
Submitted:
18 June 2025
Posted:
19 June 2025
You are already at the latest version
Abstract
Flash thermal pretreatment (FTT) is a promising technique for enhancing virgin olive oil (VOO) yield and quality. This study investigated the effects of FTT, both cooling (15 – 25 °C) and heating (30 – 40 °C), on oil yield, phenolics, tocopherols, fatty acid composition, oxidative stability (OSI), antioxidant capacity (AC), and volatile composition in VOOs from three Croatian varieties: Istarska Bjelica, Levantinka, and Oblica. A full factorial experimental design was used with two independent variables: treatment temperature and olive variety. Olive pastes were treated after crushing and before malaxation. Data were evaluated using two-way ANOVA, partial least squares (PLS) regression, and response surface methodology (RSM). Istarska Bjelica showed the highest OSI improvement (+16 %) linked to elevated phenolics and α-tocopherol, and the largest yield increase (+8.1 % at 25 °C). Levantinka exhibited moderate responses, with slight OSI and AC declines and enrichment in lipoxygenase (LOX)-derived volatiles. Oblica was most sensitive to heating, showing OSI and AC reductions (up to 28 %), despite increased oleocanthal, olacein and LOX volatiles. RSM identified optimal FTT temperatures for each variety: 18.9 °C (Istarska Bjelica), 15.4 °C (Levantinka), and 15.5 °C (Oblica). These findings support variety-specific FTT as an effective strategy to improve VOO functional and sensory quality.
Keywords:
virgin olive oil
; flash thermal treatment
; Croatian olive varieties
; oxidative stability
; antioxidant capacity
; yield
; volatiles
; phenolics
; tocopherols
1. Introduction
Olive fruits and virgin olive oil (VOO) are emblematic components of the Mediterranean diet, which has gained global recognition and adoption beyond its traditional geographic origins. VOO is not only a primary dietary fat but also a valuable source of bioactive phytochemicals with demonstrated protective effects against a range of chronic diseases, including cancer, cardiovascular and neurodegenerative diseases, and metabolic syndrome [1,2,3,4].
The chemical composition of VOO is significantly influenced by the technological processes employed during its extraction. In accordance with European Union regulations, VOO must be produced exclusively through mechanical methods, including fruit crushing, malaxation, and centrifugal separation. Among these, the crushing and malaxation steps are particularly critical due to their substantial impact on the extraction and transformation of phytochemicals. Modern industrial extraction employs metallic crushers, which generate substantial emulsification of oil and water phases, thereby necessitating a subsequent malaxation step. During malaxation, the breakdown of emulsions and coalescence of oil droplets occur, while biochemical reactions among compounds released from the crushed fruit further influence oil composition. These interactions govern the distribution of triacylglycerols, fatty acids, pigments, polyphenols, and endogenous enzymes between the aqueous and lipid phases, thereby affecting the organoleptic and nutritional qualities of the final oil. The malaxation phase activates endogenous olive enzymes such as pectolytic and hemicellulolytic enzymes, which degrade cell wall structures and enhance oil release. Lipases, phospholipases, and galactolipases catalyze the hydrolysis of triglycerides, phospholipids, and galactolipids, respectively, liberating free fatty acids. Concurrently, enzymes involved in the lipoxygenase pathway, including acylhydrolase, lipoxygenase, hydroperoxide lyase, alcohol dehydrogenase, and alcohol acyltransferase, are responsible for the formation of characteristic volatile compounds. Furthermore, phenolic glucosides are hydrolyzed by β-glucosidase and esterase enzymes to form lipophilic aglycones, while complex polyphenols are cleaved into phenolic alcohols and phenolic acids. Additional oxidative and degradative processes further modulate the phenolic profile [5,6,7,8,9,10,11]. The activity of these enzymes determines the partitioning of phenolic compounds between oil and water phases and contributes to the sensory variability observed in VOOs. Enzyme activity is influenced by both intrinsic factors, such as the genetic makeup of the olive variety [12], and extrinsic factors, primarily technological parameters during malaxation [13,14,15]. Numerous studies have evaluated the influence of malaxation duration and temperature on enzymatic activity, phenolic composition, and volatile compound formation. These studies underscore the importance of optimizing malaxation conditions to improve both extraction efficiency and oil quality. It is generally recommended to malaxate the olive paste gently for 30–45 minutes at moderate temperatures ranging from 20 to 35 °C [15].
Malaxation is typically conducted in stainless steel chambers equipped with a rotating horizontal shaft fitted with blades that slowly stir the paste. Heating is achieved indirectly through the circulation of hot water within a jacketed chamber. However, conventional malaxation systems present several limitations, including uneven temperature distribution, time–temperature variability across the paste mass, inconsistent flow rates, and prolonged processing times [16]. Advancements in food processing technology have stimulated research into alternative methods for enhancing the malaxation process [17]. Innovative technologies such as microwave heating, ultrasound, and pulsed electric fields have demonstrated potential in improving VOO yield and quality ([16,18,19,20].
Among these, flash thermal treatment (FTT) has emerged as a promising technique. FTT involves the rapid heating of olive paste immediately after crushing, aiming to reach malaxation temperatures and potentially eliminate the need for traditional batch malaxation. Amirante [21] pioneered this approach by incorporating a heat exchanger following destoning, which allowed for instantaneous heating of the paste to 27 °C. The result was a notable increase in total phenolic content, oxidative stability, and sensory quality of the resulting oil. Subsequent studies employed tubular heat exchangers for preheating olive paste post-crushing, reporting similar improvements in phenolic content, malaxation efficiency, and volatile compound profile [12,22,23]. This technology is especially advantageous in cooler growing regions, as it ensures rapid and continuous thermal conditioning. However, due to earlier harvest practices and climate change, paste temperatures after crushing may exceed 30 °C, a level considered detrimental for the production of high-quality extra virgin olive oil (EVOO), as it may negatively affect sensory characteristics and reduce phenolic content [6,24].
To address this, recent studies have explored cooling as an alternative FTT strategy, demonstrating that controlled temperature reduction prior to malaxation can also enhance polyphenol concentration and alter the volatile profile of the oil [24,25]. Notably, olive variety plays a crucial role in the formation of volatile and phenolic compounds during both heating and cooling treatments. Therefore, many authors recommend the development of variety-specific malaxation parameters, particularly when applying innovative technologies, to optimize the activity of endogenous enzymes and thus improve oil quality [8,12,13,26,27,28].
Despite extensive research on Italian, Spanish, and Greek varieties, there is a lack of scientific data regarding Croatian olive varieties. Croatia contributes approximately 0.22 % to European and 0.13 % to global olive oil production [29]. Nevertheless, Croatian VOOs are internationally recognized for their high quality, which can be attributed to the country's considerable genetic diversity among varieties, favorable agroecological conditions, and the expertise of its olive oil producers.
In this context, the objective of the present study was to investigate the effects of FTT,both heating and cooling, on the yield, volatile profile, phenolic and tocopherol content, oxidative stability and antioxidant activity of VOOs derived from three Croatian autochthonous varieties: Istarska Bjelica, Levantinka, and Oblica. The ultimate goal was to determine variety-specific optimal paste temperatures that support the production of VOO with enhanced oxidative stability and antioxidant potential. To the best of our knowledge, this is the first study to systematically evaluate FTT effects on Croatian olive varieties.
2. Materials and Methods
2.1. Plant Material
For this experiment, olive fruits (Olea europaea L.) of the autochthonous Croatian varieties Levantinka and Oblica were harvested by hand in the same orchard in region Dalmatia (Croatia) in November 2021, while variety Istarska Bjelica in region Istria (Croatia). The local producers of the award-winning EVOOs were asked to suggest the optimum degree of ripeness for each of the selected olive varieties. Accordingly, on the basis of the colour of the skin and flesh (1) the fruits of Oblica were harvested at maturity index 1.03, Levantinka 1.08 and Istarska Bjelica 0.48.
2.2. Olive oil Production
The olives were processed within 48 hours by centrifugal extraction using the Abencor laboratory oil system (mc2, Ingenierias y Sistemas, Seville, Spain). After cleaning and washing, the olives (about 800 g) were crushed in a hammer mill. Immediately after crushing, the olive paste was subjected to flash thermal treatment (FTT) at six different temperatures (15, 20, 25, 30, 35 and 40 °C) for the purpose of FTT optimization. In order to reach a temperature of 15 and 20 °C, the paste was spread in a 1 cm thick layer on a stainless-steel tray and cooled using a shoch freezer at -18 °C (Blastchiller ATT05 ATTILA ABB, TECNODOM, Padova, Italy). Temperatures higher than 20 °C were achieved by heating the paste in a closed plastic container in a water bath (SUB Aqua Pro SAP12, Grant Instruments, Amsterdam, The Netherlands). Water temperature was set to 50 °C (in case of paste temperatures from 25 to 35 °C) or 52 °C (in case of paste temperature of 40 °C). All temperatures were reached within 10 minutes.
After treatment, the olive paste was kneaded for 40 minutes at 27 °C in a thermo beater. The liquid phase was separated by vertical centrifugation at 1370 g for 90 s, transferred to a glass cylinder and the oil fraction was measured to calculate the yield. After separation, the oil was additionally purified by centrifugation (Rotina 380R, Hettich, Tuttlingen, Germany) at 5000 g for 4 minutes at 18 °C. The control sample was prepared under the same conditions of crushing, malaxation and oil extraction as the other samples, with the exception that no FTT was performed. The average temperature of the control sample after crushing was 22 °C. The oils were produced in triplicate and stored in 250 mL dark glass bottles under nitrogen at 15 - 20 °C until analysis.
2.3. Basic Quality Parameters
The basic quality parameters were determined according to the standard methods. The peroxide value of the VOOs was determined according to the ISO 3960 method [30], while the determination of the acidity and the spectrophotometric examination in the ultraviolet range were carried out according to the IOC methods [31,32].
2.4. Oil Yield
The oil yield (Y), defined as the amount of oil (g) extracted from 100 g of fruit and expressed in % [33] %, was calculated according to the equation (1):
where Voil (mL) is the volume of the extracted oil, 0.915 (g/mL) is the standard density of VOO and Wolives (g) is the mass of the olive paste.
2.5. Volatile Components
The volatiles were isolated by solid phase microextraction using a 2 cm Divinylbenzene/Carboxen/Polydimethylsiloxane (DVB/CAR/PDMS) fiber with a film thickness of 50/30 μm (Supelco, Bellefonte, USA). The content and composition of volatile compounds were determined by gas chromatography/mass spectrometry (GC/MS) according to our previously published method [34] with some minor modifications. 15 mg of the internal standard (0.15 % solution of 4-methyl-2-pentanol in freshly refined sunflower oil) was weighed into a 20-mL vial with silicone septum along with 10 g of VOO and then placed in a heating block at 40 °C with a magnetic stirrer (Pierce Reacti-Therm Heating/Stirring Module, Artisan, Champaign, IL, USA). After 10 minutes of sample conditioning, the fiber was exposed for 30 minutes and then immediately desorbed in the injector of the gas chromatograph in splitless mode at 260 °C for 1 minute. Samples were analyzed using an Agilent Technologies 8890 GC system coupled with an Agilent Technologies 7000D TQ mass detector. Volatile compounds were separated on an HP-5 column (30 m×0.25 mm×0.25 μm; Agilent Technologies). The oven temperature was maintained at an initial temperature of 30 °C for 3 min and then increased to 150 °C at a rate of 5 °C/min, followed by an increase to 250 °C at 20 °C/min. This final temperature was maintained for a further 5 minutes. The temperature of the ion source was 250 °C and that of the transfer line 260 °C. Helium was used as the carrier gas at a constant flow rate of 1.5 mL/min. The mass spectra were recorded in the mass range 50-550. The volatile compounds were identified by comparing their mass spectra with the records in the NIST mass spectra library. For additional conformation, the retention index values calculated after analyzing the n-alkane mixture (C8 - C20) under the same chromatographic conditions were compared with the previously reported values. The quantification of the volatile compounds was carried out using the internal standard mentioned above.
2.6. Phenolic Compounds
The polyphenolic compounds were determined by HPLC using a DAD detector (Agilent Technologies HPLC series 1200, Santa Clara, CA, USA). The extraction of the polyphenolic compounds was carried out according to the IOC method [35] of direct extraction of phenolic compounds by means of methanolic solution. The extracted phenolic compounds were separated by injecting 20 μl onto a C18 column heated to 30 °C (Luna 250 mm × 4.6 mm, 5 μm, 100 Å, Phenomenex, Torrance, USA). A 0.1 % formic acid solution in water (mobile phase A) and a 0.1 % formic acid solution in methanol (mobile phase B) were used for elution. The following gradient was used at a constant flow rate of 1 ml/min: At the beginning of the analysis, from 0 to 3 min, 10 % B; from 3 to 30 min, the percentages changed to 50 % B; from 30 to 40 min, the percentages changed to 60 % B and in the next 5 min to 100 % B; this percentage remained until 50 min; from 50 to 50.1 min, the percentages returned to their initial values and remained there for another 10 min. The chromatograms were recorded with DAD at 280 nm. The quantification of the individual phenolic compounds was carried out according to the IOC method mentioned above.
The phenolic compounds were identified by comparing their retention times and UV spectra with those of commercially available standards. Identification of the remaining compounds was performed by UHPLC Q-TOF-MS analysis (Agilent 1290 Infinity II, Santa Clara, CA, USA) using a Kinetex Core-Shell C18 column (150 mm × 4.6 mm, 2.6 μm, 100 Å, Phenomenex, Torrance, USA) heated to 30 °C. The volume of phenolic extract injected was 3 μL. For the separation of the phenolic compounds, the same mobile phases were used as for the HPLC analysis (A - 0.1 % formic acid solution in water; B - 0.1 % formic acid solution in methanol) with an adjusted gradient. In the first 3 min the separation solution consisted of 10 % B; from 3 to 15 min the percentage changed to 50 % B; from 15 to 21 min the percentage changed to 60 % B and in the next 6 min to 100 % B. This percentage remained up to 30 min; from 30 to 30.1 min the percentages returned to their initial values and remained there for another 5 min to reach equilibrium. A constant flow rate of 0.4 ml/min was used throughout the analysis. Chromatograms were recorded using DAD (at 280 nm) and Q-TOF-MS detectors. Mass spectra were recorded in a negative ionization with m/z values ranging from 100 to 1600 using Agilent 6550 Series Accurate-Mass-Quadrupole Time-of-Flight (Santa Clara, CA, USA). Nitrogen was used as sheath and drying gas at a temperature of 250 °C and a flow rate of 11 L/min and 17 L/min, respectively. The nebulizer pressure was 25 psi, capillary potential 3500 V and the fragmentor voltage 380 V. MSMS spectra were recorded in the range of m/z 50-800 with collision energies of 10-30 V. The phenolic compounds were identified by comparing the mass spectra obtained with those previously published. The compounds detected by UHPLC DAD were identified by comparing the retention times with those of UHPLC Q-TOF-MS. A very good correlation was found between the UHPLC and HPLC retention times with a coefficient of determination of R2 = 0.997, which was used for the identification of unidentified phenolic compounds determined by the HPLC DAD method (Supplementary material S1).
2.7. Tocopherol Content
The tocopherol content was determined according to the ISO standard method [36]. A 1 % (w/v) VOO solution in n-heptane was injected (20 μl) into an Agilent Technologies 1260 Infinity series HPLC (Santa Clara, CA, USA) equipped with a fluorescence detector and a LiChroCART Silica 60 column (250 mm×4.6 mm, 5 μm; Merck, Darmstadt, Germany). The separation of tocopherols was performed during 25 minutes at room temperature by isocratic chromatography with 0.7 % 2-propanol in n-hexane as mobile phase. The flow rate of the mobile phase was 0.9 mL/min. The tocopherols were detected at an excitation wavelength of 295 nm and an emission wavelength of 330 nm. The tocopherols were identified by comparing their retention time with the standards, and a standard solution of α-tocopherol was used for quantification, so the results are expressed in mg α-tocopherol/kg VOO.
2.8. Fatty Acid Composition
Gas chromatography was used to determine the fatty acid composition of the VOO produced. The fatty acid methyl esters were prepared by transesterification with methanol according to method ISO 12966-2:2017 [37]. The produced methyl esters were injected into an Agilent Technologies 6890N Network GC system (Santa Clara, CA, USA) using GC parameters that we have previously reported [34] The fatty acid methyl esters were identified by comparing their retention times with those of commercial standards and the amount of each fatty acid is expressed as a percentage of total fatty acids.
2.9. Oxidative Stability Index
The oxidative stability index (OSI) of VOO oil was determined as induction period (IP) using a DSC 214 Polyma Differential Scanning Calorimeter (NETZSCH, Selb, Germany). The instrument was calibrated with pure indium and an empty aluminum pan identical to the one used for the sample was used as a reference. VOO (4.0 ± 0.5 mg) was weighed into the aluminum pan, hermetically sealed with a pin-hole lid and placed in the sample chamber of the device. The sample was heated to 140 °C under nitrogen (40 ml/min) at a rate of 20 °C/min, followed by an equilibrium period of 5 min under nitrogen to improve the baseline. To determine OSI, the isothermal method was used at the aforementioned temperature and purified oxygen (99.95 %) was passed through the sample cell at 100 ml/min. At the end of the run, IP (min) was determined as the intersection of the extrapolated baseline and the tangent to the recorded exotherm.
2.10. Antioxidative Capacity
The stable free radical 2,2-diphenyl-1-picrylhydrazyl (DPPH) was used to determine the antioxidant capacity of the produced VOO. The measurements were carried out using electron paramagnetic resonance spectroscopy (EPR). A DPPH˙ solution (0.15 mM) in ethyl acetate was prepared 24 hours before the measurements and kept in the dark at 4 °C to ensure complete dissolution of the radical. 20 μL VOO was added to 980 μL DPPH˙, mixed well and kept in the dark at room temperature for 27 min. Then the mixture was filled into the capillary, which was then inserted into a standard EPR tube. The EPR spectra were recorded at room temperature using the Magnettech MS – 5000 X (Freiberg Instruments, Freiberg, Germany) after exactly 30 minutes of contact between the oil and the radical solution. The settings for the spectrometry were magnetic field modulation frequency (100 kHz), central field (337 mT), sweep range (12 mT), sweep time (30 s), microwave power (10 mW) and modulation amplitude (0.2 mT). The scavenging effect of VOO on DPPH radicals was determined by the amplitude (A30) of the EPR signal. The antioxidant capacity (AC) of VOO was defined as the percentage of DPPH˙ reduction and calculated according to the equation (2):
where A0 is the signal amplitude of the blank sample (DPPH˙ solution containing 20 μL ethyl acetate).
2.11. Statistical Analysis
The effects of FTT on the oil yield, quality and chemical composition of Croatian VOOs were evaluated using a full factorial experimental design with two independent variables: (i) treatment temperature (15, 20, 25, 30, 35, and 40 °C) and (ii) olive variety (Istarska Bjelica, Levantinka, and Oblica). Three consecutive production batches of VOOs were carried out for each variety under each FTT condition. All resulting oil samples were analyzed in triplicate.
A two-way analysis of variance (ANOVA) was performed to evaluate the main effects and their interactions of the studied factors on the measured parameters, followed by a Tukey’s post hoc test for multiple comparisons. To further explore the influence of specific components on oxidative stability and antioxidant capacity, Partial Least Squares (PLS) regression analysis was performed. The PLS model for oxidative stability included fatty acid composition (sum of saturated - SFA, monounsaturated - MUFA, and polyunsaturated fatty acids - PUFA) and bioactive compounds (α-tocopherol and phenolic compounds) as predictors. For the antioxidant capacity model, only bioactive compounds were used as a predictor. Variable Importance in Projection (VIP) scores were calculated to determine the most influential variables, and model performance was evaluated using the coefficient of determination (R²).
To identify optimal FTT temperatures for each olive variety, Response Surface Methodology (RSM) was employed. Optimization aimed to maximize the oxidative stability index (OSI), antioxidant capacity (AC), and volatile compounds resulting from lipoxygenase pathway (ΣLOX), while minimizing the levels of volatiles resulting from oxidation (ΣOX) and microbial activity (ΣMBA). For each response variable, a polynomial regression model was fitted and evaluated using ANOVA, lack-of-fit tests, and R² values. Numerical optimization was performed using a desirability function approach, with individual goals and relative importance set for each response variable to reflect their contribution to overall oil quality. Optimal pretreatment temperatures were identified for each variety, and predicted response values at these optimal conditions were generated from the fitted models to illustrate the expected improvements in oil quality.
All statistical analyses were conducted at a significance level of p = 0.05. ANOVA, Tukey’s test, and PLS regression were carried out using XLSTAT 2023 (Lumivero, Denver, CO, USA), while RSM analyses were performed using Design-Expert 10 (Stat-Ease, Inc., Minneapolis, MN, USA).
3. Results and Discussion
Flash thermal treatment (FTT) is an emerging technological innovation in virgin olive oil processing, proposed primarily as a pre-malaxation strategy to enhance phenolic content and improve the volatile compound profile of the oil.
The present study focused on VOOs prepared under controlled conditions from three Croatian autochthonous olive varieties harvested at the stage of ripeness recommended as optimal by local VOO producers. The temperature points from 25 to 40 °C of olive paste thermal treatment were selected based on prior research indicating their relevance for optimizing oil extraction under low ambient temperatures [12,22,23,38,39]. In contrast, rapid cooling to 15 °C and 20 °C was evaluated as a potential mitigation strategy for elevated paste temperatures observed during harvesting in warmer climates, a scenario increasingly associated with the effects of climate change [24,25,40]. Previous studies have demonstrated that FTT influences the activity of endogenous enzymes, which play a critical role in determining the final chemical composition and sensory quality of VOO. To assess the biochemical impact of these treatments, model systems of two key endogenous enzymes, lipoxygenase and β-glucosidase, were evaluated. The results indicated that none of the applied FTT temperatures resulted in inhibition of these enzymes [41], supporting their potential applicability without compromising enzymatic activity crucial for oil quality.
3.1. Basic Quality Parameters and Processing Yield
Thermal treatment of the olive paste prior to malaxation did not compromise the classification of any sample according to basic quality parameters; all oils remained within the "extra virgin olive oil" category (Table 1), as defined by current EU standards [42].
Acidity was significantly influenced by olive variety, treatment temperature, and their interaction (p < 0.001). This observation aligns partially with findings by Panzanaro [43], who reported reduced olive lipase activity at temperatures deviating from the 35 °C optimum. In the present study, lower FTT temperatures caused a notable reduction in acidity in samples from Oblica and Istarska Bjelica. Specifically, compared to control sample, acidity decreased by 10 % in Oblica and by 7 % in Istarska Bjelica at 25 °C, while treatment at 15 °C further reduced acidity by 9 % in Istarska Bjelica (Table 1).
All thermal treatments prior to malaxation resulted in a statistically significant increase in peroxide value (PV) compared to the untreated control, ranging from 47 % to 81 %. Despite this rise, PV levels in all samples remained well below the regulatory limit of 20 meq O₂/kg, as stipulated by EU Regulations [42]. Similar results were reported by other authors [44,45]. The specific extinction coefficients at 232 nm and 268 nm (K232 and K268), which serve as indicators for primary oxidation products and conjugated dienes, conjugated trienes and secondary oxidation products, respectively, did not exhibit a significant increase across treatments, suggesting limited oxidative deterioration under the applied conditions. Nevertheless, due to the potential pro-oxidative effects of elevated temperatures, additional indicators of oxidative stability were included in the study, which are discussed later in this paper (Table 7).
One of the biggest challenges in conventional VOO production is the relatively low oil yield: 10-20 % of the oil remains trapped in the cell matrix or in the colloidal system of the olive paste and part is bound in an emulsion with the vegetable water [46]. Recent research has focused on improving extraction efficiency through the use of innovative technologies, very often in combination with malaxation. Notably, the use of pulsed electric fields (PEF) has shown promising results [47,48,49,50], as have ultrasound and high hydrostatic pressure treatments [51,52]. In contrast, thermal treatment of olive paste, either applied alone or in combination with malaxation, has not consistently improved oil yield [22,23,24,53]. Our findings are shown in Table 1. In the case of Istarska belica, oil yield increased under cooling (by 2–4 %) and heating (by 4–8 %) conditions. For Levantinka, cooling enhanced yield by 2–6 %, while heating resulted in a 1–7 % increase. In contrast, for Oblica, a yield improvement was observed only under heating at 30, 35, and 40 °C. Although all treatment conditions influenced extraction yield to some extent, only one condition—thermal treatment of Istarska Bjelica paste at 25 °C—resulted in a statistically significant yield increase of 8 % compared to the untreated control.
3.2. Volatile Compounds
Volatile compounds, both major and minor, play a critical role in determining the sensory quality and consumer perception of VOO. Their composition is influenced by multiple factors, including olive variety, geographic origin, fruit ripeness, and particularly the technological parameters employed during oil extraction. Among these, malaxation time and temperature are recognized as key determinants shaping the volatile profile and, consequently, the aroma characteristics of the final product.
In accordance with the classification proposed by Cecchi [54], the identified volatile compounds in this study were categorized into three primary groups based on their biochemical, oxidation or microbiological origin. Considering the reliability of identification, the compounds were classified into three levels, following the principle published by Mikrou [55]. Table 2 presents the concentrations of volatile compounds produced via the lipoxygenase (LOX) pathway which are largely responsible for the green and fruity notes typical of high-quality VOOs. In the control samples, clear varietal differences in volatile profiles were observed, confirming the significant influence of genetic background, geographical climate and fruit maturity on LOX-pathway activity.
Istarska Bjelica exhibited the highest concentration of esters, particularly 3-hexenyl acetate, suggesting elevated activity of alcohol acyltransferase (AAT) relative to the other varieties. Interestingly, despite this ester richness, Istarska Bjelica showed the lowest overall concentrations of LOX-pathway derived aldehydes, possibly reflecting lower upstream LOX activity. The reason for this could also be that the high concentrations of phenols (Table 4), which are characteristic of this variety, and that can inhibit the enzymes of the LOX pathway [56]. In contrast, Levantinka produced the highest total concentration of LOX- pathway derived volatiles, particularly 2-hexenal, indicating robust LOX and hydroperoxide lyase (HPL) activity. Oblica displayed a unique profile marked by the predominance of 3-hexenal and a complete absence of esters, suggesting weak AAT activity. These findings are consistent with previous reports on Croatian VOOs [57,58,59].
The impact of FTT on LOX-pathway volatiles was variety-dependent. Istarska Bjelica exhibited the most pronounced sensitivity, with both cooling and heating treatments resulting in decreased concentrations of aldehydes, alcohols, and esters. Particularly significant reduction is in concentration of 3-hexenyl acetate that implies temperature-induced inhibition of AAT activity. In Levantinka, the levels of esters and some alcohols increased with heating, suggesting enhanced AAT and alcohol dehydrogenase (ADH) activity. Additionally, the consistent increase in 3-hexenal across all treatments indicates a potential stimulation of HPL activity. For Oblica, cooling treatments led to elevated levels of 3-hexenal, 1-penten-3-ol, 2-penten-1-ol and the sum of LOX volatiles, highlighting a divergent enzymatic response compared to the other varieties.
These findings underscore the complex, genotype-dependent behavior of the LOX pathway in response to thermal pretreatment, as also noted by other authors [9,60,61]. According to Veneziani [40], such variability is primarily governed by the inherent genetic characteristics of each olive variety, which influence the activity of key LOX-pathway enzymes including lipoxygenase, HPL, ADH, and AAT.
In addition to the lipoxygenase (LOX) pathway, volatile compounds in VOO can also originate from autoxidation and/or photooxidation processes. Three oxidation-derived volatile compounds were identified in the present study: pentanal, 2,4-hexadienal, and nonanal. Table 3 shows a trend towards a decrease in volatiles due to oxidation for all three varieties produced with FTT, both during cooling and heating. While the accumulation of pentanal and nonanal was relatively uniform in Istarska Bjelica, Levantinka and Oblica, a significant increase in 2,4-hexadienal was observed in Oblica compared to the other two varieties. This elevated level likely reflects Oblica's heightened susceptibility to oxidation, as indicated by its peroxide value (Table 1) and oxidative stability (Table 7). At temperatures of 20 °C and higher, however, the volatile oxidation products are reduced, whereby the reduction at 40 °C is statistically significant.
In addition to oxidative degradation, microbiological activity during olive storage can significantly influence the formation of volatile compounds. The native microbiota presents on the surface of olive fruits—including bacteria, yeasts, and molds—can proliferate during post-harvest storage and metabolize fruit constituents to produce various volatiles [54]. Two volatile compounds commonly associated with microbial fermentation, 3-methylbutanal and 2-methylbutanal, were identified and quantified. At a pretreatment temperature of 25 °C, a statistically significant increase in the concentrations of these volatiles was observed in oils derived from Istarska Bjelica and Oblica, suggesting a temperature-dependent facilitation of microbial metabolite release or transfer from paste to oil. Conversely, a significant reduction in the levels of these compounds was detected in Levantinka following cooling to 15 °C, indicating that lower temperatures may inhibit microbial enzymatic activity during malaxation or suppress the volatility of these fermentation-related metabolites.
Although the concentration of volatile compounds associated with undesirable sensory characteristics was reduced by FTT treatment in all three cultivars, the possibility that undesirable sensory characteristics (such as rancid and fusty/muddy sediment) will appear in VOO samples produced by FTT cannot be excluded.
3.3. Phenolic Compounds
Phenolic compounds in VOO have been extensively studied due to their well-established health-promoting properties [1,62,63]. These bioactive molecules exhibit potent antioxidant activity, primarily attributed to their unique chemical structures. In olives, phenolics are biosynthesized through complex chemical and enzymatic pathways. To date, more than 30 distinct phenolic compounds have been identified in VOO, with total phenolic content (TPC) ranging from 40 to more than 4000 mg/kg [64]. The concentration and composition of phenolics in olives are modulated by various factors, including variety, ripening stage, climatic conditions, as well as agronomic and technological practices. Table 4 presents the phenolic profiles of oils extracted with and without the application of FTT. The data underscore the significant influence of variety on the TPC in control samples. Notably, the Istarska Bjelica variety exhibited an exceptionally high TPC of 773 mg/kg, approximately 2.4 times higher than that of Levantinka (328 mg/kg) and 1.8 times higher than that of Oblica (429 mg/kg). In Istarska Bjelica oil, ligstroside aglycones and oleocanthal were the predominant phenolic compounds. Conversely, Levantinka oil contained the highest concentrations of oleacein and oleocanthal, whereas Oblica oil was characterized by a predominance of oleuropein and ligstroside aglycones. The TPCs recorded for Istarska Bjelica slightly exceeded values reported previously [57,65,66] (414–685 mg/kg), while the TPCs for Levantinka and Oblica were within the range reported for that varieties (212–694 mg/kg and 50-791 mg/kg, respectively) [57,67,68].
Although the technological parameters during oil extraction, especially malaxation, have a significant influence on the content of phenolic compounds in VOO, neither heating nor cooling caused significant changes in the concentrations of hydroxytyrosol, tyrosol, oleocanthal, methyl hemiacetal, oleuropein aglycone or TPC in any of the oils analysed in our work (Table 4). Interestingly, the concentration of p - coumaric acid in Istarska Bjelica oil increased significantly (by 43 %) following pretreatment at 25 °C. Although no other statistically significant differences were observed between control and treated samples for Istarska Bjelica and Levantinka, certain trends were noted. In Istarska Bjelica VOO, the concentrations of hydroxytyrosol, tyrosol, oleuropein aglycones, p-coumaric acid, and TPC tended to increase following both heating and cooling pretreatments. In Levantinka VOO, cooling led to increases in hydroxytyrosol, tyrosol, and oleocanthal, while heating at 40 °C resulted in an overall increase in most phenolic compounds, including TPC (Table 4).
In contrast, Oblica oil demonstrated a statistically significant response to thermal pretreatment. Heating led to increased concentrations of oleacein and oleocanthal, accompanied by a decrease in ligstroside aglycones and p-coumaric acid. These findings are consistent with previous reports indicating that elevated malaxation temperatures can enhance the concentrations of oleacein and oleocanthal [12,66,69,70]. Several studies [38,71,72] have attributed such increases to the thermal activation of endogenous enzymes that facilitate the formation of phenolic compounds during malaxation or promote their release by disrupting cellular structures. However, the potential adverse effects of elevated malaxation temperatures must also be considered. Numerous studies [73,74,75] have reported phenolic degradation via enzymatic oxidation mediated by polyphenol oxidase (PPO) and peroxidase (POD). In addition to heating, cooling of the olive paste post-crushing has also been shown to positively affect the concentration and profile of phenolic compounds [24,25,40]. Ultimately, the phenolic composition of VOO reflects a complex interplay among enzymatic activity, thermal stability of key enzymes (e.g., β-glucosidase, esterase, PPO, POD), and the partitioning behavior of phenolics between the oil and aqueous phases. All these processes are strongly influenced by the temperature of the olive paste during processing [26].
3.4. Tocopherols
Tocopherols are lipid-soluble compounds synthesized exclusively by plants, and they play a crucial role in protecting biological membranes and oils from oxidative degradation. In VOO, α-tocopherol is the predominant isoform, typically representing more than 95 % of the total tocopherol content. The concentration of tocopherols in olive fruits appears to be primarily determined by genetic and agronomic factors, rather than by technological or processing conditions.
Table 5 presents the concentrations of the tocopherol isoforms detected in the VOO samples. The control oils illustrate clear varietal differences: Istarska Bjelica exhibited markedly lower α-tocopherol concentrations compared to Levantinka and Oblica. Previous studies have reported α-tocopherol levels in Istarska Bjelica ranging from 89 to 96 mg/kg [76,77,78]. In the current study, α-tocopherol levels in Istarska Bjelica were even lower than this published range. Additionally, γ-tocopherol was not detected in this variety.
The Levantinka control sample contained 273 mg/kg of α-tocopherol, consistent with previously reported values [79]. Similarly, the tocopherol concentration in the Oblica control sample aligns with data published by Šarolić [79] and Jukić Špika [80].
Each olive variety exhibited a distinct response to FTT across the range of applied temperatures. In Istarska Bjelica, no statistically significant differences in tocopherol content were observed between the control and treated samples, regardless of whether the pretreatment involved cooling or heating. The tocopherols appeared to remain stable under thermal stress, likely due to the synergistic action of oleacein, which has been shown to effectively regenerate α-tocopherol by reducing the α-tocopheroxyl radical [81] All Istarska Bjelica oil samples, irrespective of FTT temperature, contained high concentrations of oleacein (Table 5), which may contribute to the preservation of tocopherols. In contrast, the Levantinka variety, which also contains significant concentrations of oleacein, showed a statistically significant decrease in α-tocopherol content after cooling to 15 °C and 20 °C and after heating to 40 °C. The observed decreases were 13 %, 15 % and 15 %, indicating a greater sensitivity of the tocopherols in Levantinka to heat stress.
The most pronounced effect of FTT was observed in Oblica oils. All pretreatments led to a reduction in γ-tocopherol levels, while all except the 25 °C treatment significantly decreased α-tocopherol concentrations, with reductions ranging from 13 % to 24 %. The observed decline in tocopherol content is likely attributable to its role as an antioxidant, during which it is consumed in neutralizing oxidative radicals. This mechanism has been described by Rastrelli [82], who reported the degradation of α-tocopherol under oxidative stress conditions.
Supporting this, the Oblica oils subjected to FTT heating also showed the highest increase in primary oxidation products, as reflected by the peroxide value (PV, Table 1), and exhibited the shortest oxidative stability (induction period, Table 7), suggesting a correlation between tocopherol depletion and increased lipid oxidation.
The biosynthesis of fatty acids from malonyl coenzyme A occurs in the plastid stroma of the fruit and is catalyzed by a series of specific enzymes over multiple cycles. These fatty acids are subsequently esterified into triacylglycerols via the Kennedy pathway (also known as the glycerol-3-phosphate pathway) [83]. The fatty acid composition of VOO is influenced by various factors, including latitude, climate, geographical origin, variety, and the degree of fruit ripeness [84,85]. No significant deviations were observed in the fatty acid profiles of control samples (produced without thermal pretreatment) (Table 6) compared with previously published data for oils derived from the same olive varieties [86,87,88,89].
The impact of processing parameters on VOO quality was investigated by Olmo-Cunillera [60] who reported that increasing the malaxation temperature led to a higher absolute fatty acid concentration in VOOs from Arbequina variety, although the relative fatty acid composition remained unchanged. This effect was attributed to reduced oil viscosity, enhanced coalescence of oil droplets, and improved oil yield at elevated paste temperatures. In contrast to these findings, our results (Table 6) show a small but statistically significant increase in proportion of oleic acid following thermal pretreatment of Istarska Bjelica paste at 30, 35 and 40 °C, which corresponded to an increase in total monounsaturated fatty acids (MUFA) of 1.1–1.5 %. Notably, a significant increase in proportion of oleic acid and ΣMUFA was also observed at a lower treatment temperature (15 °C). Furthermore, a statistically significant difference in proportion of palmitic acid content was detected in the Oblica variety between the control and the sample subjected to cooling pretreatment at the same temperature (15 °C). In contrast, thermal pretreatment at higher temperatures resulted in a decrease in palmitic acid in this variety.
Overall, Table 6 demonstrates that the three Croatian varieties responded significantly to FTT for nearly all identified fatty acids, with the exception of linolenic acid. Importantly, the fatty acid composition of VOO samples from all tested varieties, both untreated and thermally pretreated, remained within the regulatory limits for EVOO as defined by EU Regulation [42].
3.5. Oxidative Stability and Antioxidant Capacity
Autoxidation and photooxidation are oxidative degradation processes initiated by the presence of atmospheric oxygen, and are virtually unavoidable during the processing, storage and handling of oils. In addition to oxygen, the key substrates involved in these reactions are unsaturated fatty acids, particularly polyunsaturated ones, due to their high susceptibility to oxidative attack. These oxidative pathways result in the formation of both primary and secondary oxidation products. Primary oxidation products include peroxyl radicals, lipid radicals, and hydroperoxides, which are formed during the early stages of the radical chain reaction. As the process progresses, hydroperoxides—being thermodynamically unstable—decompose into a diverse array of secondary products, including additional free radicals, as well as various volatile and non-volatile compounds that contribute to quality deterioration [90,91].
The oxidative stability of VOO refers to its resistance to oxidative degradation. A key parameter used to characterize this resistance is the oxidative stability index (OSI), defined as the induction period (IP) – the time required for a significant increase in the oxidation rate under accelerated conditions [91]. The OSI is typically determined by subjecting the oil sample to a constant elevated temperature while monitoring a physical or chemical parameter at regular time intervals. The obtained results are presented in Table 7.
Antioxidant capacity is defined as the total amount of oxidants neutralized by antioxidant mechanisms, representing the cumulative antioxidant activity present in VOO [92]. Phenolic compounds are among the most potent antioxidants in VOO which act as chain-breaking antioxidants. These compounds react with lipid radicals to form stable, non-reactive radicals, thereby interrupting the propagation phase of lipid peroxidation. Specifically, phenolic compounds can donate an electron or a hydrogen atom to lipid radicals formed during the propagation stage, subsequently stabilizing the resulting phenoxyl radicals through delocalization of the unpaired electron.
In VOO, phenolic compounds exhibit their antioxidant activity primarily by scavenging peroxyl and alkyl radicals, as well as by chelating trace amounts of transition metal ions that may catalyze oxidative reactions [93,94]. Tocopherols, another important class of antioxidants present in VOO, also scavenge peroxyl radicals. In addition, they are among the most effective natural quenchers of singlet oxygen, converting it to its ground state and thereby inhibiting singlet oxygen-mediated oxidation of unsaturated fatty acids [90].
The evaluation of the antioxidant capacity of EVOO reflects not only the contributions of phenolic compounds and tocopherols, but also of other minor antioxidants, which together enhance the nutritional value and oxidative stability of the oil through synergistic interactions.
In this study, the antioxidant capacity of VOO obtained from olive paste subjected to FTT was assessed using the stable free radical DPPH (2,2-diphenyl-1-picrylhydrazyl). The results are presented in Table 7 as the percentage reduction of the DPPH˙ radical.
Given the differences in phenolic content, tocopherol composition, and fatty acid profiles among the studied olive varieties, it was anticipated that each would exhibit a distinct response to FTT in terms of oxidative stability and antioxidant capacity. All applied temperatures produced statistically significant effects: 35 °C influenced the induction period (IP), while 15, 25, 30, 35, and 40 °C significantly affected the percentage reduction of DPPH˙.
The Istarska Bjelica variety demonstrated strong tolerance to FTT, as evidenced by an increase in IP during both the cooling and heating phases, although a statistically significant increase in IP compared to the control was observed only after heating to 40 °C. This stability can be attributed to its robust antioxidant capacity, which remained unaffected by thermal treatment. Notably, Istarska Bjelica possesses the highest concentration of phenolic compounds among the tested varieties (Table 5), particularly oleocanthal, oleuropein aglycone, and hydroxytyrosol—compounds recognized for their potent antioxidant activity [3].
In the Levantinka variety, a downward trend in IP was observed although not statistically significant. Antioxidant capacity also did not differ significantly from the control, except at 25 °C. The most pronounced decline in oxidative stability—particularly under heating conditions—was observed in oils derived from the Oblica variety. This variety is characterized by a high content of polyunsaturated fatty acids (PUFAs), nearly twice that of the other tested varieties (Table 6), as well as the lowest measured concentrations of hydroxytyrosol and tyrosol (Table 5) in oils produced following either cooling or heating of the paste prior to malaxation. Although Oblica displayed higher antioxidant capacity than Levantinka, exposure to elevated temperatures and 15 °C resulted in a statistically significant decrease in antioxidant activity.
Given the observed influence of PUFAs, hydroxytyrosol, and tyrosol on the induction period and antioxidant capacity of the Oblica variety, we aimed to evaluate the extent to which these and other bioactive components in VOO from the three tested varieties, subjected to FTT, contribute to overall oxidative stability and antioxidant potential.
To this end, Partial Least Squares (PLS) regression analysis was applied to investigate the influence of specific oil constituents on oxidative stability and antioxidant capacity. For the oxidative stability model (measured by the induction period, IP), predictor variables included the fatty acid composition and the quantified bioactive compounds. The resulting model is presented in Equation (3):
IP = -31,515 + 2,716*SFA + 1,430*MUFA - 1,992*PUFA - 0,056*α-TOCO + 0,4801*HTY - 0,115*OLEA + 0,39*OLEU AGL + 0,929*TY + 0,135*OLEC + 0,681*MH OLEC + 0,096*LIG AGL - 0,652*p-CA + 0,023*TPC
The abbreviations in the equation stand for: SFA - sum of saturated fatty acids, MUFA - sum of monounsaturated fatty acids, PUFA - sum of polyunsaturated fatty acids, α-TOCO - α-tocopherol, HTY - hydroxytyrosol, TY - tyrosol, OLEA - oleacein, OLEC - oleocanthal, OLEU AGL – sum of oleuropein aglycons, LIG AGL – sum of ligstroside aglycons, MH OLEC -methyl hemiacetal of oleocanthal, p-CA - p-coumaric acid, TPC - total phenols.
The model demonstrated strong predictive power, with a coefficient of determination (R²) of 0.788 and a cross-validated R² (Q²) of 0.733, indicating that approximately 78.8 % of the variability in oxidative stability could be explained by the included predictors. Variable Importance in Projection (VIP) scores (Figure 1a) identified key contributors, with PUFA, hydroxytyrosol, oleuropein aglycons, tyrosol, ligstroside aglycons, TPC, α-tocopherol, and MUFA all exhibiting VIP > 1.0. The predicted vs. observed plot (Figure 1b) confirmed the model’s robustness, with most data points aligning closely with the 1:1 reference line. Model predictions indicate that oxidative stability is negatively influenced by elevated concentrations of PUFAs, due to their high susceptibility to oxidation, while it is increased by the presence of phenolic compounds as VOO potent antioxidants.
For antioxidant capacity (AC), only bioactive compounds (α-tocopherol and phenolics) were considered. The corresponding PLS model is shown in Equation (4):
with a coefficient of determination R2 = 0.583. The abbreviations in the equation stand for α-TOCO – α-tocopherol, HTY – hydroxytyrosol, TY – tyrosol, OLEA – oleacein, OLEC – oleocanthal, OLEU AGL – sum of oleuropein aglycons, LIG AGL – sum of ligstroside aglycons, MH OLEC -methyl hemiacetal of oleocanthal, p-CA – p-coumaric acid, TPC – total phenols.
AC = 46,739 – 0,007*α-TOCO + 0,053*HTY – 0,015*OLEA + 0,005*OLEA AGL + 0,1004*TY + 0,001*OLEC + 0,118*MH OLEC + 0,016*LIG AGL + 0,250*p-CA + 0,003*TPC
VIP analysis (Figure 2a) highlighted ligstroside aglycons, oleuropein aglycons, p-coumaric acid, TPC, methyl hemiacetal of oleocanthal, and hydroxytyrosol (VIP > 1) as the main contributors to AC. Compounds such as tyrosol, α-tocopherol, oleacein, and oleocanthal showed VIP scores < 1, suggesting a lesser impact under the conditions studied. The model for antioxidant capacity yielded an R² of 0.583 and a Q² of 0.515, indicating moderate predictive strength. The predicted vs. actual values plot (Fig 2b) further supported the model’s validity. However, some scatter was evident, particularly at higher antioxidant capacity values, indicating potential limitations in the model’s accuracy across the full range of observations. These findings are consistent with the established roles of major phenolic compounds and tocopherols as potent antioxidants in olive oil, although the moderate R² indicates that additional factors may also contribute significantly.
3.6. Optimization
Response Surface Methodology (RSM) was used to individually optimize FTT temperatures for each of the three Croatian olive varieties used in this study. The aim was to enhance the oxidative stability index (OSI), indicated by induction period (IP), antioxidant capacity (AC) and volatiles derived from the lipoxygenase pathway (Σ LOX), while minimizing oxidation-derived volatiles (Σ OX) and those associated with microbial activity (Σ MBA). Polynomial models were developed for each parameter and tested for suitability using ANOVA, coefficients of determination (R²), and lack- of- fit tests (Table 8).
The best-fitting models were obtained for the Oblica variety. All models showed high statistical significance (p < 0.05), with R² values ranging from 0.659 to 0.908, indicating they explained a substantial portion of the observed variability. Additionally, non-significant lack-of-fit results (p > 0.05) for IP, Σ LOX and Σ OX, confirming the suitability of the models to capture the experimental data. Second-order polynomial models were also developed for the remaining two varieties. However, the ANOVA results showed statistical significance only for the IP model for Istarska Bjelica and the ΣMBA model for Levantinka.
For the Istarska Bjelica variety, the cooling of the olives to 18.9 °C was predicted to increase the IP value by 6.4 % and the AC value by 1.2 %. Although a decrease in Σ LOX volatiles of about 15 % was expected, Σ OX was expected to decrease by 4 % and Σ MBA by 42 %. In contrast, for the Oblica variety, a decrease in OSI and AC (2 % and 10 %, respectively) was predicted, but an improvement in sensory properties due to a 15 % increase in Σ LOX volatile components and a 75 % decrease in Σ MBA. For the Levantinka variety, an improvement in AC was predicted by applying the optimal FTT temperature, although a reduction in both IP and Σ LOX volatiles was also expected.
4. Conclusions
The objective of this study was to evaluate the impact of fast thermal pretreatment (FTT) of olive paste prior to malaxation on oxidative stability (OSI), antioxidant capacity (AC), volatile compound composition, and oil yield in VOO derived from three Croatian indigenous olive varieties: Istarska Bjelica, Levantinka, and Oblica. Each variety exhibited a distinct response to FTT, applied through both heating and cooling, which manifested in changes in the chemical profile of the resulting VOO.
Among the tested varieties, Istarska Bjelica demonstrated the highest resistance to oxidative degradation. OSI increased under both heating and cooling conditions relative to the untreated control, with a statistically significant enhancement at 40 °C corresponding to a 16 % increase in induction time. The antioxidant capacity of this variety remained unaffected by all thermal treatments. The improvement in IP and robustness of AC is primarily attributed to the increased content of tocopherols and phenolic compounds (with the exception of ligstroside aglycones and oleocanthal methylhemiacetal), which were identified as the most important factors for OSI and AC via PLS regression analysis. Furthermore, antioxidant enrichment was observed under both heating and cooling conditions. Istarska Bjelica also exhibited a favorable fatty acid profile, characterized by a high proportion of monounsaturated fatty (~75 %) and low proportion of polyunsaturated fatty acid content (~6%). Additionally, this was the only variety to demonstrate a statistically significant increase in oil yield (8,1 %), achieved at a pretreatment temperature of 25 °C. It has also been shown that the volatile components of this variety decrease with both cooling and heating.
In contrast, VOO obtained from the Oblica variety was most susceptible to oxidative deterioration. FTT via heating resulted in a pronounced reduction in OSI (23–28 %) and a decline in AC (12–28 %) across all treatment temperatures except 20 °C. Tocopherol levels were significantly diminished under both heating and cooling conditions. Heating treatments notably reduced the total content of ligstroside aglycones (by 30–68 %) and p-coumaric acid (by 16–25 %), alongside a general reduction in other phenolic compounds relevant to OSI and AC. This variety also exhibited the lowest MUFA (~70 %) and highest PUFA (~12 %) levels among the three. However, thermal pretreatment at 30, 35, and 40 °C led to a marked increase in the concentrations of olacein (1.9–2.8 times relative to control) and oleocanthal (1.6–2 times). Additionally, a modest increase in oil yield (0.7–2.7 %) was observed. Cooling treatments enhanced the levels of specific volatile compounds, including (E)-2-hexenal, (Z)-3-hexenal, 1-penten-3-ol, and 2-penten-1-ol, as well as the total concentration of LOX pathway-derived volatiles.
Levantinka exhibited intermediate sensitivity. A decrease in OSI and AC was also observed after FTT, but the Levantinka has a longer IP than the Oblica, and the decrease in AC (11 %) was only pronounced at 25 °C. Tocopherol content significantly decreased under both cooling and heating at 40 °C. Although phenolic content did not significantly differ from control samples, a trend toward increased levels of OSI and AC relevant phenols was observed, particularly at 40 °C. Volatile compound profiles were significantly affected, with heating increasing concentrations of 3-hexanal, 1-hexanol, hexyl acetate, and 3-hexenyl acetate. Cooling not only elevated these same volatiles, but also led to an overall increase in LOX-derived volatile content. Oil yield improved by 2–6 % due to cooling and 1–7 % as a result of heating.
Optimal FTT conditions for maximizing VOO oxidative stability, antioxidant capacity, and favorable volatile profiles predicted by response surface methodology (RSM) are as follows: 18.9 °C for Istarska Bjelica, 15.4 °C for Levantinka, and 15.5 °C for Oblica.
Supplementary Materials
The following supporting information can be downloaded at the website of this paper posted on Preprints.org, Table S1: Relative retention times (RtR – retention time of the compound in relation to the retention time of syringic acid) for the standards of phenolic compounds detected by UHPLC and HPLC methods; Table S2: Phenolic compounds of virgin olive oil extracts detected and identified by UHPLC Q-TOF-MS and their calculated and experimentally determined relative retention times by HPLC- DAD method.
Author Contributions
Conceptualization, D.Š., S.B., O.K., M.Ž. and K.K.; methodology, K.K., M.J.Š. and M.Ž.; software, K.K.; validation, K.K.; formal analysis, D.Š. and K.K.; investigation, K.F., K.Ž., E.S., M.R., M.O., M.B. and M.D.; resources, K.K., D.Š., M.Ž. and M.J.Š.; data curation, K.K. and D.Š.; writing—original draft preparation, D.Š. and K.K.; writing—review and editing, M.J.Š., O.K., S.B., M.Ž. and M.O.; visualization, K.K. and D.Š.; supervision, D.Š., K.K. and S.B..; project administration, D.Š. and K.K.; funding acquisition, D.Š. and S.B. All authors have read and agreed to the published version of the manuscript.
Funding
This work was supported by the Croatian Science Foundation under the project number [HRZZ-IP-2020-02-7553]
Data Availability Statement
The original contributions generated for this study are included in the article/Supplementary Material; further inquiries can be directed to the corresponding author
Acknowledgments
We thank Melissa Trputec (University of Zagreb, Faculty of Food Technology and Biotechnology) for technical assistance in olive oil analyses, and Blanka Anđelić (Institute for Adriatic Crops) for technical assistance in olive oil processing.
Conflicts of Interest
The authors declare no conflicts of interest.
References
- Marrero, A.D.; Quesada, A.R.; Martínez-Poveda, B.; Medina, M.Á. Anti-Cancer, Anti-Angiogenic, and Anti-Atherogenic Potential of Key Phenolic Compounds from Virgin Olive Oil. Nutrients 2024, 16, 1283. [Google Scholar] [CrossRef] [PubMed]
- Lu, Y.; Zhao, J.; Xin, Q.; Yuan, R.; Miao, Y.; Yang, M.; Mo, H.; Chen, K.; Cong, W. Protective Effects of Oleic Acid and Polyphenols in Extra Virgin Olive Oil on Cardiovascular Diseases. Food Sci Hum Well 2024, 13, 529–540. [Google Scholar] [CrossRef]
- Gonçalves, M.; Vale, N.; Silva, P. Neuroprotective Effects of Olive Oil: A Comprehensive Review of Antioxidant Properties. Antioxidants 2024, 13, 762. [Google Scholar] [CrossRef]
- Tsimihodimos, V.; Psoma, O. Extra Virgin Olive Oil and Metabolic Diseases. Int J Mol Sci 2024, 25, 8117. [Google Scholar] [CrossRef]
- Obied, H.K.; Prenzler, P.D.; Ryan, D.; Servili, M.; Taticchi, A.; Esposto, S.; Robards, K. Biosynthesis and Biotransformations of Phenol-Conjugated Oleosidic Secoiridoids from Olea Europaea L. Nat Prod Rep 2008, 25, 1167. [Google Scholar] [CrossRef]
- Salas, J.J.; Sánchez, J. The Decrease of Virgin Olive Oil Flavor Produced by High Malaxation Temperature Is Due to Inactivation of Hydroperoxide. J Agric Food Chem 1999, 47, 809–812. [Google Scholar] [CrossRef]
- Sánchez-Ortiz, A.; Romero-Segura, C.; Sanz, C.; Pérez, A.G. Synthesis of Volatile Compounds of Virgin Olive Oil Is Limited by the Lipoxygenase Activity Load during the Oil Extraction Process. J Agric Food Chem 2012, 60, 812–822. [Google Scholar] [CrossRef] [PubMed]
- Kalua, C.M.; Bedgood, D.R.; Bishop, A.G.; Prenzler, P.D. Changes in Volatile and Phenolic Compounds with Malaxation Time and Temperature during Virgin Olive Oil Production. J Agric Food Chem 2006, 54, 7641–7651. [Google Scholar] [CrossRef]
- Kalua, C.M.; Allen, M.S.; Bedgood, D.R.; Bishop, A.G.; Prenzler, P.D.; Robards, K. Olive Oil Volatile Compounds, Flavour Development and Quality: A Critical Review. Food Chem 2007, 100, 273–286. [Google Scholar] [CrossRef]
- Bejaoui, M.A.; Sánchez-Ortiz, A.; Aguilera, M.P.; Ruiz-Moreno, M.J.; Sánchez, S.; Jiménez, A.; Beltrán, G. High Power Ultrasound Frequency for Olive Paste Conditioning: Effect on the Virgin Olive Oil Bioactive Compounds and Sensorial Characteristics. Innov Food Sci Emerg Technol 2018, 47, 136–145. [Google Scholar] [CrossRef]
- Romero-Segura, C.; García-Rodríguez, R.; Sánchez-Ortiz, A.; Sanz, C.; Pérez, A.G. The Role of Olive β-Glucosidase in Shaping the Phenolic Profile of Virgin Olive Oil. Food Res Int 2012, 45, 191–196. [Google Scholar] [CrossRef]
- Veneziani, G.; Esposto, S.; Taticchi, A.; Selvaggini, R.; Urbani, S.; Di Maio, I.; Sordini, B.; Servili, M. Flash Thermal Conditioning of Olive Pastes during the Oil Mechanical Extraction Process: Cultivar Impact on the Phenolic and Volatile Composition of Virgin Olive Oil. J Agric Food Chem 2015, 63, 6066–6074. [Google Scholar] [CrossRef]
- Nardella, M.; Moscetti, R.; Bedini, G.; Bandiera, A.; Chakravartula, S.S.N.; Massantini, R. Impact of Traditional and Innovative Malaxation Techniques and Technologies on Nutritional and Sensory Quality of Virgin Olive Oil – A Review. Food Chem Adv 2023, 2, 100163. [Google Scholar] [CrossRef]
- Kalogianni, E.P.; Georgiou, D.; Exarhopoulos, S. Olive Oil Droplet Coalescence during Malaxation. J Food Eng 2019, 240, 99–104. [Google Scholar] [CrossRef]
- Clodoveo, M.L. Malaxation: Influence on Virgin Olive Oil Quality. Past, Present and Future - An Overview. Trends Food Sci Technol 2012, 25, 13–23. [Google Scholar] [CrossRef]
- Leone, A.; Tamborrino, A.; Zagaria, R.; Sabella, E.; Romaniello, R. Plant Innovation in the Olive Oil Extraction Process: A Comparison of Efficiency and Energy Consumption between Microwave Treatment and Traditional Malaxation of Olive Pastes. J Food Eng 2015, 146, 44–52. [Google Scholar] [CrossRef]
- Clodoveo, M.L. New Advances in the Development of Innovative Virgin Olive Oil Extraction Plants: Looking Back to See the Future. Food Res Int 2013, 54, 726–729. [Google Scholar] [CrossRef]
- Clodoveo, M.L.; Moramarco, V.; Paduano, A.; Sacchi, R.; Di Palmo, T.; Crupi, P.; Corbo, F.; Pesce, V.; Distaso, E.; Tamburrano, P. Engineering Design and Prototype Development of a Full Scale Ultrasound System for Virgin Olive Oil by Means of Numerical and Experimental Analysis. Ultrason Sonochem 2017, 37, 169–181. [Google Scholar] [CrossRef]
- Andreou, V.; Dimopoulos, G.; Alexandrakis, Z.; Katsaros, G.; Oikonomou, D.; Toepfl, S.; Heinz, V.; Taoukis, P. Shelf-Life Evaluation of Virgin Olive Oil Extracted from Olives Subjected to Nonthermal Pretreatments for Yield Increase. Innovative Food Sci Emerg Technol 2017, 40, 52–57. [Google Scholar] [CrossRef]
- Romaniello, R.; Tamborrino, A.; Leone, A. Use of Ultrasound and Pulsed Electric Fields Technologies Applied to the Olive Oil Extraction Process. Chem Eng Trans 2019, 75, 13–18. [Google Scholar] [CrossRef]
- Amirante, P.; Clodoveo, M.L.; Dugo, G.; Leone, A.; Tamborrino, A. Advance Technology in Virgin Olive Oil Production from Traditional and De-Stoned Pastes: Influence of the Introduction of a Heat Exchanger on Oil Quality. Food Chem 2006, 98, 797–805. [Google Scholar] [CrossRef]
- Esposto, S.; Veneziani, G.; Taticchi, A.; Selvaggini, R.; Urbani, S.; Di Maio, I.; Sordini, B.; Minnocci, A.; Sebastiani, L.; Servili, M. Flash Thermal Conditioning of Olive Pastes during the Olive Oil Mechanical Extraction Process: Impact on the Structural Modifications of Pastes and Oil Quality. J Agric Food Chem 2013, 61, 4953–4960. [Google Scholar] [CrossRef]
- Leone, A.; Esposto, S.; Tamborrino, A.; Romaniello, R.; Taticchi, A.; Urbani, S.; Servili, M. Using a Tubular Heat Exchanger to Improve the Conditioning Process of the Olive Paste: Evaluation of Yield and Olive Oil Quality. Eur J Lipid Sci Technol 2016, 118, 308–317. [Google Scholar] [CrossRef]
- Veneziani, G.; Esposto, S.; Taticchi, A.; Urbani, S.; Selvaggini, R.; Di Maio, I.; Sordini, B.; Servili, M. Cooling Treatment of Olive Paste during the Oil Processing: Impact on the Yield and Extra Virgin Olive Oil Quality. Food Chem 2017, 221, 107–113. [Google Scholar] [CrossRef]
- Veneziani, G.; Esposto, S.; Taticchi, A.; Urbani, S.; Selvaggini, R.; Sordini, B.; Servili, M. Characterization of Phenolic and Volatile Composition of Extra Virgin Olive Oil Extracted from Six Italian Cultivars Using a Cooling Treatment of Olive Paste. LWT - Food Sci Technol 2018, 87, 523–528. [Google Scholar] [CrossRef]
- Selvaggini, R.; Esposto, S.; Taticchi, A.; Urbani, S.; Veneziani, G.; Di Maio, I.; Sordini, B.; Servili, M. Optimization of the Temperature and Oxygen Concentration Conditions in the Malaxation during the Oil Mechanical Extraction Process of Four Italian Olive Cultivars. J Agric Food Chem 2014, 62, 3813–3822. [Google Scholar] [CrossRef] [PubMed]
- Angerosa, F.; Servili, M.; Selvaggini, R.; Taticchi, A.; Esposto, S.; Montedoro, G. Volatile Compounds in Virgin Olive Oil: Occurrence and Their Relationship with the Quality. J Chromatogr A 2004, 1054, 17–31. [Google Scholar] [CrossRef]
- Gómez-Rico, A.; Fregapane, G.; Salvador, M.D. Effect of Cultivar and Ripening on Minor Components in Spanish Olive Fruits and Their Corresponding Virgin Olive Oils. Food Res Int 2008, 41, 433–440. [Google Scholar] [CrossRef]
- International Olive Council, Madrid, Spain. Available online: https://www.internationaloliveoil.org/what-we-do/economic-affairs-promotion-unit/#figures (accessed on 10 May 2025).
- ISO 3960:2017 - Animal and Vegetable Fats and Oils — Determination of Peroxide Value — Iodometric (Visual) Endpoint Determination. Available online: https://www.iso.org/standard/71268.html (accessed on 4 December 2023).
- COI/T.20/Doc. No 34/Rev. 1 2017 Method determination of free fatty acids, cold method. Available online: https://www.internationaloliveoil.org/what-we-do/chemistry-standardisation-unit/standards-and-methods/ (accessed on 5 December 2023).
- COI/T.20/Doc. No 19/Rev. 5 2019 Method of analysis spectrophotometric investigation in the ultraviolet. Available online: https://www.internationaloliveoil.org/what-we-do/chemistry-standardisation-unit/standards-and-methods/ (accessed on 4 December 2023).
- Peres, F.; Martins, L.L.; Ferreira-Dias, S. Laboratory-scale Optimization of Olive Oil Extraction: Simultaneous Addition of Enzymes and Microtalc Improves the Yield. Eur J Lipid Sci Technol 2014, 116, 1054–1062. [Google Scholar] [CrossRef]
- Kraljić, K.; Stjepanović, T.; Obranović, M.; Pospišil, M.; Balbino, S.; Škevin, D. Influence of Conditioning Temperature on the Quality, Nutritional Properties and Volatile Profile of Virgin Rapeseed Oil. Food Technol Biotechnol 2018, 56, 562–572. [Google Scholar] [CrossRef]
- COI/T.20/Doc. No 29/Rev. 2 2022 Document to declare the use of IOC methods for phenolic compounds determination. Available online: https://www.internationaloliveoil.org/what-we-do/chemistry-standardisation-unit/standards-and-methods/ (accessed on 11 December 2023).
- ISO 9936:2016 - Animal and Vegetable Fats and Oils — Determination of Tocopherol and Tocotrienol Contents by High-Performance Liquid Chromatography Available online:. Available online: https://www.iso.org/standard/69595.html (accessed on 6 December 2023).
- ISO 12966-2:2017 - Animal and Vegetable Fats and Oils — Gas Chromatography of Fatty Acid Methyl Esters — Part 2: Preparation of Methyl Esters of Fatty Acids Available online:. Available online: https://www.iso.org/standard/72142.html (accessed on 6 December 2023).
- Taticchi, A.; Esposto, S.; Veneziani, G.; Urbani, S.; Selvaggini, R.; Servili, M. The Influence of the Malaxation Temperature on the Activity of Polyphenoloxidase and Peroxidase and on the Phenolic Composition of Virgin Olive Oil. Food Chem 2013, 136, 975–983. [Google Scholar] [CrossRef] [PubMed]
- Inarejos-García, A.M.; Gómez-Rico, A.; Salvador, M.D.; Fregapane, G. Influence of Malaxation Conditions on Virgin Olive Oil Yield, Overall Quality and Composition. Eur Food Res Technol 2009, 228, 671–677. [Google Scholar] [CrossRef]
- Veneziani, G.; Nucciarelli, D.; Taticchi, A.; Esposto, S.; Selvaggini, R.; Tomasone, R.; Pagano, M.; Servili, M. Application of Low Temperature during the Malaxation Phase of Virgin Olive Oil Mechanical Extraction Processes of Three Different Italian Cultivars. Foods 2021, 10, 1578. [Google Scholar] [CrossRef]
- Kraljić, K.; Balbino, S.; Filipan, K.; Herceg, Z.; Ivanov, M.; Vukušić Pavičić, T.; Stuparević, I.; Pavlić, K.; Škevin, D. Innovative Approaches to Enhance Activity of Endogenous Olive Enzymes—A Model System Experiment: Part I—Thermal Techniques. Processes 2023, 11, 1194. [Google Scholar] [CrossRef]
- Commission Delegated Regulation Commission Delegated Regulation (EU) 2022/2104 of Supplementing Regulation (EU) No 1308/2013 of the European Parliament and of the Council as Regards Marketing Standards for Olive Oil, and Repealing Commission Regulation (EEC) No 2568/91 and Commission Implementing Regulation (EU) No 29/2012. 2022. 29 July.
- Panzanaro, S.; Nutricati, E.; Miceli, A.; De Bellis, L. Biochemical Characterization of a Lipase from Olive Fruit (Olea Europaea L.). Plant Physiol Biochem 2010, 48, 741–745. [Google Scholar] [CrossRef] [PubMed]
- Olmo-Cunillera, A.; Lozano-Castellón, J.; Pérez, M.; Miliarakis, E.; Tresserra-Rimbau, A.; Ninot, A.; Romero-Aroca, A.; Lamuela-Raventós, R.M.; Vallverdú-Queralt, A. Optimizing the Malaxation Conditions to Produce an Arbequina EVOO with High Content of Bioactive Compounds. Antioxidants 2021, 10, 1819. [Google Scholar] [CrossRef]
- Marx, Í.M.G.; Rodrigues, N.; Veloso, A.C.A.; Casal, S.; Pereira, J.A.; Peres, A.M. Effect of Malaxation Temperature on the Physicochemical and Sensory Quality of Cv. Cobrançosa Olive Oil and Its Evaluation Using an Electronic Tongue. LWT - Food Sci Technol 2021, 137, 110426. [Google Scholar] [CrossRef]
- Espínola, F.; Moya, M.; Fernández, D.G.; Castro, E. Improved Extraction of Virgin Olive Oil Using Calcium Carbonate as Coadjuvant Extractant. J Food Eng 2009, 92, 112–118. [Google Scholar] [CrossRef]
- Leone, A.; Tamborrino, A.; Esposto, S.; Berardi, A.; Servili, M. Investigation on the Effects of a Pulsed Electric Field (PEF) Continuous System Implemented in an Industrial Olive Oil Plant. Foods 2022, 11, 2758. [Google Scholar] [CrossRef]
- Yang, S.; Li, S.; Li, G.; Li, C.; Li, W.; Bi, Y.; Wei, J. Pulsed Electric Field Treatment Improves the Oil Yield, Quality, and Antioxidant Activity of Virgin Olive Oil. Food Chem X 2024, 22, 101372. [Google Scholar] [CrossRef]
- Tamborrino, A.; Romaniello, R.; Caponio, F.; Squeo, G.; Leone, A. Combined Industrial Olive Oil Extraction Plant Using Ultrasounds, Microwave, and Heat Exchange: Impact on Olive Oil Quality and Yield. J Food Eng 2019, 245, 124–130. [Google Scholar] [CrossRef]
- Andreou, V.; Psarianos, M.; Dimopoulos, G.; Tsimogiannis, D.; Taoukis, P. Effect of Pulsed Electric Fields and High Pressure on Improved Recovery of High-added-value Compounds from Olive Pomace. J Food Sci 2020, 85, 1500–1512. [Google Scholar] [CrossRef]
- Chemat, F.; Rombaut, N.; Sicaire, A.-G.; Meullemiestre, A.; Fabiano-Tixier, A.-S.; Abert-Vian, M. Ultrasound Assisted Extraction of Food and Natural Products. Mechanisms, Techniques, Combinations, Protocols and Applications. A Review. Ultrason Sonochem 2017, 34, 540–560. [Google Scholar] [CrossRef]
- Andreou, V.; Kourmbeti, E.; Dimopoulos, G.; Psarianos, M.; Katsaros, G.; Taoukis, P. Optimization of Virgin Olive Oil Yield and Quality Applying Nonthermal Processing. Food Bioproc Tech 2022, 15, 891–903. [Google Scholar] [CrossRef]
- Juliano, P.; Gaber, M.A.F.M.; Romaniello, R.; Tamborrino, A.; Berardi, A.; Leone, A. Advances in Physical Technologies to Improve Virgin Olive Oil Extraction Efficiency in High-Throughput Production Plants. Food Eng Rev 2023, 15, 625–642. [Google Scholar] [CrossRef]
- Cecchi, L.; Migliorini, M.; Mulinacci, N. Virgin Olive Oil Volatile Compounds: Composition, Sensory Characteristics, Analytical Approaches, Quality Control, and Authentication. J Agric Food Chem 2021, 69, 2013–2040. [Google Scholar] [CrossRef] [PubMed]
- Mikrou, T.; Litsa, M.; Papantoni, A.; Kapsokefalou, M.; Gardeli, C.; Mallouchos, A. Effect of Cultivar and Geographical Origin on the Volatile Composition of Greek Monovarietal Extra Virgin Olive Oils. Chemosensors 2023, 11, 80. [Google Scholar] [CrossRef]
- Germek, V.M.; Koprivnjak, O.; Butinar, B.; Pizzale, L.; Bučar-Miklavčič, M.; Conte, L.S. Influence of Phenols Mass Fraction in Olive (Olea Europaea L.) Paste on Volatile Compounds in Buža Cultivar Virgin Olive Oil. J Agric Food Chem 2013, 61, 5921–5927. [Google Scholar] [CrossRef]
- Lukić, I.; Lukić, M.; Žanetić, M.; Krapac, M.; Godena, S.; Brkić Bubola, K. Inter-Varietal Diversity of Typical Volatile and Phenolic Profiles of Croatian Extra Virgin Olive Oils as Revealed by GC-IT-MS and UPLC-DAD Analysis. Foods 2019, 8, 565. [Google Scholar] [CrossRef]
- Žanetić, M.; Jukić Špika, M.; Ožić, M.M.; Brkić Bubola, K. Comparative Study of Volatile Compounds and Sensory Characteristics of Dalmatian Monovarietal Virgin Olive Oils. Plants 2021, 10, 1995. [Google Scholar] [CrossRef]
- Soldo, B.; Jukić Špika, M.; Pasković, I.; Vuko, E.; Polić Pasković, M.; Ljubenkov, I. The Composition of Volatiles and the Role of Non-Traditional LOX on Target Metabolites in Virgin Olive Oil from Autochthonous Dalmatian Cultivars. Molecules 2024, 29, 1696. [Google Scholar] [CrossRef] [PubMed]
- Olmo-Cunillera, A.; Casadei, E.; Valli, E.; Lozano-Castellón, J.; Miliarakis, E.; Domínguez-López, I.; Ninot, A.; Romero-Aroca, A.; Lamuela-Raventós, R.M.; Pérez, M.; Vallverdú-Queralt, A.; Bendini, A. Aromatic, Sensory, and Fatty Acid Profiles of Arbequina Extra Virgin Olive Oils Produced Using Different Malaxation Conditions. Foods 2022, 11, 3446. [Google Scholar] [CrossRef] [PubMed]
- Servili, M.; Taticchi, A.; Esposto, S.; Urbani, S.; Selvaggini, R.; Montedoro, G.F. Effect of Olive Stoning on the Volatile and Phenolic Composition of Virgin Olive Oil. J Agric Food Chem 2007, 55, 7028–7035. [Google Scholar] [CrossRef]
- Finicelli, M.; Squillaro, T.; Di Cristo, F.; Di Salle, A.; Melone, M.A.B.; Galderisi, U.; Peluso, G. Metabolic Syndrome, Mediterranean Diet, and Polyphenols: Evidence and Perspectives. J Cell Physiol 2019, 234, 5807–5826. [Google Scholar] [CrossRef] [PubMed]
- Emma, M.R.; Augello, G.; Di Stefano, V.; Azzolina, A.; Giannitrapani, L.; Montalto, G.; Cervello, M.; Cusimano, A. Potential Uses of Olive Oil Secoiridoids for the Prevention and Treatment of Cancer: A Narrative Review of Preclinical Studies. Int J Mol Sci 2021, 22, 1234. [Google Scholar] [CrossRef]
- Diamantakos, P.; Ioannidis, K.; Papanikolaou, C.; Tsolakou, A.; Rigakou, A.; Melliou, E.; Magiatis, P. A New Definition of the Term “High-Phenolic Olive Oil” Based on Large Scale Statistical Data of Greek Olive Oils Analyzed by QNMR. Molecules 2021, 26, 1115. [Google Scholar] [CrossRef]
- Lukić, I.; Horvat, I.; Godena, S.; Krapac, M.; Lukić, M.; Vrhovsek, U.; Brkić Bubola, K. Towards Understanding the Varietal Typicity of Virgin Olive Oil by Correlating Sensory and Compositional Analysis Data: A Case Study. Food Res Int 2018, 112, 78–89. [Google Scholar] [CrossRef]
- Lukić, I.; Krapac, M.; Horvat, I.; Godena, S.; Kosić, U.; Brkić Bubola, K. Three-Factor Approach for Balancing the Concentrations of Phenols and Volatiles in Virgin Olive Oil from a Late-Ripening Olive Cultivar. LWT - Food Sci Technol 2018, 87, 194–202. [Google Scholar] [CrossRef]
- Soldo, B.; Jukić Špika, M.; Pasković, I.; Vuko, E.; Polić Pasković, M.; Ljubenkov, I. The Composition of Volatiles and the Role of Non-Traditional LOX on Target Metabolites in Virgin Olive Oil from Autochthonous Dalmatian Cultivars. Molecules 2024, 29, 1696. [Google Scholar] [CrossRef]
- Jukić Špika, M.; Perica, S.; Žanetić, M.; Škevin, D. Virgin Olive Oil Phenols, Fatty Acid Composition and Sensory Profile: Can Cultivar Overpower Environmental and Ripening Effect? Antioxidants 2021, 10, 689. [Google Scholar] [CrossRef]
- Diamantakos, P.; Giannara, T.; Skarkou, M.; Melliou, E.; Magiatis, P. Influence of Harvest Time and Malaxation Conditions on the Concentration of Individual Phenols in Extra Virgin Olive Oil Related to Its Healthy Properties. Molecules 2020, 25, 2449. [Google Scholar] [CrossRef]
- Lukić, I.; Žanetić, M.; Jukić Špika, M.; Lukić, M.; Koprivnjak, O.; Brkić Bubola, K. Complex Interactive Effects of Ripening Degree, Malaxation Duration and Temperature on Oblica Cv. Virgin Olive Oil Phenols, Volatiles and Sensory Quality. Food Chem 2017, 232, 610–620. [Google Scholar] [CrossRef]
- Aguilera, M.P.; Jimenez, A.; Sanchez-Villasclaras, S.; Uceda, M.; Beltran, G. Modulation of Bitterness and Pungency in Virgin Olive Oil from Unripe “Picual” Fruits. Eur J Lipid Sci Technol 2015, 117, 1463–1472. [Google Scholar] [CrossRef]
- Stefanoudaki, E.; Koutsaftakis, A.; Harwood, J.L. Influence of Malaxation Conditions on Characteristic Qualities of Olive Oil. Food Chem 2011, 127, 1481–1486. [Google Scholar] [CrossRef]
- Amirante, R.; Cini, E.; Montel, G.L.; Pasqualone, A. Influence of Mixing and Extraction Parameters on Virgin Olive Oil Quality. Grasas y Aceites 2001, 52, 198–201. [Google Scholar] [CrossRef]
- Angerosa, F.; Mostallino, R.; Basti, C.; Vito, R. Influence of Malaxation Temperature and Time on the Quality of Virgin Olive Oils. Food Chem 2001, 72, 19–28. [Google Scholar] [CrossRef]
- Parenti, A.; Spugnoli, P.; Masella, P.; Calamai, L. The Effect of Malaxation Temperature on the Virgin Olive Oil Phenolic Profile under Laboratory-scale Conditions. Eur J Lipid Sci Technol 2008, 110, 735–741. [Google Scholar] [CrossRef]
- Koprivnjak, O.; Kriško, A.; Valić, S.; Carić, D.; Krapac, M.; Poljuha, D. Antioxidants, Radical-Scavenging and Protein Carbonylation Inhibition Capacity of Six Monocultivar Virgin Olive Oils in Istria (Croatia). Acta Aliment 2016, 45, 427–433. [Google Scholar] [CrossRef]
- Koprivnjak, O. , Vrhovnik, I., Hladnik, T., Prgomet, Ž., Hlevnjak, B., Majetić Germek, V. Characteristics of Nutritive Value of Virgin Olive Oils from Buža, Istarska Bjelica, Leccino and Rosulja Cultivars. Cro J Food Technol Biotechnol Nutr 2012, 7, 172–178. [Google Scholar]
- Pérez, A.G.; León, L.; Pascual, M.; de la Rosa, R.; Belaj, A.; Sanz, C. Analysis of Olive (Olea Europaea L.) Genetic Resources in Relation to the Content of Vitamin E in Virgin Olive Oil. Antioxidants 2019, 8, 242. [Google Scholar] [CrossRef]
- Šarolić, M.; Gugić, M.; Friganović, E.; Tuberoso, C.; Jerković, I. Phytochemicals and Other Characteristics of Croatian Monovarietal Extra Virgin Olive Oils from Oblica, Lastovka and Levantinka Varieties. Molecules 2015, 20, 4395–4409. [Google Scholar] [CrossRef] [PubMed]
- Jukić Špika, M.; Kraljić, K.; Koprivnjak, O.; Škevin, D.; Žanetić, M.; Katalinić, M. Effect of Agronomical Factors and Storage Conditions on the Tocopherol Content of Oblica and Leccino Virgin Olive Oils. J Am Oil Chem Soc 2015, 92, 1293–1301. [Google Scholar] [CrossRef]
- Pazos, M.; Andersen, M.L.; Medina, I.; Skibsted, L.H. Efficiency of Natural Phenolic Compounds Regenerating α-Tocopherol from α-Tocopheroxyl Radical. J Agric Food Chem 2007, 55, 3661–3666. [Google Scholar] [CrossRef]
- Rastrelli, L.; Passi, S.; Ippolito, F.; Vacca, G.; De Simone, F. Rate of Degradation of α-Tocopherol, Squalene, Phenolics, and Polyunsaturated Fatty Acids in Olive Oil during Different Storage Conditions. J Agric Food Chem 2002, 50, 5566–5570. [Google Scholar] [CrossRef]
- Sánchez, J.; Harwood, J.L. Biosynthesis of Triacylglycerols and Volatiles in Olives. Eur J Lipid Sci Technol 2002, 104, 564–573. [Google Scholar] [CrossRef]
- Rondanini, D.P.; Castro, D.N.; Searles, P.S.; Rousseaux, M.C. Contrasting Patterns of Fatty Acid Composition and Oil Accumulation during Fruit Growth in Several Olive Varieties and Locations in a Non-Mediterranean Region. Eur J Agr 2014, 52, 237–246. [Google Scholar] [CrossRef]
- Kiritsakis, A.; Shahidi, F. Olive Oil Quality and Its Relation to the Functional Bioactives and Their Properties. In Olives and Olive Oil as Functional Foods; Wiley, 2017; pp. 205–219.
- Špika Jukić, M.; Žanetić, M.; Pinatel, C.; Vitanović, E.; Strikić, F. Fatty Acid and Triacylgycerol Profile of Levantinka Virgin Olive Oil. In Proceedings of the 14th Ružička days: Today science – Tomorrow industry; Jukić, A., Ed.; Croatian Society of Chemical Engineers Faculty of Food Technology: Osijek, 2013; pp. 213–218. [Google Scholar]
- Jukić Špika, M.; Žanetić, M.; Kraljić, K.; Soldo, B.; Ljubenkov, I.; Politeo, O.; Škevin, D. Differentiation Between Unfiltered and Filtered Oblica and Leccino Cv. Virgin Olive Oils. J Food Sci 2019, 84, 877–885. [Google Scholar] [CrossRef] [PubMed]
- Jukić Špika, M.; Perica, S.; Žanetić, M.; Škevin, D. Virgin Olive Oil Phenols, Fatty Acid Composition and Sensory Profile: Can Cultivar Overpower Environmental and Ripening Effect? Antioxidants 2021, 10, 689. [Google Scholar] [CrossRef]
- Brkić Bubola, K.; Valenčič, V.; Bučar-Miklavčič, M.; Krapac, M.; Lukić, M.; Šetić, E.; Sladonja, B. Sterol, Triterpen Dialcohol and Fatty Acid Profile of Less- and Well-Known Istrian Monovarietal Olive Oil. Cro J Food Sci Technol 2018, 10, 118–122. [Google Scholar] [CrossRef]
- Morales, M.T.; Przybylski, R. Olive Oil Oxidation. In Handbook of Olive Oil; Springer US: Boston, MA, 2013; pp. 479–522. [Google Scholar]
- Velasco, J.; Dobarganes, C. Oxidative Stability of Virgin Olive Oil. Eur J Lipid Sci Technol 2002, 104, 661–676. [Google Scholar] [CrossRef]
- Rubio, C.P.; Hernández-Ruiz, J.; Martinez-Subiela, S.; Tvarijonaviciute, A.; Arnao, M.B.; Ceron, J.J. Validation of Three Automated Assays for Total Antioxidant Capacity Determination in Canine Serum Samples. J Vet Diagn Invest 2016, 28, 693–698. [Google Scholar] [CrossRef] [PubMed]
- Prior, R.L.; Wu, X.; Schaich, K. Standardized Methods for the Determination of Antioxidant Capacity and Phenolics in Foods and Dietary Supplements. J Agric Food Chem 2005, 53, 4290–4302. [Google Scholar] [CrossRef]
- Visioli, F.; Bellomo, G.; Galli, C. Free Radical-Scavenging Properties of Olive Oil Polyphenols. Biochem Biophys Res Commun 1998, 247, 60–64. [Google Scholar] [CrossRef] [PubMed]
- Quirantes-Piné, R.; Lozano-Sánchez, J.; Herrero, M.; Ibáñez, E.; Segura-Carretero, A.; Fernández-Gutiérrez, A. HPLC–ESI–QTOF–MS as a Powerful Analytical Tool for Characterising Phenolic Compounds in Olive-leaf Extracts. Phytochem Anal 2013, 24, 213–223. [Google Scholar] [CrossRef]
- Kalogiouri, N.P.; Kritikou, E.; Martakos, I.C.; Lazarou, C.; Pentogennis, M.; Thomaidis, N.S. Characterization of the Phenolic Fingerprint of Kolovi Extra Virgin Olive Oils from Lesvos with Regard to Altitude and Farming System Analyzed by UHPLC-QTOF-MS. Molecules 2021, 26, 5634. [Google Scholar] [CrossRef] [PubMed]
- Kanakis, P.; Termentzi, A.; Michel, T.; Gikas, E.; Halabalaki, M.; Skaltsounis, A.-L. From Olive Drupes to Olive Oil. An HPLC-Orbitrap-Based Qualitative and Quantitative Exploration of Olive Key Metabolites. Planta Med 2013, 79, 1576–1587. [Google Scholar] [CrossRef]
- Sánchez de Medina, V.; Miho, H.; Melliou, E.; Magiatis, P.; Priego-Capote, F.; Luque de Castro, M.D. Quantitative Method for Determination of Oleocanthal and Oleacein in Virgin Olive Oils by Liquid Chromatography–Tandem Mass Spectrometry. Talanta 2017, 162, 24–31. [Google Scholar] [CrossRef]
- Jerman Klen, T.; Golc Wondra, A.; Vrhovšek, U.; Mozetič Vodopivec, B. Phenolic Profiling of Olives and Olive Oil Process-Derived Matrices Using UPLC-DAD-ESI-QTOF-HRMS Analysis. J Agric Food Chem 2015, 63, 3859–3872. [Google Scholar] [CrossRef]
Figure 1.
(a) Variable importance in the projection (VIP) of induction period – IP (min) with the variables SFA – sum of saturated fatty acids, MUFA – sum of monounsaturated fatty acids, PUFA – sum of polyunsaturated fatty acids, α-TOCO – α-tocopherol, HTY – hydroxytyrosol, TY – tyrosol, OLEA – oleacein, OLEC – oleocanthal, OLEU AGL – sum of oleuropein aglycons, LIG AGL – sum of ligstroside aglycons, MH OLEC -methyl hemiacetal of oleocanthal, p-CA – p-coumaric acid, TPC – total phenols. The solid black line represents the significance threshold for VIP score. (b) The predicted versus actual values of antioxidant capacity. The gray solid line represents the 95 % confidence interval.
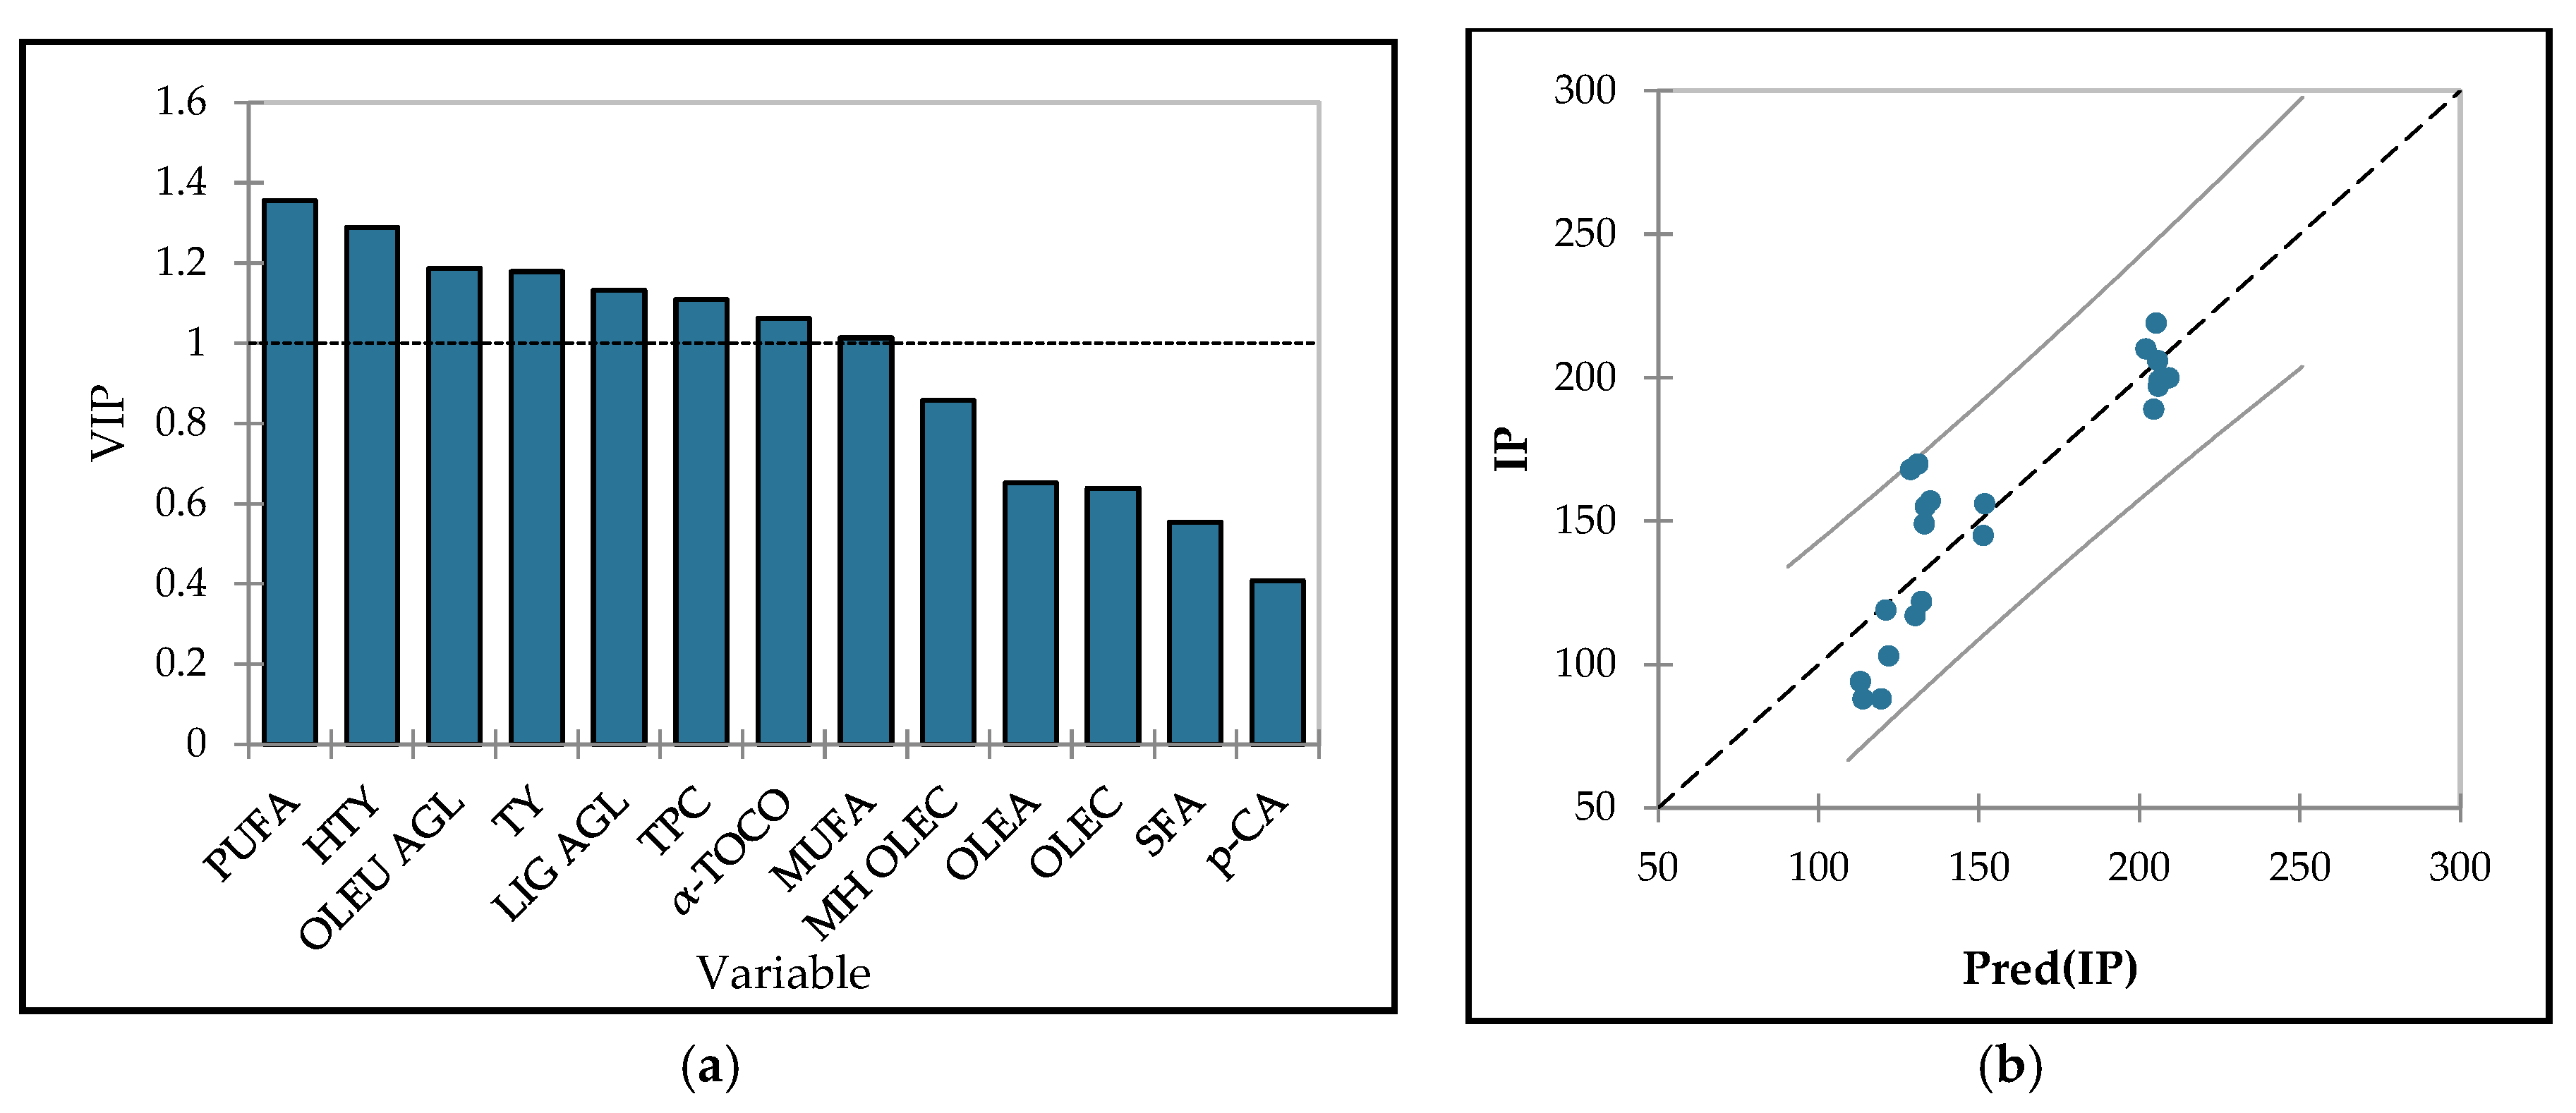
Figure 2.
(a) Variable importance in the projection (VIP) of antioxidant capacity - AC (% red. DPPH˙) with the variables α-TOCO - α-tocopherol, HTY - hydroxytyrosol, TY - tyrosol, OLEA - oleacein, OLEC - oleocanthal, OLEU AGL – sum of oleuropein aglycons, LIG AGL – sum of ligstroside aglycons, MH OLEC -methyl hemiacetal of oleocanthal, p-CA - p-coumaric acid, TPC - total phenols. The solid black line represents the significance threshold for VIP score. (b) The predicted versus actual values of antioxidant capacity. The gray solid line represents the 95 % confidence interval.
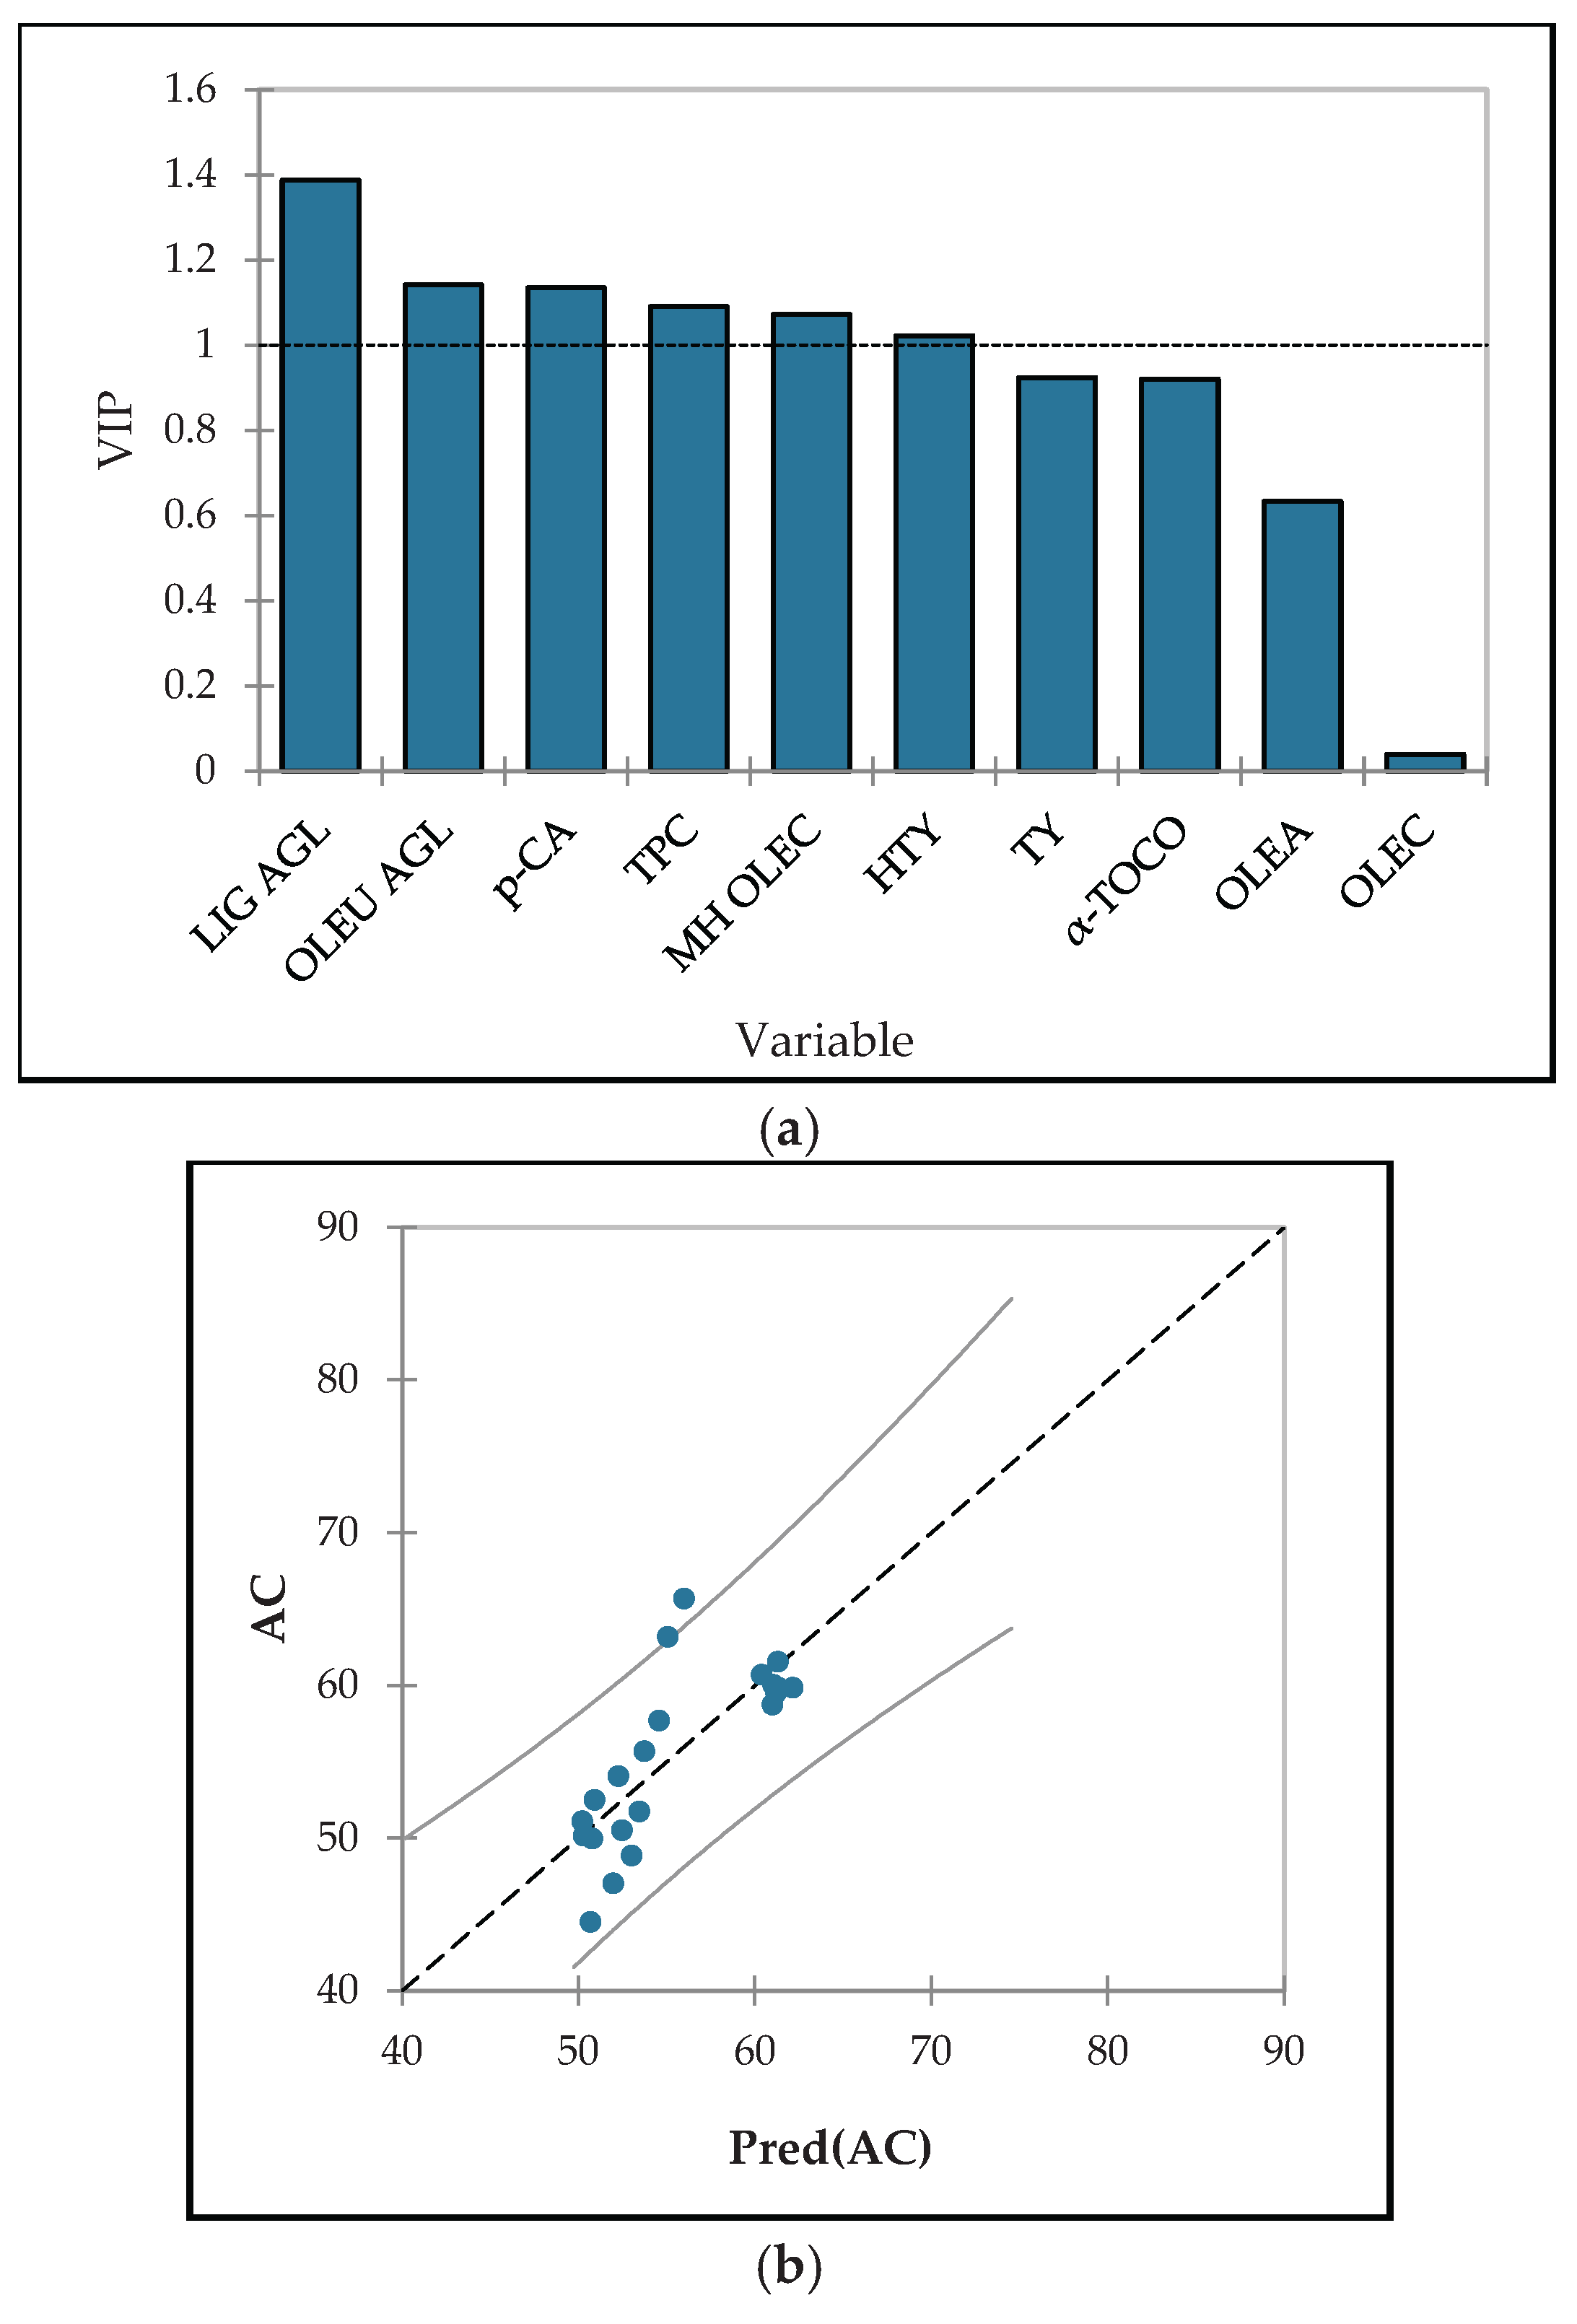

Table 1.
Extraction yield and basic quality parameters (acidity, peroxide value – PV and K-values) of controls and oils produced with flash thermal treatment (FTT) as an effect of variety and pretreatment temperature.
Table 1.
Extraction yield and basic quality parameters (acidity, peroxide value – PV and K-values) of controls and oils produced with flash thermal treatment (FTT) as an effect of variety and pretreatment temperature.
| Source of variation |
Acidity (% oleic fatty acid) |
PV (meq O2/kg) |
K-values | Yield (%) | ||
| K232 | K268 | ΔK | ||||
| Variety* | p ≤ 0.001 | p ≤ 0.01 | p ≤ 0.001 | p ≤ 0.001 | p ≤ 0.001 | p ≤ 0.001 |
| Istarska Bjelica | 0.40 ± 0.00 a | 4.3 ± 0.1 b | 2.01 ± 0.02 a | 0.22 ± 0.01 a | -0.01 ± 0.00 c | 25.69 ± 0.15 a |
| Levantinka | 0.24 ± 0.00 c | 5.0 ± 0.3 ab | 1.68 ± 0.02 b | 0.13 ± 0.01 b | 0.00 ± 0.00 a | 12.52 ± 0.11 c |
| Oblica | 0.30 ± 0.00 b | 5.4 ± 0.2 a | 1.89 ± 0.11 ab | 0.18 ± 0.01 a | -0.01 ± 0.00 b | 13.36 ± 0.08 b |
| Temperature (°C) ** | p ≤ 0.001 | p ≤ 0.001 | p = 0.529 | p = 0.824 | p ≤ 0.001 | p ≤ 0.05 |
| Control | 0.32 ± 0.01 ab | 3.2 ± 0.1 b | 1.87 ± 0.04 | 0.18 ± 0.01 | -0.01 ± 0.00 a | 16.83 ± 0.26 ab |
| 15 | 0.30 ± 0.00 b | 5.4 ± 0.2 a | 1.83 ± 0.03 | 0.19 ± 0.02 | -0.01 ± 0.00 a | 16.81 ± 0.18 b |
| 20 | 0.31 ± 0.00 ab | 4.8 ± 0.3 a | 1.84 ± 0.02 | 0.18 ± 0.01 | 0.00 ± 0.00 a | 17.19 ± 0.15 ab |
| 25 | 0.29 ± 0.00 c | 4.7 ± 0.4 a | 1.83 ± 0.03 | 0.18 ± 0.01 | 0.00 ± 0.00 a | 17.21 ± 0.20 ab |
| 30 | 0.32 ± 0.00 ab | 5.2 ± 0.4 a | 1.95 ± 0.04 | 0.18 ± 0.02 | -0.01 ± 0.00 a | 17.30 ± 0.13 ab |
| 35 | 0.33 ± 0.00 a | 5.2 ± 0.5 a | 1.74 ± 0.25 | 0.16 ± 0.02 | -0.01 ± 0.00 b | 17.45 ± 0.17 ab |
| 40 | 0.33 ± 0.00 a | 5.8 ± 0.3 a | 1.96 ± 0.02 | 0.17 ± 0.01 | -0.01 ± 0.00 b | 17.56 ± 0.11 a |
| Variety × Temperature (°C) | p ≤ 0.001 | p ≤ 0.001 | p = 0.494 | p = 0.168 | p ≤ 0.001 | p ≤ 0.05 |
| Istarska Bjelica × Control | 0.42 ± 0.02 a | 2.9 ± 0.3 e | 1.92 ± 0.08 | 0.23 ± 0.02 | 0.00 ± 0.00 a | 24.70 ± 0.72 b |
| Istarska Bjelica × 15 | 0.38 ± 0.01 c | 4.8 ± 0.1 b-e | 1.89 ± 0.04 | 0.19 ± 0.01 | -0.01 ± 0.00 c | 25.18 ± 0.42 b |
| Istarska Bjelica × 20 | 0.39 ± 0.01 abc | 5.3 ± 0.1 a-e | 2.02 ± 0.00 | 0.23 ± 0.01 | -0.01 ± 0.00 bc | 25.72 ± 0.10 ab |
| Istarska Bjelica × 25 | 0.39 ± 0.00 bc | 6.0 ± 0.2 a-d | 2.00 ± 0.03 | 0.21 ± 0.01 | -0.01 ± 0.00 bc | 26.69 ± 0.41 a |
| Istarska Bjelica × 30 | 0.39 ± 0.01 abc | 4.5 ± 0.7 b-e | 2.06 ± 0.09 | 0.23 ± 0.06 | -0.01 ± 0.00 bc | 25.86 ± 0.21 ab |
| Istarska Bjelica × 35 | 0.42 ± 0.00 ab | 3.4 ± 0.6 de | 2.10 ± 0.05 | 0.25 ± 0.02 | -0.01 ± 0.00 bc | 25.98 ± 0.28 ab |
| Istarska Bjelica × 40 | 0.42 ± 0.01 ab | 3.4 ± 0.1 de | 2.07 ± 0.05 | 0.20 ± 0.02 | -0.01 ± 0.00 bc | 25.69 ± 0.19 ab |
| Levantinka × Control | 0.24 ± 0.01 fg | 3.3 ± 0.1 de | 1.70 ± 0.03 | 0.10 ± 0.00 | -0.01 ±0.0. abc | 12.22 ± 0.12 e |
| Levantinka × 15 | 0.24 ± 0.01 fg | 6.9 ± 0.6 ab | 1.67 ± 0.06 | 0.15 ± 0.03 | 0.00 ± 0.00 a | 12.44 ± 0.17 de |
| Levantinka × 20 | 0.25 ± 0.01 fg | 4.9 ± 0.7 b-e | 1.62 ± 0.02 | 0.12 ± 0.01 | 0.00 ± 0.00 a | 12.95 ± 0.34 cde |
| Levantinka × 25 | 0.22 ± 0.00 g | 3.9 ± 1.1 cde | 1.69 ± 0.04 | 0.16 ± 0.01 | 0.00 ± 0.00 a | 12.22 ± 0.41 e |
| Levantinka × 30 | 0.23 ± 0.01 g | 4.6 ± 1.1 b-e | 1.69 ± 0.06 | 0.13 ± 0.00 | 0.00 ± 0.00 a | 12.36 ± 0.19 de |
| Levantinka × 35 | 0.23 ± 0.01 fg | 5.3 ± 1.1 a-e | 1.66 ± 0.01 | 0.11 ± 0.01 | -0.01 ± 0.00 bc | 12.43 ± 0.40 de |
| Levantinka × 40 | 0.24 ± 0.00 fg | 6.3 ± 0.4 abc | 1.71 ± 0.02 | 0.12 ± 0.01 | -0.01 ± 0.00 bc | 13.03 ± 0.22 cde |
| Oblica × Control | 0.30 ± 0.01 d | 3.5 ± 0.1 de | 1.98 ± 0.06 | 0.20 ± 0.03 | -0.01 ± 0.00 bc | 13.58 ± 0.23 cd |
| Oblica × 15 | 0.30 ± 0.01 de | 4.5 ± 0.3 b-e | 1.93 ± 0.07 | 0.22 ± 0.05 | 0.00 ± 0.00 ab | 12.81 ± 0.28 cde |
| Oblica × 20 | 0.30 ± 0.00 d | 4.3 ± 0.5 b-e | 1.88 ± 0.04 | 0.19 ± 0.03 | 0.00 ± 0.00 a | 12.89 ± 0.26 cde |
| Oblica × 25 | 0.27 ± 0.01 ef | 4.3 ± 0.5 b-e | 1.80 ± 0.08 | 0.17 ± 0.03 | 0.00 ± 0.00 a | 12.71 ± 0.16 cde |
| Oblica × 30 | 0.32 ± 0.00 d | 6.5 ± 0.2 abc | 2.10 ± 0.04 | 0.19 ± 0.01 | -0.01 ± 0.00 bc | 13.67 ± 0.27 cd |
| Oblica × 35 | 0.33 ± 0.00 d | 6.8 ± 1.0 ab | 1.45 ± 0.76 | 0.12 ± 0.06 | -0.01 ± 0.00 bc | 13.93 ± 0.11 c |
| Oblica × 40 | 0.32 ± 0.00 d | 7.7 ± 0.9 a | 2.09 ± 0.01 | 0.19 ± 0.01 | -0.01 ± 0.00 bc | 13.94 ± 0.15 c |
Values with different letters in each column subsection are statistically different (p ≤ 0.05) according to Tukey’s multiple comparison tests; * Results represent LS mean ± standard error of control and all temperatures applied for each variety; ** Results represent LS mean ± standard error of all three varieties for control and for the samples pretreated at the indicated temperature.
Table 2.
Composition of volatile compounds (Part I – compounds resulting from lipoxygenase pathway (LOX path)) of controls and oils produced with flash thermal treatment (FTT) as an effect of variety and pretreatment temperature.
Table 2.
Composition of volatile compounds (Part I – compounds resulting from lipoxygenase pathway (LOX path)) of controls and oils produced with flash thermal treatment (FTT) as an effect of variety and pretreatment temperature.
| Source of variation |
VOC from LOX path (mg/kg) |
||||||||||||||
| 2-pentenal | 3-hexenal | 2-methyl-4-pentenal | 2-hexenal | 1-penten-3-ol | (E)2-penten-1-ol | (Z)2-penten-1-ol | 3-hexen-1-ol | ||||||||
| A | B | B | A | A | B | B | A | ||||||||
| Variety* | p ≤ 0.001 | p ≤ 0.001 | p ≤ 0.001 | p ≤ 0.001 | p = 0.171 | p = 0.699 | p = 0.948 | p = 0.180 | |||||||
| Istarska Bjelica | 0.17 ± 0.01 b | 2.24 ± 0.06 c | nd c | 6.37 ± 0.21 c | 1.99 ± 0.47 | 0.15 ± 0.01 | 1.49 ± 0.04 | 1.27 ± 0.07 | |||||||
| Levantinka | 0.32 ± 0.03 a | 6.23 ± 0.56 b | 1.81 ± 0.18 b | 21.92 ± 0.79 a | 1.46 ± 0.03 | 0.18 ± 0.03 | 1.53 ± 0.02 | 2.34 ± 0.72 | |||||||
| Oblica | 0.33 ± 0.02 a | 8.31 ± 0.49 a | 2.70 ± 0.14 a | 7.65 ± 0.27 b | 1.46 ± 0.03 | 0.16 ± 0.04 | 1.54 ± 0.23 | 1.94 ± 0.46 | |||||||
| Temperature (°C) ** | p = 0.071 | p ≤ 0.05 | p ≤ 0.01 | p ≤ 0.01 | p = 0.388 | p = 0.271 | p = 0.424 | p = 0.094 | |||||||
| Control | 0.32 ± 0.02 | 5.41 ± 0.62 a | 1.94 ± 0.23 a | 12.82 ± 0.46 ab | 1.60 ± 0.07 | 0.15 ± 0.01 | 1.54 ± 0.04 | 1.90 ± 0.25 | |||||||
| 15 | 0.29 ± 0.03 | 7.51 ± 0.81 a | 1.80 ± 0.17 a | 12.90 ± 0.27 ab | 2.41 ± 1.10 | 0.12 ± 0.00 | 1.48 ± 0.04 | 1.34 ± 0.22 | |||||||
| 20 | 0.23 ± 0.04 | 6.20 ± 1.15 a | 0.92 ± 0.27 a | 10.58 ± 0.45 b | 1.48 ± 0.09 | 0.24 ± 0.11 | 1.85 ± 0.54 | 1.38 ± 0.39 | |||||||
| 25 | 0.22 ± 0.06 | 5.03 ± 0.60 a | 1.64 ± 0.26 a | 13.56 ± 1.61 a | 1.62 ± 0.04 | 0.17 ± 0.02 | 1.60 ± 0.04 | 3.76 ± 1.89 | |||||||
| 30 | 0.31 ± 0.02 | 4.90 ± 0.30 a | 1.54 ± 0.06 a | 12.42 ± 0.15 ab | 1.55 ± 0.04 | 0.14 ± 0.00 | 1.48 ± 0.03 | 1.62 ± 0.16 | |||||||
| 35 | 0.24 ± 0.03 | 4.98 ± 0.39 a | 1.24 ± 0.23 a | 10.81 ± 0.86 b | 1.48 ± 0.03 | 0.19 ± 0.03 | 1.41 ± 0.03 | 1.41 ± 0.41 | |||||||
| 40 | 0.29 ± 0.02 | 5.11 ± 0.30 a | 1.44 ± 0.06 a | 10.78 ± 0.48 b | 1.31 ± 0.04 | 0.13 ± 0.00 | 1.31 ± 0.03 | 1.55 ± 0.10 | |||||||
| Variety × Temperature (°C) | p = 0.449 | p = 0.146 | p ≤ 0.05 | p ≤ 0.05 | p = 0.479 | p = 0.433 | p = 0.093 | p = 0.975 | |||||||
| Istarska Bjelica × Control | 0.20 ± 0.02 | 2.84 ± 0.12 | nd c | 6.77 ± 0.07 bcd | 1.88 ± 0.11 | 0.18 ± 0.01 | 1.81 ± 0.09 | 1.55 ± 0.16 | |||||||
| Istarska Bjelica × 15 | 0.12 ± 0.01 | 2.24 ± 0.11 | nd c | 5.28 ± 0.55 cd | 4.24 ± 3.29 | 0.12 ± 0.01 | 1.41 ± 0.12 | 1.10 ± 0.12 | |||||||
| Istarska Bjelica × 20 | 0.14 ± 0.04 | 1.85 ± 0.35 | nd c | 4.06 ± 0.59 d | 1.42 ± 0.22 | 0.12 ± 0.02 | 1.23 ± 0.21 | 0.95 ± 0.11 | |||||||
| Istarska Bjelica × 25 | 0.17 ± 0.05 | 2.23 ± 0.17 | nd c | 11.5 ± 1.06 b | 1.96 ± 0.09 | 0.21 ± 0.05 | 1.85 ± 0.07 | 1.76 ± 0.38 | |||||||
| Istarska Bjelica × 30 | 0.20 ± 0.00 | 2.21 ± 0.08 | nd c | 6.36 ± 0.15 bcd | 1.67 ± 0.01 | 0.16 ± 0.01 | 1.61 ± 0.04 | 1.42 ± 0.11 | |||||||
| Istarska Bjelica × 35 | 0.18 ± 0.02 | 1.94 ± 0.11 | nd c | 4.75 ± 0.37 cd | 1.42 ± 0.07 | 0.14 ± 0.01 | 1.30 ± 0.09 | 0.91 ± 0.08 | |||||||
| Istarska Bjelica × 40 | 0.19 ± 0.01 | 2.35 ± 0.07 | nd c | 5.87 ± 0.48 bcd | 1.32 ± 0.06 | 0.13 ± 0.00 | 1.26 ± 0.03 | 1.21 ± 0.03 | |||||||
| Levantinka × Control | 0.39 ± 0.01 | 5.33 ± 0.90 | 2.41 ± 0.12 ab | 23.91 ± 0.51 a | 1.50 ± 0.03 | 0.14 ± 0.01 | 1.52 ± 0.01 | 1.84 ± 0.36 | |||||||
| Levantinka × 15 | 0.41 ± 0.08 | 7.84 ± 2.23 | 2.14 ± 0.49 ab | 23.45 ± 0.54 a | 1.40 ± 0.05 | 0.13 ± 0.01 | 1.58 ± 0.03 | 1.62 ± 0.63 | |||||||
| Levantinka × 20 | 0.23 ± 0.09 | 7.57 ± 2.63 | 0.40 ± 0.46 c | 20.25 ± 1.14 a | 1.41 ± 0.12 | 0.24 ± 0.16 | 1.52 ± 0.07 | 1.54 ± 1.10 | |||||||
| Levantinka × 25 | 0.27 ± 0.16 | 5.85 ± 0.94 | 2.02 ± 0.76 ab | 21.40 ± 4.56 a | 1.51 ± 0.06 | 0.19 ± 0.05 | 1.67 ± 0.11 | 5.12 ± 4.69 | |||||||
| Levantinka × 30 | 0.39 ± 0.07 | 5.97 ± 0.30 | 2.30 ± 0.14 ab | 23.91 ± 0.41 a | 1.50 ± 0.07 | 0.13 ± 0.00 | 1.53 ± 0.07 | 1.86 ± 0.42 | |||||||
| Levantinka × 35 | 0.23 ± 0.09 | 4.92 ± 1.10 | 1.28 ± 0.70 bc | 20.59 ± 2.54 a | 1.60 ± 0.06 | 0.30 ± 0.10 | 1.53 ± 0.02 | 2.00 ± 1.20 | |||||||
| Levantinka × 40 | 0.31 ± 0.05 | 6.11 ± 0.79 | 2.10 ± 0.05 ab | 19.94 ± 1.26 a | 1.31 ± 0.09 | 0.12 ± 0.01 | 1.40 ± 0.07 | 2.41 ± 0.27 | |||||||
| Oblica × Control | 0.38 ± 0.05 | 8.07 ± 1.64 | 3.41 ± 0.67 a | 7.77 ± 1.28 bcd | 1.42 ± 0.18 | 0.14 ± 0.03 | 1.30 ± 0.05 | 2.32 ± 0.63 | |||||||
| Oblica × 15 | 0.34 ± 0.03 | 12.45 ± 0.98 | 3.25 ± 0.07 a | 9.98 ± 0.20 bc | 1.59 ± 0.05 | 0.12 ± 0.00 | 1.44 ± 0.02 | 1.30 ± 0.08 | |||||||
| Oblica × 20 | 0.32 ± 0.05 | 9.19 ± 2.22 | 2.37 ± 0.67 ab | 7.42 ± 0.41 bcd | 1.62 ± 0.08 | 0.35 ± 0.28 | 2.80 ± 1.61 | 1.64 ± 0.35 | |||||||
| Oblica × 25 | 0.23 ± 0.08 | 7.00 ± 1.53 | 2.89 ± 0.20 a | 7.8 ± 1.14 bcd | 1.40 ± 0.03 | 0.12 ± 0.01 | 1.29 ± 0.04 | 4.41 ± 3.14 | |||||||
| Oblica × 30 | 0.34 ± 0.03 | 6.52 ± 0.84 | 2.31 ± 0.11 ab | 7.00 ± 0.10 bcd | 1.48 ± 0.09 | 0.13 ± 0.00 | 1.30 ± 0.02 | 1.57 ± 0.16 | |||||||
| Oblica × 35 | 0.32 ± 0.02 | 8.08 ± 0.38 | 2.44 ± 0.06 ab | 7.10 ± 0.20 bcd | 1.42 ± 0.02 | 0.15 ± 0.00 | 1.40 ± 0.01 | 1.32 ± 0.27 | |||||||
| Oblica × 40 | 0.38 ± 0.02 | 6.87 ± 0.41 | 2.22 ± 0.17 ab | 6.53 ± 0.51 bcd | 1.31 ± 0.06 | 0.14 ± 0.01 | 1.27 ± 0.07 | 1.04 ± 0.09 | |||||||
| Source of variation |
VOC from LOX path (mg/kg) |
||||||||||||||
| 2-hexen-1-ol | 1-hexanol | 1-pente-3-one | hexyl acetate | 3-hexenyl acetate | 2-hexenyl acetate | Σ LOX | |||||||||
| A | B | A | B | A | A | ||||||||||
| Variety* | p ≤ 0.05 | p ≤ 0.001 | p ≤ 0.05 | p ≤ 0.001 | p ≤ 0.001 | p ≤ 0.05 | p ≤ 0.001 | ||||||||
| Istarska Bjelica | 0.08 ± 0.01 a | 0.49 ± 0.13 a | 4.64 ± 0.29 a | 1.62 ± 0.06 a | 4.30 ± 0.26 a | 0.05 ± 0.01 a | 24.87 ± 0.66 c | ||||||||
| Levantinka | 0.86 ± 0.51 a | 0.15 ± 0.05 b | 4.07 ± 0.19 a | 0.10 ± 0.01 b | 0.45 ± 0.17 b | 0.02 ± 0.03 ab | 41.44 ± 0.94 a | ||||||||
| Oblica | 0.05 ± 0.06 a | 0.08 ± 0.08 b | 4.62 ± 0.14 a | nd c | nd c | nd b | 28.86 ± 0.78 b | ||||||||
| Temperature (°C)** | p ≤ 0.01 | p = 0.162 | p ≤ 0.05 | p ≤ 0.05 | p ≤ 0.05 | p ≤ 0.05 | p ≤ 0.001 | ||||||||
| Control | 0.05 ± 0.01 a | 0.17 ± 0.01 | 5.08 ± 0.12 a | 0.69 ± 0.03 a | 1.84 ± 0.43 a | 0.09 ± 0.06 a | 33.61 ± 1.62 a | ||||||||
| 15 | 0.04 ± 0.01 a | 0.15 ± 0.01 | 3.84 ± 0.53 a | 0.56 ± 0.04 ab | 1.94 ± 0.28 a | 0.02 ± 0.01 ab | 34.39 ± 0.85 a | ||||||||
| 20 | 0.04 ± 0.01 a | 0.13 ± 0.03 | 4.24 ± 0.27 a | 0.53 ± 0.11 ab | 1.34 ± 0.30 a | nd b | 29.16 ± 2.20 b | ||||||||
| 25 | 0.14 ± 0.14 a | 0.53 ± 0.34 | 4.07 ± 0.52 a | 0.59 ± 0.01 ab | 1.22 ± 0.04 a | nd b | 34.16 ± 1.21 a | ||||||||
| 30 | 0.06 ± 0.01 a | 0.19 ± 0.01 | 4.82 ± 0.10 a | 0.62 ± 0.01 ab | 2.09 ± 0.29 a | 0.03 ± 0.00 ab | 31.77 ± 0.43 ab | ||||||||
| 35 | 1.93 ± 1.20 a | 0.33 ± 0.12 | 4.50 ± 0.27 a | 0.54 ± 0.05 ab | 1.44 ± 0.24 a | 0.02 ± 0.01 ab | 30.52 ± 0.49 ab | ||||||||
| 40 | 0.06 ± 0.00 a | 0.18 ± 0.02 | 4.56 ± 0.17 a | 0.50 ± 0.03 b | 1.22 ± 0.12 a | 0.01 ± 0.00 b | 28.46 ± 0.63 b | ||||||||
| Variety × Temperature (°C) | p ≤ 0.001 | p = 0.429 | p ≤ 0.05 | p ≤ 0.01 | p = 0.097 | p = 0.417 | p ≤ 0.01 | ||||||||
| Istarska Bjelica × Control | 0.10 ± 0.00 b | 0.48 ± 0.02 | 5.78 ± 0.24 a | 1.99 ± 0.09 a | 5.29 ± 1.27 | 0.13 ± 0.01 | 28.99 ± 1.55 c-g | ||||||||
| Istarska Bjelica × 15 | 0.08 ± 0.01 b | 0.35 ± 0.02 | 2.60 ± 1.57 b | 1.57 ± 0.10 bc | 4.90 ± 0.22 | 0.05 ± 0.04 | 24.05 ± 1.90 efg | ||||||||
| Istarska Bjelica × 20 | 0.08 ± 0.02 b | 0.31 ± 0.06 | 4.39 ± 0.66 ab | 1.45 ± 0.32 bc | 3.71 ± 0.90 | 0.01 ± 0.01 | 19.70 ± 3.44 g | ||||||||
| Istarska Bjelica × 25 | 0.05 ± 0.04 b | 1.11 ± 0.88 | 5.13 ± 0.95 a | 1.66 ± 0.01 abc | 3.34 ± 0.09 | nd | 30.96 ± 0.99 b-e | ||||||||
| Istarska Bjelica × 30 | 0.11 ± 0.00 b | 0.46 ± 0.02 | 5.12 ± 0.17 a | 1.81 ± 0.04 ab | 5.44 ± 0.26 | 0.10 ± 0.01 | 26.66 ± 0.46 d-g | ||||||||
| Istarska Bjelica × 35 | 0.09 ± 0.00 b | 0.35 ± 0.02 | 4.80 ± 0.30 ab | 1.52 ± 0.15 bc | 4.06 ± 0.73 | 0.05 ± 0.02 | 21.50 ± 1.21 fg | ||||||||
| Istarska Bjelica × 40 | 0.09 ± 0.01 b | 0.38 ± 0.03 | 4.67 ± 0.27 ab | 1.37 ± 0.09 c | 3.34 ± 0.37 | 0.02 ± 0.01 | 22.21 ± 0.77 efg | ||||||||
| Levantinka × Control | 0.04 ± 0.02 b | 0.02 ± 0.02 | 4.54 ± 0.07 ab | 0.08 ± 0.01 d | 0.24 ± 0.05 | 0.14 ± 0.18 | 42.10 ± 0.17 a | ||||||||
| Levantinka × 15 | 0.03 ± 0.02 b | 0.09 ± 0.01 | 4.37 ± 0.13 ab | 0.10 ± 0.02 d | 0.94 ± 0.82 | nd | 44.10 ± 1.42 a | ||||||||
| Levantinka × 20 | 0.06 ± 0.04 b | 0.10 ± 0.06 | 3.83 ± 0.43 ab | 0.13 ± 0.01 d | 0.31 ± 0.04 | nd | 37.58 ± 5.35 abc | ||||||||
| Levantinka × 25 | 0.04 ± 0.03 b | 0.06 ± 0.04 | 3.63 ± 0.91 ab | 0.11 ± 0.03 d | 0.30 ± 0.06 | nd | 42.16 ± 3.01 a | ||||||||
| Levantinka × 30 | 0.07 ± 0.03 b | 0.07 ± 0.00 | 4.50 ± 0.20 ab | 0.06 ± 0.02 d | 0.83 ± 0.82 | nd | 43.11 ± 0.82 a | ||||||||
| Levantinka × 35 | 5.70 ± 3.59 a | 0.60 ± 0.36 | 3.44 ± 0.72 ab | 0.10 ± 0.01 d | 0.25 ± 0.05 | nd | 42.53 ± 0.75 a | ||||||||
| Levantinka × 40 | 0.10 ± 0.01 b | 0.11 ± 0.02 | 4.16 ± 0.35 ab | 0.12 ± 0.03 d | 0.32 ± 0.08 | nd | 38.51 ± 1.51 ab | ||||||||
| Oblica × Control | nd b | nd | 4.92 ± 0.28 ab | nd d | nd | nd | 29.73 ± 4.61 b-f | ||||||||
| Oblica × 15 | nd b | nd | 4.56 ± 0.13 ab | nd d | nd | nd | 35.01 ± 0.95 a-d | ||||||||
| Oblica × 20 | nd b | nd | 4.50 ± 0.17 ab | nd d | nd | nd | 30.21 ± 1.78 b-f | ||||||||
| Oblica × 25 | 0.34 ± 0.42 b | 0.43 ± 0.52 | 3.44 ± 0.86 ab | nd d | nd | nd | 29.36 ± 1.74 b-f | ||||||||
| Oblica × 30 | nd b | 0.05 ± 0.03 | 4.83 ± 0.12 ab | nd d | nd | nd | 25.53 ± 0.87 efg | ||||||||
| Oblica × 35 | nd b | 0.05 ± 0.03 | 5.25 ± 0.20 a | nd d | nd | nd | 27.53 ± 0.31 d-g | ||||||||
| Oblica × 40 | nd b | 0.05 ± 0.03 | 4.86 ± 0.24 ab | nd d | nd | nd | 24.66 ± 0.81 efg | ||||||||
Capital letters next to the compound name indicate the reliability of identification (RID): A-level — agreement of retention index (RI) and mass spectrum with those of an authentic compound; B-level — difference between experimental RI and literature RI < 20 and mass spectrum similarity match > 900; C-level — at least agreement of mass spectrum > 800; nd – not detected; values with different letters in each column subsection are statistically different (p ≤ 0.05) according to Tukey’s multiple comparison tests; * results represent LS mean ± standard error of the control and all applied temperatures for each variety; ** results represent LS mean ± standard error of all four varieties for the control and for the samples pretreated at the indicated temperature.
Table 3.
Composition of volatile compounds (Part II – compounds resulting from oxidation (OX) and Part III - compounds resulting from microbiological activities (MBA)) of controls and oils produced with flash thermal treatment (FTT) as an effect of variety and pretreatment temperature.
Table 3.
Composition of volatile compounds (Part II – compounds resulting from oxidation (OX) and Part III - compounds resulting from microbiological activities (MBA)) of controls and oils produced with flash thermal treatment (FTT) as an effect of variety and pretreatment temperature.
| Source of variation |
VOC from OX (mg/kg) |
VOC from MBA (mg/kg) |
|||||
| pentanal | 2,4-hexadienal | nonanal | Σ OX | 2-methylbutanal | 3-methylbutanal | Σ MBA | |
| A | A | B | C | B | |||
| Variety | p ≤ 0.05 | p ≤ 0.001 | p ≤ 0.01 | p ≤ 0.001 | p ≤ 0.001 | p ≤ 0.001 | p ≤ 0.001 |
| Istarska Bjelica | 0.75 ± 0.11 a | 0.59 ± 0.04 c | 0.16 ± 0.01 ab | 1.50 ± 0.11 c | 0.12 ± 0.00 a | 0.07 ± 0.01 a | 0.19 ± 0.01 a |
| Levantinka | 0.60 ± 0.12 ab | 2.39 ± 0.21 b | 0.18 ± 0.01 a | 3.16 ± 0.14 b | 0.04 ± 0.01 b | 0.03 ± 0.01 b | 0.08 ± 0.01 b |
| Oblica | 0.41 ± 0.06 b | 4.23 ± 0.16 a | 0.15 ± 0.01 b | 4.79 ± 0.14 a | 0.04 ± 0.01 b | 0.03 ± 0.00 b | 0.07 ± 0.01 b |
| Temperature (°C) | p ≤ 0.01 | p ≤ 0.01 | p ≤ 0.01 | p ≤ 0.01 | p ≤ 0.001 | p ≤ 0.001 | p ≤ 0.001 |
| Control | 0.48 ± 0.09 b | 2.98 ± 0.24 a | 0.15 ± 0.01 ab | 3.60 ± 0.26 a | 0.06 ± 0.01 b | 0.04 ± 0.01 b | 0.09 ± 0.01 b |
| 15 | 0.29 ± 0.02 b | 2.84 ± 0.14 ab | 0.15 ± 0.01 ab | 3.28 ± 0.14 a | 0.04 ± 0.01 b | 0.02 ± 0.01 b | 0.06 ± 0.02 b |
| 20 | 0.58 ± 0.19 ab | 2.43 ± 0.30 abc | 0.18 ± 0.01 a | 3.19 ± 0.16 a | 0.06 ± 0.01 b | 0.04 ± 0.01 b | 0.10 ± 0.02 b |
| 25 | 1.08 ± 0.32 a | 2.33 ± 0.30 abc | 0.13 ± 0.01 b | 3.54 ± 0.31 a | 0.14 ± 0.01 a | 0.09 ± 0.01 a | 0.23 ± 0.02 a |
| 30 | 0.47 ± 0.03 b | 2.27 ± 0.12 abc | 0.18 ± 0.01 a | 2.92 ± 0.13 a | 0.05 ± 0.01 b | 0.04 ± 0.01 b | 0.09 ± 0.01 b |
| 35 | 0.78 ± 0.14 ab | 1.85 ± 0.31 c | 0.17 ± 0.01 ab | 2.80 ± 0.20 a | 0.05 ± 0.01 b | 0.03 ± 0.01 b | 0.08 ± 0.01 b |
| 40 | 0.45 ± 0.05 b | 2.11 ± 0.11 bc | 0.18 ± 0.01 a | 2.73 ± 0.11 a | 0.06 ± 0.01 b | 0.04 ± 0.01 b | 0.10 ± 0.01 b |
| Variety × temperature (°C) | p = 0.070 | p ≤ 0.01 | p ≤ 0.05 | p ≤ 0.001 | p ≤ 0.001 | p ≤ 0.001 | p ≤ 0.001 |
| Istarska Bjelica × Control | 0.69 ± 0.17 | 0.75 ± 0.04 fghi | 0.15 ± 0.01 abc | 1.58 ± 0.14 fghi | 0.08 ± 0.01 bcdef | 0.04 ± 0.03 bcd | 0.12 ± 0.03 bcde |
| Istarska Bjelica × 15 | 0.36 ± 0.01 | 0.65 ± 0.03 ghi | 0.13 ± 0.01 abc | 1.14 ± 0.03 i | 0.05 ± 0.00 defghi | 0.01 ± 0.01 cd | 0.06 ± 0.01 ef |
| Istarska Bjelica × 20 | 0.54 ± 0.03 | 0.49 ± 0.14 i | 0.17 ± 0.03 abc | 1.20 ± 0.19 hi | 0.08 ± 0.01 bcdef | 0.04 ± 0.01 bcd | 0.12 ± 0.02 bcde |
| Istarska Bjelica × 25 | 1.92 ± 0.73 | 0.64 ± 0.09 ghi | 0.11 ± 0.01 c | 2.67 ± 0.64 efgh | 0.28 ± 0.01 a | 0.16 ± 0.01 a | 0.44 ± 0.01 a |
| Istarska Bjelica × 30 | 0.58 ± 0.07 | 0.55 ± 0.07 hi | 0.20 ± 0.03 ab | 1.34 ± 0.16 ghi | 0.11 ± 0.01 bcd | 0.07 ± 0.00 b | 0.18 ± 0.01 bcd |
| Istarska Bjelica × 35 | 0.70 ± 0.06 | 0.51 ± 0.15 i | 0.16 ± 0.01 abc | 1.37 ± 0.20 ghi | 0.11 ± 0.01 bcde | 0.07 ± 0.01 b | 0.17 ± 0.02 bcd |
| Istarska Bjelica × 40 | 0.49 ± 0.16 | 0.55 ± 0.10 hi | 0.19 ± 0.02 abc | 1.23 ± 0.15 hi | 0.13 ± 0.01 b | 0.08 ± 0.01 b | 0.21 ± 0.02 b |
| Levantinka × Control | 0.50 ± 0.21 | 2.84 ± 0.29 cde | 0.15 ± 0.01 abc | 3.49 ± 0.46 cde | 0.06 ± 0.00 cdefgh | 0.06 ± 0.01 b | 0.12 ± 0.01 bcde |
| Levantinka × 15 | 0.34 ± 0.04 | 2.41 ± 0.30 def | 0.19 ± 0.01 abc | 2.94 ± 0.33 def | 0.01 ± 0.01 hi | nd d | 0.01 ± 0.01 f |
| Levantinka × 20 | 0.79 ± 0.55 | 2.27 ± 0.86 defgh | 0.19 ± 0.01 abc | 3.25 ± 0.31 cde | 0.02 ± 0.02 ghi | 0.03 ± 0.02 bcd | 0.05 ± 0.03 ef |
| Levantinka × 25 | 0.70 ± 0.47 | 2.38 ± 0.60 defg | 0.13 ± 0.01 abc | 3.21 ± 0.41 de | 0.04 ± 0.03 fghi | 0.03 ± 0.02 bcd | 0.07 ± 0.04 def |
| Levantinka × 30 | 0.35 ± 0.05 | 2.62 ± 0.14 de | 0.18 ± 0.01 abc | 3.15 ± 0.10 de | 0.06 ± 0.02 defghi | 0.04 ± 0.02 bcd | 0.09 ± 0.04 cdef |
| Levantinka × 35 | 1.13 ± 0.42 | 1.45 ± 0.87 efghi | 0.20 ± 0.02 ab | 2.78 ± 0.51 defg | 0.05 ± 0.02 efghi | 0.03 ± 0.02 bcd | 0.08 ± 0.04 def |
| Levantinka × 40 | 0.39 ± 0.02 | 2.74 ± 0.25 de | 0.22 ± 0.03 a | 3.34 ± 0.25 cde | 0.06 ± 0.01 defgh | 0.05 ± 0.01 bc | 0.11 ± 0.03 bcdef |
| Oblica × Control | 0.24 ± 0.08 | 5.34 ± 0.65 ab | 0.15 ± 0.04 abc | 5.73 ± 0.60 a | 0.03 ± 0.02 fghi | 0.01 ± 0.01 cd | 0.04 ± 0.02 ef |
| Oblica × 15 | 0.17 ± 0.03 | 5.47 ± 0.28 a | 0.13 ± 0.04 abc | 5.76 ± 0.28 a | 0.07 ± 0.02 bcdefg | 0.04 ± 0.02 bcd | 0.11 ± 0.05 bcdef |
| Oblica × 20 | 0.4 ± 0.09 | 4.53 ± 0.22 abc | 0.19 ± 0.01 abc | 5.12 ± 0.31 ab | 0.07 ± 0.00 bcdefg | 0.05 ± 0.02 bcd | 0.12 ± 0.02 bcde |
| Oblica × 25 | 0.62 ± 0.43 | 3.96 ± 0.65 abcd | 0.15 ± 0.02 abc | 4.73 ± 0.53 abc | 0.12 ± 0.01 bc | 0.08 ± 0.01 b | 0.20 ± 0.02 bc |
| Oblica × 30 | 0.48 ± 0.00 | 3.65 ± 0.34 bcd | 0.15 ± 0.02 abc | 4.27 ± 0.35 abcd | nd i | nd d | nd f |
| Oblica × 35 | 0.50 ± 0.03 | 3.61 ± 0.26 bcd | 0.15 ± 0.00 abc | 4.26 ± 0.26 abcd | nd i | nd d | nd f |
| Oblica × 40 | 0.47 ± 0.03 | 3.04 ± 0.18 cde | 0.12 ± 0.00 bc | 3.63 ± 0.17 bcde | nd i | nd d | nd f |
Capital letters next to the compound name indicate the reliability of identification (RID): A-level — agreement of retention index (RI) and mass spectrum with those of an authentic compound; B-level — difference between experimental RI and literature RI < 20 and mass spectrum similarity match > 900; C-level — at least agreement of mass spectrum > 800; nd – not detected; values with different letters in each column subsection are statistically different (p ≤ 0.05) according to Tukey’s multiple comparison tests; * results represent LS mean ± standard error of the control and all applied temperatures for each variety; ** results represent LS mean ± standard error of all four varieties for the control and for the samples pretreated at the indicated temperature.
Table 4.
Composition of phenolic compounds (expressed as tyrosol) of controls and oils produced with flash thermal treatment as an effect of variety and pretreatment temperature.
Table 4.
Composition of phenolic compounds (expressed as tyrosol) of controls and oils produced with flash thermal treatment as an effect of variety and pretreatment temperature.
| Source of variation | Phenolic compound (mg/kg) |
||||||||
| Hydroxytyrosol | Tyrosol | Oleacein | Oleocantal | Methyl hemiacetal of oleocanthal | Σ of oleorupein aglycons | Σ of ligstroside aglycons | p - Coumaric acid | Total phenolic content | |
| Variety | p ≤ 0.001 | p ≤ 0.001 | p ≤ 0.001 | p ≤ 0.001 | p ≤ 0.001 | p ≤ 0.001 | p ≤ 0.001 | p ≤ 0.001 | p ≤ 0.001 |
| Istarska Bjelica | 39 ± 1 a | 18 ± 1 a | 71 ± 3 b | 108 ± 2 a | 25 ± 1 a | 351 ± 6 a | 164 ± 2 a | 9 ± 0 b | 785 ± 8 a |
| Levantinka | 18 ± 3 b | 9 ± 2 b | 69 ± 6 b | 81 ± 3 b | 17 ± 2 b | 68 ± 3 c | 57 ± 2 c | 5 ± 0 c | 322 ± 8 c |
| Oblica | 17 ± 1 b | 9 ± 0 b | 88 ± 3 a | 83 ± 2 b | 18 ± 1 b | 117 ± 7 b | 80 ± 3 b | 10 ± 0 a | 422 ± 8 b |
| Temperature (°C) | p = 0.548 | p = 0.542 | p ≤ 0.001 | p ≤ 0.001 | p = 0.349 | p = 0.442 | p ≤ 0.001 | p ≤ 0.01 | p ≤ 0.05 |
| Control | 25 ± 1 | 11 ± 0 | 72 ± 4 bc | 84 ± 2 c | 22 ± 1 | 179 ± 11 | 110 ± 5 ab | 8 ± 0 ab | 510 ± 13 ab |
| 15 | 25 ± 1 | 11 ± 1 | 62 ± 4 c | 83 ± 2 c | 18 ± 2 | 184 ± 6 | 106 ± 3 abc | 8 ± 0 a | 498 ± 13 ab |
| 20 | 28 ± 4 | 14 ± 2 | 60 ± 6 c | 82 ± 3 c | 22 ± 2 | 186 ± 5 | 113 ± 2 a | 8 ± 0 ab | 513 ± 13 ab |
| 25 | 25 ± 3 | 13 ± 3 | 65 ± 9 bc | 85 ± 5 bc | 21 ± 3 | 169 ± 7 | 91 ± 4 cd | 8 ± 0 ab | 477 ± 13 b |
| 30 | 20 ± 1 | 10 ± 0 | 91 ± 5 ab | 98 ± 3 b | 19 ± 1 | 172 ± 7 | 96 ± 3 bcd | 7 ± 0 b | 513 ± 13 ab |
| 35 | 26 ± 6 | 13 ± 3 | 77 ± 10 abc | 93 ± 5 bc | 21 ± 4 | 172 ± 6 | 98 ± 2 bcd | 8 ± 0 b | 507 ± 13 ab |
| 40 | 26 ± 3 | 12 ± 1 | 104 ± 4 a | 111 ± 3 a | 17 ± 1 | 186 ± 15 | 87 ± 5 d | 8 ± 0 ab | 552 ± 13 a |
| Variety × Temperature (°C) | p = 0.425 | p = 0.587 | p ≤ 0.001 | p ≤ 0.001 | p = 0.255 | p = 0.135 | p ≤ 0.001 | p ≤ 0.001 | p = 0.543 |
| Istarska Bjelica × Control | 36 ± 3 | 16 ± 1 | 77 ± 9 bcd | 106 ± 5 abcde | 32 ± 3 | 330 ± 30 | 169 ± 11 a | 7 ± 0 d | 773 ± 22 |
| Istarska Bjelica × 15 | 39 ± 1 | 18 ± 1 | 70 ± 3 bcd | 107 ± 2 abcde | 24 ± 1 | 368 ± 12 | 163 ± 2 a | 8 ± 0 cd | 798 ± 22 |
| Istarska Bjelica × 20 | 41 ± 2 | 20 ± 1 | 57 ± 1 d | 102 ± 2 bcdef | 21 ± 0 | 360 ± 11 | 168 ± 5 a | 9 ± 1 cd | 778 ± 22 |
| Istarska Bjelica × 25 | 42 ± 4 | 21 ± 5 | 67 ± 17 bcd | 112 ± 8 ab | 29 ± 5 | 327 ± 14 | 156 ± 1 a | 10 ± 0 bc | 765 ± 22 |
| Istarska Bjelica × 30 | 38 ± 1 | 18 ± 1 | 79 ± 10 bcd | 111 ± 5 abc | 23 ± 2 | 344 ± 18 | 157 ± 5 a | 8 ± 0 cd | 775 ± 22 |
| Istarska Bjelica × 35 | 40 ± 2 | 19 ± 1 | 71 ± 3 bcd | 108 ± 1 abcd | 24 ± 0 | 360 ± 16 | 167 ± 4 a | 9 ± 1 cd | 798 ± 22 |
| Istarska Bjelica × 40 | 40 ± 1 | 18 ± 1 | 76 ± 1 bcd | 111 ± 1 ab | 24 ± 0 | 366 ± 6 | 165 ± 2 a | 9 ± 0 cd | 809 ± 22 |
| Levantinka × Control | 15 ± 1 | 5 ± 0 | 83 ± 5 bcd | 83 ± 3 defghi | 15 ± 1 | 69 ± 4 | 54 ± 3 def | 5 ± 0 e | 328 ± 22 |
| Levantinka × 15 | 16 ± 1 | 9 ± 3 | 60 ± 7 cd | 79 ± 2 fghi | 11 ± 7 | 62 ± 8 | 57 ± 8 def | 5 ± 0 e | 299 ± 22 |
| Levantinka × 20 | 24 ± 10 | 12 ± 7 | 60 ± 19 cd | 82 ± 9 efghi | 23 ± 6 | 83 ± 8 | 69 ± 2 d | 5 ± 1 e | 356 ± 22 |
| Levantinka × 25 | 16 ± 9 | 10 ± 7 | 63 ± 19 cd | 72 ± 12 ghi | 17 ± 8 | 52 ± 4 | 38 ± 9 ef | 4 ± 0 e | 273 ± 22 |
| Levantinka × 30 | 14 ± 1 | 5 ± 0 | 81 ± 3 bcd | 85 ± 1 cdefghi | 15 ± 1 | 70 ± 9 | 58 ± 2 def | 4 ± 0 e | 333 ± 22 |
| Levantinka × 35 | 27 ± 18 | 14 ± 10 | 54 ± 26 d | 74 ± 12 ghi | 22 ± 11 | 67 ± 7 | 57 ± 3 def | 4 ± 0 e | 318 ± 22 |
| Levantinka × 40 | 17 ± 1 | 7 ± 1 | 82 ± 7 bcd | 91 ± 1 bcdefgh | 13 ± 2 | 73 ± 5 | 63 ± 6 de | 5 ± 0 e | 351 ± 22 |
| Oblica × Control | 23 ± 1 | 12 ± 1 | 56 ± 9 d | 61 ± 4 i | 21 ± 3 | 138 ± 15 | 106 ± 7 b | 12 ± 0 a | 429 ± 22 |
| Oblica × 15 | 19 ± 1 | 8 ± 1 | 57 ± 8 d | 63 ± 4 i | 20 ± 1 | 123 ± 7 | 96 ± 2 bc | 12 ± 0 ab | 397 ± 22 |
| Oblica × 20 | 21 ± 1 | 9 ± 0 | 62 ± 2 cd | 62 ± 2 i | 22 ± 1 | 115 ± 3 | 103 ± 1 b | 10 ± 1 c | 405 ± 22 |
| Oblica × 25 | 17 ± 1 | 8 ± 1 | 65 ± 2 cd | 70 ± 0 hi | 17 ± 2 | 129 ± 13 | 80 ± 5 bcd | 10 ± 1 bc | 395 ± 22 |
| Oblica × 30 | 10 ± 3 | 6 ± 0 | 114 ± 10 ab | 97 ± 7 bcdefg | 18 ± 1 | 103 ± 3 | 74 ± 7 cd | 9 ± 0 cd | 430 ± 22 |
| Oblica × 35 | 10 ± 4 | 7 ± 0 | 106 ± 13 abc | 96 ± 9 bcdefgh | 16 ± 1 | 90 ± 5 | 71 ± 4 cd | 10 ± 0 bc | 405 ± 22 |
| Oblica × 40 | 21 ± 8 | 10 ± 2 | 154 ± 10 a | 132 ± 8 a | 14 ± 4 | 119 ± 45 | 33 ± 14 f | 9 ± 1 cd | 496 ± 22 |
Values with different letters in each column subsection are statistically different (p ≤ 0.05) according to Tukey’s multiple comparison tests; * Results represent LS mean ± standard error of control and all temperatures applied for each variety; ** Results represent LS mean ± standard error of all four varieties for control and for the samples pretreated at the indicated temperature.
Table 5.
Tocopherol content expressed as α-tocopherol of controls and oils produced with flash thermal treatment as an effect of variety and pretreatment temperature.
Table 5.
Tocopherol content expressed as α-tocopherol of controls and oils produced with flash thermal treatment as an effect of variety and pretreatment temperature.
| Source of variation | Tocopherols (mg/kg) |
|
| α-tocopherol | γ-tocopherol | |
| Variety* | p ≤ 0.001 | p ≤ 0.001 |
| Istarska Bjelica | 79 ± 1 c | nd c |
| Levantinka | 249 ± 2 a | 11 ± 0 a |
| Oblica | 222 ± 4 b | 8 ± 0 b |
| Temperature (°C) ** | p ≤ 0.001 | p ≤ 0.001 |
| Control | 198 ± 2 a | 7 ± 0 a |
| 15 | 201 ± 2 a | 7 ± 0 ab |
| 20 | 176 ± 9 bcd | 6 ± 0 bc |
| 25 | 188 ± 2 ab | 6 ± 0 b |
| 30 | 182 ± 2 bc | 6 ± 0 bc |
| 35 | 173 ± 2 cd | 6 ± 0 c |
| 40 | 167 ± 2 d | 6 ± 0 c |
| Variety × Temperature (°C) | p ≤ 0.001 | p ≤ 0.001 |
| Istarska Bjelica × Control | 75 ± 3 h | nd f |
| Istarska Bjelica × 15 | 73 ± 4 h | nd f |
| Istarska Bjelica × 20 | 83 ± 0 h | nd f |
| Istarska Bjelica × 25 | 78 ± 2 h | nd f |
| Istarska Bjelica × 30 | 76 ± 4 h | nd f |
| Istarska Bjelica × 35 | 85 ± 3 h | nd f |
| Istarska Bjelica × 40 | 82 ± 2 h | nd f |
| Levantinka × Control | 273 ± 5 ab | 12 ± 1 a |
| Levantinka × 15 | 237 ± 2 cdef | 11 ± 1 a |
| Levantinka × 20 | 232 ± 9 def | 11 ± 0 a |
| Levantinka × 25 | 264 ± 6 abc | 11 ± 0 ab |
| Levantinka × 30 | 258 ± 6 bcd | 11 ± 0 a |
| Levantinka × 35 | 248 ± 5 bcde | 11 ± 0 a |
| Levantinka × 40 | 232 ± 4 def | 11 ± 0 a |
| Oblica × Control | 244 ± 5 bcde | 11 ± 0 a |
| Oblica × 15 | 292 ± 2 a | 9 ± 0 bc |
| Oblica × 20 | 213 ± 25 fg | 7 ± 1 de |
| Oblica × 25 | 221 ± 2 ef | 8 ± 0 cd |
| Oblica × 30 | 211 ± 0 fg | 7 ± 0 de |
| Oblica × 35 | 185 ± 1 g | 6 ± 0 e |
| Oblica × 40 | 187 ± 1 g | 6 ± 0 e |
nd – not detected; values with different letters in each column subsection are statistically different (p ≤ 0.05) according to Tukey’s multiple comparison tests; * Results represent LS mean ± standard error of control and all temperatures applied for each variety; ** Results represent LS mean ± standard error of all four varieties for control and for the samples pretreated at the indicated temperature.
Table 6.
Fatty acid composition of controls and oils produced with flash thermal treatment (FTT) as an effect of variety and pretreatment temperature.
Table 6.
Fatty acid composition of controls and oils produced with flash thermal treatment (FTT) as an effect of variety and pretreatment temperature.
| Source of variation | Fatty acid (% of total) |
|||||||||
| C16:0 | C16:1 | C18:0 | C18:1 | C18:2 | C18:3 | C20:0 | Σ SFA | Σ MUFA | Σ PUFA | |
| Variety* | p ≤ 0.001 | p ≤ 0.001 | p ≤ 0.001 | p ≤ 0.001 | p ≤ 0.001 | *** | p ≤ 0.001 | p ≤ 0.001 | p ≤ 0.001 | p ≤ 0.001 |
| Istarska Bjelica | 13.0 ± 0.0 b | 1.2 ± 0.0 a | 3.4 ± 0.0 a | 73.2 ± 0.1 b | 6.0 ± 0.0 b | 0.4 ± 0.0 | 0.5 ± 0.0 ab | 16.9 ± 0.0 a | 74.5 ± 0.1 b | 6.4 ± 0.0 b |
| Levantinka | 11.6 ± 0.0 c | 0.6 ± 0.0 c | 3.0 ± 0.0 b | 76.3 ± 0.1 a | 5.5 ± 0.0 c | 0.6 ± 0.0 | 0.5 ± 0.0 a | 15.1 ± 0.0 c | 77.2 ± 0.1 a | 6.1 ± 0.0 c |
| Oblica | 13.4 ± 0.0 a | 0.7 ± 0.0 b | 2.4 ± 0.1 c | 69.2 ± 0.1 c | 11.4 ± 0.0 a | 0.6 ± 0.0 | 0.5 ± 0.0 b | 16.3 ± 0.1 b | 70.2 ± 0.1 c | 12.1 ± 0.1 a |
| Temperature (°C)** | p ≤ 0.001 | p ≤ 0.001 | p = 0.414 | p ≤ 0.001 | p = 0.067 | *** | p ≤ 0.001 | p = 0.006 | p ≤ 0.001 | p = 0.052 |
| Control | 12.7 ± 0.1 ab | 0.8 ± 0.0 c | 2.9 ± 0.0 | 72.8 ± 0.1 ab | 7.5 ± 0.0 | 0.5 ± 0.0 | 0.5 ± 0.0 ab | 16.1 ± 0.0 ab | 73.8 ± 0.1 bc | 8.1 ± 0.0 |
| 15 | 12.8 ± 0.0 a | 0.8 ± 0.0 b | 2.9 ± 0.0 | 72.8 ± 0.1 ab | 7.6 ± 0.0 | 0.6 ± 0.0 | 0.5 ± 0.0 a | 16.2 ± 0.02 a | 74.0 ± 0.1 bc | 8.2 ± 0.0 |
| 20 | 12.7 ± 0.0 ab | 0.8 ± 0.0 a | 3.0 ± 0.0 | 72.9 ± 0.1 ab | 7.6 ± 0.1 | 0.6 ± 0.0 | 0.5 ± 0.0 a | 16.2 ± 0.0 a | 74.0 ± 0.1 abc | 8.2 ± 0.1 |
| 25 | 12.8 ± 0.0 a | 0.9 ± 0.0 a | 3.0 ± 0.0 | 72.6 ± 0.1 b | 7.6 ± 0.0 | 0.6 ± 0.0 | 0.5 ± 0.0 a | 16.3 ± 0.0 a | 73.7 ± 0.1 c | 8.2 ± 0.0 |
| 30 | 12.5 ± 0.0 b | 0.8 ± 0.0 b | 2.7 ± 0.3 | 73.2 ± 0.1 a | 7.6 ± 0.0 | 0.5 ± 0.0 | 0.5 ± 0.0 a | 15.8 ± 0.3 b | 74.3 ± 0.1 a | 8.1 ± 0.1 |
| 35 | 12.6 ± 0.1 b | 0.8 ± 0.0 bc | 2.9 ± 0.0 | 73.0 ± 0.1 a | 7.7 ± 0.0 | 0.5 ± 0.0 | 0.5 ± 0.0 ab | 16.0 ± 0.0 ab | 74.1 ± 0.1 ab | 8.2 ± 0.0 |
| 40 | 12.6 ± 0.0 b | 0.8 ± 0.0 b | 2.9 ± 0.0 | 72.9 ± 0.1 ab | 7.7 ± 0.0 | 0.5 ± 0.0 | 0.5 ± 0.0 b | 16.0 ± 0.0 ab | 74.0 ± 0.1abc | 8.3 ± 0.0 |
| Variety × Temperature (°C) | p ≤ 0.001 | p ≤ 0.001 | p = 0.254 | p ≤ 0.001 | p = 0.035 | *** | p ≤ 0.001 | p ≤ 0.001 | p ≤ 0.001 | p = 0.099 |
| Istarska Bjelica × Control | 13.1 ± 0.1 de | 1.2 ± 0.0 ab | 3.3 ± 0.0 | 72.4 ± 0.4 d | 5.9 ± 0.0 bc | 0.4 ± 0.0 | 0.4 ± 0.0 b | 16.8 ± 0.1 ab | 73.8 ± 0.4 d | 6.3 ± 0.0 |
| Istarska Bjelica × 15 | 12.9 ± 0.0 e | 1.1 ± 0.0 b | 3.4 ± 0.0 | 73.7 ± 0.0 b | 6.0 ± 0.0 b | 0.4 ± 0.0 | 0.5 ± 0.0 a | 16.8 ± 0.0 abc | 75.0 ± 0.0 b | 6.4 ± 0.0 |
| Istarska Bjelica × 20 | 13.1 ± 0.1 de | 1.2 ± 0.0 a | 3.4 ± 0.0 | 73.1 ± 0.2bcd | 5.9 ± 0.0 bc | 0.4 ± 0.0 | 0.5 ± 0.0 a | 17.0 ± 0.1 a | 74.5 ± 0.2 bc | 6.3 ± 0.0 |
| Istarska Bjelica × 25 | 13.1 ± 0.0 de | 1.2 ± 0.0 a | 3.4 ± 0.0 | 72.8 ± 0.2 cd | 6.0 ± 0.0 b | 0.4 ± 0.0 | 0.5 ± 0.0 a | 17.0 ± 0.0 a | 74.2 ± 0.2 cd | 6.4 ± 0.0 |
| Istarska Bjelica × 30 | 13.0 ± 0.0 e | 1.2 ± 0.0 a | 3.4 ± 0.0 | 73.5 ± 0.1 bc | 6.0 ± 0.0 b | 0.4 ± 0.0 | 0.5 ± 0.0 a | 16.9 ± 0.0 a | 74.9 ± 0.1 bc | 6.4 ± 0.0 |
| Istarska Bjelica × 35 | 13.1 ± 0.0 de | 1.2 ± 0.0 a | 3.4 ± 0.0 | 73.4 ± 0.1 bc | 6.0 ± 0.1 b | 0.4 ± 0.0 | 0.5 ± 0.0 a | 17.0 ± 0.0 a | 74.8 ± 0.1 bc | 6.4 ± 0.1 |
| Istarska Bjelica × 40 | 13.1 ± 0.0 de | 1.2 ± 0.0 a | 3.4 ± 0.0 | 73.2 ± 0.1 bc | 6.0 ± 0.0 bc | 0.4 ± 0.0 | 0.5 ± 0.0 a | 17.0 ± 0.0 a | 74.6 ± 0.1 bc | 6.4 ± 0.0 |
| Levantinka × Control | 11.4 ± 0.0 g | 0.5 ± 0.0 f | 3.0 ± 0.0 | 76.7 ± 0.0 a | 5.3 ± 0.0 d | 0.6 ± 0.0 | 0.5 ± 0.0 a | 14.9 ± 0.0 e | 77.5 ± 0.0 a | 5.9 ± 0.0 |
| Levantinka × 15 | 11.6 ± 0.0 fg | 0.6 ± 0.0 e | 3.0 ± 0.0 | 76.2 ± 0.2 a | 5.5 ± 0.1 d | 0.6 ± 0.0 | 0.5 ± 0.0 a | 15.0 ± 0.0 e | 77.1 ± 0.2 a | 6.1 ± 0.1 |
| Levantinka × 20 | 11.7 ± 0.1 f | 0.6 ± 0.0 d | 3.0 ± 0.0 | 76.0 ± 0.2 a | 5.6 ± 0.0 bcd | 0.6 ± 0.0 | 0.5 ± 0.0 a | 15.2 ± 0.0 de | 76.9 ± 0.2 a | 6.2 ± 0.0 |
| Levantinka × 25 | 11.5 ± 0.0 fg | 0.6 ± 0.0 e | 3.0 ± 0.0 | 76.3 ± 0.1 a | 5.4 ± 0.1 d | 0.6 ± 0.0 | 0.5 ± 0.0 a | 15.0 ± 0.0 e | 77.2 ± 0.1 a | 6.0 ± 0.1 |
| Levantinka × 30 | 11.6 ± 0.0 fg | 0.6 ± 0.0 ef | 3.0 ± 0.0 | 76.5 ± 0.3 a | 5.3 ± 0.1 d | 0.6 ± 0.0 | 0.5 ± 0.0 a | 15.1 ± 0.0 de | 77.3 ± 0.3 a | 5.9 ± 0.1 |
| Levantinka × 35 | 11.6 ± 0.1 fg | 0.5 ± 0.0 ef | 3.0 ± 0.0 | 76.5 ± 0.3 a | 5.5 ± 0.1 d | 0.6 ± 0.0 | 0.5 ± 0.0 a | 15.0 ± 0.1 e | 77.3 ± 0.3 a | 6.1 ± 0.1 |
| Levantinka × 40 | 11.7 ± 0.0 f | 0.6 ± 0.0 d | 3.0 ± 0.0 | 76.2 ± 0.1 a | 5.6 ± 0.1 cd | 0.6 ± 0.0 | 0.5 ± 0.0 a | 15.2 ± 0.0 de | 77.1 ± 0.1 a | 6.2 ± 0.1 |
| Oblica × Control | 13.5 ± 0.0 bc | 0.7 ± 0.0 d | 2.5 ± 0.0 | 69.2 ± 0.2 efg | 11.4 ± 0.1 a | 0.6 ± 0.0 | 0.5 ± 0.0 a | 16.5 ± 0.0 abc | 70.2 ± 0.2 ef | 12.0 ± 0.1 |
| Oblica × 15 | 13.9 ± 0.0 a | 0.8 ± 0.0 c | 2.4 ± 0.0 | 68.7 ± 0.2 g | 11.4 ± 0.1 a | 0.7 ± 0.0 | 0.5 ± 0.0 a | 16.8 ± 0.0 ab | 69.8 ± 0.2 f | 12.1 ± 0.1 |
| Oblica × 20 | 13.3 ± 0.1 cd | 0.7 ± 0.0 d | 2.7 ± 0.0 | 69.5 ± 0.3 ef | 11.3 ± 0.3 a | 0.7 ± 0.0 | 0.5 ± 0.0 a | 16.5 ± 0.4 abc | 70.5 ± 0.3 ef | 12.0 ± 0.3 |
| Oblica × 25 | 13.8 ± 0.0 ab | 0.8 ± 0.0 c | 2.5 ± 0.0 | 68.8 ± 0.0 fg | 11.5 ± 0.0 a | 0.7 ± 0.0 | 0.5 ± 0.0 a | 16.8 ± 0.0 ab | 69.87 ± 0.04 f | 12.2 ± 0.0 |
| Oblica × 30 | 13.1 ± 0.1 de | 0.7 ± 0.0 d | 1.7 ± 0.9 | 69.7 ± 0.1 e | 11.5 ± 0.1 a | 0.6 ± 0.0 | 0.5 ± 0.0 a | 15.3 ± 0.9 de | 70.7 ± 0.1 e | 12.1 ± 0.1 |
| Oblica × 35 | 13.1 ± 0.0 de | 0.7 ± 0.0 d | 2.4 ± 0.0 | 69.3 ± 0.0 efg | 11.5 ± 0.0 a | 0.6 ± 0.0 | 0.4 ± 0.0 b | 15.9 ± 0.0 bcd | 70.3 ± 0.0 ef | 12.1 ± 0.0 |
| Oblica × 40 | 13.1 ± 0.0 de | 0.7 ± 0.0 d | 2.4 ± 0.0 | 69.1 ± 0.1 efg | 11.6 ± 0.1 a | 0.6 ± 0.0 | 0.4 ± 0.0 b | 15.9 ± 0.0 cde | 70.1 ± 0.1 ef | 12.2 ± 0.1 |
Values with different letters in each column subsection are statistically different (p ≤ 0.05) according to Tukey’s multiple comparison tests; * Results represent LS mean ± standard error of control and all temperatures applied for each variety; ** Results represent LS mean ± standard error of all three varieties for control and for the samples pretreated at the indicated temperature; *** C18:3 showed no variance across groups; p-values for main effects and interaction were not computed and results for C18:3 are presented as mean ± standard deviation.3.5. Fatty acid composition.
Table 7.
Induction period (IP) and antioxidant capacity (AC) of controls and oils produced with flash thermal treatment (FTT) as an effect of variety and pretreatment temperature.
Table 7.
Induction period (IP) and antioxidant capacity (AC) of controls and oils produced with flash thermal treatment (FTT) as an effect of variety and pretreatment temperature.
| Source of variation | IP (min) |
AC (% DPPH red.) *** |
| Variety* | p ≤ 0.001 | p ≤ 0.001 |
| Istarska Bjelica | 202 ± 2 a | 60.06 ± 0.38 a |
| Levantinka | 157 ± 3 b | 49.86 ± 0.29 c |
| Oblica | 104 ± 1 c | 56.29 ± 0.38 b |
| Temperature (°C)** | p ≤ 0.05 | p ≤ 0.001 |
| Control | 160 ± 4 a | 58.65 ± 0.55 a |
| 15 | 158 ± 2 a | 55.5 ± 0.42 b |
| 20 | 157 ± 3 ab | 58.85 ± 0.81 a |
| 25 | 152 ± 4 ab | 53.37 ± 0.56 bc |
| 30 | 160 ± 6 a | 55.31 ± 0.53 b |
| 35 | 144 ± 2 b | 53.09 ± 0.48 c |
| 40 | 155 ± 2 ab | 53.04 ± 0.33 c |
| Variety × Temperature (°C) | p ≤ 0.001 | p ≤ 0.001 |
| Istarska Bjelica × Control | 189 ± 6 bcd | 60.07 ± 0.18 bc |
| Istarska Bjelica × 15 | 206 ± 5 ab | 58.77 ± 0.54 cd |
| Istarska Bjelica × 20 | 197 ± 4 abc | 61.58 ± 2.1 abc |
| Istarska Bjelica × 25 | 200 ± 6 ab | 59.87 ± 0.72 bc |
| Istarska Bjelica × 30 | 210 ± 4 ab | 60.73 ± 1.09 bc |
| Istarska Bjelica × 35 | 199 ± 5 ab | 59.88 ± 0.78 bc |
| Istarska Bjelica × 40 | 219 ± 3 a | 59.53 ± 0.41 bcd |
| Levantinka × Control | 168 ± 8 de | 50.18 ± 0.94 ghi |
| Levantinka × 15 | 149 ± 3 ef | 50.00 ± 0.32 ghi |
| Levantinka × 20 | 156 ± 7 e | 51.77 ± 0.85 fgh |
| Levantinka × 25 | 155 ± 6 e | 44.53 ± 0.27 j |
| Levantinka × 30 | 170 ± 19 cde | 51.12 ± 1.03 ghi |
| Levantinka × 35 | 145 ± 3 efg | 48.87 ± 1.08 hi |
| Levantinka × 40 | 157 ± 5 e | 52.53 ± 0.47 fgh |
| Oblica × Control | 122 ± 4 fgh | 65.70 ± 1.35 a |
| Oblica × 15 | 118 ± 4 ghi | 57.73 ± 1.1 cde |
| Oblica × 20 | 117 ± 1 hi | 63.20 ± 0.83 ab |
| Oblica × 25 | 103 ± 6 hij | 55.70 ± 1.5 def |
| Oblica × 30 | 94 ± 1 ij | 54.07 ± 0.5 efg |
| Oblica × 35 | 88 ± 0 j | 50.53 ± 0.57 ghi |
| Oblica × 40 | 88 ± 2 j | 47.07 ± 0.78 ij |
Values with different letters in each column subsection are statistically different (p ≤ 0.05) according to Tukey’s multiple comparison tests; * Results represent LS mean ± standard error of control and all temperatures applied for each variety; ** Results represent LS mean ± standard error of all four varieties for control and for the samples pretreated at the indicated temperature; ***percentage of DPPH˙radical reduction.
Table 8.
Summary of Response Surface Methodology (RSM) model analysis, including p-values for the model and lack of fit, coefficient of determination (R²), optimal temperature, overall desirability score, and predicted response values for induction period (IP), antioxidant capacity (AC) and volatiles from the lipoxygenase pathway (ΣLOX), oxidation (ΣOX) and microbial activity (ΣMBA).
| Variety | Parameters for optimization | ||||||
| IP min |
AC (% DPPH red.) |
ΣLOX mg/kg |
ΣOX mg/kg |
ΣMBA mg/kg |
|||
| Model * | y = a + b × T + c × T2 + d × T3 | ||||||
| Istarska bjelica* |
a | 237.017 | 54.088 | 5.761 | -1.755 | -0.593 | |
| b | -3.128 | 0.484 | 1.549 | 0.264 | 0.059 | ||
| c | 0.065 | -0.009 | 0.029 | -0.004 | -0.001 | ||
| p-Value | Model | 0.035 | 0.362 | 0.210 | 0.146 | 0.040 | |
| Lack of fit | 0.056 | 0.338 | 0.001 | 0.007 | <0.0001 | ||
| R2 | 0.361 | 0.127 | 0.189 | 0.227 | 0.350 | ||
| Optimal temperature | 18.9 | ||||||
| Desirability | 0.481 | ||||||
| Predicted values | 201 | 60.80 | 24.56 | 1.51 | 0.07 | ||
| Levantinka* | a | 119.932 | 62.511 | 39.282 | 3.009 | -0.133 | |
| b | 2.705 | -1.096 | 0.249 | 0.004 | 0.012 | ||
| c | -0.047 | 0.021 | -0.005 | -2.98E-05 | -1.54E-04 | ||
| p-Value | Model | 0.641 | 0.107 | 0.787 | 0.976 | 0.027 | |
| Lack of fit | 0.209 | ≤ 0.0001 | 0.138 | 0.458 | 0.924 | ||
| R2 | 0.058 | 0.258 | 0.031 | 0.003 | 0.383 | ||
| Optimal temperature | 15.4 | ||||||
| Desirability | 0.518 | ||||||
| Predicted values | 150 | 50.61 | 41.75 | 3.07 | 0.01 | ||
| Oblica | a | 50.898 | 1.54 | 48.997 | 7.564 | -1.316 | |
| b | 10.48 | 7.245 | -1.191 | -0.141 | 0.179 | ||
| c | -0.489 | -0.276 | 0.015 | -0.001 | -0.007 | ||
| d | 0.006 | 0.003 | 0** | 0** | 7.99E-05 | ||
| p-Value | Model | ≤ 0.0001 | ≤ 0.0001 | ≤ 0.0001 | ≤ 0.0001 | 0.001 | |
| Lack of fit | 0.513 | 0.001 | 0.110 | 0.764 | 0.001 | ||
| R2 | 0.908 | 0.864 | 0.772 | 0.736 | 0.659 | ||
| Optimal temperature | 15.5 | ||||||
| Desirability | 0.639 | ||||||
| Predicted values | 119 | 58.96 | 34.15 | 5.65 | 0.01 | ||
*the models obtained for this variety are second-order polynomial regression models; **the coefficient of d is 0, making it a second-order polynomial model.
Disclaimer/Publisher’s Note: The statements, opinions and data contained in all publications are solely those of the individual author(s) and contributor(s) and not of MDPI and/or the editor(s). MDPI and/or the editor(s) disclaim responsibility for any injury to people or property resulting from any ideas, methods, instructions or products referred to in the content. |
© 2025 by the authors. Licensee MDPI, Basel, Switzerland. This article is an open access article distributed under the terms and conditions of the Creative Commons Attribution (CC BY) license (https://creativecommons.org/licenses/by/4.0/).
Copyright: This open access article is published under a Creative Commons CC BY 4.0 license, which permit the free download, distribution, and reuse, provided that the author and preprint are cited in any reuse.


