
Submitted:
23 July 2025
Posted:
25 July 2025
You are already at the latest version
Abstract
This study examined the effects of ultrasound (US) treatment of olive paste before malaxation on oil yield (Y), enzyme activity and virgin olive oil (VOO) quality in four Croatian olive varieties: Istarska Bjelica, Rosulja, Oblica and Levantinka. Oils were extracted using the Abencor system following a central composite design, with treatment times of 3–17 minutes and power levels of 256–640 W. Parameters analyzed included Y, oxidative stability (OSI), antioxidant capacity (AC), phenolic and α-tocopherol content, volatiles, fatty acid profile and the activity of lipoxygenase, β-glucosidase, polyphenol oxidase and peroxidase. Olive variety had the most significant influence across variables. Response surface methodology revealed that US treatment at low to moderate intensity improved certain quality traits. For example, Y increased by 4% in Oblica, phenolic content rose by up to 17% in Istarska Bjelica, and OSI and AC were enhanced up to 13–14% in Istarska Bjelica and Levantinka. However, prolonged exposure and high US power had adverse effects. Other investigated parameters showed no significant changes. The application of US resulted in measurable, although moderate, improvements in Y and VOO quality, with outcomes strongly influenced by olive variety and treatment conditions. These findings highlight the importance of further optimization tailored to each specific variety. In addition, a feasibility study is warranted to evaluate the practical implementation of US technology in VOO production, considering the relatively limited benefits observed.
Keywords:
ultrasound
; virgin olive oil
; response surface methodology
; oil yield
; oxidative stability
; antioxidant capacity
; phenolic composition
; α-tocopherol
; volatile compounds
; lipoxygenase
; β-glucosidase
; polyphenol oxidase
; peroxidase
1. Introduction
Virgin olive oil (VOO) enjoys great popularity as one of the main representatives of the Mediterranean diet due to its specific sensory properties and proven positive effects on human health [1]. In the olive fruit, the oil is located in the cytoplasm inside of the specialized leucoplasts called elaioplasts. During the crushing phase of VOO production, mechanical force is applied to olives, breaking down their structure and releasing oil from the disrupted cells. However, some of the cells remain intact and the oil which is released from disrupted cells can form an emulsion with the aqueous phase further complicating separation [2]. These factors contribute to relatively low oil yield (Y) in conventional VOO production which are addressed during the malaxation phase. Malaxation, a controlled slow mixing of the crushed olive paste at regulated temperatures (typically up to 28 °C) and controlled duration (up to 60 minutes), increases Y and influences the overall quality of VOO [3]. During malaxation, the oil droplets bind to each other through hydrophobic interactions (coalescence phenomenon), while chemical substances (triacylglycerols, fatty acids, pigments and phenols) released from the cells during the crushing phase are distributed between the oil and water phases and transformed by the activity of the endogenous enzymes of the olive fruit (EE) [2,4]. The enzymes of the lipoxygenase pathway (acyl hydralase, lipoxygenase (LOX), hydroperoxide lyase, alcohol dehydrogenase and alcohol acyl transferase) are involved in the formation of the desirable C5 and C6 volatile compounds responsible for the positive sensory properties of VOO. Qualitatively and quantitatively, the main volatile compounds contributing to the VOO aroma are hexanal, (E)-2-hexenal, (E)-2-hexen-1-ol, hexan-1-ol and (Z)-3-hexenyl acetate [5]. The composition and quantity of phenols are directly influenced by β-glucosidase (β-GLU), which hydrolyses phenolic glycosides, producing simple sugars and phenolic aglycones that are more soluble in oil and contribute to the sensory and nutritional value of VOO. On the other hand, the oxidoreductases polyphenol oxidase (PPO) and peroxidase (POX) are responsible for the degradation of phenols. POX oxidizes phenols at the expense of hydroperoxides, while PPO oxidizes phenols converting phenols into benzene-1,2-diols (o-diphenols or catechins) through hydroxylation and into benzo-1,2-quinones (o-quinones) through their oxidation, producing melanins with amines or phenols through a series of enzymatic browning reactions [6]. To improve the nutritional and sensory profile of VOO, the ultimate goal would be to influence the activity of EE by increasing the activity of LOX and β-GLU and decreasing the activity of POX and PPO.
Although essential for enhancing Y and overall quality of produced VOO, malaxation is also the limiting factor in the VOO production process. It disrupts process continuity, and significantly contributes to production costs due to the substantial energy required to maintain the olive paste temperature [7]. For these reasons, the shortening of the malaxation phase by optimizing the process parameters of conventional VOO production (temperature and time) and, more recently, the application of innovative technologies such as flash thermal treatment, ultrasound (US) and pulsed electric field, which could potentially replace malaxation, are some of the possibilities investigated [8]. Application of high-power US in the production of VOO induces both thermal and mechanical effects [9]. The thermal effect results from the conversion of US wave energy into heat, which reduces the viscosity of the olive paste and increases coalescence of oil droplets. The mechanical effect is primarily driven by acoustic cavitation, characterized by the formation, growth to a critical size and implosion of gas bubbles, causing localized increases in temperature and pressure [2]. Cavitation induces destabilization of the plant cell structure and disruption of the cell membrane and wall, thereby enhancing mass transfer and subsequently increasing Y and bioactive compounds [3,9,10]. The incorporation of US in the VOO production process offers significant advantages in terms of environmental sustainability. It contributes to pollution reduction by decreasing the volume of by-products and facilitating their disposal, due to the lower concentration of phenolic compounds, which can be ecotoxic at high levels. Furthermore, US enhances energy efficiency and reduces production costs by shortening or potentially eliminating the malaxation phase [7].
To date, the application of ultrasound has been studied on Spanish, Italian, Turkish and Tunisian olive varieties [9,10,11,12,13,14,15,16,17,18]. However, autochthonous Croatian varieties originate from different geographical and climatic Mediterranean regions - Istria (45°04’ N; 13°79’ E) and Dalmatia (43°55’ N; 16°35’ E) [19] and have not yet been investigated in this context. Varieties Istarska Bjelica, Rosulja, Oblica and Levantinka are the leading Croatian varieties and represent the core of national olive oil production. These varieties are genetically and chemically distinct types of olives that have not yet been sufficiently researched in the context of new processing technologies. Examining the response of different varieties to ultrasound contributes to a broader understanding of cultivar-specific reactions to innovative processing methods and offers insights applicable to similar Mediterranean growing regions, supporting the development of optimized, variety-specific approaches for VOO production. Therefore, the aim of this study was to evaluate the effects of ultrasound application prior to malaxation on Y, oxidative stability (OSI), antioxidant capacity (AC) and the composition of phenols, tocopherols, volatile compounds and fatty acids in VOOs obtained from Istarska Bjelica, Rosulja, Oblica and Levantinka.
2. Materials and Methods
2.1. Plant Material
Olive fruits (Olea europaea L.) of four different autochthonous Croatian varieties were used for this experiment. Oblica and Levantinka came from the Dalmatia region from the orchard of the Institute for Adriatic Crops and Karst Reclamation in Split, while Rosulja and Istarska Bjelica came from the Istria region from the agricultural holding in Bale. The olive fruits were harvested in mid-October and early November 2022, with a ripening index of 1.75 for Oblica, 2.01 for Levantinka, 2.19 for Rosulja and 1.32 for Istarska Bjelica. The ripening index of the harvested olives was determined based on the degree of pigmentation of the skin and pulp according to the method of the International Olive Council [20].
2.2. Virgin Olive Oil Production
The olives were processed within 24 hours of harvest, and VOO was produced on laboratory scale using an Abencor MC2 system (Ingenierías y Sistemas, Seville, Spain) which simulates the industrial process of VOO production. After cleaning and washing, approximately 800 g of olives were crushed into olive paste using a metal hammer mill (MM-100) equipped with a 4.5 mm sieve and operating at 3000 rpm. The paste was then subjected to US treatment, following the parameters defined by the central composite plan varying the duration and US power. The Sonorex Digiplus US bath (BANDELIN electronic, Berlin, Germany) with a maximum power of 640 W, a voltage of 120 - 240 V and a frequency of 20 kHz was used for the treatment. During the US treatment, the olive paste was constantly stirred to ensure uniform exposure. After the US pretreatment, malaxation was carried out at 27 °C for 40 minutes in a thermos beater (TM-100). The oil was separated on a CF-100 vertical centrifuge (90 s, 3500 rpm) and additionally clarified by a second centrifugation (4 min, 5000 rpm, 18 °C) on a Rotina 320R centrifuge (Hettich, Tuttlingen, Germany). The oils obtained were stored in dark glass bottles under a nitrogen atmosphere at a temperature not exceeding 20 °C until further analysis.
2.3. Oil Yield
The oil yield (Y, %) was calculated using the following equation (1) according to Peres et al. [21]:
where Vvoo is the volume of VOO produced (mL), ρ is the density of VOO (0.915 g/mL) and m is the mass of olive paste used for oil extraction (g).
2.4. Basic Quality Parameters
2.5. Determination of Fatty Acid Composition
The fatty acid composition was determined by gas chromatography (GC) according to ISO standard method [25]. A solution of methyl pentadecanoate in octane (C15 methyl ester, γ = 1.25 μg/mL) was used as an internal standard, replacing isooctane in the sample preparation protocol. Prepared fatty acid methyl esters (FAMEs) were analyzed using a gas chromatograph equipped with a flame ionization detector (GC-FID; Agilent 6890N Network GC System, Agilent Technologies, Santa Clara, CA, USA), following the procedure described by Kraljić et al. [26]. Fatty acids were identified by comparing their retention times with those of a commercial standard mixture (FAME 37, Supelco, Bellefonte, PA, USA). Quantification of individual fatty acids was performed using internal standard method.
2.6. Enzyme Activity Assay
2.6.1. Olive Paste and Acetone Powders
Olive paste was used to isolate and determine LOX activity, while acetone powder was prepared and used for extraction of β-GLU, PPO, and POX. After malaxation, 30 g of olive paste was sealed in a plastic bag, frozen in liquid nitrogen and stored in a freezer until further analysis. An additional 90 g of the paste was used for the preparation of acetone powder following the modified method described by Romero-Segura et al. [27]. To prepare the powder, 1200 mL of cold acetone (- 20 °C) was added to the paste and the mixture was homogenized for 2 minutes using the GLH 850 homogenizer (Omni International, Kennesaw, GA, USA) at 15,000 rpm. The homogenate was vacuum filtered and the resulting powder was subjected to two additional homogenizations, each with 250 mL of cold acetone. The final residue was rinsed with 50 mL of diethyl ether, sealed in a plastic bag, frozen in liquid nitrogen and stored in a freezer until further analysis.
2.6.2. Lipoxygenase Extraction and Activity Assay
LOX was isolated according method by Luaces et al. [28] with minor modifications. Briefly, 5 g of olive paste was homogenized in 20 mL of extraction buffer (100 mM phosphate buffer, pH 6.7) using GLH 850 homogenizer at 11,000 rpm during two 1-minute intervals. The homogenate was vacuum filtered through a double layer of Miracloth and subsequently centrifuged at 27,000 g for 30 minutes at 4 °C. The resulting supernatant was used as crude enzyme extract.
LOX activity was determined according to the protocol described by Soldo et al. [29]. Linoleic acid (25 mM), prepared as described in our previous work [30], was used as a substrate. The reaction mixture consisted of 4.0 mL of 0.1 M sodium phosphate buffer (pH 6.0), 500 μL of linoleic acid, and 500 μL of enzyme extract. The reaction was magnetically stirred at 25 °C for 30 minutes and terminated by adjusting the pH to 2.0 with 3 M HCl. Butylated hydroxytoluene (BHT; 1 mL of 0.25 mM) was added as an internal standard.
The hydroperoxides were extracted in three successive extractions with 10 mL hexane:isopropanol solution (95:5 v/v). Following the final extraction, the mixture was centrifuged at 5000 rpm for 10 minutes. The hexane phases were combined and evaporated to dryness at 40 °C under reduced pressure (<200 mbar) using a rotary evaporator (Rotavapor, Heidolph Instruments GmbH & Co., Schwabach, Germany). The dried residue was reconstituted in 1.5 mL of acetonitrile:water (67:33, v/v) and sonicated for 10 seconds in an ultrasonic bath.
For analysis, 10 μL of the prepared extract was injected into a HPLC system (Agilent Technologies 1200 Series, Santa Clara, CA, USA) equipped with a diode array detector (DAD). Separation was achieved using a reverse-phase C18 column (Luna, 250 mm × 4.6 mm, 5 μm particle size, 100 Å pore size; Phenomenex, Torrance, CA, USA) maintained at 35 °C. The mobile phase consisted of solvent A (0.25% acetic acid in water) and solvent B (acetonitrile), with a constant flow rate of 1.0 mL/min. The following gradient program was applied: 63% B at 0 min, held until 17 min; increased linearly to 80% B by 20 min; maintained at 80% B until 32 min; and returned to initial conditions by 35 min, followed by a 10-minute equilibration period. Detection was performed at 234 nm. Hydroperoxy-octadecatrienoic acids (HPOTs) were identified by comparing retention times and UV spectra with those of a commercial 13(S)-hydroperoxy-9(Z),11(E),15(Z)- octadecatrienoic acid standard. Quantification was carried out using an internal standard method based on the response factor ratio between HPOTs and BHT. LOX activity was defined as the amount of HPOT in μmol synthesized by 1 mg of enzyme per minute at 25 °C.
2.6.3. β-Glucosidase Extraction and Activity Assay
β-GLU was isolated, and its activity was determined according to the modified method of Romero-Segura et al. [27]. Enzyme extracts were prepared by mixing 3 g of acetone powder and 12 mL of extraction buffer (5 mM ethylenediaminetetraacetic acid (EDTA), 1 mM phenylmethanesulfonylfluoride (PMSF) and 0.25 % (w/v) dithiothreitol in 100 mM borate buffer, pH 9) on a magnetic stirrer in an ice bath for 1 h. The resulting homogenate was then centrifuged at 27,000 g for 30 min at 4 °C and the clear supernatant was used as crude extract for determination of enzyme activity. The reaction medium for β-GLU activity consisted of 1.5 mL oleuropein (5 mM in 50 mM sodium acetate buffer pH 5.5) and 500 μl enzyme extract. The reaction lasted 30 minutes at 45 °C, after which it was stopped by adding 1.5 mL methanol. The prepared samples were injected (20 μl) into an HPLC system (Agilent Technologies LC 1200, Santa Clara, CA, USA) and analyzed isostatically on a non-polar C18 column (Luna 250 mm × 4.6 mm, 5 μm, 100 Å, Phenomenex, Torrance, CA, USA). A 0.1 % solution of formic acid in water/methanol (V/V, 1:1) at a constant flow rate of 1 mL/min was used as the mobile phase. The chromatograms were recorded using a DAD detector at 280 nm. The oleuropein concentration before and after the reaction was calculated using the corresponding calibration curve. The β-GLU activity was defined as the amount of residual oleuropein in μmol after reduction by 1 mg of enzyme per minute.
2.6.4. Polyphenol Oxidase Extraction and Activity Assay
The enzyme extracts were prepared according to the modified method of Peres et al. [31]. Enzyme extracts were prepared by mixing 3 g of acetone powder, 2.5 % polyvinylpyrrolidone and 12 mL of extraction buffer (0.05 M potassium phosphate and 1 M KCl, pH 6.2) on a magnetic stirrer in an ice bath for 1 h. The resulting homogenate was then centrifuged at 27,000 g for 30 min at 4 °C and the clear supernatant was used as crude extract for determination of enzyme activity. The reaction medium consisted of 2,5 mL of catechol (c = 30 mM) and 500 μL of enzyme extract. The activity of PPO was determined spectrophotometrically by measuring the increase in absorbance at 420 nm associated with the oxidation of catechol after one minute of reaction at room temperature according to the method described by Caponio et al. [32]. One unit of PPO activity was defined as the amount of o-quinone in μmol (ε = 1623 M/cm) produced by 1 mg of enzyme per minute.
2.6.5. Peroxidase Extraction and Activity Assay
The enzyme extracts were prepared in the same way as described in section 2.6.4. POX activity in the extracts was determined spectrophotometrically based on the increase in absorbance at 470 nm, which is due to the formation of tetraguaiacol (ε = 26,600 M/cm) by peroxidation of guaiacol according to the modified method of Caponio et al. [32]. 2 mL of guaiacol (c = 30 mM) and 1 mL of H202 (30%, c = 4 mM) were added simultaneously and the absorbance was measured after 10 minutes of reaction at room temperature. One unit of POX activity was defined as the amount of tetraguaiacol in μmol produced by 1 mg of enzyme per minute.
2.6.6. Total Protein Content
The amount of total proteins in enzyme extracts was determined using the Bradford reagent with crystalline bovine serum albumin (BSA) as the standard protein [33]. In brief, 300 μL of the enzyme extract was added to 1.2 mL of Bradford reagent, and the absorbance was measured against a blank after a 5-minute reaction at room temperature at 595 nm.
2.7. Determination of Volatile Compounds
The composition and content of volatile compounds were determined by gas chromatography coupled with mass spectrometry (GC/MS) using the 6890N Network GC System and the 5973 inert Mass Selective Detector (Agilent Technologies, Santa Clara, CA, SAD) according to the method of Kraljić et al. [26] with some minor modifications. Samples were prepared in a 20-mL glass vial by weighting 0.015 g of internal standard (0.15 % solution of 4-methyl-2-pentanol in refined sunflower oil) and 10 g of VOO. The vial was sealed with a silicone septum and placed in a heating block at 40 °C with a magnetic stirrer (Pierce Reacti-Therm Heating/Stirring Module, Artisan, Champaign, IL, USA). After 10 minutes of sample conditioning, the SPME fiber (a 2 cm long Divinylbenzene/Carboxen/Polydimethylsiloxane fiber; Supelco, Bellefonte, PA, USA) was exposed to the headspace for 30 minutes and immediately desorbed in the GC injector in splitless mode at 260 °C for 1 minute. The volatile compounds were separated using a HP-5 capillary column (30 m×0.25 mm×0.25 μm; Agilent Technologies, Santa Clara, USA) and helium as the carrier gas at a flow rate of 1.5 mL/min. The initial oven temperature of 30 °C was maintained for 3 minutes. Then the temperature increased to 150 °C at a rate of 5 °C/min and further to 250 °C at a rate of 20 °C/min. The final temperature was maintained for 5 minutes. The mass spectrometer was operated in electron ionization (EI) mode scanning the mass range m/z 50-550. The ion source and transfer line temperatures were set at 250 °C and 260 °C, respectively. The mixture of standard n-alkanes (C8–C20) in pure dichloromethane was run under the same conditions as the samples to calculate the Kovats retention index values. The volatile compounds were identified by comparing their retention times and mass spectra with those of the standards and with the mass spectra in the National Institute of Standards and Technology (NIST) mass spectral library databases. They were also identified by comparing Kovats indices from the same library or from the literature. The quantification of the compounds was performed considering the response and the concentration of the internal standard.
2.8. Determination of Phenolic Compounds
The composition of the phenolic compounds was determined using the RP-HPLC method. The extraction of phenolic compounds was carried out according to the standard method of the International Olive Council [34] with syringic acid as internal standard. The prepared methanolic extracts (20 μl) were analyzed on HPLC according to the method described by Škevin et al. [35]. The concentration of total and individual phenols was expressed as mg tyrosol/kg oil.
2.9. Determination of Tocopherols
The tocopherol content was analyzed according to ISO standard method [36]. Separation and detection of tocopherols was performed according to Kraljić et al. [26]. The retention time of the commercial standards was used to identify the tocopherols in the sample. The concentration of each tocopherol detected in the sample was expressed by the concentration of α-tocopherol (mg/kg).
2.10. Determination of Oxidative Stability
The oxidative stability was determined by measuring the induction time on a differential scanning calorimeter (DSC) 214 Polyma (NETZSCH-Gerätebau GmbH, Selb, Germany) according to the modified method by Tan et al. [37]. 4.0 ± 0.3 mg of VOO was weighed into an aluminum pan and hermetically sealed with a lid with a pinhole in the middle. It was then placed in the sample chamber of the instrument. The device was calibrated with high-purity indium and the baseline was determined with an empty aluminum pan. The isothermal method was used. The sample was heated to 140 °C at a rate of 20 °C/min under constant nitrogen flow (40 mL/min). After 5 minutes of equilibrium at 140 °C, nitrogen was replaced by purified oxygen (99.95 %, 100 mL/min). Nitrogen was used as a protective gas throughout the analysis at a flow rate of 60 mL/min. The DSC curves were evaluated using the NETZSCH Proteus Thermal Analysis 8.0.1 program. The induction time was determined at the intersection of the extrapolated baseline and the tangent of the exothermic part of the recorded exotherm.
2.11. Determination of Antioxidative Capacity
The antioxidant capacity of VOO was determined by measuring the percentage of reduction of 1,1-diphenyl-2-picrylhydrazyl (DPPH) radical using electron paramagnetic resonance (EPR) according to the modified method of Markić et al [39]. The measurements were carried out at room temperature using the Magnettech MS – 5000 (Freiberg instruments GmbH, Freiberg, Germany) with the following parameters: frequency of magnetic field modulation - 100 kHz, magnetic field strength - 331–343 mT, field sweep range - 12 mT, sweep time - 30 s, microwave power - 10 mW and modulation amplitude - 0.2 mT. 20 μl of VOO was added to 980 μl of DPPH˙ solution (0.15 mM in ethyl acetate), mixed vigorously and EPR spectra were recorded after exactly 30 minutes of the reaction in the dark. The blank sample was prepared by adding 20 μl of ethyl acetate instead of the VOO sample. The amplitudes of the EPR signals of the DPPH˙ were calculated by integration of the EPR spectra using EW (EPRWare) Scientific Software Service. The reduction of amplitude of the DPPH˙ (%) was calculated according to the following formula (2):
where A0 is amplitude of the blank sample and A30 is the amplitude of the EPR signal of DPPH˙ in the VOO solution measured after 30 minutes of reaction time.
2.12. Statistical Analysis
The VOO samples were produced with the application of US pretreatment according to the central composite experiment design with two independent variables: treatment duration (min) and ultrasonic bath power (W). The experimental matrix, shown in Table 1, consisted of 10 experimental conditions, including a control with no US application (0 min, 0 W) and a central point which was replicated 5 times to enable the estimation of experimental error and assess the reproducibility of the system. The treatment duration ranged from 3 to 17 minutes, while US power varied between 256 and 640 W (axial points). A one-way analysis of variance (ANOVA) was performed to test the influence of variety. Significant differences between the control samples of different olive varieties were determined using the (two-tailed) Tukey‘s post hoc test at p ≤ 0.05.
Response surface methodology (RSM) was employed to understand the effects of US pretreatment on key quality and compositional parameters of VOO. A two-factor interaction (2FI) models were developed to describe the influence of US power and treatment time across different olive varieties on Y, OSI, AC, phenolic and tocopherol content, and linoleic acid concentration. The empirical equation (first order multiple regression equation) was developed (3):
where A=time, B=power, C1=Istarska Bjelica variety, C2=Rosulja, C3=Oblica and C4=Levantinka. The predicted response correlated to the set of regression coefficients (β): the intercept (β0), linear (β1-β6), and interaction coefficients (β7-β15). Analyses were performed using XLSTAT statistical software (Lumivero, Denver, CO, USA). The results are shown as mean ± standard deviation. All analyses were performed in at least two replicates.
3. Results and Discussion
The application of US in VOO production has received growing attention as a technology potentially capable of enhancing the release of intracellular components and improving oil functionality [16]. In this study, the effects of US pretreatment in the production of VOO in laboratory conditions were evaluated across four Croatian olive varieties, focusing on both compositional changes and biochemical responses. All samples, regardless of treatment, met the official criteria for extra virgin olive oil under EU regulations [38]. Peroxide values ranged from 1.0 to 3.0 meq O₂/kg, free fatty acids from 0.19 to 0.42% oleic acid, and UV absorption indices (K232, K268, ∆K) remained within acceptable limits. As in previous studies on both industrial and laboratory scale [9,10,15,16,17], no significant differences were observed between control and US-treated samples for these basic quality parameters. Therefore, they are not further discussed in this paper, allowing greater emphasis on the more sensitive indicators of oil quality and technological response. Furthermore, given that olive variety strongly determines the chemical composition, phenolic content, and antioxidant capacity of VOO, and thus its specific response to US-assisted extraction [39], it is essential to first discuss the intrinsic differences among the studied varieties.
3.1. Influence of Olive Variety
Differences among Istarska Bjelica, Rosulja, Oblica, and Levantinka were significant for nearly every chemical and biochemical parameter measured, confirming previous studies highlighting the importance of genotype in oil quality outcomes [19,40].
3.1.1. Oil Yield
From the results shown in Figure 1 and models detailed in Table 6, it is evident that the olive variety was the main factor that significantly influenced Y (p ≤ 0.001). Specifically, Levantinka exhibited the highest Y, while Rosulja showed the lowest. Similar results were reported in the literature for Levantinka (20 %) and Rosulja (5 and 8 %) [41,42,43]. In contrast, Y of 18–21 % and about 21 % for laboratory production were usually reported for Oblica and Istarska Bjelica, respectively [19,41,44], which corresponds to values 1.5 to 2 times higher than those observed in this study. However, lower Y comparable with our results were reported in some of the previous studies [42,45,46]. The lower Y can be most probable attributed to the pronounced drought in 2022 during the pit hardening and intensive fruit growth compared to previous years, and also to differences in ripening indexes, with Istarska Bjelica and Oblica having somewhat lower ripening indexes than the other two varieties [41,46,47,48]. Moreover, excess rain was observed near harvest in Istria that could have increased fruit moisture and diluted Y during extraction [49]. Nevertheless, it is well established that Y is affected by factors such as fruit ripeness, climatic conditions, agronomic practices, and technological parameters applied during processing [50,51].
3.1.2. Fatty Acid Composition
The fatty acid composition of VOO is strongly influenced by the variety, the degree of ripeness and the geographical origin, especially the latitude and climatic conditions [52]. Table 2 shows the main fatty acids in the VOO samples and includes fatty acid groups (saturated fatty acids – SFA, monounsaturated fatty acids – MUFA and polyunsaturated fatty acids - PUFA).
The results for fatty acid composition of the VOOs produced in this study were consistent with previous studies [19,45,53]. MUFAs dominated the fatty acid profile, accounting for 64–75% of total fatty acids, of which oleic acid accounted for approximately 98%. Due to the high content of oleic acid, VOO carries the health claim “high unsaturated fat”, which indicates that this food contributes to the maintenance of normal blood cholesterol levels [54]. The detailed fatty acid profiles of different olive varieties further elucidate the variability in oil composition and its implications for nutritional quality and oxidative stability. The MUFA/PUFA ratio serves as a critical indicator of the oxidative stability of VOOs, reflecting their resistance to oxidative degradation and, consequently, shelf life under appropriate storage conditions [19]. In the present work, Levantinka and Rosulja exhibited MUFA/PUFA ratio of around 10, Istarska Bjelica 8, and Oblica had the lowest ratio of around 4, indicating greater susceptibility to oxidation. This is due to the fact that Oblica exhibited the lowest level of oleic acid, while displaying the highest concentrations of linoleic fatty acid. Notably, the study of Žanetić et al. [19] reported a MUFA/PUFA ratio for Oblica approximately twice as high, while the ratio for Levantinka was consistent with these findings. On the other hand, the research of Jukić Špika et al. [53] reported the same ratio for Oblica as in this research.
3.1.3. Endogenous Enzymes
Olive paste was used to isolate and determine LOX activity, while for β-GLU, POX and PPO proteins were first concentrated in an acetonic powder which was then used for their isolation (Table 3). EE play a very important role in the production of VOO, as they are responsible for its quality and nutritional value. As mentioned, during the crushing phase of VOO production, the structure of the plant cells breaks down and the chemical substances such as triacylglycerols, fatty acids, pigments and phenols (substrates for EE) are released. In the next phase of production (the malaxation phase), the enzymes are activated and convert these compounds into volatile and phenolic compounds, which are responsible for the nutritional, sensory and antioxidant properties and oxidative stability of the VOOs [2].
Olive variety had a significant influence on the overall enzyme activity. In the control samples, the highest LOX activity was found in Rosulja, which had the highest maturity index (2.19) compared to the other three olive varieties. This is consistent with the literature [55,56], which shows a significant increase in LOX activity in olive fruits as ripening progresses. Compared to the research of Soldo et al. [55], this study found a 2 to 3 times higher LOX activity in Oblica and Levantinka, respectively, which is related to their higher ripening indexes. The activity of β-GLU was detected exclusively in Rosulja, which exhibited the highest maturity index among the studied varieties. This is in agreement with the study of Susamci et al. [57] who observed that β-GLU activity increases with fruit ripening; however, this pattern can vary considerably depending on the olive variety. In this study, β-GLU activity was measured in acetone powders, following the procedure described by Romero-Segura et al. [27]. While acetone precipitation effectively concentrates proteins, it can also lead to partial inactivation due to the high sensitivity of β-GLU to organic solvents [58,59]. This likely explains the absence of detectable activity in the other varieties. For more accurate assessment in future studies, it would be advisable to determine β-GLU activity directly in olive paste, as is commonly done for LOX analysis. No PPO activity was detected in the control sample in Rosulja, while the highest activity was recorded in Istarska Bjelica, the opposite of what was the case with LOX. This is also confirmed by the literature, which states that the activity of PPO and POX decreases as the olive fruit ripens [60]. POX activity, on the other hand, was only detected in Levantinka, but it was very low, similar to previous reports [31,32].
3.1.4. Volatile Compounds
According to the literature [59], volatile compounds can be divided into products of the lipoxygenase pathway (ΣLOX), oxidation products (ΣOX) and products of microbiological activity (ΣMBA). The composition of volatile components of produced VOO is presented in Table 4. Of the detected compounds, 2-methylbutanal is identified as sole product of microbiological activity responsible for the fusty defect in VOO. 2,4-Hexadienal, 4-oxohex-2-enal, pentanal and nonanal are products of oxidation (ΣOX), while all other detected compounds originate from the lipoxygenase pathway (ΣLOX). The products of the lipoxygenase pathway contribute to the specific aroma and flavor of the VOO being responsible for the green and fruity aroma, while the oxidation products are responsible for the development of the undesirable off-flavor of rancidity. VOO is very resistant to non-enzymatic oxidation as it contains oleic acid and various antioxidants. The oxidation of VOO mostly occurs through autoxidation, a chain reaction triggered by radicals that leads to the loss of antioxidants and the formation of toxic free radicals and hydroperoxides [61]. The content of volatile compounds strongly depends on the variety, the degree of ripeness of the fruit, the geographical area of cultivation, the agronomic factors and the processing method [55]. In the control samples, aldehydes dominated among the volatile compounds in all olive varieties, with the exception of the Levantinka variety, in which the mass fraction of aldehydes and alcohols was approximately equal. Aldehydes were more abundant in the varieties from the Istria region, while alcohols were more abundant in the varieties from the Dalmatia region. The highest content of ketones was found in Istarska Bjelica and the highest content of esters in Levantinka. In addition, the varieties from the Istria region had the highest content of compounds from the LOX pathway and also the highest content of OX products, while the highest content of MBA products was found in Levantinka and Istarska Bjelica. Compared to previous reports [62], Rosulja showed a 5-fold lower total amount of aldehydes than in our study, while other volatile groups were present in the same amount. In contrast, in the study by Žanetić et al. [19], Oblica had a threefold higher content of aldehydes, a twofold higher content of alcohols and a slightly higher content of esters, while Levantinka had a fivefold higher content of aldehydes, an approximately equal content of alcohols and a fourfold lower amount of esters.
3.1.5. Phenolic Compounds and Tocopherols
Several phenolic compounds have been detected in the VOOs. These included phenolic alcohols (hydroxytyrosol and tyrosol), p-coumaric acid, hydroxytyrosol acetate, oleacein, methyl hemiacetal of oleocanthal, oleocanthal, oleuropein and ligstroside aglycones, as shown in Table 5. The phenolic composition is a characteristic of the olive variety but depends on many different factors such as the maturity index, the geographical area of cultivation, the climate and the agricultural and technological conditions [63]. Among the control samples of the four varieties analyzed, Istarska Bjelica proved to be the variety with the highest content of phenolic compounds. This variety had the highest concentration of total phenolic compounds (TPC), oleocanthal and ligstroside aglycones, while Levantinka had the highest concentration of phenolic alcohols. In addition, Rosulja had the highest concentration of methyl hemiacetal of oleocanthal, oleuropein aglycones and oleacein. Oblica, on the other hand, had the lowest TPC, oleuropein aglycones, methyl hemiacetal of oleocanthal, phenolic alcohols and oleacein, while having the highest concentration of p-coumaric acid. According to the research of Šarolić et al. [64] Levantinka exhibited half the TPC content as in this study. Oblica, on the other hand, showed a content twice as high. In the research of Franić et al. [45], Levantinka had a lower TPC content (279 mg/kg), similar to Oblica and Rosulja in this study, while Istarska Bjelica had a content twice as high as in this study (582 mg/kg).
According to EU Commission Regulation [54], olive oil may bear the health claim “Olive oil polyphenols contribute to the protection of blood lipids from oxidative stress” if the oil contains at least 5 mg of hydroxytyrosol and its derivatives per 20 g of olive oil. Of the varieties in our experiment, only Rosulja VOO can carry this health claim.
The concentration of α-tocopherol (the main tocopherol in VOOs) is also shown in Table 5. The variety had the greatest influence on its concentration. In the control samples, the highest content was found in Levantinka (367 mg/kg) and the lowest in Oblica and Rosulja (273 and 272 mg/kg, respectively). In the research of Jukić Špika et al. [65], Oblica had similar contents (284 and 263 mg/kg). For other varieties, lower levels of α-tocopherol were found in the literature than in this study. The study of Šarolić et al. [64] found a lower α-tocopherol content in Oblica (213 mg/kg) and Levantinka (222 mg/kg), which can be attributed to the higher ripening indexes as the study of Morello et al. [66] demonstrated that the α-tocopherol concentration decreases with increasing ripeness of the olive fruit. In the research of Koprivnjak et al. [67] both varieties from Istria also had a lower content than in our experiment, with Istarska Bjelica having a three times lower content. According to the EU Regulation on nutrition and health claims made on foods [68,69] food may bear the claim “Vitamin E contributes to the protection of cells from oxidative stress” if they contain at least 1.8 mg vitamin E per 100 g, which is the case for all VOOs in this study.
3.1.6. Oxidative Stability and Antioxidant Capacity
The oxidative stability of VOOs was described by the induction time, which is defined as the time in minutes during which the oil is resistant to oxidation at high temperatures. The higher the induction time, the higher the concentration of compounds with antioxidant properties in the oil, which is why the oil deteriorates more slowly and is more stable during storage. Components of the oil that contribute to oxidative stability are phenols, tocopherols and fatty acid composition [70]. Among the control samples (Figure 2), Rosulja had the highest oxidative stability, while Oblica had the lowest, corresponding to the lowest TPC content and the highest content of PUFAs, more specifically linoleic acid. In the research of Bilušić et al. [71] Oblica also had the shortest induction time among other Croatian varieties in that study.
The antioxidant capacity of the oil is described as the potential of the oil to protect the consumer from a range of oxidative reactions that lead to oxidative stress and the development of various diseases. Compounds with antioxidant properties such as phenols and tocopherols are responsible for the antioxidant capacity of VOO [11]. The antioxidant capacity in this study was assessed in vitro and is expressed as a percentage of the reduction of stable DPPH radical. The higher the percentage of reduction, the higher the concentration of antioxidants in the oil, so the oil is more stable over time, degrades more slowly and is healthier for consumers given the numerous proven health benefits of the above compounds [72]. As can be seen in Figure 3, the highest antioxidant capacity among the control samples was found in Rosulja and the lowest in Oblica, following the pattern of oxidative stability. Rosulja showed similar AC (75 %) in the research of Koprivnjak et al. [43], while Istarska Bjelica had higher AC (78 %) than in our study.
3.2. Influence of Ultrasound
It was previously reported in several studies that US affected Y, OSI, AC, phenolic and tocopherol content [9,10,12,15,16,17,73,74,75]. However, negligible effect of US on volatile compounds has been reported [14,15,17,76] or that it led to a slight decrease [9,16,17], which was explained by the increase in temperature and the inactivation of enzymes of the LOX pathway by acoustic cavitation. In addition, Yahyaoui et al. [18] reported no significant impact of US on LOX activity, while β-GLU showed a slight decrease in its activity. On the other hand, US significantly affected PPO and POX activities [2,3]. Mild or short US stimulated activity due to heat and micro-mixing effects, while higher power decreased enzyme activity or inhibited the enzyme. These results highlight the complexity of the effects of US technology on both the production yield and the quality of virgin olive oil.
To better understand the effects of US treatment on key quality and compositional parameters of VOO produced from Croatian olive varieties, RSM was employed. This statistical tool enables the evaluation of multiple variables and their interactions simultaneously, offering an efficient approach to model complex systems such as olive paste processing. In this study, a two-factor interaction (2FI) models were developed to describe the influence of US power (256 – 640 W) and treatment time (3 – 17 min). Results in Table 6 present model parameters for Y, OSI, AC, phenolic and tocopherol content, and linoleic acid concentration. The models for other parameters investigated were also developed, but were not significant, which is why they are not presented and discussed further here.

Table 6.
Two-factor interaction model parameters (regression coefficients, p-value, coefficient of determination (R2) and lack of fit) for oil yield (Y), oxidative stability index (OSI), antioxidant capacity (AC), content of linoleic acid, total phenolic compounds and α-tocopherol content affected by US treatment duration (min), power (W) and olive variety.
| Model parameter | Y (%) | OSI (min) | AC (% of DPPH˙ reduction) | Linoleic acid (mg/g) | TPC (mg/kg) | α-tocopherol (mg/kg) |
|---|---|---|---|---|---|---|
| Intercept | 12.923 | 130.94 | 53.037 | 93.6 | 296.586 | 287.106 |
| p-value | <0,0001 | <0,0001 | <0,0001 | <0,0001 | <0,0001 | <0,0001 |
| Time | 0.159 | -3.908 | -2.012 | -0.166 | -12.653 | -2.557 |
| p-value | 0.093 | 0.004 | <0,0001 | 0.603 | 0.000 | 0.375 |
| Power | 0.105 | -0.879 | -0.453 | -0.649 | -3.305 | -0.228 |
| p-value | 0.247 | 0.477 | 0.272 | 0.037 | 0.275 | 0.935 |
| Variety-Istarska Bjelica | -2.167 | 24.252 | 8.156 | -9.462 | 147.029 | 13.317 |
| p-value | <0,0001 | <0,0001 | <0,0001 | <0,0001 | <0,0001 | 0.001 |
| Variety-Levantinka | 7.05 | 7.46 | -3.413 | -27.823 | -41.035 | 35.01 |
| p-value | <0,0001 | <0,0001 | <0,0001 | <0,0001 | <0,0001 | <0,0001 |
| Variety-Oblica | 0.9 | -92.602 | -22.275 | 68.004 | -179.161 | -33.683 |
| p-value | <0,0001 | <0,0001 | <0,0001 | <0,0001 | <0,0001 | <0,0001 |
| Variety-Rosulja | -5.783 | 60.89 | 17.533 | -30.719 | 73.168 | -14.644 |
| p-value | <0,0001 | <0,0001 | <0,0001 | <0,0001 | <0,0001 | 0 |
| Time *Power | -0.184 | -1.325 | 0.4 | 1.066 | -3.992 | 16.688 |
| p-value | 0.164 | 0.462 | 0.505 | 0.019 | 0.365 | <0,0001 |
| Time *Variety-Istarska Bjelica | 0.217 | -1.066 | -0.403 | 0.053 | 12.657 | -6.509 |
| p-value | 0.182 | 0.63 | 0.585 | 0.923 | 0.021 | 0.193 |
| Time *Variety-Levantinka | 0.064 | -1.879 | -1.322 | 0.191 | -8.421 | -5.966 |
| p-value | 0.691 | 0.398 | 0.076 | 0.729 | 0.122 | 0.233 |
| Time *Variety-Oblica | -0.131 | 1.542 | -0.204 | -1.087 | -0.853 | 1.509 |
| p-value | 0.419 | 0.487 | 0.783 | 0.051 | 0.875 | 0.762 |
| Time *Variety-Rosulja | -0.151 | 1.403 | 1.929 | 0.842 | -3.382 | 10.966 |
| p-value | 0.352 | 0.527 | 0.01 | 0.129 | 0.532 | 0.03 |
| Power *Variety-Istarska Bjelica | -0.276 | -7.309 | -2.812 | 0.493 | -15.387 | 0.169 |
| p-value | 0.082 | 0.001 | 0 | 0.356 | 0.004 | 0.972 |
| Power *Variety-Levantinka | 0.115 | 5.803 | 1.782 | 1.131 | 8.789 | -11.743 |
| p-value | 0.461 | 0.009 | 0.014 | 0.036 | 0.095 | 0.016 |
| Power *Variety-Oblica | 0.363 | 3.574 | 2.376 | -3.343 | 9.826 | -1.184 |
| p-value | 0.024 | 0.1 | 0.001 | <0,0001 | 0.062 | 0.806 |
| Power *Variety-Rosulja | -0.202 | -2.068 | -1.347 | 1.719 | -3.229 | 12.757 |
| p-value | 0.199 | 0.336 | 0.061 | 0.002 | 0.537 | 0.009 |
| R2 | 0.991 | 0.988 | 0.958 | 0.997 | 0.966 | 0.653 |
| R2 adjusted | 0.988 | 0.985 | 0.952 | 0.996 | 0.962 | 0.607 |
As mentioned earlier, Y was primarily influenced by olive variety. Although a slight increase in Y was observed with longer pretreatment times, neither treatment time (p = 0.093) nor power (p = 0.247) had a statistically significant main effect on Y (Table 6, Figure 4), suggesting that US treatment alone did not consistently enhance oil recovery across all conditions. However, a significant interaction between US power and the Oblica variety suggests that applying US can moderately enhance oil recovery in specific varieties, most likely by promoting cell wall disruption and facilitating oil release. Compared to the control, the application of 640 W US power for 10 min increased Y from Oblica by about 4%. These findings are consistent with previous reports emphasizing that varietal differences in cell structure and moisture or oil content play a dominant role in extractability [77]. Similar improvements in Y have been reported in other varieties subjected to US pretreatment before malaxation under industrial conditions, such as a 3.4% increase in Ogliarola Garganica with a maturity index of 2.82 [16], and increases of 4.4% and 4.6% in Nocellara and Coratina, respectively [15]. Additionally, a 4.3% increase was observed in Chemlali after a 10-minute US treatment [73].
The oxidative stability index (OSI) is a critical parameter reflecting the resistance of VOO to lipid oxidation and serves as a strong predictor of shelf life. The model (Table 6 and Figure 5) developed for oxidative stability index (OSI) exhibited a high level of predictive accuracy (R² = 0.988; adjusted R² = 0.985), indicating that the combined effects of US parameters and olive variety explain nearly all the observed variability in OSI. Among the US factors, treatment time had a statistically significant negative effect on OSI (p = 0.004), suggesting that prolonged sonication promotes oxidative degradation. This aligns with previous reports demonstrating that acoustic cavitation during US processing can induce localized heating and the formation of reactive oxygen species, accelerating oxidative processes [78]. In contrast, US power alone did not have a significant effect (p = 0.477), indicating that the duration of exposure is a more critical factor for oxidative damage than power intensity. These findings are supported by Iqdiam et al. [12], who observed a significant decrease in OSI after 8 and 10 minutes of both direct and indirect high-power US treatment compared to shorter exposure times (0–6 min), for two different olive varieties. They reported that 10 minutes of direct high-power US caused an approximate 8% reduction in induction time, with no significant changes observed for shorter durations (p > 0.05). This indicates that US begins to compromise oxidative stability only beyond a critical exposure threshold.
However, the negative interaction of power in Istarska Bjelica observed (Figure 5a) here suggests that even phenolic-rich cultivars [79] may be susceptible to oxidation when exposed to excessive US energy, confirming the narrow margin between beneficial extraction and detrimental degradation. Interestingly, the interaction of US power in Levantinka (Figure 5d) was significant and positive, suggesting that in this variety, moderate US energy may help release more antioxidants without causing substantial oxidative stress. This agrees with results from Servili et al. [15], who reported that under optimized conditions, in their case increased pressure, US can selectively enhance antioxidant extraction and improve oil quality. Together, these findings underscore the importance of variety-specific optimization of US parameters. Short to moderate treatment durations may offer benefits, while prolonged sonication appears to pose a risk to oxidative stability, particularly in more sensitive varieties.
The regression model for the content of linoleic acid (Table 6, Figure 6), displayed excellent predictive power (R² = 0.997; adjusted R² = 0.996). The models were created with mass fractions in mg/g of oil (not in percentages) so that small changes in concentration can be recognized and a higher precision and resolution of the model is achieved. US power emerged as a significant negative factor (p = 0.037), indicating that higher sonication intensity reduces linoleic acid levels, likely through oxidative degradation triggered by cavitation-generated radicals. In contrast, treatment time did not have a statistically significant main effect (p = 0.603), suggesting that long exposures alone may not significantly alter linoleic acid content unless combined with high power. This aligns with the observed decline in OSI, suggesting that US-induced oxidation may target unsaturated lipids like linoleic acid.
Interestingly, in the Oblica variety (Figure 6c), treatment with high-power ultrasound (p < 0.001) resulted in a significant decrease in linoleic acid content. This finding is not unexpected, as Oblica typically contains at least twice the amount of linoleic acid compared to the other varieties studied (Table 2). Linoleic acid is considerably more susceptible to oxidation than oleic acid, and high-power ultrasound (20 kHz, 150 W) has been shown to accelerate oxidative processes in oils. As reported by Chemat et al. [80], sonication of refined sunflower oil for just 2 minutes increased peroxide values from 5.38 to 6.33 meq O₂/kg, indicating the onset of oxidation. Although there were no significant immediate changes in fatty acid composition, the volatile profile in their study showed the formation of hexanal and limonene resulting from sonication.
The regression model for total phenolic compounds (Table 6, Figure 7) showed a strong fit (R² = 0.966; adjusted R² = 0.962), confirming that besides variety, US processing influences the phenolic profile of VOO. Among US parameters, treatment duration had a highly significant negative effect (–12.653 mg/kg per minute, p < 0.001), while US power was not a significant predictor. However, the interaction between sonication time and the variety Istarska Bjelica was significant and positive (p = 0.021), suggesting that this variety is less sensitive to phenolic losses at longer treatment times. Reports on US implementation in VOO production show that its effect can be highly dependent on the variety and treatment conditions. Several authors have also reported a significant increase in phenolic compounds following US treatment which was specific to chemical structure. Tamborrino et al. [9] observed a 41 % increase in TPC and 68 % increase in oleacein in the Peranzana variety, while oleocanthal increased only slightly (~10 %), and phenolic alcohols decreased. Oils extracted with the application of US from Ogliarola garganica variety analyzed by Taticchi et al. [16] showed TPC increase of 10 % which was related to oleuropein aglycon species. Servilli et al. [15] reported a 28 % increase in TPC in the Nocellara variety and notable increases in oleocanthal in both Nocellara and Coratina varieties (39 % and 19 %, respectively), along with increases in ligstroside and tyrosol. Conversely, Gila et al. [17] found that phenolic content was generally not affected by US treatment and even observed a slight decrease in Arbequina oils, which was attributed to moderate temperature rises during treatment.
On the other hand, Iqdiam et al. [12] reported that after 10 minutes of direct high-power US treatment, total polyphenol levels were significantly reduced, by approximately 19% in Arbequina and 22% in Frantoio, indicating a substantial loss of antioxidants under extended sonication. This is consistent with the findings of Jiménez et al. [74], who reported that US exposure can induce phenolic degradation. These differing findings can be explained by the dual role of US. On one hand, US enhances the extraction of phenolic compounds by disrupting cellular structures and facilitating the release of bound phenolics [3]. On the other hand, it may simultaneously promote oxidative processes, leading to the consumption of these compounds as they act as primary antioxidants to neutralize US-induced free radicals [81]. This mechanism is supported by the observed decreases in OSI and linoleic acid content, suggesting a coupled degradation pathway whereby phenolics are depleted to counteract oxidation, subsequently facilitating the degradation of unsaturated fatty acids and reducing overall oil stability. The results in Istarska Bjelica imply that brief US treatments can still effectively enhance phenolic content without triggering significant oxidative losses, underscoring the importance of carefully optimizing sonication duration to balance these competing effects.
The regression model for α-tocopherol content (Table 6, Figure 8) (R² = 0.653; adjusted R² = 0.607) explained a moderate proportion of the variability, reflecting the complex behavior of tocopherols under US processing. Treatment time and US power alone were not significant, but their interaction was highly significant (p < 0.0001), indicating that the combination of higher US intensity and longer exposure can strongly affect tocopherol levels probably due to enhanced release from cellular matrices, as observed in Rosulja (24% increase). Taticchi et al. [16] and Pagano et al. [10] also observed an increase in α-tocopherol concentration (11%) in Ogliarola garganica, while Gila et al. [17] reported no effect of sonication process on tocopherol content. In present study, US showed declined α-tocopherol content in all investigated varieties except aforementioned Rosulja (Figure 8).
The regression model for antioxidant capacity (AC), expressed as % DPPH radical reduction (Table 6 and Figure 9), demonstrated strong explanatory power (R² = 0.958; adjusted R² = 0.952). Time had a highly significant negative effect (p < 0.0001), indicating that longer ultrasound (US) exposure reduced AC. This effect is likely due to temperature increases during sonication, which can lead to the degradation of antioxidant compounds [17]. In contrast, ultrasound power alone did not have a statistically significant effect (p = 0.272). However, the interaction between power and the Istarska Bjelica variety showed a significant negative influence (p < 0.001), suggesting that higher US power reduces AC in this specific cultivar. These findings align well with the observed effects of US parameters on total phenolic content (TPC), the primary antioxidants in virgin olive oil (VOO). Similarly, Aydar et al. [75] reported a decrease in AC with prolonged US treatment in the Edremit cultivar, attributing this to a reduction in TPC. Conversely, in the Rosulja variety, the interaction with treatment time had a significant positive effect on AC, potentially linked to an increase in α-tocopherol content observed with extended US exposure.
4. Conclusions
This study investigated the effects of ultrasound (US) pretreatment on oil yield, endogenous enzyme activity, and virgin olive oil (VOO) quality in four Croatian olive varieties: Istarska Bjelica, Rosulja, Oblica, and Levantinka. US was applied to olive paste prior to malaxation, with treatment durations ranging from 3 to 17 minutes and power levels between 256 and 640 W.
The effects of US were variety-dependent, with treatment time having a stronger influence than power. A moderate increase in oil yield (~4%) was observed only in Oblica. In general, prolonged US exposure reduced TPC and, consequently OSI and AC, except in Rosulja, where AC increased. Higher US power levels were associated with a decrease in linoleic acid content, indicating enhanced oxidative degradation, which also contributed to the reduction in AC observed in Istarska Bjelica. α-Tocopherol content was generally negatively affected by US, except in Rosulja, where extreme US conditions led to a significant increase, likely contributing to the observed rise in its AC.
Other quality parameters remained largely unaffected by US pretreatment. Given the risk of oxidative degradation and loss of bioactive compounds with extended sonication, short-to-medium US durations at low-to-moderate power are recommended. Optimization of treatment parameters should be tailored to each olive variety to ensure the preservation of VOO quality and functional properties.
Author Contributions
Conceptualization, D.Š., S.B., K.K., T.V.P. and Z.H.; methodology, K.K., T.V.P. M.Ž., M.J.Š.; software, K.K. and S.B. validation, K.K. and S.B.; formal analysis, K.K. and S.B.; investigation, K.F.,V.S., M.I., I.H., M.T., M.O.; resources, M.Ž., M.J.Š., K.K., T.V.P. and D.Š.; data curation, K.K. and S.B.; writing—original draft preparation, K.F. and S.B.; writing—review and editing, K.K., T.V.P., V.S., M.J.Š, M.Ž. and D.Š.; visualization, K.F. and S.B.; supervision, K.K., S.B. and D.Š.; project administration, K.K. and D.Š.; funding acquisition, D.Š. and Z.H. All authors have read and agreed to the published version of the manuscript.
Funding
This work was supported by the Croatian Science Foundation under the project number HRZZ-IP-2020-02-7553 and by the Republic of Croatia Ministry of Science and Education through the European Regional Development Fund through the project “Equipping the Semi-Industrial Practice for the Development of New Food Technologies” (KK.01.1.1.02.0001).
Data Availability Statement
The original contributions presented in this study are included in the article/supplementary material. Further inquiries can be directed to the corresponding author(s).
Acknowledgments
We thank Melisa Trputec (University of Zagreb, Faculty of Food Technology and Biotechnology) for technical assistance in olive oil analyses.
Conflicts of Interest
The authors declare no conflicts of interest.
Abbreviations
The following abbreviations are used in this manuscript:
| US | Ultrasound |
| Y | Yield |
| VOO | Virgin olive oil |
| OSI | Oxidation stability |
| AC | Antioxidant capacity |
| TPC | Total phenolic content |
| EE | Endogenous enzymes of the olive fruit |
| LOX | Lipoxygenase |
| Β-GLU | β-Glucosidase |
| PPO | Polyphenol oxidase |
| POX | Peroxidase |
| GC | Gas chromatography |
| FID | Flame ionization detector |
| FAME | Fatty acid methyl ester |
| HPOT | Hydroperoxy-octadecatrienoic acid |
| BHT | Butylated hydroxytoluene |
| DAD | Diode array detector |
| DSC | Differential scanning calorimeter |
| DPPH | 1,1-diphenyl-2-picrylhydrazyl |
| EPR | Electron paramagnetic resonance |
| ANOVA | Analysis of variance |
| RSM | Response surface methodology |
| SFA | Saturated fatty acids |
| MUFA | Monounsaturated fatty acids |
| PUFA | Polyunsaturated fatty acids |
| MBA | Microbiological activity |
| OX | Oxidation |
References
- Nardella, M.; Moscetti, R.; Bedini, G.; Bandiera, A.; Chakravartula, S.S.N.; Massantini, R. Impact of Traditional and Innovative Malaxation Techniques and Technologies on Nutritional and Sensory Quality of Virgin Olive Oil – A Review. Food Chem Adv 2023, 2, 100163. [CrossRef]
- Amirante, R.; Paduano, A. Ultrasound in Olive Oil Extraction. In Products from Olive Tree; Boskou, D., Clodoveo, M.L., Eds.; IntechOpen: Rijeka, Croatia, 2016; pp. 43-47. [CrossRef]
- Nardella, M.; Moscetti, R.; Chakravartula, S.S.N.; Bedini, G.; Massantini, R. A Review on High-Power Ultrasound-Assisted Extraction of Olive Oils: Effect on Oil Yield, Quality, Chemical Composition and Consumer Perception. Foods 2021, 10, 2743. [CrossRef]
- Kalua, C.M.; Bedgood, D.R.; Bishop, A.G.; Prenzler, P.D. Changes in Volatile and Phenolic Compounds with Malaxation Time and Temperature during Virgin Olive Oil Production. J Agric Food Chem 2006, 54, 7641–7651. [CrossRef]
- Muzzalupo, I.; MacChione, B.; Bucci, C.; Stefanizzi, F.; Perri, E.; Chiappetta, A.; Tagarelli, A.; Sindona, G. LOX Gene Transcript Accumulation in Olive (Olea Europaea L.) Fruits at Different Stages of Maturation: Relationship between Volatile Compounds, Environmental Factors, and Technological Treatments for Oil Extraction. Sci World J 2012, 2012, 532179. [CrossRef]
- García-Rodríguez, R.; Romero-Segura, C.; Sanz, C.; Sánchez-Ortiz, A.; Pérez, A.G. Role of Polyphenol Oxidase and Peroxidase in Shaping the Phenolic Profile of Virgin Olive Oil. Food Res Int 2011, 44, 629–635. [CrossRef]
- Abenoza, M.; Benito, M.; Saldaña, G.; Álvarez, I.; Raso, J.; Sánchez-Gimeno, A.C. Effects of Pulsed Electric Field on Yield Extraction and Quality of Olive Oil. Food Bioprocess Technol 2013, 6, 1367–1373. [CrossRef]
- Veneziani, G.; Sordini, B.; Taticchi, A.; Esposto, S.; Selvaggini, R.; Urbani, S.; Di Maio, I.; Servili, M. Improvement of Olive Oil Mechanical Extraction: New Technologies, Process Efficiency, and Extra Virgin Olive Oil Quality. In Products from Olive Tree; Boskou, D., Clodoveo, M.L., Eds.; IntechOpen: Rijeka, Croatia, 2016; pp. 21-42. [CrossRef]
- Tamborrino, A.; Taticchi, A.; Romaniello, R.; Perone, C.; Esposto, S.; Leone, A.; Servili, M. Assessment of the Olive Oil Extraction Plant Layout Implementing a High-Power Ultrasound Machine. Ultrason Sonochem 2021, 73, 105505. [CrossRef]
- Pagano, M.; Tomasone, R.; Cedrola, C.; Fedrizzi, M.; Veneziani, G.; Servili, M. Use of Ultrasound in the Extraction Process of Virgin Olive Oil and Influence on Malaxation Time. In Innovative Biosystems Engineering for Sustainable Agriculture, Forestry and Food Production; Coppola, A.; Di Renzo, G.C.; Altieri, G.; D’Antonio, P., Eds.; Springer: Cham, Switzerland, 2020; Volume 67, pp.703-712. [CrossRef]
- Almeida, B.; Valli, E.; Bendini, A.; Gallina Toschi, T. Semi-Industrial Ultrasound-Assisted Virgin Olive Oil Extraction: Impact on Quality. Eur J Lipid Sci Technol 2017, 119, 1–7. [CrossRef]
- Iqdiam, B.M.; Mostafa, H.; Goodrich-Schneider, R.; Baker, G.L.; Welt, B.; Marshall, M.R. High Power Ultrasound: Impact on Olive Paste Temperature, Malaxation Time, Extraction Efficiency, and Characteristics of Extra Virgin Olive Oil. Food Bioprocess Technol 2018, 11, 634–644. [CrossRef]
- Juliano, P.; Bainczyk, F.; Swiergon, P.; Supriyatna, M.I.M.; Guillaume, C.; Ravetti, L.; Canamasas, P.; Cravotto, G.; Xu, X.Q. Extraction of Olive Oil Assisted by High-Frequency Ultrasound Standing Waves. Ultrason Sonochem 2017, 38, 104–114. [CrossRef]
- Bejaoui, M.A.; Sánchez-Ortiz, A.; Aguilera, M.P.; Ruiz-Moreno, M.J.; Sánchez, S.; Jiménez, A.; Beltrán, G. High Power Ultrasound Frequency for Olive Paste Conditioning: Effect on the Virgin Olive Oil Bioactive Compounds and Sensorial Characteristics. Innov Food Sci Emerg Technol 2018, 47, 136–145. [CrossRef]
- Servili, M.; Veneziani, G.; Taticchi, A.; Romaniello, R.; Tamborrino, A.; Leone, A. Low-Frequency, High-Power Ultrasound Treatment at Different Pressures for Olive Paste: Effects on Olive Oil Yield and Quality. Ultrason Sonochem 2019, 59, 104747. [CrossRef]
- Taticchi, A.; Selvaggini, R.; Esposto, S.; Sordini, B.; Veneziani, G.; Servili, M. Physicochemical Characterization of Virgin Olive Oil Obtained Using an Ultrasound-Assisted Extraction at an Industrial Scale: Influence of Olive Maturity Index and Malaxation Time. Food Chem 2019, 289, 7–15. [CrossRef]
- Gila, A.; Sánchez-Ortiz, A.; Jiménez, A.; Beltrán, G. The Ultrasound Application Does Not Affect to the Thermal Properties and Chemical Composition of Virgin Olive Oils. Ultrason Sonochem 2021, 70, 105320. [CrossRef]
- Yahyaoui, A.; Rigane, G.; Mnif, S.; Salem, R. Ben; Acar, A.; Arslan, D. Ultrasound Technology Parameters: Effects on Phenolics in Olive Paste and Oil in Relation to Enzymatic Activity. Eur J Lipid Sci Technol 2019, 121, 1–9. [CrossRef]
- Žanetić, M.; Špika, M.J.; Ožić, M.M.; Bubola, K.B. Comparative Study of Volatile Compounds and Sensory Characteristics of Dalmatian Monovarietal Virgin Olive Oils. Plants 2021, 10, 1995, doi.org/10.3390/plants10101995.
- International Olive Council. Guide for the Determination of the Characteristics of Oil-Olives; COI/OH/Doc. No 1; International Olive Council: Madrid, Spain, 2011.
- Peres, F.; Martins, L.L.; Ferreira-Dias, S. Laboratory-Scale Optimization of Olive Oil Extraction: Simultaneous Addition of Enzymes and Microtalc Improves the Yield. Eur J Lipid Sci Technol 2014, 116, 1054–1062. [CrossRef]
- ISO 3960:2017; Animal and vegetable fats and oils – Determination of peroxide value – Iodometric (visual) endpoint determination. ISO: Geneve, Switzerland, 2017.
- International Olive Council. Determination of free fatty acids, cold method; COI/T.20/Doc. No 34/Rev. 1; International Olive Council: Madrid, Spain, 2017.
- International Olive Council. Spectrophotometric investigation in the ultraviolet; COI/T.20/Doc. No 19/Rev. 5; International Olive Council: Madrid, Spain, 2019.
- ISO 12966-2:2017; Animal and vegetable fats and oils — Gas chromatography of fatty acid methyl esters - Part 2: Preparation of methyl esters of fatty acids. ISO: Geneve, Switzerland, 2017.
- Kraljić, K.; Stjepanović, T.; Obranović, M.; Pospišil, M.; Balbino, S.; Škevin, D. Influence of Conditioning Temperature on the Quality, Nutritional Properties and Volatile Profile of Virgin Rapeseed Oil. Food Technol Biotechnol 2018, 56, 562–572. [CrossRef]
- Romero-Segura, C.; Sanz, C.; Perez, A.G. Purification and Characterization of an Olive Fruit β-Glucosidase Involved in the Biosynthesis of Virgin Olive Oil Phenolics. J Agric Food Chem 2009, 57, 7983–7988. [CrossRef]
- Luaces, P.; Pérez, A.G.; García, J.M.; Sanz, C. Effects of Heat-Treatments of Olive Fruit on Pigment Composition of Virgin Olive Oil. Food Chem 2005, 90, 169–174. [CrossRef]
- Soldo, B.; Šprung, M..; Mušac, G.; Pavela-Vrančić, M.; Ljubenkov, I. Evaluation of Olive Fruit Lipoxygenase Extraction Protocols on 9- and 13-Z,E-HPODE Formation. Molecules 2016, 21, 506. [CrossRef]
- Kraljić, K.; Balbino, S.; Filipan, K.; Herceg, Z.; Stuparević, I.; Ivanov, M.; Vukušić Pavičić, T.; Jakoliš, N.; Škevin, D. Innovative Approaches to Enhance Activity of Endogenous Olive Enzymes—A Model System Experiment: Part II—Non-Thermal Technique. Processes 2023, 11, 3283, doi.org/10.3390/pr11123283.
- Peres, F.; Martins, L.L.; Mourato, M.; Vitorino, C.; Antunes, P.; Ferreira-Dias, S. Phenolic Compounds of “Galega Vulgar” and “Cobrançosa” Olive Oils along Early Ripening Stages. Food Chem 2016, 211, 51–58. [CrossRef]
- Caponio, F.; Squeo, G.; Curci, M.; Silletti, R.; Paradiso, V.M.; Summo, C.; Crecchio, C.; Pasqualone, A. Calcium Carbonate Effect on Alkyl Esters and Enzymatic Activities during Olive Processing. Ital J Food Sci 2018, 30, 381–392. doi.org/10.14674/IJFS-1087.
- Bradford, M.M. A Rapid and Sensitive Method for the Quantitation of Microgram Quantities of Protein Utilizing the Principle of Protein-Dye Binding. Anal Biochem 1976, 72, 248–254. [CrossRef]
- International Olive Council. Determination of biophenols in olive oils by HPLC; COI/T.20/Doc. No 29/Rev.1; International Olive Council: Madrid, Spain, 2017.
- Škevin, D.; Balbino, S..; Žanetić, M.; Jukić Špika, M..; Koprivnjak, O.; Filipan, K.; Obranović, M.; Žanetić, K.; Smajić, E.; Radić, M.; Bunić, M.; Dilber, M; Kraljić, K. Improvement of Oxidative Stability and Antioxidative Capacity of Virgin Olive Oil by Flash Thermal Pretreatment—Optimization Process. Foods 2025, 14, 2564. [CrossRef]
- ISO 9936:2016; Animal and vegetable fats and oils — Determination of tocopherol and tocotrienol contents by high performance liquid chromatography. ISO: Geneve, Switzerland, 2016.
- Tan, C.P.; Che Man, Y.B.; Selamat, J.; Yusoff, M.S.A. Comparative studies of oxidative stability of edible oils by differential scanning calorimetry and oxidative stability index methods. Food Chem 2002, 76, 385–389. doi.org/10.1016/S0308-8146(01)00272-2.
- European Union Commission. Commission Delegated Regulation (EU) 2022/2104 of 29 July 2022 supplementing Regulation (EU) No 1308/2013 of the European Parliament and of the Council as regards marketing standards for olive oil, and repealing Commission Regulation (EEC) No 2568/91 and Commission Implementing Regulation (EU) No 29/2012. Off J Eur Union 2022, 65, L 284, 1-22.
- Taticchi, A.; Esposto, S.; Veneziani, G.; Urbani, S.; Selvaggini, R.; Servili, M. The Influence of the Malaxation Temperature on the Activity of Polyphenoloxidase and Peroxidase and on the Phenolic Composition of Virgin Olive Oil. Food Chem 2013, 136, 975–983. [CrossRef]
- Reboredo-Rodríguez, P.; González-Barreiro, C.; Cancho-Grande, B.; Valli, E.; Bendini, A.; Gallina Toschi, T.; Simal-Gandara, J. Characterization of Virgin Olive Oils Produced with Autochthonous Galician Varieties. Food Chem 2016, 212, 162–171. [CrossRef]
- Strikić, F.; Klepo, T.; Rošin, J.; Radunić, M. Udomaćene Sorte Masline u Republici Hrvatskoj; Institut za Jadranske Kulture i Melioraciju Krša: Split, Croatia, 2010.
- Bubola, K.B.; Lukić, M.; Novoselić, A.; Krapac, M.; Lukić, I. Olive Fruit Refrigeration during Prolonged Storage Preserves the Quality of Virgin Olive Oil Extracted Therefrom. Foods 2020, 9, 1445. [CrossRef]
- Koprivnjak, O.; Kriško, A.; Valić, S.; Carić, D.; Krapac, M.; Poljuha, D. Antioxidants, Radical-Scavenging and Protein Carbonylation Inhibition Capacity of Six Monocultivar Virgin Olive Oils in Istria (Croatia). Acta Aliment 2016, 45, 427–433. [CrossRef]
- Žanetić, M.; Cerretani, L.; Del Carlo, M. Preliminary Characterisation of Monovarietal Extra-Virgin Olive Oils Obtained From Different Cultivars in Croatia. J Commod Sci Technol Qual 2007, 46, 80–94.
- Franić, M.; Pasković, I.; Goreta Ban, S.; Marcelić, Š.; Lukić, M.; Rončević, S.; Nemet, I.; Kosić, U.; Soldo, B.; Polić Pasković, M. Cultivar-Dependent Effect of Silicon Foliar Application on Olive Fruit Yield, Morphology, and Olive Oil Quality Parameters. Appl Sci 2024, 14, 11500. [CrossRef]
- Jukić Špika, M.; Romić, D.; Žanetić, M.; Zovko, M.; Klepo, T.; Strikić, F.; Perica, S. Irrigation of Young Olives Grown on Reclaimed Karst Soil Increases Fruit Size, Weight and Oil Yield and Balances the Sensory Oil Profile. Foods 2022, 11, 2923. [CrossRef]
- Beltrán, G.; Del Río, C.; Sánchez, S.; Martínez, L. Seasonal Changes in Olive Fruit Characteristics and Oil Accumulation during Ripening Process. J Sci Food Agric 2004, 84, 1783–1790. [CrossRef]
- Brkić Bubola, K.; Koprivnjak, O.; Sladonja, B.; Belobrajić, I. Influence of Storage Temperature on Quality Parameters, Phenols and Volatile Compounds of Croatian Virgin Olive Oils. Grasas Aceites 2014, 65. [CrossRef]
- Romero-Trigueros, C.; Vivaldi, G.A.; Nicolás, E.N.; Paduano, A.; Salcedo, F.P.; Camposeo, S. Ripening Indices, Olive Yield and Oil Quality in Response to Irrigation With Saline Reclaimed Water and Deficit Strategies. Front Plant Sci 2019, 10, 1–16. [CrossRef]
- Kaniewski, D.; Marriner, N.; Morhange, C.; Khater, C.; Terral, J.F.; Besnard, G.; Otto, T.; Luce, F.; Couillebault, Q.; Tsitsou, L.; et al. Climate Change Threatens Olive Oil Production in the Levant. Nat Plants 2023, 9, 219–227. [CrossRef]
- Juliano, P.; Gaber, M.A.F.M.; Romaniello, R.; Tamborrino, A.; Berardi, A.; Leone, A. Advances in Physical Technologies to Improve Virgin Olive Oil Extraction Efficiency in High-Throughput Production Plants. Food Eng Rev 2023, 15, 625–642. [CrossRef]
- Rotondo, A.; Bartolomeo, G.; Spanò, I.M.; La Torre, G.L.; Pellicane, G.; Molinu, M.G.; Culeddu, N. Comparison between Traditional and Novel NMR Methods for the Analysis of Sicilian Monovarietal Extra Virgin Olive Oils: Metabolic Profile Is Influenced by Micro-Pedoclimatic Zones. Molecules 2024, 29, 4532. [CrossRef]
- Špika, M.J.; Perica, S.; Žanetić, M.; Škevin, D. Virgin Olive Oil Phenols, Fatty Acid Composition and Sensory Profile: Can Cultivar Overpower Environmental and Ripening Effect? Antioxidants 2021, 10, 689. [CrossRef]
- European Union Commission. Commission Regulation (EU) No 432/2012 of 16 May 2012 establishing a list of permitted health claims made on foods, other than those referring to the reduction of disease risk and to children’s development and health. Off J Eur Union 2012, 55, L136, 1–40.
- Soldo, B.; Jukić Špika, M.; Pasković, I.; Vuko, E.; Polić Pasković, M.; Ljubenkov, I. The Composition of Volatiles and the Role of Non-Traditional LOX on Target Metabolites in Virgin Olive Oil from Autochthonous Dalmatian Cultivars. Molecules 2024, 29 (8), 1696. doi.org/10.3390/molecules29081696.
- Palmieri-Thiers, C.; Canaan, S.; Brunini, V.; Lorenzi, V.; Tomi, F.; Desseyn, J.L.; Garscha, U.; Oliw, E.H.; Berti, L.; Maury, J. A Lipoxygenase with Dual Positional Specificity Is Expressed in Olives (Olea Europaea L.) during Ripening. Biochim Biophys Acta - Mol Cell Biol Lipids 2009, 1791, 339–346. [CrossRef]
- Susamcı, E.; Tuncay; Bayraktar, H.; Önal, S. Phenol Content and β-Glucosidase Activity during the Ripening Period of Olive Fruits (Erkence Cv.) from Different Locations. Grasas Aceites 2024, 75. [CrossRef]
- Vaz, J.E.; Rabelo, L.; Zaiter, M.A.; Pereira, W.E.S.; Metzker, G.; Boscolo, M.; da Silva, R.; Gomes, E.; da Silva, R.R. Functional Properties and Potential Application of Ethanol Tolerant β-Glucosidases from Pichia Ofunaensis and Trichosporon Multisporum Yeasts. 3 Biotech 2021, 11, 1–12. [CrossRef]
- Magwaza, B.; Amobonye, A.; Bhagwat, P.; Pillai, S. Biochemical and in Silico Structural Properties of a Thermo-Acid Stable β-Glucosidase from Beauveria Bassiana. Heliyon 2024, 10, 28667. [CrossRef]
- Lukić, I.; Žanetić, M.; Jukić Špika, M.; Lukić, M.; Koprivnjak, O.; Brkić Bubola, K. Complex Interactive Effects of Ripening Degree, Malaxation Duration and Temperature on Oblica Cv. Virgin Olive Oil Phenols, Volatiles and Sensory Quality. Food Chem 2017, 232, 610–620. [CrossRef]
- Cecchi, L.; Migliorini, M.; Mulinacci, N. Virgin Olive Oil Volatile Compounds: Composition, Sensory Characteristics, Analytical Approaches, Quality Control, and Authentication. J Agric Food Chem 2021, 69, 2013–2040. [CrossRef]
- Brkic Bubola, K.; Koprivnjak, O.; Sladonja, B.; Škevin, D.; Belobrajić, I. Influence of Harvest Time on the Composition and Quality of Rosinjola Cultivar Virgin Olive Oils. Croat. J Food Sci Technol 2012, 4, 9–18.
- Malheiro, R; Rodrigues, N.; Pereira, J.A. Olive Oil Phenolic Composition as Affected by Geographic Origin, Olive Cultivar, and Cultivation Systems. In Olive and Olive Oil Bioactive Constituents; Boskou, D., Eds.; AOCS Press: Urbana, United States, 2015; pp. 93-121. doi.org/10.1016/B978-1-63067-041-2.50010-0.
- Šarolić, M.; Gugić, M.; Friganović, E.; Tuberoso, C.I.G.; Jerković, I. Phytochemicals and Other Characteristics of Croatian Monovarietal Extra Virgin Olive Oils from Oblica, Lastovka and Levantinka Varieties. Molecules 2015, 20, 4395–4409. [CrossRef]
- Jukić Špika, M.; Kraljić, K.; Koprivnjak, O.; Škevin, D.; Žanetić, M.; Katalinić, M. Effect of Agronomical Factors and Storage Conditions on the Tocopherol Content of Oblica and Leccino Virgin Olive Oils. J Am Oil Chem Soc 2015, 92, 1293–1301. [CrossRef]
- Morelló, J.R.; Romero, M.P.; Motilva, M.J. Influence of Seasonal Conditions on the Composition and Quality Parameters of Monovarietal Virgin Olive Oils. J Am Oil Chem Soc 2006, 83, 683–690. [CrossRef]
- Koprivnjak, O.; Vrhovnik, I.; Hladnik, T.; Prgomet, Ž.; Hlevnjak, B.; Majetić, V. Characteristics of nutritive value of virgin olive oils from Buža, Istarska bjelica, Leccino and Rosulja cultivars. Croat J Food Sci Technol 2012, 7, 172–178.
- European Union Commission. Commission Regulation (EU) No 1924/2006 of 20 December 2006 on nutrition and health claims made on foods. Off J Eur Union 2006, 49, L404, 9-25.
- European Union Commission. Commission Regulation (EU) No 1169/2011 of 25 October 2011 on the provision of food information to consumers, amending Regulations (EC) No 1924/2006 and (EC) No 1925/2006 of the European Parliament and of the Council, and repealing Commission Directive 87/250/EEC, Council Directive 90/496/EEC, Commission Directive 1999/10/EC, Directive 2000/13/EC of the European Parliament and of the Council, Commission Directives 2002/67/EC and 2008/5/EC and Commission Regulation (EC) No 608/2004. Off J Eur Union 2011, 54, L304, 18–63.
- Velasco, J.; Dobarganes, C. Oxidative Stability of Virgin Olive Oil. Eur J Lipid Sci Technol 2002, 104, 661–676. [CrossRef]
- Bilušić, T.; Žanetić, M.; Ljubenkov, I.; Generalić Mekinić, I.; Štambuk, S.; Bojović, V.; Soldo, B.; Magiatis, P. Molecular Characterization of Dalmatian Cultivars and the Influence of the Olive Fruit Harvest Period on Chemical Profile, Sensory Characteristics and Oil Oxidative Stability. Eur Food Res Technol 2018, 244, 281–289. [CrossRef]
- Bohn, V.F.; Schappo, F.B.; Braga Alves, A.S.; Ferreira Ribeiro, C.D.; Nunes, I.L. Polyphenol antioxidants in vegetable oils: A scientific and technological prospecting. In Studies in Natural Products Chemistry; Rahman, A.-U., Eds.; Elsevier: Amsterdam, Netherlands/London, United Kingdom/Cambridge, United States, 2024, Volume 80, pp. 407-436. doi.org/10.1016/B978-0-443-15589-5.00012-8.
- Rigane, G.; Yahyaoui, A.; Acar, A.; Mnif, S.; Salem, R. Ben; Arslan, D. Change in Some Quality Parameters and Oxidative Stability of Olive Oils with Regard to Ultrasound Pretreatment, Depitting and Water Addition. Biotechnol Reports 2020, 26, 4–9. [CrossRef]
- Jiménez, A.; Beltrán, G.; Uceda, M. High-Power Ultrasound in Olive Paste Pretreatment. Effect on Process Yield and Virgin Olive Oil Characteristics. Ultrason Sonochem 2007, 14, 725–731. [CrossRef]
- Aydar, A.Y.; Bağdatlıoğlu, N; Köseoğlu, O. Effect of ultrasound on olive oil extraction and optimization of ultrasound-assisted extraction of extra virgin olive oil by response surface methodology (RSM). Grasas aceites 2017, 68(2), 189, doi.org/10.3989/gya.1057162.
- Manganiello, R.; Pagano, M.; Nucciarelli, D.; Ciccoritti, R.; Tomasone, R.; Di Serio, M.G.; Giansante, L.; Re, P. Del; Servili, M.; Veneziani, G. Effects of Ultrasound Technology on the Qualitative Properties of Italian Extra Virgin Olive Oil. Foods 2021, 10, 2884. [CrossRef]
- Veneziani, G.; Esposto, S.; Taticchi, A.; Selvaggini, R.; Sordini, B.; Lorefice, A.; Daidone, L.; Pagano, M.; Tomasone, R.; Servili, M. Extra-Virgin Olive Oil Extracted Using Pulsed Electric Field Technology: Cultivar Impact on Oil Yield and Quality. Front Nutr 2019, 6, 1–8. [CrossRef]
- Chemat, F.; Zill-E-Huma; Khan, M.K. Applications of Ultrasound in Food Technology: Processing, Preservation and Extraction. Ultrason Sonochem 2011, 18, 813–835. [CrossRef]
- Klisović, D.; Novoselić, A.; Lukić, I.; Brkić Bubola, K. Evolution of phenolic compounds and quality parameters after storage of Istarska bjelica and Buža cv. virgin olive oil. In Proceedings of the 55th Croatian & 15th International Symposium on Agriculture, Vodice, Croatia, 16 – 21 February 2020.
- Chemat, F.; Grondin, I.; Costes, P.; Moutoussamy, L.; Sing, A.S.C.; Smadja, J. High Power Ultrasound Effects on Lipid Oxidation of Refined Sunflower Oil. Ultrason Sonochem 2004, 11, 281–285. [CrossRef]
- Aktı, N.; Yildiz, S.; Aktı, N.; Yildiz, S.; Yildiz, S. Exploring Ultrasound-Induced Free Radical Formation: A Comparative Study in Water and Sour Cherry Juice Using Glutathione and Terephthalic Acid Indicators. Ultrason Sonochem 2025, 112, 107193. [CrossRef]
Figure 1.
Oil yield (Y, %) in VOOs from different olive varieties. Different lowercase letters indicate significant differences obtained via a one-way ANOVA and Tukey’s post hoc test (at p ≤ 0.05).
Figure 1.
Oil yield (Y, %) in VOOs from different olive varieties. Different lowercase letters indicate significant differences obtained via a one-way ANOVA and Tukey’s post hoc test (at p ≤ 0.05).
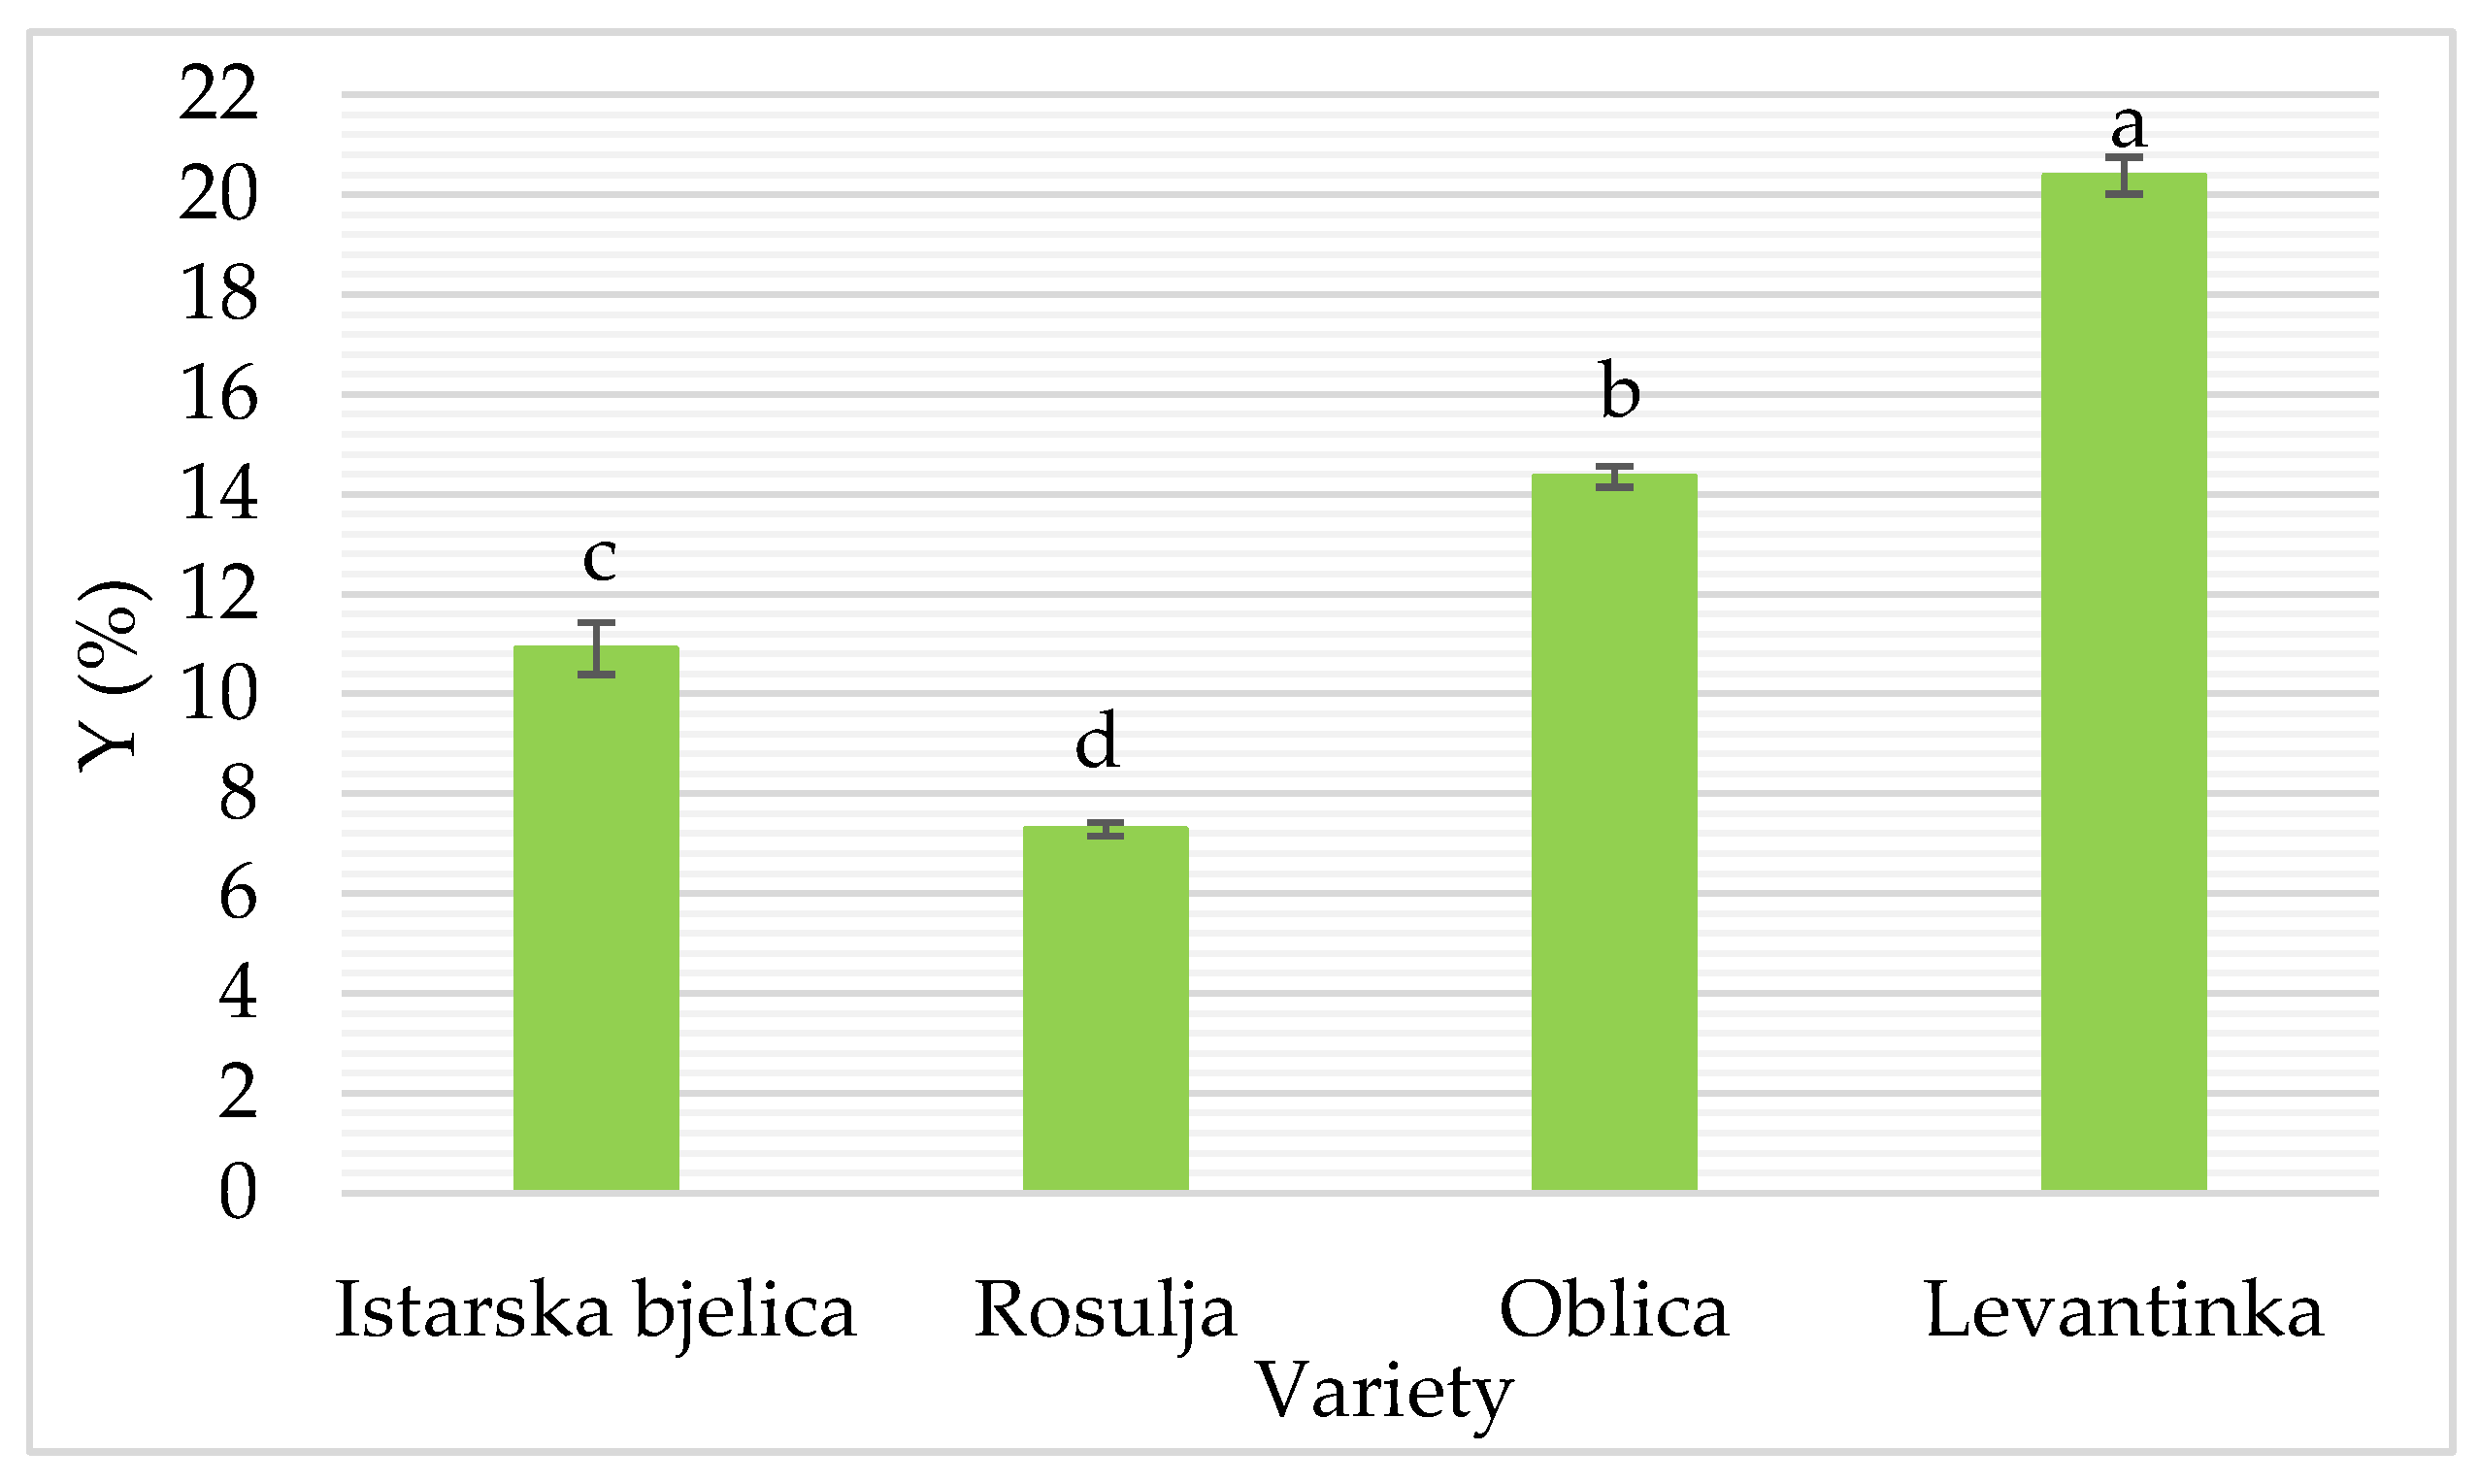
Figure 2.
Oxidative stability index (min) in VOO control samples from different olive varieties. Different letters within rows indicate significant differences between the control samples for each variety obtained via a one-way ANOVA and Tukey’s post hoc test (at p ≤ 0.05).
Figure 2.
Oxidative stability index (min) in VOO control samples from different olive varieties. Different letters within rows indicate significant differences between the control samples for each variety obtained via a one-way ANOVA and Tukey’s post hoc test (at p ≤ 0.05).
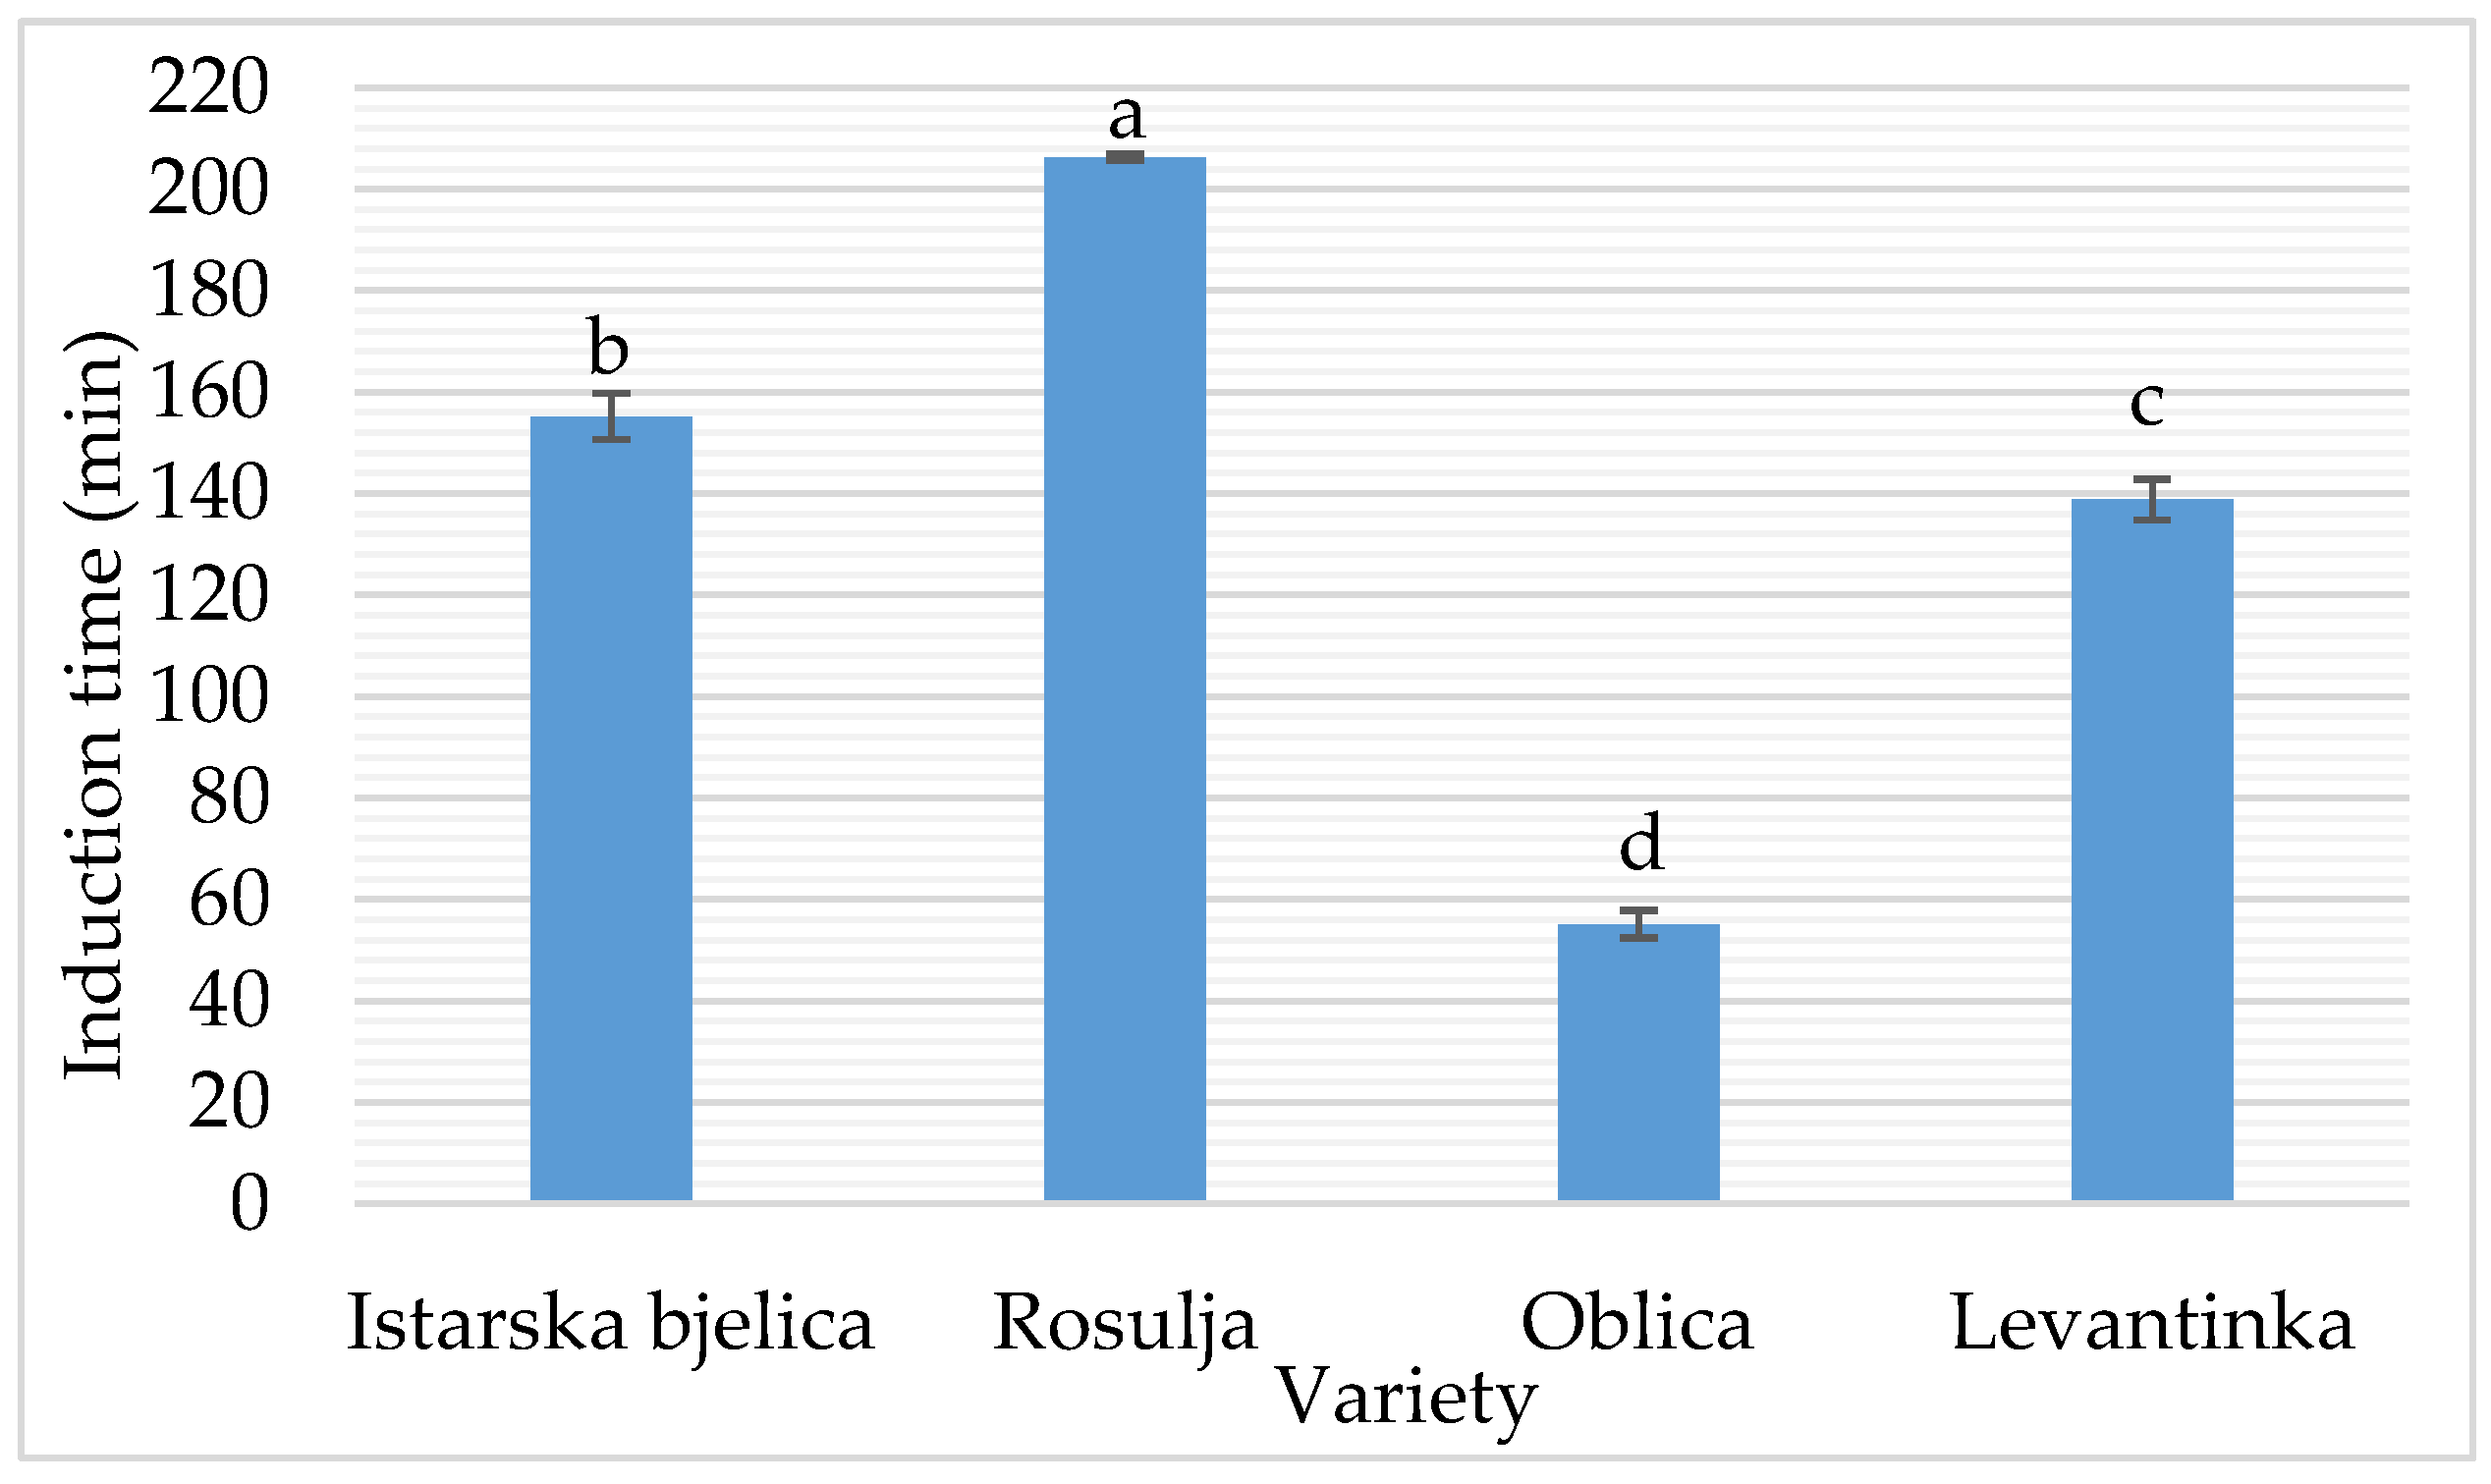
Figure 3.
Antioxidant capacity (% of DPPH˙ reduction) in VOO control samples from different olive varieties. Different letters within rows indicate significant differences between the control samples for each variety obtained via a one-way ANOVA and Tukey’s post hoc test (at p ≤ 0.05).
Figure 3.
Antioxidant capacity (% of DPPH˙ reduction) in VOO control samples from different olive varieties. Different letters within rows indicate significant differences between the control samples for each variety obtained via a one-way ANOVA and Tukey’s post hoc test (at p ≤ 0.05).
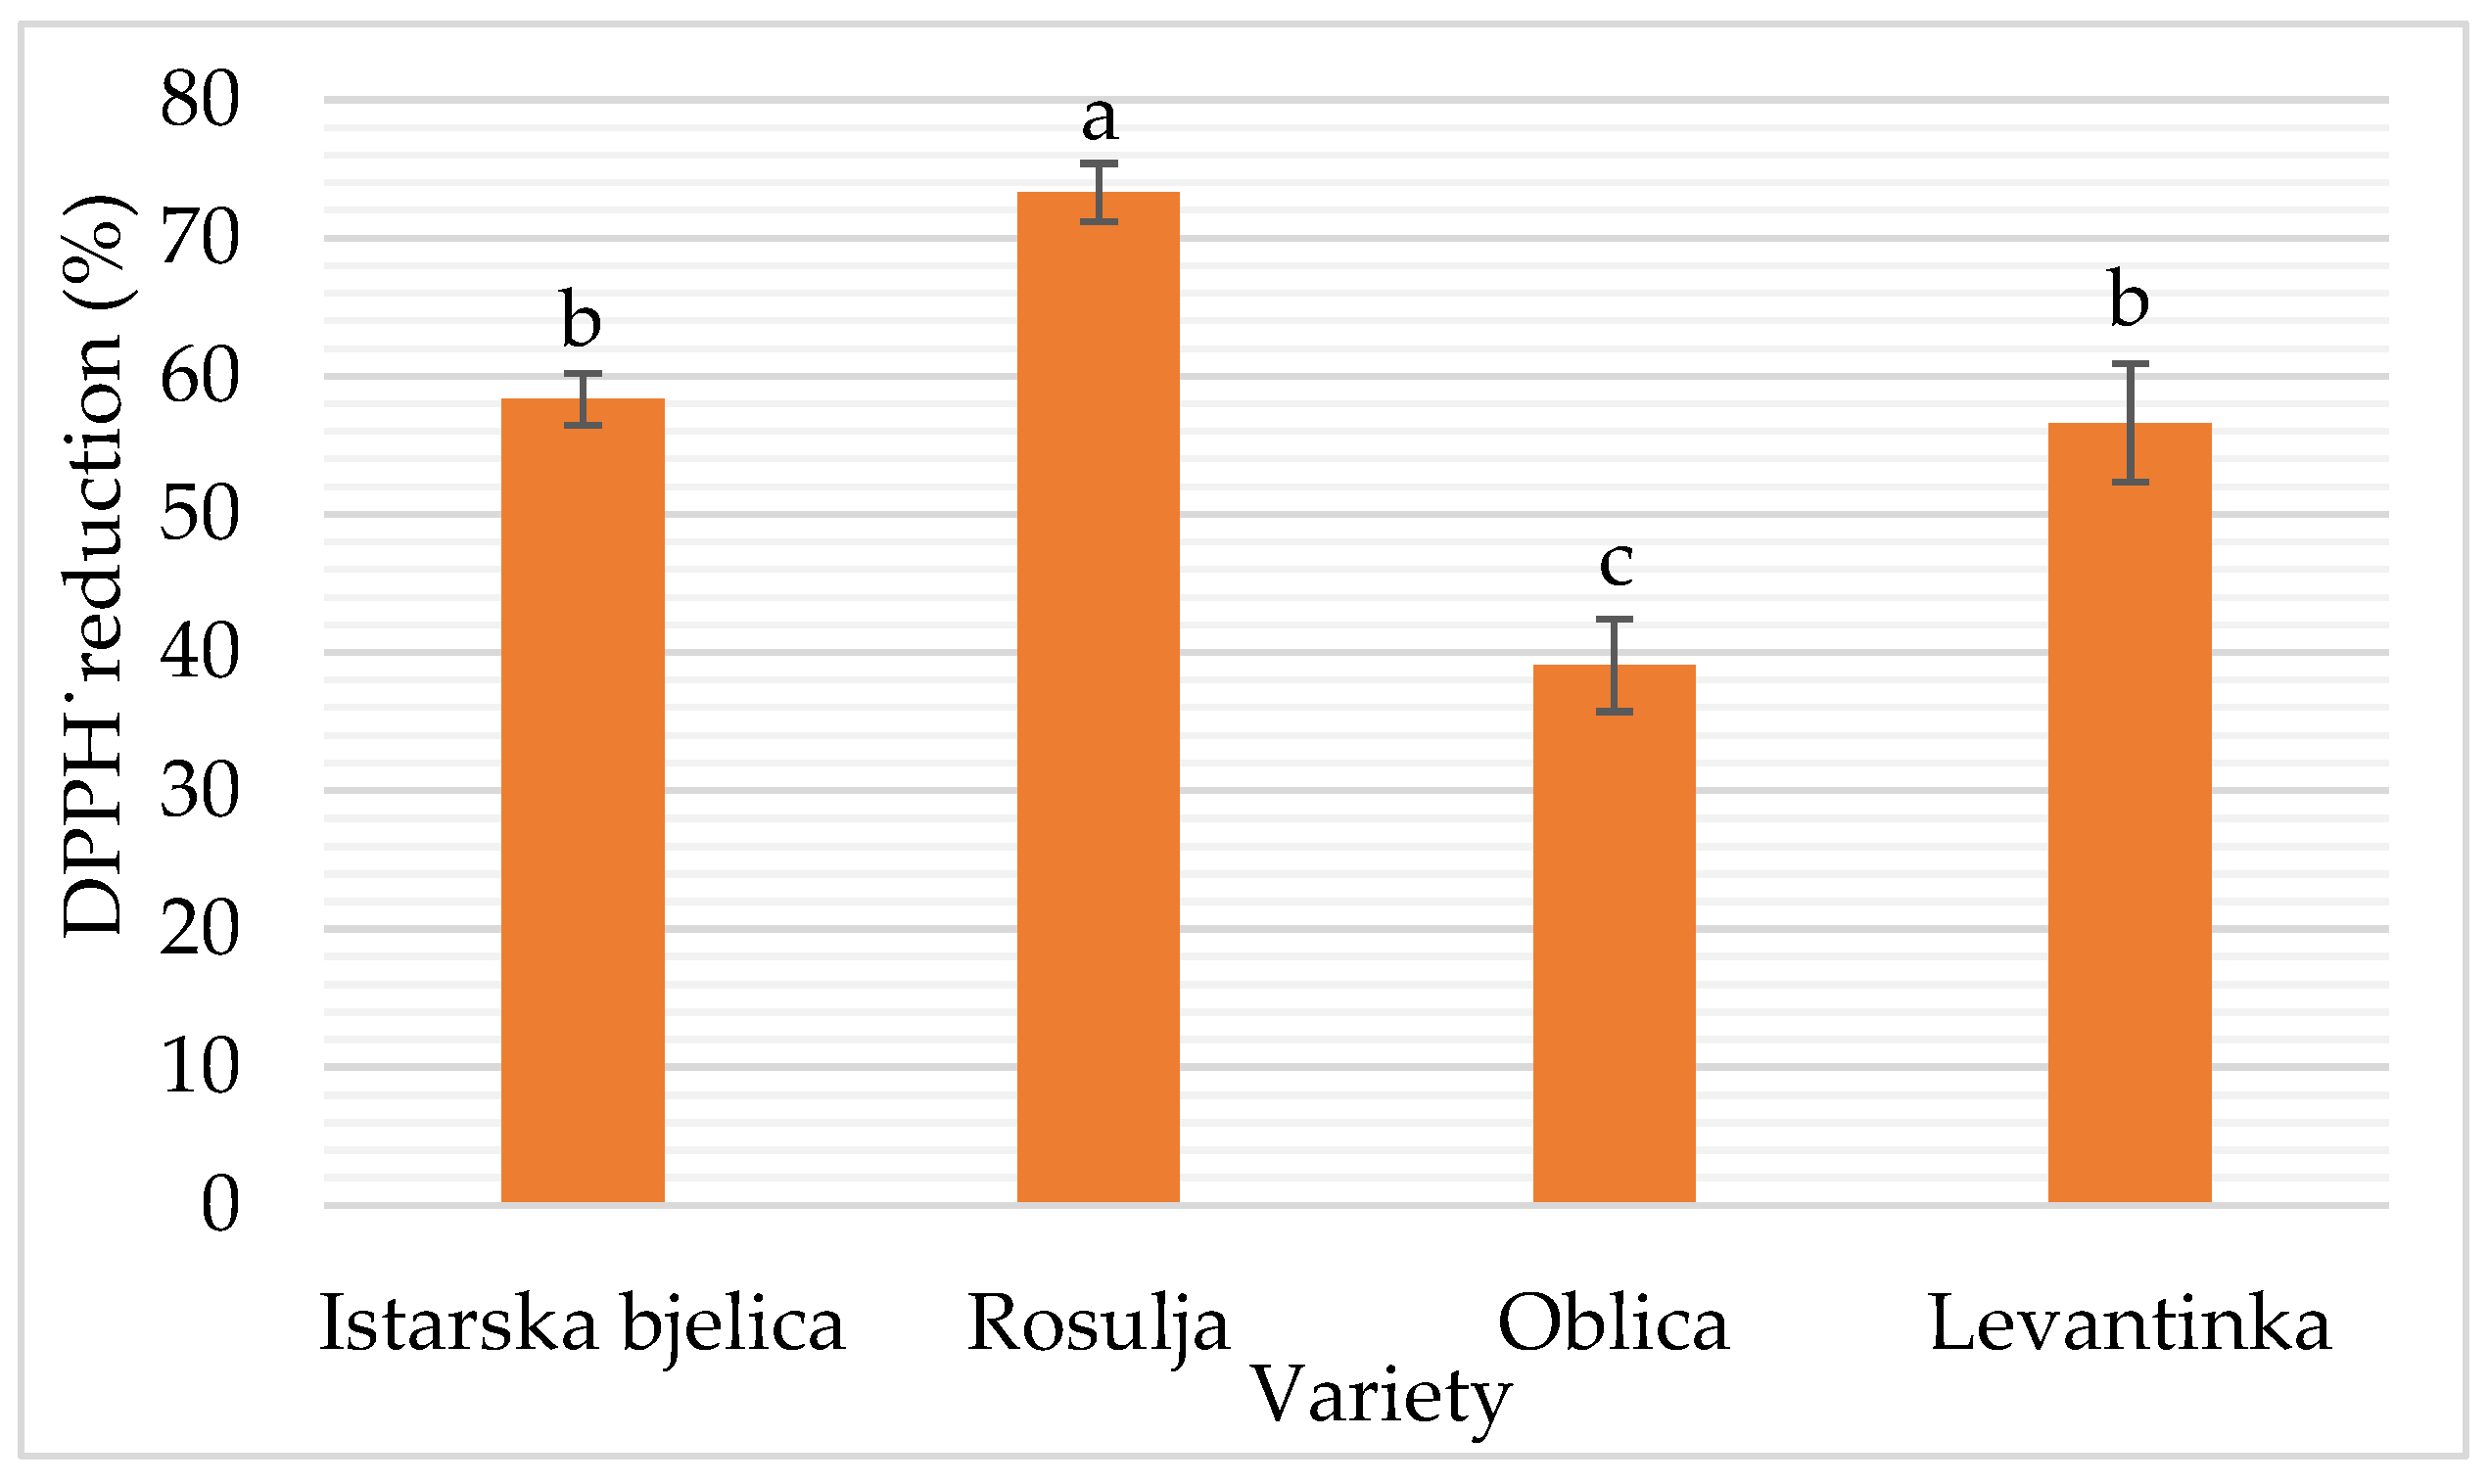
Figure 4.
3D plots describing the influence of US pretreatment parameters (treatment time and US power) on oil yield using RSM in Croatian olive varieties: a) Istarska Bjelica b) Rosulja c) Oblica and d) Levantinka. Grey line represents values for the control samples of each olive variety.
Figure 4.
3D plots describing the influence of US pretreatment parameters (treatment time and US power) on oil yield using RSM in Croatian olive varieties: a) Istarska Bjelica b) Rosulja c) Oblica and d) Levantinka. Grey line represents values for the control samples of each olive variety.
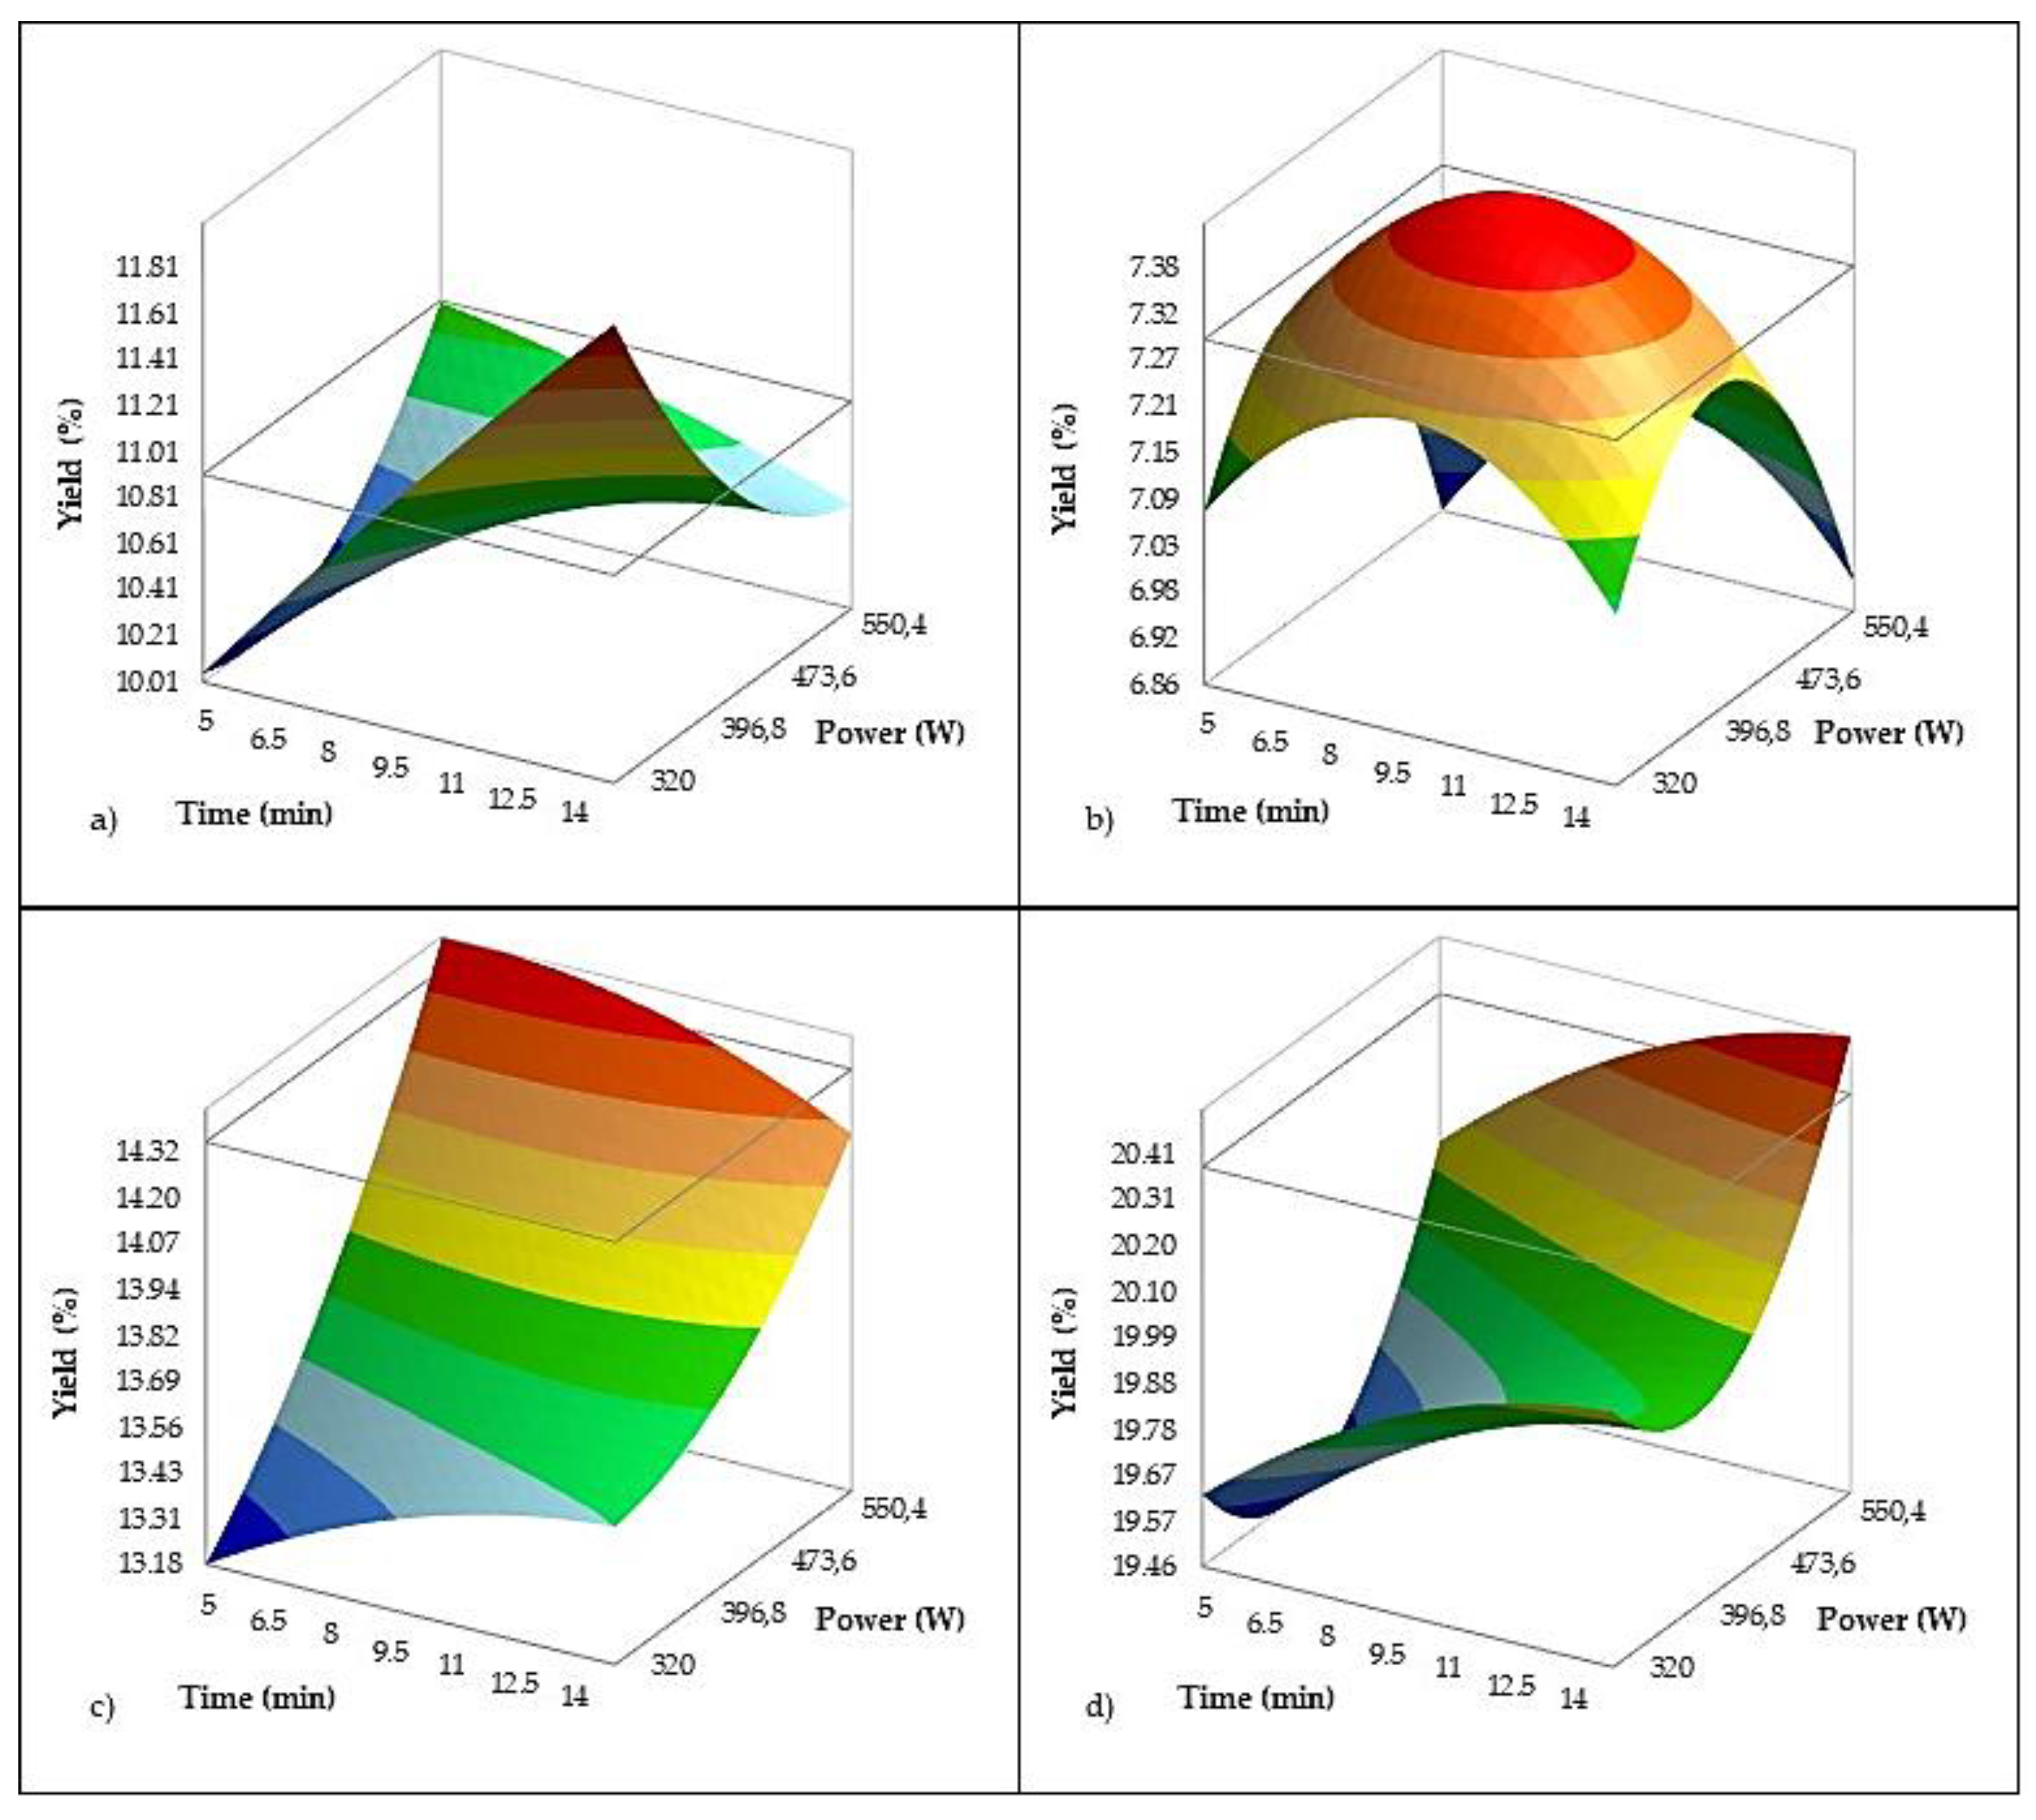
Figure 5.
3D plots describing the influence of US pretreatment parameters (treatment time and US power) on OSI (expressed as induction time in minutes) using RSM in Croatian olive varieties: a) Istarska Bjelica b) Rosulja c) Oblica and d) Levantinka. Grey line represents values for the control samples of each olive variety.
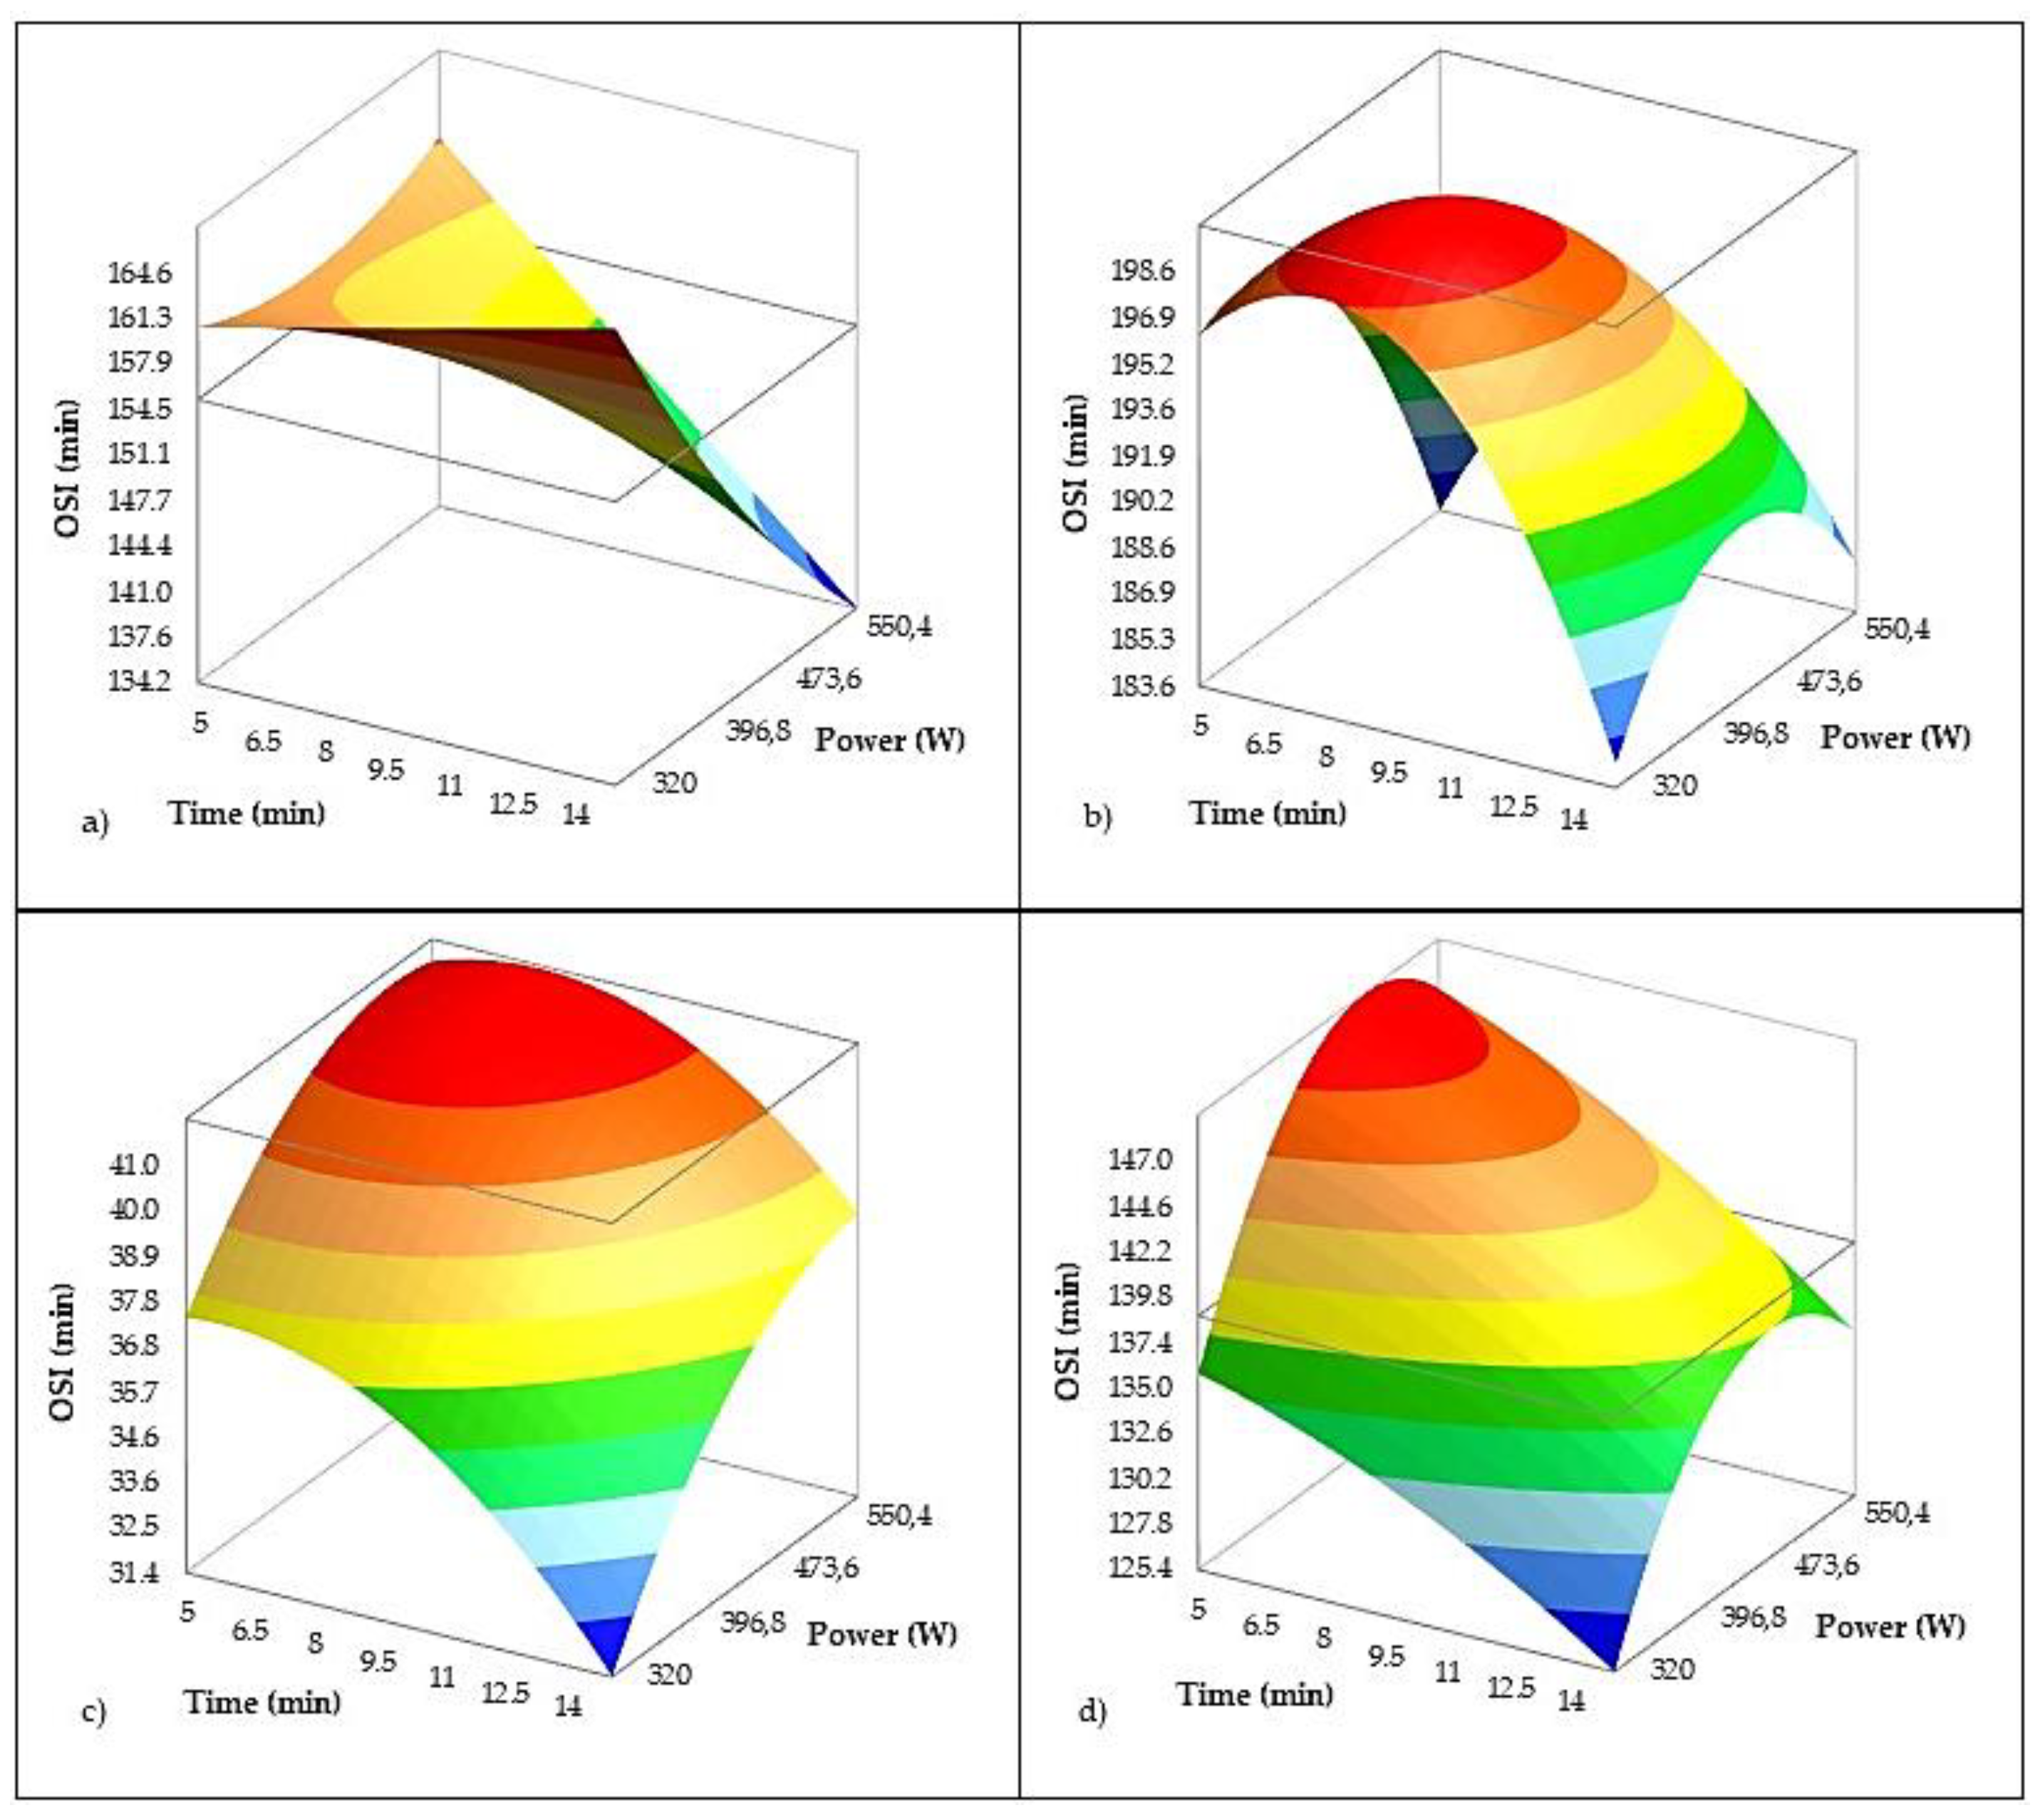
Figure 6.
3D plots describing the influence of US pretreatment parameters (treatment time and US power) on linoleic acid (mg/g) using RSM in Croatian olive varieties: a) Istarska Bjelica b) Rosulja c) Oblica and d) Levantinka. Grey line represents values for the control samples of each olive variety.
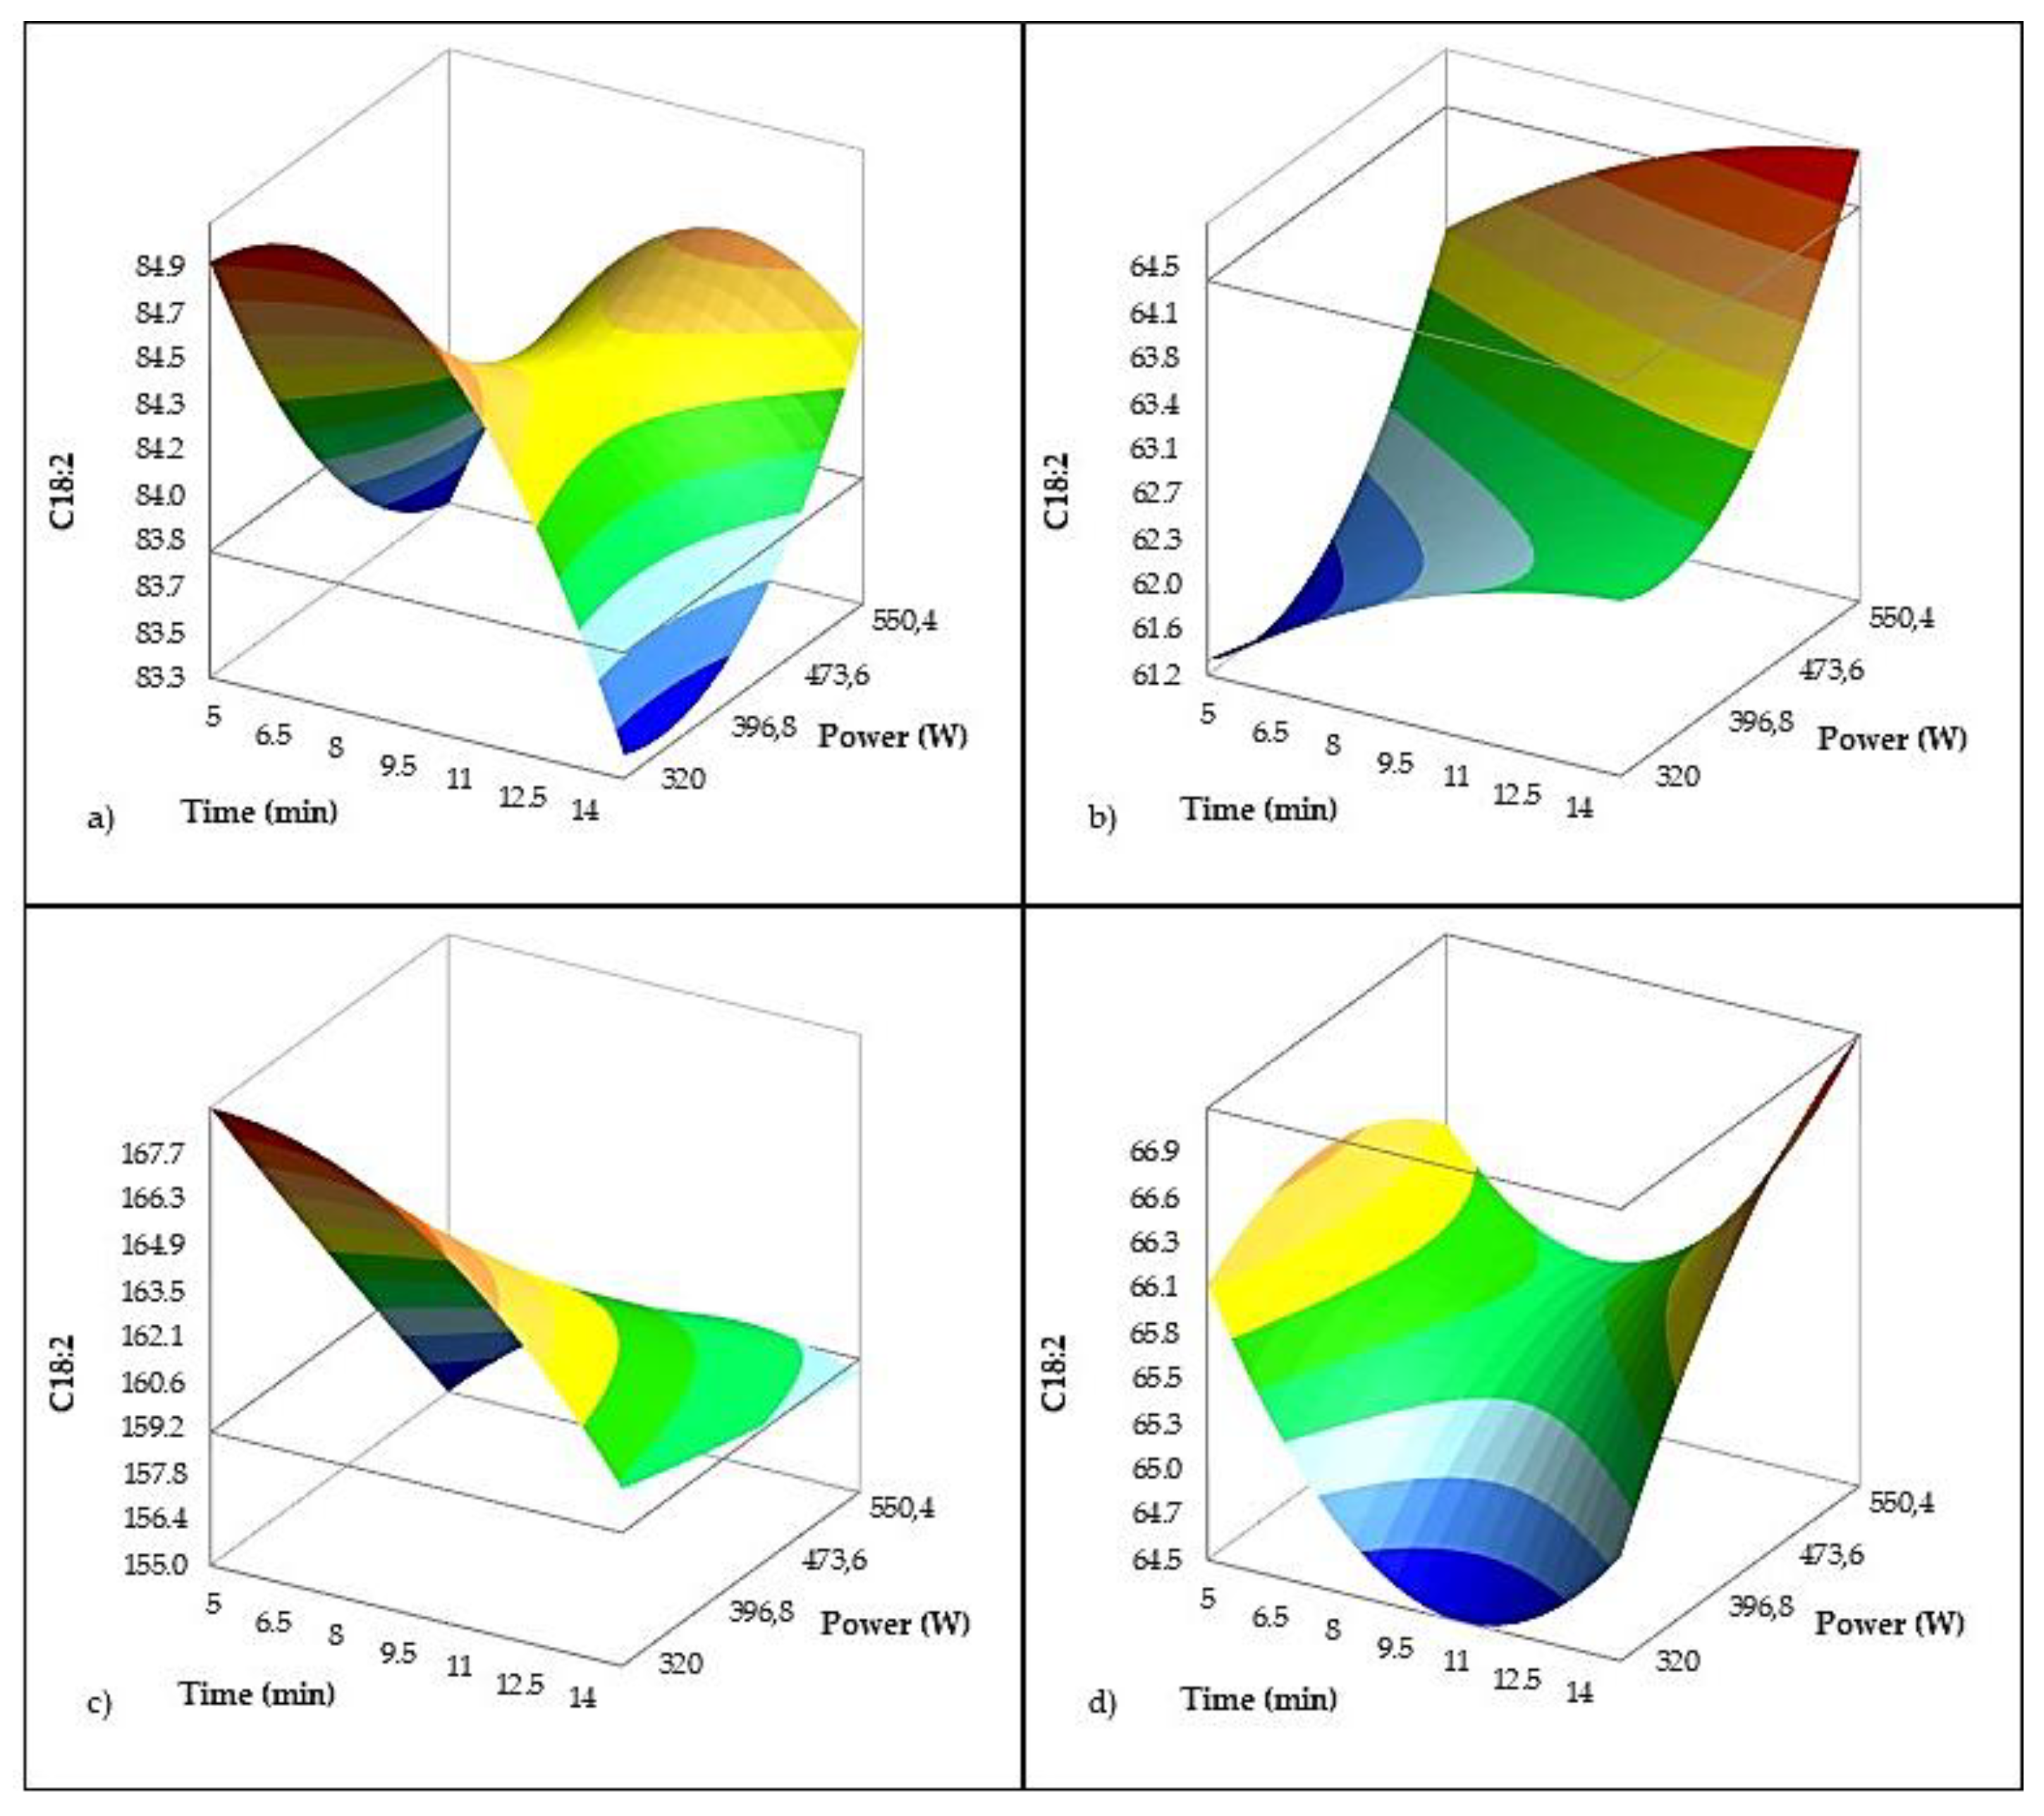
Figure 7.
3D plots describing the influence of US pretreatment parameters (treatment time and US power) on TPC using RSM in Croatian olive varieties: a) Istarska Bjelica b) Rosulja c) Oblica and d) Levantinka. Grey line represents values for the control samples of each olive variety.
Figure 7.
3D plots describing the influence of US pretreatment parameters (treatment time and US power) on TPC using RSM in Croatian olive varieties: a) Istarska Bjelica b) Rosulja c) Oblica and d) Levantinka. Grey line represents values for the control samples of each olive variety.
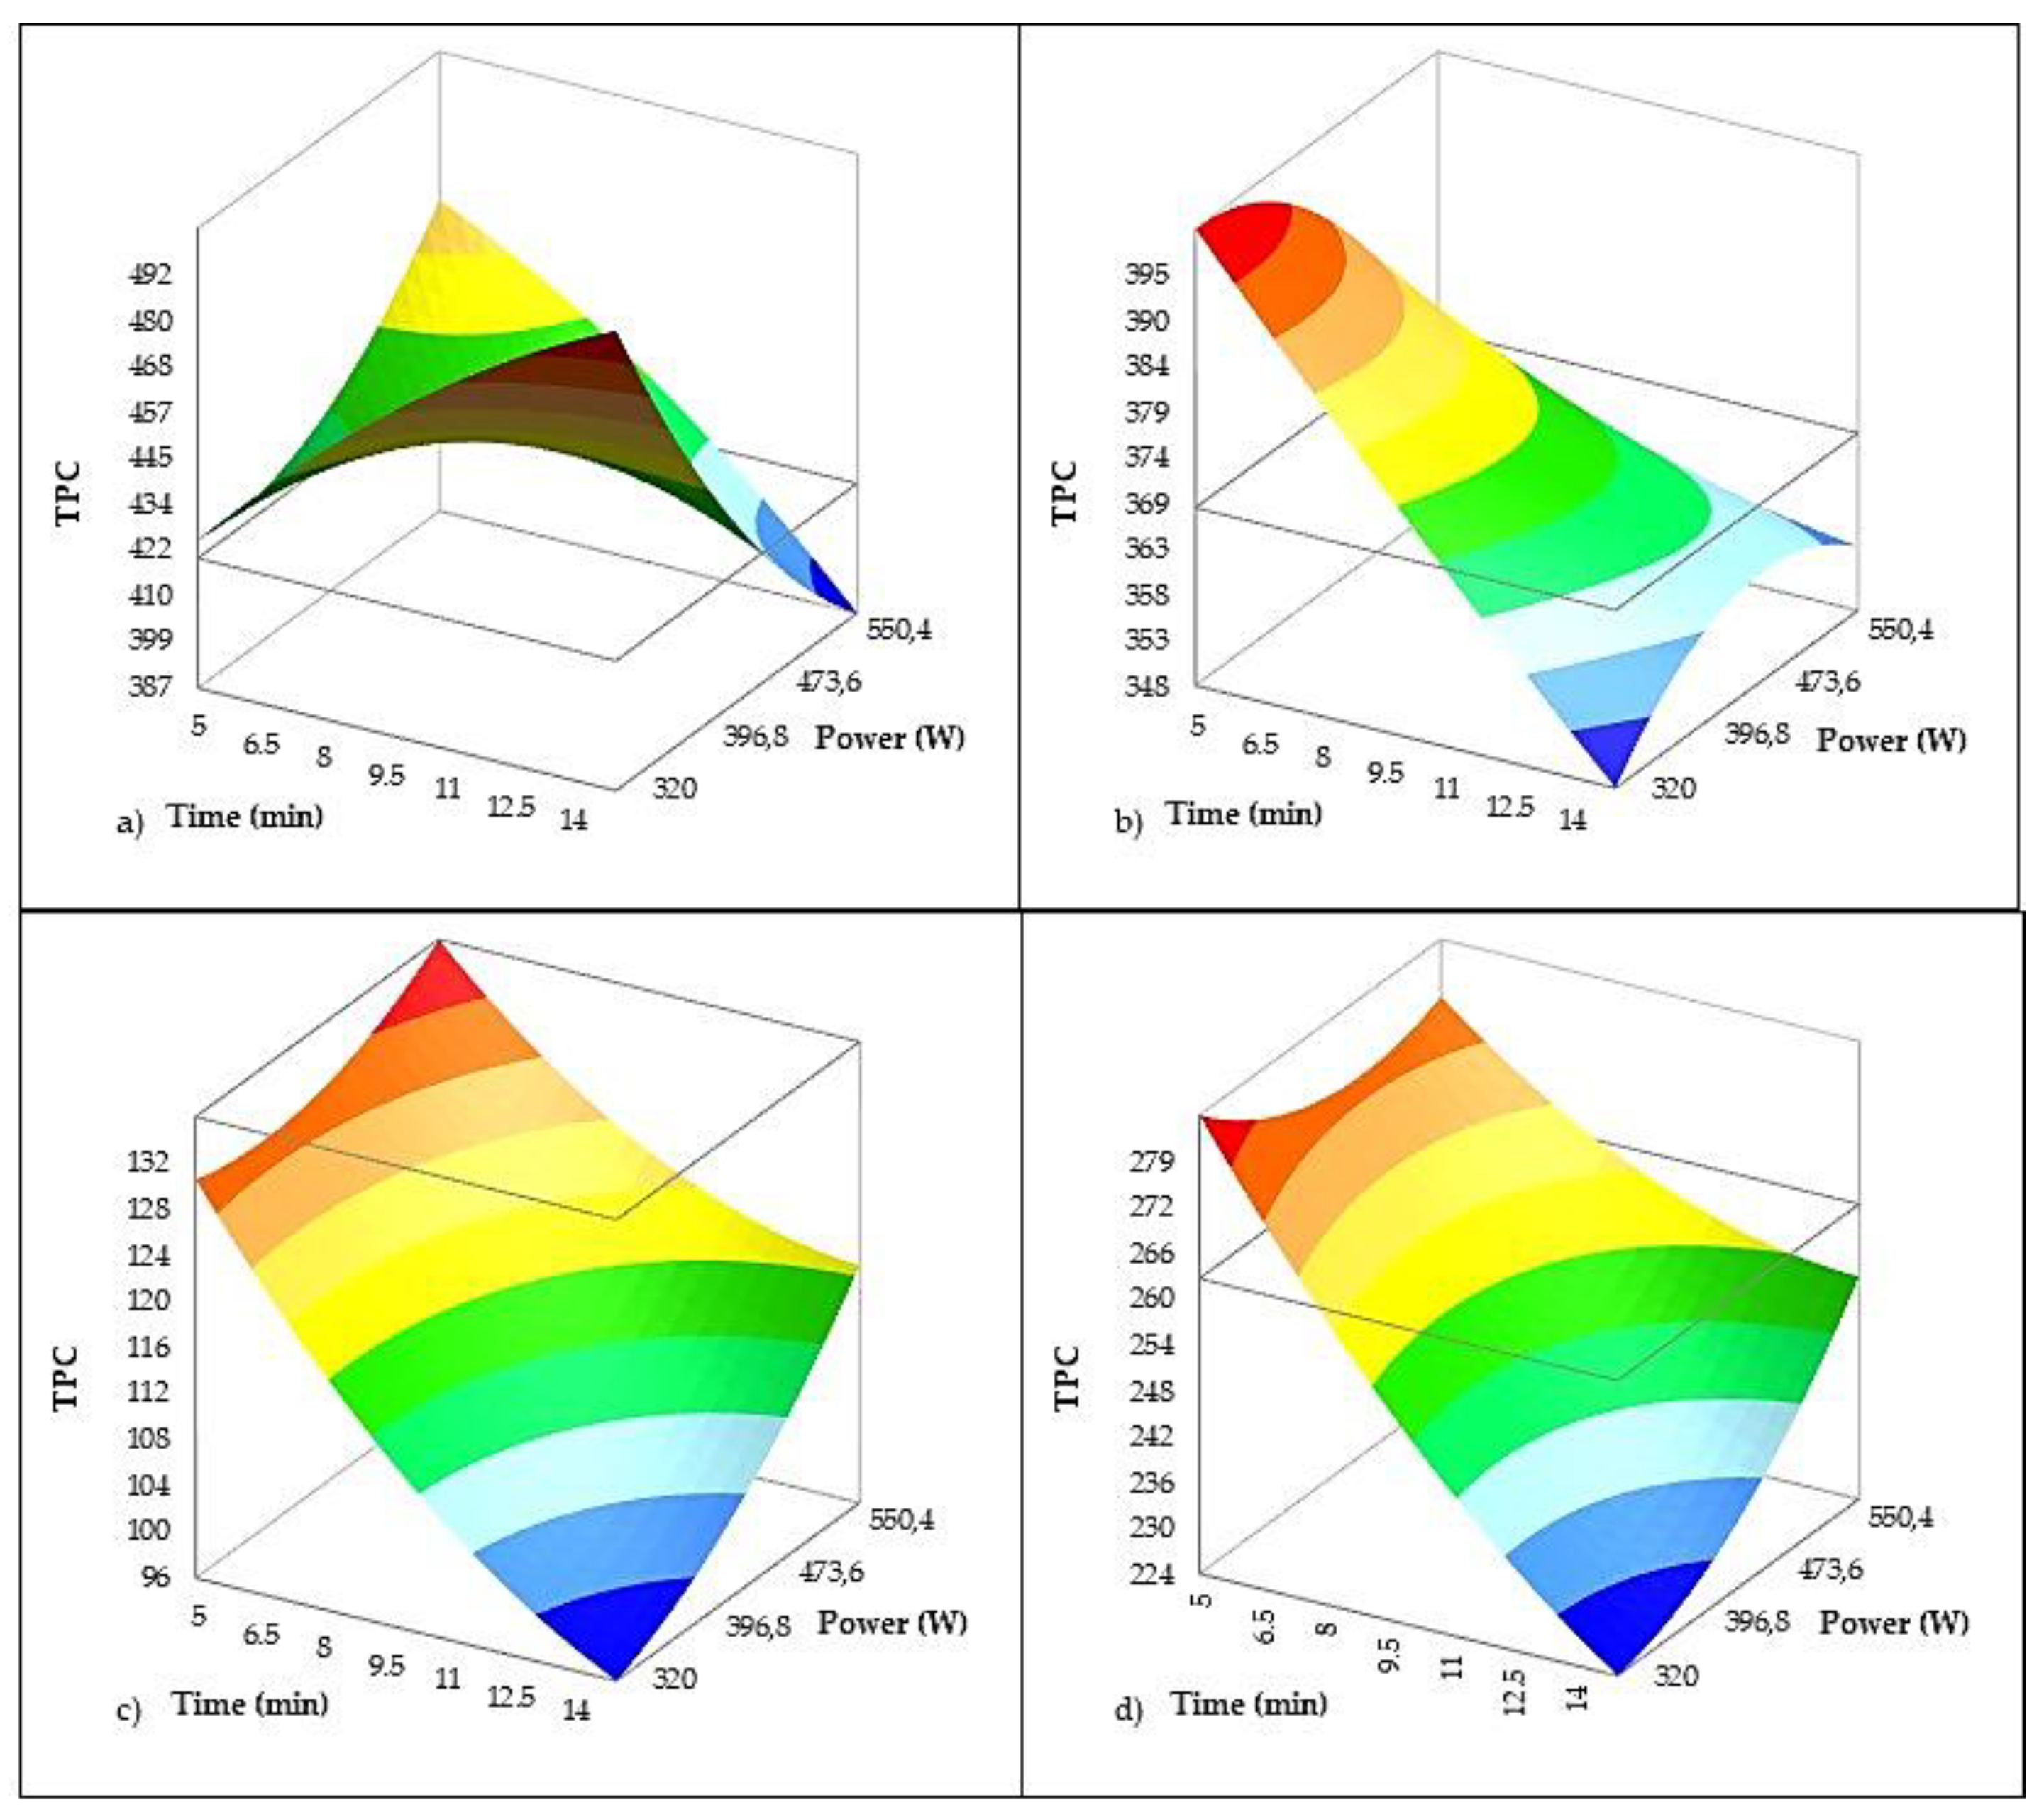
Figure 8.
3D plots describing the influence of US pretreatment parameters (treatment time and US power) on α-tocopherol content using RSM in Croatian olive varieties: a) Istarska Bjelica b) Rosulja c) Oblica and d) Levantinka. Grey line represents values for the control samples of each olive variety.
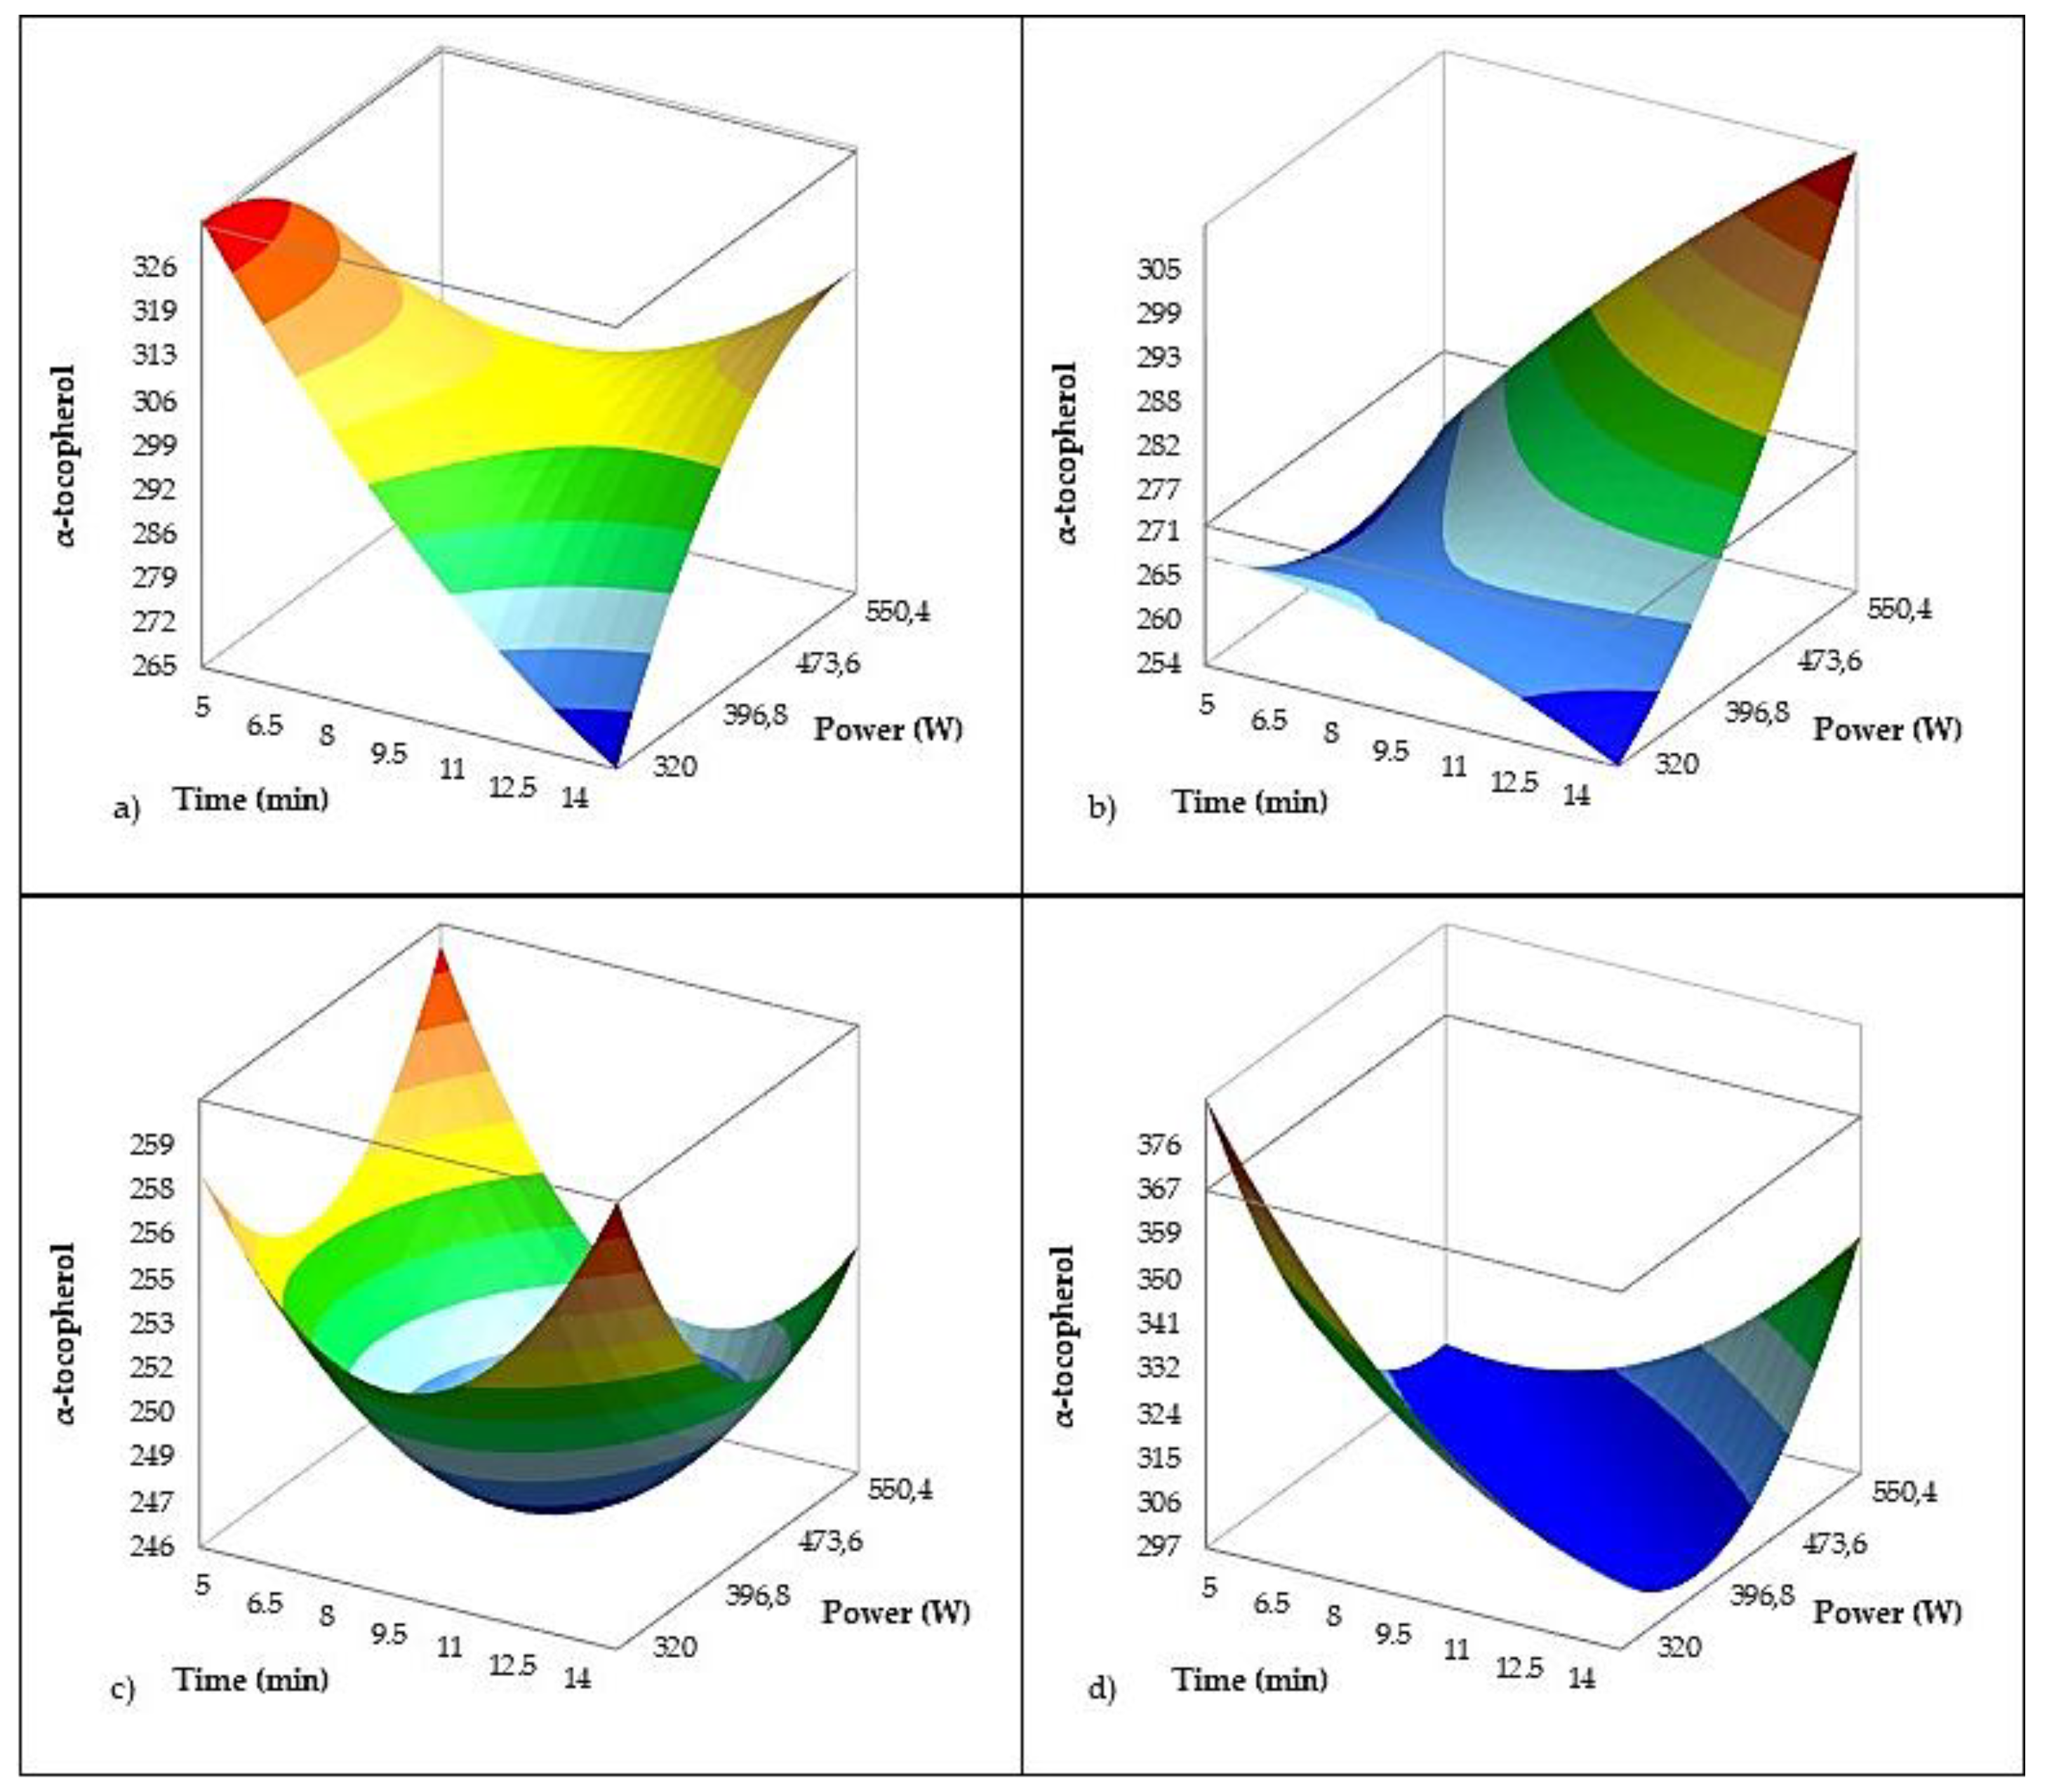
Figure 9.
3D plots describing the influence of US pretreatment parameters (treatment time and US power) on AC (expressed as % DPPH radical reduction) using RSM in Croatian olive varieties: a) Istarska Bjelica b) Rosulja c) Oblica and d) Levantinka. Grey line represents values for the control samples of each olive variety.
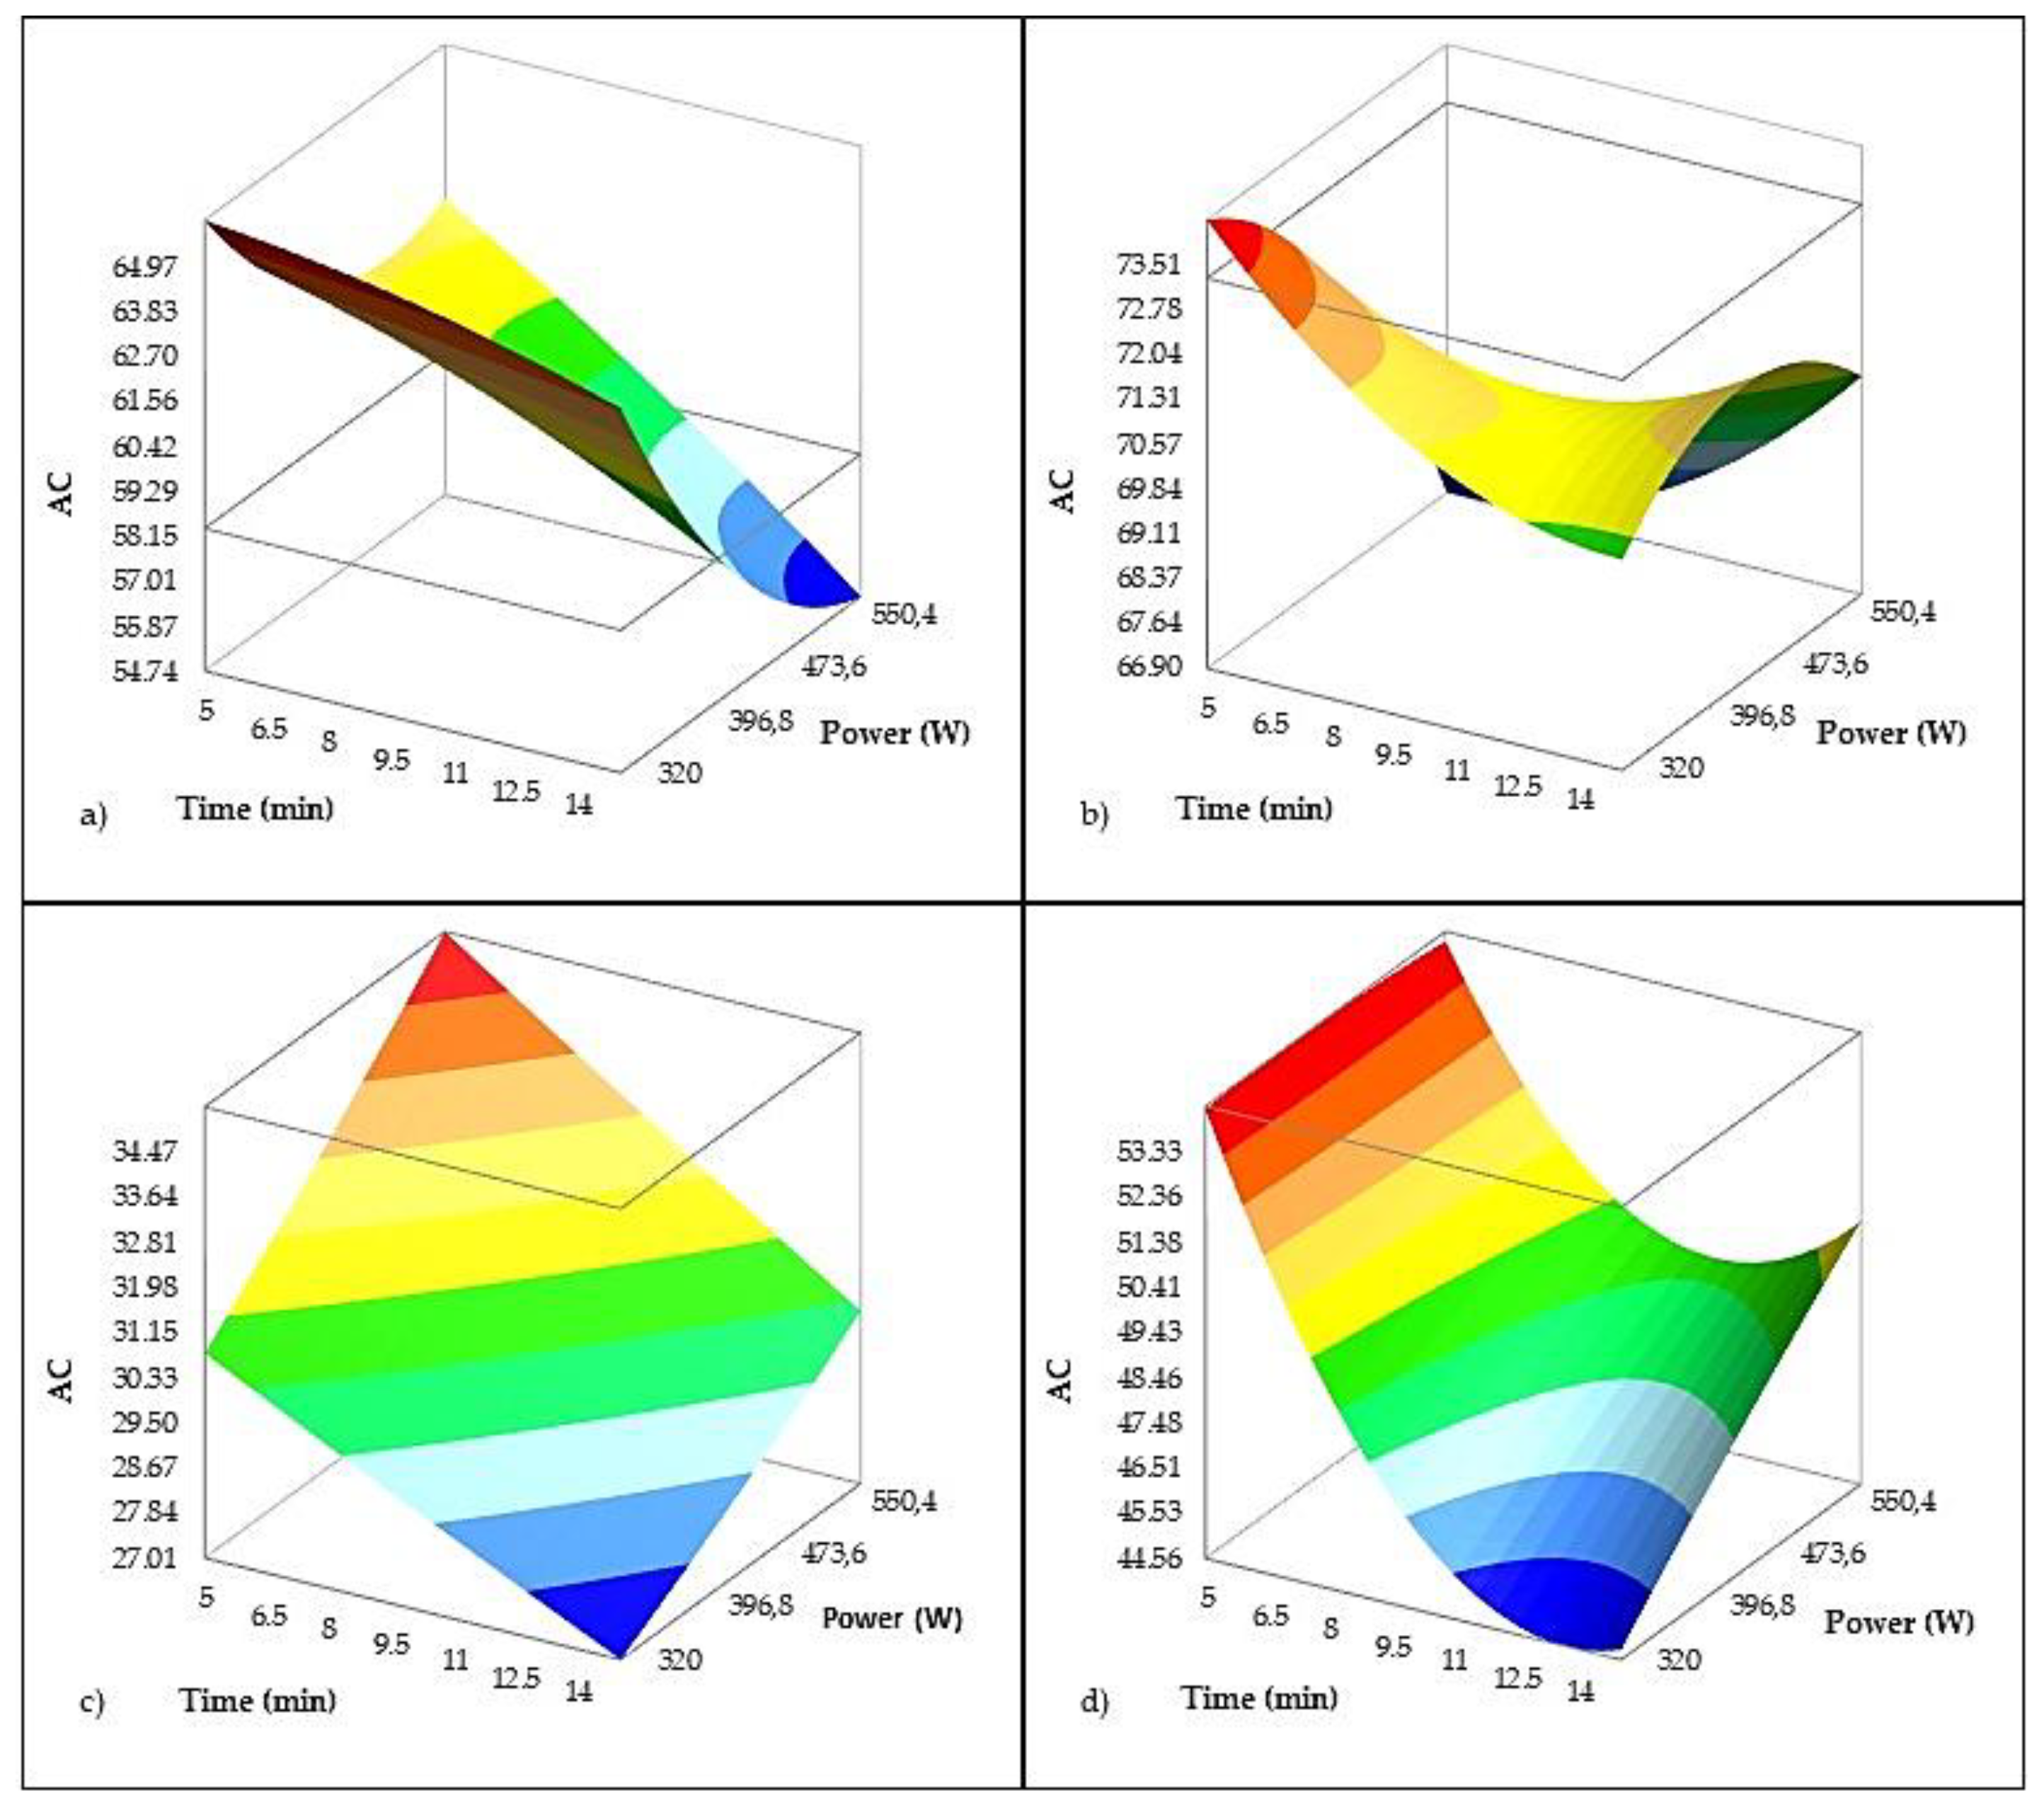
Table 1.
Central composite experiment design for VOO production.
| Sample | Treatment duration (min) | Ultrasonic bath power (W) |
|---|---|---|
| 1-control | 0 | 0 |
| 2 | 10 | 256 |
| 3 | 5 | 320 |
| 4 | 15 | 320 |
| 5 | 3 | 448 |
| 6-central | 10 | 448 |
| 7 | 17 | 448 |
| 8 | 5 | 576 |
| 9 | 15 | 576 |
| 10 | 10 | 640 |
Table 2.
The main fatty acids and fatty acid groups (saturated fatty acids – SFA, monounsaturated fatty acids – MUFA and polyunsaturated fatty acids - PUFA) expressed as % of total fatty acids in the VOO control samples of the different olive varieties.
Table 2.
The main fatty acids and fatty acid groups (saturated fatty acids – SFA, monounsaturated fatty acids – MUFA and polyunsaturated fatty acids - PUFA) expressed as % of total fatty acids in the VOO control samples of the different olive varieties.
| Fatty acids/fatty acid groups (mg/g) | p-value | Variety | |||
|---|---|---|---|---|---|
| Istarska Bjelica | Rosulja | Oblica | Levantinka | ||
| C16:0 | <0.0001 | 13.4±0.2 b | 14.1±0.1 a | 13.8±0.2 a | 11.5±0.1 c |
| C18:0 | <0.0001 | 3.1±0.1 b | 2.3±0.0 c | 2.4±0.1 c | 4.1±0.1a |
| C18:1 | <0.0001 | 70.1±0.2 c | 72.5±0.2 b | 63.7±0.5 d | 73.6±0.6 a |
| C18:2 | <0.0001 | 8.6±0.2 b | 6.6±0.0 c | 16.1±0.4 a | 6.9±0.3 c |
| SFA | <0.0001 | 17.2±0.3 a | 17.0±0.0 ab | 16.7±0.1 b | 16.3±0.2 c |
| MUFA | <0.0001 | 71.6±0.2 b | 74.3±0.2 a | 64.9±0.4 c | 74.7±0.6 a |
| PUFA | <0.0001 | 9.3±0.3 b | 7.4±0.0 c | 16.9±0.4 a | 7.5±0.4 c |
Different lowercase letters within rows indicate significant differences between the control samples for each variety obtained via a one-way ANOVA and Tukey’s post hoc test (at p ≤ 0.05).
Table 3.
The activity of endogenous enzymes (μmol/mg min) and groups of volatile compounds (mg/kg) in VOO control samples from different olive varieties.
Table 3.
The activity of endogenous enzymes (μmol/mg min) and groups of volatile compounds (mg/kg) in VOO control samples from different olive varieties.
| Activity of endogenous enzymes (μmol/mg min) | p-value | Variety | |||
|---|---|---|---|---|---|
| Istarska Bjelica | Rosulja | Oblica | Levantinka | ||
| LOX | <0.0001 | 0.120±0.012 b | 1.638±0.072 a | 0.132±0.004 b | 0.190±0.016 b |
| β-GLU | <0.0001 | n.d. b | 0.031±0.001 a | n.d. b | n.d. b |
| PPO | <0.0001 | 1.593±0.112 a | n.d. c | 0.016±0.021 c | 0.459±0.026 b |
| POX | <0.0001 | n.d. b | n.d. b | n.d. b | 0.007±0.002 a |
n.d.: not detected. Different lowercase letters within rows indicate significant differences between the control samples for each variety obtained via a one-way ANOVA and Tukey’s post hoc test (at p ≤ 0.05).
Table 4.
Volatile compounds and groups of volatile compounds (mg/kg) in VOO control samples from different olive varieties.
Table 4.
Volatile compounds and groups of volatile compounds (mg/kg) in VOO control samples from different olive varieties.
| Groups of volatile compounds (mg/kg) | p-value | Variety | |||
|---|---|---|---|---|---|
| Istarska Bjelica | Rosulja | Oblica | Levantinka | ||
| 2-Methylbutanal | 0.126 | 0.22±0.04 | 0.04±0.03 | 0.08±0.02 | 0.38±0.33 |
| Pentanal | 0.154 | 0.29±0.30 | 0.35±0.30 | n. d. | n. d. |
| 2-Pentenal | 0.834 | 0.24±0.03 | 0.16±0.11 | 0.18±0.03 | 0.19±0.19 |
| 2-Hexenal | <0.0001 | 15.27±1.31 b | 37.18±4.21 a | 9.42±0.95 b | 10.92±5.43 b |
| 2,4-Hexadienal | 0.005 | 2.92±0.23 a | 3.28±0.26 a | 2.97±0.27 a | 1.54±0.76 b |
| 4-Oxohex-2-enal | <0.0001 | 3.54±0.40 a | 2.27±0.25 b | 2.10±0.24 b | 0.52±0.38 c |
| Nonanal | 0.000 | 0.32±0.05 a | 0.36±0.06 a | 0.12±0.00 b | 0.21±0.03 b |
| 3-Hexenal + 2-Methyl-4-pentenal | <0.0001 | 14.31±0.77 a | 7.20±0.89 c | 10.32±0.94 b | 1.81±0.98 d |
| Total aldehydes | <0.0001 | 37.11±1.90 b | 50.84±4.77 a | 25.19±2.43 bc | 15.57±7.42 c |
| 1-Penten-3-ol | 0.111 | 0.39±0.41 | 1.49±1.46 | 2.51±2.51 | 5.42±3.42 |
| (E)-2-Penten-1-ol | 0.560 | 0.16±0.01 | 0.05±0.06 | 0.04±0.04 | 0.50±0.86 |
| (Z)-2-Penten-1-ol | 0.192 | 1.93±0.06 | 1.32±0.08 | 0.91±0.19 | 1.19±1.03 |
| (Z)-3-Hexen-1-ol | 0.338 | 2.20±0.26 | 1.17±2.02 | 3.39±0.10 | 2.13±1.86 |
| 2-Hexen-1-ol | 0.483 | n. d. | 0.10±0.02 | 0.05±0.05 | 0.90±1.56 |
| 1-Hexanol | 0.512 | 0.10±0.02 | n. d. | 0.57±0.11 | 1.09±1.89 |
| Total alcohols | 0.006 | 4.77±0.62 b | 4.13±1.66 b | 7.48±2.62 ab | 11.23±1.92 a |
| 1-Penten-3-one | 0.003 | 6.11±0.23 a | 1.93±1.67 b | 2.02±1.95 b | n. d. b |
| Total ketones | 0.003 | 6.11±0.23 a | 1.93±1.67 b | 2.02±1.95 b | n.d. b |
| 3-Hexenyl acetate | <0.0001 | n. d. b | 0.44±0.25 b | n. d. b | 2.69±0.42 a |
| Hexyl acetate | <0.0001 | n. d. b | n. d. b | n. d. b | 1.62±0.10 a |
| Total esters | <0.0001 | n.d. b | 0.44±0.25 b | n.d. b | 4.31±0.46 a |
| ΣLOX* | <0.0001 | 40.75±2.44 b | 51.05±2.86 a | 29.42±2.58 c | 28.45±4.86 c |
| ΣOX** | <0.0001 | 7.07±0.48 a | 6.26±0.42 ab | 5.19±0.50 b | 2.27±1.13 c |
| ΣMBA*** | 0.126 | 0.22±0.04 a | 0.04±0.03 a | 0.08±0.02 a | 0.38±0.33 a |
n.d.: not detected. Different lowercase letters within rows indicate significant differences between the control samples for each variety obtained via a one-way ANOVA and Tukey’s post hoc test (at p ≤ 0.05). * ΣLOX accounts for the sum of 2-pentenal, 2-hexenal, 3-hexenal + 2-methyl-4-pentenal, 1-penten-3-ol, (E)-2-penten-1-ol, (Z)-2-penten-1-ol, (Z)-3-hexen-1-ol, 2-hexen-1-ol, 1-hexanol, 1-penten-3-one, 3-hexenyl acetate and hexyl acetate; **ΣOX accounts for the sum of 2,4-hexadienal, 4-oxohex-2-enal, pentanal and nonanal; ***ΣMBA accounts for 2-methylbutanal.
Table 5.
The concentration of phenolic compounds and α-tocopherol (mg/kg) in VOO control samples from different olive varieties.
Table 5.
The concentration of phenolic compounds and α-tocopherol (mg/kg) in VOO control samples from different olive varieties.
| Phenolic compounds (mg/kg) | p-value | Variety | |||
|---|---|---|---|---|---|
| Istarska Bjelica | Rosulja | Oblica | Levantinka | ||
| Hydroxytyrosol | 0.157 | 2±0 | 7±2 | n.d. | 14±22 |
| Tyrosol | 0.112 | 4±0 | n.d. | 4±0 | 11±15 |
| p-Coumaric acid | <0.0001 | 3±0 b | n.d. c | 7±1 a | 3±0 b |
| Hydroxytyrosol acetate | 0.089 | n.d. | n.d. | n.d. | 1±1 |
| Oleacein | <0.0001 | 136±23 a | 145±4 a | 38±8 c | 71±18 b |
| Methyl hemiacetal of oleocanthal | <0.0001 | 19±1 b | 32±2 a | 7±4 c | 15±3 b |
| Oleuropein aglycone | <0.0001 | 85±6 b | 110±5 a | 24±11 d | 46±6 c |
| Ligstroside aglycone | <0.0001 | 78±12 a | 32±1 b | 35±3 b | 41±3 b |
| Oleocanthal | <0.0001 | 94±2 a | 42±1 d | 46±1 c | 60±4 b |
| Total | <0.0001 | 420±12 a | 368±9 b | 161±26 d | 263±30 c |
| α-tocopherol (mg/kg) | <0.0001 | 332±52 A | 272±10 B | 273±22 B | 367±18 A |
n.d.: not detected. Different letters within rows indicate significant differences between the control samples for each variety obtained via a one-way ANOVA and Tukey’s post hoc test (at p ≤ 0.05).
Disclaimer/Publisher’s Note: The statements, opinions and data contained in all publications are solely those of the individual author(s) and contributor(s) and not of MDPI and/or the editor(s). MDPI and/or the editor(s) disclaim responsibility for any injury to people or property resulting from any ideas, methods, instructions or products referred to in the content. |
© 2025 by the authors. Licensee MDPI, Basel, Switzerland. This article is an open access article distributed under the terms and conditions of the Creative Commons Attribution (CC BY) license (http://creativecommons.org/licenses/by/4.0/).
Copyright: This open access article is published under a Creative Commons CC BY 4.0 license, which permit the free download, distribution, and reuse, provided that the author and preprint are cited in any reuse.


