
Submitted:
07 July 2025
Posted:
08 July 2025
You are already at the latest version
Abstract
Grain chalkiness is an undesirable trait that significantly compromises rice quality, attracting considerable attention from both consumers and breeders. In this study, we characterized the role of the autophagy-related gene OsATG4b in rice grain development. OsATG4b was predominantly expressed in the endosperm. Compared with wild-type plants, OsATG4b-overexpressing lines exhibited significantly reduced grain chalkiness, whereas OsATG4b knockout mutants displayed a marked increase in chalkiness. Importantly, OsATG4b had no significant effect on other major agronomic traits. Ultrastructure analysis of the endosperm and evaluation of seed storage components revealed that the chalky endosperm in osatg4b mutants contained loosely packed starch granules, aberrant protein bodies, and reduced levels of seed storage proteins. Furthermore, gene expression analysis indicated that OsATG4b regulates the expression of genes involved in storage protein biosynthesis. Together, these findings demonstrate that OsATG4b plays a critical regulatory role in determining grain chalkiness in rice.
Keywords:
rice
; grain quality
; autophagy
; OsATG4b
1. Introduction
Rice (Oryza sativa L.) is a staple food crop for more than half of the global population. With ongoing economic development and rising living standards, there is increasing demand for high-quality rice [1]. Rice quality is generally evaluated based on four key attributes: appearance, eating and cooking quality, milling quality, and nutritional value [2,3,4]. Among these, chalkiness refers to the opaque regions in the rice endosperm; it is an undesirable trait for the appearance quality of rice and is also negatively correlated with milling and cooking quality [5,6]. Thus, chalkiness not only reduces consumer preference but also compromises its commercial value.
Chalkiness is a complex quantitative trait controlled by multiple genes and highly sensitive to environmental conditions [7,8]. In particular, elevated temperatures during the grain-filling stage have been shown to significantly increase the proportion of chalky grains [9,10]. Generally, the formation of chalkiness results from loosely packed or abnormally developed starch granules (SGs) and protein bodies (PBs) [11,12]. Notably, starch and storage proteins account for approximately 85% and 10% of the dry weight of rice grains, respectively. Disruptions in the biosynthesis or deposition of these storage substances can lead to structural defects in the endosperm, ultimately manifesting as chalkiness [13,14]. Therefore, understanding the physiological and molecular mechanisms regulating starch and protein accumulation during grain development is essential for improving rice grain quality.
Autophagy is a highly conserved intracellular degradation and recycling process in all eukaryotic organisms, including yeast, plants, and mammals [15,16,17]. In plants, autophagy plays essential roles in a wide range of physiological processes, such as growth, development, immune responses, and senescence. It is also strongly induced under adverse environmental conditions, including nutrient deprivation and various abiotic stresses [17,18,19]. This catabolic process involves the de novo formation of double-membrane vesicles known as autophagosomes, which sequester cytoplasmic components and deliver them to the vacuole for degradation and recycling. The molecular machinery underlying autophagy comprises a set of core autophagy-related (ATG) proteins [20,21]. Among these, the ATG8 and ATG12 conjugation systems are central to autophagosome formation. Specifically, the covalent linkage of ATG8 to the membrane lipid phosphatidylethanolamine (PE) is a critical step required for autophagosome expansion and maturation [22,23,24].
ATG4 is a cysteine protease that plays a dual and indispensable role in the autophagy pathway. It mediates both the initial cleavage of ATG8 to expose a C-terminal glycine residue necessary for lipid conjugation, and the subsequent deconjugation of ATG8–PE to allow recycling of ATG8 [25,26,27]. In Arabidopsis thaliana, two ATG4 isoforms, AtATG4a and AtATG4b, have been identified. Functional studies have shown that ATG4-mediated autophagy is essential for proper root system development under nutrient-deficient conditions [27]. Moreover, the activity of both AtATG4a and AtATG4b is subject to redox regulation and can be reversibly inhibited under oxidative conditions and hydrogen sulfide [28,29]. In rice, recent studies have shown that the natural variations of an ATG4 gene, OsATG4a, contributes to grain size and weight, playing a role in the divergence of grain size between indica and japonica subspecies [30]. However, despite these advances, the potential roles of rice ATG4 genes in the regulation of grain chalkiness remain largely unexplored.
In this study, we identified an autophagy-related gene, OsATG4b, which plays a crucial role in determining grain chalkiness in rice. OsATG4b was predominantly expressed in the endosperm. Knockout of OsATG4b resulted in increased grain chalkiness, whereas its overexpression significantly reduced grain chalkiness. Loss of OsATG4b function disrupted the normal ultrastructure of starch granules (SGs) and protein bodies (PBs), and lead to decreased accumulation of seed storage proteins in the endosperm. Further investigation demonstrated that OsATG4b regulates the expression of genes involved in storage protein biosynthesis during seed development. Collectively, these findings demonstrate that OsATG4b plays a vital role in regulating endosperm development and rice grain appearance quality.
2. Results
2.1. Identification of Rice OsATG4b Protein
To identify ATG4 homologs in rice, BLASTP searches were conducted against the UniProt database using the yeast ATG4 protein sequence as a query. Two rice homologs, OsATG4a and OsATG4b, were identified, exhibiting 28.3% and 27.15% sequence identity with yeast ATG4, respectively (Figure 1A). These two rice proteins share 87.97% sequence similarity with each other and possess a predicted Peptidase C54 catalytic domain, a conserved feature of the ATG4 protein family (Figure 1A,B). To further investigate the evolutionary conservation of ATG4 proteins, additional homologs were retrieved from representative species of algae, plants, and mammals. We performed a phylogenetic analysis based on their amino acid sequences (Figure 1C). The broad distribution of ATG4 homologs among plants, fungi, algae, and animals underscores the conserved role of ATG4 in autophagy throughout eukaryotic evolution.
2.2. Expression Patterns of OsATG4a and OsATG4b
To explore the expression patterns of OsATG4a and OsATG4b, tissue-specific transcriptome data were retrieved from the RiceXPro database [31]. Heatmap analysis revealed distinct expression profiles for the two genes across different rice tissues and developmental stages (Figure 2A). OsATG4a was predominantly expressed in reproductive organs, including the inflorescence, pistil, and lemma, whereas OsATG4b showed higher expression levels in the root, stem, and late-stage endosperm. These observations were consistent with gene expression patterns obtained from the eFP Rice database (Figure 2B). To validate the transcriptome data, Quantitative real-time PCR (qRT-PCR) was performed using gene-specific primers on RNA extracted from different tissues of field-grown wild-type rice, including root, stem, leaf sheath, panicle, and seed. Both genes were expressed in all examined tissues (Figure 2C). Notably, OsATG4a expression was enriched in the panicle, while OsATG4b showed markedly higher expression in the seed. These differential expression patterns suggest OsATG4a and OsATG4b may play distinct functional roles in specific tissues during rice development.
2.3. Generation and Phenotypic Characterization of OsATG4a and OsATG4b Knockout Mutants
To investigate whether OsATG4a and OsATG4b have distinct functions in rice, we generated knockout mutants in the Nipponbare (Nip) background using CRISPR/Cas9-mediated genome editing. Target sites were designed within the coding regions of both genes (Figure 3A). Two OsATG4a mutant alleles, osatg4a-1 and osatg4a-2, harbored 2-bp and 1-bp deletions (Figure 3A), respectively, leading to premature stop codons at the 146th and 129th amino acid positions (Figure 3B). Similarly, two OsATG4b mutant alleles, osatg4b-1 and osatg4b-2, carried a 1-bp insertion and a 2-bp deletion (Figure 3A), respectively, resulting in premature stop codons at the 75th and 89th amino acid positions (Figure 3B).
Compared with the wild type, OsATG4a knockout mutants exhibited significantly increased grain length, grain width, and 1000-grain weight (Figure 4A–E), consistent with previous findings identifying OsATG4a as a negative regulator of grain size and weight in rice [30]. In contrast, the knockout of OsATG4b did not result in significant changes in these grain morphology traits (Figure 4A–E). Given the high expression of OsATG4b in the endosperm, we further examined grain appearance in the OsATG4b knockout mutants. The osatg4b-1 and osatg4b-2 mutants displayed markedly increased chalkiness compared to the wild type, as reflected by higher chalky grain rate (CGR) and degree of chalkiness (DC) (Figure 4F–H). Conversely, OsATG4a knockout mutants showed no significant difference in chalkiness (Figure 4F–H).
Furthermore, no significant differences were observed in major agronomic traits—including plant height, seed-setting rate, tiller number, heading date, number of primary and secondary branches, panicle length, and grain number per panicle—between the OsATG4a and OsATG4b knockout mutants and wild-type plants (Figure 5).
2.4. Overexpression of OsATG4b Decreases Grain Chalkiness
To further investigate the role of OsATG4b in regulating grain chalkiness, transgenic lines overexpressing OsATG4b under the control of the ubiquitin promoter were generated in the Nip background. Quantitative RT-PCR analysis confirmed that OsATG4b transcript levels were significantly elevated in the overexpression (OE) lines, with OE1 and OE2 showing 8.0- and 8.4-fold increases, respectively, compared with the wild type (Figure 6A). Under field conditions, the OE lines did not show significant differences from the wild-type plants in key agronomic traits, including tiller number, 1000-grain weight, seed-setting rate, and plant height (Figure 6B–E). However, the OE lines produced more transparent grains and exhibited significantly reduced CGR and DC relative to the wild type (Figure 6F–H).
2.5. Altered Structure and Composition of Seed Storage Substances in osatg4b Endosperm
Grain chalkiness is often associated with alterations in endosperm ultrastructure and the composition of seed storage components. To evaluate these changes, scanning electron microscopy was used to examine the morphology of SGs in the endosperm of wild-type and OsATG4b mutant plants. In wild-type grains, SGs were regularly polyhedral and tightly packed. In contrast, SGs in the OsATG4b knockout mutants were smaller, round, and loosely arranged (Figure 7A). To further assess the structure of PBs, transmission electron microscopy was conducted on endosperm sections at 12 days after flowering (DAF). Wild-type endosperm displayed abundant and well-defined PBs, including irregularly shaped PBII and spherical PBI structures (Figure 7B). However, aberrant PBs were observed in the endosperm of OsATG4b mutants (Figure 7B). These results indicate that the morphology of both SGs and PBs was disrupted in the absence of OsATG4b function.
To examine whether these structural abnormalities were associated with altered storage compound accumulation, we quantified the storage component content of mature seeds. While total starch and amylose contents were comparable between OsATG4b mutants and Nip, total protein content was significantly reduced in the mutants (Figure 7C–E). Further analysis of individual protein fractions showed significant reductions in glutenin, prolamin, albumin, and globulin levels (Figure 7F–I). These findings suggest that the increased grain chalkiness observed in OsATG4b mutants is associated with defective accumulation and organization of storage substances in the endosperm.
2.6. OsATG4b Mutation Alters Expression of Storage Protein Genes Without Affecting Starch Biosynthesis
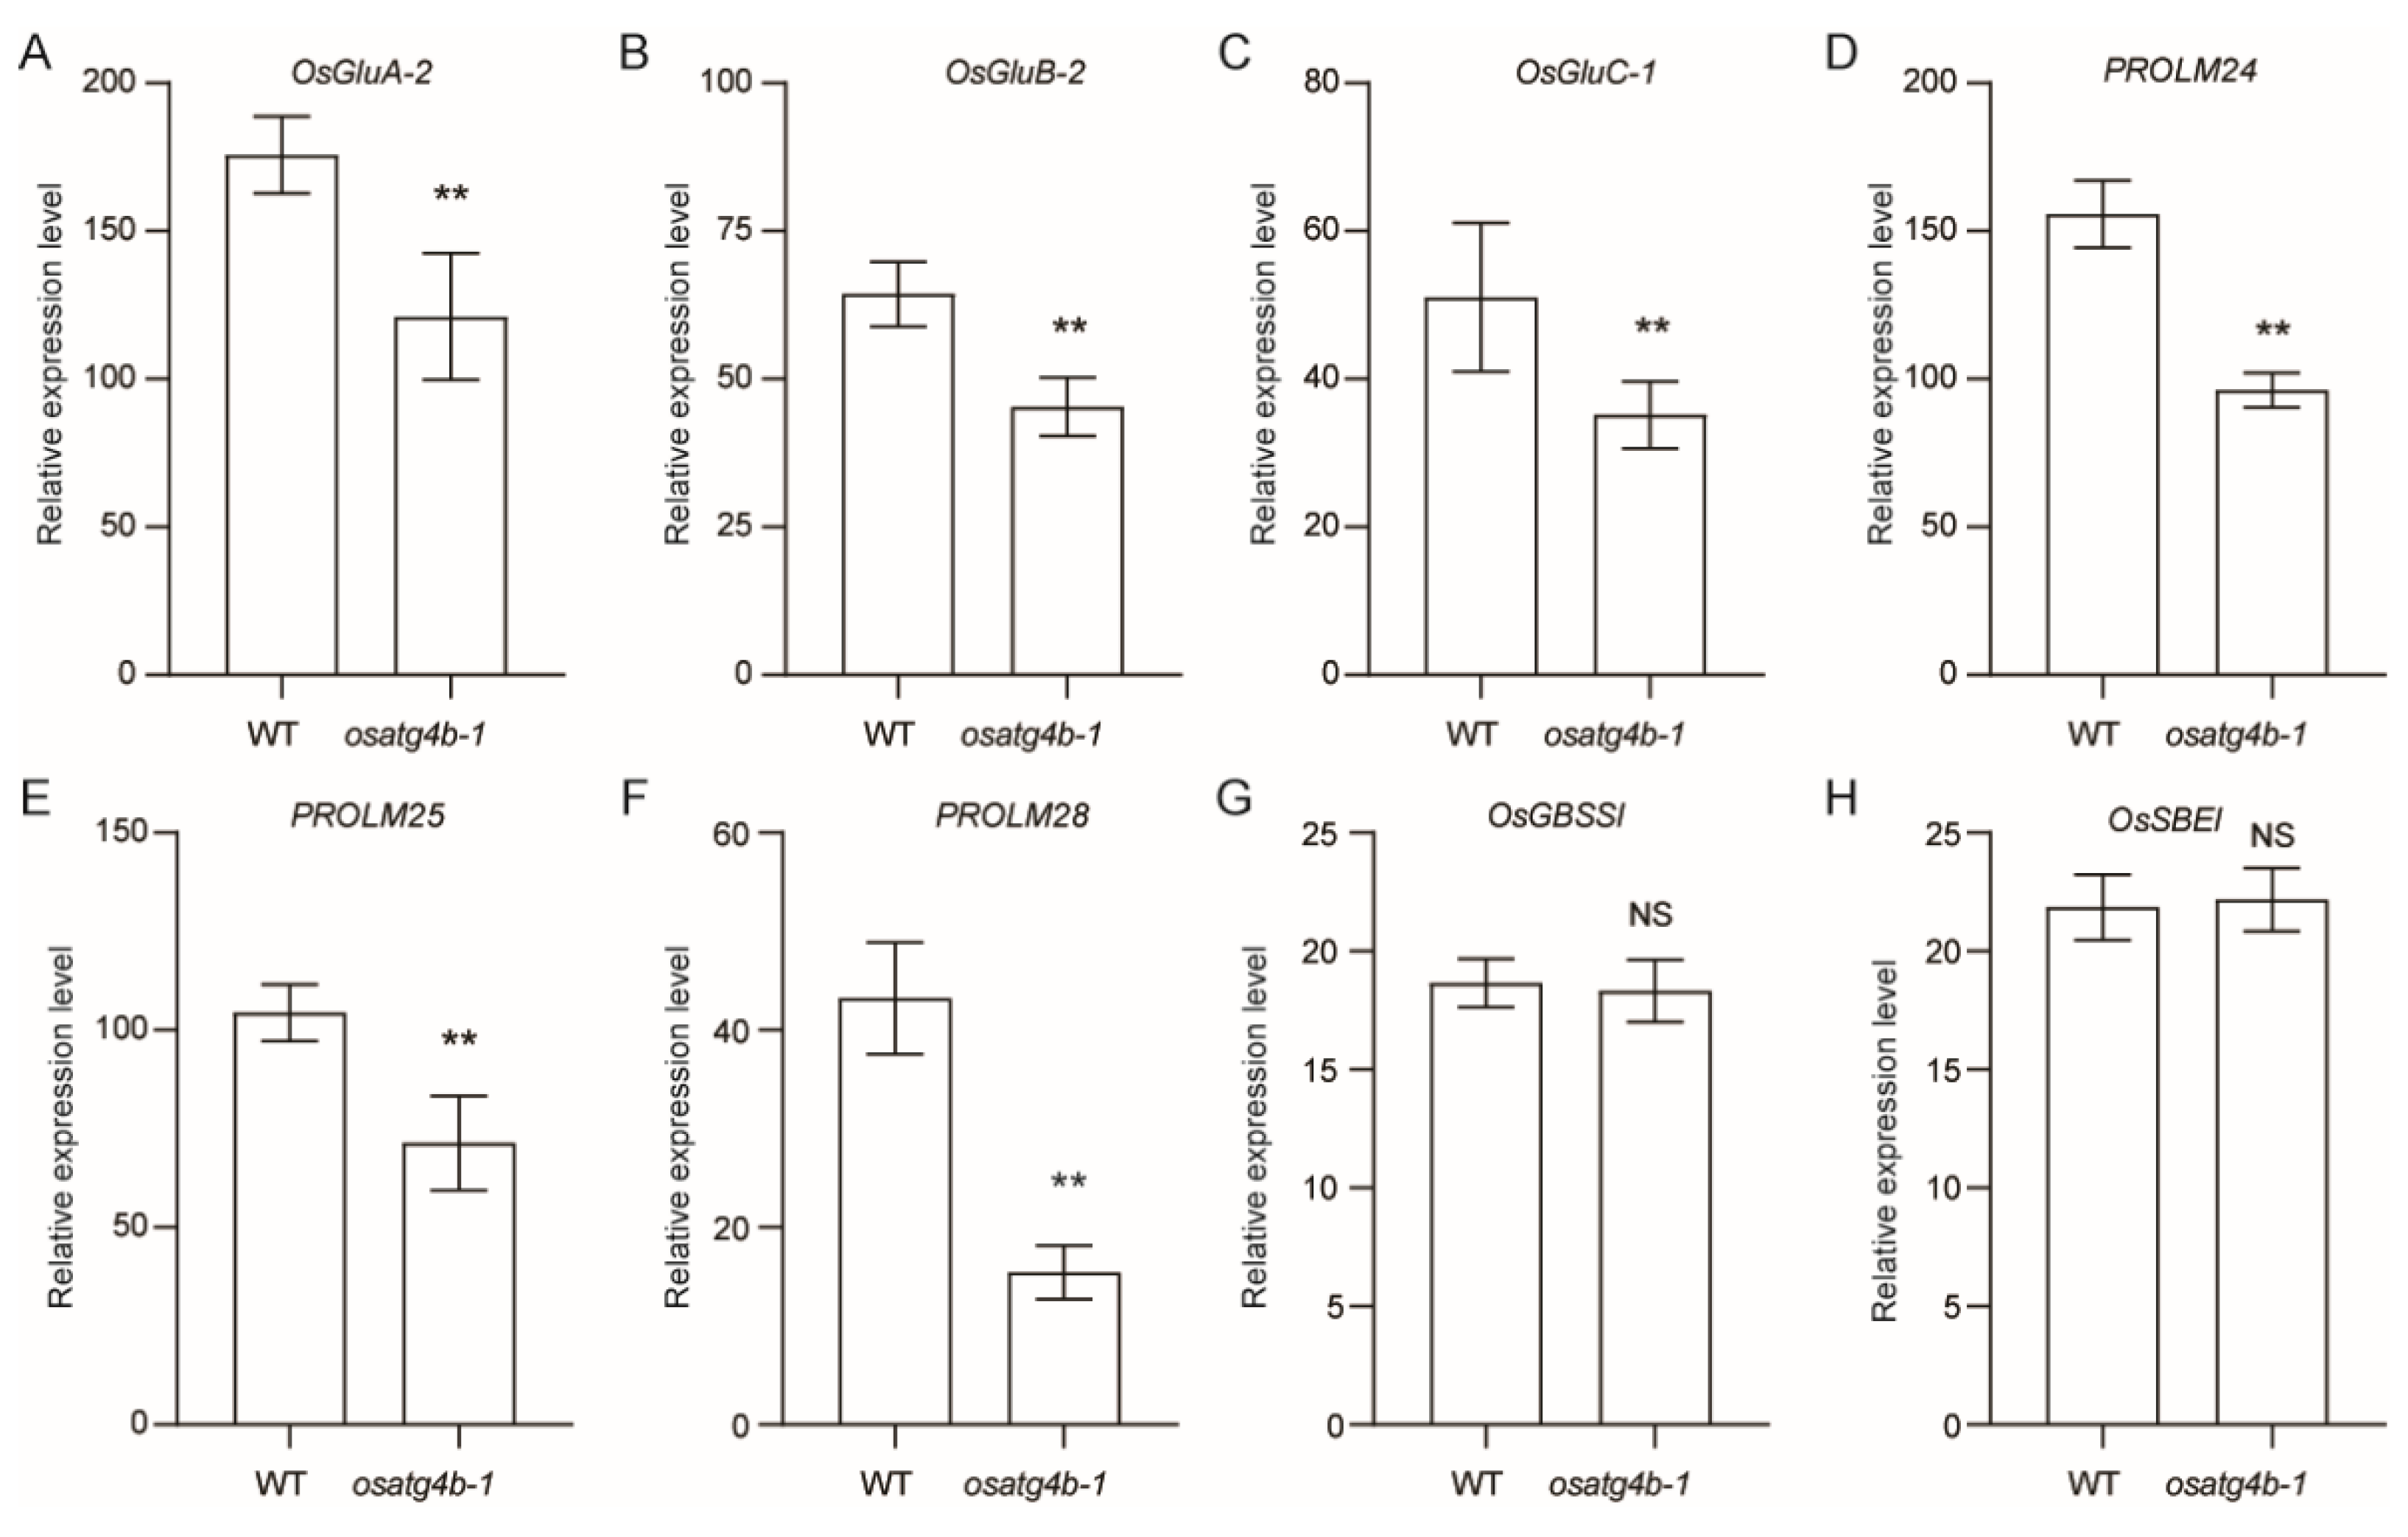
To investigate the basis of altered grain chalkiness phenotype in the osatg4b mutant, qRT-PCR analysis was performed on selected genes involved in storage protein and starch biosynthesis. The expression levels of OsGluA-2, OsGluB-2, OsGluC-1, PROLM24, PROLM25, and PROLM28 were significantly downregulated in osatg4b-1 relative to WT (Figure 8A–F). In contrast, OsGBSSI and OsSBEI transcript levels remained unchanged (Figure 8G,H), suggesting that OsATG4b primarily regulates storage protein-related gene expression during seed development.
3. Discussion
ATG4 plays a central role in the autophagy pathway by processing ATG8 precursors, a critical step required for autophagosome formation and recycling [25,27,28]. To better understand the functional significance and potential divergence of ATG4 homologs in rice, we investigated the roles of OsATG4a and OsATG4b. Despite their high amino acid sequence similarity, OsATG4a and OsATG4b have distinct expression patterns. OsATG4a is preferentially active in reproductive tissues, whereas OsATG4b is predominantly expressed in the endosperms (Figure 2). Functionally, OsATG4a regulates grain size, while OsATG4b is involved in grain chalkiness (Figure 4 and Figure 5). These results suggest that functional divergence between OsATG4a and OsATG4b is closely aligned with their distinct expression patterns.
Autophagy is known to play essential roles in plant growth, development, and stress responses. In rice, autophagy has been implicated in diverse physiological processes such as nutrient remobilization, leaf senescence, pollen maturation, flowering, and grain size [30,32,33,34,35,36]. Despite these advances, the regulatory mechanisms governing autophagy activity in specific tissues, such as the endosperm, remain poorly understood. In particular, the grain quality regulation of autophagy during grain development is still largely unexplored. Here, we found that loss of function of OsATG4b disrupted the morphology of starch granules and the organization of protein bodies in the endosperm, accompanied by a marked reduction in total protein content (Figure 7). Notably, the expression levels of multiple storage protein genes were significantly downregulated in osatg4b mutants (Figure 8), indicating that OsATG4b may contribute to grain chalkiness by modulating the expression or accumulation of storage proteins during grain filling. Given the known roles of autophagy in endoplasmic reticulum (ER) quality control and storage protein turnover [37,38,39], it is plausible that OsATG4b regulates grain chalkiness through autophagy-mediated regulation of protein homeostasis in the endosperm.
Considering its specific expression in endosperm and its functional impact on chalkiness, OsATG4b holds promise as a genetic target for improving rice grain quality. Overexpression of OsATG4b significantly reduced grain chalkiness without negatively affecting key agronomic traits (Figure 6), highlighting its potential utility in molecular breeding programs aimed at enhancing rice appearance quality and commercial value. Our findings reveal a previously uncharacterized role for OsATG4b in endosperm development, likely through selective modulation of storage protein pathways, and broaden the known functional repertoire of autophagy-related genes in crop species.
Despite these insights, several key questions remain. It is yet to be determined whether OsATG4b directly regulates the transcription of storage protein genes or acts indirectly through autophagy-mediated ER quality control. Additionally, potential crosstalk between OsATG4b and transcriptional regulators of endosperm development, such as RISBZ1 and RPBF [40,41,42], remain to be elucidated. Future studies employing protein-protein interaction assays, real-time tracking of autophagosome dynamics, and analyses of ER stress markers will be critical for dissecting the precise molecular mechanisms by which OsATG4b influences storage protein accumulation and grain quality in rice.
4. Materials and Methods
4.1. Plant Materials and Growth Conditions
The rice cultivar used in this study was the japonica variety Nipponbare (Nip). Wild-type and transgenic lines were cultivated under natural field conditions either at the experimental paddy fields of Yangzhou University (Jiangsu Province, China) or in Lingshui, Hainan Province, depending on seasonal schedules. All plants were cultivated during the normal rice-growing seasons. For each genotype, plants were arranged in two rows with 10 plants per row. The spacing between plants within each row was 18 cm, and the distance between adjacent rows was 25 cm. Field management followed standard agricultural practices. All lines were grown under similar conditions to ensure comparability in phenotypic evaluation.
4.2. CRISPR/Cas9-Mediated Knockout of OsATG4a and OsATG4b
To generate knockout mutants of OsATG4a and OsATG4b, a CRISPR/Cas9 system based on the binary vector pYLCRISPR/Cas9-MH was employed. Gene-specific 20-bp guide RNA (gRNA) target sequences were designed using the CRISPRdirect online tool to ensure high specificity [43]. Synthesized oligonucleotides corresponding to the gRNA sequences were annealed, digested, and ligated into an intermediate CRISPR/gRNA vector. The resulting gRNA expression cassettes were then cloned into the final pYLCRISPR/Cas9-MH vector. The recombinant plasmids were introduced into Agrobacterium tumefaciens strain EHA105 via electroporation. Transformed colonies were then used for Agrobacterium-mediated transformation of Nip calli. To verify gene editing events, genomic DNA was extracted from T0 transgenic plants, and the regions flanking the target sites were amplified by PCR using gene-specific primers. PCR amplicons were subjected to Sanger sequencing, and resulting chromatograms were analyzed using the online tool DSDecode [44] to identify insertions or deletions (indels) at the target sites. Primers sequences used for genotyping are listed in Table S1.
4.3. Construction of OsATG4b Overexpression Lines
For the generation of OsATG4b overexpression lines, the full-length coding sequence of OsATG4b was amplified from Nip cDNA and cloned into the pCAMBIA1301 vector under the control of the maize ubiquitin promoter. The resulting overexpression construct was introduced into Agrobacterium tumefaciens strain EHA105 and subsequently used for Agrobacterium-mediated transformation of Nip calli. Independent T1 transgenic lines were obtained and analyzed for expression levels of OsATG4b by qRT-PCR. Lines exhibiting high OsATG4b transcript levels were selected for further phenotypic characterization. Primers sequences used for cloning and expression analysis are listed in Table S1.
4.4. Identification of ATG4 Homologs and Phylogenetic Analysis
To identify ATG4 homologs across eukaryotic species, the amino acid sequence of Saccharomyces cerevisiae ATG4 was retrieved from the NCBI protein database and used as a query for BLASTP searches against the UniProtKB database. An E-value cutoff of 1 × 10⁻⁵ was applied to select candidate sequences with significant homology. Homologous e sequences showing high similarity were retained for further analysis. Multiple sequence alignments of the retrieved proteins were performed using the UniProt Align tool to ensure accutte comparison of conserved regions.
For phylogenetic analysis, amino acid sequences were aligned using ClustalW2 [45] with default parameters, followed by manual refinement of misaligned regions. A phylogenetic tree was then constructed using the maximum likelihood (ML) method implemented in MEGA11 software [46]. The LG+G+I substitution model was used based on model testing, and a total of 1000 rapid bootstrap replicates were performed to assess branch support and tree topology reliability.
4.5. Expression Analysis by Quantitative RT-PCR
To analyze the expression patterns of OsATG4a and OsATG4b in various rice tissues, total RNA was extracted from roots, stems, leaves, leaf sheaths, panicles, and developing seeds of Nip using the RNA Easy Fast Plant Tissue Kit (DP452, TIANGEN, China) according to the manufacturer’s protocol. For each sample, 0.5 μg of total RNA was reverse-transcribed into first-strand cDNA using the FastKing One Step RT-PCR Kit (KR123, TIANGEN). qRT-PCR was conducted using the CFX96 Real-Time PCR Detection System (Bio-Rad, USA) and RealUniversal Color PreMix (SYBR Green) (FP201, TIANGEN). One-fifth of the synthesized cDNA was used as the template for each reaction. OsACTIN1 (LOC_Os03g50885) was used as an internal reference gene for normalization. Primers sequences used in the analysis are listed in Table S1.
4.6. Transmission Electron Microscopy
To investigate ultrastructural changes in the developing endosperm, transmission electron microscopy was performed on wild-type and osatg4b mutant seeds collected at 13 DAF. Sample preparation was conducted following the protocol described previously [36], with slight modifications. Briefly, developing seeds were harvested and immediately fixed overnight at 4 °C in a solution containing 4% (v/v) paraformaldehyde and 0.1% (v/v) glutaraldehyde. Following fixation, samples were dehydrated through a graded ethanol series (30%, 50%, 70%, 80%, 90%, and 100%) and embedded in resin. Ultrathin sections were prepared using an ultramicrotome and post-stained with 2% uranyl acetate. Sections were then examined using a transmission electron microscope equipped with a 200-kV LaB₆ electron source and an FEI Eagle 4k CCD camera. At least three biological replicates were analyzed to ensure reproducibility of the observations.
4.7. Scanning Electron Microscopy
To examine the morphology of starch granules in mature rice endosperm, scanning electron microscopy was performed on wild-type and osatg4b mutant grains. Sample preparation and imaging were carried out according to a previously described protocol [47], with minor modifications. Mature, dehulled rice grains were transversely fractured at the central region of the endosperm using a sterile razor blade. The fractured samples were mounted on aluminum stubs and sputter-coated with a thin layer of gold under vacuum conditions to enhance conductivity. Imaging was conducted using a Carl Zeiss EVO SEM 300 system (Zeiss, Germany) at an accelerating voltage of 10 kV and a spot size of 30 nm. The surface structures of starch granules were observed and recorded. For each genotype, at least three independent biological replicates were analyzed.
4.8. Measurement of Phenotype Data
Agronomic traits were evaluated at maturity in field-grown rice plants. Traits including plant height, tiller number, and heading date were recorded at the flowering stage, while primary and secondary branch number, grain number per panicle, seed-setting rate, grain length, grain width, and 1,000-grain weight were measured after physiological maturity. Grain length and width were determined using a digital caliper. For 1,000-grain weight, approximately 500 fully filled grains per plant were counted and weighed, and the value was calculated proportionally. CGR and DC were determined using a ScanMaker grain appearance analyzer (Microtek, China) based on random samples of over more than 100 dehulled grains per plant.
For the analysis of seed storage substances, mature grains were dehulled and ground into fine flour using a laboratory mill. Total starch and amylose contents were determined according to the method described by Yang et al. [48]. Total protein content was measured using the Kjeldahl nitrogen determination method, and protein concentrations was calculated using the appropriate nitrogen-to-protein conversion factor. Endosperm storage proteins—including albumin, globulin, prolamin, and glutelin—were extracted and quantified as previously described [3]. All measurements were performed using three independent biological replicates.
4.9. Statistical Analysis
All experiments were independently replicated at least three times. Statistical analyses were performed using two-tailed Student’s t-test via GraphPad Prism version 8 (GraphPad Software Inc., San Diego, CA, USA). Statistical significance was defined as p < 0.01 (**) and p > 0.05 (NS: no significant difference).
5. Conclusions
We identified OsATG4b as a key regulator of rice grain chalkiness, acting through the modulation of storage protein accumulation and endosperm structure organization. Our findings reveal a previously unrecognized role for autophagy-related genes in regulating grain quality traits, specifically by OsATG4b-mideated control of endosperm development. This study not only advances our understanding of autophagy during seed development but also highlights the potential of targeting autophagy-related genes as a promising strategy to improve rice grain quality.
Supplementary Materials
The following supporting information can be downloaded at the website of this paper posted on Preprints.org. Table S1: Primers used in this study.
Author Contributions
Conceptualization, C.Y. and Z.H.; methodology, Z.H. and X.H.; software, Y.Y. (Yumeng Yuan); validation, R.X. and H.L., and Y.G.; formal analysis, S.S.; investigation, Z.H. and X.H.; resources, C.L., H.S., Y.Y. (Yihao Yang), and M.G.; writing—original draft preparation, Z.H.; writing—review and editing, C.Y.; visualization, Z.H. and X.H.; supervision, C.Y.; funding acquisition, C.Y. and Z.H. All authors have read and agreed to the published version of the manuscript.
Funding
This research was funded by the National Natural Sciences Foundation of China (32301828), the Biological Breeding-National Science and Technology Major Project (2023ZD04068), and the programs of the Jiangsu Province Government (BE2022335, JBGS[2021]001, and BE2021334-1).
Data Availability Statement
The data used in this study are available within the article and its accompanying Supplementary Materials.
Acknowledgments
We sincerely thank all members of our laboratory for their valuable assistance with the fieldwork.
Conflicts of Interest
The authors declare no conflicts of interest.
References
- Zeng, D. , Tian, Z., Rao, Y., Dong, G., Yang, Y., Huang, L., Leng, Y., Xu, J., Sun, C., Zhang, G., et al. Rational design of high-yield and superior-quality rice. Nat. Plants 2007, 3, 17031. [Google Scholar] [CrossRef] [PubMed]
- Custodio, M.C. , Cuevas, R.P., Ynion, J., Laborte, A.G., Velasco, M.L., and Demont, M. Rice quality: How is it defined by consumers, industry, food scientists, and geneticists? Trends Food Sci. Tech. 2019, 92, 122–137. [Google Scholar] [CrossRef] [PubMed]
- Yang, Y. , Shen, Z., Li, Y., Xu, C., Xia, H., Zhuang, H., Sun, S., Guo, M., and Yan, C. Rapid improvement of rice eating and cooking quality through gene editing toward glutelin as target. J. Integr. Plant Biol. 2022, 64, 1860–1865. [Google Scholar] [CrossRef] [PubMed]
- Chen, L. , Li, X., Zheng, M., Hu, R., Dong, J., Zhou, L., Liu, W., Liu, D., and Yang, W. Genes controlling grain chalkiness in rice. Crop J. 2024, 12, 979–991. [Google Scholar] [CrossRef]
- Zhao, D. , Zhang, C., Li, Q., and Liu, Q. Genetic control of grain appearance quality in rice. Biotechnol. Adv. 2022, 60, 108014. [Google Scholar] [CrossRef]
- Siebenmorgen, T.J. , Grigg, B.C., and Lanning, S.B. Impacts of preharvest factors during kernel development on rice quality and functionality. Annu. Rev. Food Sci. Technol. 2013, 4, 101–115. [Google Scholar] [CrossRef]
- Zhao, D. , Chen, S., Han, Y., Liu, G., Liu, J., Yang, Q., Zhang, T., Shen, J., Fan, X., Zhang, C., et al. A CRISPR/Cas9-mediated mutant library of seed-preferred genes in rice. Plant Biotechnol. J. 2024, 11, 3012–3014. [Google Scholar] [CrossRef]
- Cao, S. , Liu, B., Wang, D., Rasheed, A., Xie, L., Xia, X., and He, Z. Orchestrating seed storage protein and starch accumulation toward overcoming yield–quality trade-off in cereal crops. J. Integr. Plant Biol. 2024, 66, 468–483. [Google Scholar] [CrossRef]
- Yang, W. , Liang, J., Hao, Q., Luan, X., Tan, Q., Lin, S., Zhu, H., Liu, G., Liu, Z., Bu, S., et al. Fine mapping of two grain chalkiness QTLs sensitive to high temperature in rice. Rice 2021, 14, 33. [Google Scholar] [CrossRef]
- Kaneko, K. , Sasaki, M., Kuribayashi, N., Suzuki, H., Sasuga, Y., Shiraya, T., Inomata, T., Itoh, K., Baslam, M., and Mitsui, T. Proteomic and Glycomic Characterization of Rice Chalky Grains Produced Under Moderate and High-temperature Conditions in Field System. Rice 2016, 9, 26. [Google Scholar] [CrossRef]
- Cao, R. , Zhao, S., Jiao, G., Duan, Y., Ma, L., Dong, N., Lu, F., Zhu, M., Shao, G., Hu, S., et al. OPAQUE3, encoding a transmembrane bZIP transcription factor, regulates endosperm storage protein and starch biosynthesis in rice. Plant Commun. 2022, 3, 100463. [Google Scholar]
- Wang, G. , Wang, F., Wang, G., Wang, F., Zhang, X., Zhong, M., Zhang, J., Lin, D., Tang, Y., Xu, Z., et al. Opaque1 encodes a myosin XI motor protein that is required for endoplasmic reticulum motility and protein body formation in maize endosperm. Plant Cell 2012, 24, 3447–3462. [Google Scholar] [PubMed]
- Ren, Y. , Wang, Y., Liu, F., Zhou, K., Ding, Y., Zhou, F., Wang, Y., Liu, K., Gan, L., Ma, W., et al. GLUTELIN PRECURSOR ACCUMULATION3 encodes a regulator of post-Golgi vesicular traffic essential for vacuolar protein sorting in rice endosperm. Plant Cell 2014, 26, 410–425. [Google Scholar] [PubMed]
- Zhang, Z. , Zheng, X., Yang, J., Messing, J., and Wu, Y. Maize endosperm-specific transcription factors O2 and PBF network the regulation of protein and starch synthesis. P. Natl. Acad. Sci. USA 2016, 113, 10842–10847. [Google Scholar] [CrossRef]
- Marshall, R.S. , and Vierstra, R.D. Autophagy: The Master of Bulk and Selective Recycling. Annu. Rev. Plant Biol. 2018, 69, 173–208. [Google Scholar] [CrossRef]
- Liu, Y. , and Bassham, D.C. Autophagy: pathways for self-eating in plant cells. Annu. Rev. Plant Biol. 2012, 63, 215–237. [Google Scholar] [CrossRef]
- Ustun, S. , Hafren, A., and Hofius, D. Autophagy as a mediator of life and death in plants. Curr. Opin. Plant Biol. 2017, 40, 122–130. [Google Scholar] [CrossRef]
- Su, W. , Bao, Y., Yu, X., Xia, X., Liu, C., and Yin, W. Autophagy and Its Regulators in Response to Stress in Plants. Int. J. Mol. Sci. 2020, 21, 8889. [Google Scholar] [CrossRef]
- Yang, M. , Ismayil, A., and Liu, Y. Autophagy in Plant-Virus Interactions. Annu. Rev. Virol. 2020, 7, 403–419. [Google Scholar] [CrossRef]
- Yoshimoto, K. Beginning to Understand Autophagy, an Intracellular Self-Degradation System in Plants. Plant Cell Physiol. 2012, 53, 1355–1365. [Google Scholar] [CrossRef]
- Doelling, J.H. , Walker, J.M., Friedman, E.M., Thompson, A.R., and Vierstra, R.D. The APG8/12-activating enzyme APG7 is required for proper nutrient recycling and senescence in Arabidopsis thaliana. J. Biol. Chem. 2002, 277, 33105–33114. [Google Scholar] [CrossRef] [PubMed]
- Chung, T. , Phillips, A.R., and Vierstra, R.D. ATG8 lipidation and ATG8-mediated autophagy in Arabidopsis require ATG12 expressed from the differentially controlled ATG12A and ATG12B loci. Plant J. 2010, 62, 483–493. [Google Scholar] [CrossRef] [PubMed]
- Noda, N.N. , Ohsumi, Y., and Inagaki, F. Atg8-family interacting motif crucial for selective autophagy. Febs Lett. 2010, 584, 1379–1385. [Google Scholar] [CrossRef] [PubMed]
- Shpilka, T. , Weidberg, H., Pietrokovski, S., and Elazar, Z. Atg8: an autophagy-related ubiquitin-like protein family. Genome Biol. 2011, 12, 226. [Google Scholar] [CrossRef]
- Park, E. , Woo, J., and Dinesh-Kumar, S.P. Arabidopsis ATG4 cysteine proteases specificity toward ATG8 substrates. Autophagy 2014, 10, 926–927. [Google Scholar]
- Zhen, X. , Li, X., Yu, J., and Xu, F. OsATG8c-Mediated Increased Autophagy Regulates the Yield and Nitrogen Use Efficiency in Rice. Int. J. Mol. Sci. 2019, 20, 4956. [Google Scholar]
- Yoshimoto, K. , Hanaoka, H., Sato, S., Kato, T., Tabata, S., Noda, T., and Ohsumi, Y. Processing of ATG8s, ubiquitin-like proteins, and their deconjugation by ATG4s are essential for plant autophagy. Plant Cell 2004, 16, 2967–2983. [Google Scholar] [CrossRef]
- Woo, J. , Park E Fau - Dinesh-Kumar, S.P., and Dinesh-Kumar, S.P. Differential processing of Arabidopsis ubiquitin-like Atg8 autophagy proteins by Atg4 cysteine proteases. P. Natl. Acad. Sci. USA 2014, 14, 863–868. [Google Scholar] [CrossRef]
- Laureano-Marín, A.M. , Aroca, Á., Pérez-Pérez, M.E., Yruela, I., Jurado-Flores, A., Moreno, I., Crespo, J.L., Romero, L.C., and Gotor, C. Abscisic Acid-Triggered Persulfidation of the Cys Protease ATG4 Mediates Regulation of Autophagy by Sulfide. Plant Cell 2020, 32, 3902–3920. [Google Scholar] [CrossRef]
- Huang, S. , Wang, P., Li, C., Zhou, Q., Huang, T., Cai, Y., Cheng, Q., Wang, H., Zhong, Q., Chen, Z., et al. Natural variation of an autophagy-family gene among rice subspecies affects grain size and weight. Crop J. 2024, 12, 121–132. [Google Scholar] [CrossRef]
- Sato, Y. , Takehisa, H., Kamatsuki, K., Minami, H., Namiki, N., Ikawa, H., Ohyanagi, H., Sugimoto, K., Antonio, B.A., and Nagamura, Y. RiceXPro Version 3.0: expanding the informatics resource for rice transcriptome. Nucleic Acids Res. 2013, 41, D1206–D1213. [Google Scholar] [CrossRef] [PubMed]
- Liu, Z. , Yang, Q., Wu, P., Li, Y., Lin, Y., Liu, W., Guo, S., Liu, Y., Huang, Y., Xu, P., et al. Dynamic monitoring of TGW6 by selective autophagy during grain development in rice. New Phytol. 2023, 240, 2419–2435. [Google Scholar] [CrossRef] [PubMed]
- Zhen, X. , Zheng, N., Yu, J., Bi, C., and Xu, F. Autophagy mediates grain yield and nitrogen stress resistance by modulating nitrogen remobilization in rice. Plos One 2021, 16, e0244996. [Google Scholar] [CrossRef] [PubMed]
- Kurusu, T. , Koyano, T., Hanamata, S., Kubo, T., Noguchi, Y., Yagi, C., Nagata, N., Yamamoto, T., Ohnishi, T., Okazaki, Y., et al. OsATG7 is required for autophagy-dependent lipid metabolism in rice postmeiotic anther development. Autophagy 2014, 10, 878–888. [Google Scholar]
- Izumi, M. , Hidema, J., Wada, S., Kondo, E., Kurusu, T., Kuchitsu, K., Makino, A., and Ishida, H. Establishment of monitoring methods for autophagy in rice reveals autophagic recycling of chloroplasts and root plastids during energy limitation. Plant Physiol. 2015, 167, 1307–1320. [Google Scholar] [CrossRef]
- Hu, Z. , Yang, Z., Zhang, Y., Zhang, A., Lu, Q., Fang, Y., and Lu, C. Autophagy targets Hd1 for vacuolar degradation to regulate rice flowering. Mol. Plant 2022, 15, 1137–1156. [Google Scholar] [CrossRef]
- Ibl, V. , Kapusi, E., Arcalis, E., Kawagoe, Y., and Stoger, E. Fusion, rupture, and degeneration: the fate of in vivo-labelled PSVs in developing barley endosperm. J. Exp. Bot. 2014, 65, 3249–3261. [Google Scholar] [CrossRef]
- Di Berardino, J. , Marmagne, A., Berger, A., Yoshimoto, K., Cueff, G., Chardon, F., Masclaux-Daubresse, C., and Reisdorf-Cren, M. Autophagy controls resource allocation and protein storage accumulation in Arabidopsis seeds. J. Exp. Bot. 2018, 69, 1403–1414. [Google Scholar] [CrossRef]
- Zhang, X. , Ding, X., Marshall, R.S., Paez-Valencia, J., Lacey, P., Vierstra, R.D., and Otegui, M.S. Reticulon proteins modulate autophagy of the endoplasmic reticulum in maize endosperm. Elife 2020, 9, e51918. [Google Scholar] [CrossRef]
- Yamamoto, M.P. , Onodera, Y., Touno, S.M., and Takaiwa, F. Synergism between RPBF Dof and RISBZ1 bZIP activators in the regulation of rice seed expression genes. Plant Physiol. 2006, 141, 1694–1707. [Google Scholar] [CrossRef]
- Kawakatsu, T. , Yamamoto, M.P., Touno, S.M., Yasuda, H., and Takaiwa, F. Compensation and interaction between RISBZ1 and RPBF during grain filling in rice. Plant J. 2009, 59, 908–920. [Google Scholar] [CrossRef] [PubMed]
- Wu, M.-W. , Liu, J., Bai, X., Chen, W.-Q., Ren, Y., Liu, J.-L., Chen, M.-M., Zhao, H., Yao, X., Zhang, J.-D., et al. Transcription factors NAC20 and NAC26 interact with RPBF to activate albumin accumulations in rice endosperm. Plant Biotechnol. J. 2023, 21, 890–892. [Google Scholar] [CrossRef] [PubMed]
- Naito, Y. , Hino, K., Bono, H., and Ui-Tei, K. CRISPRdirect: software for designing CRISPR/Cas guide RNA with reduced off-target sites. Bioinformatics 2015, 31, 1120–1123. [Google Scholar] [CrossRef]
- Liu, W. , Xie, X., Ma, X., Li, J., Chen, J., and Liu, Y.-G. DSDecode: A Web-Based Tool for Decoding of Sequencing Chromatograms for Genotyping of Targeted Mutations. Mol. Plant 2015, 8, 1431–1433. [Google Scholar] [CrossRef] [PubMed]
- Larkin, M.A. , Blackshields, G., Brown, N.P., Chenna, R., McGettigan, P.A., McWilliam, H., Valentin, F., Wallace, I.M., Wilm, A., Lopez, R., et al. Clustal W and Clustal X version 2.0. Bioinformatics 2007, 23, 2947–2948. [Google Scholar] [CrossRef]
- Tamura, K. , Stecher, G., and Kumar, S. MEGA11: Molecular Evolutionary Genetics Analysis Version 11. Mol. Biol. Evol. 2021, 38, 3022–3027. [Google Scholar] [CrossRef]
- Wu, B. , Yun, P., Zhou, H., Xia, D., Gu, Y., Li, P., Yao, J., Zhou, Z., Chen, J., Liu, R., et al. Natural variation in WHITE-CORE RATE 1 regulates redox homeostasis in rice endosperm to affect grain quality. Plant Cell 2022, 34, 1912–1932. [Google Scholar] [CrossRef]
- Yang, Y. , Guo, M., Sun, S., Zou, Y., Yin, S., Liu, Y., Tang, S., Gu, M., Yang, Z., and Yan, C. (2019). Natural variation of OsGluA2 is involved in grain protein content regulation in rice. Nat. Commun. 2019, 10, 1949. [Google Scholar] [CrossRef]
Figure 1.
Comparative analysis of ATG4 proteins across various species. (A) Protein identity matrix of ATG4 homologs from Oryza sativa (O. sativa), Arabidopsis thaliana (A. thaliana), and Saccharomyces cerevisiae (S. cerevisiae). Pairwise sequence identity was calculated based on amino acid alignment. (B) Domain architecture of O. sativa ATG4 homologs. Schematic representation of the two rice ATG4 proteins, OsATG4a (Q75KP8) and OsATG4b (Q7XPW8), showing the conserved Peptidase C54 domain (yellow). (C) Phylogenetic tree of ATG4 proteins based on amino acid sequences. The tree reveals the evolutionary relationships among ATG4 homologs from different taxa, showing clear clades for monocots, dicots, and non-plant species (algae, fungi, and mammals).
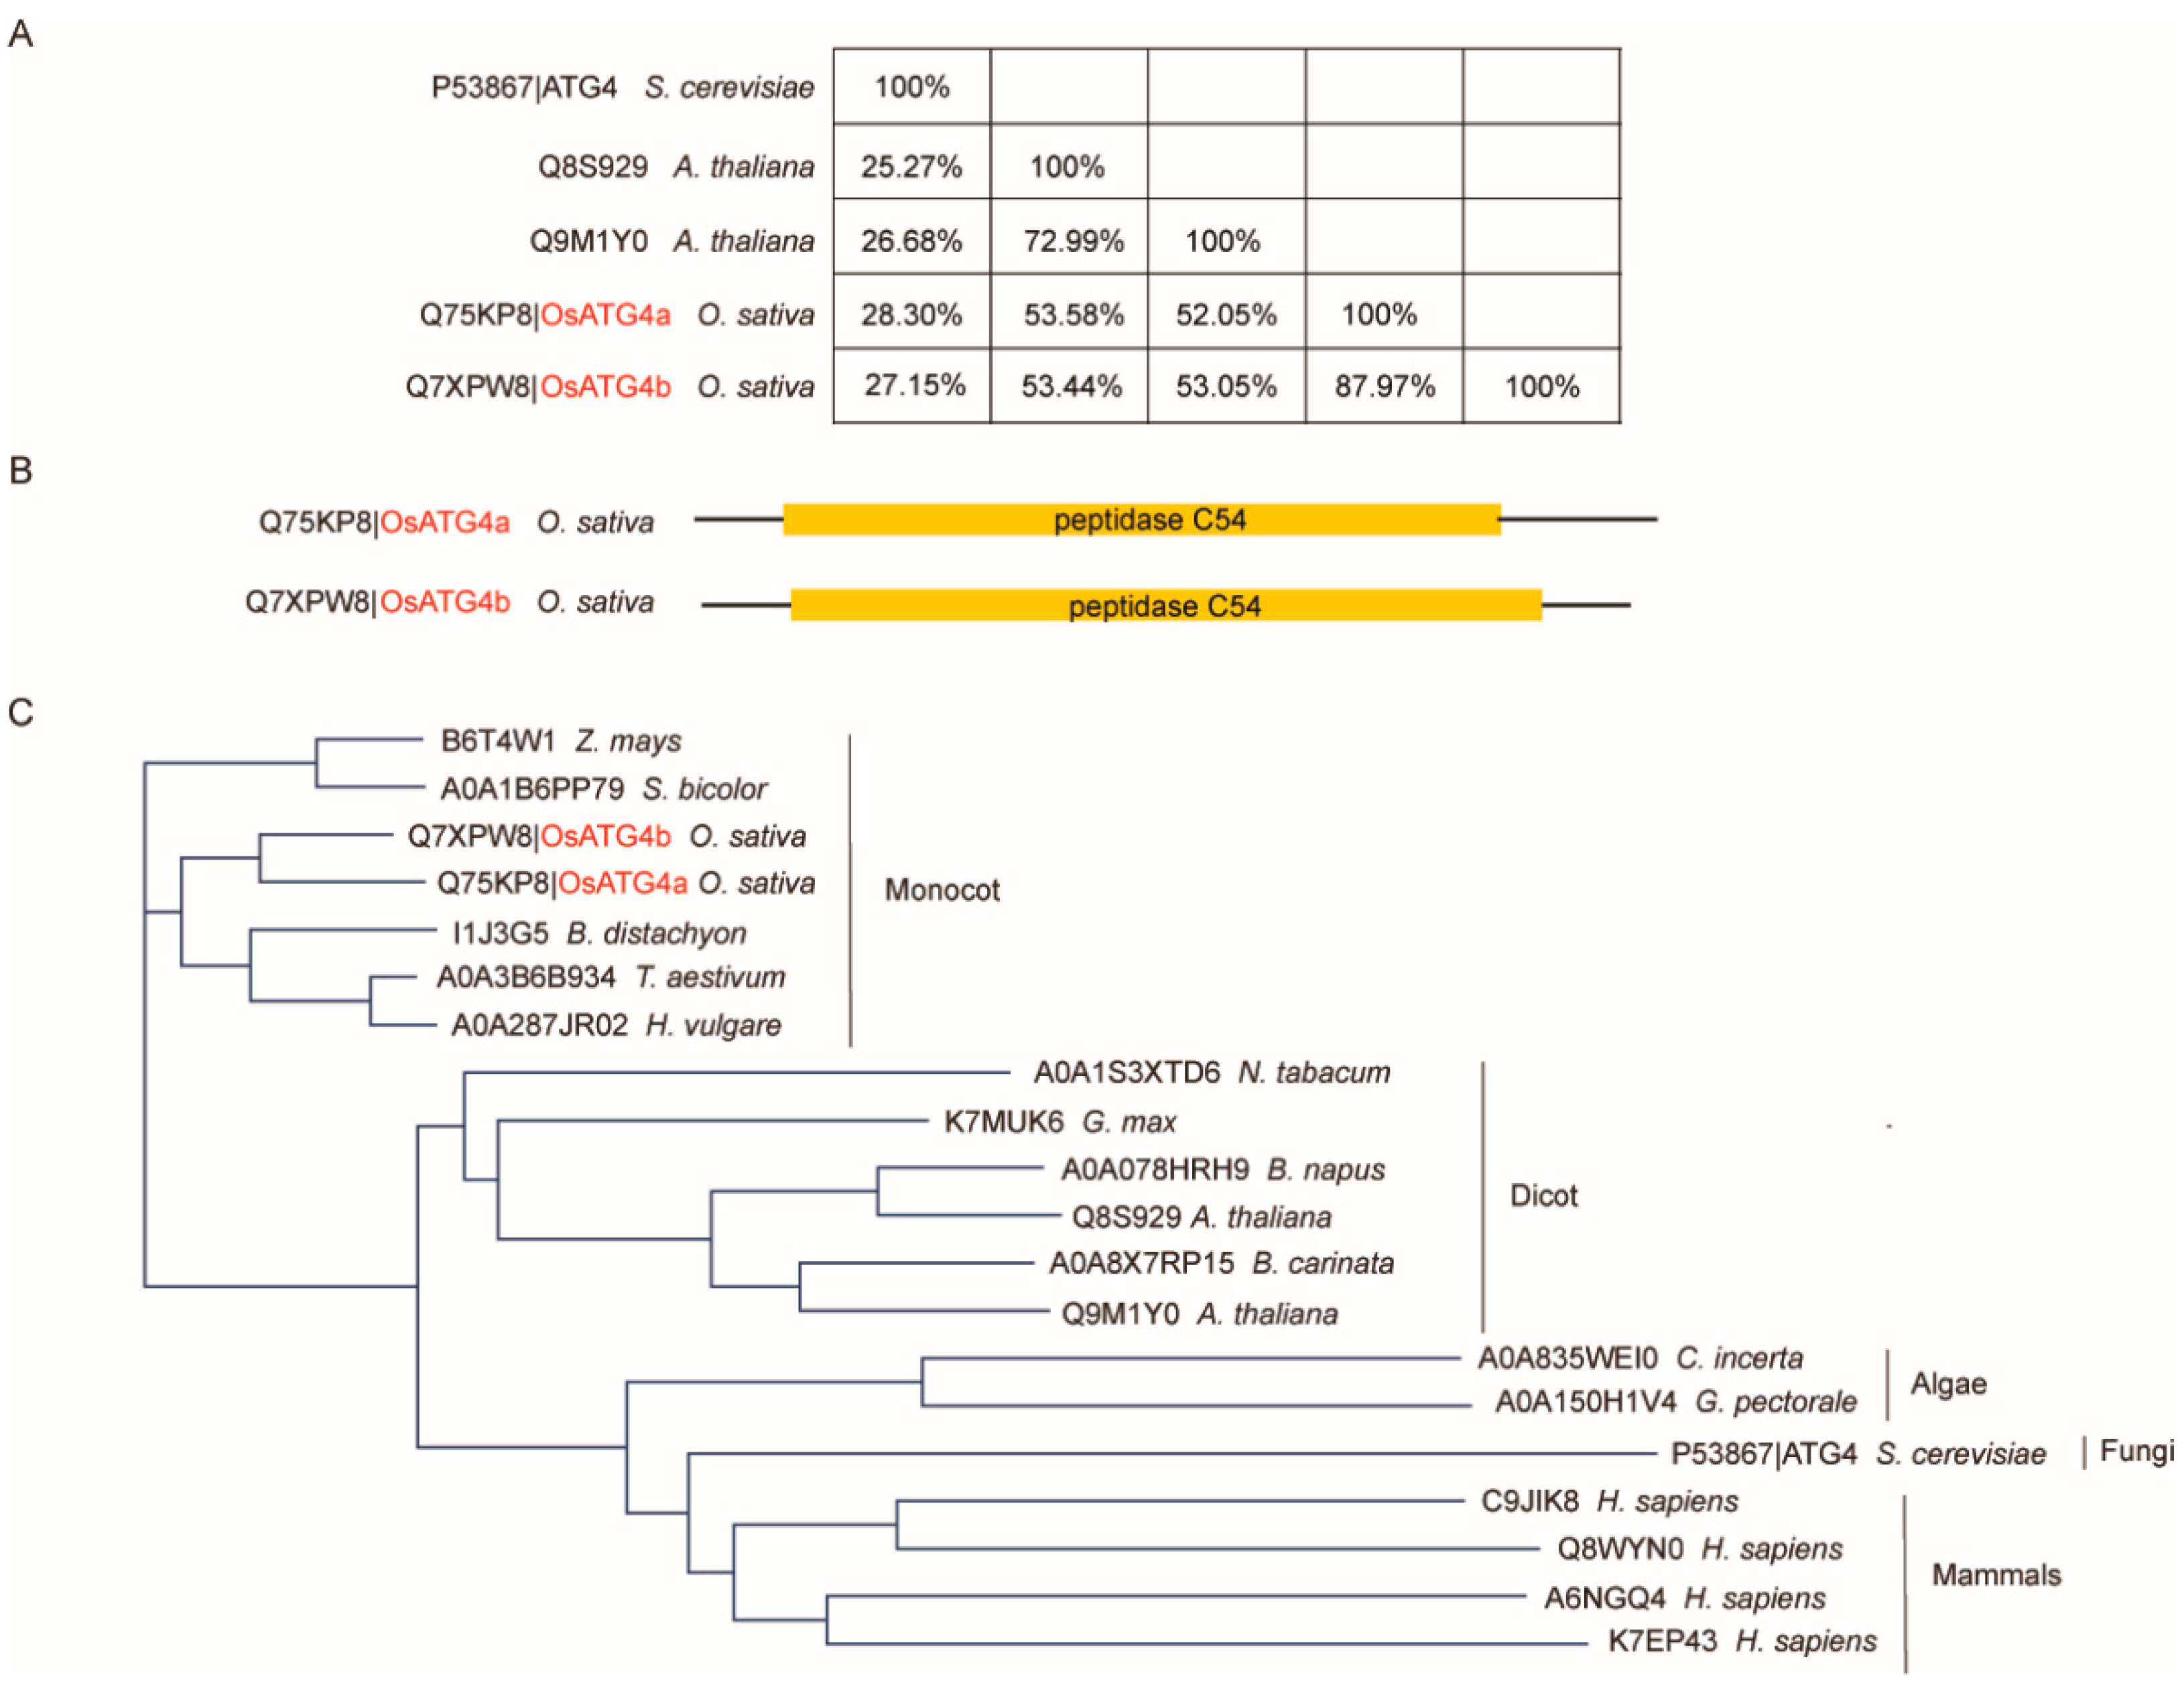
Figure 2.
Expression profiles of OsATG4a and OsATG4b in various tissues and developmental stages of rice. (A) Heatmap showing the expression levels of OsATG4a and OsATG4b across multiple rice tissues at different developmental stages. Data were retrieved from RiceXPro (http://ricexpro.dna.affrc.go.jp/GGEP/index.html). (B) Tissue-specific expression patterns of OsATG4a and OsATG4b, visualized using the ePlant platform (http://bar.utoronto.ca/eplant_rice/). (C) qRT-PCR analysis of OsATG4a and OsATG4b expression in different rice tissues, including root, stem, leaf sheath, leaf, panicle, and seed. Expression levels are normalized to the rice ACTIN1 gene. Data represent means ± SD (n = 3).
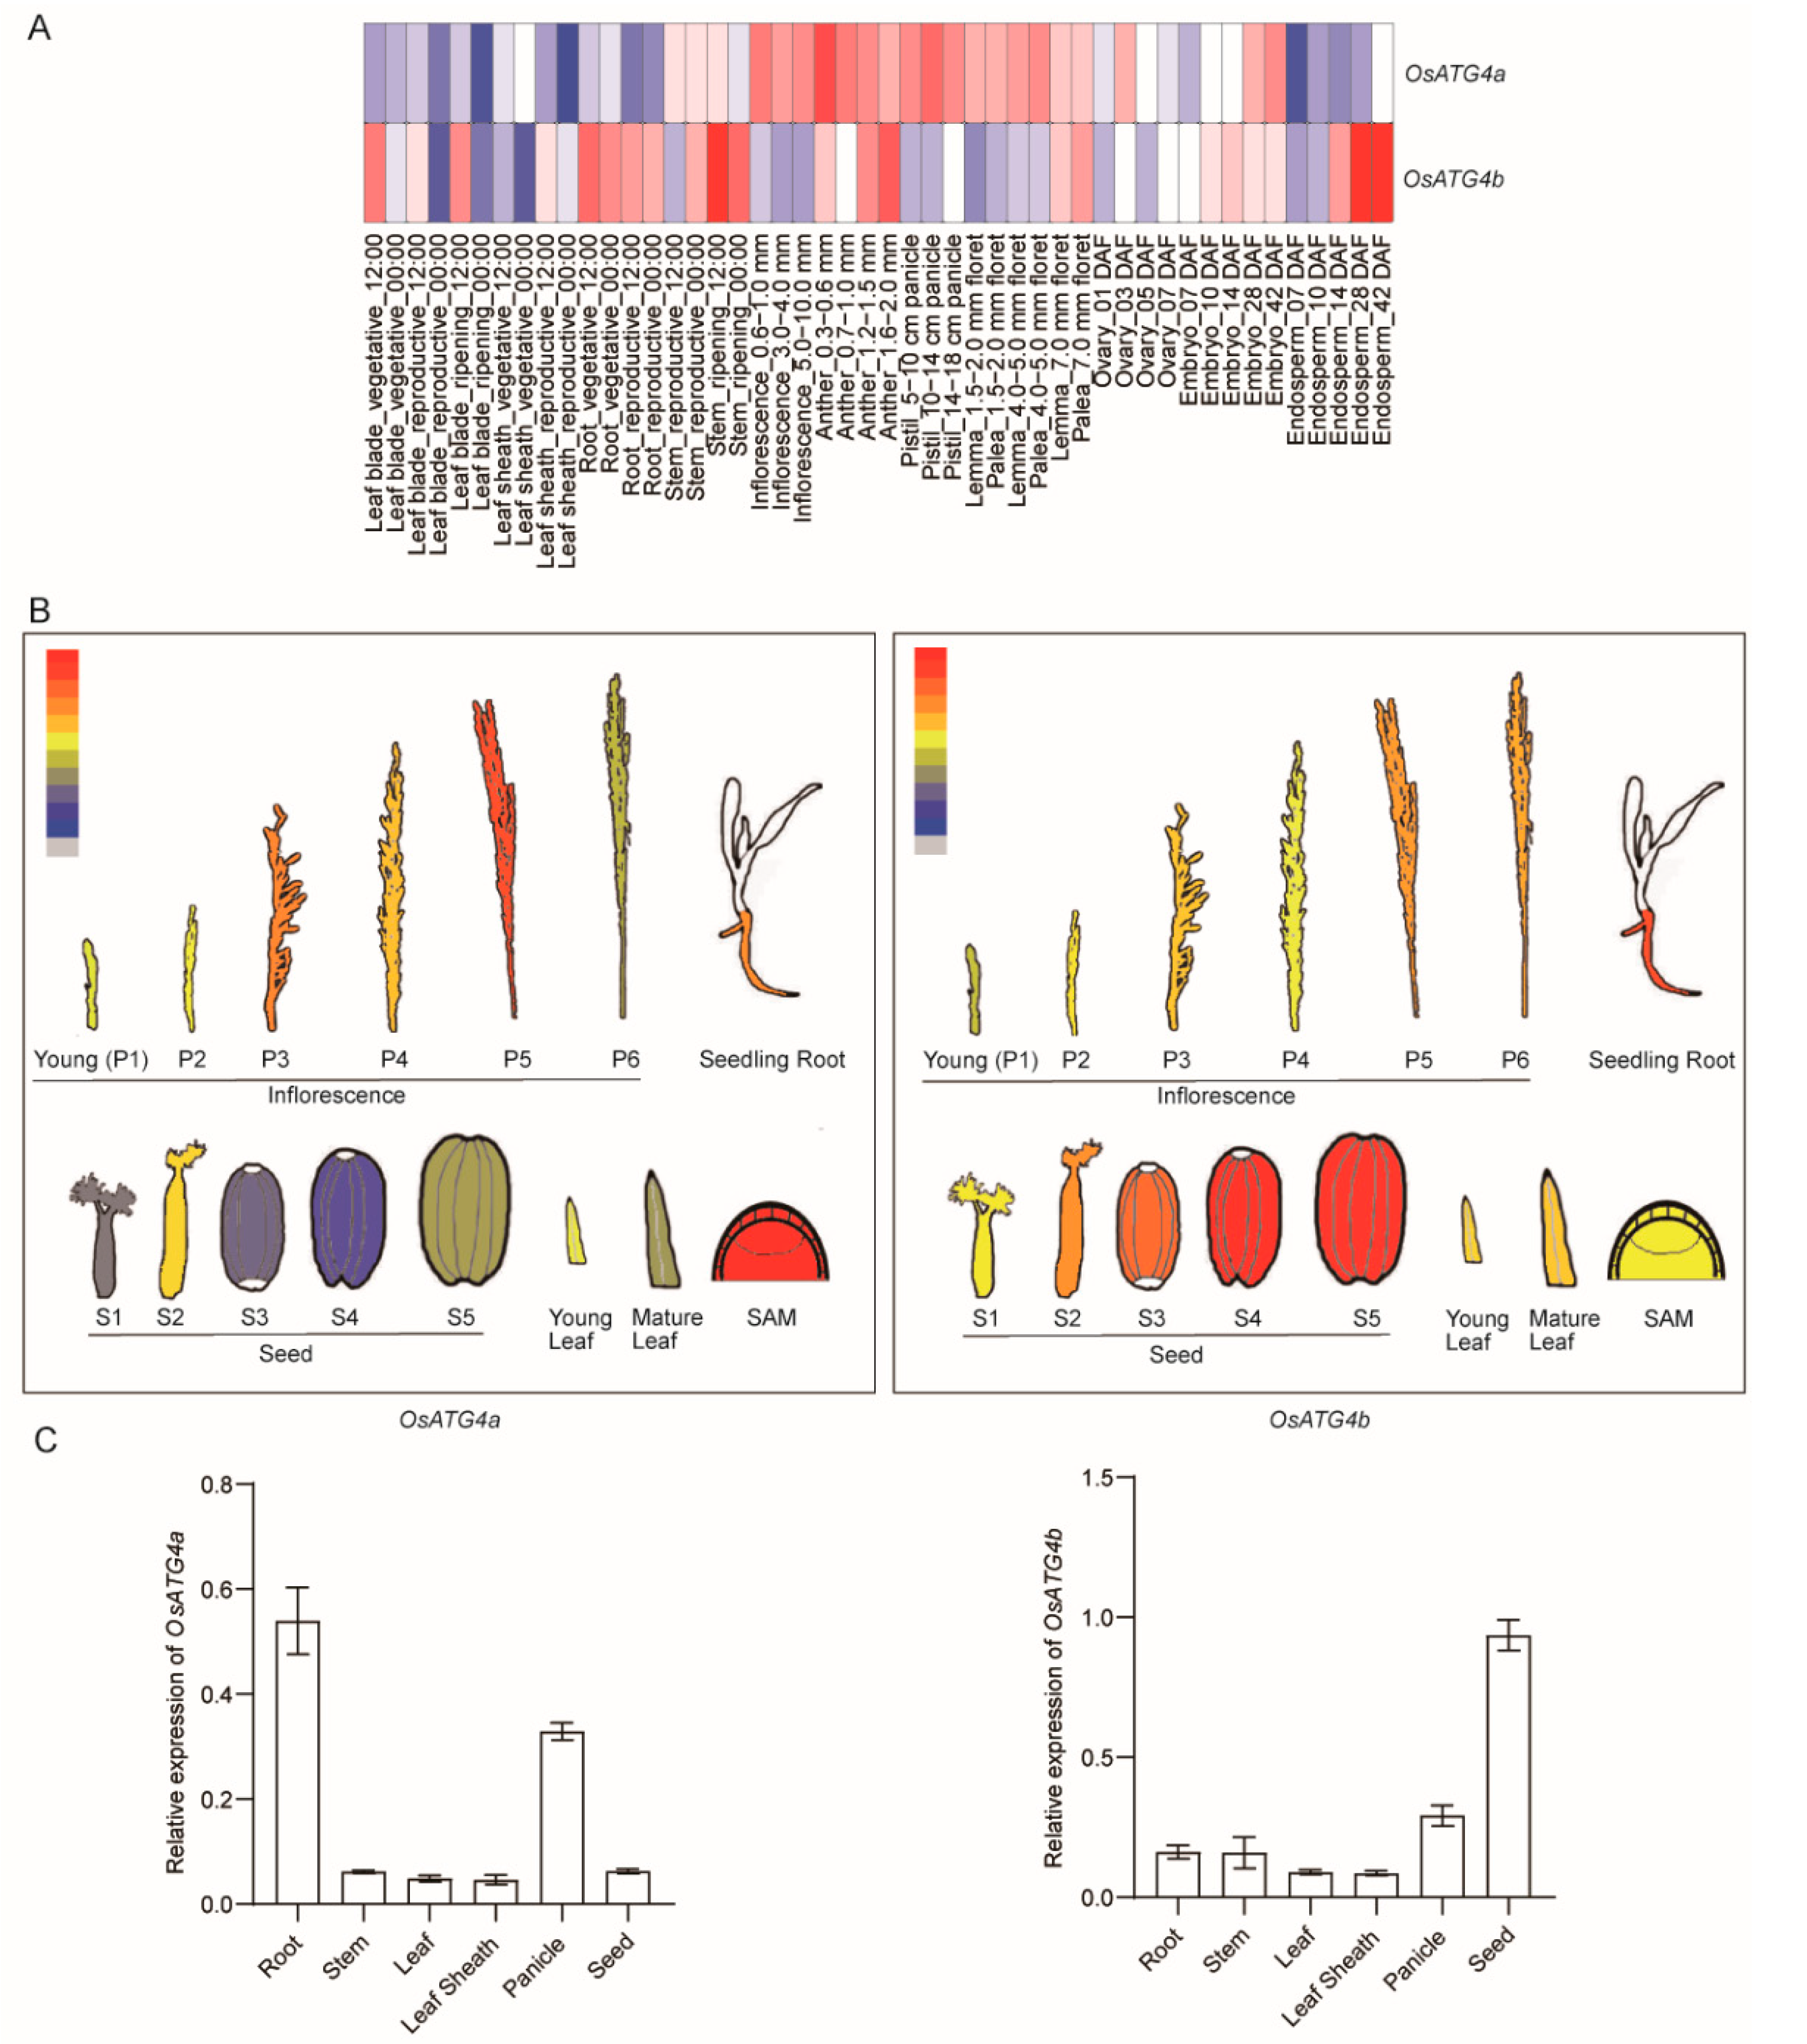
Figure 3.
Generation of OsATG4a and OsATG4b knockout mutants. (A) Schematic representation of CRISPR/Cas9 target sites in OsATG4a and OsATG4b genes. Black boxes represent exons, and arrows mark the positions of target sites relative to the start codon (ATG) and stop codon (TAG). Wild-type (Nip) sequences and corresponding mutant alleles (osatg4a-1, osatg4a-2, osatg4b-1, and osatg4b-2) are shown. Dashes indicate deleted nucleotides. (B) Predicted amino acid sequences of OsATG4a and OsATG4b proteins in wild type and mutant lines. Frameshift mutations in mutants result in premature stop codons, leading to truncated proteins. Asterisks indicate stop codons. Numbers on the right correspond to the amino acid positions.
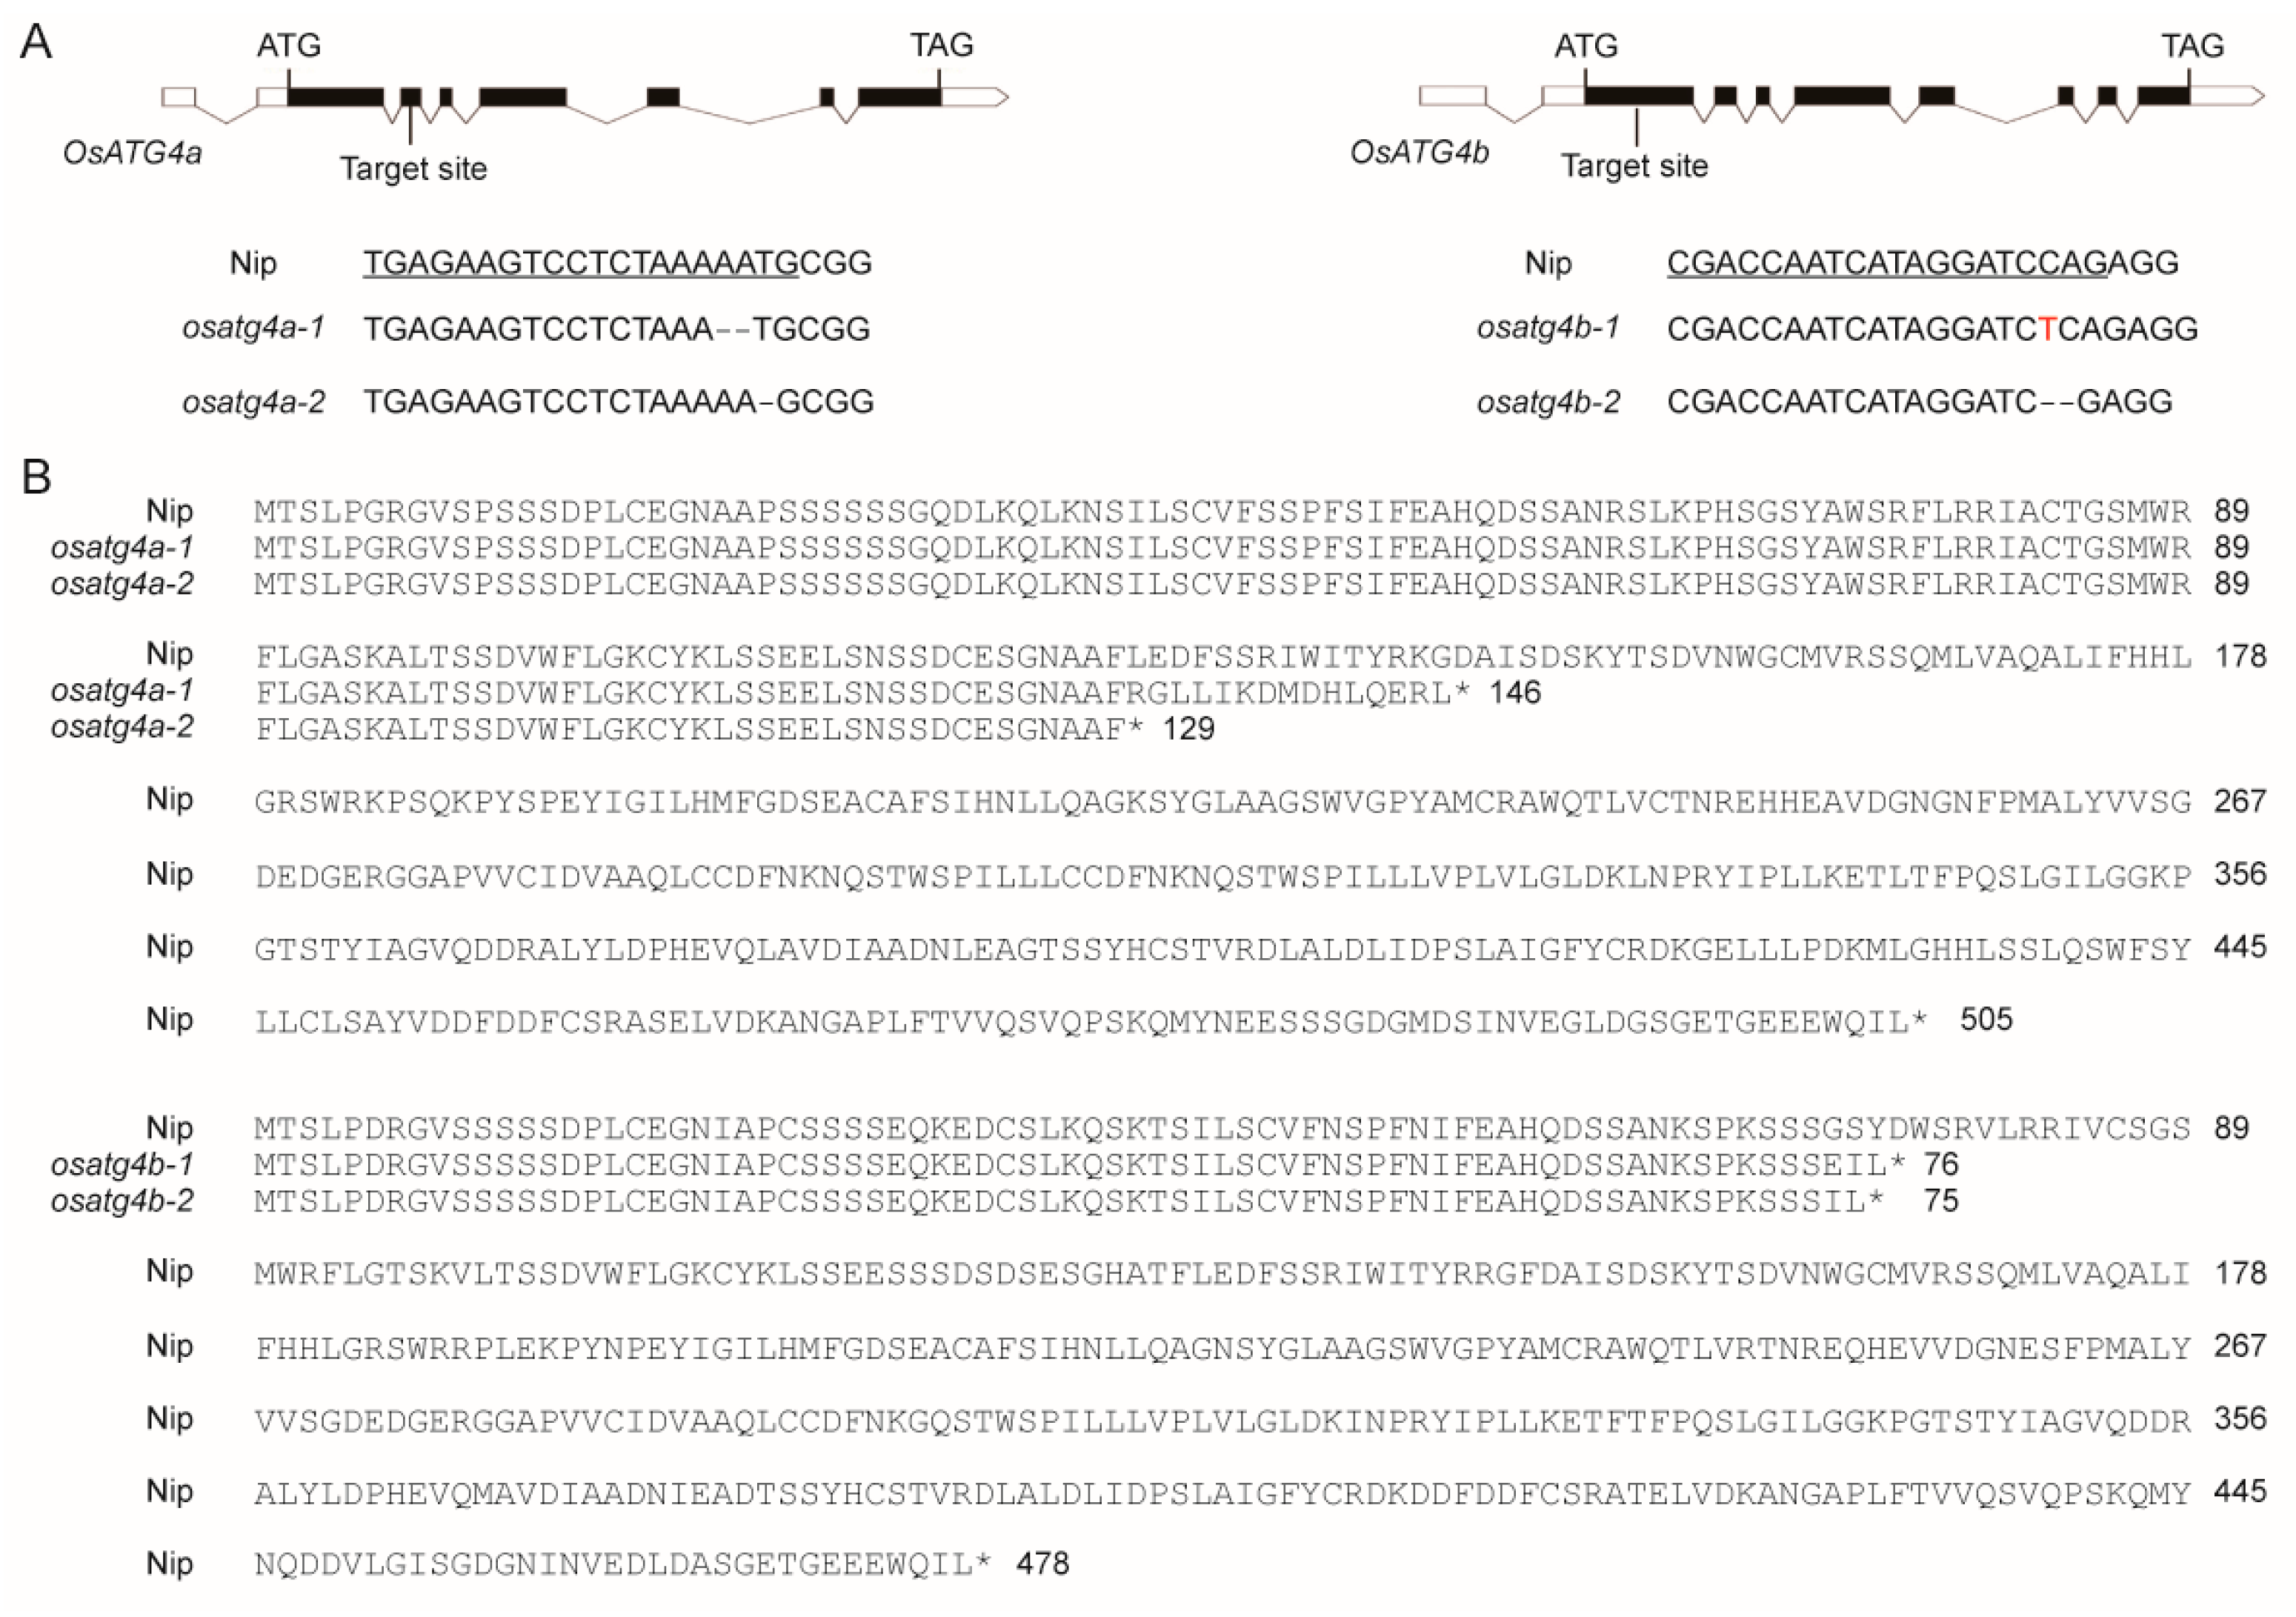
Figure 4.
Grain morphology and chalkiness in OsATG4a and OsATG4b knockout mutants. (A) Comparison of grain length among WT, osatg4a and osatg4b plants. Scale bars, 0.8 cm. (B) Comparison of grain width among WT, osatg4a and osatg4b plants. Scale bars, 0.8 cm. (C) Comparative analysis of grain length at maturity in (A). Values are means ± SD (n = 50). (D) Comparative analysis of grain width at maturity in (B). Values are means ± SD (n = 50). (E) Evaluation of 1000-grain weight among WT, osatg4a and osatg4b plants. (F and G) Assessment of grain chalkiness traits, including degree of chalkiness (DC) and chalky grain rate (CGR) among WT, osatg4a and osatg4b plants. (H) Morphological appearance of polished grains among WT, osatg4a and osatg4b plants. Scale bar = 5 mm. Data are presented as means ± SD (n = 10). Statistical significance was determined by Student’s t-test: p < 0.01 (**); NS, not significant.
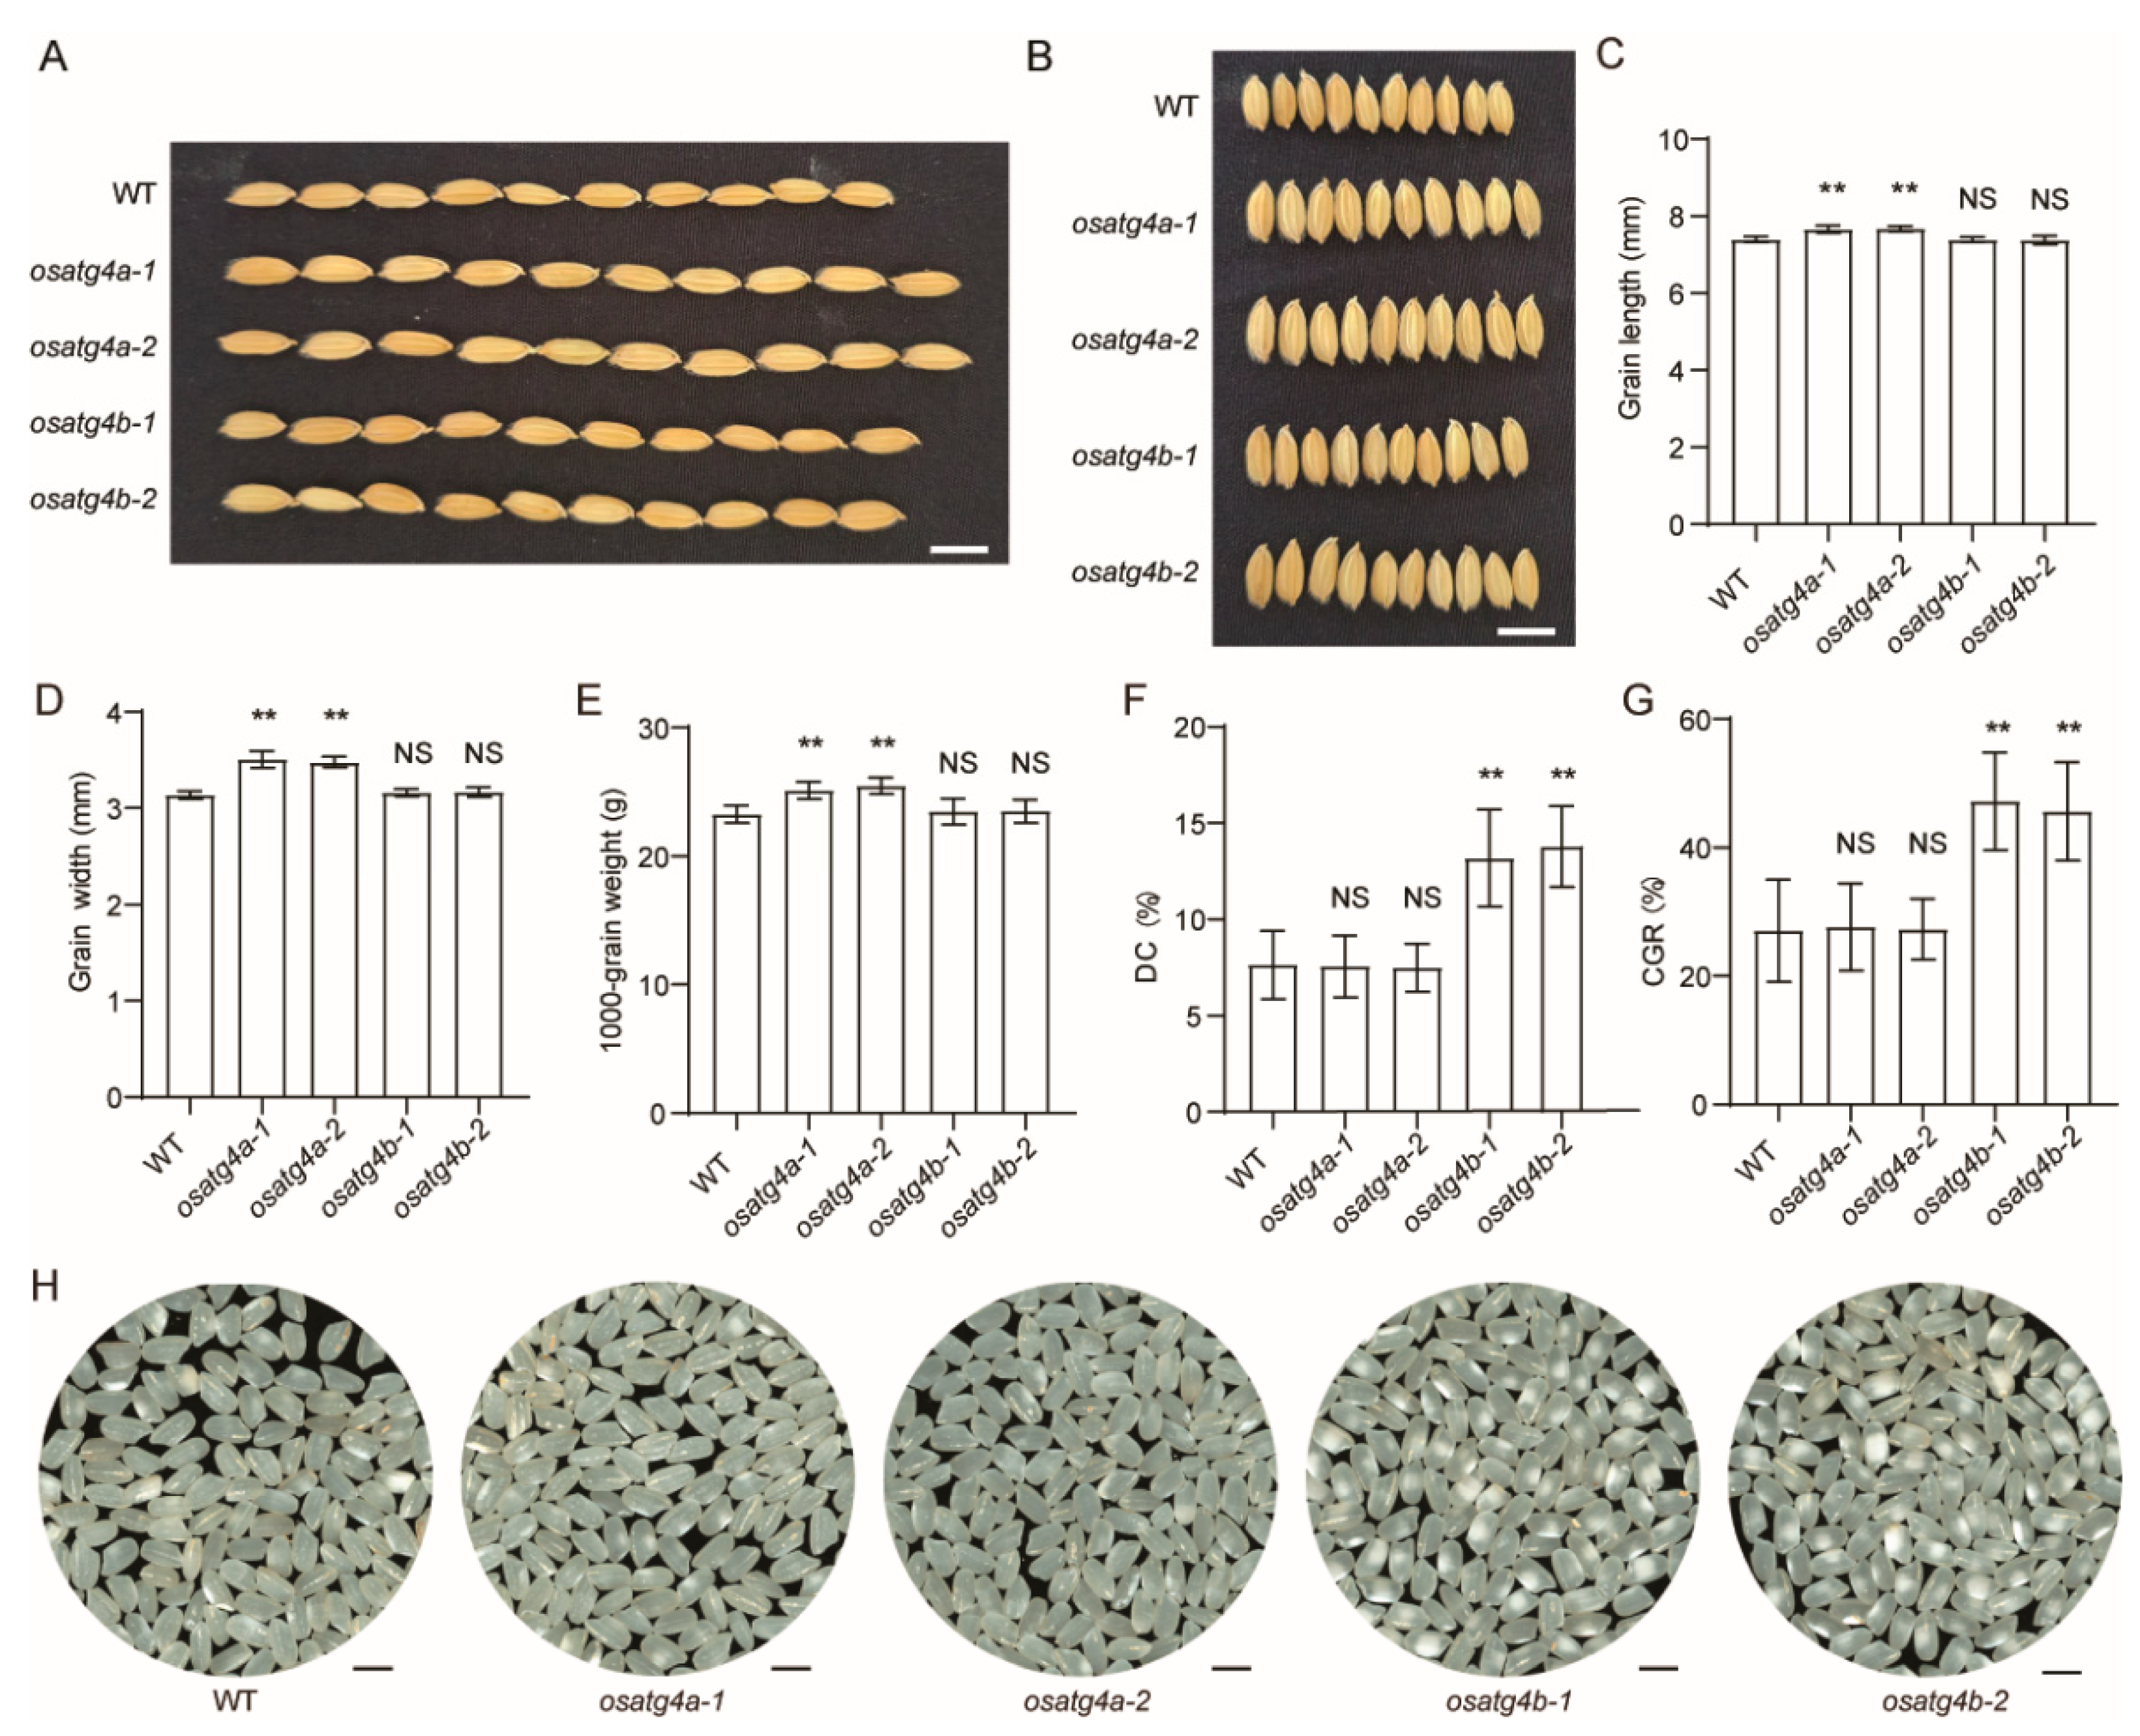
Figure 5.
Agronomic trait analysis in OsATG4a and OsATG4b knockout mutants. (A–H) Comparison of plant height, seed-setting rate, tiller number, heading date, primary branch number, secondary branch number, grain number per panicle, and panicle length among WT, osatg4a, and osatg4b plants. Data are presented as means ± SD (n = 10). Significant difference was determined by Student’s t-test. NS, not significant.
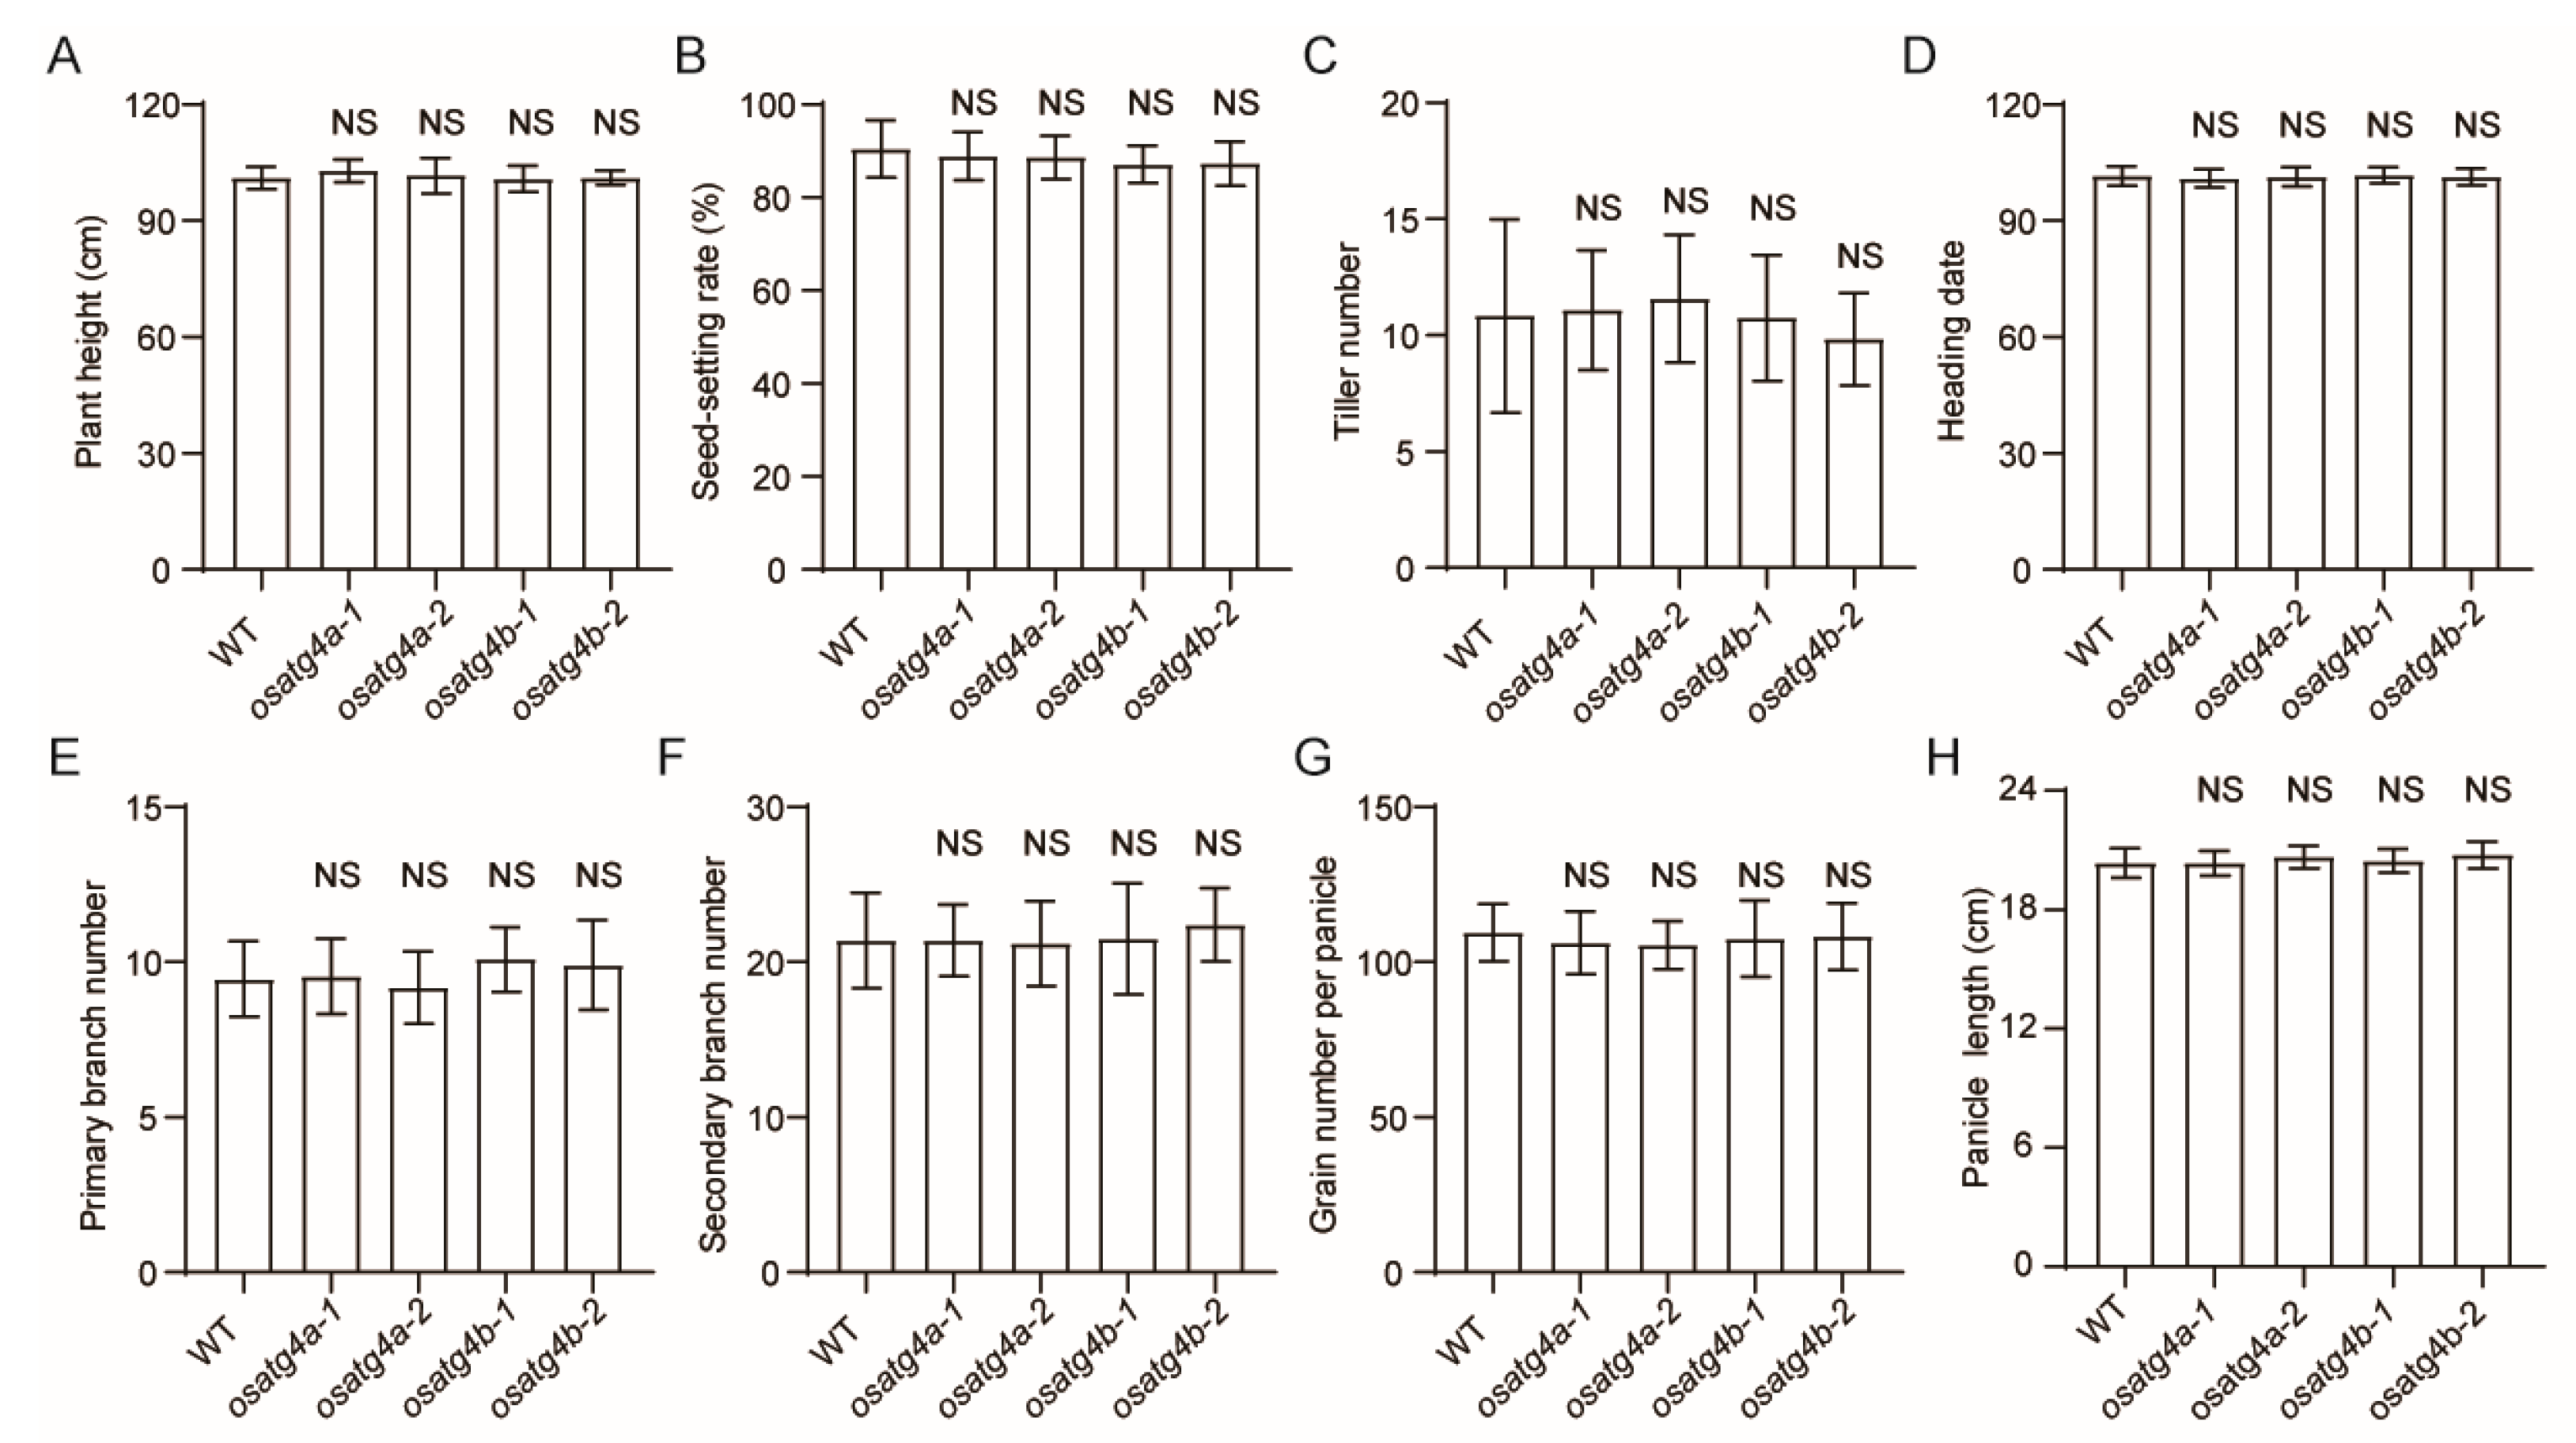
Figure 6.
Phenotypic characterization of OsATG4b overexpression lines. (A) Relative expression levels of OsATG4b in transgenic overexpression (OE) lines as determined by qRT-PCR. (B–E) Agronomic trait comparisons between WT and OsATG4b-OE lines, including tiller number, seed setting rate, 1000-grain weight, and plant height. (F) Grain appearance from WT and OsATG4b-OE lines. (G and H) Chalkiness evaluation of WT and OE lines, including DC and CGR. Data are means ± SD (n = 10). Statistical significance was determined using Student’s t-test: p < 0.01 (**); NS, not significant.
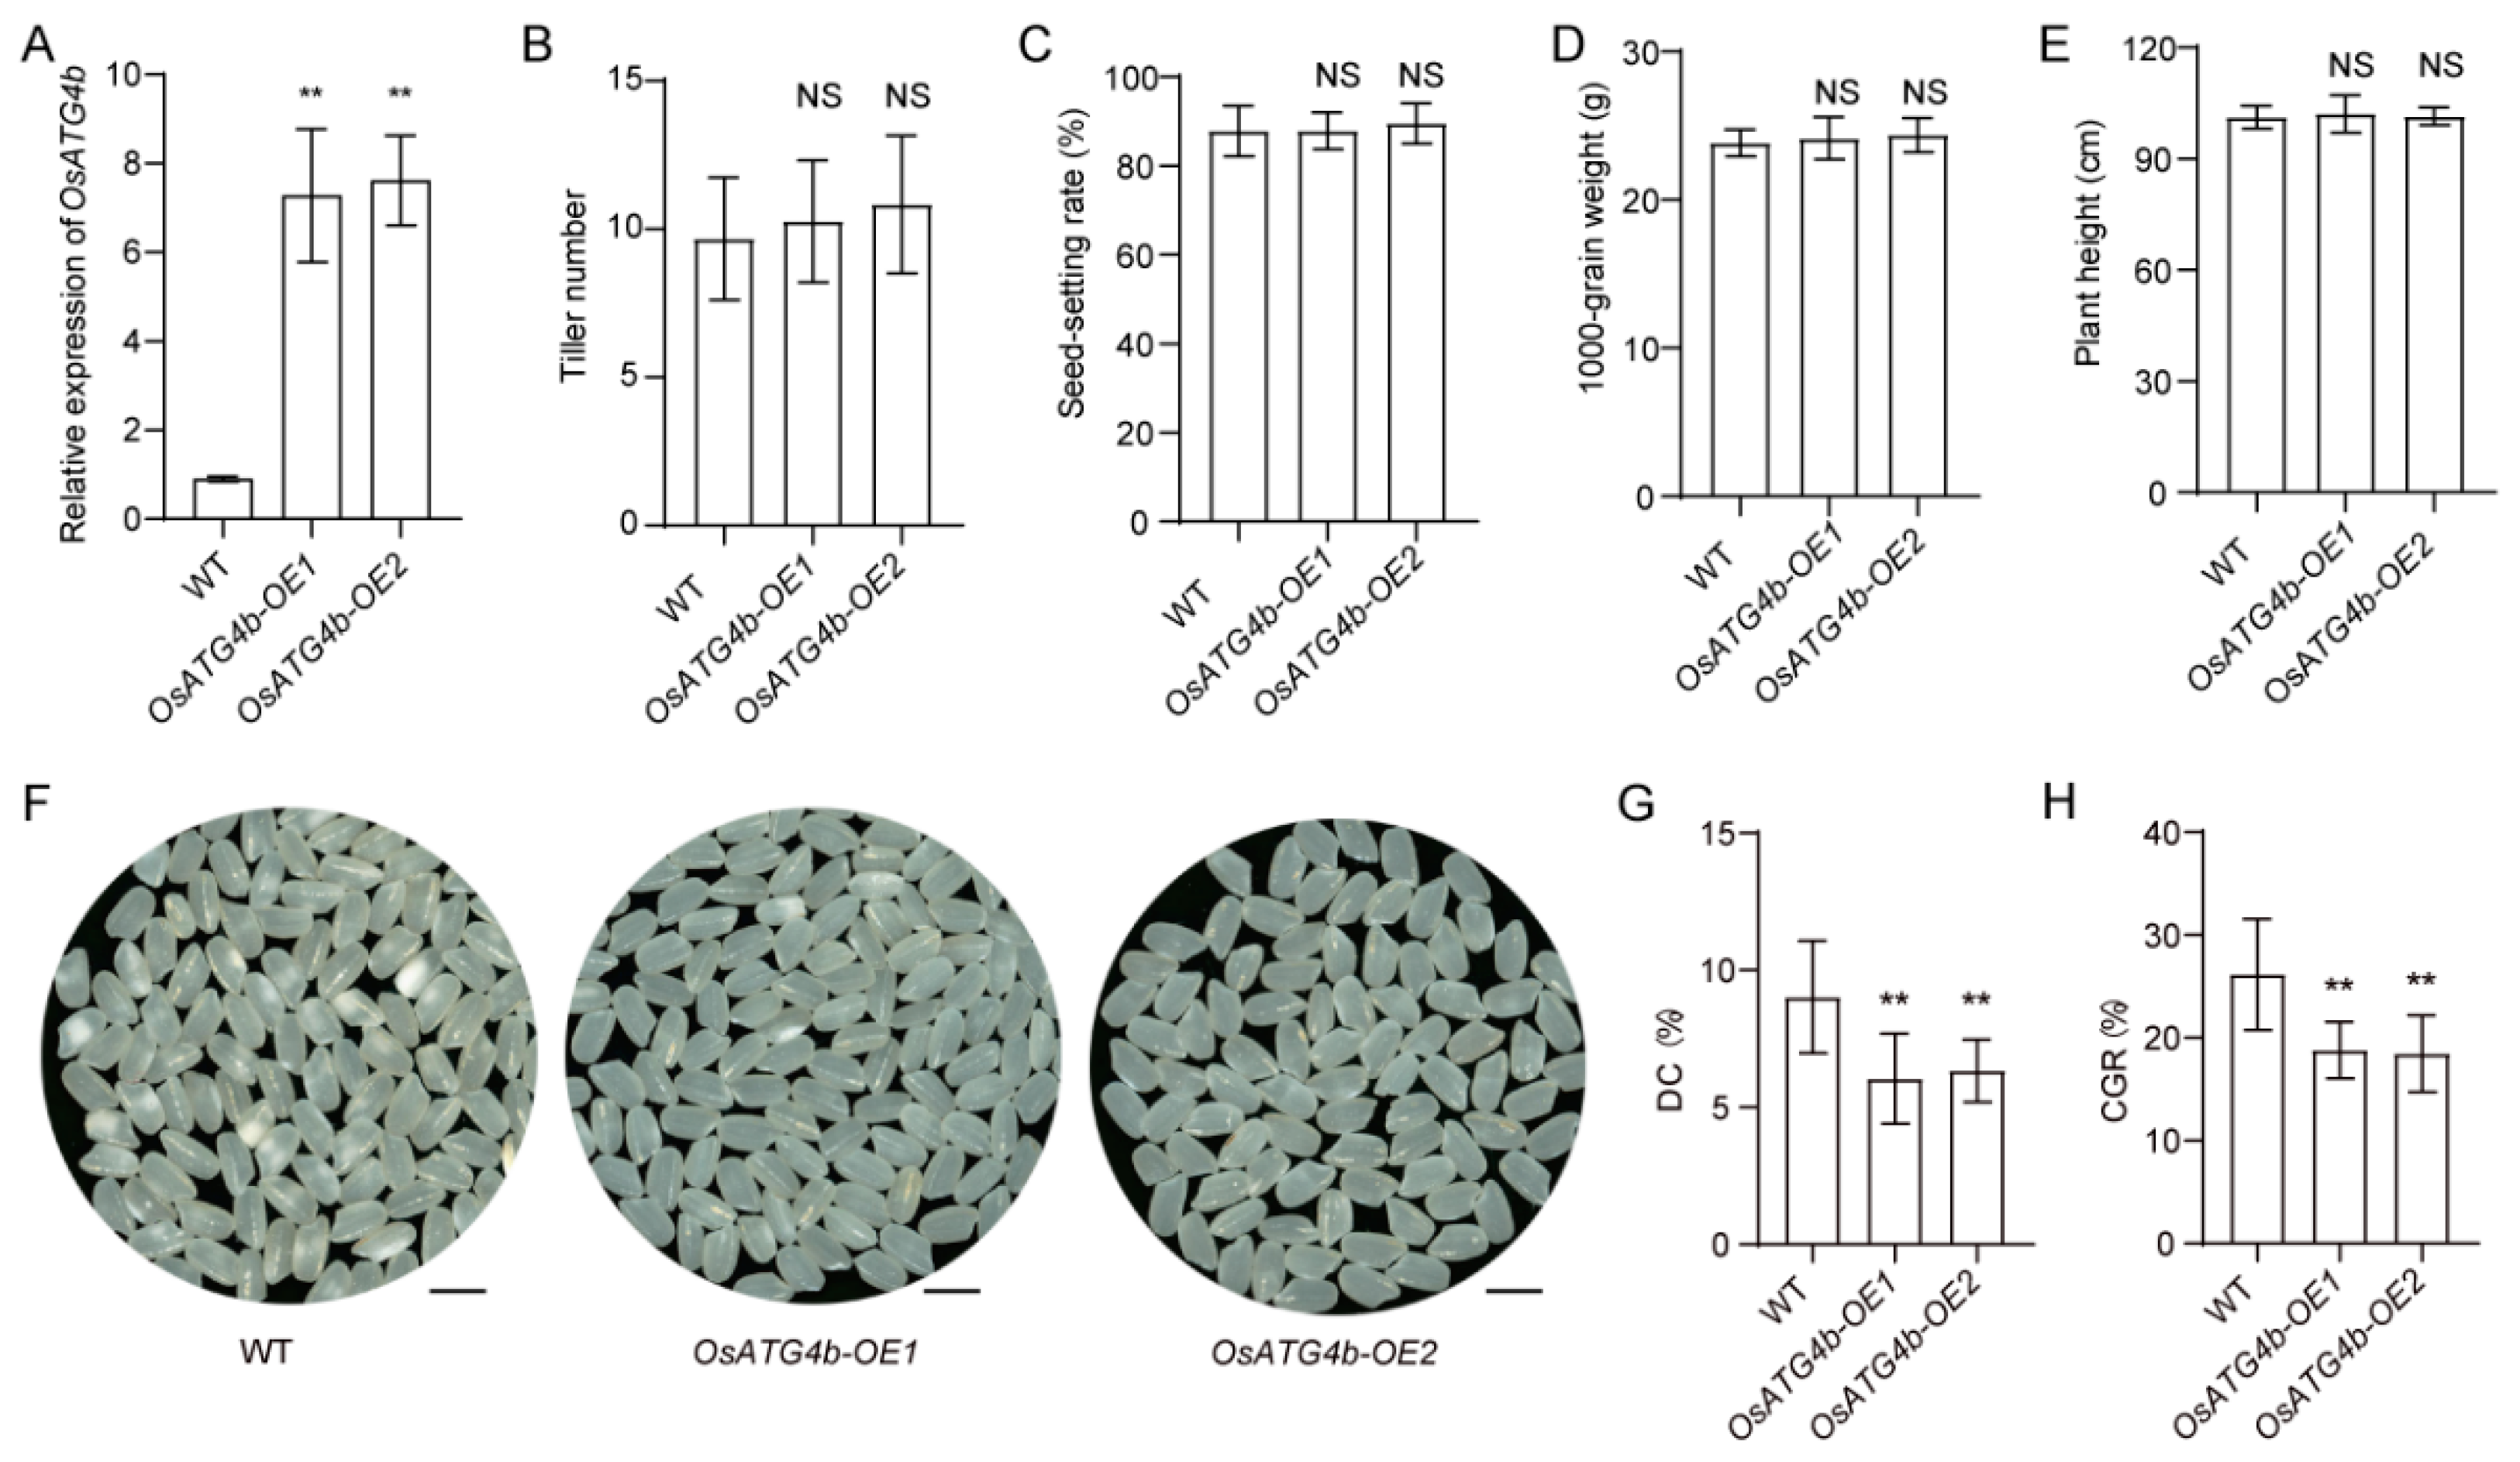
Figure 7.
OsATG4b affects starch granule and protein body morphology, as well as seed storage protein accumulation. (A) Scanning electron microscopy images of transverse sections from mature seeds of WT and osatg4b mutants, showing altered endosperm structure. Scale bars: 500 µm (top), 10 µm (middle), 5 µm (bottom). (B) Transmission electron microscopy analysis of developing endosperm cells at 13 days after flowering (DAF). Scale bars: 5 µm (top), 2 µm (bottom). Red arrows indicate abnormal protein bodies. (C and D) Quantification of total starch content and apparent amylose content in mature seeds. (E–I) Comparison of total protein, albumin, glutelin, prolamin, and globulin contents among WT and osatg4b seeds. Data are presented as means ± SD (n = 10). Statistical significance was determined using Student’s t-test: p < 0.01 (**); NS, not significant.
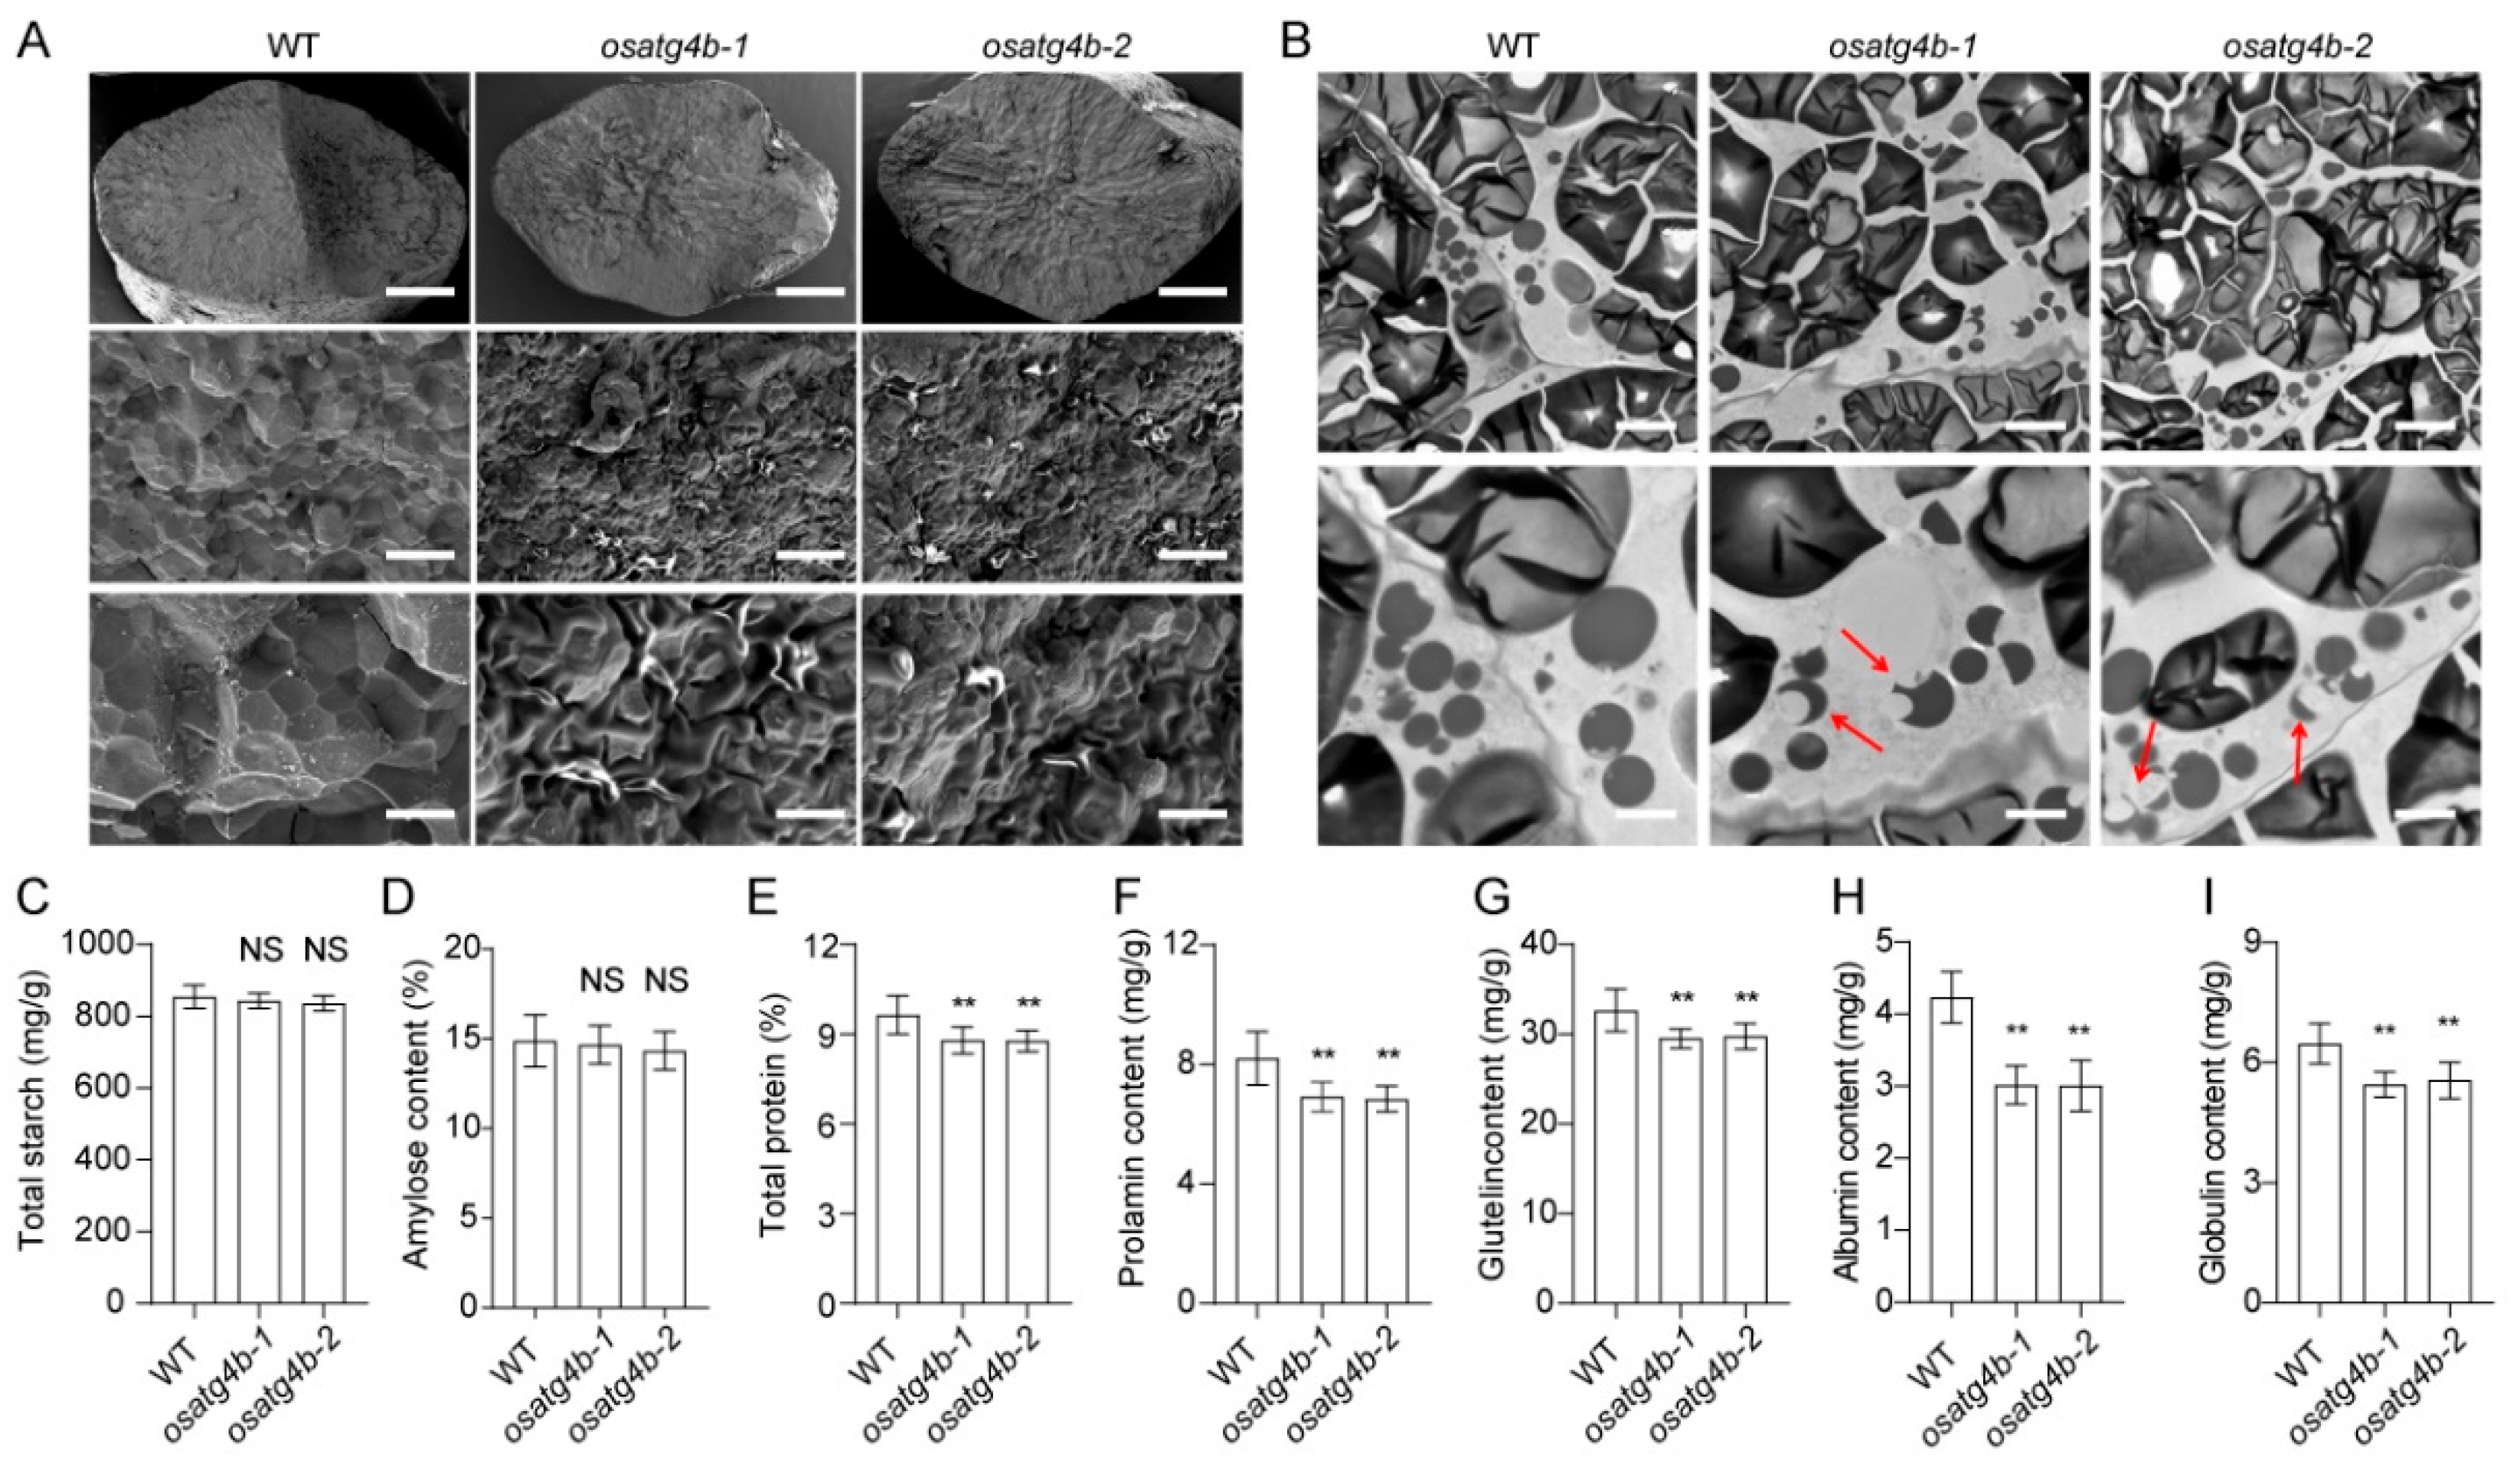
Figure 8.
qRT-PCR analysis of genes involved in seed storage protein and starch metabolism. (A–H) Relative expression levels of OsGluA-2, OsGluB-2, OsGluC-1, PROLM24, PROLM25, PROLM28, OsGBSSI, and OsSBEI in WT and osatg4b-1. Data represent means ± SD (n = 3). Statistical significance was determined using Student’s t-test: p < 0.01 (**); NS, not significant.
Disclaimer/Publisher’s Note: The statements, opinions and data contained in all publications are solely those of the individual author(s) and contributor(s) and not of MDPI and/or the editor(s). MDPI and/or the editor(s) disclaim responsibility for any injury to people or property resulting from any ideas, methods, instructions or products referred to in the content. |
© 2025 by the authors. Licensee MDPI, Basel, Switzerland. This article is an open access article distributed under the terms and conditions of the Creative Commons Attribution (CC BY) license (http://creativecommons.org/licenses/by/4.0/).
Copyright: This open access article is published under a Creative Commons CC BY 4.0 license, which permit the free download, distribution, and reuse, provided that the author and preprint are cited in any reuse.


