
Submitted:
07 July 2025
Posted:
08 July 2025
You are already at the latest version
Abstract
3D printing refers to the process of producing physical objects from a computer model. With the ongoing advancements in technology, the introduction of printers equipped with fused granular fabrication (FGF) technology has significantly broadened the range of usable materials. This innovation also enables the mixing of materials during the printing process, thereby reducing costs associated with manufacturing mixtures and blends. This article aims to evaluate the mechanical properties of blends of polypropylene (PP) with acrylonitrile butadiene styrene (ABS) manufactured in a printer with FGF technology. Tensile and compressive strength, impact resistance, shore D hardness and hardness were performed. The materials were characterized by scanning electron microscopy (SEM), differential scanning calorimetry (DSC) and thermogravimetry (TG). The results of the pure material and the blends were compared. For mechanical performance, there was no improvement in the parameters evaluated. The blends exhibited more ductile failure behavior than for the pure materials. Despite the easier manufacturing and reduction of thermal processes, the manufacture of PP and ABS blends did not present advantages other than the increase in the degree of crystallization of the PP matrix.
Keywords:
blends
; additive manufacturing
; fused granular fabrication
1. Introduction
3D printing is a process that transforms 3D models produced from a computer-aided design (CAD) into physical objects. For the manufacture of 3D objects, a 3D computer model, software capable of processing the model, a machine or printer that uses 3D technology and the material to be used are required [1].
There are seven classifications additive manufacturing (AM) processes [2]: Extrusion of Materials (MEX), Vessel Photopolymerization (VPP), Powder Bed Melting (PBF), Binder Jetting (BJT), Material Jetting (MJT), Sheet Rolling (SHL), Directed Energy Deposition (DED).
AM refers to the production of physical objects from a computational model with the possibility of using different materials with complex geometries that were impossible for previous manufacturing technologies [3,4,5,6].
Within the MEX process, one of MA's technologies is filament fusion manufacturing (FFF). In this method, the thermoplastic filament is melted in the heating block, directed to the extruder nozzle and cooled again after leaving the nozzle. In this process, the material is deposited layer by layer until the object is made (Figure 1) [1,7,8].
To use this method, it is necessary to manufacture the filament. To do this, the pellets are melted and transformed into filaments, constituting a thermomechanical cycle before printing. In comparison, Fused Granule Fabrication (FGF) technology eliminates this cycle by directly utilizing the granular form (pellets).
FGF is a process in which the printer is fed directly into the pellets. The pellets are stored in a hopper and directed to screw extruder. In the screw, the material is melted in the heating block region and forced into the nozzle. After leaving the nozzle, the material is cooled, which is selectively deposited layer by layer until the object is completed (Figure 2).
The use of granular material makes it possible to use more types of materials. In addition, it allows the mixing of elements directly in the extruder. It also avoids additional processes in the material while preserving the physical capabilities of the polymer [7]. This method, compared to FDM, saves energy costs and the time used to manufacture the filament, making the material less expensive [5,6].
The extruder screw can deposit material up to two hundred times faster than in conventional printing technology [6]. This allows the manufacture of products with greater volume, on a larger scale and in a shorter time.
FGF technology allows the use of many thermoplastic polymers, including ABS and PP. In 3D printing, the use of PP is a challenge because its crystallization causes thermal shrinkage, affecting the interfusion between the layers [9]. In addition, another problem encountered with the use of PP in material extrusion (ME), is the low adhesion of the material on the printing platform [10].
One way to promote the use of PP in 3D printing is the use of blends with other thermoplastic materials to reduce the problems in the use of PP in 3D printing. One of the hypotheses investigated in this research is whether the blend of PP and ABS would improve the behavior of the PP matrix during printing.
The blend between PP and ABS has already been studied by other researchers. K. Wang et al. [11] used ABS as a β-nucleating agent (β-NA) to harden PP. To make mixture they used the melting mixing method, the materials were melted at a temperature of 180°C in the proportion of 80% PP and 20% ABS and mixed with a rotation of 60rpm for 8 min. The resulting material was transferred to a mold injection machine for the manufacture of the specimens, with a melting temperature of 180°C and a mold temperature of 40°C for 8 seconds.
A. C. Patel, R. B. Brahmbhatt, and S. Devi [12] used PP-g-2-HEMA to make the PP blend compatible with ABS in different concentration proportions. To do this, PP and PP-g-2-HEMA were premixed in a 1:1 ratio in a simple extruder with four different temperature zones: 190-200-210-220°C. com a rotational speed of 50rpm. After that, the material was palletized and mixed with ABS in the same extruder with temperature zones of 200-220-230-225°C at 50rpm for PP-rich blends and 220-230-250-240°C for ABS-rich blends. The resulting mixtures were palletized and the specimens manufactured by injection molding.
C. Wang, Z. Zhang, Y. Du, J. Zhang, and K. Mai [13] used a β-NA, PP and ABS to make blends of PP and ABS with several different concentrations. The blends were prepared in two different ways. The first one mixed β-NA, PP and ABS simultaneously in an HK-200 internal mixer with a temperature of 240°C and a rotation speed of 50 rom for 5 min. The second way was to first prepare the PP mixture with 5% of the weight of β-NA in a twin-screw extruder with a temperature of 190°C, the material was palletized and mixed in the internal mixer with ABS to make the blend.
G. S. Lohar and B. F. Jogi [14] blended PP with ABS in concentrations of 80% PP and 20% ABS using a twin-screw extruder rotating in opposite directions. The temperature range used was 155-210-240°C with a rotation speed of 10rpm. The resulting material was transferred to an injection machine in an in-mold where the samples were molded at 220°C for 3 minutes.
A similar thing in the research cited is that first the material needs to be manufactured and then go through a molding process. Thinking about reducing the number of steps for the manufacture of blends and energy expenditure, it would be possible to use FGF 3D printing technology to unite the blending manufacturing process with the manufacture of inputs. The second objective of this work was to use FGF printing to reduce one of the stages of manufacturing the polymeric blend, aiming at the production of inputs with a lower energy consumption.
2. Materials and Methods
2.1. Preparation of Blends
The specimens of the pure materials (PP and ABS) and of the blends were prepared using acrylonitrile butadiene styrene (ABS) GP 35, produced by ineos styrolution, and heterophasic polypropylene (PP) copolymers GR105 produced by Braskem.
The samples were prepared at different percentages and named as shown in Table 1:
All specimens were digitally modeled in Autodesk Fusion 360 © 2020 Autodesk, Inc. software. The software used for slicing the 3D model was Prusaslicer 2.7.1 +win 64.
The 3D printer used to print the specimens was the Piocreat G5 (Shenzhen PioCreat 3D Technology Co., Ltd, China), a printer with fusion granuled fabrication (FGF) technology that prints using pellets, thus allowing the blending of materials to be done directly in the printer itself. The printing parameters are described in Table 2:
The temperature variation for the first layer and other layers for PP and blends is due to their low adhesion to the platform, to make printing possible, a adhesive for PP and PE was used, commercially acquired at F3DBR from F3DBR commerce of articles for 3D printing LTDA. At 110°C the adhesive is in a viscous state, so the printer fuses the first layer, after the first layer is finished the printer is paused and waits until the temperature decreases, then the adhesive solidifies and sticks the PP on the platform, with this it is possible to print the remaining layers of the objects.
2.2. Tensile Strength Test
The tensile test was carried out with the objective of evaluating mechanical properties such as Tensile Strength Limit (LRT) and Modulus of Elasticity (ME) in the tensile. The modeling of the test specimens for traction followed the criteria of the standard, the type 1 specimens recommended for rigid and semi-rigid plastics were chosen [15].
The direction of the filling was changed on the specimens, specimens were printed with the filling at 45° angles in relation to the length of the specimen (Figure 3. A), with the x and y axis, intersecting perpendicular to each layer, and others at angles of 0° and 90° with the x axis, changing the direction layer by layer (Figure 3. B).
The tensile specimens were named with the acronyms for samples present in Table 1 with the addition of the filling angle.
The test was performed on a universal testing machine – EMIC DL 10000, with a speed of 10 mm/min. Before each essay, all samples were measured using a digital caliper with an accuracy of 0.05 mm at three different points in the reduced section of each sample. For each sample, five specimens were manufactured and evaluated.
2.3. Compressive Strength Test
The purpose of the compression test is to evaluate the mechanical properties of Compressive Strength Limit (LRC) and Modulus of Elasticity at Compression (MEC).
The dimension for the modeling of the compression specimens was obtained using the norm [16], it was decided to use prismatic specimens, because it would be possible to print them horizontally (Figure 4), that is, one of the faces with a larger area facing the printing platform, and vertically, one of the faces with a smaller area in contact with the printing platform.
The test was performed on a universal testing machine – EMIC DL 10000, with a test speed of 1.3 mm/min and a maximum displacement of 10 mm. Before each essay, all samples were measured using a digital caliper with an accuracy of 0.05 mm before each essay. For each sample, five specimens were manufactured and evaluated.
2.4. Izod Impact Resistance Test
The standard for the modeling of the specimens was ASTM D256-10 [17], this test aims to evaluate the impact of resistance. The test was carried out on a Resil impactor Junior from Ceast (Torino, Italy), five specimens were manufactured and evaluated for each sample. Before each test, V-shaped notches were made, and three points of the test specimens were measured using a digital caliper with a precision of 0.05 mm.
2.5. Shore D Hardness Test
The specimens for the hardness test were molded following the minimum thickness recommended by the standard ASTM D 2240-00 [18]. The specimens were designed in a cylindrical shape with a diameter of 50.8 mm and a thickness of 7 mm. This test aims to evaluate the shore D hardness (HSD) of the material.
The hardness of 5 specimens of each sample was evaluated. The analysis of the first printing layer and the last printing layer was carried out. Each side of the specimens was separated into five parts (Figure 5). After the test, the averages of the regions for each PC are made. The tests were carried out using a Barry Century Shore D durometer.
2.6. Scanning Electron Microscopy (SEM)
Using SEM, with a magnification of 100x and 500x, the images of the fractures of the specimens after the impact resistance test were evaluated. The slim electron microscope of the Shimadzu model SS-550 was used. Prior to the scan, the samples were metallized to increase their conductivity. Images with magnifications of 100x and 500x were taken. 1 specimen was analyzed for each type of sample.
2.7. Differential Scanning Callometry (DSC)
DSC analysis was used to identify the crystallization temperature, melting and crystallinity index. The material for the DCS thermogravimetry tests was collected from samples after printing, through sectioning with the use of a stylus. The equipment used for the DSC analysis was the DSC Q20 V24.11 Build 124. For the test, aluminum izero pans, nitrogen gas atmosphere with an application rate of 50 mL/min were used and for the thermal cycle a variation of 10 °C/min.
2.8. Thermogravimetry (TGA)
The thermal stability of the samples was evaluated with thermogravimetry analysis. TGA Q50 V20.13 Build 39 equipment was used. The tests were carried out with a titanium pan and the use of nitrogen gas with an application rate of 50.0 mL/min. The temperature ranged from 10°C/min.
3. Results and Discussions
During the printing of the 50/50 blend the printing layers did not adhere correctly to each other, making it impossible to manufacture, so the only blends evaluated were the 80/20 and 90/10 of PP and ABS, respectively.
3.1. Tensile Strength Test
For pure LRT, ABS presented a value about 2.6 times higher than that of PP for printing at a 45° angle, and 2.5 times higher for filling at a 90° angle (Figure 6). The blends did not obtain satisfactory LRT for the FGF 3D printing technology, in Figure 6, it was observed that there was no increase in resistance with the addition of ABS in the PP matrix. Wang et al [11] also carried out tests using PP and PP blend with ABS, but the molding of the specimens was done by the traditional extrusion method, for the method used by him the LRT for PP and the blends was higher, indicating a better performance for tensile strength for PP and for the blend in the injection mold manufacturing method.
The values obtained were statistically compared using the Student's t-test, considering 95% reliability. Comparisons were made for the group of printed samples filled at 45° (Table 3), at 90° (Table 4) and between the 45° and 90° angles for the same types of samples (Table 5).
The mixtures negatively affected the LRT of the samples at the 45° angle, the higher the percentage of the mixture, the lower the resistance (Table 3). In table 4, among the blends the one that had the best behavior was 80/20, however, even so, the mixtures negatively affected the pure samples.
According to Table 5, a 45° infill angle generally resulted in better performance, except for the 20/80 blend, which exhibited a statistically superior LRT at 90°. This shows that for the pure material, the best angle for filling the 3D printed body is 45°.
In relation to the BD, for ABS, the value of the BD for the 90° filling direction was 1.59 times higher than the 45° direction, whereas for PP and blends, the filling direction did not considerably influence the value of this parameter (Figure 7). Wang et al. [11], also studied the EM, however, because they manufactured the samples by conventional extrusion, the specimens are only solid, without a defined filling direction, they obtained higher values of ME, again indicating that for PP and for the blends of PP and ABS, it is possible to generate objects with better physical resistance by conventional manufacturing.
Statistically, the ME in traction was higher for ABS for both the 45° and 90° filling angles, indicating a lower ABS deformation when used in additive manufacturing than for PP and blends (Table 6 and Table 7). At a 45° angle, the blends behaved similarly to pure PP (see Table 6). Adding 20% ABS to the matrix at a 90° angle increased the value of EM compared to pure PP (Table 7).
Table 8 shows the comparison between the ME for the same material, but with a different filling angle, for ABS and the 20/80 blend, the filling angle influenced, with a higher ME for the 90° angle. For the PP, the values are statistically equal for the two angles.
3.2. Compressive Strength Test
As in the tensile test, the highest values of the compressive strength limit (LRC) were obtained by ABS (Figure 8). Furthermore, it was noted that the printing direction had no significant effect on the LRC values of ABS, however, the direction affected the values for PP and its blends.
One hypothesis for this difference in LRC is that when the sense of force is perpendicular to the printing layers, one layer is crushed against another, and the resistance ends up being mostly from the material itself. On the other hand, when this force is applied in the same direction as the printing layer, there is an influence of the adhesion between the layers in the LRC. In addition, the PP crystallization process in 3D printing causes thermal shrinkage affecting the interfusion between the layers, consequently decreasing adhesion strength between the PP layers, this may explain what happens in Figure 8 in which the LRC value was lower for the bodies printed horizontally than for the bodies printed vertically, especially for PP and blends [9].
The deformation for the PP and blends specimen was not uniform when the force was applied in a parallel direction to the printing layers, that is, to the printed body in the horizontal direction (Figure 9). The shape of the deformation was like a wave, and there was also a detachment between the layers. Meanwhile, bodies printed in the vertical direction had a more uniform deformation. This difference in direction and how deformation occurs is possibly due to the 3D printing process that deposits layer by layer.
Statistically, for the horizontal direction, the pure samples had better performance in relation to the blends (Table 9). In Table 10, for the vertical printing direction, there was no statistical difference for the LRC of PP in relation to the mixtures.
The printing direction for the ABS did not affect the LRC for the ABS samples, while. for PP and blends, the LRC performance of the horizontal direction was lower than the vertical direction (Table 11). Again, this indicates the hypothesis that the adhesion strength between the layers of PP is lower than that of ABS for FGF printing technology.
Another parameter analyzed with the compressive strength test was the ME in compression. In Figure 10 it is possible to see the means for each sample. The ME was more than three times the value for ABS than for PP in both directions analyzed. On the other hand, the lowest ME value was for the blends in the vertical direction.
Statistically, in Table 12, it is possible to notice that ABS had the highest value of ME in compression for prints made horizontally in relation to PP and blends, which demonstrated comparable behavior in this direction. In the vertical direction (Table 13), the ME values were adversely affected by the presence of blends.
Regarding the differences in the vertical and horizontal direction (Table 14), the ME in compression was higher for ABS in the vertical direction, while for the mixtures the highest value was in the horizontal direction. Meanwhile, the printing direction did not affect PP's ME.
3.3. Impact Resistance Test
In Figure 11 it is possible to see the values of impact resistance, the material that obtained the highest resistance value was PP, followed by ABS, but the material blends had a negative effect on the impact resistance of 166.43 J/m similar result [19], which obtained a resistance of 143.8 J/m for specimens manufactured with FFF printing technology, according to the author, the value was below those previously reported for different grades of ABS (520-550 J/m).
For PP, the resistance values were different from those found in previous studies. Wang and Gardner [20], studied how the printing temperature and layer height influenced the resistance to izod impact, the resistance obtained in traditional manufacturing was close to 700 J/m, much higher than approximately 350 J/m and 500 J/m achieved by printed specimens with layer height of 0.3mm and 0.1mm respectively produced at a temperature of 250°C. The results obtained by him were even greater for the impact resistance obtained in the tests of this article.
Table 15 shows that the impact strength was higher for PP and later for ABS. With the increase in the concentration of ABS in the blends, the impact resistance was lower.
3.4. Shore D Hardness Test
Regarding hardness, it is possible to see, in Figure 12, that both on the top face of the PC and on the base face the values were similar. Regarding the type of material, ABS exhibited the highest level of hardness. The blends did not seem to influence the hardness compared to the PP value.
Table 16 shows that, statistically, both faces exhibited similar performance for ABS and the 90/10 blend. In contrast, the PP samples presented higher hardness on the top surface, whereas the 80/20 blend showed greater hardness on the base. Table 17 shows a comparison between the tops of one material different from the other, in this case the highest value was for ABS, while PP and the 80/20 sample had similar behavior, and the lowest value was for the 90/10 blend.
In Table 18 the same comparison is made, but for the base-facing face, the highest performance was also for ABS, followed by the 20/80 blend, which had a better value than PP, while the PP value was like the 90/10 blend.
3.5. Scanning Electron Microscopy (SEM)
SEM was used to analyze the fracture surface of the bodies after the impact test. In Figure 13 and Figure 14, the magnitude used to compare the specimens was 100x and 500x, respectively. It is possible to notice roughness on the surface of ABS and TEM and PP, indicating a more fragile breaking behavior for the samples. For blends, the surface has a wavy and smooth appearance, as if it had been stretched at break by the impact test, suggesting a ductile behavior of the material.
3.6. Differential Scanning Allometry (DSC) And Thermogravimetry (TG)
As shown in Figure 15, the DSC analysis revealed that blending affected the melting temperatures of the materials. For pure materials, the melting temperature was 108.58°C for ABS and 136.75°C for PP, for blends the melting temperature was 163.97°C and 164.36°C for 10/90 and 20/80, respectively. It can also be noted that the enthalpy of fusion of the blends was higher than that of the pure materials, suggesting that the ABS in the PP matrix generated the crystallization of the molecules of the blends.
According to the TG results presented in Figure 16, the onset of thermal decomposition occurred at approximately 345°C for PP and 315°C for ABS. When the blends were made, the results were thermogravimetric in relation to weight (TG), the decomposition temperature was lower in relation to the pure components, being about 305°C and 290°C for the blends of 10/90 and 20/80, respectively.
In the same figure, the TG derivative (DTG), the peaks for the deterioration of the blends were below the peaks of the pure materials, another thing to note is that the 80/20 mixture had two distinct peaks, which may indicate the existence of two materials with different behaviors in the same sample, showing that there was no mixture between the PP matrix and the ABS.
4. Conclusions
This study evaluated the mechanical and thermal properties of PP and ABS blends produced using FGF 3D printing technology, with the aim of reducing production steps and energy consumption in additive manufacturing. The results indicate that blending polypropylene (PP) with acrylonitrile butadiene styrene (ABS) did not lead to any mechanical enhancements over the pure polymers.ymermers The difficulties experienced during the 3D printing process were consistent for both the blends and the pure polypropylene (PP), suggesting that the incorporation of acrylonitrile butadiene styrene (ABS) did not improve processing or printability.
During the analysis, it was seen that the blends of ABS and PP, in some cases, had values equal to PP or were negatively affected by the combination. This shows that there was no benefit in the mechanical properties of the blend of ABS and PP.
It is observed that the blend of PP and ABS has not provided any mechanical benefit to 3D printing. The challenges encountered during the printing of PP and its blends were identical.
Thermal analysis further revealed that the degradation temperature of the blends was lower than that of the individual pure materials, which may limit their applicability in environments requiring higher thermal stability. However, a notable outcome was the increased degree of crystallization in the PP matrix when blended with ABS, which could influence other physical properties.
The findings suggest that, while FGF technology offers significant advantages in terms of process simplification and energy savings by enabling direct pellet-based printing and in situ blending, the mechanical performance of PP/ABS blends does not surpass that of the base polymers under the tested conditions. This underscores the need for continued research into alternative blend compositions, compatibilizers, or processing parameters that might overcome the current limitations.
Funding
This research was funded by Conselho Nacional de Desenvolvimento Científico e Tecnológico grant number 424208/2021-0, Financiadora de Estudos e Projetos grant number 0040/23 and Company Smart Sensor Design – Empresa Paranaense de Sensores.
References
- P. J. Kitson, S. Glatzel, W. Chen, C. G. Lin, Y. F. Song, and L. Cronin, “3D printing of versatile reactionware for chemical synthesis,” Nat Protoc, vol. 11, no. 5, pp. 920–936, May 2016. [CrossRef]
- ISO/ASTM 52900:2015, Standard Terminology for Additive Manufacturing - General Principles - Terminology. 2015. [Online]. Available: http://www.ansi.org.
- N. H. Mohd Yusoff, L. R. Irene Teo, S. J. Phang, V. L. Wong, K. H. Cheah, and S. S. Lim, “Recent Advances in Polymer-based 3D Printing for Wastewater Treatment Application: An Overview,” Chemical Engineering Journal, vol. 429, Feb. 2022. [CrossRef]
- Y. Xiong, Y. Tang, Q. Zhou, Y. Ma, and D. W. Rosen, “Intelligent additive manufacturing and design state of the art and future perspectives,” Addit Manuf, vol. 59, Nov. 2022. [CrossRef]
- J. Izdebska-Podsiadly, Polymers for 3D Printing: Methods, Properties, and Characteristics. Elsevier Science, 2022. Accessed: Apr. 22, 2024. [Online]. Available: https://books.google.com.br/books?id=n_MnzgEACAAJ.
- C. E. Duty et al., “Structure and mechanical behavior of Big Area Additive Manufacturing (BAAM) materials,” Rapid Prototyp J, vol. 23, no. 1, pp. 181–189, 2017. [CrossRef]
- A. L. J. Munhoz et al., Manufatura Aditiva: Tecnologias e aplicações da impressão 3D, 1st ed. São Paulo: Edgard Blucher LTDA, 2017.
- X. Zhang and J. Wang, “Controllable interfacial adhesion behaviors of polymer-on-polymer surfaces during fused deposition modeling 3D printing process,” Chem Phys Lett, vol. 739, Jan. 2020. [CrossRef]
- A. D. Valino, J. R. C. Dizon, A. H. Espera, Q. Chen, J. Messman, and R. C. Advincula, “Advances in 3D printing of thermoplastic polymer composites and nanocomposites,” Nov. 01, 2019, Elsevier Ltd. [CrossRef]
- K. Winter, J. Wilfert, B. Häupler, J. Erlmann, and V. Altstädt, “Large Scale 3D Printing: Influence of Fillers on Warp Deformation and on Mechanical Properties of Printed Polypropylene Components,” Macromol Mater Eng, vol. 307, no. 1, Jan. 2022. [CrossRef]
- K. Wang et al., “Influence of organo-sepiolite on the morphological, mechanical, and rheological properties of PP/ABS blends,” Polymers (Basel), vol. 11, no. 9, Sep. 2019. [CrossRef]
- A. C. Patel, R. B. Brahmbhatt, and S. Devi, “Mechanical properties and morphology of PP/ABS blends compatibilized with PP-g-2-HEMA,” J Appl Polym Sci, vol. 88, no. 1, pp. 72–78, 2003. [CrossRef]
- C. Wang, Z. Zhang, Y. Du, J. Zhang, and K. Mai, “Effect of acrylonitrile-butadiene-styrene copolymer (ABS) on β-nucleation in β-nucleated polypropylene/ABS blends,” Polymer Bulletin, vol. 69, no. 7, pp. 847–859, Oct. 2012. [CrossRef]
- G. S. Lohar and B. F. Jogi, “Influence of Carbon Black (CB) on Mechanical Behaviour and Microscopic Analysis of Poly-propylene (PP)/ Acrylonitrile-butadiene- styrene (ABS) Nanocomposites,” in Procedia Manufacturing, Elsevier B.V., 2018, pp. 85–90. [CrossRef]
- ASTM International, “ASTM D638-10, Standard Test Method for Tensile Properties of Plastics,” 2010.
- ASTM International, “ASTM D695 - 02a,Standard Test Method for Compressive Properties of Rigid Plastics,” 2002.
- ASTM International, “ASTM D256-10, Standard Test Methods for Determining the Izod Pendulum Impact Resistence of Plastic,” 2010.
- ASTM International, “ASTM D 2240-00 Standard Test Method for Rubber Property - Durometer Hardness,” 2000.
- A. M. Oviedo, A. H. Puente, C. Bernal, and E. Pérez, “Mechanical evaluation of polymeric filaments and their corresponding 3D printed samples,” Polym Test, vol. 88, Aug. 2020. [CrossRef]
- L. Wang and D. J. Gardner, “Effect of fused layer modeling (FLM) processing parameters on impact strength of cellular polypropylene,” Polymer (Guildf), vol. 113, pp. 74–80, 2017. [CrossRef]
Figure 1.
FFF print scheme. Adapted from A. L. J. Munhoz et al. [7].
Figure 1.
FFF print scheme. Adapted from A. L. J. Munhoz et al. [7].
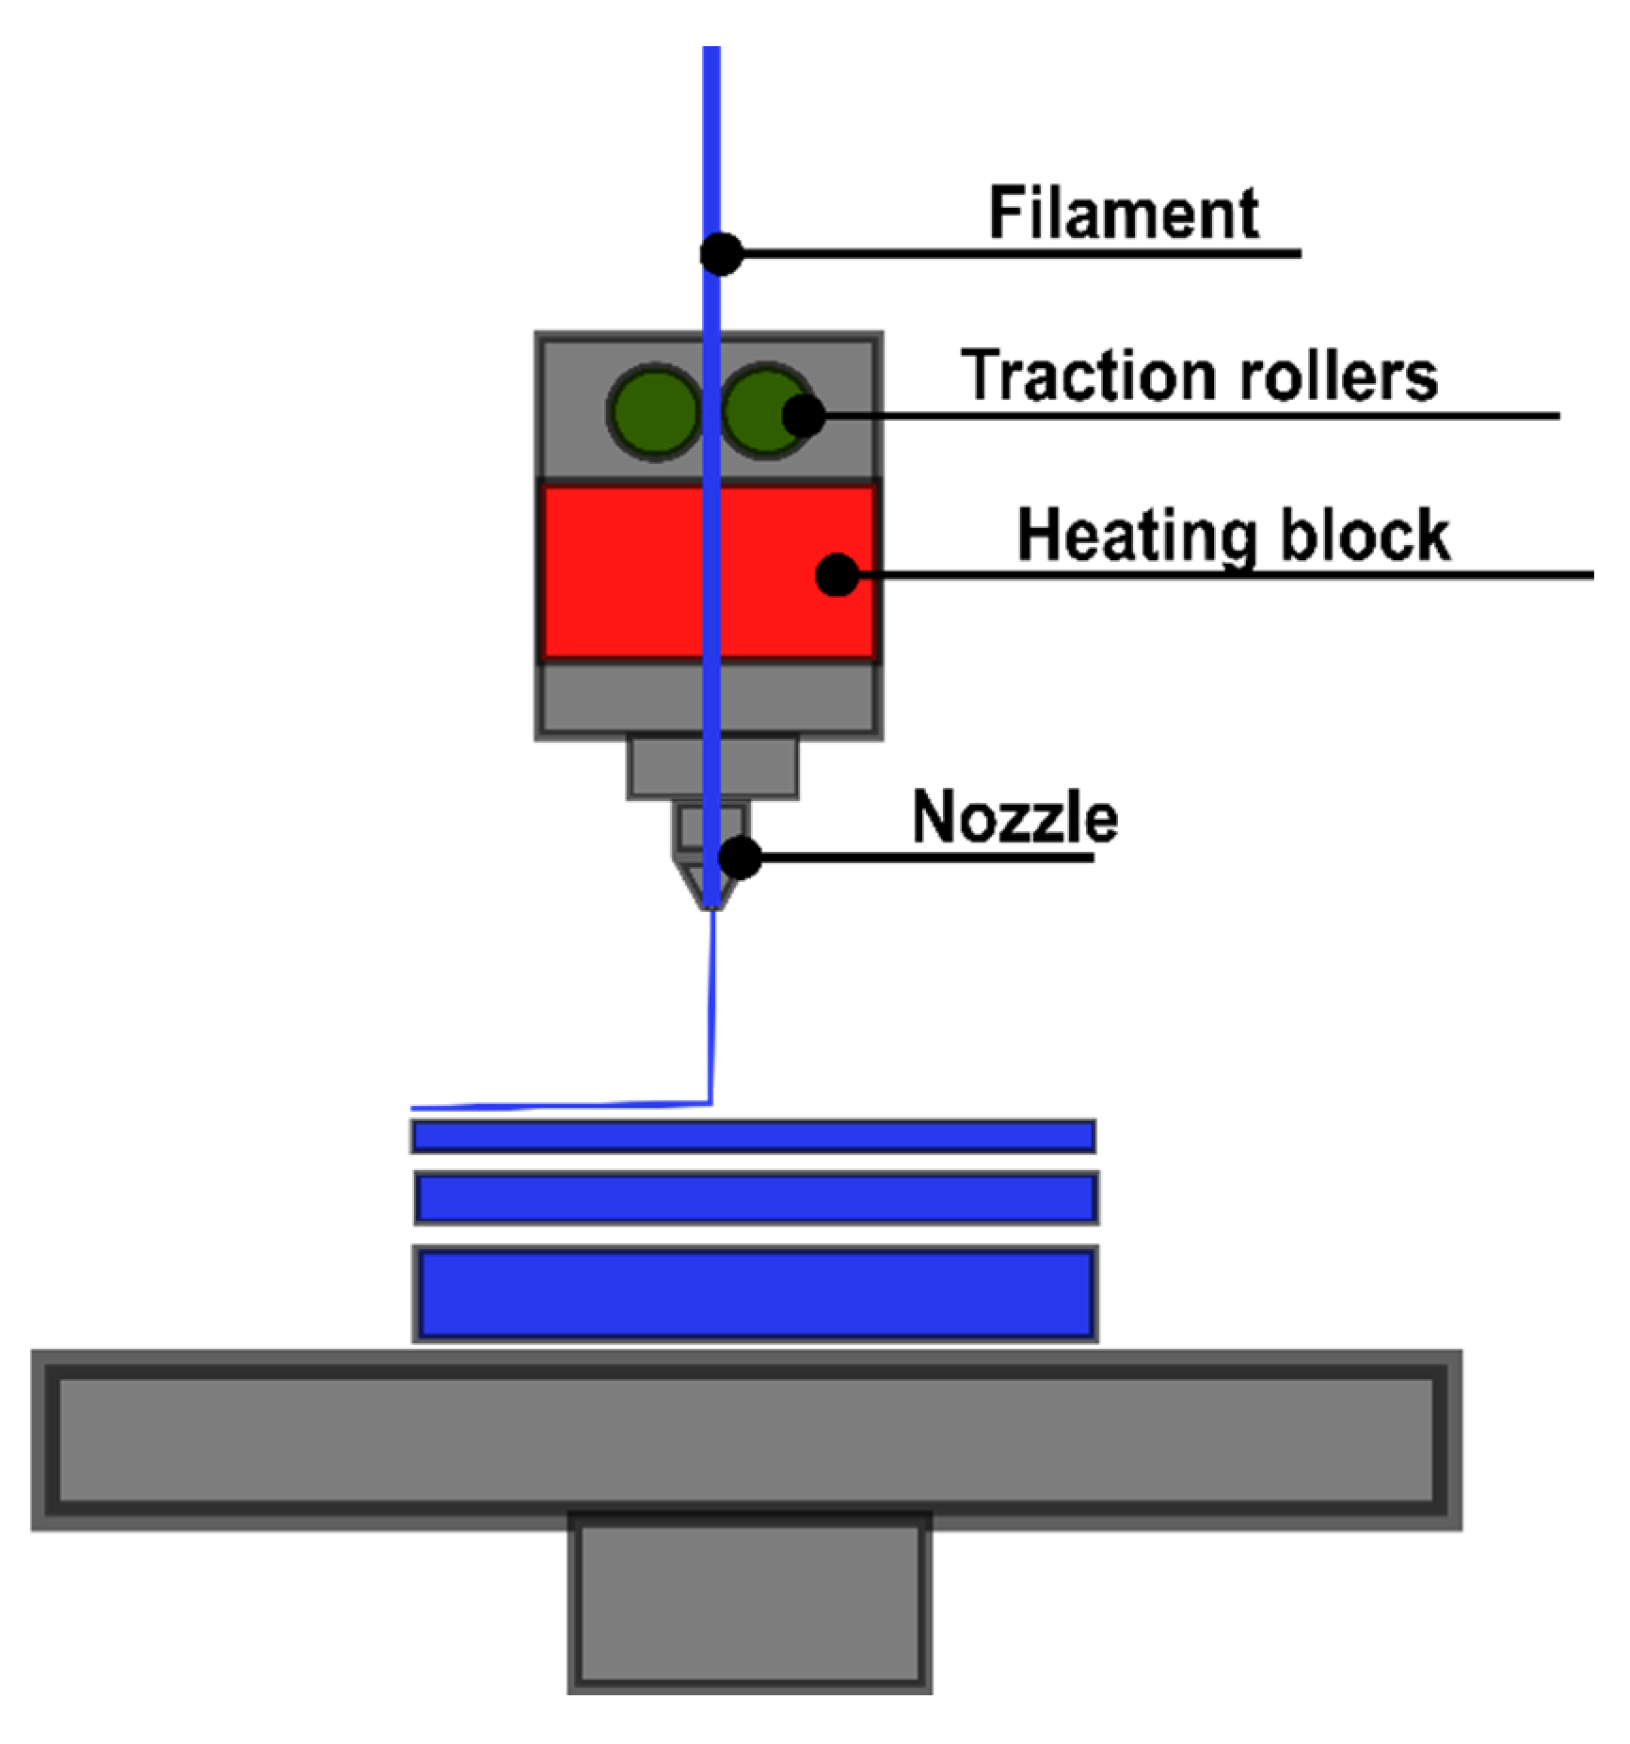
Figure 2.
FGF 3D printing scheme. Adapted from A. L. J. Munhoz et al [7].
Figure 2.
FGF 3D printing scheme. Adapted from A. L. J. Munhoz et al [7].
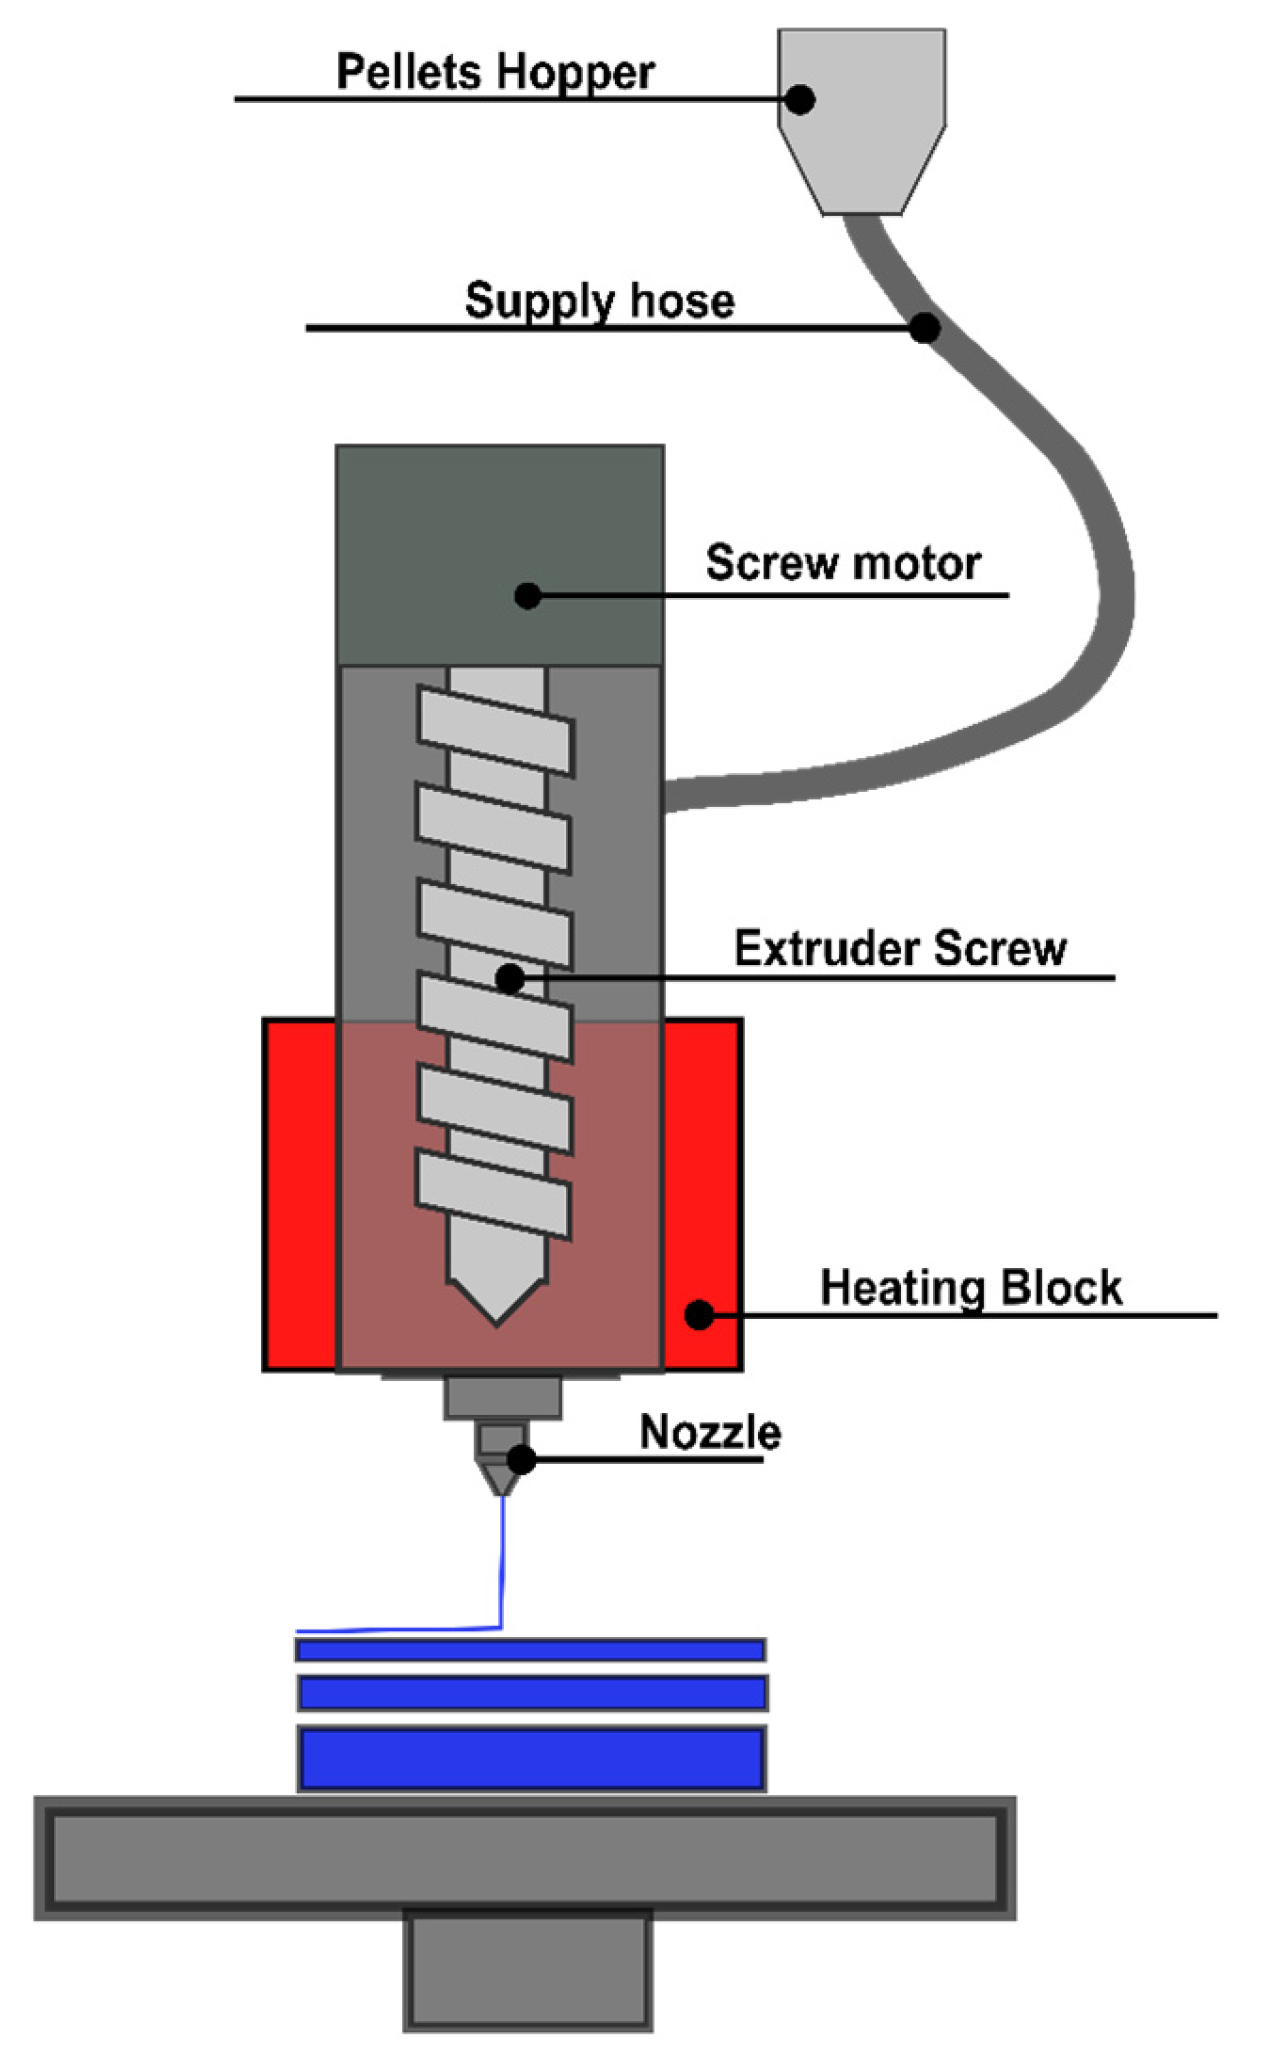
Figure 3.
(A) specimen printed horizontally with a filling angle of 45° in relation to x, in orange and yellow are the perimeters of the object, in purple the most current layer of the CP is being printed and in black the layer previously printed, perpendicular to the current layer; (B) specimen printed horizontally with a filling angle of 90° or 0° in relation to x, in orange and yellow are the perimeters of the object, in red the most current layer of the CP is being printed and in black the previously printed layer, perpendicular to the current layer.
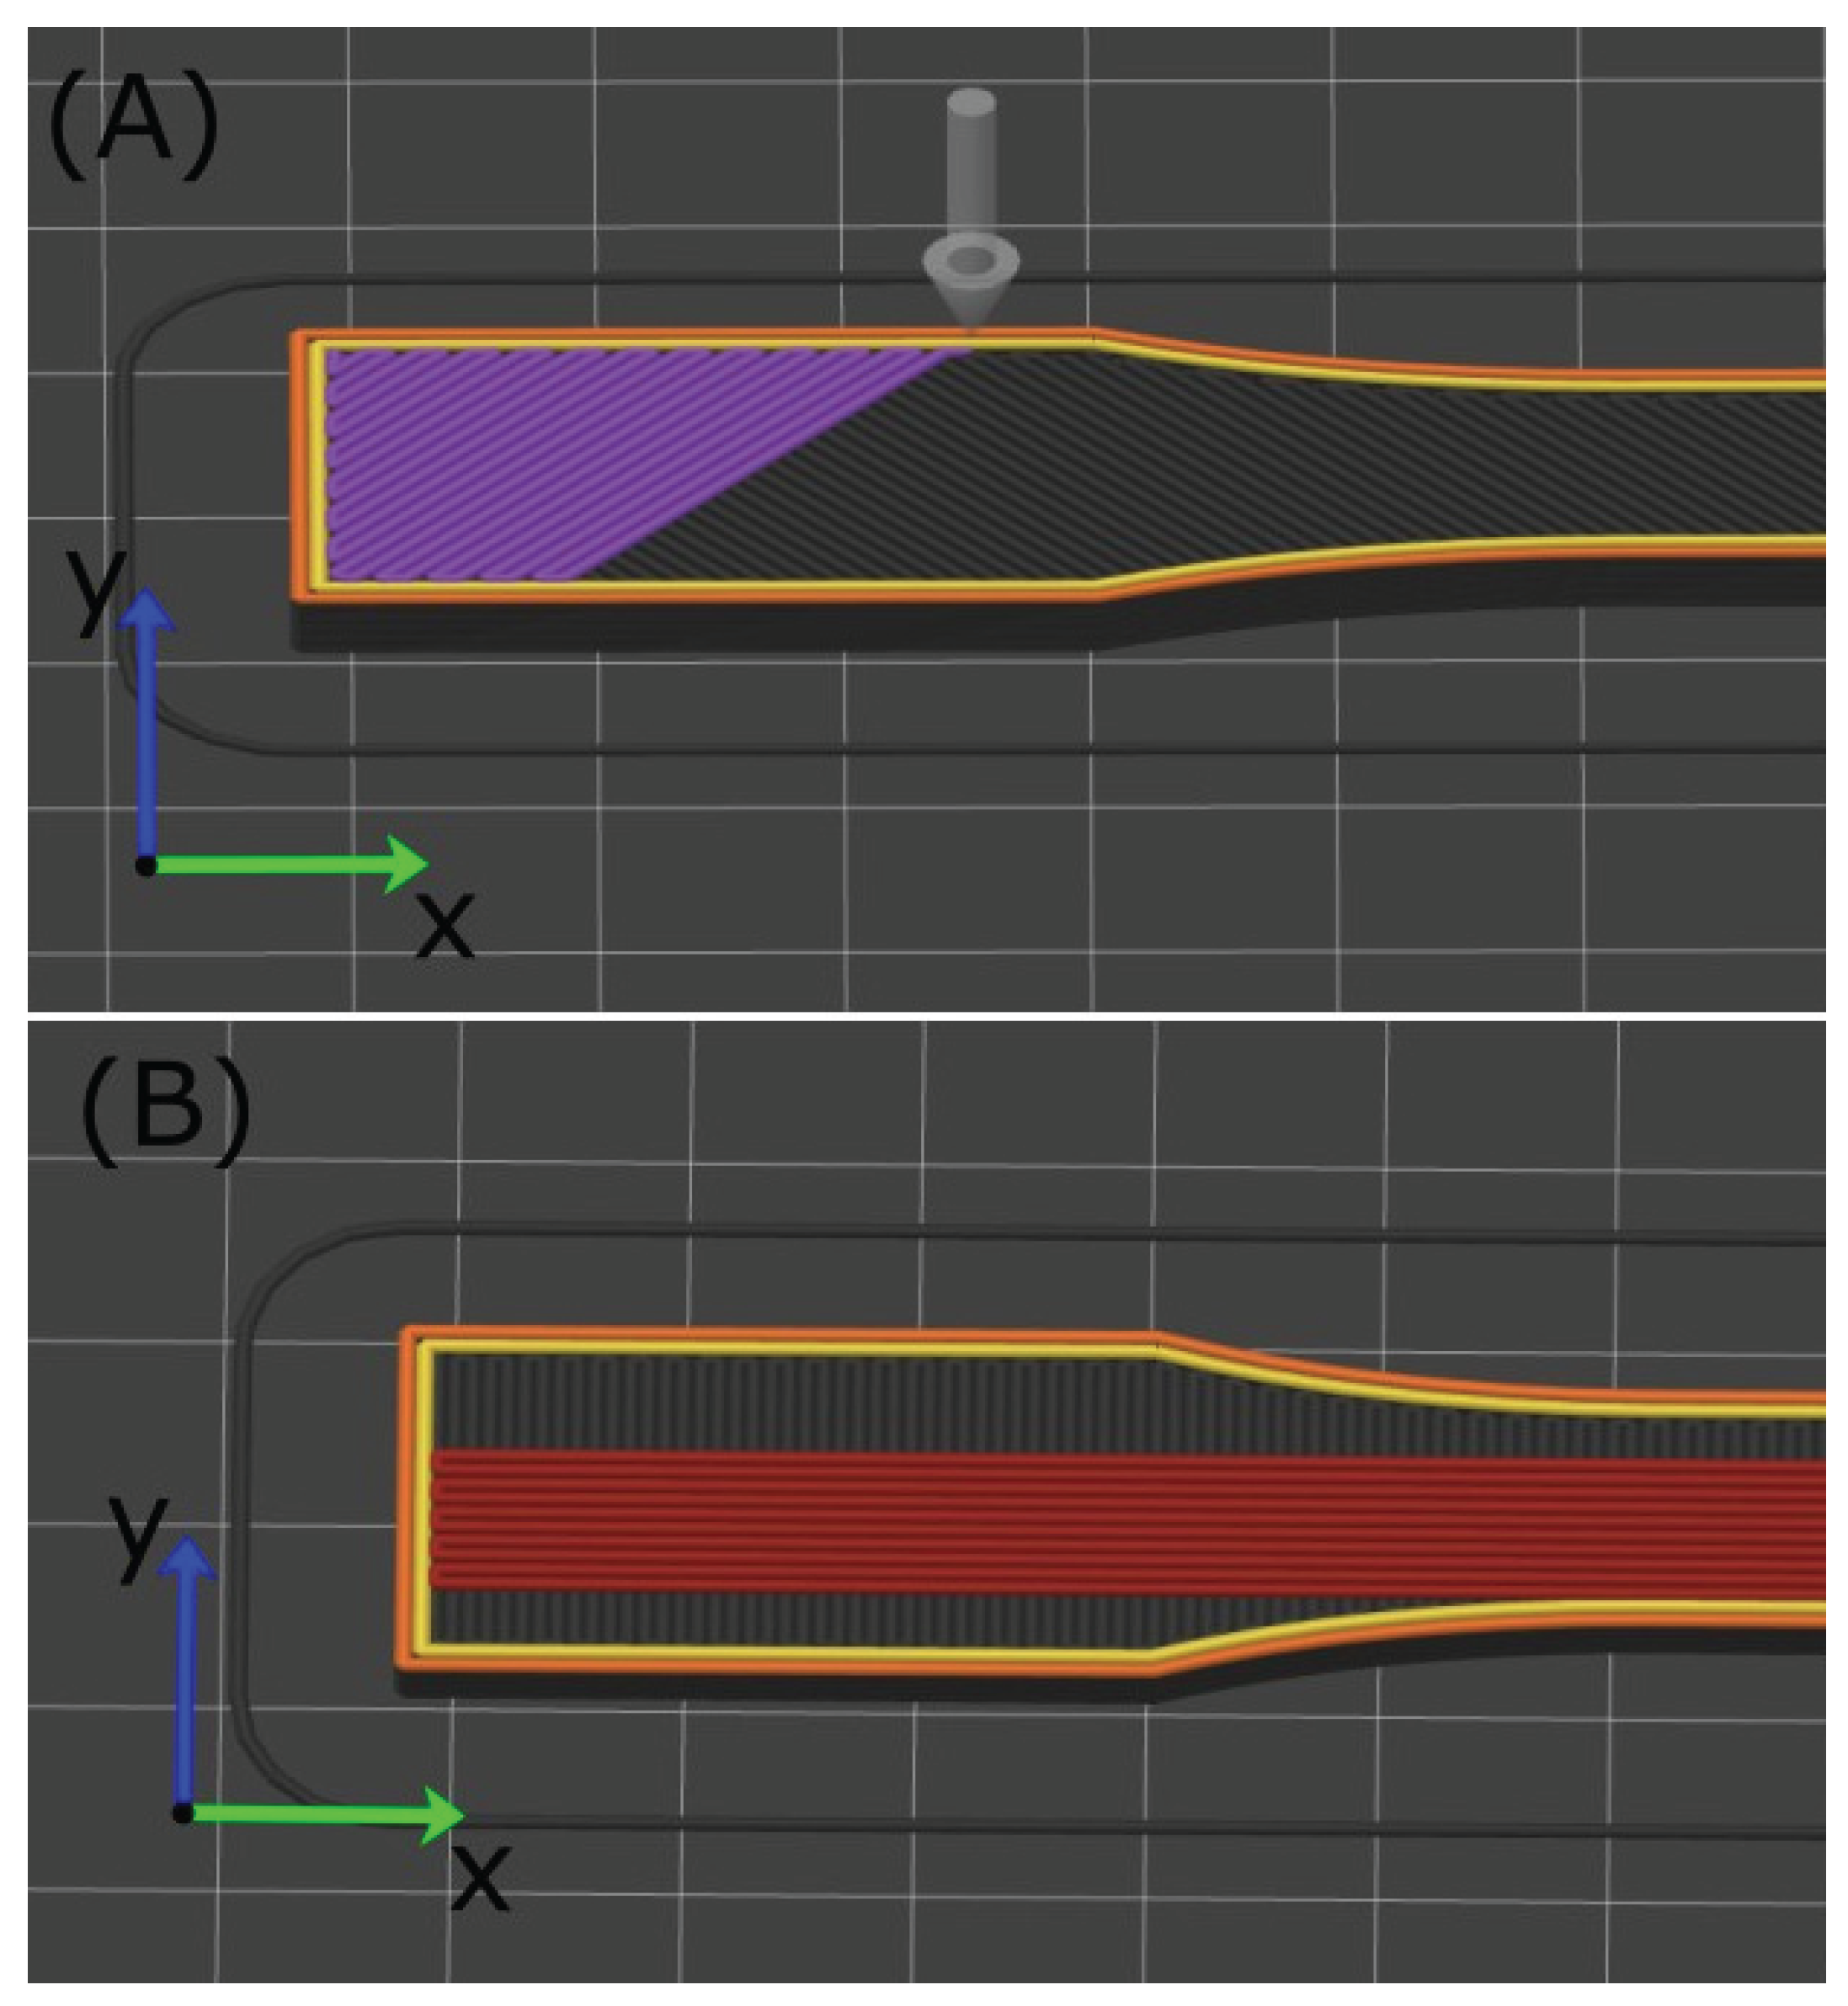
Figure 4.
Printing direction of the specimens for the compressive strength test.
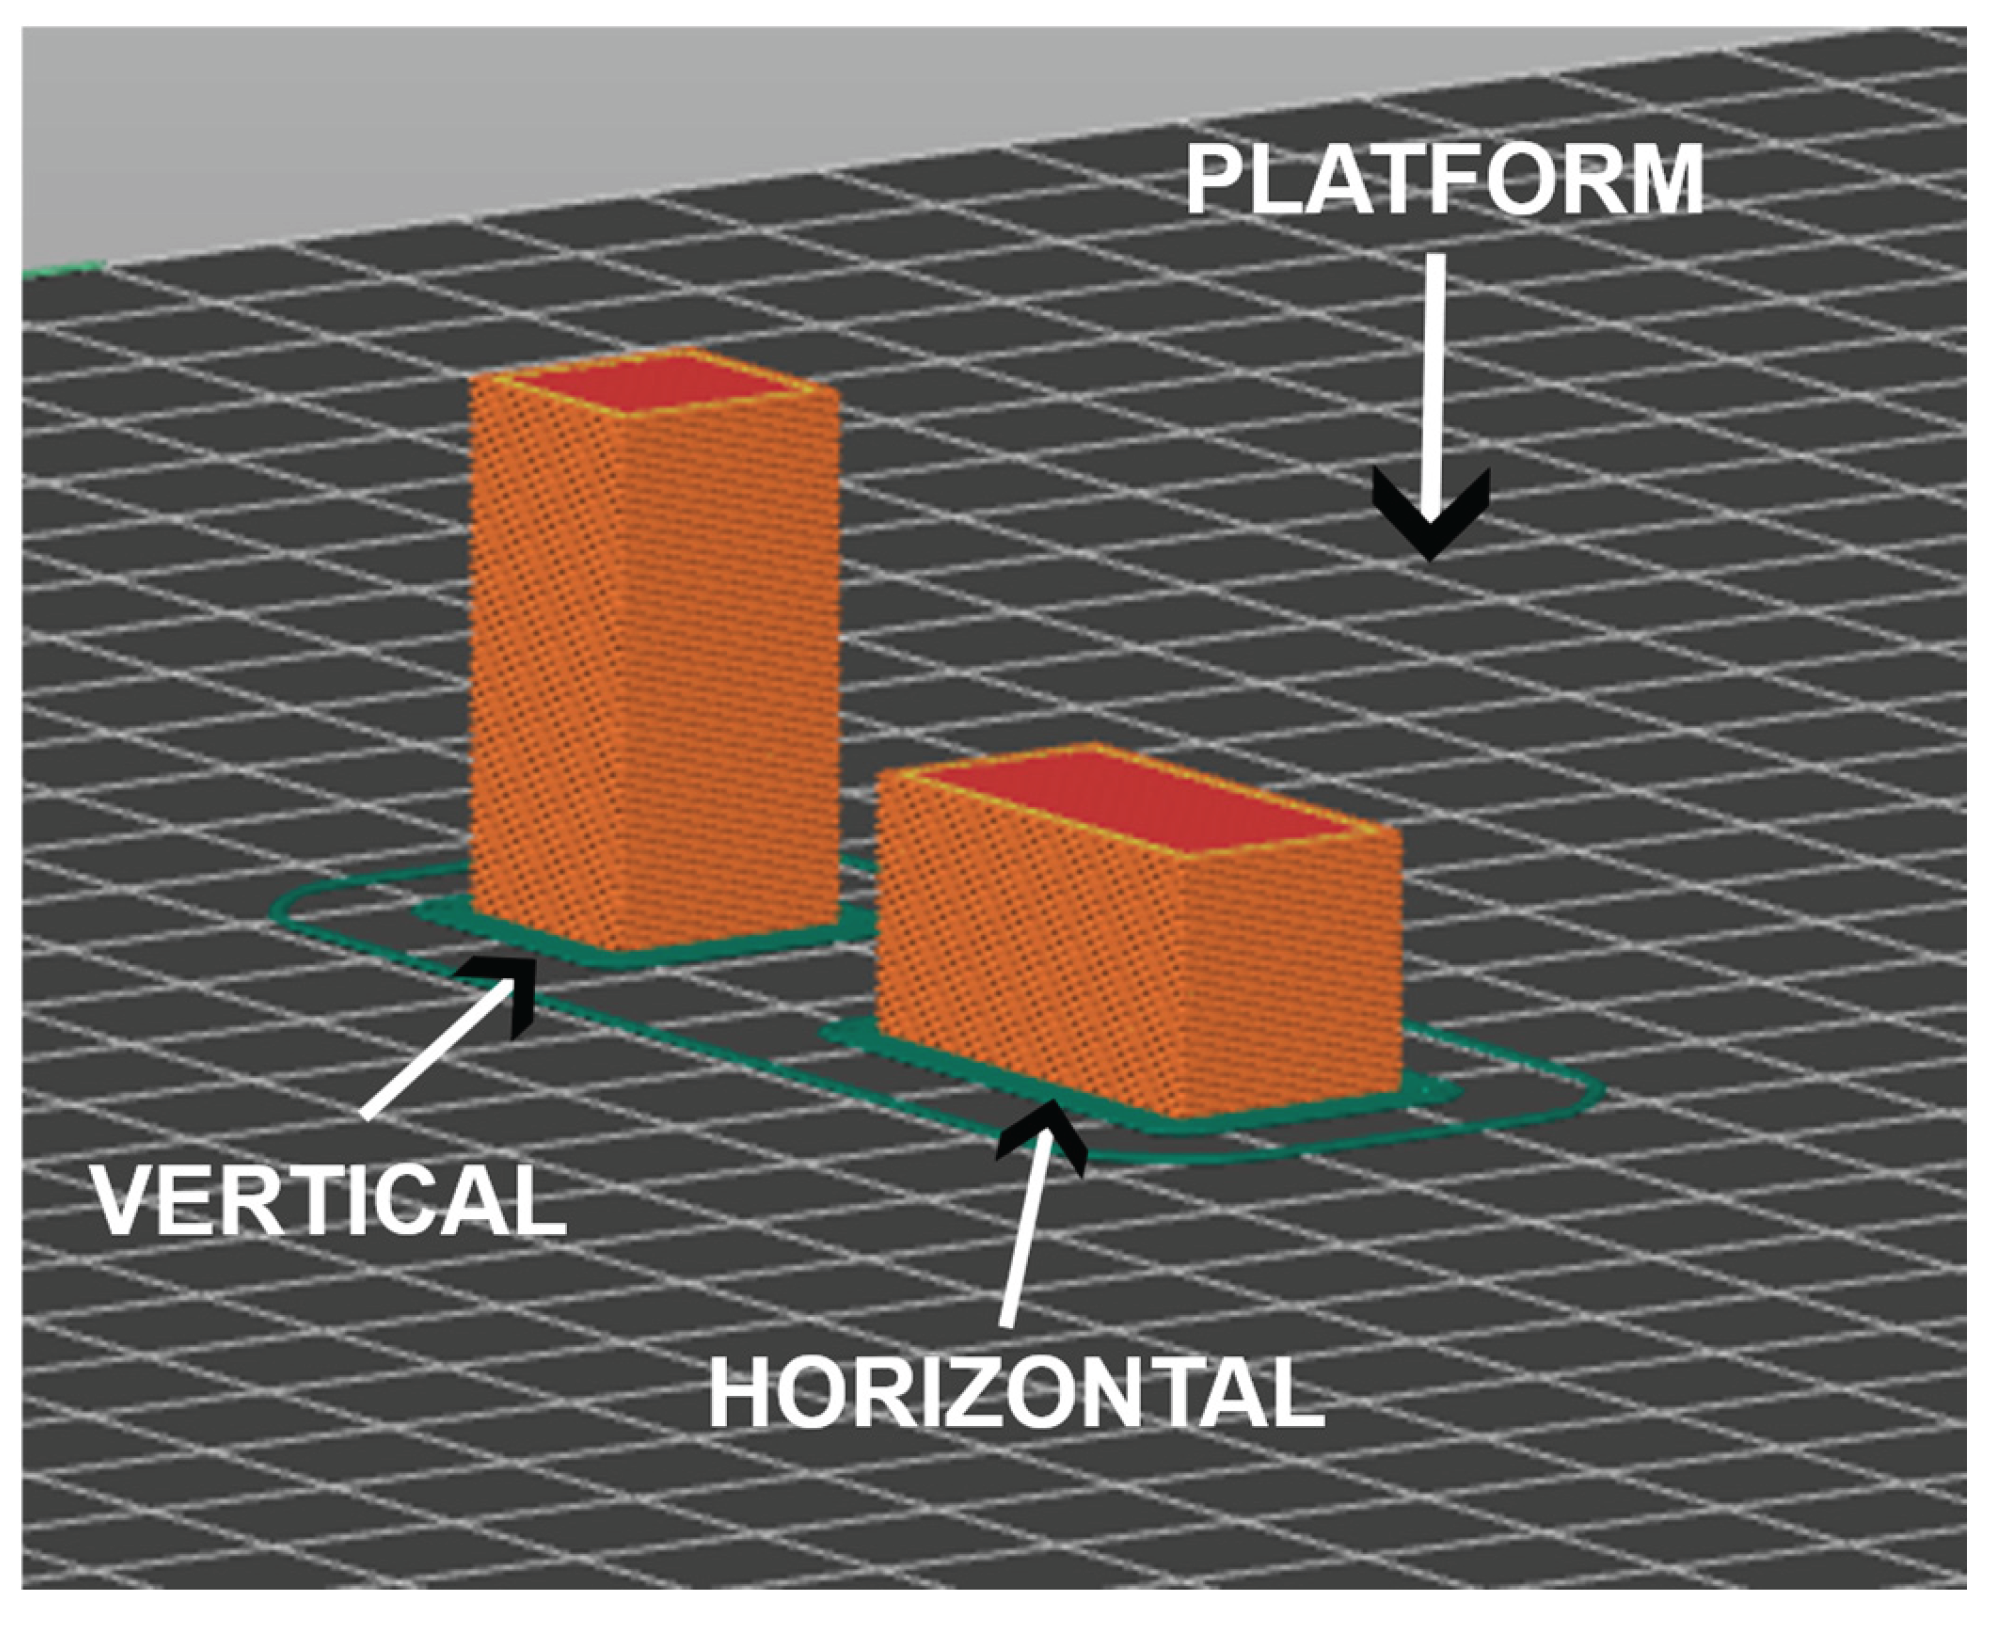
Figure 5.
Shore D hardness analysis regions.
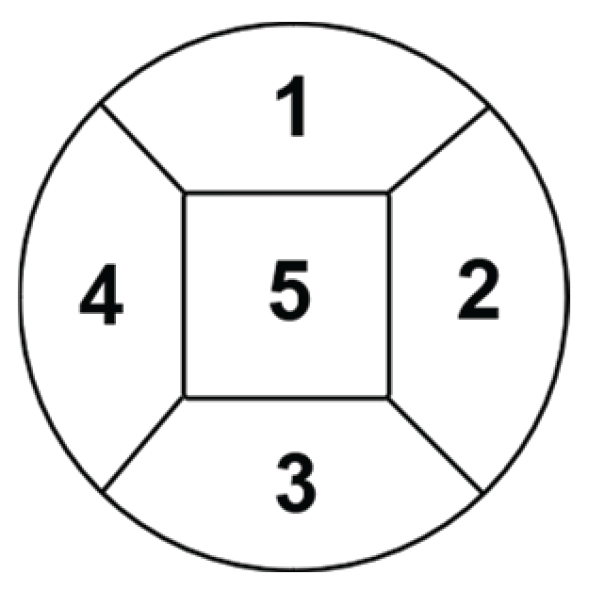
Figure 6.
Tensile strength limit for the 45° and 90° angles of specimens produced in FGF and by Wang et al. [11].
Figure 6.
Tensile strength limit for the 45° and 90° angles of specimens produced in FGF and by Wang et al. [11].
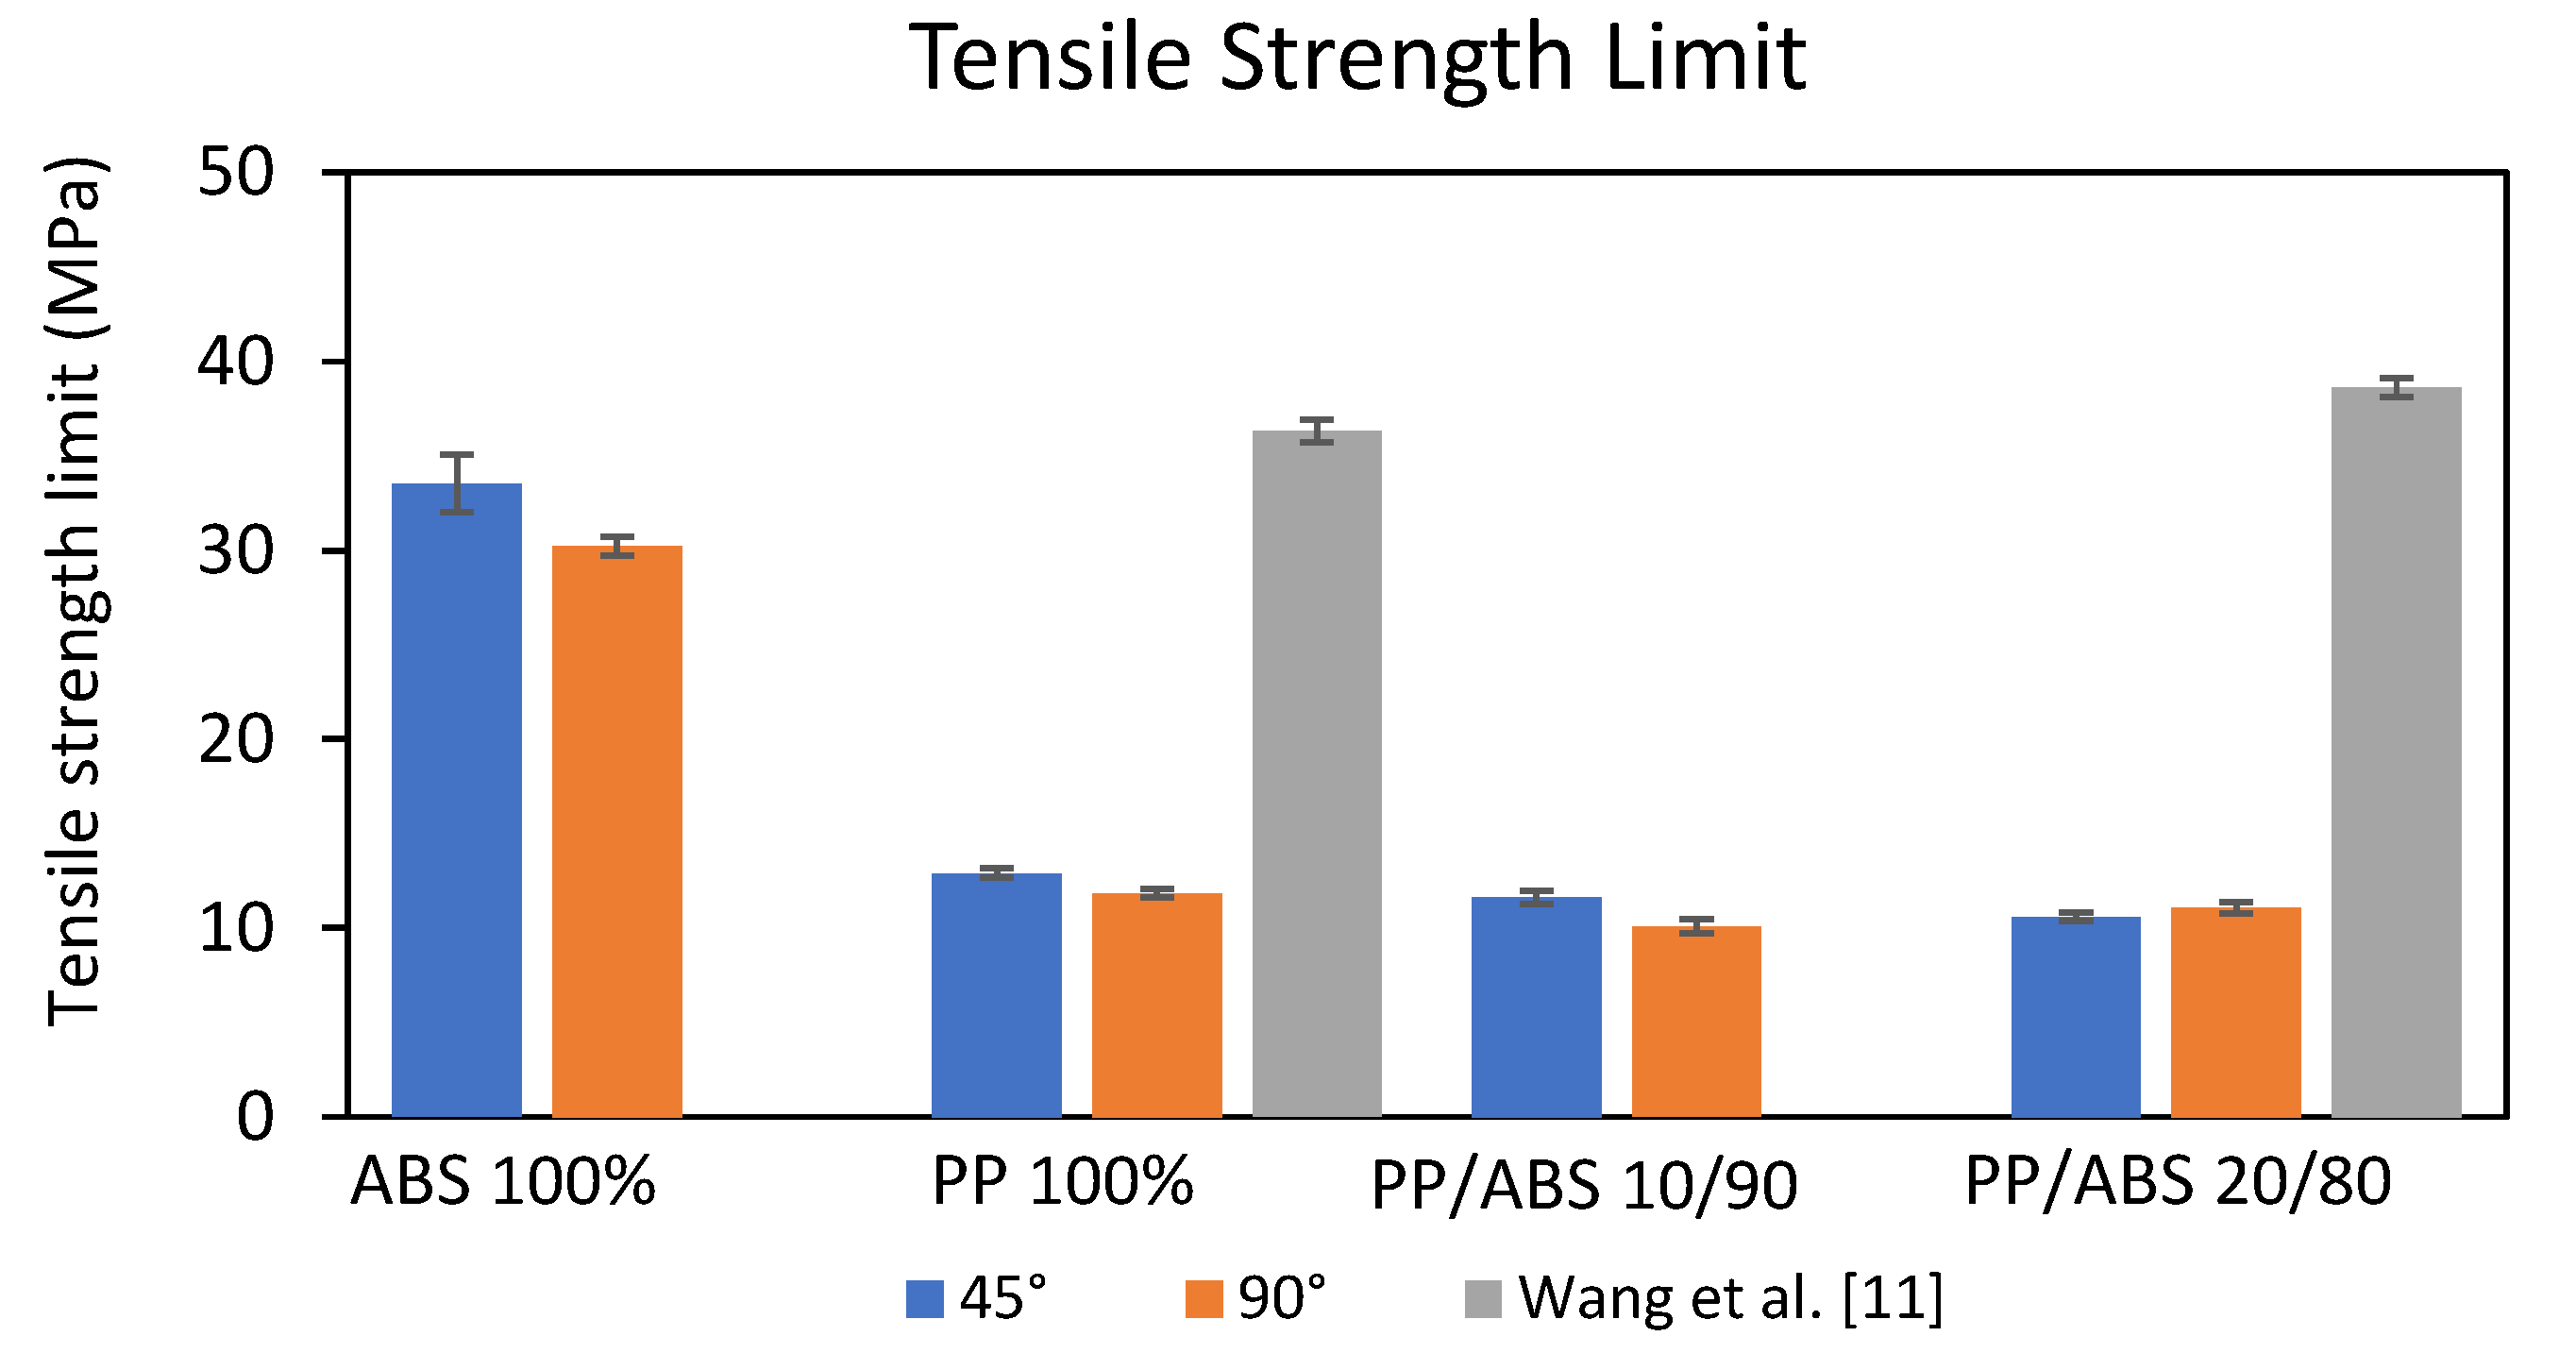
Figure 7.
Tensile modulus of elasticity for printed samples with 45° and 90° filling and by Wang et al. [11].
Figure 7.
Tensile modulus of elasticity for printed samples with 45° and 90° filling and by Wang et al. [11].
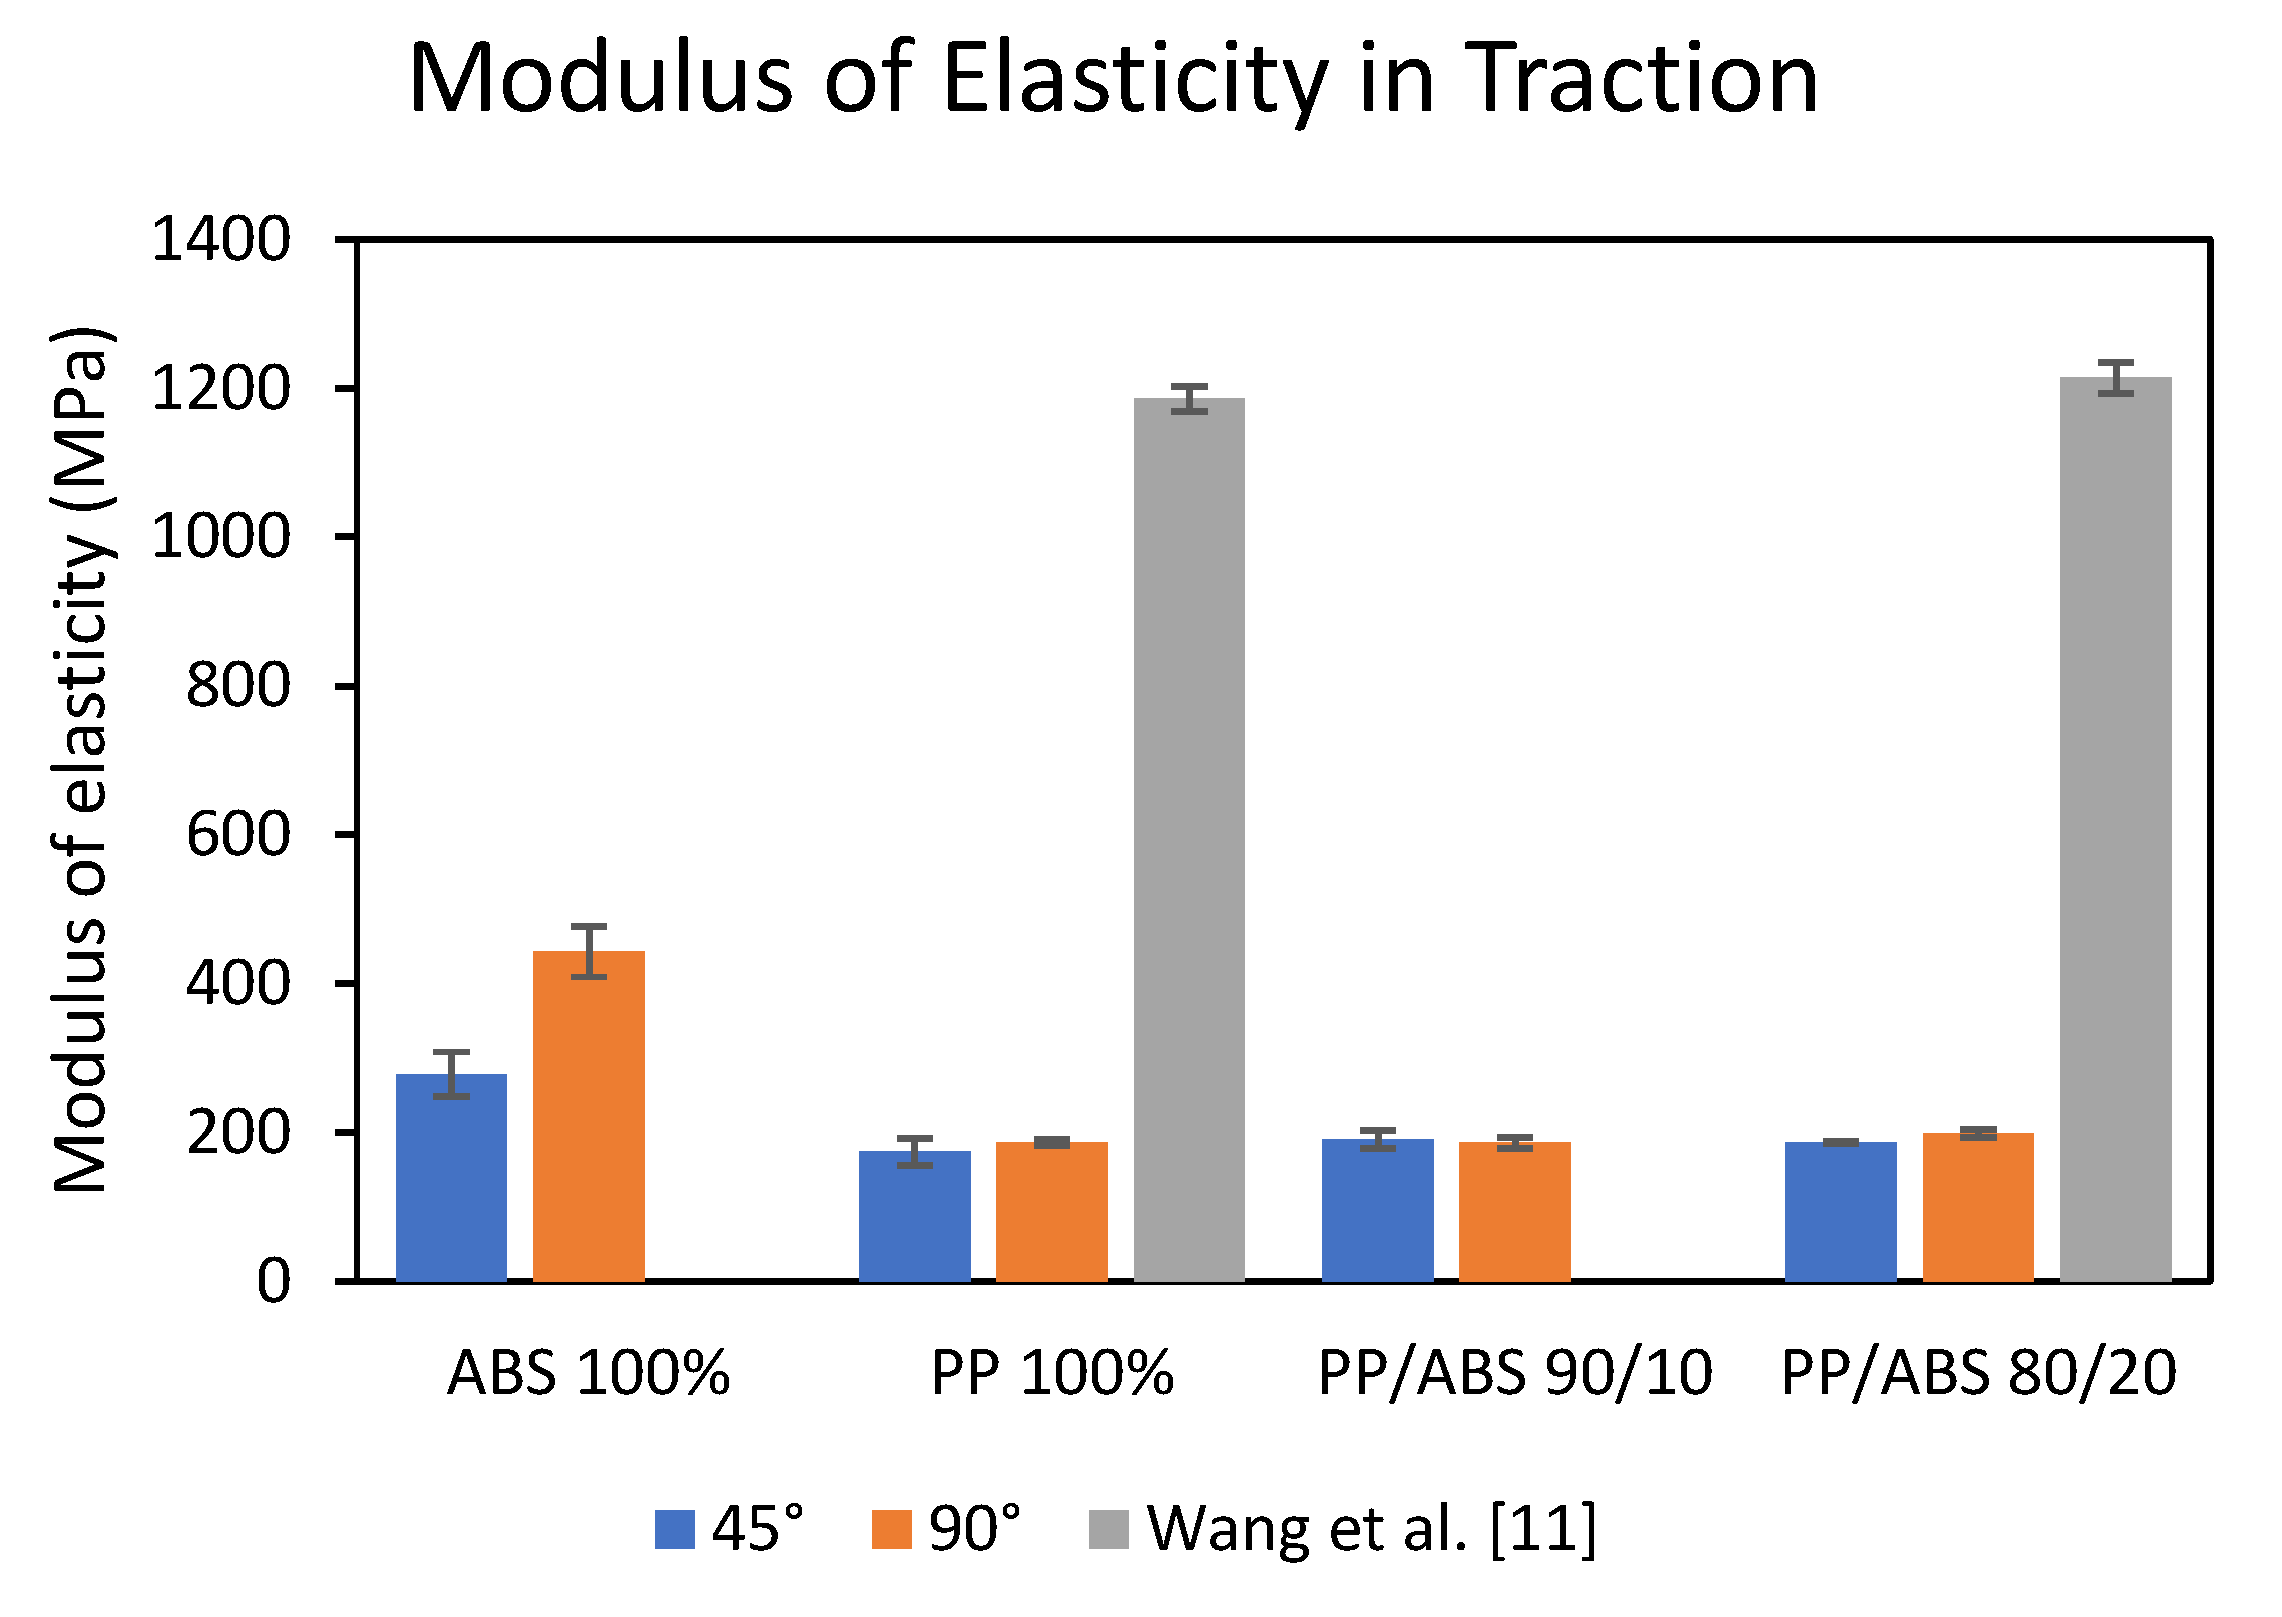
Figure 8.
Compressive strength limit for 45° and 90° angles.
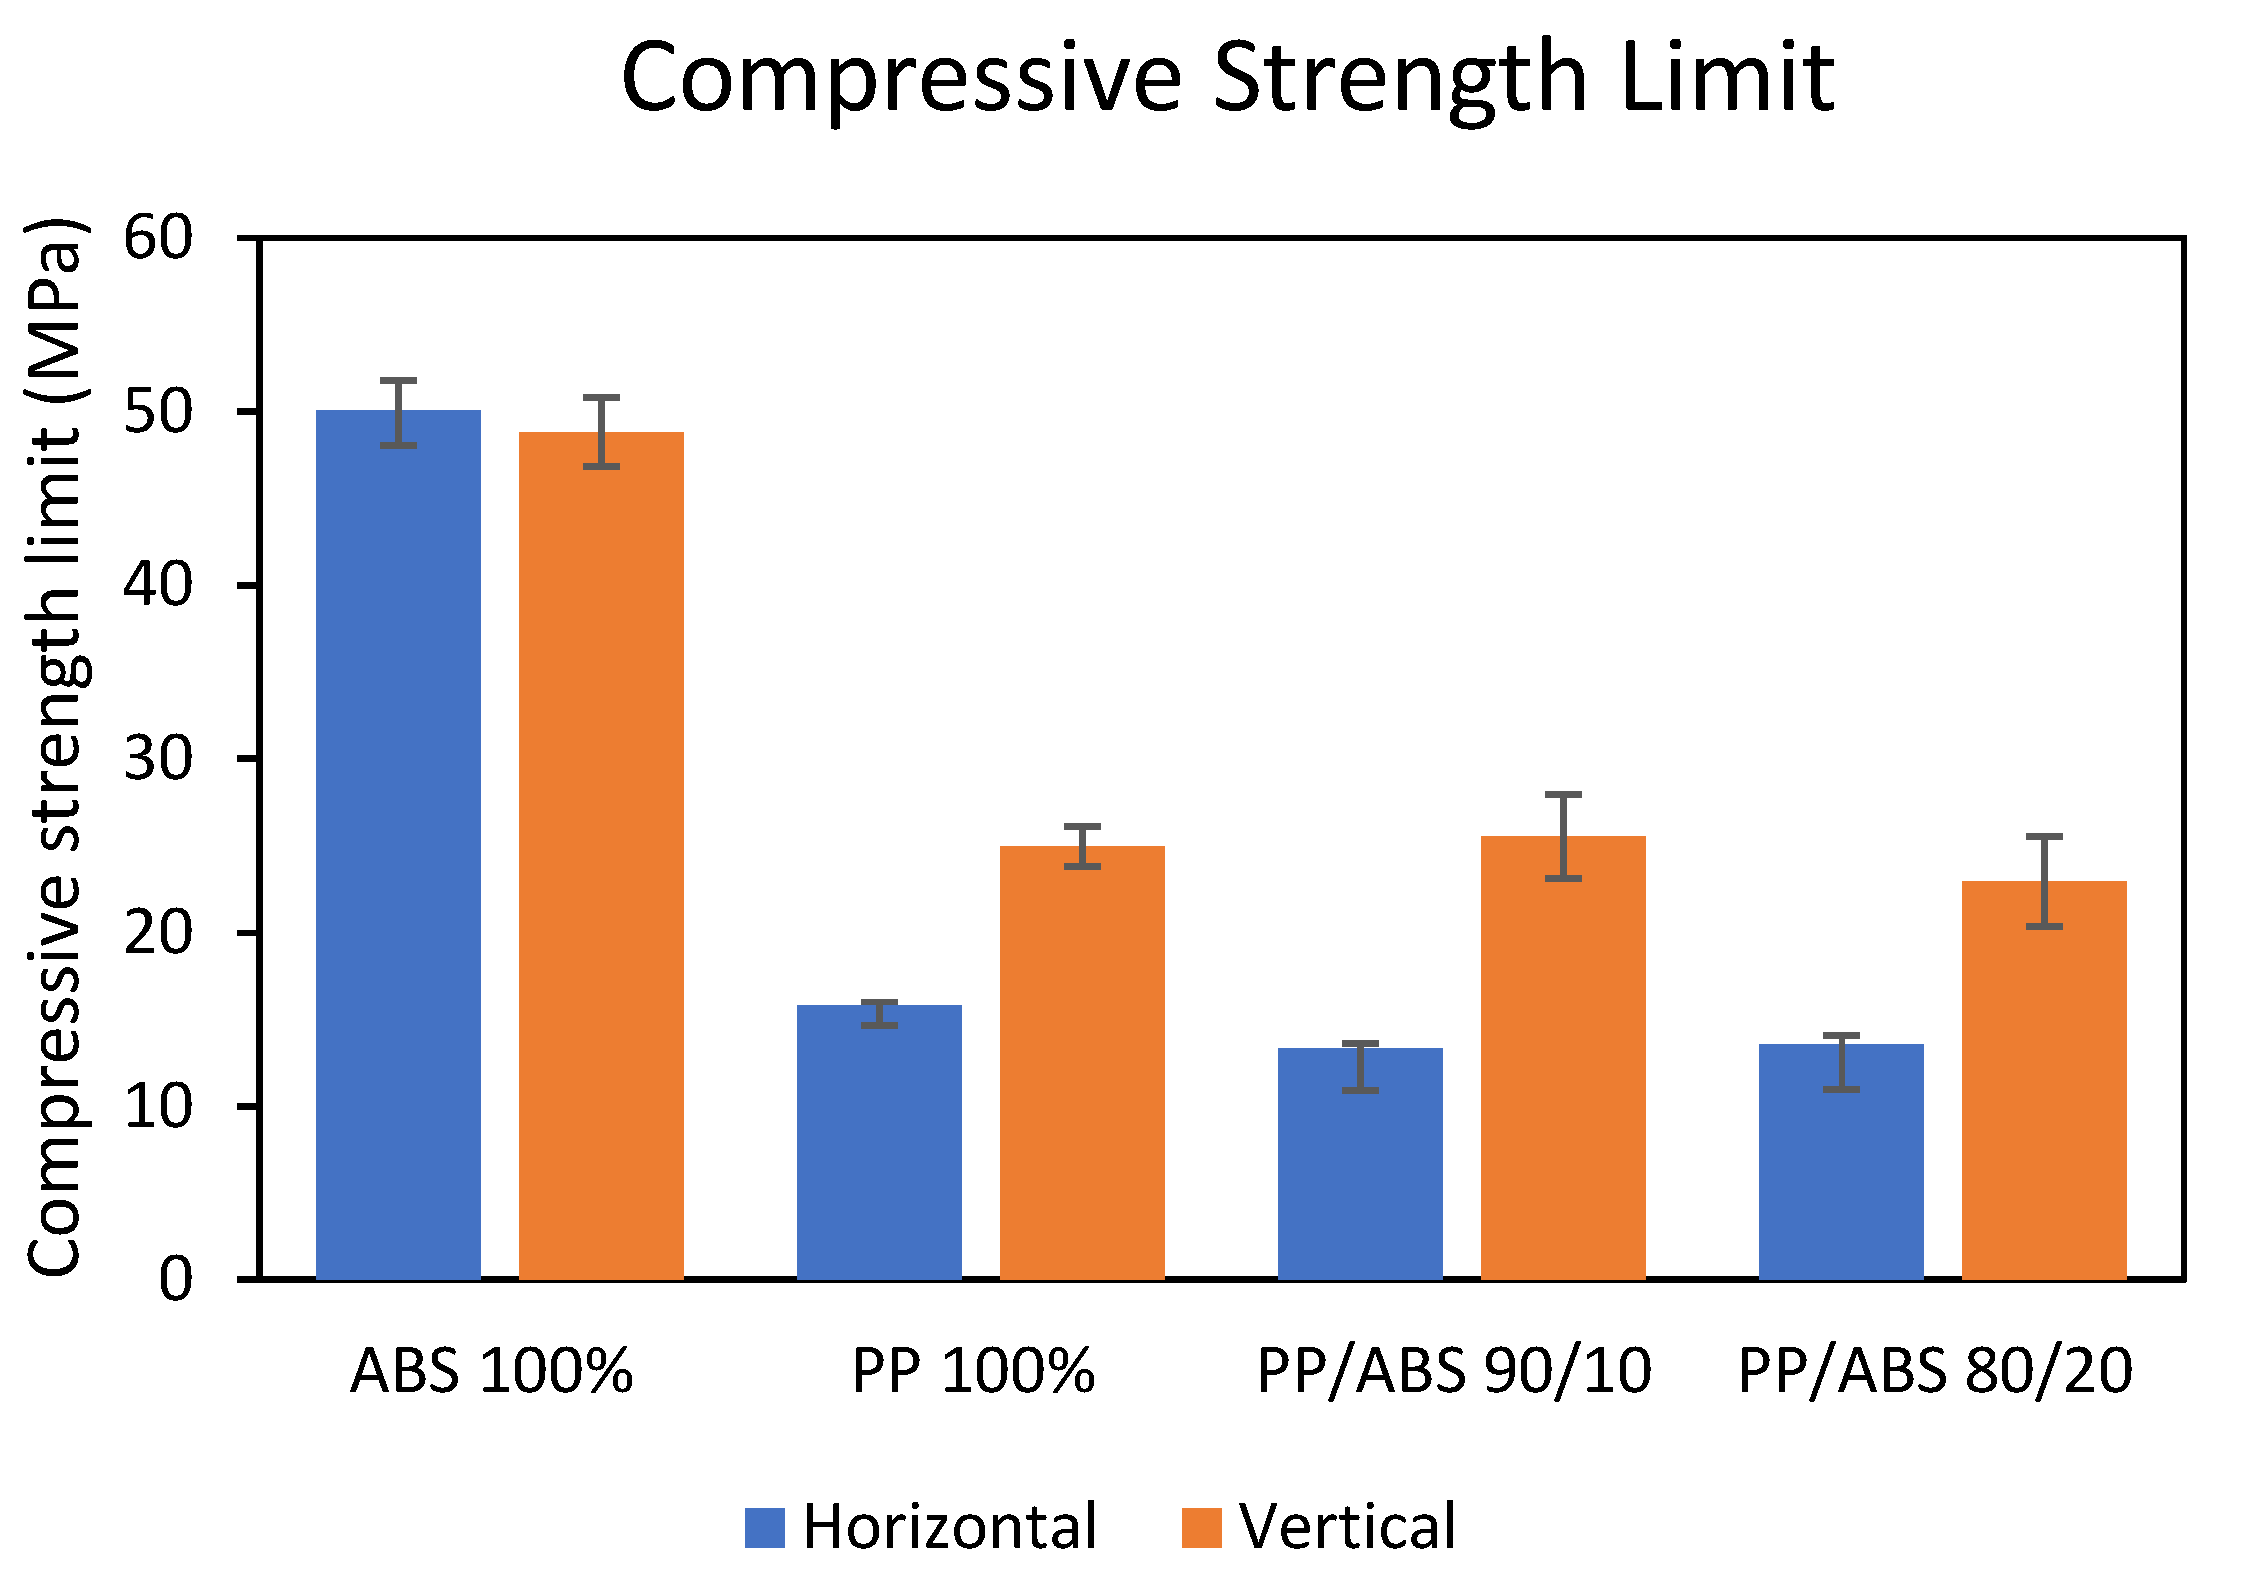
Figure 9.
PP samples after compression test.
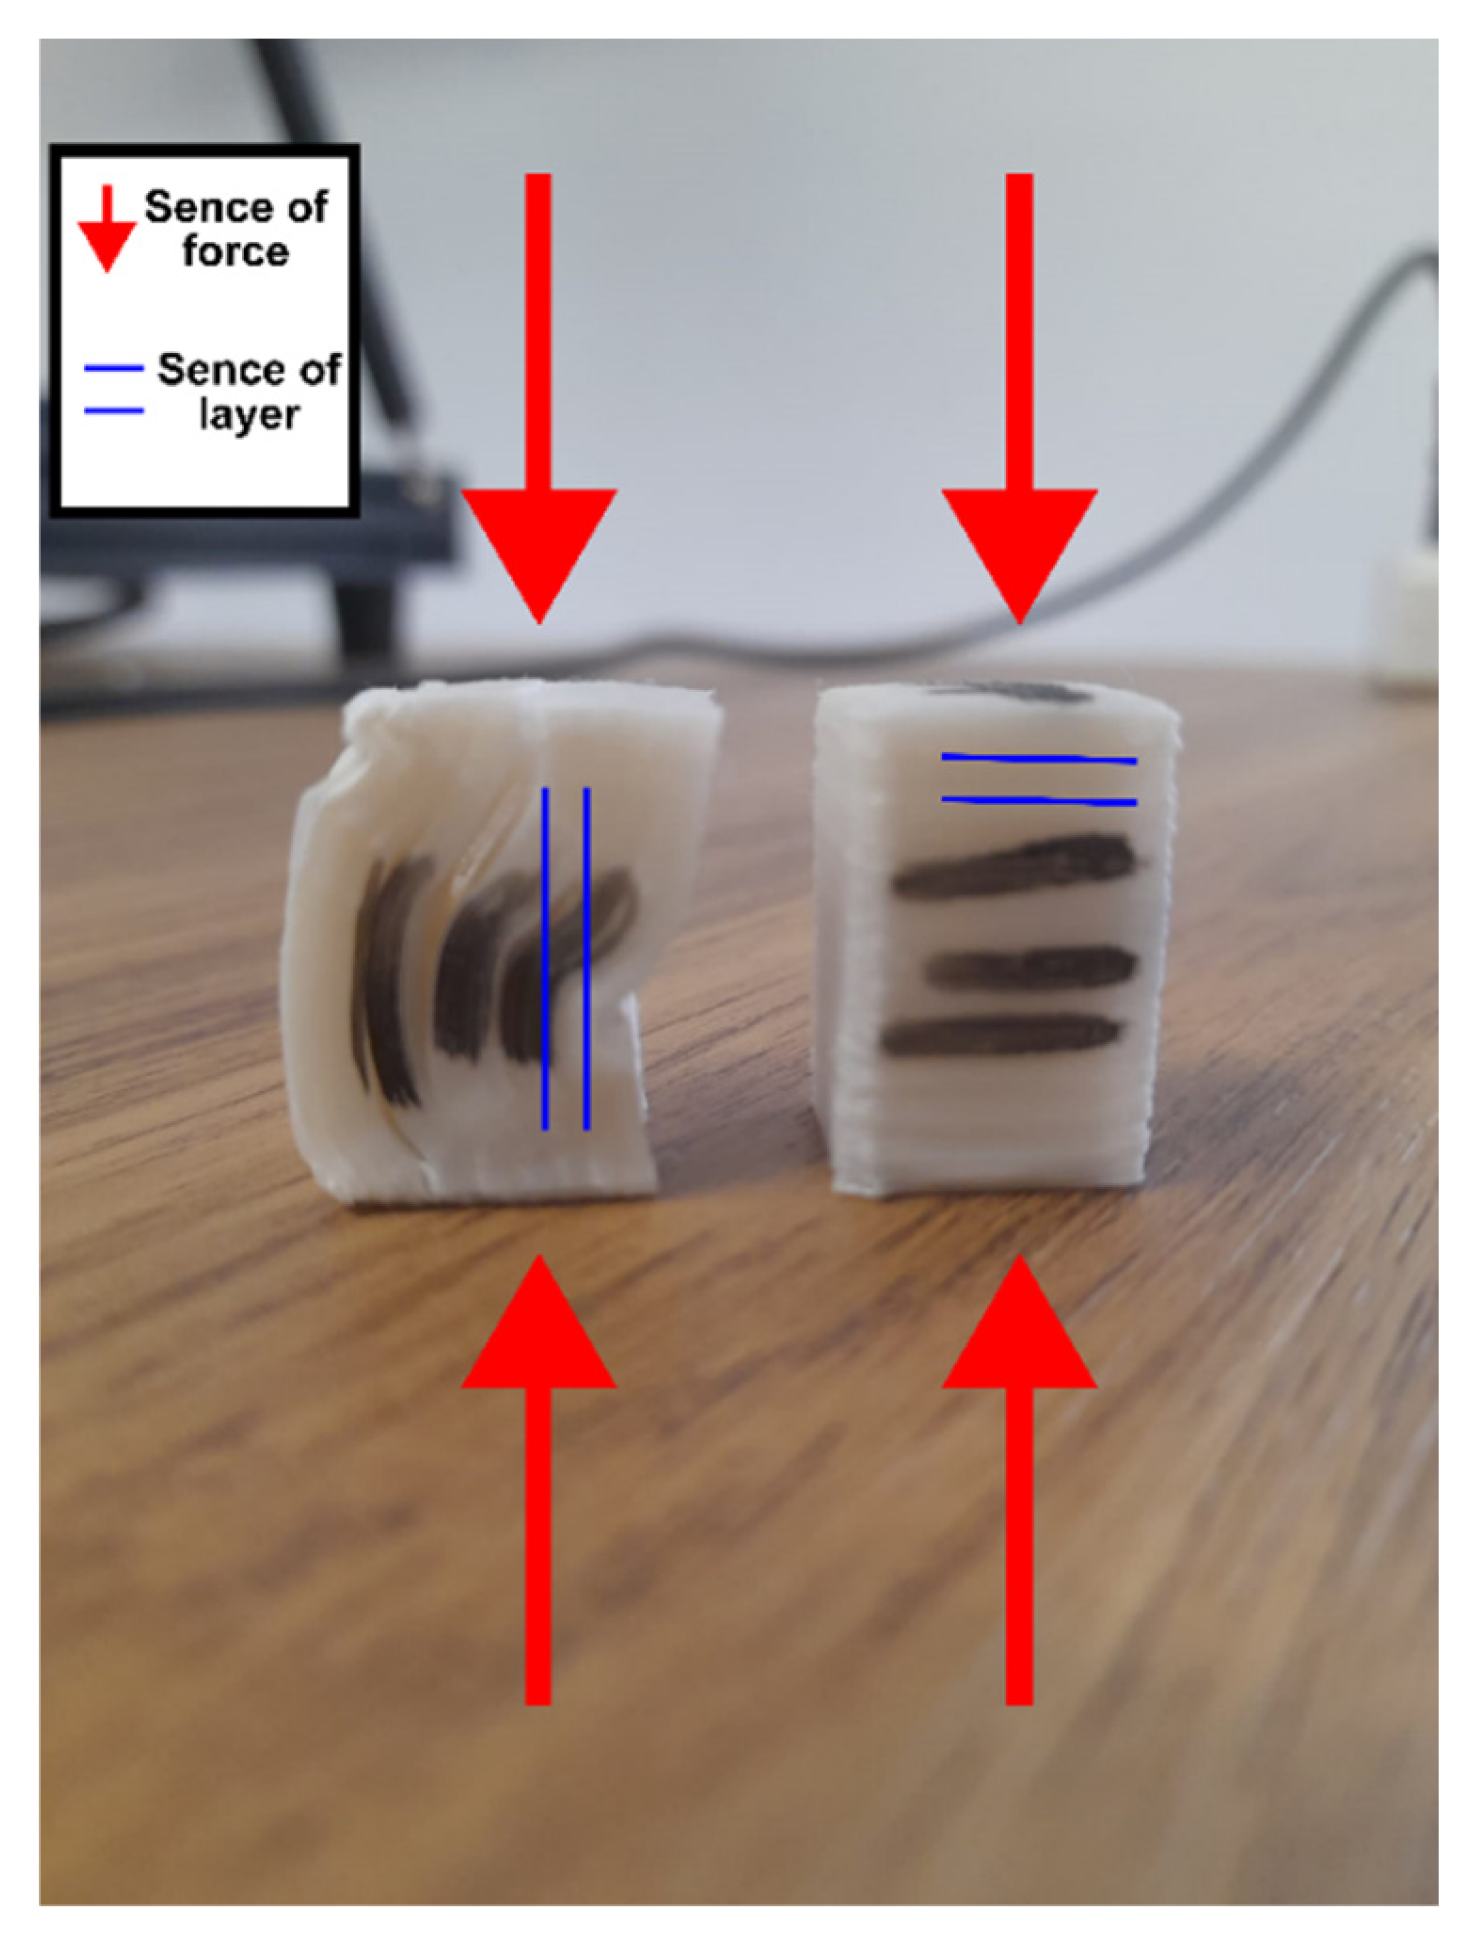
Figure 10.
Modulus of elasticity in compression for samples printed vertically and horizontally.
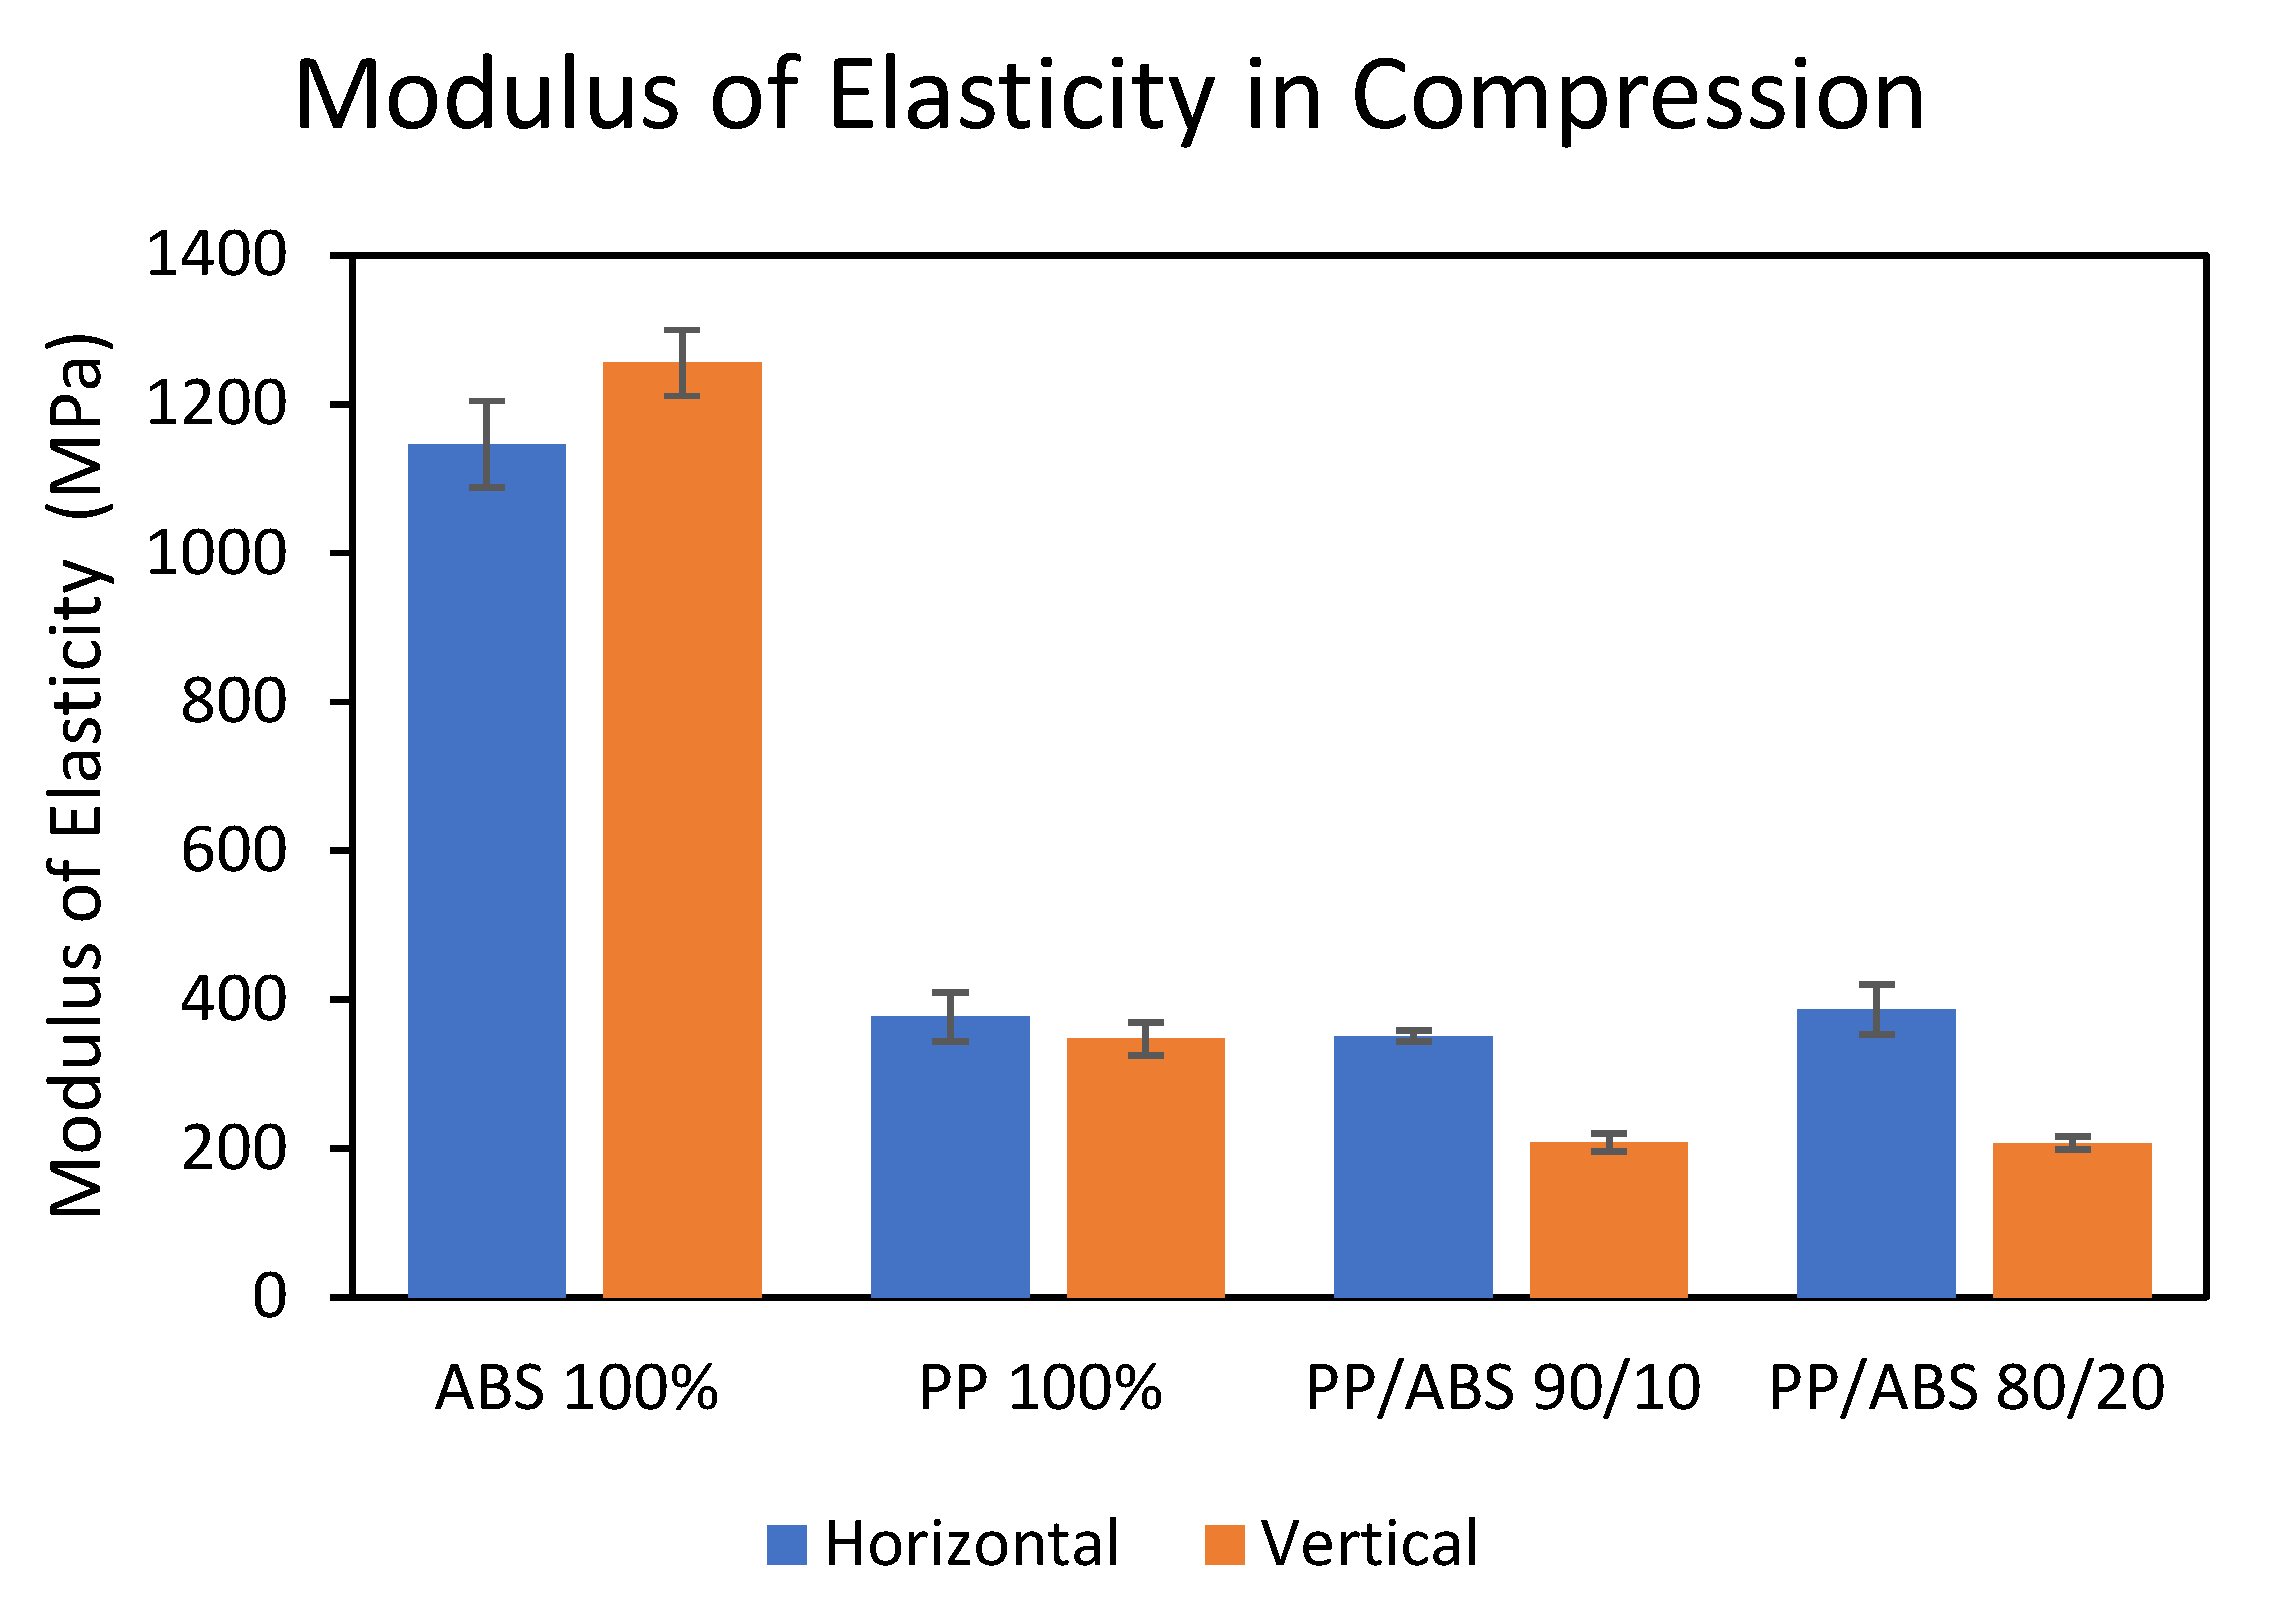
Figure 11.
Impact strength of the studied samples.
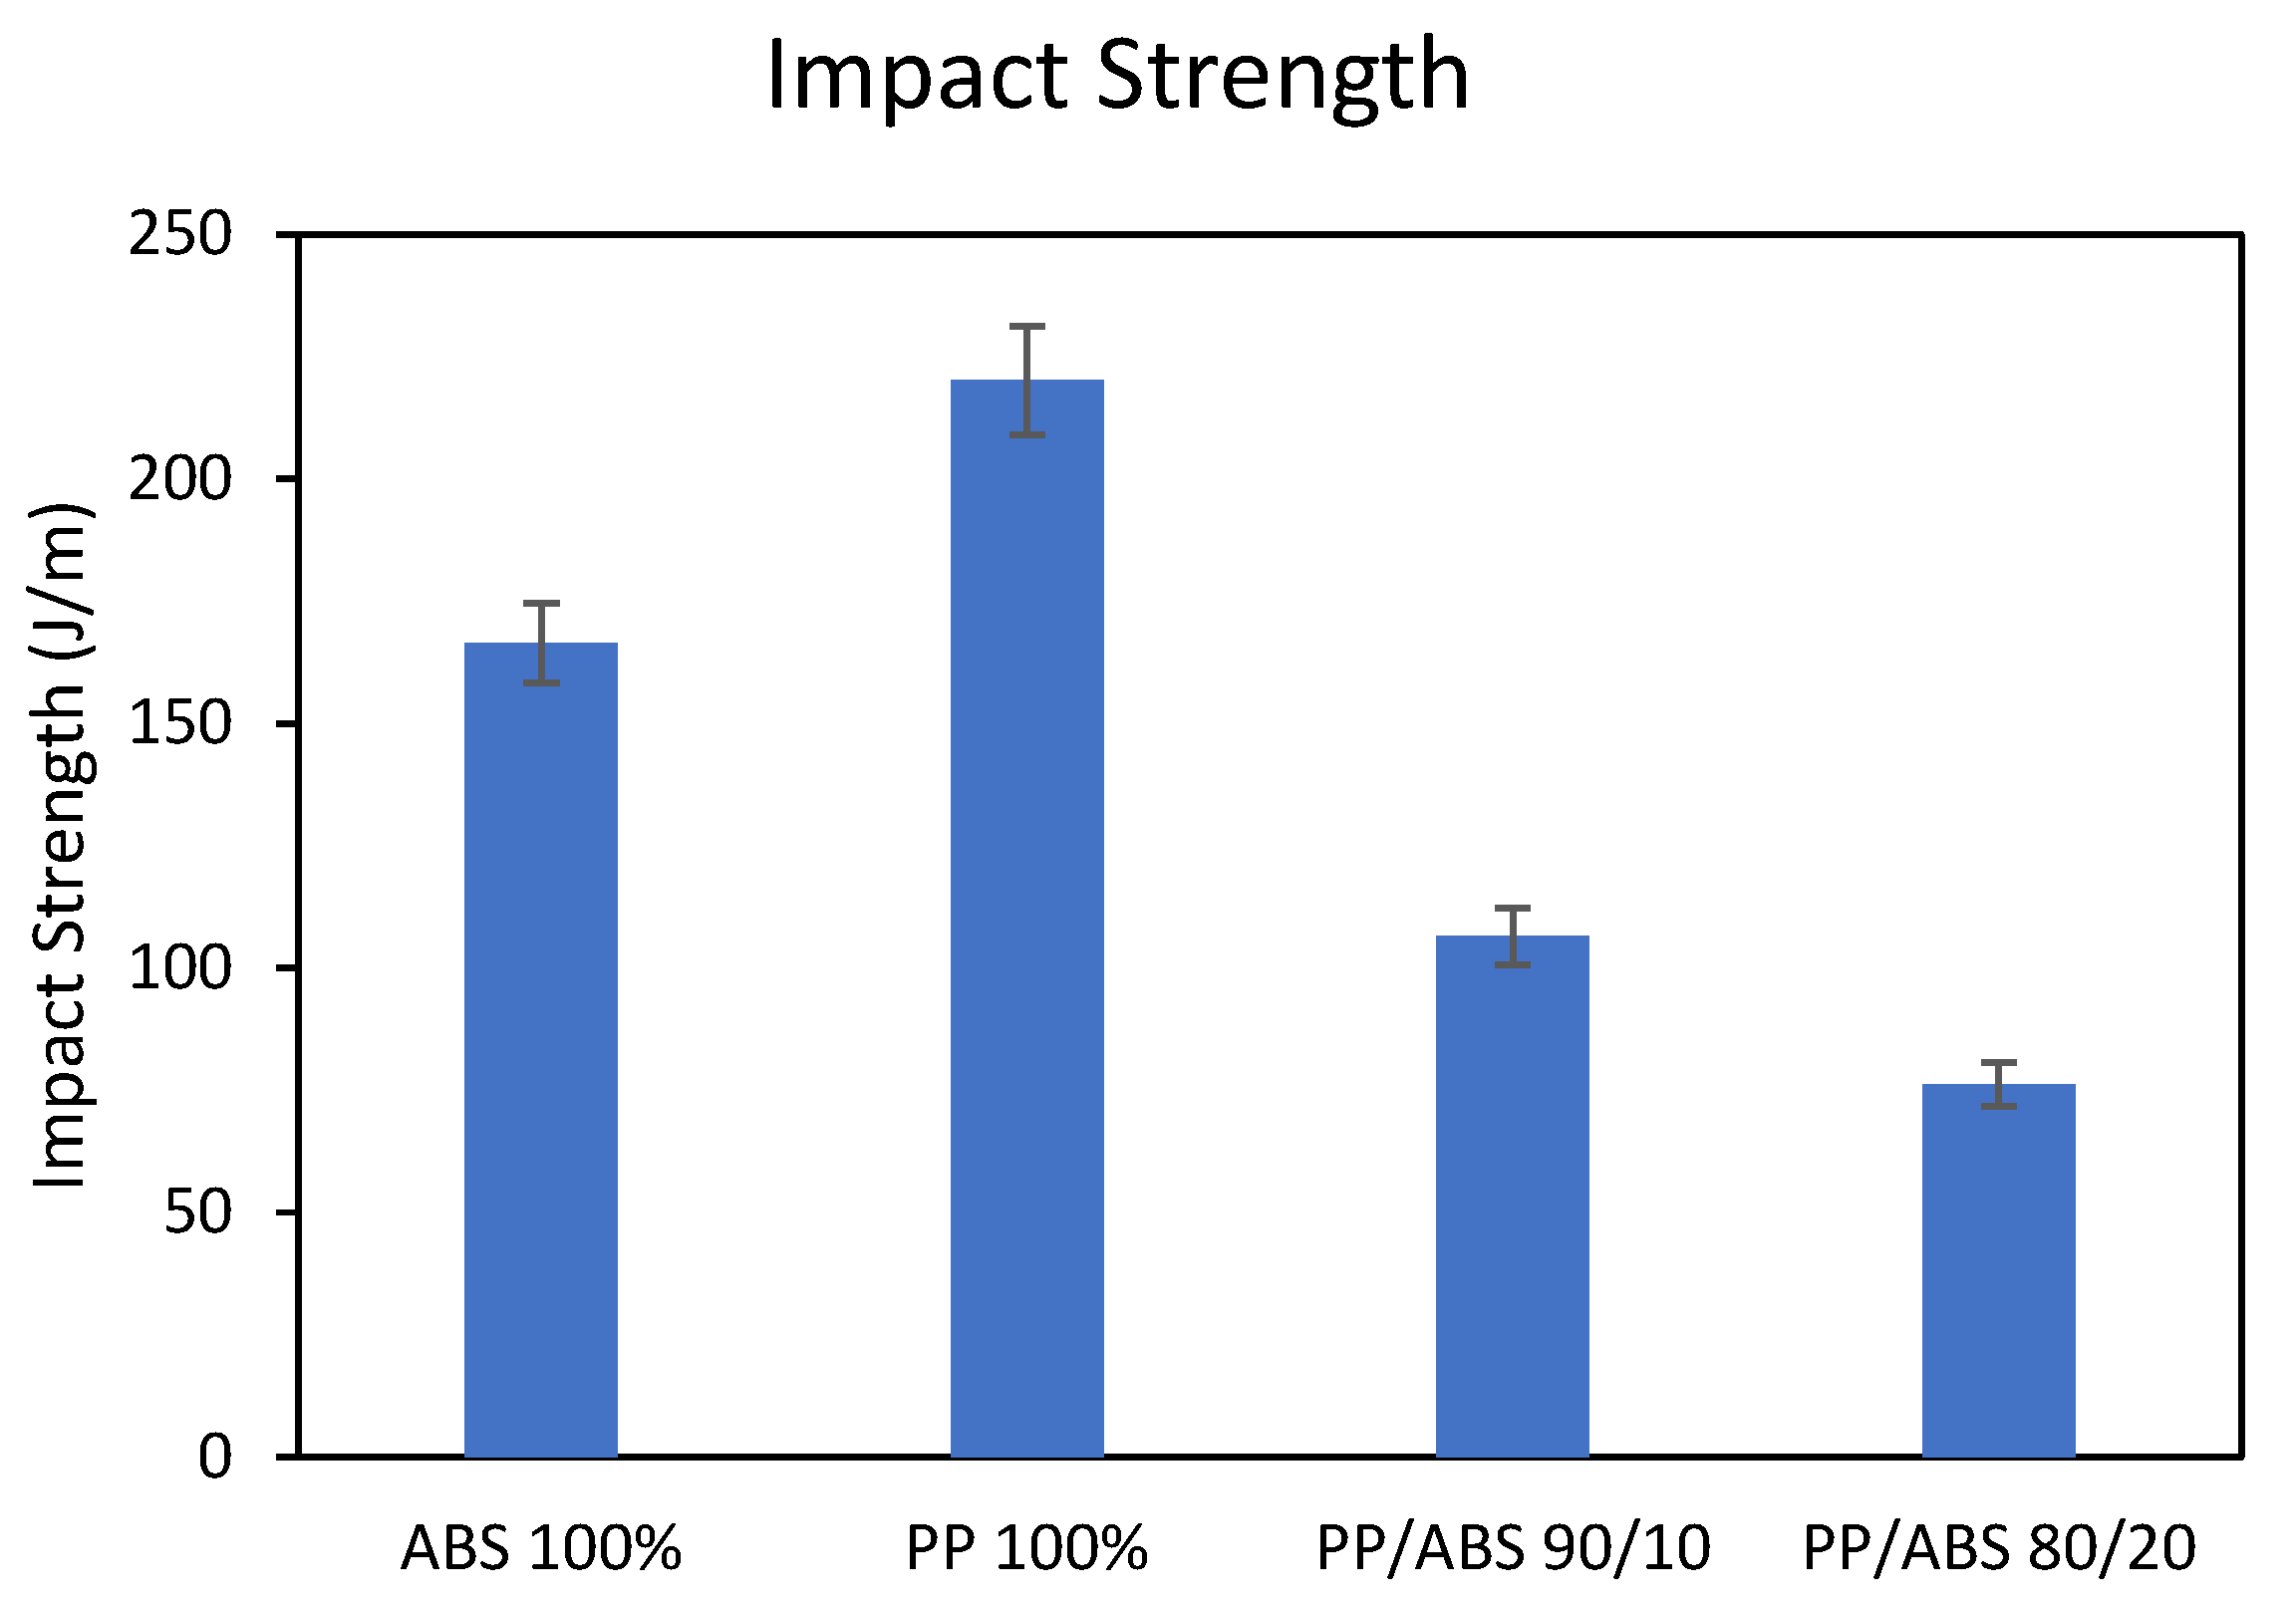
Figure 12.
Shore D hardness for the top and bottom of samples.
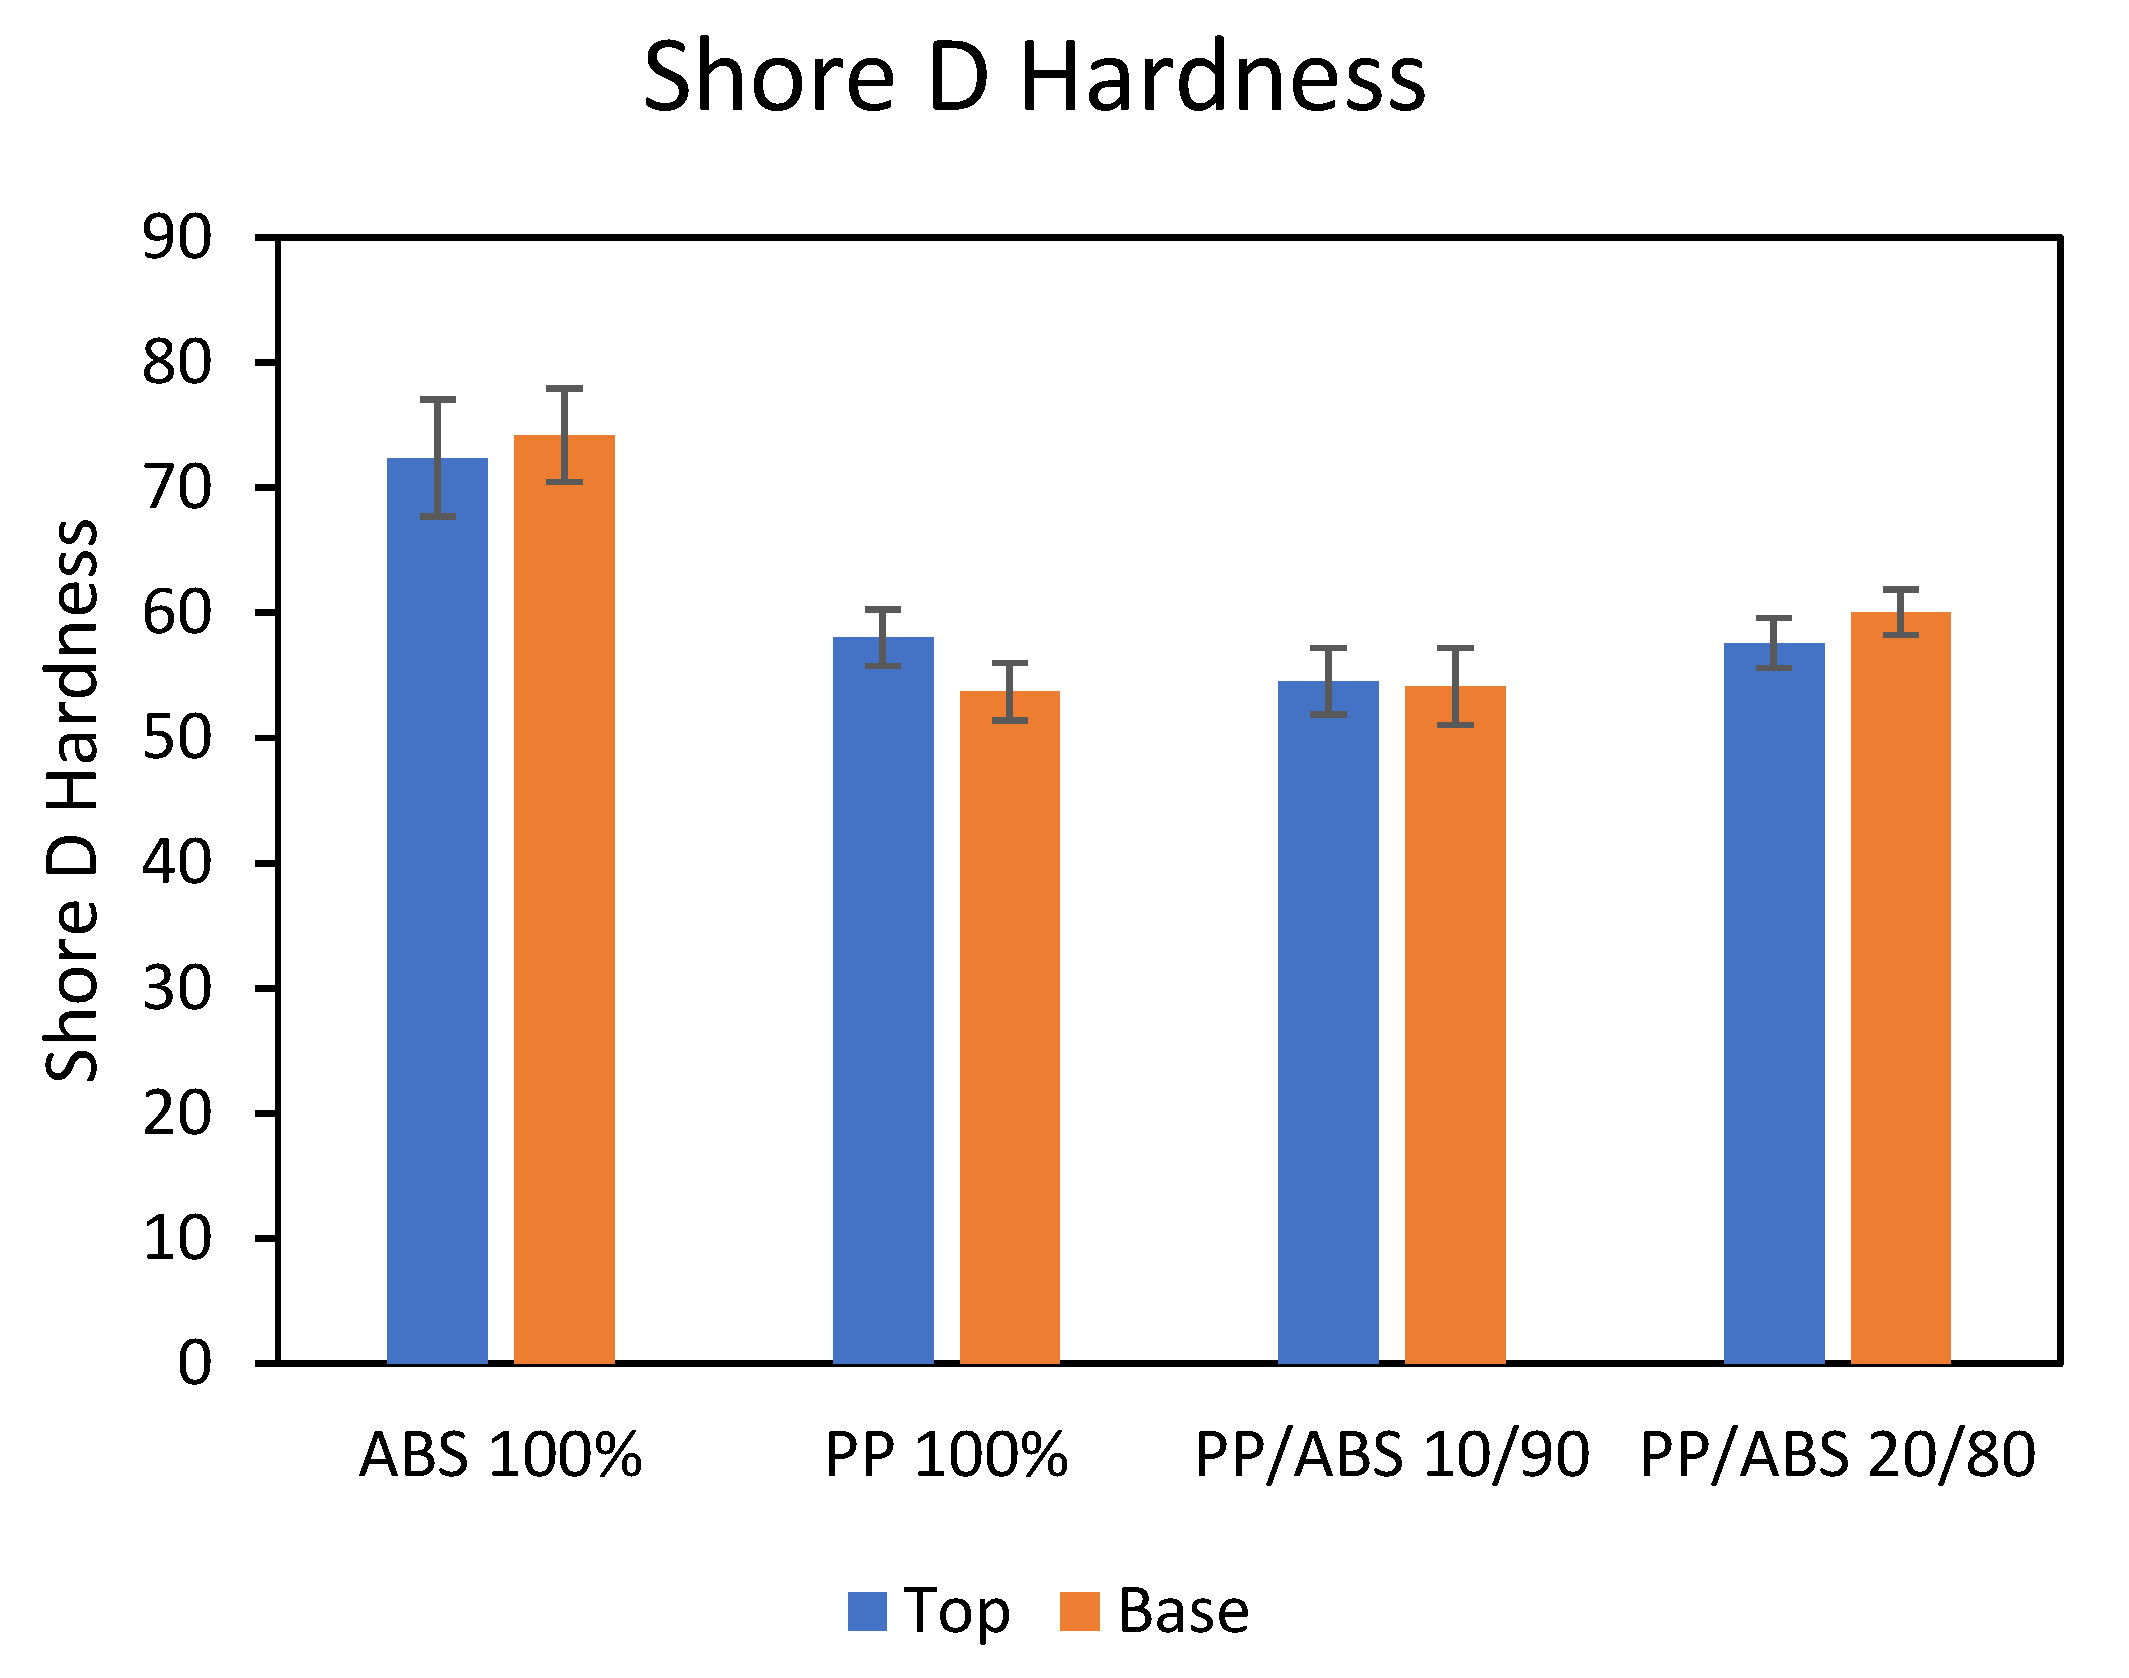
Figure 13.
SEM images of fracture from 100x increased impact specimens. (A) ABS-100, (B) PP-100, (C) 90/10, (D) 80/10.
Figure 13.
SEM images of fracture from 100x increased impact specimens. (A) ABS-100, (B) PP-100, (C) 90/10, (D) 80/10.
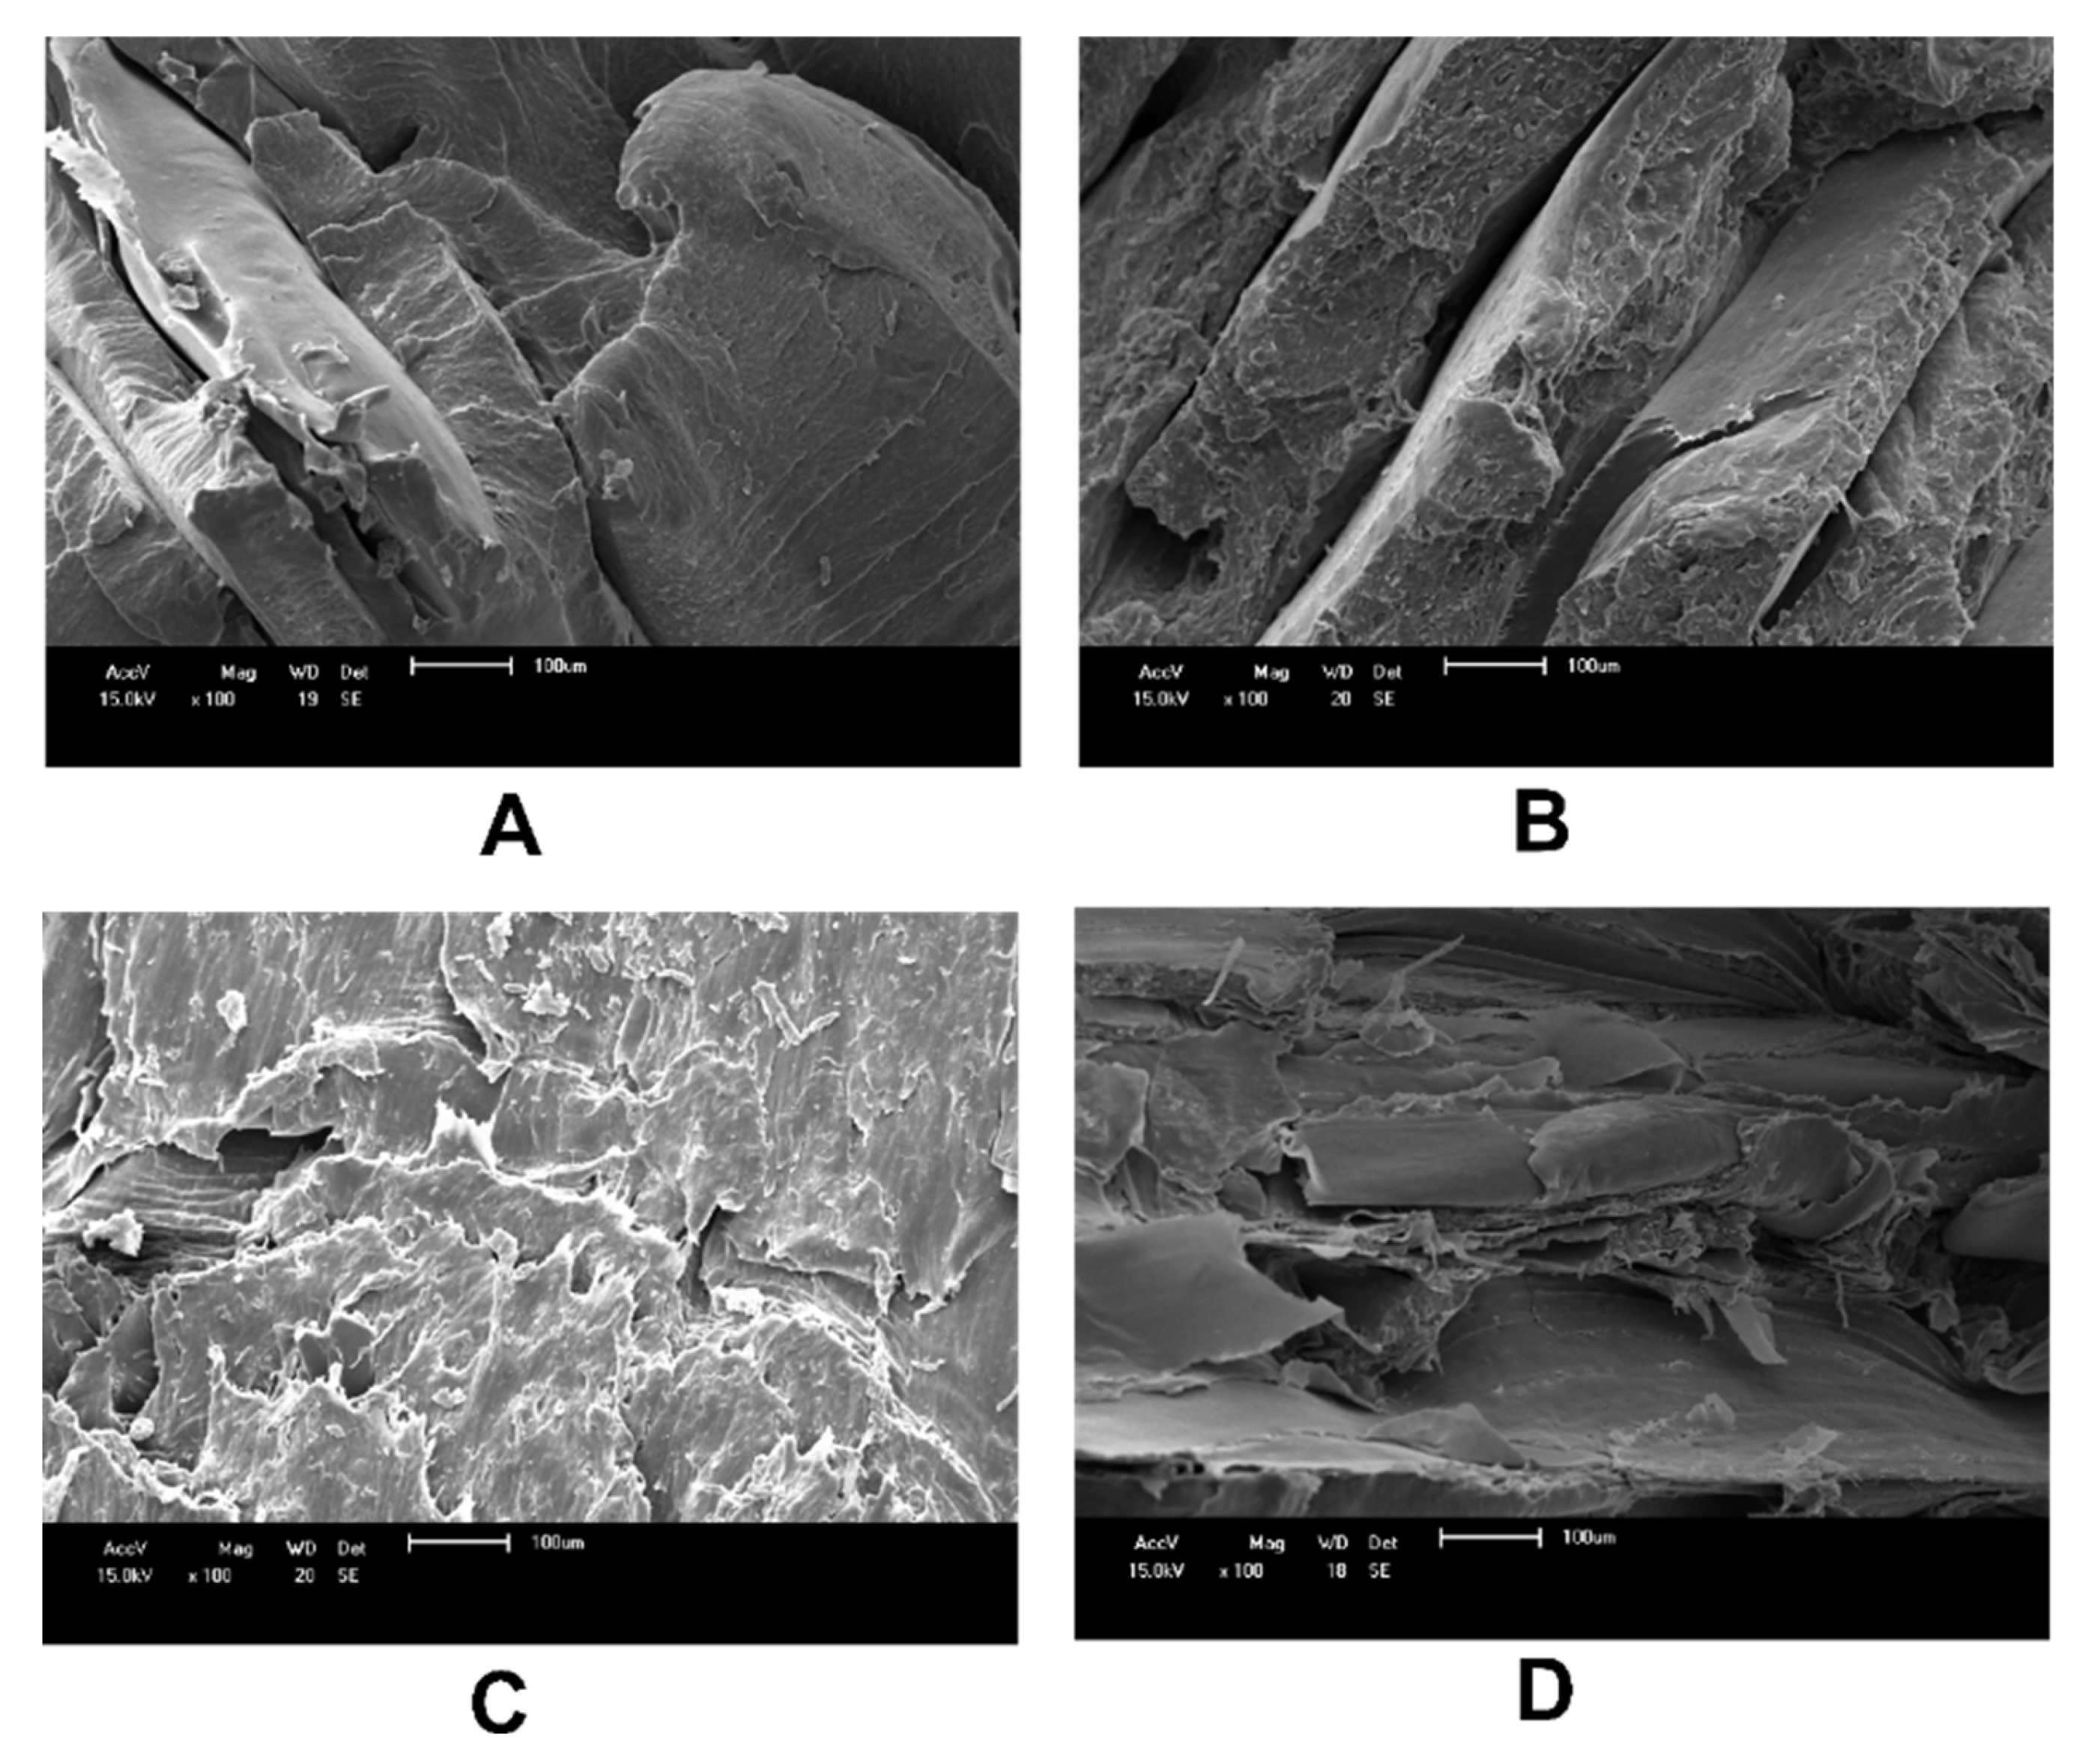
Figure 14.
Fracture of the impact specimens increased by 500x. (A) ABS-100, (B) PP-100, (C) 90/10, (D) 80/10.
Figure 14.
Fracture of the impact specimens increased by 500x. (A) ABS-100, (B) PP-100, (C) 90/10, (D) 80/10.
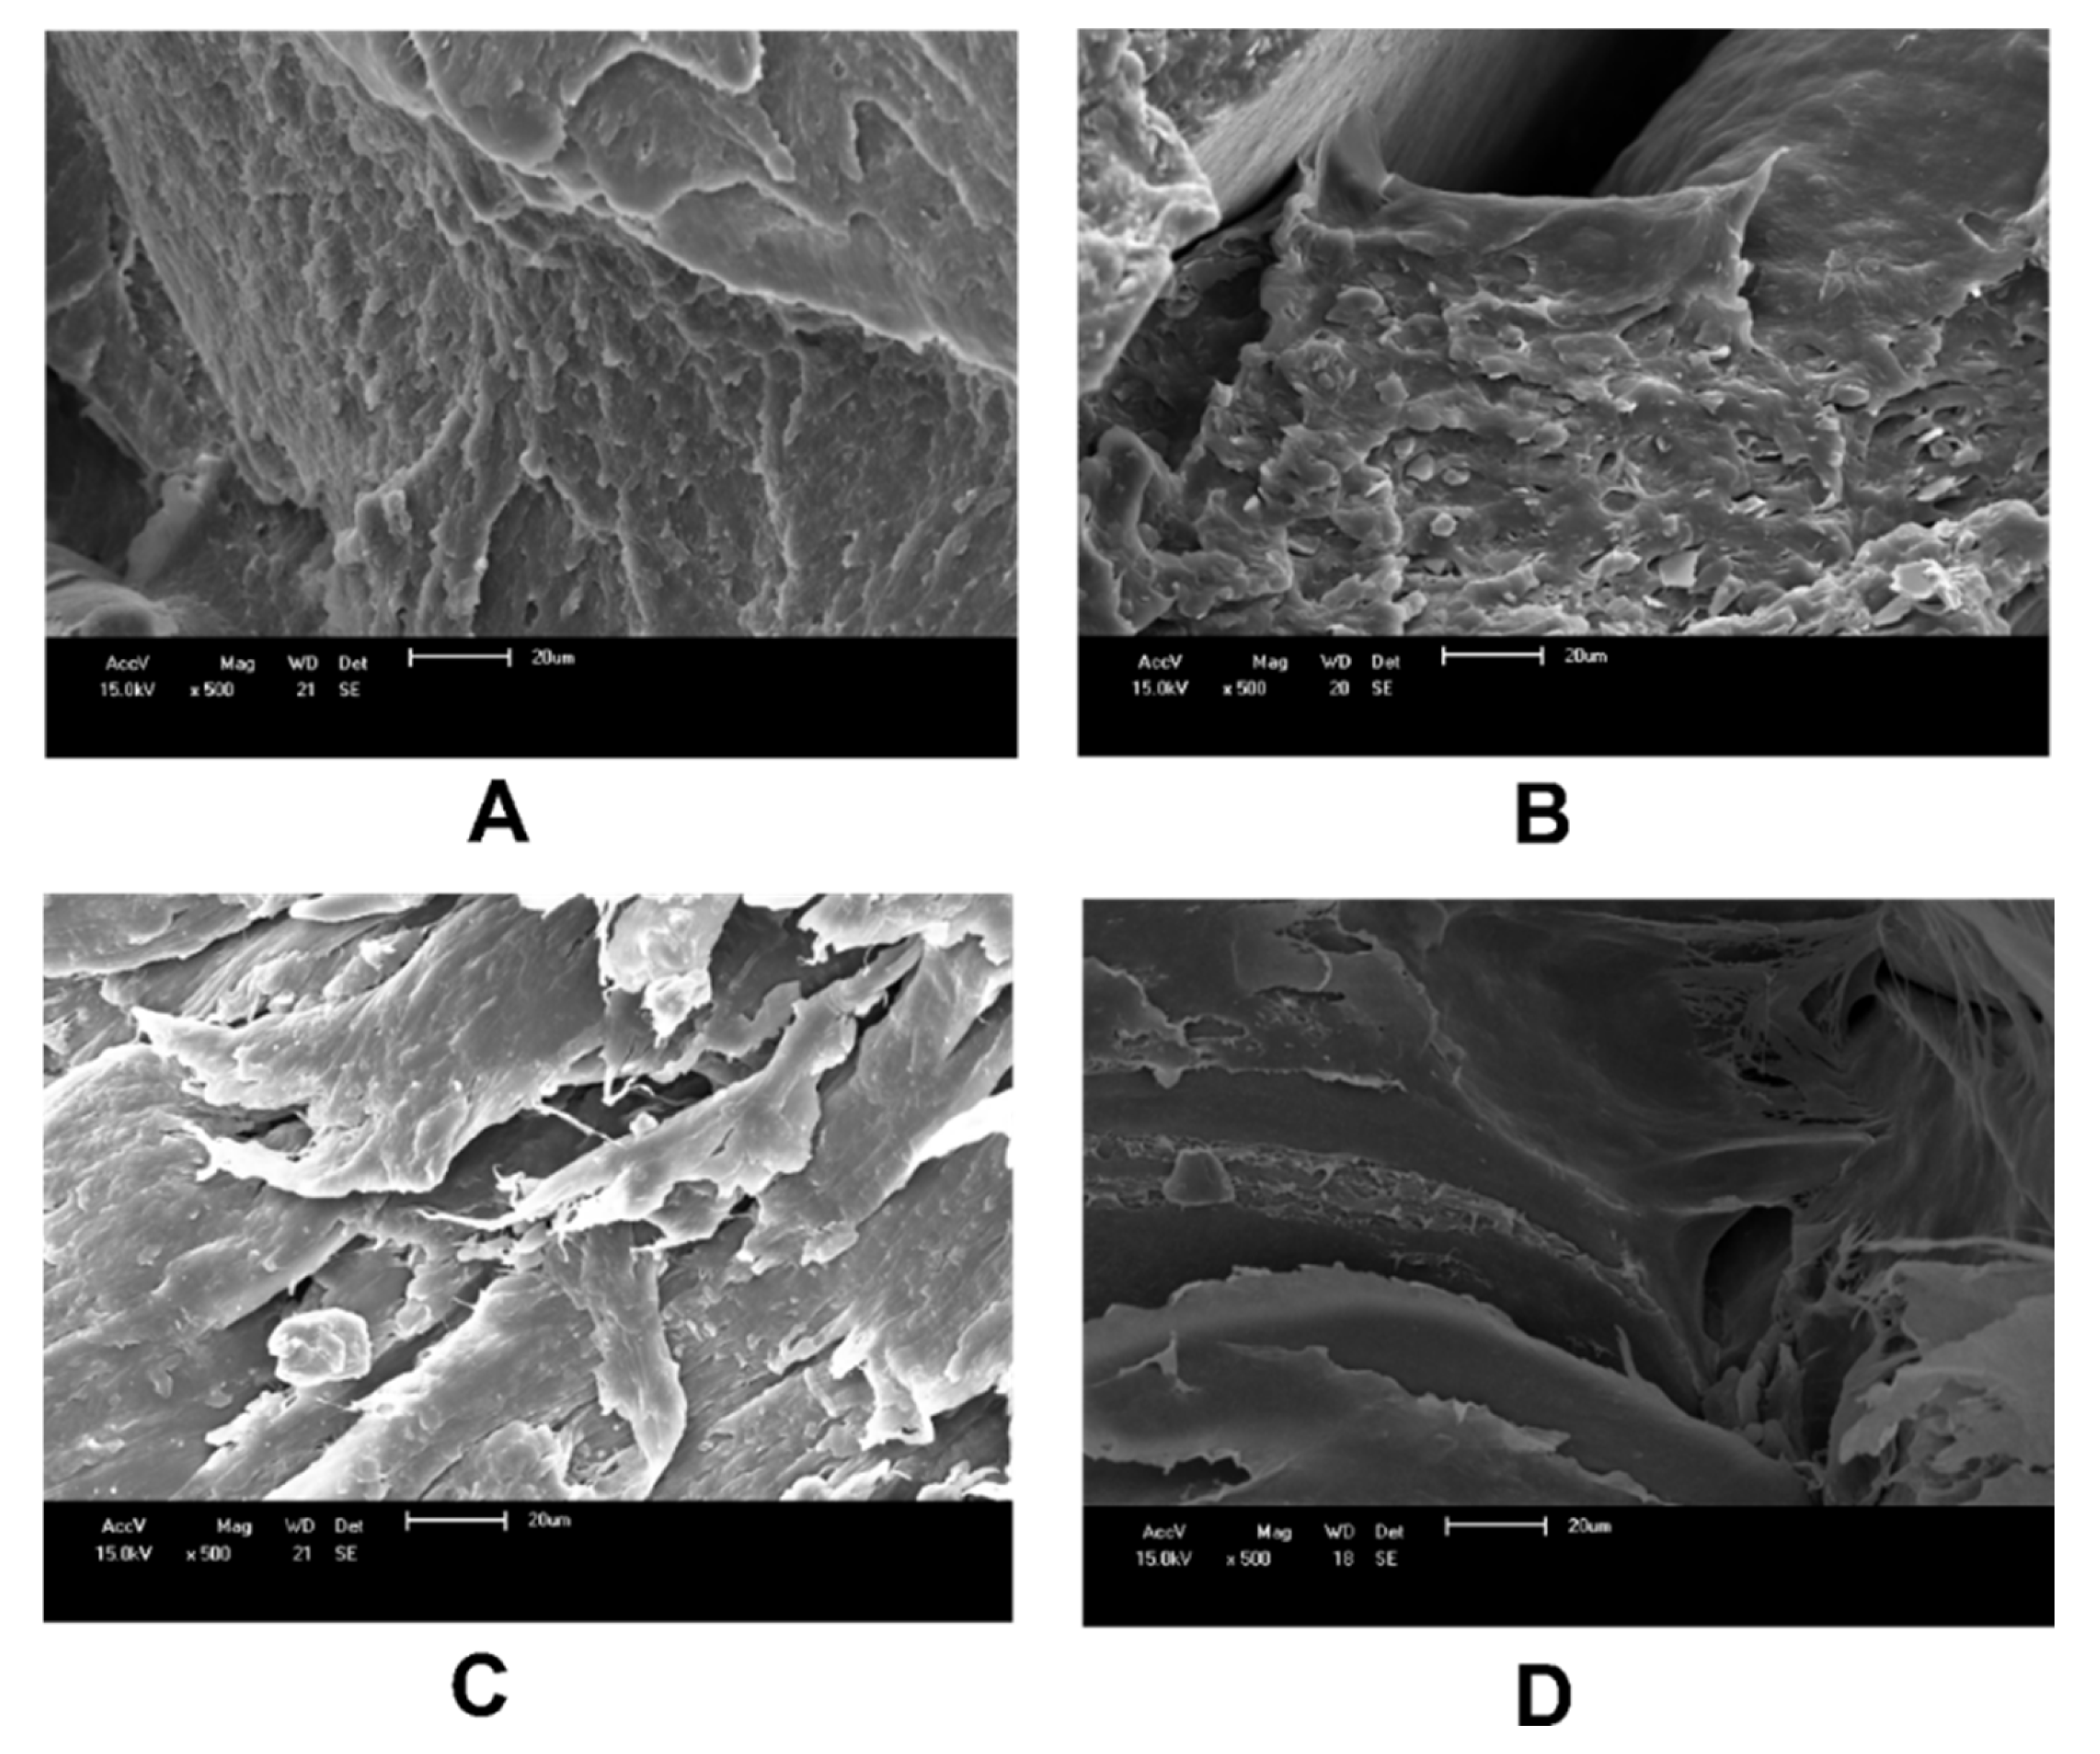
Figure 15.
Results for the analysis of differential scan calometry.
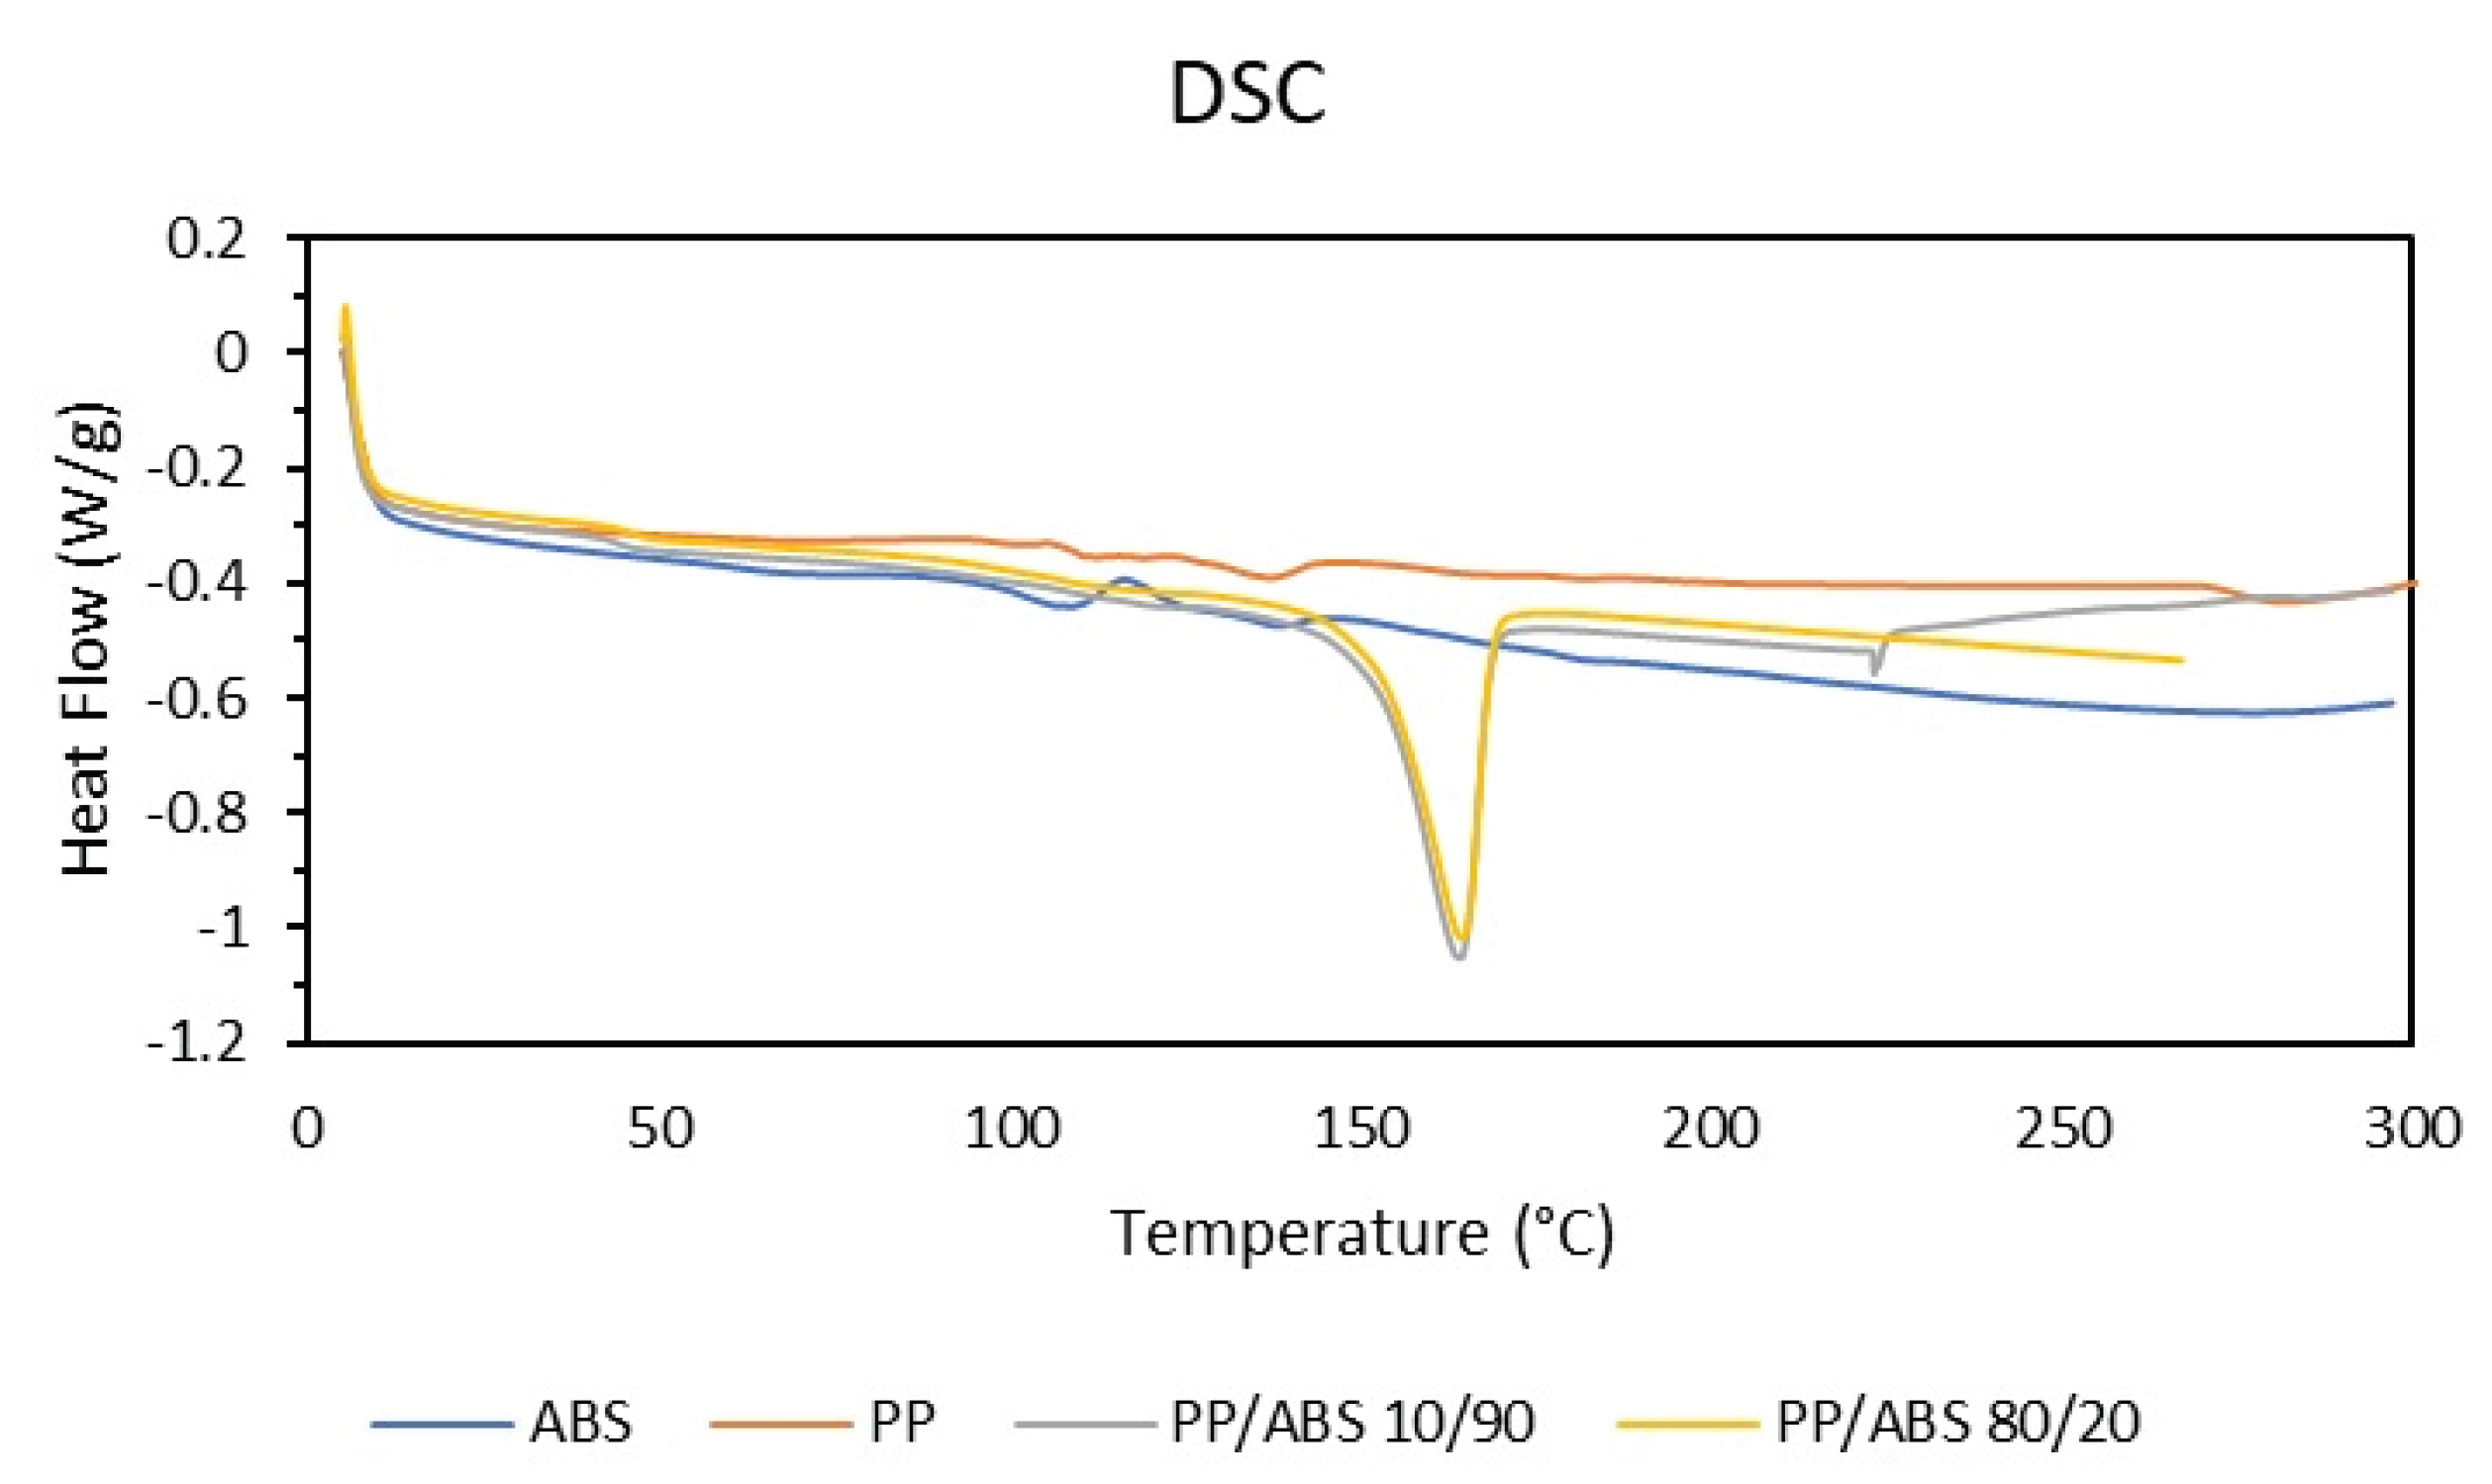
Figure 16.
Results for the thermogravimetry analysis.
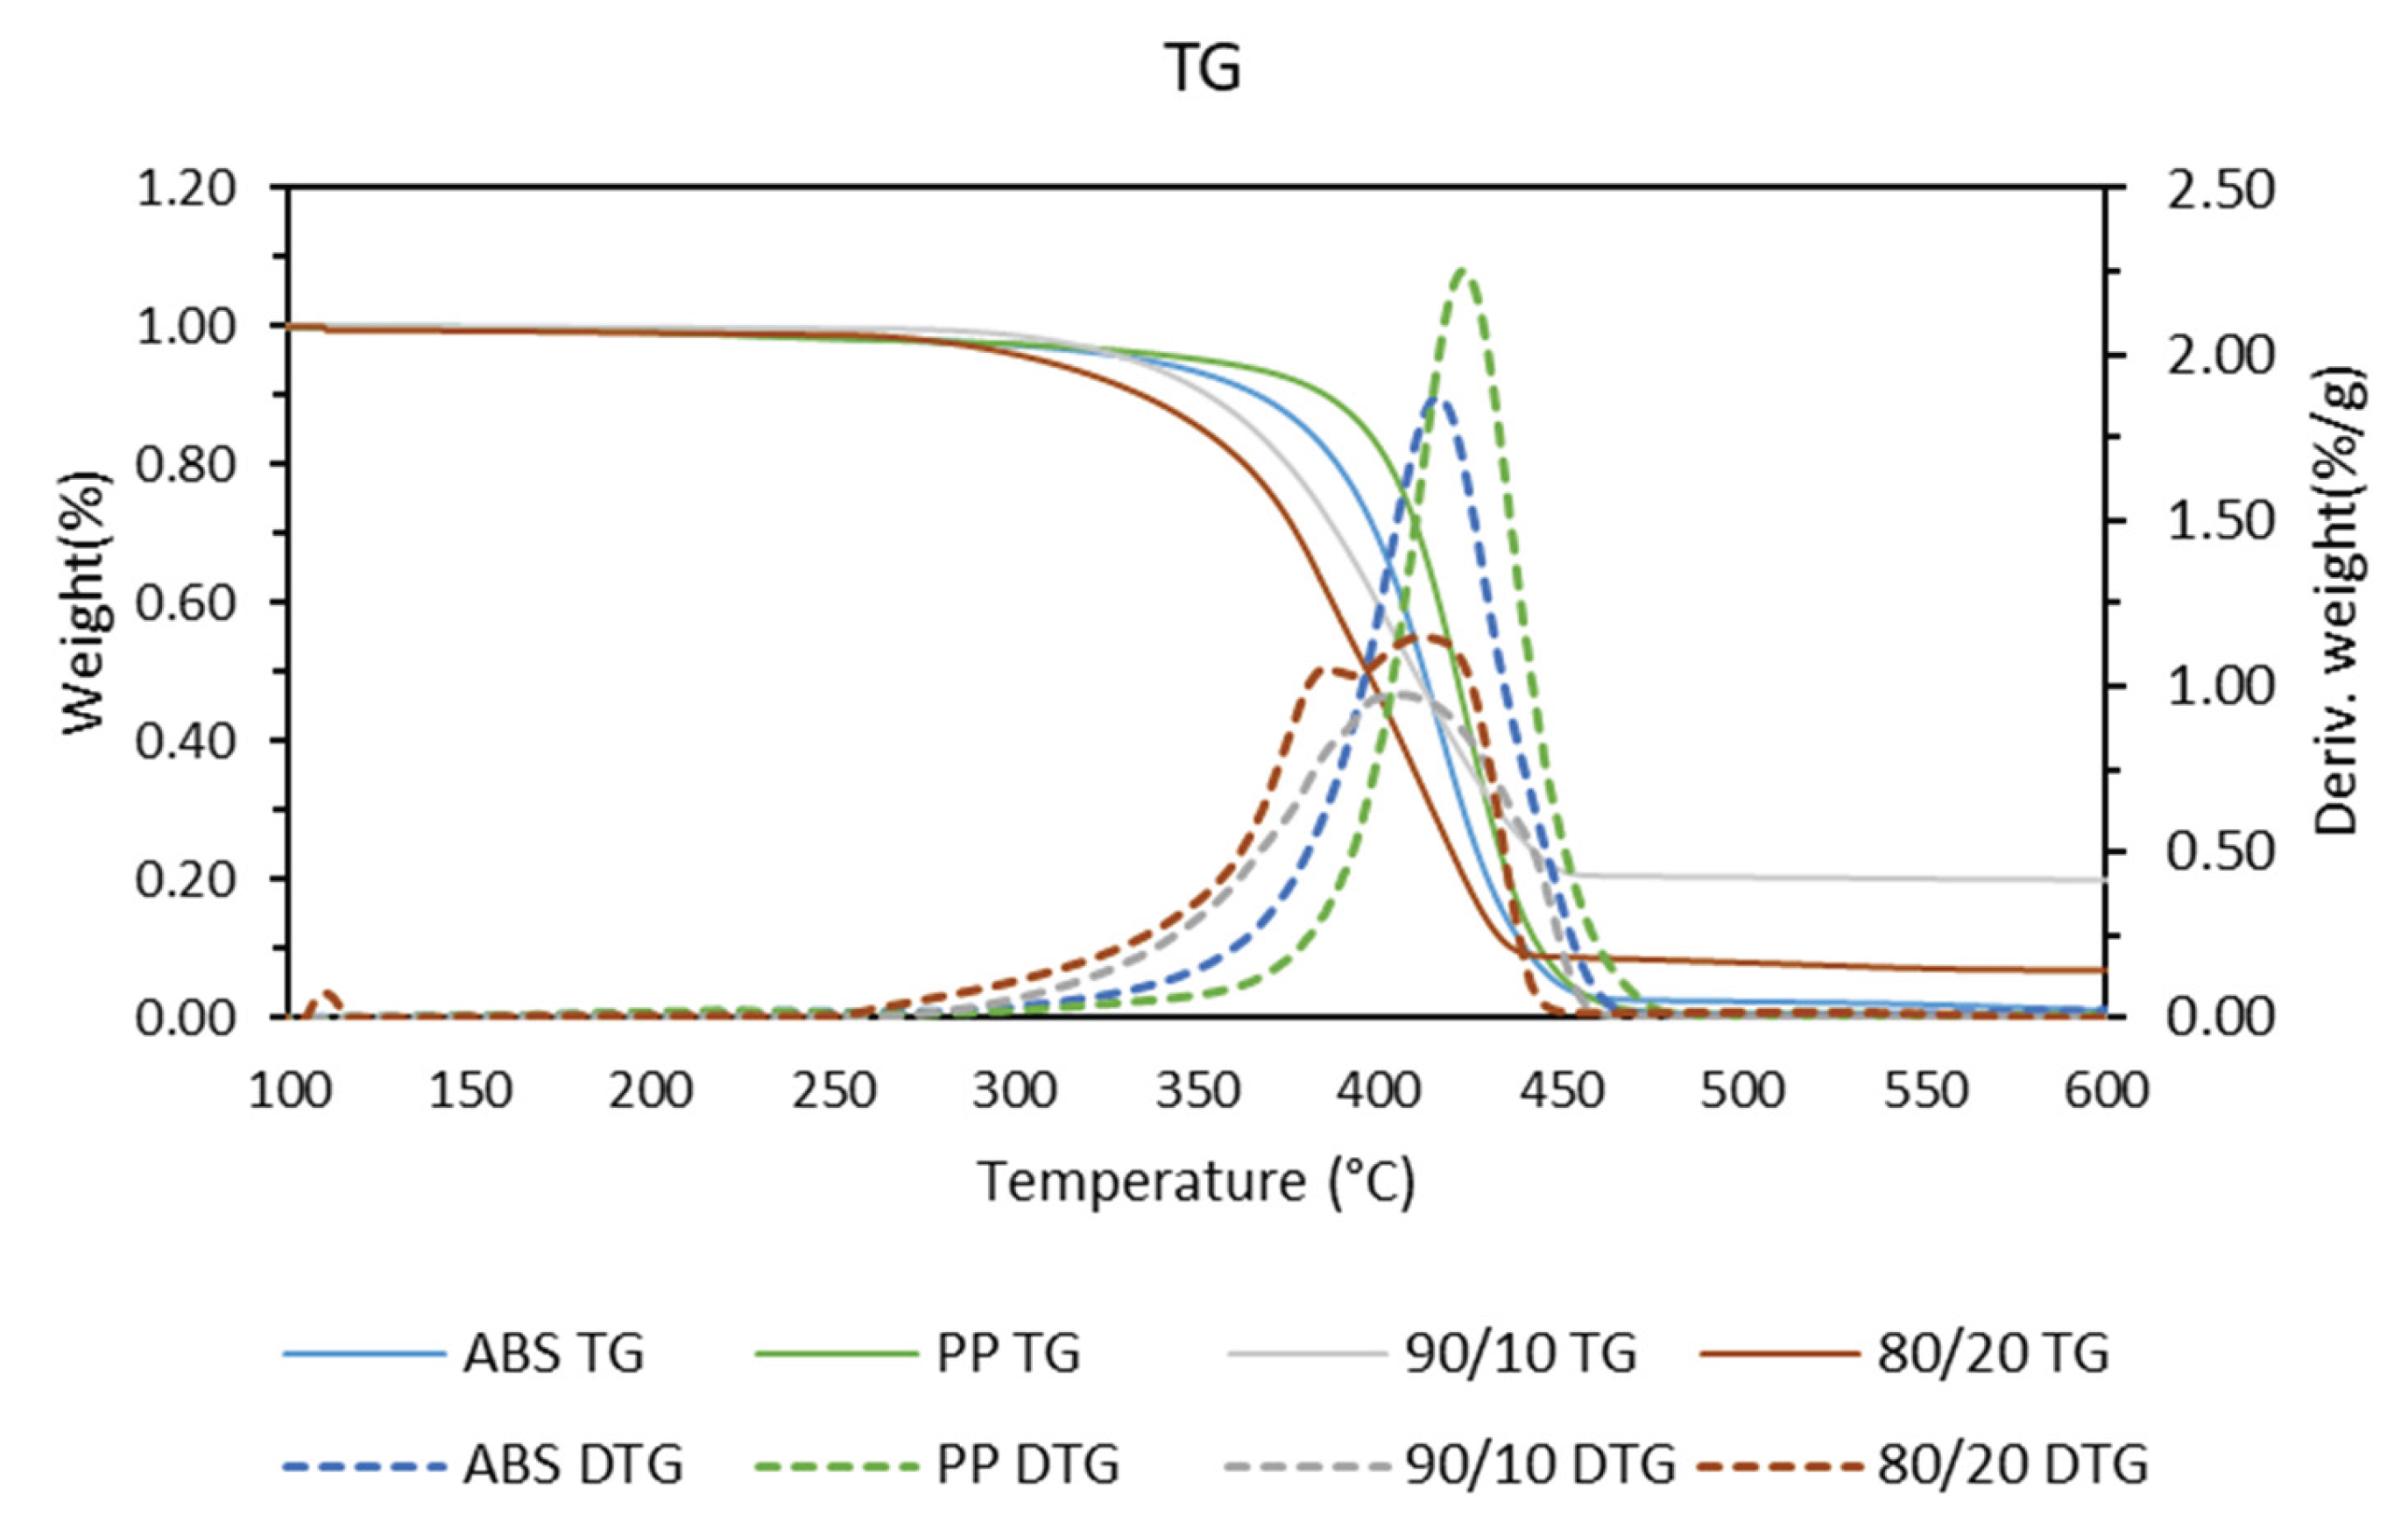

Table 1.
Percentage by weight of material used in the production of samples and sample name.
| Sample | % PP | % ABS |
|---|---|---|
| PP | 100 | 0 |
| ABS | 0 | 100 |
| PP/ABS 50/50 | 50 | 50 |
| PP/ABS 80/20 | 80 | 20 |
| PP/ABS 90/10 | 90 | 10 |
Table 2.
Blend printing parameters.
| Printing Parameters of the Blends | Value | Unit |
|---|---|---|
| Nozzle diameter | 0.8 | mm |
| Extrusion width | 0.8 | mm |
| Height of the first layer | 0.3 | mm |
| Default Layer Height | 0.2 | mm |
| Extrusion Temperature | 235 | °C |
| Platform Temperature (ABS) | 110 | °C |
| Temperature of the first layer of the platform (PP and blends) | 110 | °C |
| Temperature of the other PP layers and blends | Environment | |
Table 3.
Comparison of the tensile strength limit of samples printed at 45°.
| Angle 45° | p-Value | Evaluation | Interpretation |
|---|---|---|---|
| ABS - PP | 2.08723E-06 | p<0.05 | ABS>PP |
| PP - 90/10 | 3.53899E-05 | p<0.05 | PP>10/90 |
| 90/10 - 80/20 | 0.039432564 | p<0.05 | 90/10>80/20 |
Table 4.
Comparison of the tensile strength limit of samples printed at 90°.
| Angle 90° | p-Value | Evaluation | Interpretation |
|---|---|---|---|
| ABS - PP | 8.48685E-10 | p<0.05 | ABS>PP100 |
| PP-80/20 | 0.008237644 | p<0.05 | PP>80/20 |
| 80/20-10/90 | 0.0009662 | p<0.05 | 80/20>90/10 |
Table 5.
Comparison of the tensile strength limit between samples of the same material printed at 45° and 90°.
Table 5.
Comparison of the tensile strength limit between samples of the same material printed at 45° and 90°.
| 45°-90° | p-Value | Evaluation | Interpretation |
|---|---|---|---|
| ABS | 0.000890962 | p<0.05 | 45°>90° |
| PP | 0.001279405 | p<0.05 | 45°>90° |
| 90/20 | 6.53158E-06 | p<0.05 | 45°>90° |
| 80/20 | 0.070174803 | P>0.05 | 45°=90° |
Table 6.
Comparison of the modulus of elasticity of samples printed at 45°.
| Angle 45° | p-Value | Evaluation | Interpretation |
|---|---|---|---|
| ABS 100 - 90/10 | 0.000157955 | p<0.05 | ABS > 90/10 |
| 90/10 - 80/20 | 0.21721859 | p>0.05 | 90/10 = 80/20 |
| 80/20 - PP 100 | 0.139369528 | p>0.05 | PP = 80/20 |
Table 7.
Comparison of the modulus of elasticity of samples printed at 90°.
| Angle 90° | p-Value | Evaluation | Interpretation |
|---|---|---|---|
| ABS 100 - 80/20 | 3.31748E-05 | p<0.05 | ABS > 20/80 |
| 80/20 - 90/10 | 0.008734081 | p<0.05 | 80/20>90/10 |
| 90/10 - PP100 | 0.457600727 | p>0.05 | 90/10=PP100 |
Table 8.
Comparison of the modulus of elasticity of samples of the same material printed at 45° and 90°.
Table 8.
Comparison of the modulus of elasticity of samples of the same material printed at 45° and 90°.
| 45°-90° | p-Value | Evaluation | Interpretation |
|---|---|---|---|
| ABS 100 | 1.93399E-05 | p<0.05 | 45°<90° |
| PP 100 | 0.149076289 | P>0.05 | 45°=90° |
| 10/90 | 0.245841476 | P>0.05 | 45°=90° |
| 20/80 | 0.003944038 | p<0.05 | 45°<90° |
Table 9.
Comparison of the compressive strength limit of samples printed in the horizontal direction.
Table 9.
Comparison of the compressive strength limit of samples printed in the horizontal direction.
| Horizontal | p-Value | Evaluation | Interpretation |
|---|---|---|---|
| ABS - PP | 5,841E-07 | p<0.05 | ABS>PP |
| PP - 80/20 | 9.48E-08 | p<0.05 | PP>90/10 |
| 90/10 - 80/20 | 0.2434932 | p>0.05 | 90/10=80/20 |
Table 10.
Comparison of the compressive strength limit of samples printed in the vertical direction.
Table 10.
Comparison of the compressive strength limit of samples printed in the vertical direction.
| Vertical | p-Value | Evaluation | Interpretation |
|---|---|---|---|
| ABS - PP | 6.47308E-09 | p<0.05 | ABS>PP |
| PP - 80/20 | 0.325478086 | p>0.05 | PP=90/10 |
| 90/10 - 80/20 | 0.072074628 | p>0.05 | 90/10=80/20 |
Table 11.
Comparison of the compressive strength limit of the same type of sample printed in the vertical and horizontal direction.
Table 11.
Comparison of the compressive strength limit of the same type of sample printed in the vertical and horizontal direction.
| Horizontal - Vertical | p-Value | Evaluation | Interpretation |
|---|---|---|---|
| ABS | 0.162641511 | p>0.05 | H=V |
| PP | 2.09277E-05 | p<0.05 | V>H |
| 90/10 | 0.000162034 | p<0.05 | V>H |
| 80/20 | 0.000487349 | p<0.05 | V>H |
Table 12.
Comparison of the modulus of elasticity in compression of the printed samples in the horizontal direction.
Table 12.
Comparison of the modulus of elasticity in compression of the printed samples in the horizontal direction.
| Horizontal | p-Value | Evaluation | interpretation |
|---|---|---|---|
| ABS - 80/20 | 5.41405E-08 | p<0.05 | ABS > 80/20 |
| 80/20 - PP | 0.325747451 | p>0.05 | 80/20 = PP |
| PP - 10/90 | 0.325747451 | p>0.05 | PP = 90/10 |
Table 13.
Comparison of the modulus of elasticity in compression of samples printed in the vertical direction.
Table 13.
Comparison of the modulus of elasticity in compression of samples printed in the vertical direction.
| Vertical | p-Value | Evaluation | Interpretation |
|---|---|---|---|
| ABS - PP | 7.37081E-11 | p<0.05 | ABS>PP |
| PP - 80/20 | 9.80912E-07 | P<0.05 | PP<90/10 |
| 90/10 - 80/20 | 0.46448989 | p>0.05 | 90/10=80/20 |
Table 14.
Comparison of the modulus of elasticity for the same sample type for different printing directions.
Table 14.
Comparison of the modulus of elasticity for the same sample type for different printing directions.
| Horizontal - Vertical | p-Value | Evaluation | Interpretation |
|---|---|---|---|
| ABS | 0.005579871 | p<0.05 | V>H |
| PP | 0.07010802 | p>0.05 | V=H |
| 90/10 | 9.29644E-08 | p<0.05 | V>H |
| 80/20 | 7.84052E-05 | p<0.05 | V>H |
Table 15.
Comparison between the different materials in impact resistance.
| Sample | p-Value | Evaluation | Interpretation |
|---|---|---|---|
| ABS - PP | 1.19753E-05 | p<0.05 | ABS < PP |
| ABS - 90/10 | 4.71536E-07 | p<0.05 | ABS>90/10 |
| 90/10 - 80/20 | 7.26103E-06 | p<0.05 | 90/10>80/20 |
Table 16.
Comparison of Shore D hardness for the top and bottom of the same material.
| Top - Base | p-Value | Evaluation | Interpretation |
|---|---|---|---|
| ABS | 0.070182 | p>0.05 | Top=base |
| PP | 3.2112E-08 | p<0.05 | Top>base |
| 10/90 | 0.30803911 | p>0.05 | Top=base |
| 20/80 | 2.9513E-06 | p<0.05 | Base>top |
Table 17.
Comparison of Shore D hardness to the top of different types of material analyzed.
| Top | p-Value | Evaluation | Interpretation |
|---|---|---|---|
| ABS - PP | 2.6717E-17 | p<0.05 | ABS>PP |
| PP - 80/20 | 0.25527666 | p>0.05 | PP=80/20 |
| 80/20 - 90/10 | 1.4034E-05 | p<0.05 | 80/20>90/10 |
Table 18.
Comparison of Shore D hardness for the base of different types of material analyzed.
| Base | p-Value | Evaluation | Interpretation |
|---|---|---|---|
| ABS - 20/80 | 3.6068E-22 | p<0.05 | ABS>20/80 |
| PP - 20/80 | 3.9566E-15 | p<0.05 | PP < 20/80 |
| PP - 10/90 | 0.29074461 | p>0.05 | PP=10/90 |
Disclaimer/Publisher’s Note: The statements, opinions and data contained in all publications are solely those of the individual author(s) and contributor(s) and not of MDPI and/or the editor(s). MDPI and/or the editor(s) disclaim responsibility for any injury to people or property resulting from any ideas, methods, instructions or products referred to in the content. |
© 2025 by the authors. Licensee MDPI, Basel, Switzerland. This article is an open access article distributed under the terms and conditions of the Creative Commons Attribution (CC BY) license (http://creativecommons.org/licenses/by/4.0/).
Copyright: This open access article is published under a Creative Commons CC BY 4.0 license, which permit the free download, distribution, and reuse, provided that the author and preprint are cited in any reuse.


