
Submitted:
07 July 2025
Posted:
08 July 2025
You are already at the latest version
Abstract
High-Density Polyethylene (HDPE) has been playing a crucial role in the life of every human being, due to its properties, such as chemical resistance, lightweight, and ease of forming, among others. Its usage ranges from bottles for beverages and other liquids, pipes, wire and cable insulations, and prosthetics. As it undergoes several thermal cycles during its life cycle, it is important to maintain its qualities even after undergoing thermal and thermo-oxidative degradations. Here, various dosages of synthetic (Irganox 1010) and natural (vitamin E) antioxidants are added into HDPE formulations to study their impacts on HDPE stability. The antioxidants are mixed physically with HDPE before the mixtures are melt-mixed three times to represent their life cycles. Samples are taken after each time and used to analyze the molecular weight distribution, rheological behavior, mechanical properties, and thermal stability. The results show that vitamin E is superior to Irganox 1010 in those tests, as vitamin E performance exceeds Irganox 1010, even in lesser doses. The only drawback of using vitamin E is the yellow color caused by it, which may necessitate another additive to enhance the color stability of HDPE in color-sensitive applications.
Keywords:
high-density polyethylene
; antioxidant
; vitamin E
; irganox 1010
; thermal degradation
; mechanical properties
; molecular weight
1. Introduction
In the present day, almost all our lives revolve around polymer materials. This dependency is mainly caused by the high performance of such materials. It is easily mass-produced, lightweight, durable, and can be tailored to almost all the needs of humanity. High-density polyethylene (HDPE) is one of the most prominent, with around 51.33 million tons [1] or 13% [2] from global plastic production, depending on sources. HDPE has a very wide field of applications, from milk and oil bottles [3], pipes [4], wire insulations [5], and prosthetics [6]. Due to this wide range of applications, the polyethylene products available in the market are rarely pristine; rather, they are modified with additives to achieve their desired properties [7] for the applications. Additives such as plasticizers, colorants, and antistatic agents are added to achieve the key characteristics of the plastics, such as Izod impact, tensile strength, elongation at break, and color.
Different end products necessitate different processing techniques. Several polymer processing techniques in-clude injection molding, blow molding, rotational molding, extrusion, and others [8]. The polymer processing usually starts with mixing the polymer with the additives physically. Then, the mixture is melt-mixed into pellets, so it is easier to store or transport. However, this step exposes the polymer to the first thermal and mechanical stress. Further processing of the pellet into the desired shape exposes it to the second stress. Finally, as the polymer can be recycled into the raw material after its initial use, it is exposed to the third stress. These stresses can be detrimental to the qualities of the polymer, as they degrade the polymer chains and mess with the in-ternal structure of the products.
The degradation is due to the polymer chains undergoing thermos-oxidative degradation at the molecular level. Under thermal and mechanical stress, free radicals are formed during the initiation stage and react with the polymer chains in the propagation stage, cutting them into weaker, lower molecular weight chains. The propagation stage is largely dependent on the removal of hydrogen. A polymer with a lower carbon-hydrogen bond strength will form more stable radicals, hence more susceptible to oxidation [9]. The propagation reaction will continue to occur, ranging from 800-17500 cycles [10], until the radicals are deactivated in the termination stage. These reactions are simplified in Figure 1 and have been studied further in more detail [11]. Although the propagation step was under further scrutiny from scientists [12], it remains one of the simplest and most representative models of polymer degradation.
To prevent these reactions, antioxidants are added as additives to the formulations of the polymers. Primary antioxidants act as scavengers and react with free radicals in the propagation steps, while secondary antioxidants react with the peroxide radicals. Both antioxidants turn the radicals from chain-cutting substances into less reactive specimens [14]. Antioxidants are essential for the polymers to maintain their properties even after undergoing stresses. Numerous researches were done to study the impact of various antioxidants to the qualities of the polymers, for examples: quercetin [15], caffeic acid, naringin, gallic acid [16], and black and green tea extract [17], Currently, one of the most common [18] and effective [19] antioxidants used is Irganox 1010, which is an example of synthetic antioxidants. However, due to environmental [20,21] and health concerns [22], there is are urge to replace them with natural antioxidants as polymer additives, such as vitamin E [23]. In this work, both antioxidants’ performances on HDPE were compared after different stages of its lifecycle. In addition, since antioxidants were known to cause yellowing [24] of the polymer, polyethylene glycol (PEG) was added and studied to determine its impact on improving the color of the polymer.
2. Materials and Methods
2.1. Materials
The additives used in this study, such as the antioxidants Irganox 1010 (molecular weight 1178 g/mole), vitamin E (formula C29H50O2), and polyethylene glycol (PEG 6000), were supplied by BASF. The high-density polyethylene (density of 0.953 g/cm3) was supplied by SABIC.
2.2. Method
2.2.1. Sample Formulation and Mixing
All formulations were prepared manually using high high-precision scale (0.001g) manufactured by Taishi. Then, using a laboratory mixer (Henschel 5kg capacity mixer), all samples were dry-mixed at room temperature and 800 RPM for 160 seconds to ensure full homogenization for each formulation.
The formulation will follow the Design of Experiment Methods, using a full factorial design. Three parameters are selected: dosage of Irganox 1010 (in ppm), dosage of vitamin E (ppm), and the number of passes in times. Each parameter has three levels (minimum, medium, and maximum). The levels and values of the parameters are written in Table 1. The detailed formulations are shown in Table 2. Formulations 1-27 are used to study the impact of antioxidants, while formulations 28-36 are used to study the impact of PEG on the color stability of the polymer. PEG is added to samples with the maximum value of the antioxidants.
2.2.2. Melt Mixing
Each formulation went through melt mixing by twin-screw extruder manufacture by Thermofisher (model PTW24/40 MC) with a screw diameter of 24mm, 40 L/D, and 10 mixing zones. Temperature profile was (120-215℃) with 200 rpm screw speed, as shown in Figure 3. Melt mixing was repeated three times per formulation (multipassing), and samples were collected after each pass. First pass represents the compounding processing by the resin supplier (such as virgin polymer extrusion). The second pass represents the conversion processing (Such as new article blow molding). The third pass represents the mechanical recycling of the material or reprocessing at converters.
2.2.3. Compression Molding
A Collin compression molding machine (P 300 S, Collin, Germany) was used to produce mechanical testing samples. Pellets were compressed to sheets at 180℃ for 10 min, the first 5 min at 5 bar and the next 5 min at 25 bars, then allowed the cooling rate of 15℃ per min.
2.3. Characterization
2.3.1. Gel Permeation Chromatography
A gel permeation chromatograph (GPC 2000, Waters Alliance, US) equipped with a differential refractive index detector was used to measure average molecular weight (MW), number average (Mn), and polydispersity of prepared samples. To dissolve the samples, 1,2,4-Trichlorobenzene stabilized by butylated hydroxytoluene was used.
2.3.2. Melt Flow Index
Following ISO1133 standard, samples were placed into the melt-flow apparatus barrel and extruded through the die with specified dimensions and under a prescribed set of conditions. At 190℃ and 2.16 kg load, an extrusion plastometer (Aflow, ZwickRoell, Ulm, Germany) was used to measure melt flow characteristics.
2.3.3. Dynamic Mechanical Analysis
A dynamic mechanical analysis test was conducted to measure the rheological properties of polymers. Samples were tested at constant temperature with increasing shear rate while recording complex viscosity as a response by a low shear rheometer (ARES G2, TA Instruments, DE, US) as per ASTM D4440.
2.3.4. Tensile Properties
Following the ASTM D638 standard, compression-molded samples were tested at room temperature (23°C). This test was used to measure the tensile strength at yield and break, as well as the elongation at both states (yield and break). Zwick/Roell Z010 universal testing machine equipped with contact extensometer arms for strain measurements was used. Pre-load of 0.1 MPa with a gage length of 50 mm and test speed of 1 mm/min for Young’s modulus and 50 mm/min for other properties was used.
2.3.5. Notched Izod Impact Test
Notched Izod impact test is mainly used to measure the toughness. Following standard ASTM D256, compression-molded samples were tested at room temperature (23 °C). Zwick/Roell HIT50P was used as an impact tester. Furthermore, test specimen dimensions are (64 × 12.7 × 3.2 mm) with 10.2 mm remaining depth following type A specifications as per ASTM D256.
2.3.6. Differential Scanning Calorimetry (DSC)
Notched This test was done using (Q2000, TA Instruments, DE, US) and following the ASTM D3418 standard. The sample was heated at a rate of 10℃ per minute to 200℃, then cooled and heated again at the same rate. Results are captured in the second heating.
2.3.7. Color Measurement
To measure samples’ color variation, pellets of each formulation were tested three times using a colorimeter (ColorFlex EZ, HunterLab, Virginia, United States) following ASTM D6290-19 standard.
3. Results and Discussions
3.1. Molecular Weight and Antioxidants Mechanism
The average molecular weight (MW) of all the formulations can be seen from Table 3. As all polymers are macromolecules, rather than a single figure, they are more accurately described by the Molecular Weight Distribution (MWD). If the MWD curve is skewed to the right, indicating that the polymer in concern has more fractions with high molecular weight. From this study, Figure 2 shows the MWD of the reference samples without any additives, with the average molecular weight values of 191991, 141649, and 115091, respectively. It can be seen that the more the sample is processed (as shown by the number of passes), the less the high-molecular-weight fraction is present inside it. The processing machine applies thermal and oxidative stress to the polymer to soften it and allow it to be shaped according to the desired product. However, the same stress also broke the polymer chain and induced radical formation, which led to more broken chains, as shown in Figure 1. Hence, the MWD aligned more to the center and left as the polymer was more processed. The phenomenon was similar to what happens to LLDPE [25] and different grades of HDPE [26].
Figure 2.
Molecular Weight Distribution (MWD) of the reference samples.
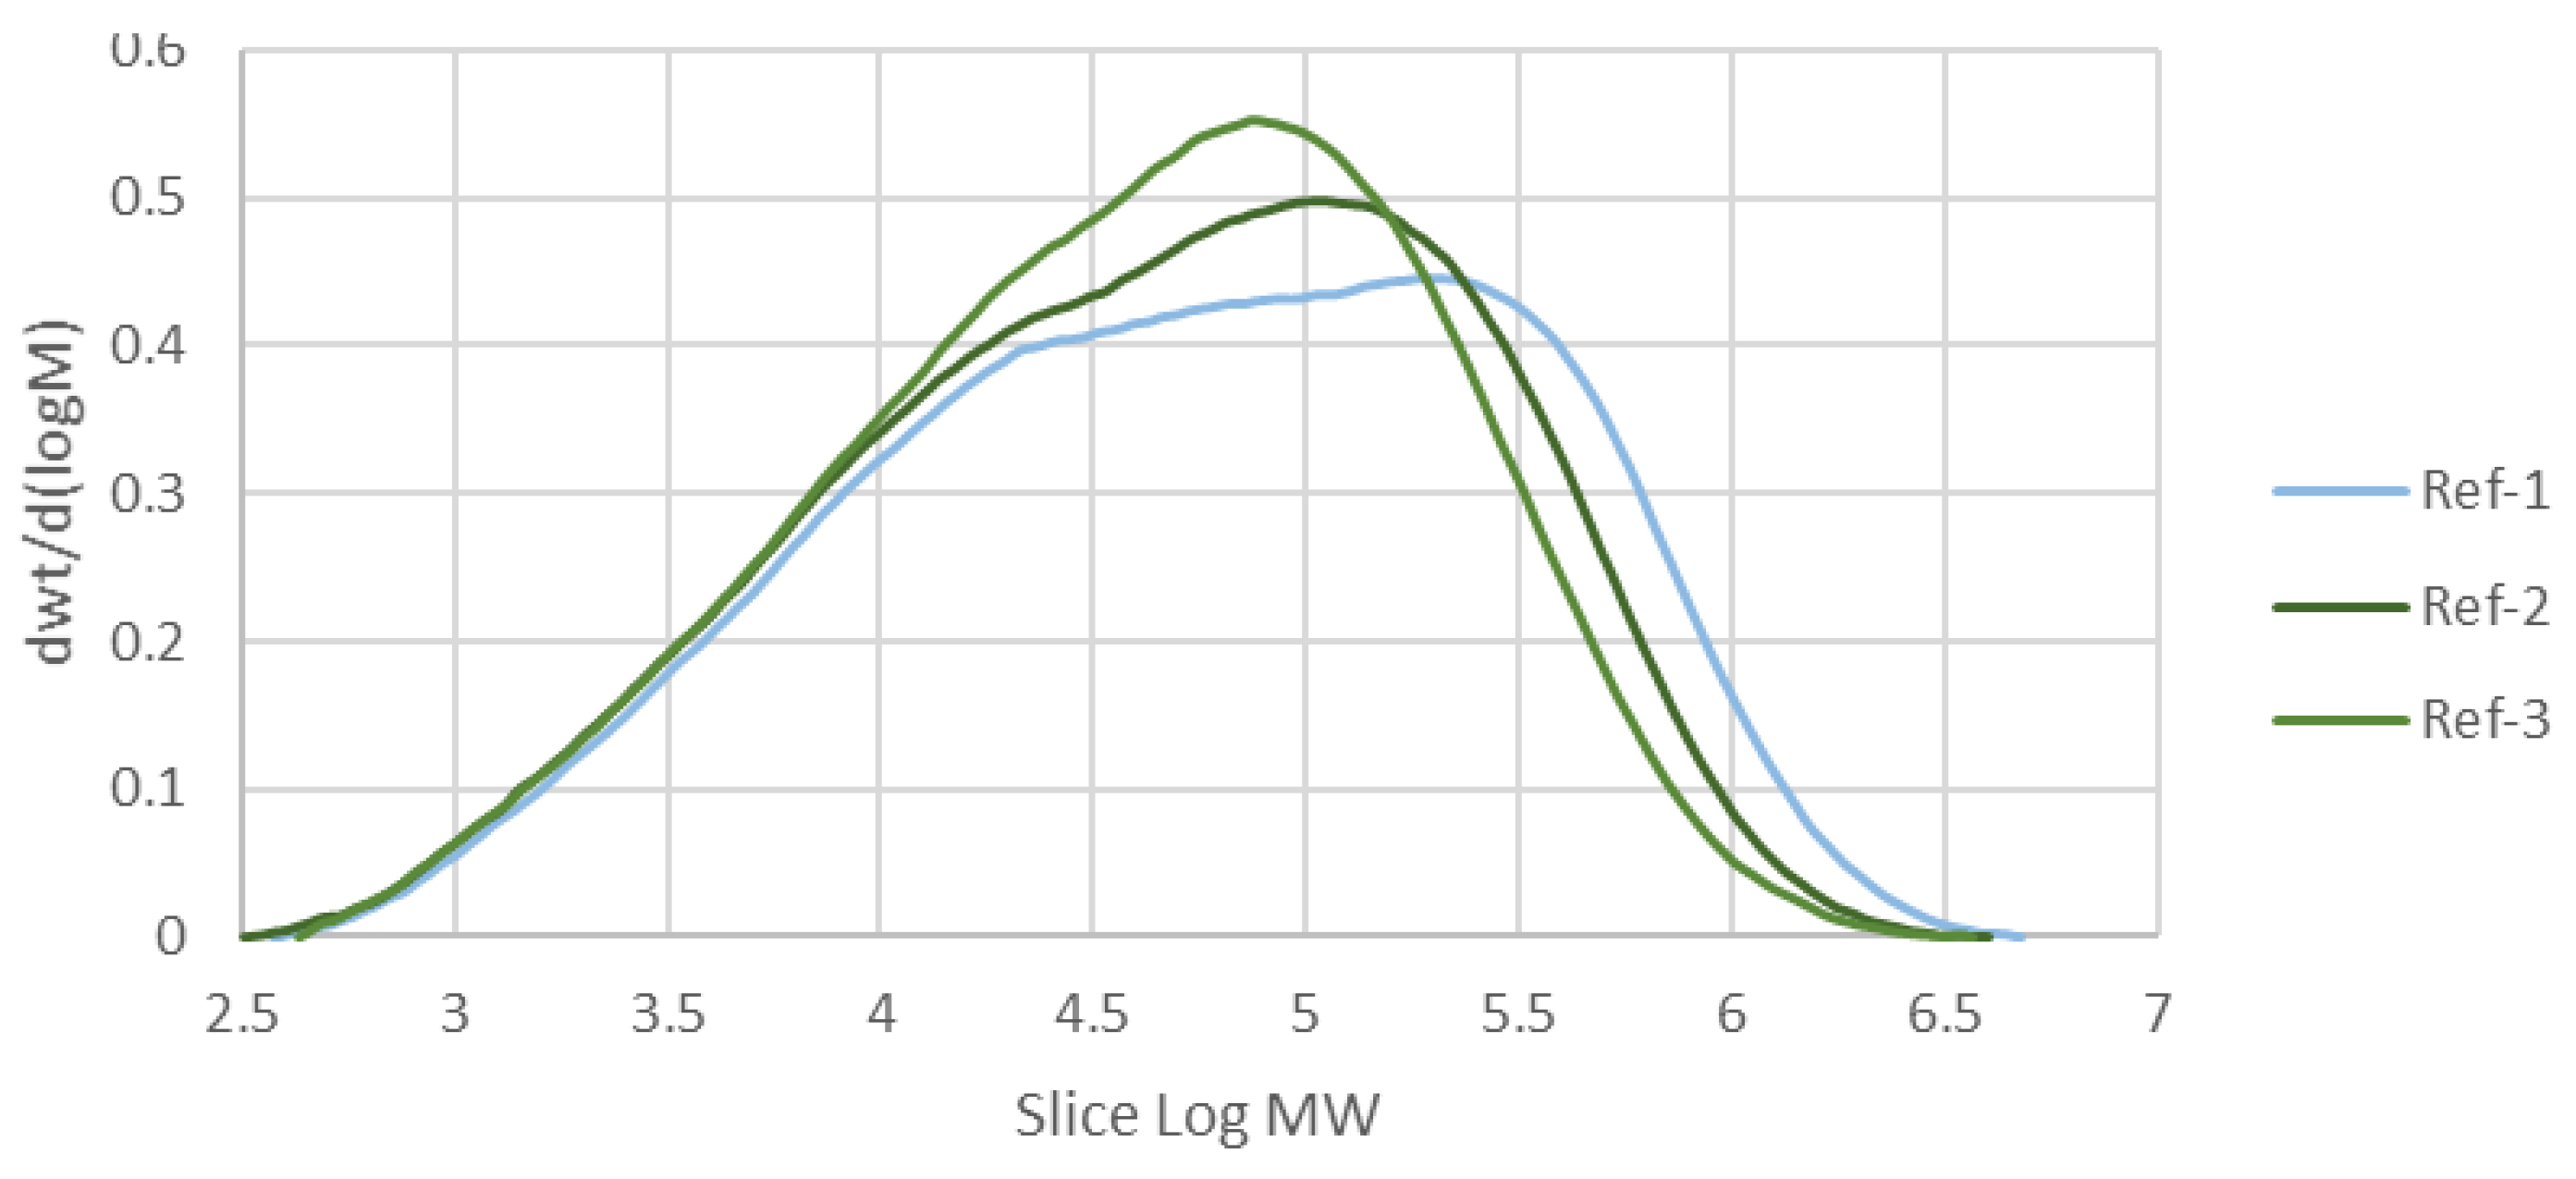
Figure 3.
General proposed mechanism of Irganox 1010 as an antioxidant. (A) is the structure of Irganox, (B) is the radical produced after it scavenges radicals, (C) is the quinonoid radical structure from B, (D) is the inactivated radical of C after scavenging polymer radicals and stopping the propagation of polymer degradation [27].
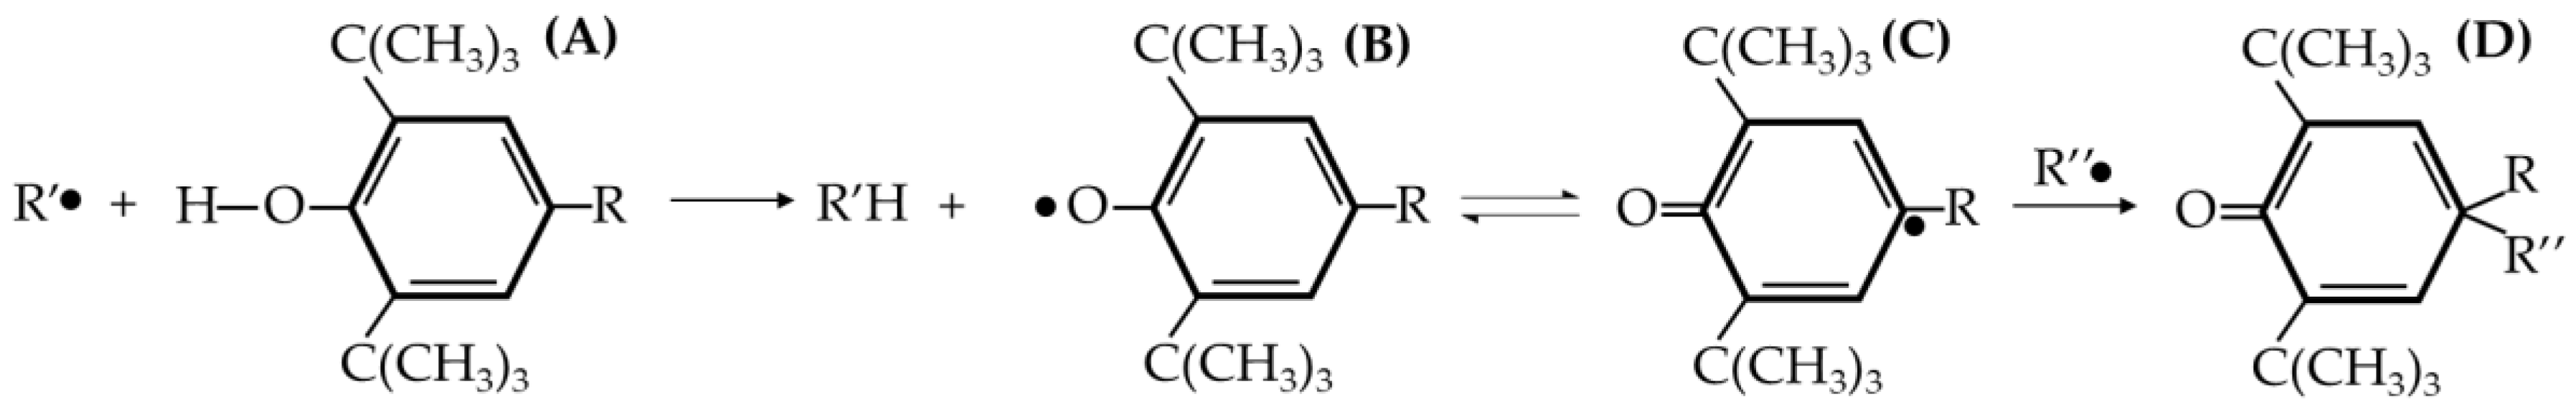
The first antioxidant that was used was Irganox 1010. It belonged to the hindered phenolic category and acted as a free radical scavenger. By reacting with free radicals produced by thermal and oxidative stress, it “sacrificed” itself and turned into radicals. However, Irganox 1010 has a high stability due to the aromatic ring resonance and the structure that causes the hydroxyl branch to be “hindered” [25]. So, the radical derived from the antioxidant has less reactivity, thus it will not react with other stable polymer chains. It was more likely to react with the polymer radicals and stop the propagation step in the degradation. Figure 3 shows the mechanism of Irganox 1010 as a radical scavenger. The results show that as the Irganox 1010 dosage in the plastic increases, the better the retention of the molecular weight of the plastic samples. Figure 4 shows the molecular weight of specimens after each pass of the reference samples and using Irganox 1010.
The second antioxidant studied in this experiment is vitamin E. Vitamin E, in its most active form (α-tocopherol), is a well-known antioxidant that is often taken as supplementation to humans’ diet, as it contains many benefits [28], and its deficiency causes some health-related problems [29]. It also acted as an antioxidant to polymer, albeit with a different mechanism compared to Irganox 1010. The hydroxyl branch in vitamin E exists in the chromane ring in Vitamin E [30]. The hydrogen of this hydroxyl group is donated to radical molecules to stabilize reactive organic species and help reduce the chain scission process. Figure 5A shows the action mechanism of vitamin E [7].
From the experiment result, it is shown that as vitamin E was introduced to the samples, its molecular weight was retained better, either as it went through more passes, or as the dosage increases, as shown in Figure 4. Moreover, as vitamin E is not as sterically hindered as the Irganox 1010 molecule, it allows for more mechanisms to react with free radicals, such as reacting directly with oxygen radicals (Figure 5B). From Figure 4, the performance of vitamin E with Irganox at the same dosage can be compared. As vitamin E and Irganox 1010 have good compatibility, vitamin E can also be used as an additive to plastic formulation with Irganox 1010, as shown in Figure 6.
3.2. Melt Flow Index
Table 3 shows the increasing MFI as the reference polymer sample went on each pass, from 6.8 g/10 min after the 1st pass, jumped to 31.3 g/10min after three passes. The increase in MFI is caused by the lower molecular weight due to the degradation process that occurs during heating [31]. The lower molecular weight will reduce the viscosity of the samples and make it easier to flow, so the melt flow index is increased.
With the addition of 200 ppm of Irganox 1010, there is some improvement, but the MFI increase is still significant. Only after 400 ppm of Irganox 1010, the HDPE relatively maintained its MFI. However, as in the case of the molecular weight, 200 ppm of vitamin E is sufficient to retain the MFI of the sample, even after the third pass. The performance of vitamin E in controlling MFI is in agreement with a previous study [31].
3.3. Dynamic Mechanical Analysis
From the dynamic mechanical analysis, the shear thinning behavior is exhibited by all three passes of reference and all formulations, as shown in Table 3 (and some are shown in Figure 8), which is an important property for the ease of processing. The shear stress applied by the equipment will break the intermolecular forces of the polymer chains, and allow them to flow more easily. However, the value of the melt strength should also be considered. The melt strength is determined from the complex viscosity at low shear rate (angular frequency 0.5 rad/s). Without any antioxidants, the complex viscosity of the reference samples drops by about 40% from 66897 Pa.s at the first pass to 40640 Pa.s at the third pass. This will lead to sagging of the parison during the blow molding process. Such sagging leads to less control over the wall thickness of the blow-molded bottle [33]. In this parameter, the addition of 400 ppm of Irganox 1010 didn’t help the HDPE to maintain its properties, as it still experienced a 34% drop in melt strength after the third pass. Only by using 400 ppm of vitamin E (7% drop) or combining 400 ppm of Irganox 1010 and 400 ppm of vitamin E (2% drop), the melt strength of HDPE is maintained, as shown in Figure 9.
3.4. Izod Impact Strength
Izod Impact Strength Test measures the impact resistance of the samples. As discussed in a previous study [34], impact resistance is related to the molecular weight. A polymer with a higher molecular weight can withstand higher impact, due to the presence of longer polymer chains that intertwine with each other, providing free volume inside, and act like a “foam”. So, the incoming force is absorbed and dispersed in different directions, preventing the force from breaking the polymer bond and forming a notch physically [35]. Table 4 shows the impact strength of the reference samples, which showed clear deterioration after each pass. It dropped from 515.2 J/m to 152.4 J/m, which represents a 70% drop in impact strength.
The addition of Irganox 1010 in 200 and 400 ppm only improves the impact strength of the HDPE by a small margin, as it still drops 49% and 41% from the initial impact strength after the third pass. On the other hand, vitamin E alone provides better results in both dosages (9% drop in 200 ppm, 1% drop in 400 ppm). Combining vitamin E with formulation with 400 ppm of Irganox 1010 also improved the impact strength (15% drop for 200 ppm vitamin E, almost 0% drop for adding 400 ppm vitamin E). Figure 10 shows the relationship between impact strength, molecular weight, and melt flow index. It is evident that as the MFI decreases due to higher molecular weight, the impact strength increases. A similar relation between MFI, molecular weight, and impact strength is observed in a previous study [34].
3.5. Tensile Properties
Another critical property for blow molding HDPE grades is tensile strength, which is linked to the top-load test of blow molded articles. Top load test is one of the critical quality properties of bottle-shaped producers. Table 4 shows that the tensile strength and Young’s modulus of the samples are retained in all formulations. However, the elongation at break of the samples deteriorated after each pass. The reference samples experienced a drop from 410% of elongation at break at first pass to 27.47% after the third pass. The longer polymer chains in the first pass allow the sample to be stretched further as the polymer chains straighten. The intermolecular forces between chains are also weak compared to the chain bond, so the chain slippage can happen [34], allowing the sample to elongate. The samples with the addition of Irganox 1010 still experience more than 59% drops in elongation at break after the third pass at both dosages. Meanwhile, vitamin E helped retain the elongation at break in both dosages, limiting the elongation at break drop after the third pass to 3.16% and 6.05% for 200 ppm and 400 ppm, respectively. Such results are in agreement with Izod impact data discussed in the previous section, where vitamin E samples exhibited superior performance (higher impact strength and higher elongation) over the Irganox 1010 stabilized samples.
3.6. Differential Scanning Calorimetry
The measurement of the crystallinity and thermal characteristics was done using DSC, on the sample after the first pass, which will be used for blow molding. Samples’ thermal history was erased by heating the specimen twice to eliminate inconsistencies within the crystalline structure caused by variations in solidification after pelletizing. Two tests were done per sample, and the results are shown in Table 3. The melting point across the twelve samples is almost constant without any significant changes, despite using different dosages of antioxidants. Similarly, the crystallinities of all samples also didn’t change significantly. Only the reference sample exhibited higher crystallinities. This may be due to the higher-than-usual chain scissions that are randomly happening, compared to other tested samples. The loss of higher molecular weight chains and the creation of shorter ones. As the chains shorten, it becomes easier for the polymer chains to align regularly and form a crystalline structure [36].
3.7. Color Measurement
From Table 3, it is shown that each pass through the melt mixer slightly increased the yellowness of the reference samples. The yellowness is caused by two reasons [24]. The first is the polymer itself, due to the chiral, optically active supramolecules that were formed on the surface of the polymer, due to UV degradation [37]. The second, ironically, came from the antioxidant as an additive. The samples that are fortified by Irganox 1010 also showed yellowness, with reduced magnitude. This is due to the quinodal compound as side products that are produced when the phenolic antioxidant scavenges the radicals into hydroxyl [24]. On the other hand, samples that are enhanced with vitamin E exhibited even more yellowness. This is due to the less steric hindrance on the phenol in vitamin E [38], which made it more prone to react with remnants of metal ion catalyst from the polymerization process, thus causing more yellowness compared to Irganox 1010. The higher yellowness will decrease the suitability of the HDPE in certain applications that require white or clear color, such as food, beverages, and pharmaceutical packaging [39,40].
To solve this problem, polyethylene glycol (PEG) was added to the formulation. The addition of PEG resulted in the lowering of the yellowness index for the reference and samples with antioxidants. The exact mechanism of how PEG can help prevent yellowness of the samples is not the focus of this study, but presumably, the PEG will react with the quinoidal compound present in the sample as a result of the radical scavenging activities of the antioxidants. It is similar to how PEG is degraded by quinoidal substances in its biodegradation by fungi [41], or in other references [42,43]. The compatibility of PEG with HDPE and the current antioxidants used is also shown in the relatively similar experimental results of formulation with PEG. The exact nature and mechanism of PEG interaction with PEG could be explored in further studies.
4. Conclusions
This study aimed to compare the performance of natural antioxidant (vitamin E) with synthetic antioxidants (Irganox 1010) in protecting high-density polyethylene from degradation to various stresses during its lifetime. As a reference, the HDPE is passed through melt mixing thrice, to mimic the life cycle of the plastics. The 1st pass symbolizes the pellet processing, 2nd pass is for the parison/final processing, and 3rd phase is the mechanical recycling stage. The HDPE underwent degradation due to the chain scission of the polymer, so the molecular weight will decrease, and its distribution will skew more to the left.
The result of this study showed that the addition of an antioxidant as an additive will reduce the impact of thermal stresses on the polymer’s properties. Further experiments showed that vitamin E, as a natural antioxidant, is superior to Irganox 1010 as a synthetic antioxidant, due to the less hindered structure of the molecules. Vitamin E is better in helping HDPE to maintain its molecular weight, melt flow index, and mechanical properties such as tensile strength and elongation at break. Vitamin E can also be used as an additive for synthetic antioxidants, as adding vitamin E into formulations with Irganox 1010 maintained or improved the properties of the polymer. However, both antioxidants, especially vitamin E, caused yellowing of the final product. So, its usage is limited to HDPE products that don’t require certain colors. To deal with this problem, 400 ppm of polyethylene glycol can be added to the formulations to reduce the yellowing of the HDPE, since it doesn’t negatively impact the desired properties of HDPE.
Author Contributions
Conceptualization, methodology, A.F.A. and O.Y.A.; software, H.I.A.; validation, H.I.A., M.M.A. and O.Y.A.; formal analysis, H.I.A. and O.Y.A.; investigation, A.F.A.; resources, M.M.A.; data curation, H.I.A.; writing—original draft preparation, A.F.A.; writing—review and editing, H.I.A. and O.Y.A; visualization, A.F.A. and H.I.A.; supervision, M.M.A. and O.Y.A.; project administration, O.Y.A.; funding acquisition, M.M.A. All authors have read and agreed to the published version of the manuscript.
Funding
The authors extend their appreciation to Ongoing Research Funding program, (ORF-2025-435), King Saud University, Riyadh, Saudi Arabia.
Data Availability Statement
Data from this research are available on request.
Conflicts of Interest
The authors declare no conflicts of interest.
Abbreviations
The following abbreviations are used in this manuscript:
| DSC | Differential Scanning Calorimetry |
| GPC | Gel permeation chromatography |
| HDPE | High-density polyethylene |
| MFI | Melt flow index |
| MW | Molecular weight |
| MWD | Molecular weight distribution |
| PEG | polyethylene glycol |
References
- Vidakis N, Petousis M, Maniadi A. Sustainable additive manufacturing: mechanical response of high-density polyethylene over multiple recycling processes. Recycling. 2021, 6, 4. [Google Scholar] [CrossRef]
- Abeysinghe S, Gunasekara C, Bandara C, Nguyen K, Dissanayake R, Mendis P. Engineering performance of concrete incorporated with recycled high-density polyethylene (HDPE)—a systematic review. Polymers. 2021, 13, 1885. [Google Scholar] [CrossRef]
- Huang HH, Chen LW, Lu WH, Lin WC, Chen YC. Design and simulation analysis of a lightweight HDPE milk bottle. Polymers and Polymer Composites. 2018, 26, 91–98. [Google Scholar] [CrossRef]
- Jiwa MZ, Kim YT, Mustaffa Z, Kim S, Kim DK. A simplified approach for predicting bend radius in HDPE pipelines during offshore installation. JMSE. 2023, 11, 2032. [Google Scholar] [CrossRef]
- Qiao Z, Wu W, Wang Z, Zhang L, Zhou Y. Space charge behavior of thermally aged polyethylene insulation of track cables. Polymers. 2022, 14, 2162. [Google Scholar] [CrossRef]
- Nagarajan YR, Farukh F, Silberschmidt VV, et al. Strength assessment of pet composite prosthetic sockets. Materials. 2023, 16, 4606. [Google Scholar] [CrossRef]
- Marturano V, Cerruti P, Ambrogi V. Polymer additives. Physical Sciences Reviews. [CrossRef]
- Xanthos, M. Polymer processing. In: Applied Polymer Science: 21st Century. Elsevier; 2000, 355-371. [CrossRef]
- Kutz, M (Ed.) Applied Plastics Engineering Handbook: Processing and Materials. 1st ed. Elsevier/William Andrew; 2011.
- Garton A, Carlsson DJ, Wiles DM. Polypropylene oxidation: the apparent rate constant for peroxy radical termination and the photoinitiation efficiency. Macromolecules. 1979, 12, 1071–1073. [Google Scholar] [CrossRef]
- Decker C, Mayo FR. Aging and degradation of polyolefins. II. γ-initiated oxidations of atactic polypropylene. J Polym Sci Polym Chem Ed. 1973, 11, 2847–2877. [Google Scholar] [CrossRef]
- Gryn’ova G, Hodgson JL, Coote ML. Revising the mechanism of polymer autooxidation. Org Biomol Chem. 2010, 9, 480–490. [Google Scholar] [CrossRef]
- Bolland JL, Gee G. Kinetic studies in the chemistry of rubber and related materials. II. The kinetics of oxidation of unconjugated olefins. Trans Faraday Soc. 1946, 42, 236. [Google Scholar] [CrossRef]
- Shahidi F, Janitha PK, Wanasundara PD. Phenolic antioxidants. Critical Reviews in Food Science and Nutrition. 1992, 32, 67–103. [Google Scholar] [CrossRef] [PubMed]
- Tátraaljai D, Földes E, Pukánszky B. Efficient melt stabilization of polyethylene with quercetin, a flavonoid type natural antioxidant. Polymer Degradation and Stability. 2014, 102, 41–48. [Google Scholar] [CrossRef]
- Rojas-Lema S, Torres-Giner S, Quiles-Carrillo L, Gomez-Caturla J, Garcia-Garcia D, Balart R. On the use of phenolic compounds present in citrus fruits and grapes as natural antioxidants for thermo-compressed bio-based high-density polyethylene films. Antioxidants. 2020, 10, 14. [Google Scholar] [CrossRef]
- Dopico-García MS, Castro-López MM, López-Vilariño JM, et al. Natural extracts as potential source of antioxidants to stabilize polyolefins. J of Applied Polymer Sci. 2011, 119, 3553–3559. [Google Scholar] [CrossRef]
- Carrero J, Oliva V, Navascués B, Borrull F, Galià M. Determination of antioxidants in polyolefins by pressurized liquid extraction prior to high performance liquid chromatography. Polymer Testing. 2015, 46, 21–25. [Google Scholar] [CrossRef]
- Ghaffari M, Ahmadian V. Investigation of antioxidant and electron beam radiation effects on the thermal oxidation stability of low-density polyethylene. Radiation Physics and Chemistry. 2007, 76, 1666–1670. [Google Scholar] [CrossRef]
- Wang W, Xiong P, Zhang H, Zhu Q, Liao C, Jiang G. Analysis, occurrence, toxicity and environmental health risks of synthetic phenolic antioxidants: A review. Environmental Research. 2021, 201, 111531. [Google Scholar] [CrossRef]
- Maraveas C, Bayer IS, Bartzanas T. Recent advances in antioxidant polymers: from sustainable and natural monomers to synthesis and applications. Polymers. 2021, 13, 2465. [Google Scholar] [CrossRef]
- Valero L, Gainche M, Esparcieux C, Delor-Jestin F, Askanian H. Vegetal polyphenol extracts as antioxidants for the stabilization of PLA: toward fully biobased polymer formulation. ACS Omega, 8 February 2024. [CrossRef]
- AI-Malaika, S. Vitamin E: an effective biological antioxidant for polymer stabilisation. Polymers and Polymer Composites. 2000, 8, 537–542. [Google Scholar] [CrossRef]
- Allen NS, Edge M, Hussain S. Perspectives on yellowing in the degradation of polymer materials: inter-relationship of structure, mechanisms and modes of stabilisation. Polymer Degradation and Stability. 2022, 201, 109977. [Google Scholar] [CrossRef]
- Li C, Sun P, Guo S, Zhang Z, Wang J. Relationship between bridged groups and antioxidant activity for aliphatic diamine bridged hindered phenol in polyolefins. J of Applied Polymer Sci. 2017, 134, 45095. [Google Scholar] [CrossRef]
- Moss S, Zweifel H. Degradation and stabilization of high density polyethylene during multiple extrusions. Polymer Degradation and Stability. 1989, 25, 217–245. [Google Scholar] [CrossRef]
- Gadioli R, Waldman WR, De Paoli MA. Lignin as a green primary antioxidant for polypropylene. J of Applied Polymer Sci. 2016, 133, app. [Google Scholar] [CrossRef]
- Clarke MW, Burnett JR, Croft KD. Vitamin E in human health and disease. Critical Reviews in Clinical Laboratory Sciences. 2008, 45, 417–450. [Google Scholar] [CrossRef]
- Traber, MG. Vitamin E inadequacy in humans: causes and consequences. Advances in Nutrition. 2014, 5, 503–514. [Google Scholar] [CrossRef]
- Birringer M, Siems K, Maxones A, Frank J, Lorkowski S. Natural 6-hydroxy-chromanols and -chromenols: structural diversity, biosynthetic pathways and health implications. RSC Advances. 2018, 8, 4803–4841. [Google Scholar] [CrossRef]
- Wang Y, Ren H, Yan Y, He S, Wu S, Zhao Q. Hindered phenolic antioxidants as heat-oxygen stabilizers for HDPE. Polymers and Polymer Composites. 2021, 29, 1403–1411. [Google Scholar] [CrossRef]
- Bremner T, Cook DG, Rudin A. Further comments on the relations between melt flow index values and molecular weight distributions of commercial plastics. J of Applied Polymer Sci. 1991, 43, 1773–1773. [Google Scholar] [CrossRef]
- Béreaux Y, Charmeau JY, Balcaen J. Optical measurement and modelling of parison sag and swell in blow moulding. Int J Mater Form. 2012, 5, 199–211. [Google Scholar] [CrossRef]
- Nunes RW, Martin JR, Johnson JF. Influence of molecular weight and molecular weight distribution on mechanical properties of polymers. Polymer Engineering & Sci. 1982, 22, 205–228. [Google Scholar] [CrossRef]
- Perkins, WG. Polymer toughness and impact resistance. Polymer Engineering & Sci. 1999, 39, 2445–2460. [Google Scholar] [CrossRef]
- Zahavich ATP, Latto B, Takacs E, Vlachopoulos J. The effect of multiple extrusion passes during recycling of high density polyethylene. Adv Polym Technol. 1997, 16, 11–24. [Google Scholar] [CrossRef]
- Elmer-Dixon MM, Fawcett LP, Hinderliter BR, Maurer-Jones MA. Could superficial chiral nanostructures be the reason polyethylene yellows as it ages? ACS Appl Polym Mater. 2022, 4, 6458–6465. [Google Scholar] [CrossRef]
- Al-Malaika S, Goodwin C, Issenhuth S, Burdick D. The antioxidant role of α-tocopherol in polymers II. Melt stabilising effect in polypropylene. Polymer Degradation and Stability. 1999, 64, 145–156. [Google Scholar] [CrossRef]
- Potts HL, Amin KN, Duncan SE. Retail lighting and packaging influence consumer acceptance of fluid milk. Journal of Dairy Science. 2017, 100, 146–156. [Google Scholar] [CrossRef]
- Guzman-Puyol S, Benítez JJ, Heredia-Guerrero JA. Transparency of polymeric food packaging materials. Food Research International. 2022, 161, 111792. [Google Scholar] [CrossRef]
- Kawai, F. Biodegradation of polyethers(Polyethylene glycol, polypropylene glycol, polytetramethylene glycol, and others). In: Steinbüchel A, ed. Biopolymers Online, 2001. [Google Scholar] [CrossRef]
- Scherz LF, Abdel-Rahman EA, Ali SS, Schlüter AD, Abdel-Rahman MA. Design, synthesis and cytotoxic activity of water-soluble quinones with dibromo-p-benzoquinone cores and amino oligo(Ethylene glycol) side chains against MCF-7 breast cancer cells. Med Chem Commun. 2017, 8, 662–672. [Google Scholar] [CrossRef]
- Rauner FJ, Arcesi JA, Guild JR. Light-sensitive quinone diazide polymers and polymer compositions. Available online: https://patents.google.com/patent/US3647443A/en (accessed on 16 January 2025).
Figure 1.
Proposed autoxidation mechanism for polymers (R = polymer chain, H = most labile hydrogen) [13].
Figure 1.
Proposed autoxidation mechanism for polymers (R = polymer chain, H = most labile hydrogen) [13].
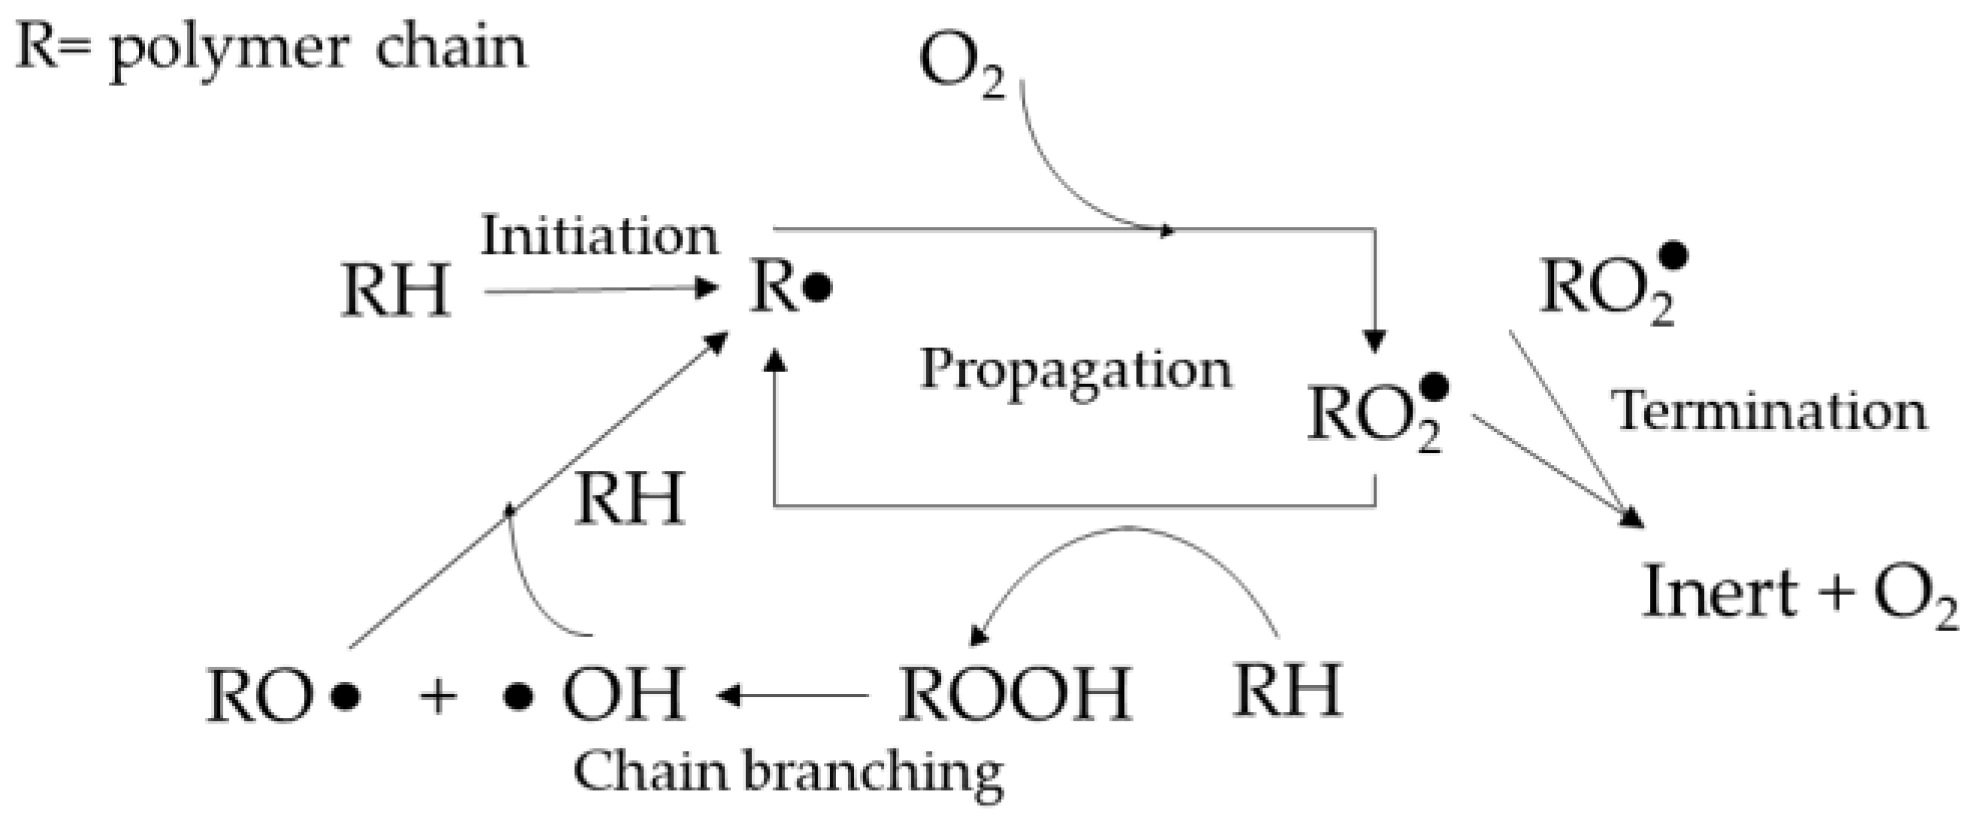
Figure 4.
MWD of the reference sample compared with samples with antioxidants.
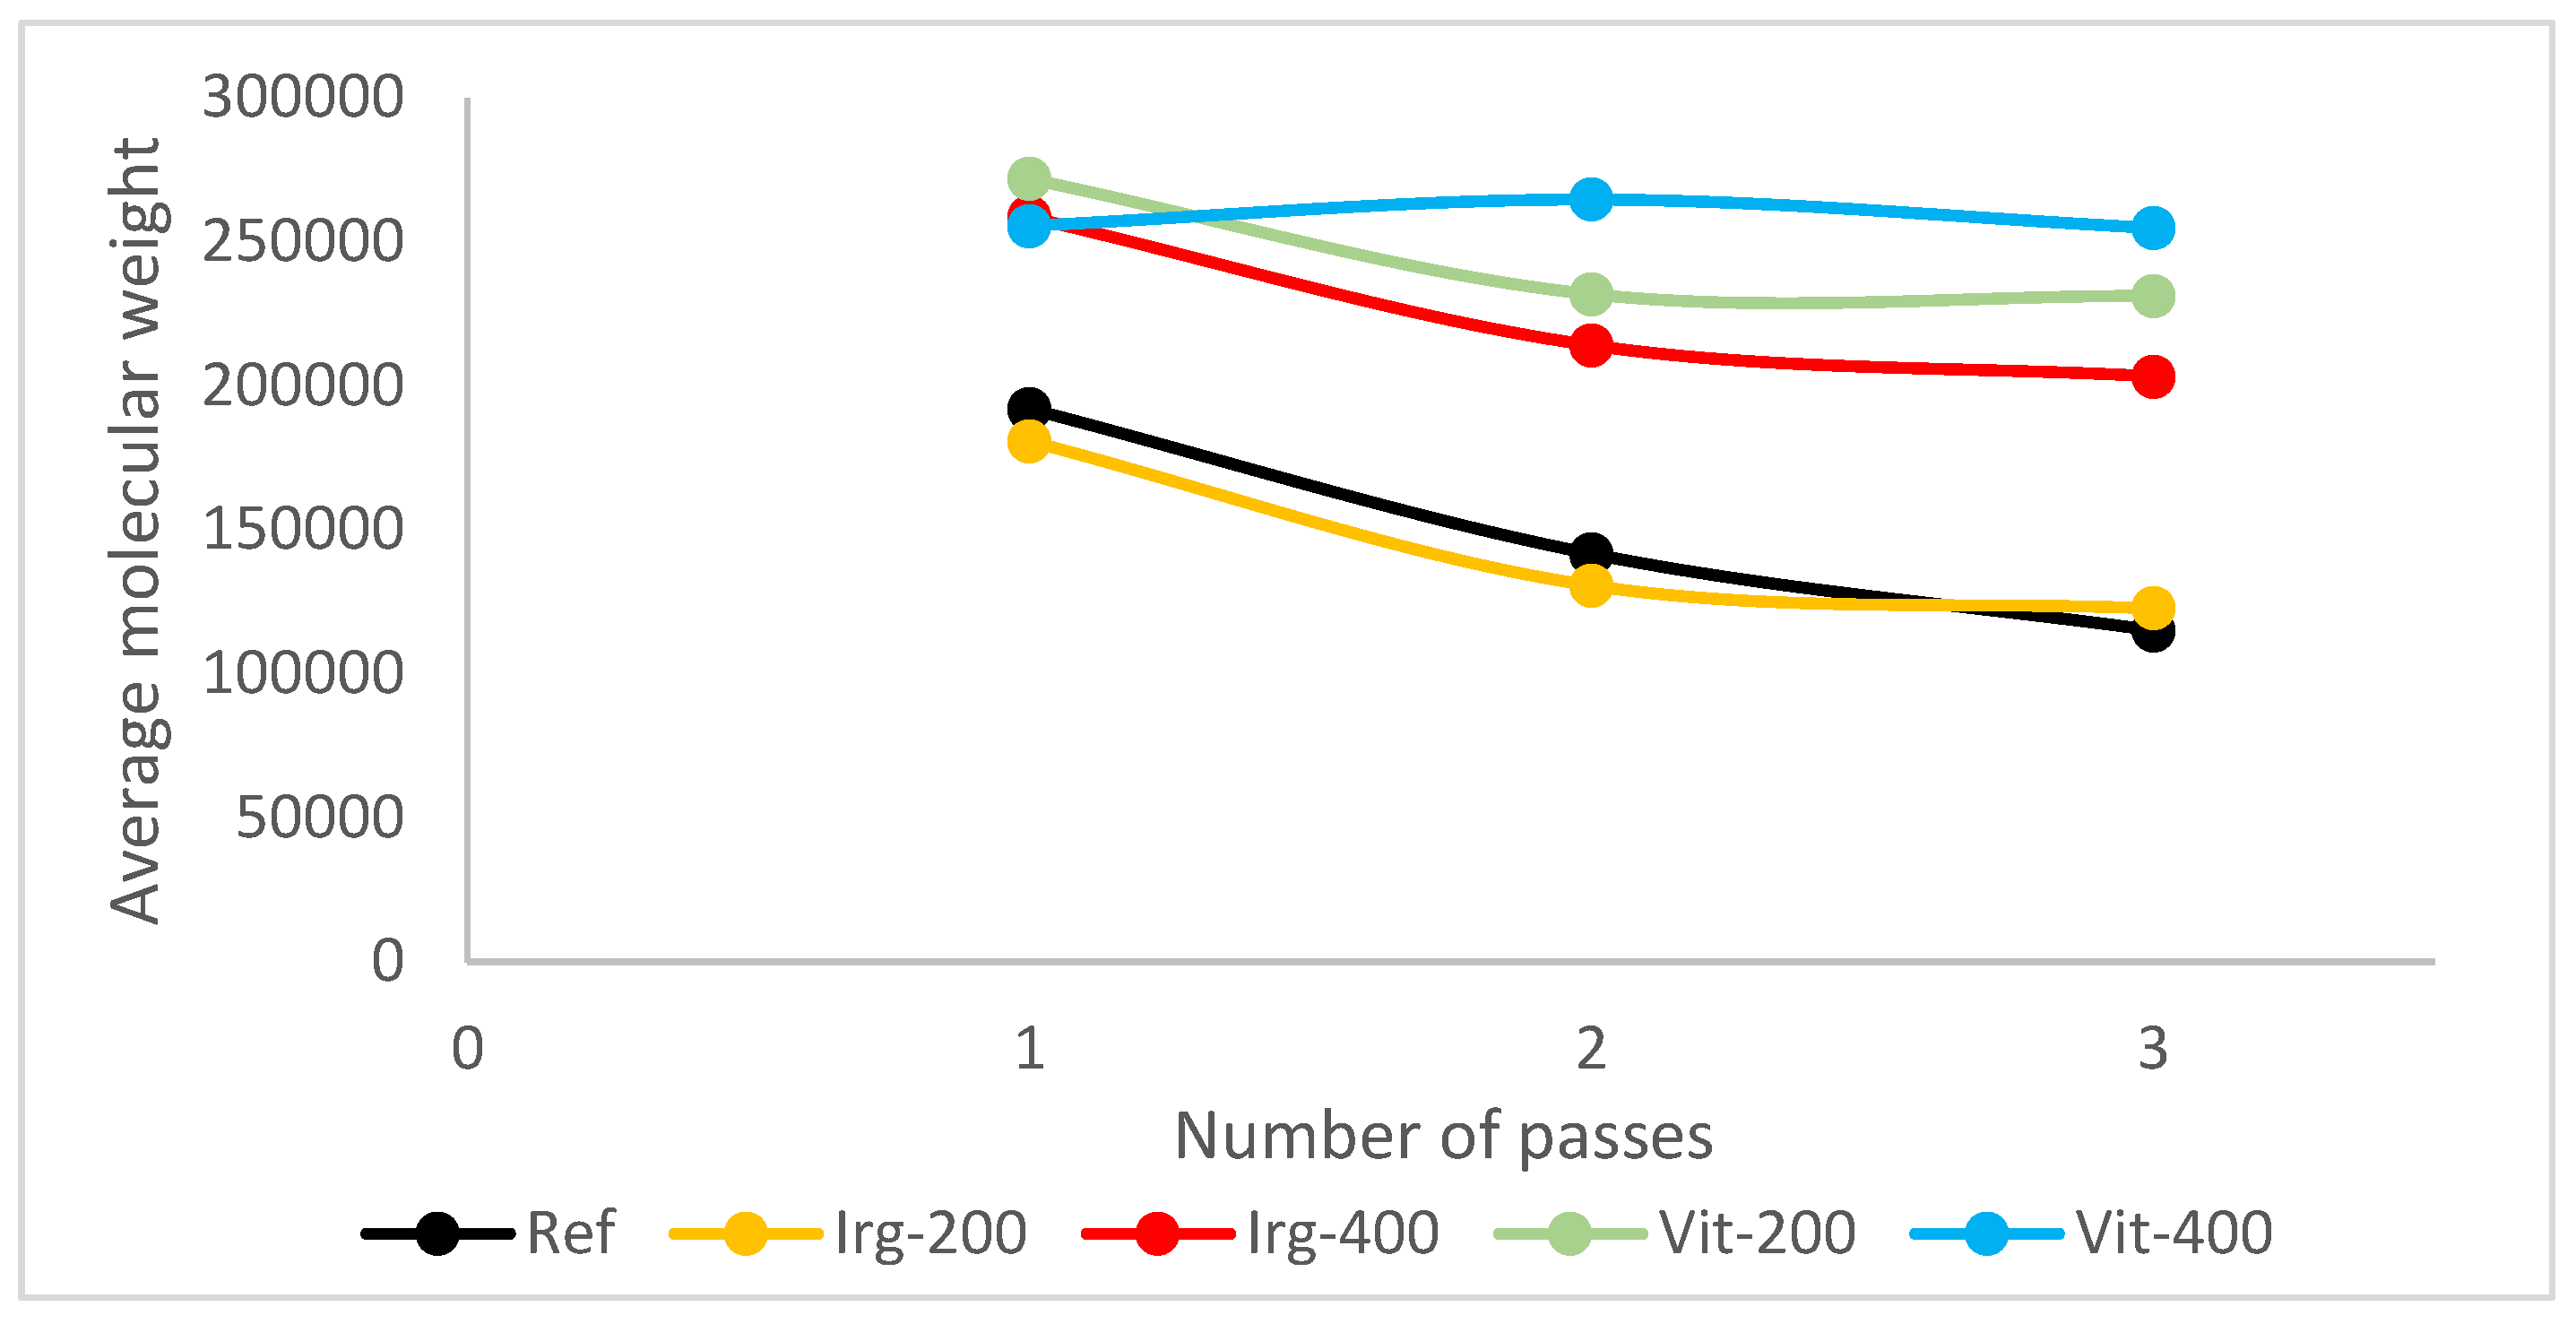
Figure 5.
(a) Radical scavenging mechanism of vitamin E with quinone intermediate; (b) Oxygen radical stabilization mechanism of vitamin E [7].
Figure 5.
(a) Radical scavenging mechanism of vitamin E with quinone intermediate; (b) Oxygen radical stabilization mechanism of vitamin E [7].
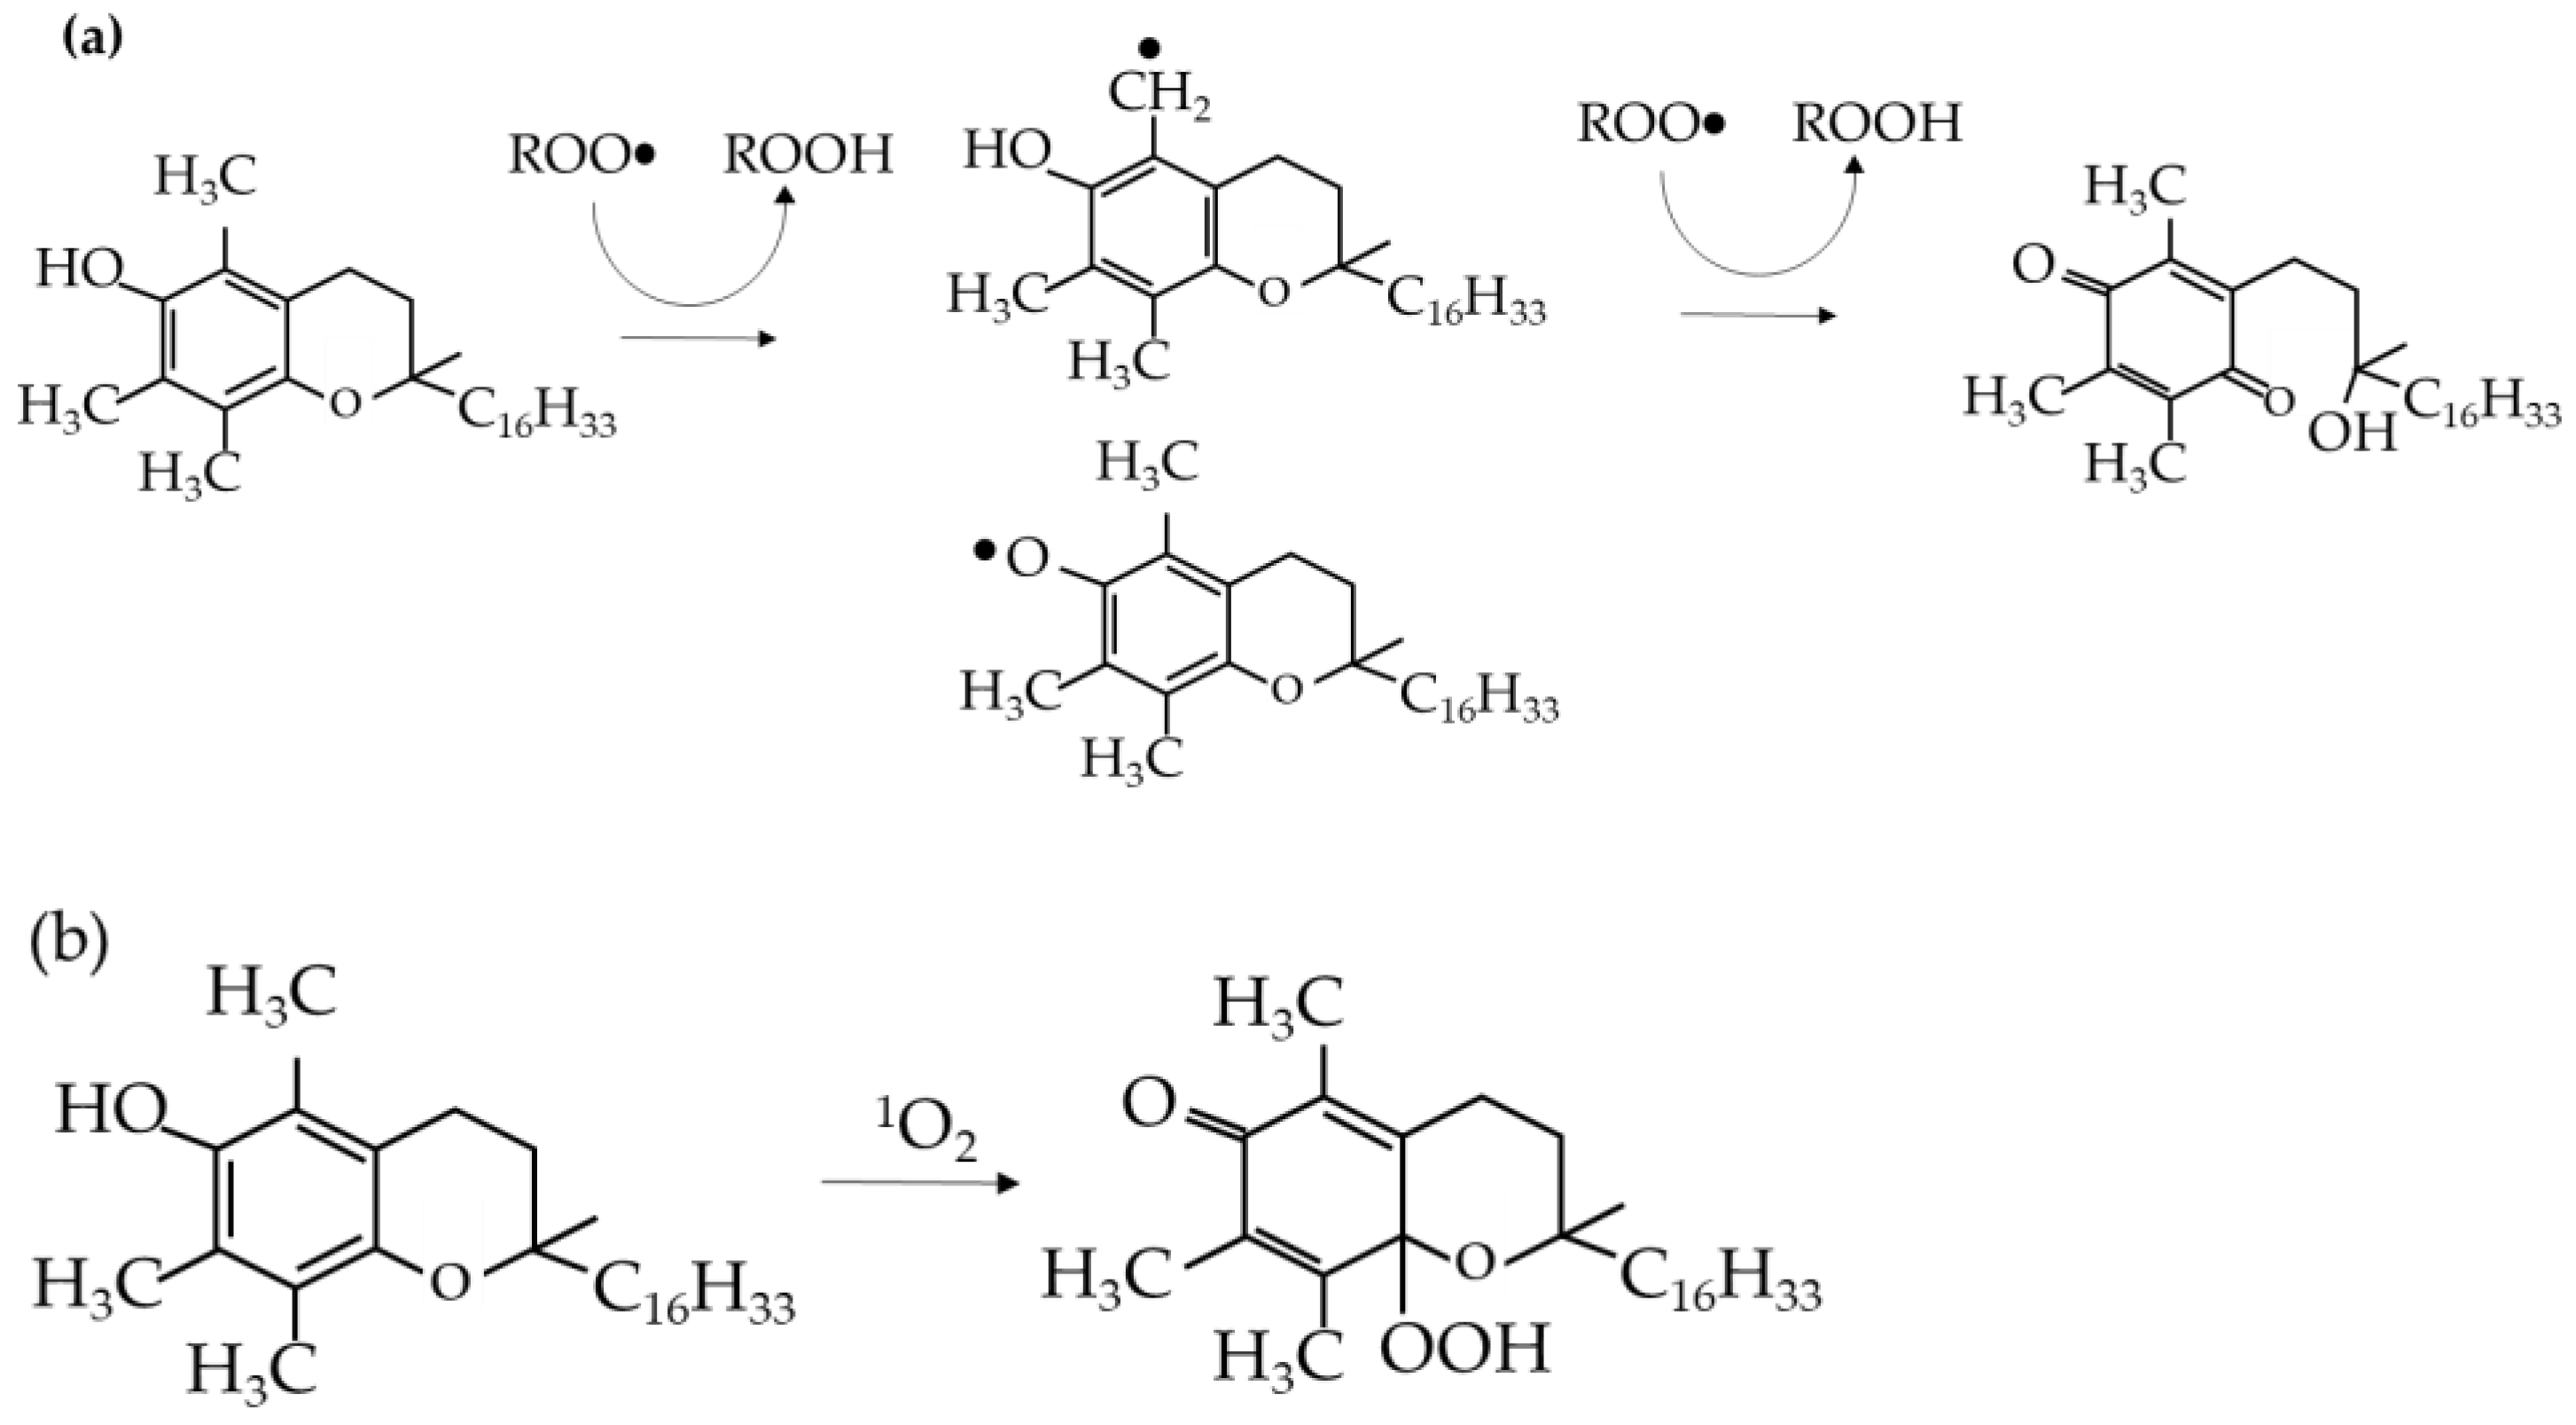
Figure 6.
Average molecular weight of each pass for several formulations of the sample.
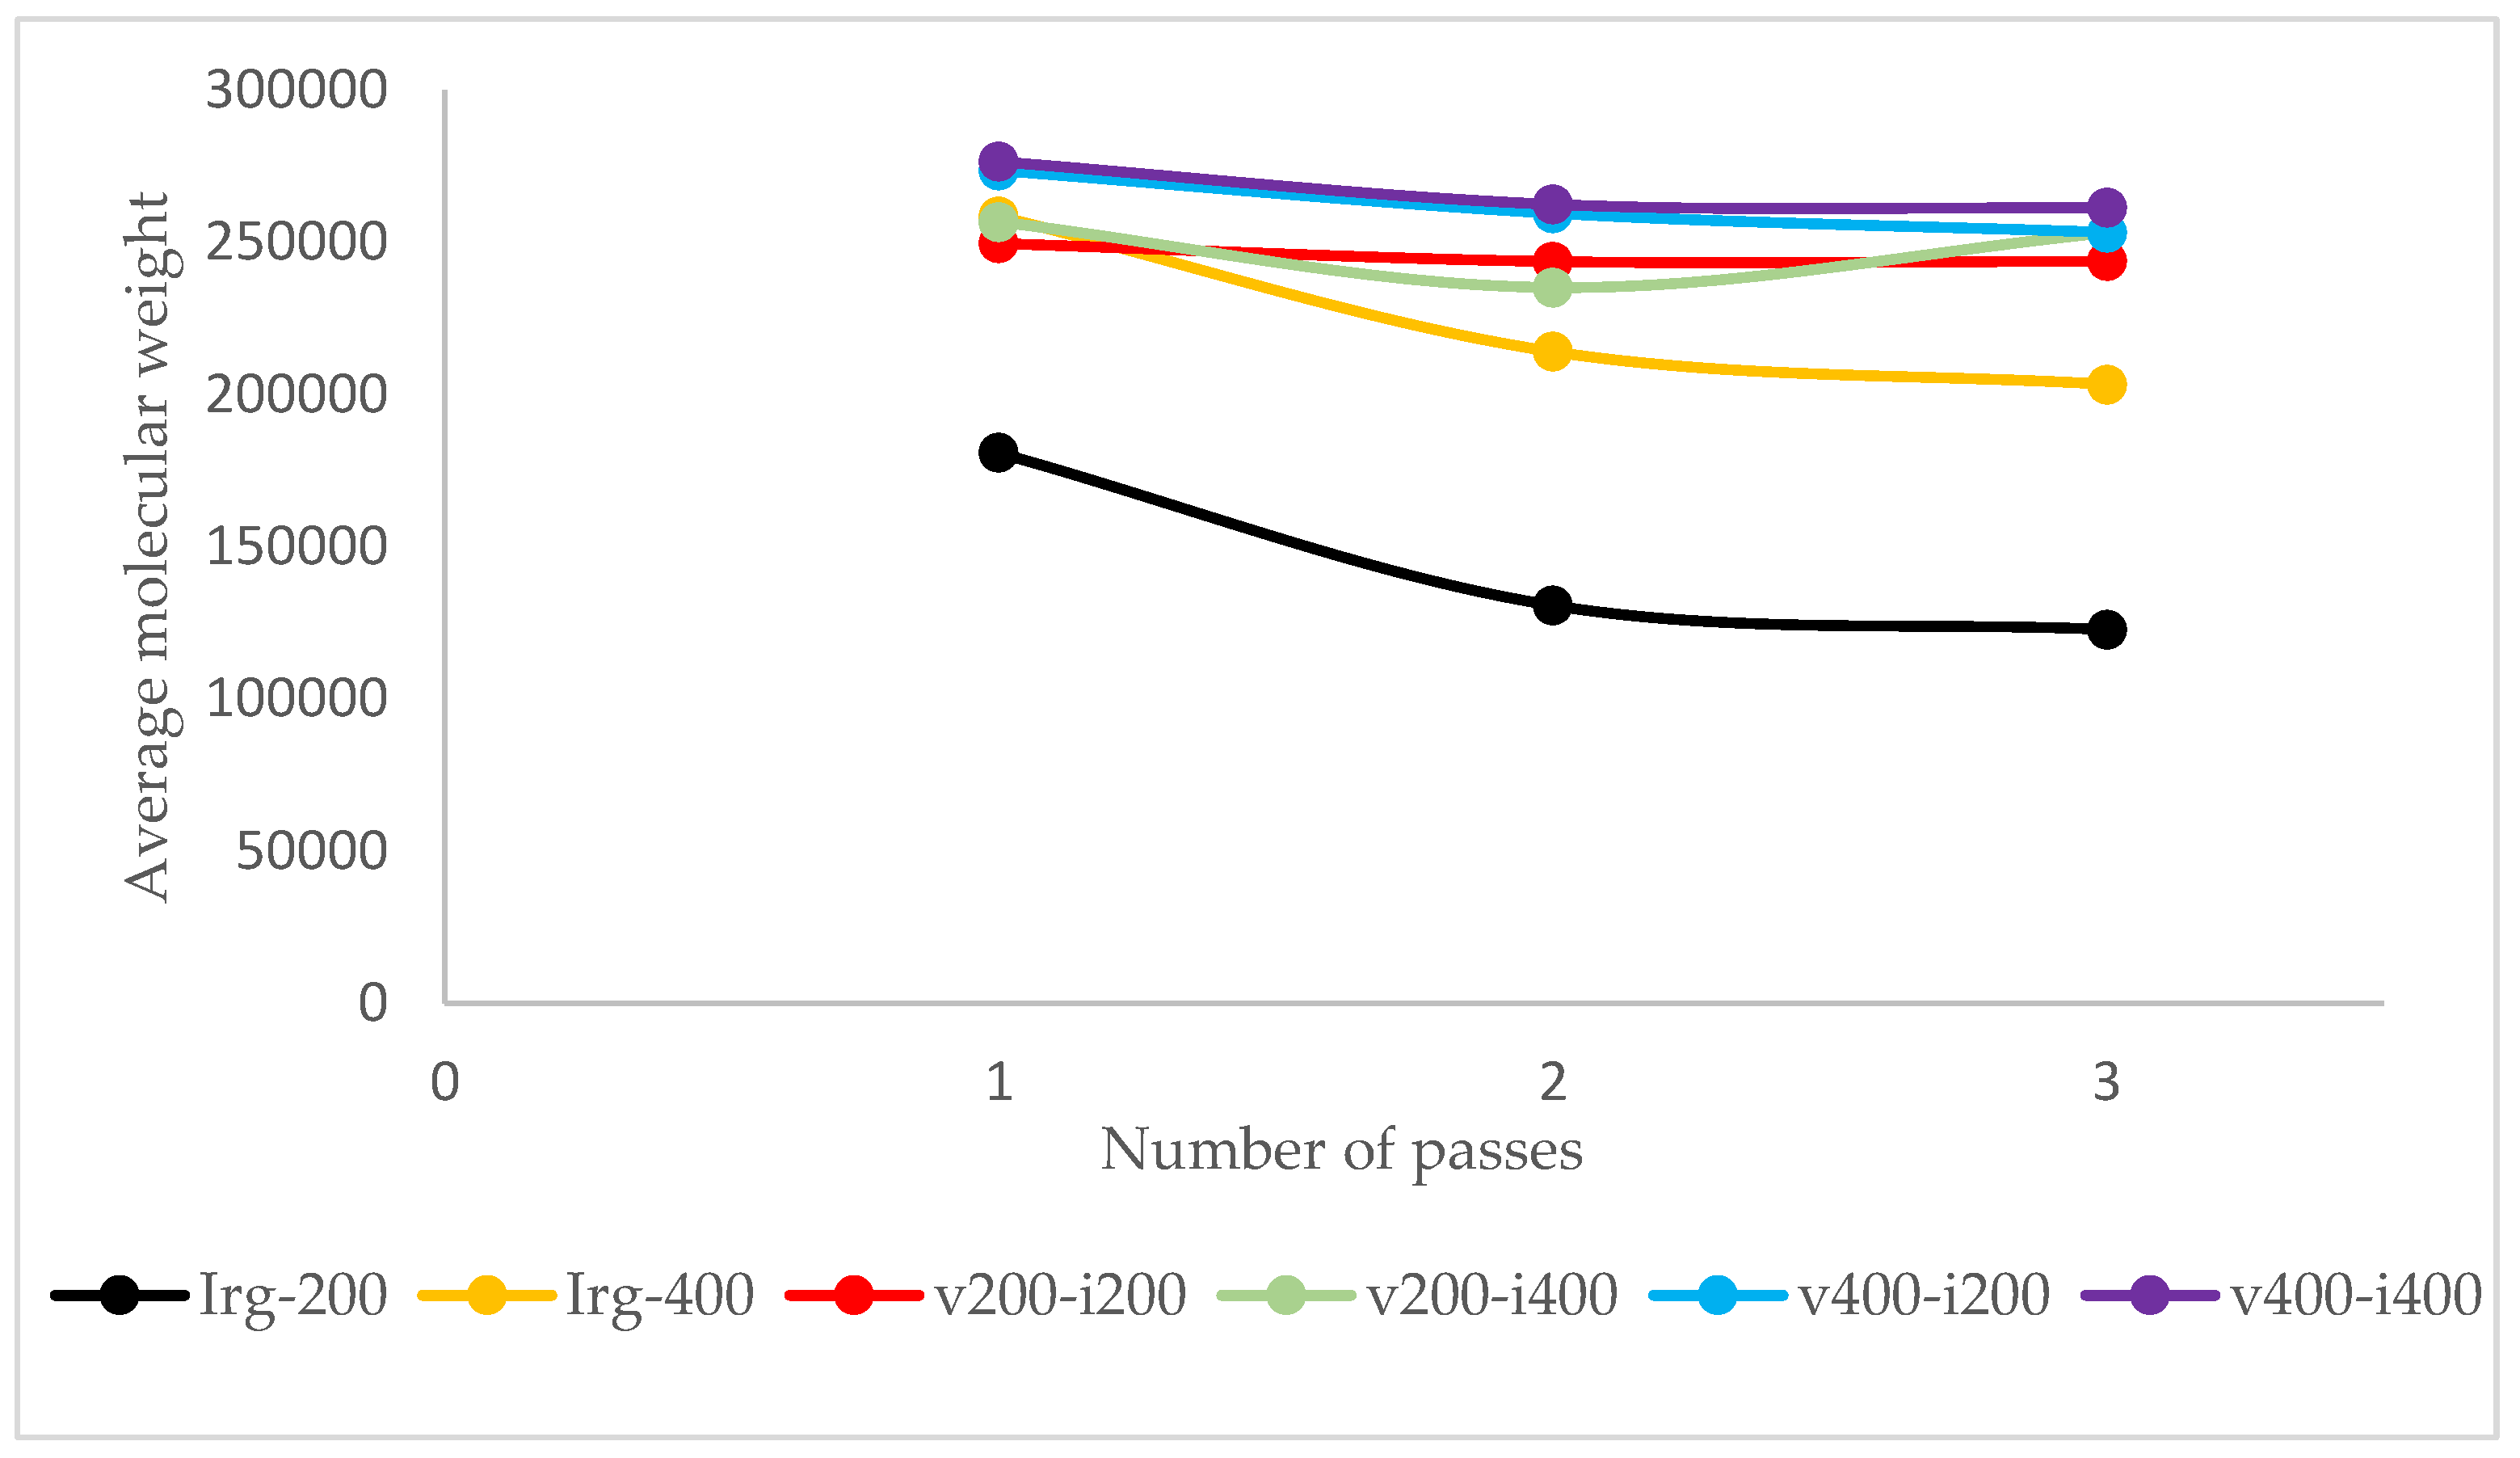
Figure 7.
Melt Flow Index as a function of molecular weight, according to Bremner et al [32]
Figure 7.
Melt Flow Index as a function of molecular weight, according to Bremner et al [32]
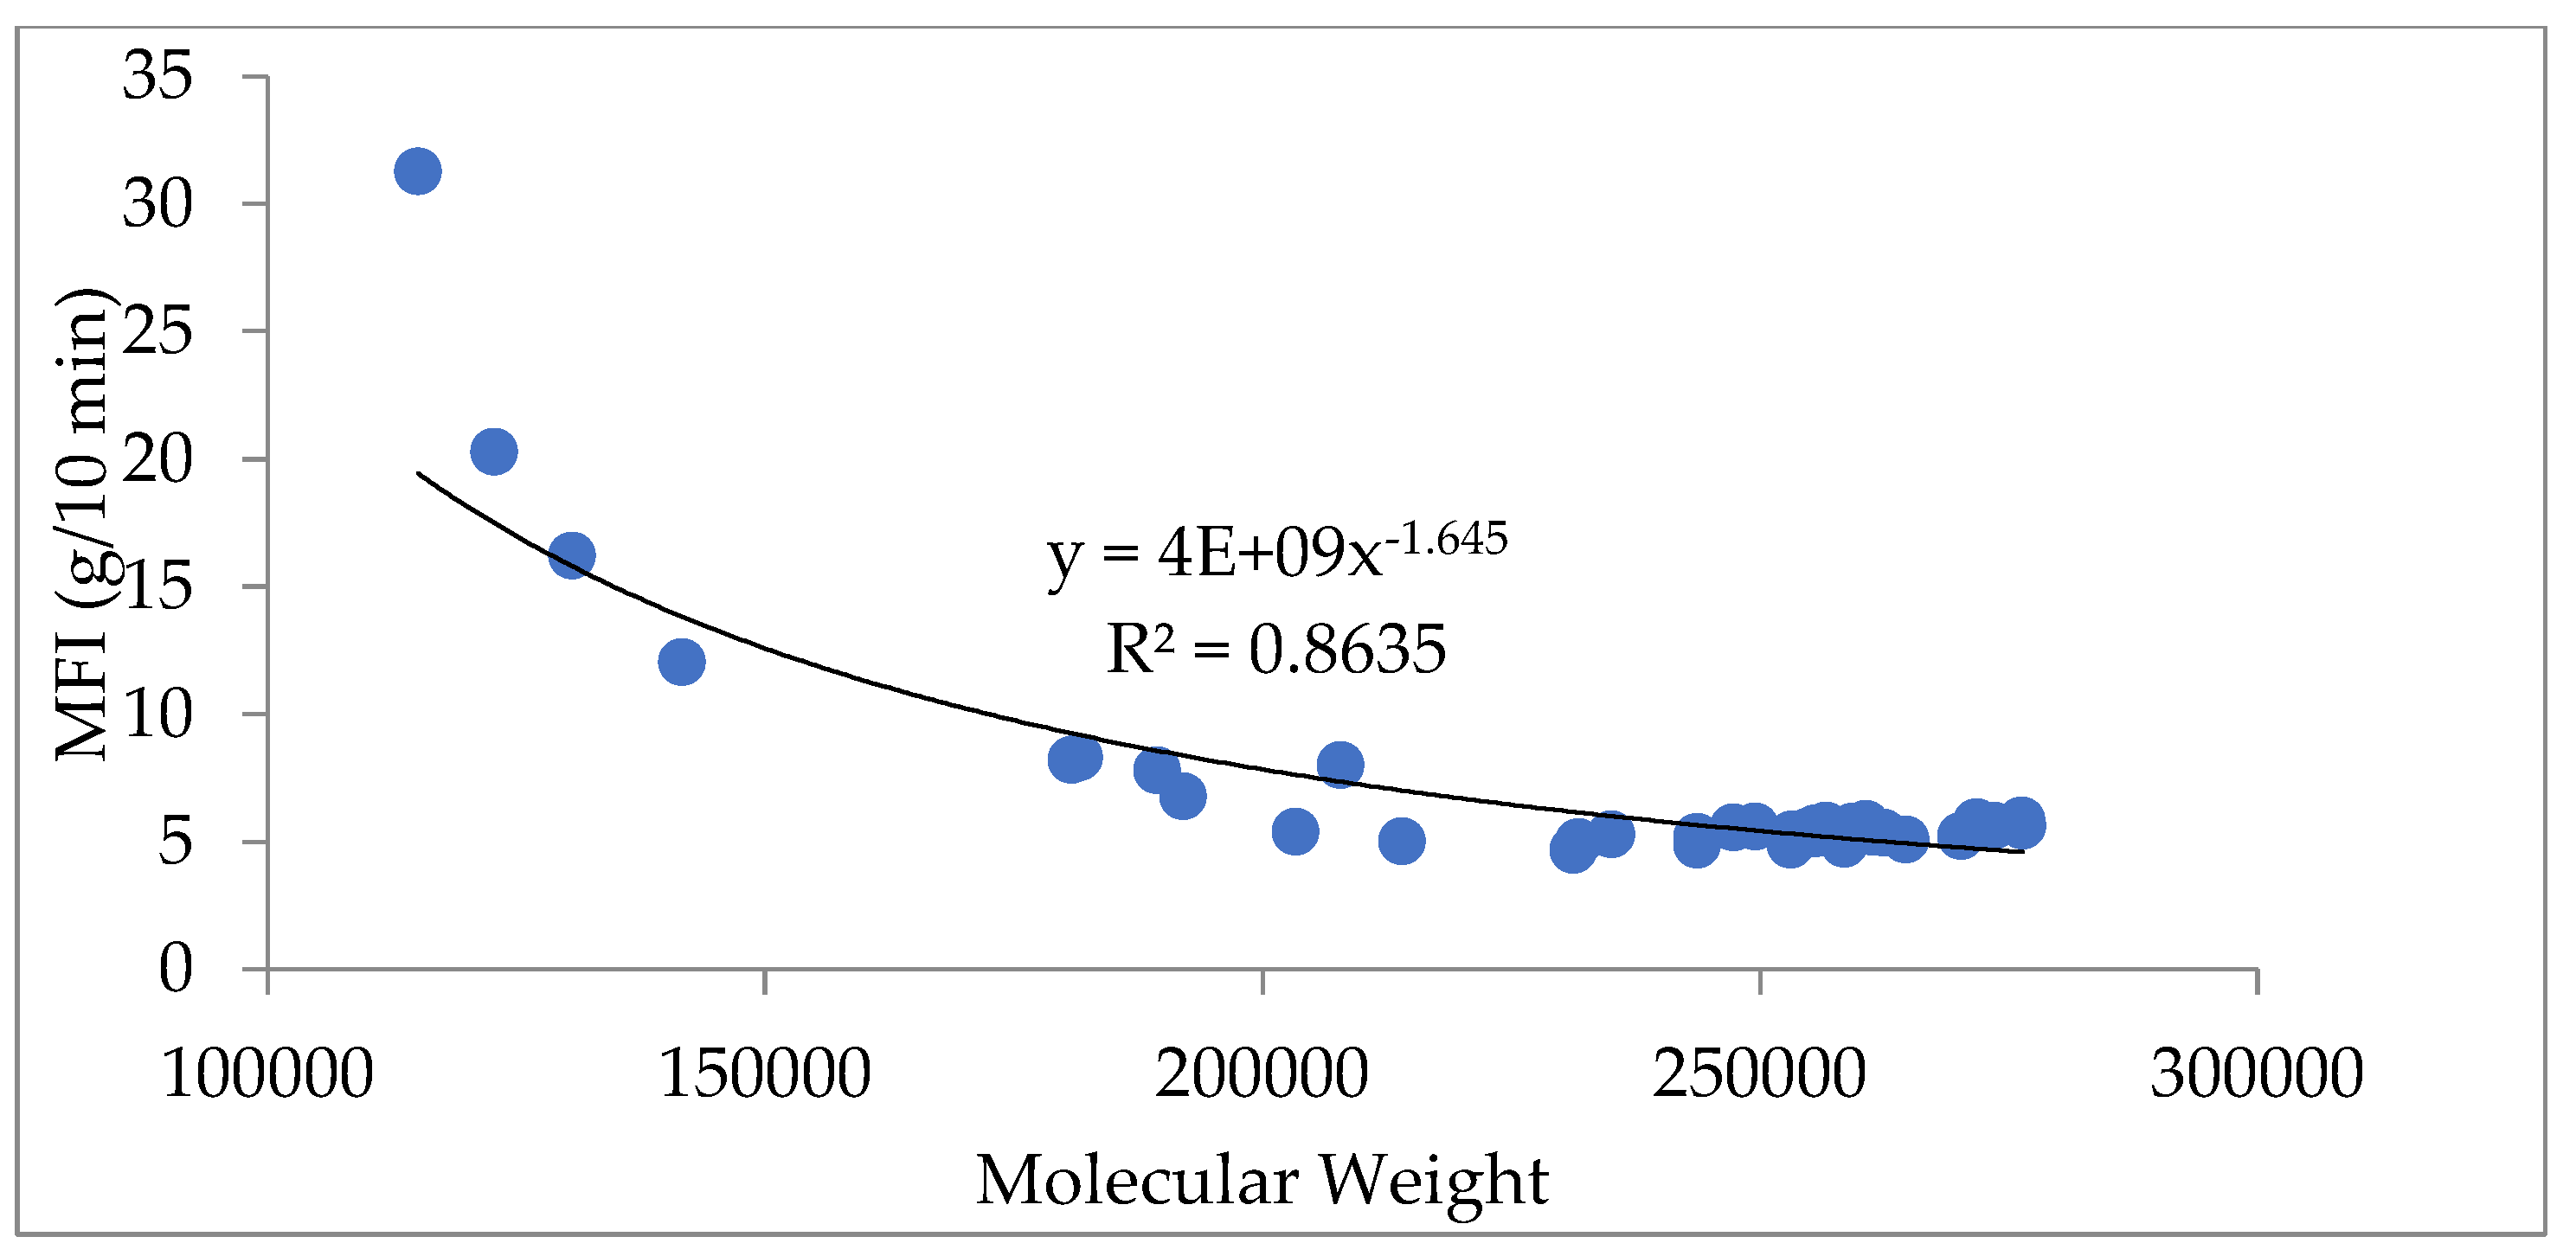
Figure 8.
Shear thinning behavior of the 1st pass of reference samples and samples with 400 ppm antioxidants
Figure 8.
Shear thinning behavior of the 1st pass of reference samples and samples with 400 ppm antioxidants
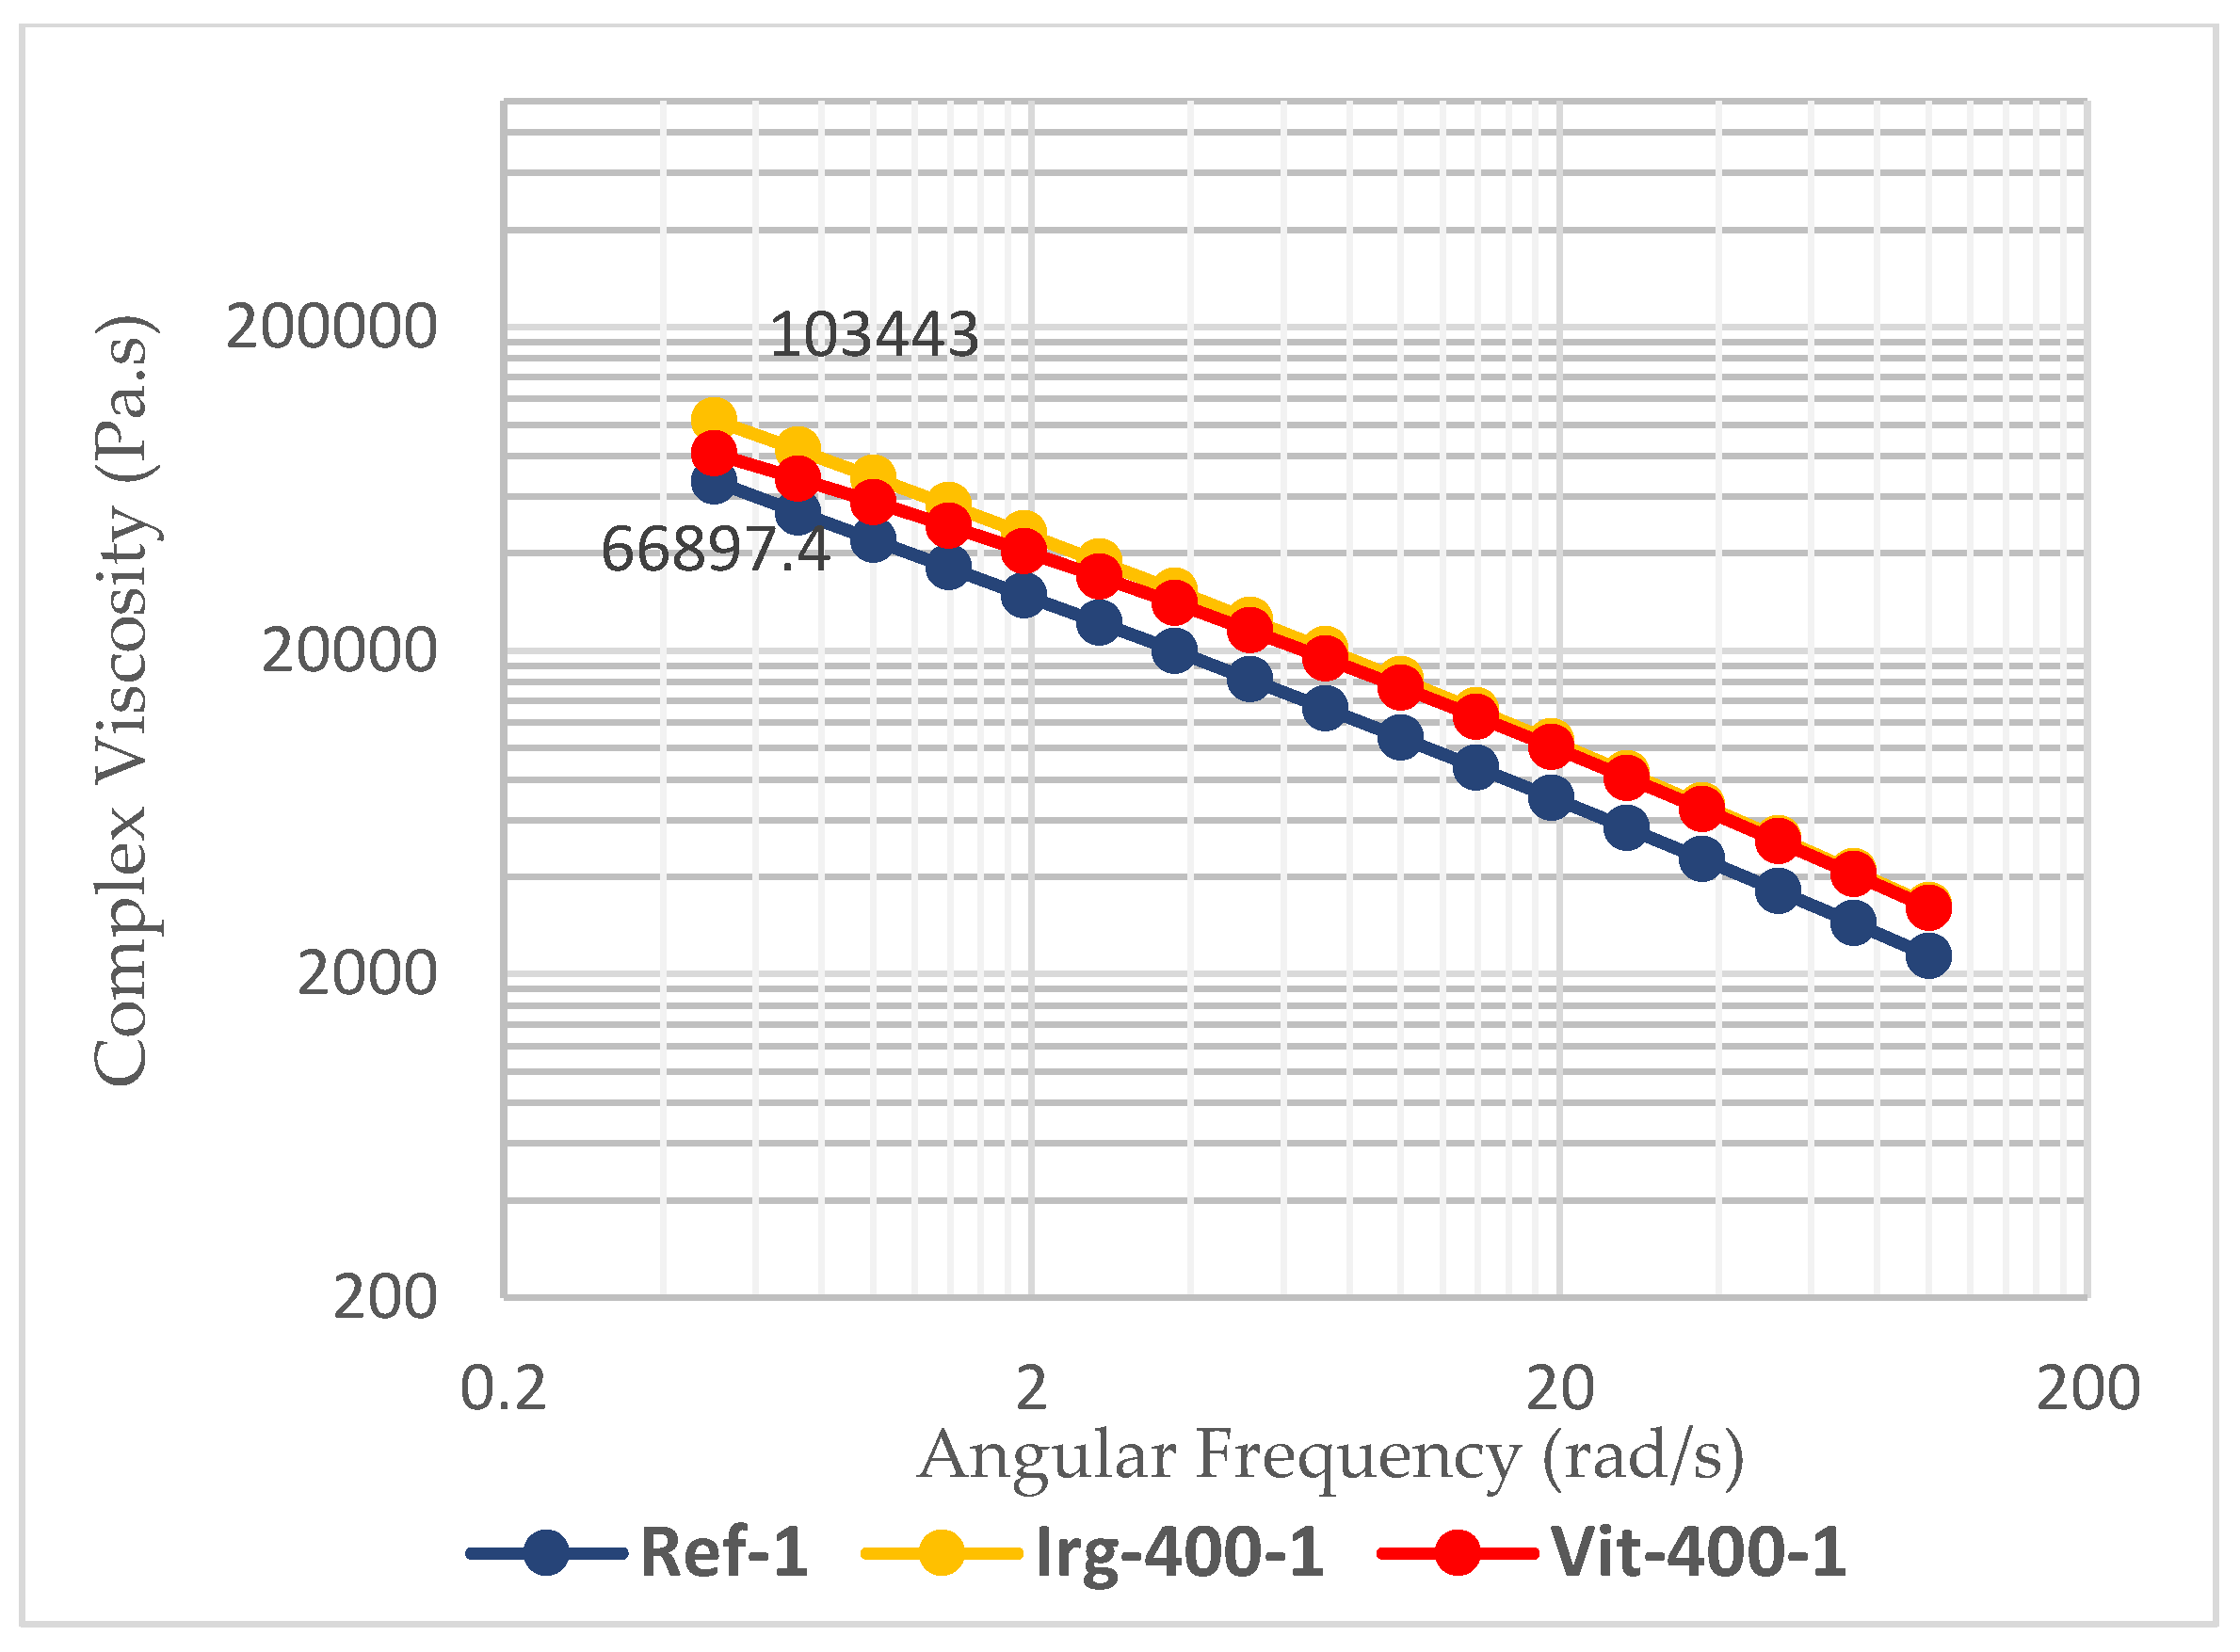
Figure 9.
Melt Strength of reference sample, samples with 400 ppm of Irganox 1010, 400 ppm of vitamin E, and 400 ppm of both antioxidants
Figure 9.
Melt Strength of reference sample, samples with 400 ppm of Irganox 1010, 400 ppm of vitamin E, and 400 ppm of both antioxidants
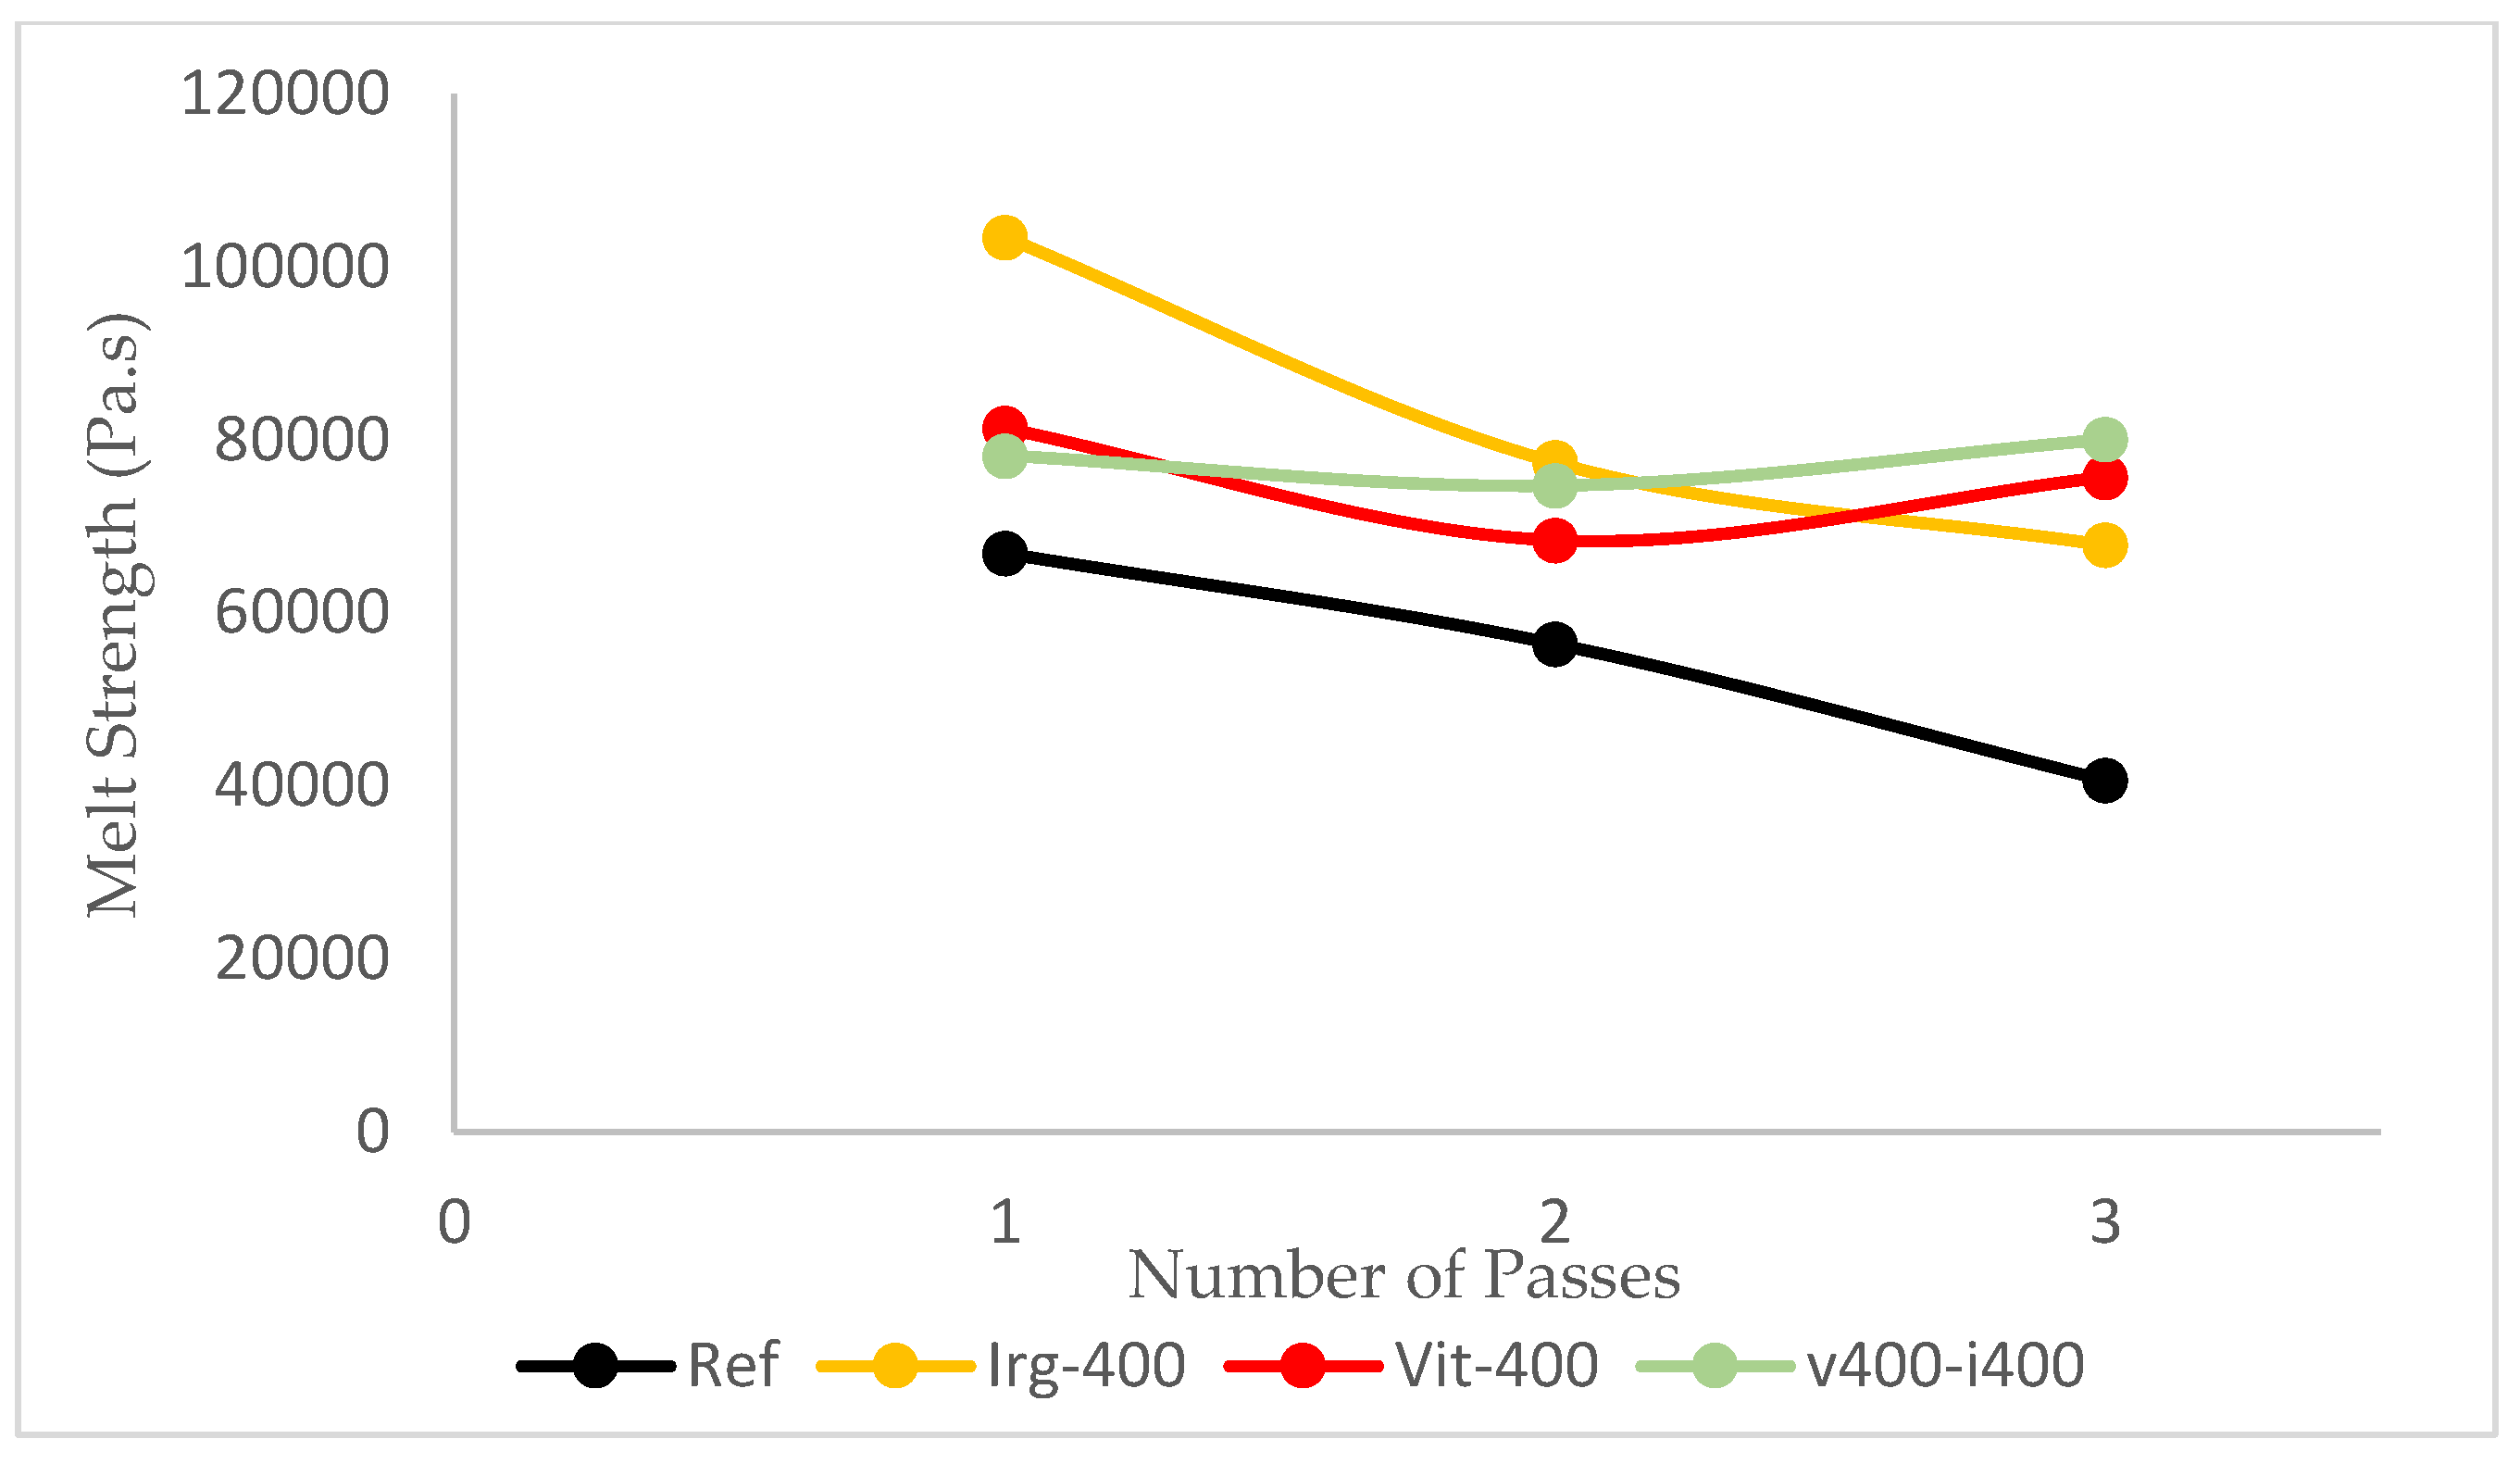
Figure 10.
The surface plot of the relationship between impact strength, MFI, and MW.
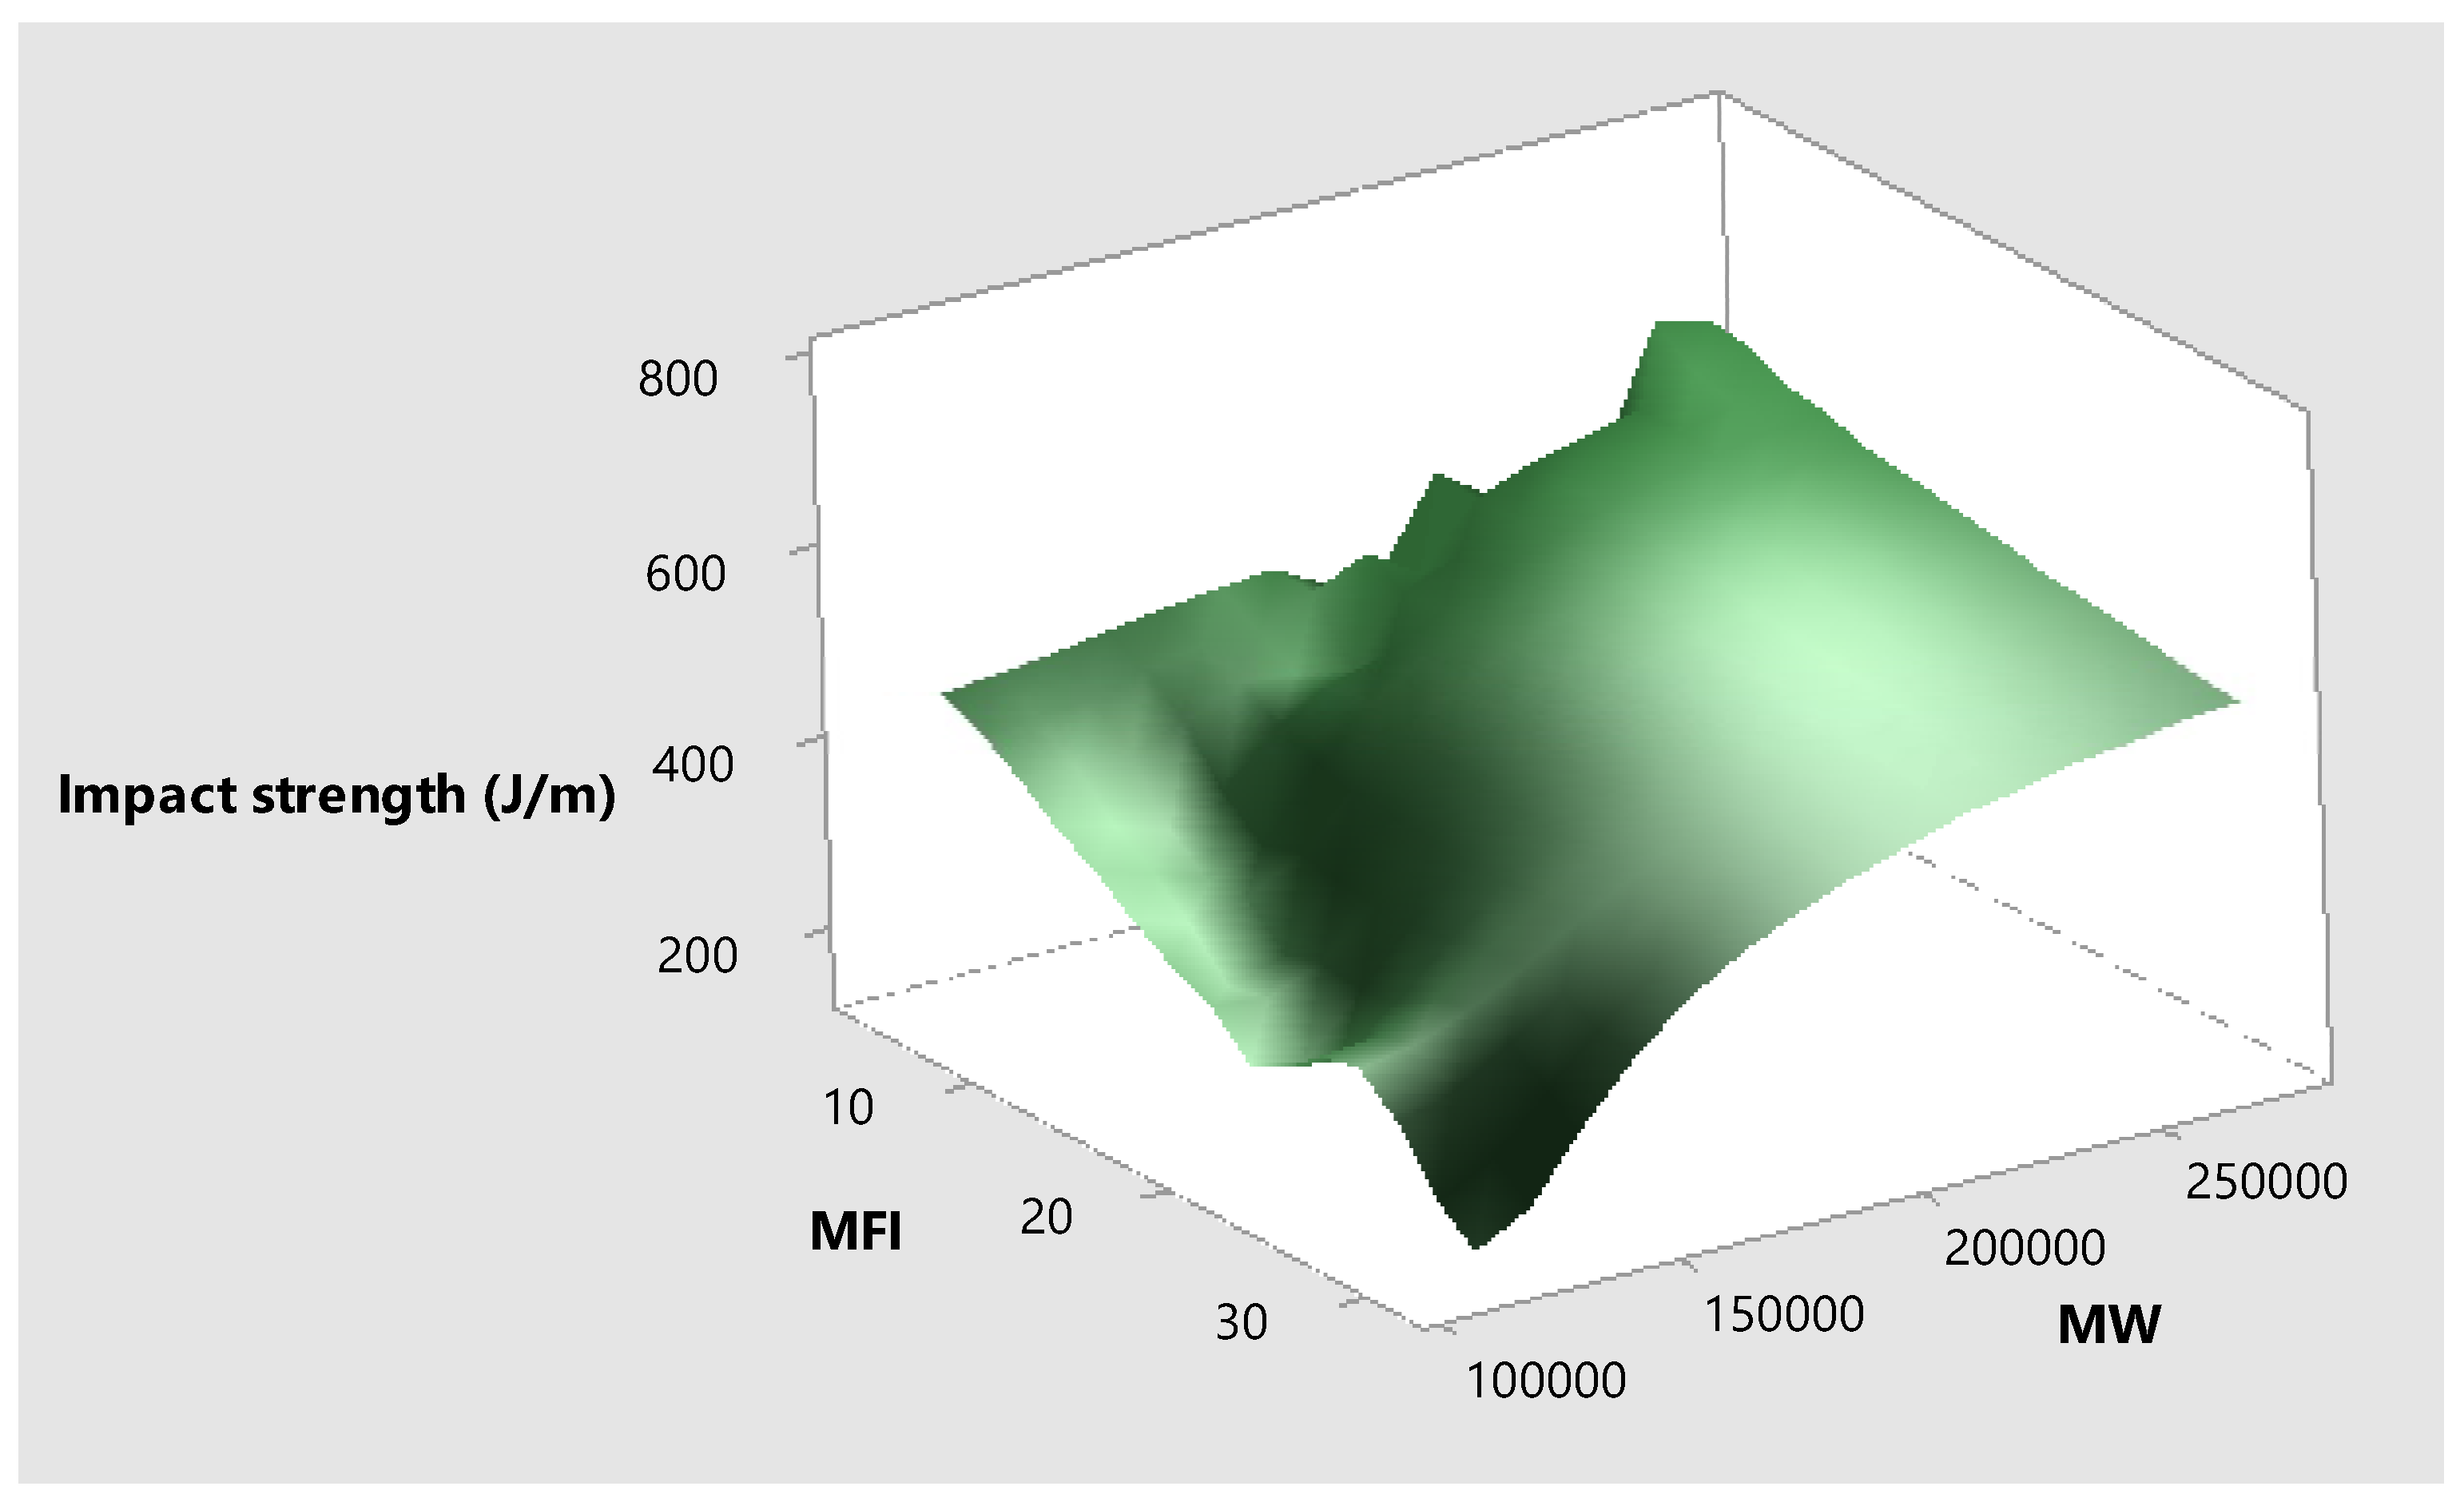

Table 1.
Levels for each parameter tested during this research.
| Parameter | No. of levels | Values |
|---|---|---|
| Concentration of Vitamin E | 3 | 0, 200, and 400 (ppm) |
| Concentration of Irganox 1010 | 3 | 0, 200, and 400 (ppm) |
| Number of Pass | 3 | 1 to 3 |
Table 2.
Details on each formulation used in this research.
| No. of formulation | Formulation Name | Number of Pass | Polymer | Concentration of Irganox 1010 (ppm) | Concentration of Vitamin E (ppm) | Concentration of PEG (ppm) | |
|---|---|---|---|---|---|---|---|
| 1 | Ref-1 | 1 | PE | 0 | 0 | 0 | |
| 2 | Ref-2 | 2 | PE | 0 | 0 | 0 | |
| 3 | Ref-3 | 3 | PE | 0 | 0 | 0 | |
| 4 | Irg-200-1 | 1 | PE | 200 | 0 | 0 | |
| 5 | Irg-200-2 | 2 | PE | 200 | 0 | 0 | |
| 6 | Irg-200-3 | 3 | PE | 200 | 0 | 0 | |
| 7 | Irg-400-1 | 1 | PE | 400 | 0 | 0 | |
| 8 | Irg-400-2 | 2 | PE | 400 | 0 | 0 | |
| 9 | Irg-400-3 | 3 | PE | 400 | 0 | 0 | |
| 10 | Vit-200-1 | 1 | PE | 0 | 200 | 0 | |
| 11 | Vit-200-2 | 2 | PE | 0 | 200 | 0 | |
| 12 | Vit-200-3 | 3 | PE | 0 | 200 | 0 | |
| 13 | v200-i200-1 | 1 | PE | 200 | 200 | 0 | |
| 14 | v200-i200-2 | 2 | PE | 200 | 200 | 0 | |
| 15 | v200-i200-3 | 3 | PE | 200 | 200 | 0 | |
| 16 | v200-i400-1 | 1 | PE | 400 | 200 | 0 | |
| 17 | v200-i400-2 | 2 | PE | 400 | 200 | 0 | |
| 18 | v200-i400-3 | 3 | PE | 400 | 200 | 0 | |
| 19 | Vit-400-1 | 1 | PE | 0 | 400 | 0 | |
| 20 | Vit-400-2 | 2 | PE | 0 | 400 | 0 | |
| 21 | Vit-400-3 | 3 | PE | 0 | 400 | 0 | |
| 22 | v400-i200-1 | 1 | PE | 200 | 400 | 0 | |
| 23 | v400-i200-2 | 2 | PE | 200 | 400 | 0 | |
| 24 | v400-i200-3 | 3 | PE | 200 | 400 | 0 | |
| 25 | v400-i400-1 | 1 | PE | 400 | 400 | 0 | |
| 26 | v400-i400-2 | 2 | PE | 400 | 400 | 0 | |
| 27 | v400-i400-3 | 3 | PE | 400 | 400 | 0 | |
| 28 | Irg-400-PEG-1 | 1 | PE | 400 | 0 | 150 | |
| 29 | Irg-400-PEG-2 | 2 | PE | 400 | 0 | 150 | |
| 30 | Irg-400-PEG-3 | 3 | PE | 400 | 0 | 150 | |
| 31 | v400-i400-PEG-1 | 1 | PE | 400 | 400 | 150 | |
| 32 | v400-i400-PEG-2 | 2 | PE | 400 | 400 | 150 | |
| 33 | v400-i400-PEG-3 | 3 | PE | 400 | 400 | 150 | |
| 34 | v400-PEG-1 | 1 | PE | 0 | 400 | 150 | |
| 35 | v400-PEG-2 | 2 | PE | 0 | 400 | 150 | |
| 36 | v400-PEG-3 | 3 | PE | 0 | 400 | 150 |
Table 3.
Physical properties of HDPE with various additive formulations.
| Formulation Name | MW | % of Change from 1st Pass | MFI (g/10min) | % of Change from 1st Pass | Strength (Pa.s) | % of Change from 1st Pass | Crystallinity (%) | Melting Point (oC) | Color #break# (b-value) |
||||||||
|---|---|---|---|---|---|---|---|---|---|---|---|---|---|---|---|---|---|
| Ref-1 | 191,991 | - | 6.79 | - | 66897.4 | - | 68.75 | 130.4 | -1.1 | ||||||||
| Ref-2 | 141,649 | -26.22 | 12.04 | 77.32 | 56409.3 | -15.68 | 58.45 | 130.6 | -0.3 | ||||||||
| Ref-3 | 115,091 | -40.05 | 31.3 | 360.97 | 40640.1 | -39.25 | 51.3 | 136.1 | 0.16 | ||||||||
| Irg-200-1 | 180,731 | - | 8.21 | - | 70690.1 | - | 61.2 | 130.7 | -0.95 | ||||||||
| Irg-200-2 | 130,614 | -27.73 | 16.22 | 97.56 | 46159.6 | -34.70 | 57.25 | 130.3 | -0.5 | ||||||||
| Irg-200-3 | 122,713 | -32.10 | 20.3 | 147.26 | 44000.0 | -37.76 | 59.1 | 129.9 | 0.3 | ||||||||
| Irg-400-1 | 258,469 | - | 4.92 | - | 103443 | - | 60.4 | 130.2 | -1.01 | ||||||||
| Irg-400-2 | 213,998 | -17.21 | 5.02 | 2.03 | 77374.6 | -25.20 | 40.25 | 133.4 | -0.4 | ||||||||
| Irg-400-3 | 203,260 | -21.36 | 5.4 | 9.76 | 67816.8 | -34.44 | 44.15 | 138.3 | 0.76 | ||||||||
| Vit-200-1 | 271,788 | - | 5.77 | - | 55153.4 | - | 58 | 129.9 | 7.6 | ||||||||
| Vit-200-2 | 231,764 | -14.73 | 5.01 | -13.17 | 65798.2 | 19.30 | 58.55 | 129.9 | 4.8 | ||||||||
| Vit-200-3 | 231,207 | -14.93 | 4.7 | -18.54 | 58516.1 | 6.10 | 37.4 | 136.4 | 4.4 | ||||||||
| v200-i200-1 | 249,505 | - | 5.6 | - | 76354.4 | - | 56.25 | 131.2 | 4.02 | ||||||||
| v200-i200-2 | 243,617 | -2.36 | 5.2 | -7.14 | 72591.1 | -4.93 | 56.55 | 131.1 | 4.5 | ||||||||
| v200-i200-3 | 243,665 | -2.34 | 4.9 | -12.50 | 68519.5 | -10.26 | 57.9 | 130.8 | 6.7 | ||||||||
| v200-i400-1 | 256,631 | - | 5.65 | - | 78902.2 | - | 56.25 | 130.1 | 3.4 | ||||||||
| v200-i400-2 | 235,056 | -8.41 | 5.3 | -6.19 | 77735.1 | -1.48 | 58 | 130.5 | 4.6 | ||||||||
| v200-i400-3 | 253,072 | -1.39 | 4.9 | -13.27 | 50340.9 | -36.20 | 59.25 | 130.6 | 5.6 | ||||||||
| Vit-400-1 | 255,547 | - | 5.52 | - | 81341 | - | 59.945 | 129.8 | 8.6 | ||||||||
| Vit-400-2 | 264,646 | 3.56 | 5.1 | -7.61 | 68385.9 | -15.93 | 56.3 | 131.0 | 8.4 | ||||||||
| Vit-400-3 | 254,776 | 0.30 | 5.4 | -2.17 | 75705.1 | -6.93 | 59.75 | 130.8 | 9.5 | ||||||||
| v400-i200-1 | 273,529 | - | 5.65 | - | 82914.6 | - | 58.7 | 130.7 | 8.9 | ||||||||
| v400-i200-2 | 259,465 | -5.14 | 5.35 | -5.31 | 72063 | -13.09 | 57.75 | 130.5 | 8.2 | ||||||||
| v400-i200-3 | 253,196 | -7.43 | 5.3 | -6.19 | 78491.7 | -5.33 | 58.45 | 130.5 | 9.2 | ||||||||
| v400-i400-1 | 276,384 | - | 5.63 | - | 78188 | - | 58.35 | 129.8 | 12.1 | ||||||||
| v400-i400-2 | 262,368 | -5.07 | 5.37 | -4.62 | 74700.4 | -4.46 | 58.4 | 130.9 | 8.36 | ||||||||
| v400-i400-3 | 261,212 | -5.49 | 5.4 | -4.09 | 80037.9 | 2.37 | 58.9 | 130.8 | 10.1 | ||||||||
| Irg-400-PEG-1 | 181,589 | - | 8.33 | - | 65291.2 | - | 59.75 | 130.5 | -0.7 | ||||||||
| Irg-400-PEG-2 | 189,411 | 4.31 | 7.8 | -6.36 | 63268 | -3.10 | 52.95 | 130.3 | -0.45 | ||||||||
| Irg-400-PEG-3 | 207,835 | 14.45 | 8.01 | -3.84 | 64865 | -0.65 | 58.5 | 130.4 | -0.4 | ||||||||
| v400-i400-PEG-1 | 247,305 | - | 5.57 | - | 75778.6 | - | 60.7 | 130.6 | 12.5 | ||||||||
| v400-i400-PEG-2 | 255,467 | 3.30 | 5.33 | -4.31 | 76537.2 | 1.00 | 59 | 130.3 | 6.2 | ||||||||
| v400-i400-PEG-3 | 260,584 | 5.37 | 5.7 | 2.33 | 76432.1 | 0.86 | 59.85 | 130.4 | 7.5 | ||||||||
| v400-PEG-1 | 276,271 | - | 5.84 | - | 72303.3 | - | 58.5 | 129.9 | 6.6 | ||||||||
| v400-PEG-2 | 270,180 | -2.20 | 5.24 | -10.27 | 73905.6 | 2.22 | 61.05 | 130.3 | 9.1 | ||||||||
| v400-PEG-3 | 259,343 | -6.13 | 5.6 | -4.11 | 68169.6 | -5.72 | 60.1 | 130.5 | 7.96 | ||||||||
Table 4.
Mechanical Properties of HDPE with various additives formulations.
| Formulation Name | Izod Impact (J/m) | % of Change from 1st Pass | Tensile Strength at Yield (MPa) | % of Change from 1st Pass | Young Modulus (MPa) | % of Change from 1st Pass | Tensile #break# Elongation at Break (%) |
% of Change from 1st Pass |
|---|---|---|---|---|---|---|---|---|
| Ref-1 | 515.2 | - | 25.6 | - | 1390 | - | 410 | - |
| Ref-2 | 290.5 | -43.61 | 27 | 5.47 | 1500.8 | 7.97 | 49.8 | -87.85 |
| Ref-3 | 152.4 | -70.42 | 27.6 | 7.81 | 1546 | 11.22 | 27.4 | -93.32 |
| Irg-200-1 | 392.2 | - | 25.9 | - | 1400 | - | 292 | - |
| Irg-200-2 | 238.7 | -39.14 | 27.8 | 7.34 | 1548.8 | 10.63 | 35 | -88.01 |
| Irg-200-3 | 201 | -48.75 | 26.3 | 1.54 | 1532 | 9.43 | 31 | -89.38 |
| Irg-400-1 | 584.5 | - | 25.6 | - | 1360 | - | 552.5 | - |
| Irg-400-2 | 539.8 | -7.65 | 26.5 | 3.52 | 1424.8 | 4.76 | 420 | -23.98 |
| Irg-400-3 | 347.3 | -40.58 | 27.4 | 7.03 | 1503 | 10.51 | 222.5 | -59.73 |
| Vit-200-1 | 519.1 | - | 25.8 | - | 1372 | - | 526.7 | - |
| Vit-200-2 | 553.5 | 6.63 | 27.1 | 5.04 | 1505 | 9.69 | 458 | -13.04 |
| Vit-200-3 | 471.8 | -9.11 | 26.8 | 3.88 | 1495 | 8.97 | 510 | -3.16 |
| v200-i200-1 | 537.2 | - | 25.5 | - | 1352 | - | 542 | - |
| v200-i200-2 | 595.7 | 10.89 | 25.3 | -0.78 | 1556 | 15.09 | 516 | -4.80 |
| v200-i200-3 | 464.7 | -13.50 | 26.8 | 5.10 | 1491 | 10.28 | 523.3 | -3.44 |
| v200-i400-1 | 551 | - | 25.9 | - | 1391 | - | 436.7 | - |
| v200-i400-2 | 588.4 | 6.79 | 28 | 8.11 | 1562 | 12.29 | 428 | -1.98 |
| v200-i400-3 | 468.8 | -14.92 | 26.7 | 3.09 | 1498 | 7.69 | 552 | 26.41 |
| Vit-400-1 | 617.4 | - | 25.6 | - | 1363 | - | 562 | - |
| Vit-400-2 | 663.6 | 7.48 | 27.5 | 7.42 | 1459.8 | 7.10 | 448 | -20.28 |
| Vit-400-3 | 614.1 | -0.53 | 26.7 | 4.30 | 1490 | 9.32 | 528 | -6.05 |
| v400-i200-1 | 776.3 | - | 27 | - | 1503 | - | 470 | - |
| v400-i200-2 | 560.3 | -27.82 | 27.3 | 1.11 | 1459 | -2.93 | 362 | -22.98 |
| v400-i200-3 | 535.9 | -30.97 | 26.7 | -1.11 | 1498 | -0.33 | 552 | 17.45 |
| v400-i400-1 | 550.6 | - | 25.4 | - | 1331.6 | - | 554 | - |
| v400-i400-2 | 644 | 16.96 | 27.3 | 7.48 | 1513.6 | 13.67 | 502 | -9.39 |
| v400-i400-3 | 551 | 0.07 | 26.1 | 2.76 | 1446 | 8.59 | 496.7 | -10.35 |
| Irg-400-PEG-1 | 371 | - | 25.7 | - | 1362.2 | - | 216 | - |
| Irg-400-PEG-2 | 415.5 | 11.99 | 26.9 | 4.67 | 1405 | 3.14 | 264 | 22.22 |
| Irg-400-PEG-3 | 390.2 | 5.18 | 25.2 | -1.95 | 1405 | 3.14 | 272 | 25.93 |
| v400-i400-PEG-1 | 547.4 | - | 25 | - | 1317.6 | - | 443.3 | - |
| v400-i400-PEG-2 | 589.6 | 7.71 | 27.4 | 9.60 | 1546.2 | 17.35 | 454 | 2.41 |
| v400-i400-PEG-3 | 614.1 | 12.18 | 27.1 | 8.40 | 1514 | 14.91 | 527.5 | 18.98 |
| v400-PEG-1 | 485.1 | - | 25.4 | - | 1344 | - | 578 | - |
| v400-PEG-2 | 533 | 9.87 | 27.3 | 7.48 | 1479.6 | 10.09 | 424 | -26.64 |
| v400-PEG-3 | 606.3 | 24.98 | 26.8 | 5.51 | 1480 | 10.12 | 552 | -4.50 |
Disclaimer/Publisher’s Note: The statements, opinions and data contained in all publications are solely those of the individual author(s) and contributor(s) and not of MDPI and/or the editor(s). MDPI and/or the editor(s) disclaim responsibility for any injury to people or property resulting from any ideas, methods, instructions or products referred to in the content. |
© 2025 by the authors. Licensee MDPI, Basel, Switzerland. This article is an open access article distributed under the terms and conditions of the Creative Commons Attribution (CC BY) license (http://creativecommons.org/licenses/by/4.0/).
Copyright: This open access article is published under a Creative Commons CC BY 4.0 license, which permit the free download, distribution, and reuse, provided that the author and preprint are cited in any reuse.


