
Submitted:
04 July 2025
Posted:
08 July 2025
You are already at the latest version
Abstract
Background: Melanoma is a highly aggressive skin cancer with limited therapeutic response. Targeting intracellular signaling pathways and promoting tumor cell differentiation are promising therapeutic strategies. Pentoxifylline (PTX) and norcantharidin (NCTD) have demonstrated antitumor properties, but their combined mechanisms of action in melanoma remain poorly understood. Methods: The effects of PTX (30 and 60 mg/kg) and NCTD (0.75 and 3 mg/kg), administered alone or in combination, in a DBA/2J murine B16-F1 melanoma model via intraperitoneal and intratumoral (IT) routes were evaluated. Tumor growth was monitored, and molecular analyses included RNA sequencing, immunofluorescence quantification of PI3K, AKT1, mTOR, ERBB2, BRAF, and MITF protein levels, and molecular docking simulations were performed. Results: Combination therapy significantly reduced tumor volume compared to monotherapies, with relative tumor volume decreasing from 18.1 in the IT control group to 0.6 in the IT combination-treated group. RNA-seq revealed over 3,000 differentially expressed genes in intratumoral treatments, with enrichment in pathways related to oxidative stress, immune response, and translation regulation (KEGG and Reactome analyses). Minimal transcript-level changes were observed for BRAF and PI3K/AKT/mTOR genes; however, immunofluorescence showed reduced total and phosphorylated levels of PI3K, AKT1, mTOR, BRAF, and ERBB2. MITF protein levels and pigmentation increased, especially in PTX-treated groups, indicating enhanced melanocytic differentiation. Docking analyses predicted direct binding of both drugs to PI3K, AKT1, mTOR, and BRAF, with affinities ranging from -5.7 to -7.4 kcal/mol. Conclusions: The combination of PTX and NCTD suppresses melanoma progression through dual mechanisms: inhibition of PI3K/AKT/mTOR signaling and promotion of tumor cell differentiation.
Keywords:
Melanoma mouse model
; Pentoxifylline
; Norcantharidin
; B16-F1
; DBA/2J
; RNA sequencing
; ERBB2
; Combined treatment
; PI3K/AKT/mTOR
; melanogenesis.
; melanoma
; MITF
1. Introduction
Melanoma represents one of the most aggressive and therapeutically challenging malignancies, characterized by rapid progression, high metastatic potential, and resistance to conventional treatments [1]. Despite significant advances in targeted therapies and immune checkpoint inhibitors, tumor heterogeneity and adaptive resistance mechanisms continue to pose major clinical obstacles [2], underscoring the urgent need for novel therapeutic strategies [3].
In this context, combination therapies have emerged as a promising approach to enhance treatment efficacy and overcome resistance by simultaneously targeting multiple oncogenic pathways [3,4,5].
Among the compounds with potential therapeutic relevance, pentoxifylline (PTX), a methylxanthine derivative approved by the FDA for the treatment of peripheral arterial disease [6], has demonstrated well-documented immunomodulatory and anti-inflammatory properties [7,8]. Similarly, norcantharidin (NCTD), a demethylated analog of cantharidin, has shown anticancer activity across various tumor models, including melanoma [9,10].
Although both PTX and NCTD have been individually proposed as potential therapeutic agents against melanoma, the combined effects of these compounds on melanoma progression, particularly their impact on the expression and activation of key oncogenic signaling pathways such as PI3K/AKT, MAPK, BRAF, and mTOR, remain insufficiently understood [11,12].
Previous studies have reported that both PTX and NCTD modulate signaling pathways associated with tumor proliferation, apoptosis, and immune regulation, in both in vitro [12,13]and in vivo models [11,14,15]. However, the precise molecular mechanisms underlying these effects, as well as their potential synergistic actions, require further elucidation.
To address this knowledge gap, we employed an integrative systems biology approach, combining in vivo tumor growth monitoring, transcriptomic (RNA-seq) and proteomic (immunofluorescence) analyses to comprehensively characterize gene and protein expression changes following treatment. Additionally, molecular docking simulations were performed to predict potential interactions between PTX, NCTD, and key regulatory proteins involved in melanoma pathophysiology.
2. Results
2.1. Effects of Treatments on Tumor Growth
To evaluate the antitumor efficacy of pentoxifylline (PTX), norcantharidin (NCTD), and their combination, we monitored tumor volume progression in B16-F1 melanoma-bearing DBA/2J mice following intraperitoneal and intratumoral administration schedules (Figure 1a). Tumor growth curves showed that all treatment groups exhibited reduced tumor volume compared to the Control group at day 14 (D14), with the most significant reductions observed in the combination treatment groups (Figure 1b,c). In the intraperitoneal administration series, the PTX 60 mg/kg + NCTD 3 mg/kg group displayed the greatest tumor suppression, followed by the PTX 60 mg/kg + NCTD 0.75 mg/kg group. Similarly, in the intratumoral administration series, the PTX 60 mg/kg + NCTD 3 mg/kg combination resulted in the most pronounced tumor growth inhibition.
Statistical analysis performed on D14 confirmed significant differences between treated groups and the Control group (ANOVA followed by Tukey’s post hoc test, ***p < 0.001). Furthermore, body weight was recorded throughout the study as a general indicator of animal health and potential treatment-related toxicity. The upper-left insets in Figure 1b and 1c show the body weight progression for each experimental group, revealing no significant weight loss in any treatment condition, suggesting that all treatment regimens were well tolerated under the experimental conditions.
A two-way ANOVA was performed to assess the effects of treatment, administration route, and their interaction on tumor volume at day 9 post-treatment (D14) (Supplementary Table S1). The analysis revealed a significant main effect of treatment (p < 0.001), indicating that tumor volume differed among treatment groups regardless of administration route. A significant main effect of administration route was also observed (p < 0.001), suggesting that the route of drug delivery (intraperitoneal vs. intratumoral) independently influenced tumor growth. Importantly, there was a significant interaction between treatment and route (p < 0.001), indicating that the effect of each treatment on tumor volume was dependent on the route of administration. Post hoc Tukey’s HSD test confirmed that the combination treatment (PTX 60 mg/kg + NCTD 3 mg/kg) administered intratumorally resulted in the most pronounced reduction in tumor volume compared to all other groups (p < 0.001). Additionally, for each individual treatment, intratumoral administration consistently showed greater tumor reduction than intraperitoneal administration. These findings highlight the enhanced efficacy of combination therapy and the superior antitumor effect of intratumoral delivery, supporting the observed macroscopic and molecular results.
Representative photographs of excised tumors at day 9 post-treatment (D14) are shown in Figure 2. Visual inspection clearly demonstrates differences in tumor size among the treatment groups. Tumors from the Control group appeared larger and more vascularized compared to those from the treated groups. Notably, the smallest tumors were observed in the combination group (PTX + NCTD), suggesting enhanced antitumor efficacy with the combined regimen. To highlight vascularization, yellow triangles were used to mark visible blood vessels supplying the tumors. In the Control group, larger and more prominent tumor-feeding vessels were observed, whereas treated groups, particularly the combination group, exhibited reduced vascularization. These macroscopic observations support the tumor growth inhibition results shown in Figure 1 and suggest a potential anti-angiogenic effect of the treatments. In Supplementary Figure S2, the representative images of excised tumors from melanoma-bearing mice following euthanasia can be observed.
2.2. Histological and Immunofluorescence Analysis of Tumor Tissues
2.2.1. Regulation of MITF in Response to Treatments
To investigate the effect of treatments on melanocytic differentiation, we evaluated the expression of microphthalmia-associated transcription factor (MITF) in tumor tissues of intraperitoneal group by immunofluorescence analysis (Figure 3). Quantitative analysis of the MITF/DAPI fluorescence ratio revealed a significant increase in MITF expression in tumors from mice treated with PTX 30 mg/kg, PTX 60 mg/kg, PTX 60 mg/kg + NCTD 0.75 mg/kg, and PTX 60 mg/kg + NCTD 3 mg/kg compared to the Control group (Figure 3a). Among these, the PTX 60 mg/kg -treated groups showed the most pronounced increase, suggesting that pentoxifylline plays a key role in modulating MITF levels. Representative immunofluorescence images (Figure 3b) further support these findings. Tumor sections from PTX-treated groups exhibited a stronger fluorescence signal, corresponding to MITF expression. This enhanced staining was most prominent in the combination group (PTX 60 mg/kg + NCTD 3 mg/kg), corroborating the quantitative data and suggesting that both monotherapy and combination therapy promote MITF upregulation in melanoma tissues.
2.2.2. Expression and Activation of Key Oncogenic Signaling Proteins
To investigate the impact of the treatments on key signaling pathways involved in melanoma progression, we evaluated the expression and activation status of ERBB2, BRAF, PI3K, AKT1, and mTOR by immunofluorescence analysis (Figure 4). For each protein, both total expression (protein/DAPI ratio) and activation level (phosphorylated protein/total protein ratio) were quantified. In the case of ERBB2 (Figure 4a), all treatment groups showed a significant reduction in total ERBB2 expression compared to the Control group, with the most pronounced decrease observed in the PTX 60 mg/kg + NCTD 3 mg/kg combination group. Notably, the phosphorylation status of ERBB2 (p-ERBB2/ERBB2 ratio) exhibited a divergent response: ERBB2 phosphorylation significantly increased in the monotherapy groups (PTX and NCTD), whereas only the combination therapy led to a significant reduction in ERBB2 phosphorylation. This paradoxical increase in phosphorylation despite reduced total ERBB2 levels in the monotherapy groups may reflect a compensatory feedback activation, a phenomenon previously described in other tumor models exposed to targeted therapies [16,17]. For BRAF (Figure 4b), a significant decrease in total BRAF expression was observed in the combination groups. Interestingly, phosphorylated BRAF (p-BRAF/BRAF ratio) was significantly increased in the combination groups, suggesting a potential compensatory activation of BRAF in response to upstream pathway inhibition. PI3K levels (Figure 4c) showed a marked reduction in total protein expression in the combination group, while the p-PI3K/PI3K ratio was significantly reduced across all treated groups, indicating effective downregulation of the PI3K pathway. Regarding AKT1 (Figure 4d), total AKT1 expression was significantly decreased in all treatment groups except PTX 30 mg/kg, while phosphorylated AKT1 levels (p-AKT1/AKT1 ratio) were significantly lower in the NCTD 3 mg/kg, PTX 60 mg/kg, and combination groups compared to Control. Finally, mTOR analysis (Figure 4e) revealed a significant reduction in both total mTOR expression and its phosphorylation status in the combination groups, with the most pronounced effect observed in the PTX 60 mg/kg + NCTD 3 mg/kg group. Representative immunofluorescence images for each protein are shown in the lower panel of each graph, highlighting the differences in fluorescence intensity between Control and treated groups. These results indicate that PTX and NCTD treatments, particularly in combination, effectively downregulate multiple key oncogenic pathways in melanoma tumors, including the PI3K/AKT/mTOR and ERBB2/BRAF signaling axes.
2.3. Transcriptomic Analysis via RNA-Seq
2.3.1. Differential Gene Expression Analysis
To explore the transcriptomic changes induced by the treatments, differential gene expression analysis was performed by comparing each treatment group with its respective control for both administration routes (intraperitoneal and intratumoral). Figure 5 shows Venn diagrams illustrating the number of differentially expressed genes (DEGs) identified across the experimental conditions. For the intraperitoneal administration (IP), a total of 10,024 genes were commonly detected as differentially expressed across all four groups (CONTROL_IP, PTX_IP, NCTD_IP, and MIX_IP), while additional unique and shared DEGs were identified for each treatment comparison (Figure 5, left panel). Similarly, for the intratumoral administration (IT), 9,953 DEGs were commonly detected across the CONTROL_IT, PTX_IT, NCTD_IT, and MIX_IT groups, with distinct subsets of DEGs specific to each treatment condition (Figure 5, right panel). Additionally, a Venn diagram comparing DEGs from the MIX_IP vs CONTROL_IP and MIX_IT vs CONTROL_IT contrasts revealed a subset of 76 DEGs commonly regulated by the combination treatment regardless of the administration route (Figure 5, bottom panel). This overlap suggests the existence of core transcriptomic responses to the combined therapy, independent of the delivery method.
To further explore the transcriptomic alterations induced by each treatment, volcano plots were generated for all pairwise comparisons against their respective control groups (Figure 6). Each plot displays the distribution of differentially expressed genes (DEGs), with the x-axis representing log2 fold change (log2FC) and the y-axis representing the –log10 adjusted p-value (padj). For the intraperitoneal administration groups (Figure 6a), treatments with PTX, NCTD, and the combination (MIX) resulted in a progressively increasing number of DEGs when compared to Control_IP. Specifically, NCTD induced 288 DEGs, PTX induced 243 DEGs, and MIX induced 324 DEGs, indicating a modest but notable increase in the transcriptomic response with combination therapy. In contrast, the intratumoral administration groups (Figure 6b) exhibited a much higher DEG count across all treatments when compared to Control_IT. NCTD_IT generated 3,233 DEGs, PTX_IT resulted in 1,070 DEGs, and the combination MIX_IT induced 1,864 DEGs. These results indicate that intratumoral delivery, particularly NCTD monotherapy, elicited a broader transcriptional response compared to intraperitoneal administration, with MIX_IT also showing a substantial number of DEGs. Overall, these findings suggest that both the administration route and treatment type strongly influence the extent of transcriptomic modulation in melanoma tumors, with intratumoral treatments resulting in a significantly higher number of differentially expressed genes than intraperitoneal treatments.
2.3.2. Clustered Gene Expression Patterns
To explore global transcriptional changes induced by the treatments, hierarchical clustering and heatmap visualization were performed using the differentially expressed genes (DEGs) from GO enrichement analyses from each comparison versus control. For the intratumoral administration groups (Figure 7), distinct gene expression profiles were observed for each treatment (NCTD_IT, PTX_IT, and MIX_IT) compared to Control_IT. The heatmaps revealed clear separation between control and treated samples, with the NCTD_IT and MIX_IT groups showing the most pronounced gene expression shifts. These results are consistent with the higher number of DEGs identified in the intratumoral comparisons. For the intraperitoneal administration groups, hierarchical clustering patterns are presented in Supplementary Figure S3, showing less pronounced but still detectable transcriptional differences compared to Control_IP. Overall, these clustered expression patterns indicate that both the route of administration and the treatment type strongly influence the global gene expression landscape in melanoma tumors, with intratumoral treatments inducing more robust transcriptional changes than intraperitoneal treatments.
2.3.3. Functional Enrichment and Pathway Analysis
To gain insight into the biological processes and pathways affected by the treatments, KEGG pathway enrichment analysis was performed using the differentially expressed genes (DEGs) from each comparison against the respective control group. For the intraperitoneal administration groups (Figure 8a), enriched pathways included oxidative phosphorylation, chemical carcinogenesis - reactive oxygen species, melanoma, carbon metabolism, and biosynthesis of amino acids. These pathways suggest that the treatments modulated processes related to energy metabolism, oxidative stress response, and cancer-related signaling. For the intratumoral administration groups (Figure 8b), the enriched pathways were more diverse and numerous, reflecting the higher DEG count observed in these groups. Significant pathways included NF-kappa B signaling, HIF-1 signaling pathway, melanoma, focal adhesion, leukocyte transendothelial migration, oxidative phosphorylation, and circadian rhythm, among others. Notably, several cancer-associated and immune-related pathways were overrepresented, particularly in the MIX_IT and NCTD_IT groups. These findings indicate that intratumoral treatments, especially with NCTD and the combination therapy, elicited broader and more diverse biological pathway alterations compared to intraperitoneal treatments, reinforcing the stronger transcriptomic impact observed in previous analyses.
To further characterize the biological functions affected by the treatments, Reactome pathway enrichment analysis was performed using the DEGs from each treatment versus control comparison. For the intraperitoneal treatment groups (Figure 9a), the most significantly enriched pathways included "Respiratory electron transport and ATP synthesis", "TP53 regulates metabolic genes", "Formation of ATP by chemiosmotic coupling", "Mitochondrial biogenesis", "Glycolysis", and "mTOR signaling", among others. These pathways suggest that the treatments modulate mitochondrial activity, metabolic processes, and key signaling cascades such as the PI3K-mTOR axis. In the intratumoral treatment groups (Figure 9b), a broader set of pathways was enriched, reflecting the higher DEG counts observed previously. Notable pathways included "Eukaryotic translation initiation", "Nonsense-mediated decay (NMD)", "Cap-dependent translation initiation", "Glutathione conjugation", "TNF receptor signaling", "ECM proteoglycans", and "Extracellular matrix organization". These results highlight a strong modulation of translational control, stress responses, and extracellular matrix remodeling in response to intratumoral drug administration. Overall, these findings suggest that intratumoral treatments, especially with NCTD and combination therapy, induce broader alterations in translation regulation, stress response, and tumor microenvironment remodeling, whereas intraperitoneal treatments predominantly affect energy metabolism and mitochondrial function.
2.4. In Silico Analysis of Drug–Target Interactions
To predict the potential molecular targets of pentoxifylline (PTX) and norcantharidin (NCTD), molecular docking analyses were performed using key proteins involved in melanoma progression, oncogenic signaling, angiogenesis, and the tumor microenvironment. The results, summarized in Table 1, revealed that both PTX and NCTD showed binding affinities (ΔG values ranging from –3.5 to –7.8 kcal/mol) toward several oncogenic signaling proteins, transcription factors, and extracellular matrix regulators. Notably, PTX exhibited stronger binding energies than NCTD in the majority of the evaluated targets, especially for CD117 (–7.4 kcal/mol), B-RAF (–7.4 kcal/mol), PTGS2 (COX-2, –7.3 kcal/mol), and MMP-9 (–7.0 kcal/mol).
Importantly, several binding residues identified for PTX and NCTD are located in functionally critical regions of the target proteins. For example:
- For B-RAF, PTX showed predicted interactions with Lys483 and Asp594, both essential residues within the ATP-binding site [18], suggesting potential interference with kinase activity.
- For mTOR, PTX docked at residues Gln1901, His2410, and Asp2412, located near the kinase catalytic site [19].
- For PIK3CA (PI3K catalytic subunit alpha), PTX interacted with residues such as His670 and Arg818, known to participate in PI3K activation [20].
- For HIF1A, NCTD showed the strongest binding energy (–7.8 kcal/mol), with interactions at residues Arg383 and His374, both involved in transcriptional regulation under hypoxic conditions [21].
Similarly, PTX showed notable binding to NF-κB p50 subunit at Lys147, a residue implicated in DNA binding and transcriptional activation [22,23]. These in silico findings suggest that both drugs may exert their antitumor effects by targeting multiple oncogenic pathways at different regulatory levels, including signaling kinases (e.g., PI3K, AKT1, mTOR, B-RAF), transcription factors (MITF, HIF1A, NF-κB), and proteins involved in tumor microenvironment remodeling (MMPs, VEGF-A, CD117).
To illustrate the molecular interactions underlying the predicted binding affinities, docking poses of PTX and NCTD with three key signaling proteins—PI3K (PDB ID: 4A55), AKT1 (PDB ID: 3O96), and mTOR (PDB ID: 6BCX)—were visualized in both three-dimensional (3D) and two-dimensional (2D) formats (Figure 10). For PI3K (Figure 10a), PTX exhibited a binding energy of –6.50 kcal/mol, interacting with residues such as His670, Arg662, and Arg818, which are localized near the ATP-binding pocket and critical for kinase activation. NCTD showed a slightly lower binding energy (–5.72 kcal/mol), forming contacts with Gln1033, Leu1036, and Glu1037, located in proximity to the catalytic site. For AKT1 (Figure 10b), PTX demonstrated a binding energy of –6.10 kcal/mol, interacting mainly with residues Leu52, Pro51, and Asp325, near the activation loop. NCTD bound with –5.99 kcal/mol, engaging residues like Leu360, Tyr340, and Arg367, which are also relevant for AKT1 regulation. In mTOR (Figure 10c), PTX displayed the strongest interaction (–6.88 kcal/mol), contacting residues Gln1901, His2410, and Asp2412 within the kinase domain. NCTD showed a binding energy of –6.60 kcal/mol, with interactions at His1398, Trp2313, and Trp2304, also located near the catalytic cleft. The 2D interaction diagrams highlight hydrogen bonds, hydrophobic contacts, and electrostatic interactions between each ligand and target protein. Overall, these results suggest that both PTX and NCTD have the potential to modulate PI3K/AKT/mTOR signaling by directly interacting with key regulatory residues within the catalytic domains of these proteins.
Overall, the combined in vivo, molecular, transcriptomic, and in silico analyses demonstrate that PTX and NCTD, both individually and in combination, modulate key signaling pathways associated with melanoma progression, proliferation, and differentiation. These multimodal effects were more pronounced with the combination therapy, highlighting the potential therapeutic value of targeting multiple pathways simultaneously. A detailed integrative discussion of these findings is presented in the following section.
3. Discussion
In this study, we employed a well-established preclinical model to investigate the antitumor effects of pentoxifylline (PTX) and norcantharidin (NCTD) in melanoma. Specifically, we used DBA/2J mice, a strain characterized by mutations in the Tyrp1 and Gpnmb genes that impair melanosome function, leading to pigment dispersion in the iris and contributing to the development of pigmentary glaucoma. These pigmentation characteristics make DBA/2J mice a valuable model for studying pigmentation-related diseases, including melanoma [24]. Additionally, its light-colored coat facilitates the macroscopic and histological assessment of pigmented tumors, such as those derived from the B16-F1 melanoma cell line. The DBA/2J strain has also been previously reported to provide favorable tumor take rates and reproducible growth kinetics for subcutaneous Cloudman S91 melanoma implantation, making it a suitable choice for evaluating tumor progression and therapeutic interventions with B16-F1 melanoma [25]. We selected the B16-F1 cell line due to its high tumorigenicity and its well-documented use in syngeneic mouse models for studying melanoma biology and therapy response [26]. This cell line allows for the evaluation of both tumor growth dynamics and molecular changes within the tumor microenvironment. Furthermore, by including both intraperitoneal and intratumoral routes of drug administration, we were able to compare systemic versus local delivery strategies. The intraperitoneal route provided insights into systemic drug effects, while the intratumoral administration allowed for direct tumor-targeted delivery, potentially minimizing off-target toxicity and enhancing local drug concentration [27].
Treatment with PTX, NCTD, and their combination resulted in significant tumor volume reduction in B16-F1 melanoma-bearing DBA/2J mice. Both administration routes were effective in decreasing tumor growth; however, intratumoral administration, particularly the combination of PTX and NCTD, produced the most pronounced antitumor effects. These findings suggest that local delivery enhances drug bioavailability at the tumor site, potentially increasing therapeutic efficacy while reducing systemic exposure [3]. The superior efficacy observed with the combination treatment may be attributed to the synergistic modulation of multiple oncogenic pathways, as both PTX and NCTD target distinct but complementary molecular mechanisms involved in melanoma progression [11]. Additionally, the lack of significant body weight loss across treatment groups indicates a favorable toxicity profile under the tested conditions.
One of the most notable molecular findings in this study was the upregulation of MITF expression in tumors from PTX-treated groups, as confirmed by immunofluorescence quantification. MITF is a key transcription factor involved in melanocyte differentiation and melanogenesis, and its expression is tightly regulated by upstream signaling pathways such as MAPK/ERK and PI3K/AKT [28]. The increase in MITF levels, especially in PTX monotherapy and combination groups, was accompanied by macroscopic evidence of enhanced pigmentation in the tumors, suggesting a shift towards a more differentiated melanoma phenotype. This observation is consistent with previous studies reporting that tumor cell differentiation, characterized by increased MITF and melanin production, can be associated with reduced proliferation and aggressiveness in melanoma [29]. Our results suggest that PTX may promote tumor cell differentiation through modulation of MITF expression, a mechanism that could contribute to its antitumor effects observed in vivo.
Our immunofluorescence analyses further revealed that both total protein levels and phosphorylation status of key oncogenic signaling molecules—including ERBB2, BRAF, PI3K, AKT1, and mTOR—were significantly reduced in treated groups, with the most pronounced effects observed in the combination therapy. These pathways play critical roles in cell proliferation, survival, and tumor progression in melanoma [30]. The observed decrease in phosphorylation levels of BRAF, PI3K, AKT1, and mTOR is particularly relevant, as constitutive activation of these pathways has been strongly associated with melanoma growth and resistance to therapy [31]. By targeting multiple nodes within these signaling cascades, PTX and NCTD appear to exert a dual inhibitory effect on both upstream and downstream regulators, contributing to the observed reduction in tumor growth. These results are in line with previous reports demonstrating that simultaneous inhibition of the PI3K/AKT/mTOR and MAPK/ERK pathways can produce synergistic antitumor effects in melanoma models, offering a potential mechanistic explanation for the enhanced efficacy observed with combination therapy [32].
Transcriptomic analysis by RNA-seq provided additional insights into the molecular mechanisms underlying the observed antitumor effects. The number of differentially expressed genes (DEGs) was markedly higher in the intratumoral treatment groups, particularly in tumors treated with NCTD and the combination therapy, compared to intraperitoneal treatments. This finding underscores the greater transcriptomic impact of local drug delivery, likely due to higher intratumoral drug concentrations and more direct modulation of tumor-specific pathways [33]. Functional enrichment analyses using KEGG and Reactome databases revealed that the DEGs were significantly associated with pathways related to oxidative stress, immune response, protein translation, energy metabolism, and key oncogenic signaling cascades, including PI3K/AKT/mTOR, HIF-1, NF-κB, and MAPK pathways. Notably, intratumoral treatments showed enrichment in pathways associated with inflammatory response, stress adaptation, and extracellular matrix remodeling, suggesting that local therapy not only affects tumor cell-intrinsic pathways but may also modulate the tumor microenvironment [34,35]. Interestingly, hierarchical clustering analysis of all treatment groups, irrespective of administration route, revealed that samples tended to cluster according to the type of drug administered rather than the delivery method (Supplementary Figure S4). This suggests that the transcriptomic response in melanoma tumors was primarily driven by the pharmacological agent, highlighting the dominant effect of PTX, NCTD, or their combination on gene expression profiles.
To support the molecular and transcriptomic findings, in silico docking analyses were performed to predict potential drug–target interactions between PTX, NCTD, and key proteins involved in melanoma progression. Both compounds demonstrated favorable binding energies with several targets, including PI3K, AKT1, mTOR, BRAF, and ERBB2, all of which are critical regulators of cell proliferation and survival in melanoma [30,31,36,37]. Detailed interaction maps revealed that PTX and NCTD interact with catalytically and functionally important residues within the kinase domains or regulatory regions of these proteins. For example, PTX showed strong binding affinity for PI3K at residues His670 and Arg818, both located near the ATP-binding site, while NCTD formed interactions with Gln1033 and Leu1036, suggesting potential inhibition of kinase activity. Similarly, both ligands exhibited interactions with residues within the activation loops of AKT1 and mTOR, supporting their capacity to interfere with signal transduction. The docking results complement the in vivo reductions observed in both total protein expression and phosphorylation levels, suggesting that direct molecular interactions may underlie the inhibition of PI3K/AKT/mTOR and MAPK/ERK pathways. Although further biochemical validation is needed, these findings provide a plausible mechanistic basis for the observed antitumor activity of PTX and NCTD in this melanoma model [38,39].
Taken together, our data suggest that the antitumor effects of PTX and NCTD, both individually and in combination, are mediated through a multimodal mechanism involving inhibition of key oncogenic signaling pathways (PI3K/AKT/mTOR and BRAF/ERK), induction of tumor cell differentiation via MITF upregulation, and modulation of transcriptional programs linked to proliferation, metabolism, and stress response. The combination therapy consistently produced the most robust effects across all experimental approaches, including tumor growth inhibition, pathway suppression, and transcriptomic reprogramming. A schematic model summarizing the proposed molecular mechanisms and signaling alterations induced by the treatments is presented in Figure 11. This integrative figure highlights how PTX and NCTD may act synergistically to suppress oncogenic signaling, promote melanoma cell differentiation, and reduce tumor proliferation and survival. While further studies are needed to validate these findings in additional melanoma models and to explore the clinical translational potential [27,32,40], our results provide compelling preclinical evidence supporting the combined use of PTX and NCTD as a novel therapeutic strategy for melanoma management.
4. Materials and Methods
4.1. Cell Culture
A vial of cryopreserved melanoma B16-F1 cells (ATCC® CRL-6323™) from ATCC® (VA, USA) was thawed in a 37ºC water bath for 30 seconds and immediately diluted in Dulbecco's Modified Eagle Medium ME-019 (DMEM, In Vitro S.A.) supplemented with 10% Gibco® Fetal Bovine Serum (FBS, Life Technologies™). The cell suspension was centrifuged at 100 RCF for 3 minutes, after which the supernatant was removed, and the cell pellet was resuspended in DMEM supplemented with 10% FBS. The cells were then transferred to 75 cm² Thermo Scientific™ cell culture-treated flasks with filter caps, containing DMEM supplemented with 10% FBS. The cells were cultured at 37ºC in a humidified incubator with 5% CO2 and 95% relative humidity. After 24 hours, cell adhesion to the flask was confirmed, and the culture medium was replaced to remove any remaining cryopreservation medium and non-viable cells. Once the cells reached greater than 80% confluency, they were treated with Gibco Trypsin-EDTA (0.25%) solution and then recovered for subsequent experimental procedures.
4.2. Establishment of the Murine Melanoma Model
Inbred DBA/2J mice (6–8 weeks old) were obtained from the Environmental Toxicology Laboratory of the Escuela Nacional de Ciencias Biológicas (ENCB), Instituto Politécnico Nacional. The animals were housed in polycarbonate cages with sawdust bedding under controlled conditions (23°C, 40–60% humidity) and maintained on a 12-hour light:12-hour dark cycle. Food and water were provided ad libitum, with rodents receiving NUTRICUBOS Rodent Chow Cargill® (SAGARPA Authorization A-0207-246) and potable water. The specimens were managed by Article 38 and Chapter V of Directive 2010/63/EU of the European Parliament and of the Council of 22 September 2010 on the protection of animals used for scientific purposes ([41], accessed on June 2021). The current study was reviewed and approved by the ENCB Bioethics Committee, with license number CEI-ENCB-ZOO-021-2020.
The study included two main experimental groups: (1) an intraperitoneal (IP) treatment group, in which 7 × 10⁵ cells were subcutaneously implanted on the right flank of the mouse, and therapeutic agents were administered intraperitoneally; (2) an intratumoral (IT) treatment group, in which 7 × 10⁵ cells were subcutaneously implanted on the right flank of the mouse, and drugs were administered directly into the tumor. On Day 0, cells were implanted, and once a visible and palpable tumor developed (Supplementary Figure S1), treatment groups were sex-matched and randomly assigned, and pharmacological treatment was initiated.
4.3. Pharmacological Treatments
Norcantaridin (NCTD, CAS No. 5442-12-6; Sigma®, USA) and pentoxifylline (PTX, CAS No. 6493-05-6; Sigma®, USA) were dissolved in either sterile saline solution or sterile dimethyl sulfoxide (DMSO), depending on the route of administration — intraperitoneal (IP) or intratumoral (IT), respectively. For the IP treatment group, animals were randomly assigned to the following subgroups: Subgroup 1 (control), receiving sterile saline solution; Subgroup 2, receiving PTX at 60 mg/kg; Subgroup 3, PTX at 30 mg/kg; Subgroup 4, NCTD at 3 mg/kg; Subgroup 5, a combination of PTX at 60 mg/kg and NCTD at 3 mg/kg; Subgroup 6, PTX at 60 mg/kg combined with NCTD at 0.75 mg/kg; and Subgroup 7, NCTD at 0.75 mg/kg. For the IT treatment group, animals were divided into four subgroups as follows: Subgroup 1 (control), receiving DMSO; Subgroup 2, PTX at 60 mg/kg; Subgroup 3, NCTD at 3 mg/kg; and Subgroup 4, PTX at 60 mg/kg combined with NCTD at 3 mg/kg.
The doses were administered over a period of 8 days, as depicted in Figure 1a, and determined based on previous studies from our research group [11,42], ensuring the absence of systemic toxic effects.
Mice were weighed using a digital scale, and tumor growth was monitored with a digital caliper from the start to the end of the treatment period. Tumor volume was calculated using the formula: V = (length × width²) / 2 [43].
Portions of tumor tissue designated for nucleic acid extraction were immediately frozen at -80°C until further processing, while the remaining tumor samples were collected and fixed in buffered formalin for subsequent immunofluorescence analysis.
4.4. Total RNA Extraction and cDNA Library Preparation
Total RNA was extracted from tumor samples using the PureLink RNA Mini Kit® (Thermo Fisher Scientific, USA), following the manufacturer’s protocol. The extracted RNA from tumor samples was subsequently used for cDNA library preparation. cDNA libraries from tumors of mice were prepared using the Collibri™ 3′ mRNA Library Prep Kit for Illumina™ (Thermo Fisher Scientific, USA), following the recommended guidelines for RNA purification, amplification, and library construction for bulk RNA-Seq analysis. The cDNA libraries prepared in the laboratory were stored in an ultrafreezer at -80°C.
4.5. RNA Sequencing and Data Acquisition
The cDNA libraries were submitted to Novogene Co., Ltd. (California, USA) for RNA sequencing. Sequencing was carried out on the Illumina HiSeq PE150 platform, generating paired-end reads of 150 base pairs in length. The sequencing depth was selected to ensure comprehensive coverage of the transcriptome. Raw sequencing data were delivered in FASTQ format and subjected to quality control analysis before being processed for downstream bioinformatics.
4.6. RNA-Seq Data Analysis Pipeline
The raw RNA-Seq data were processed and analyzed using a comprehensive bioinformatics pipeline. First, the raw FASTQ files were assessed for quality using FastQC [44] (version 0.12.1 released). Low-quality reads and adapter sequences were removed using Trimmomatic [45] (version 0.39). Cleaned reads were then aligned to the Ensembl release reference mouse genome (version GRCm39) using the STAR aligner [46] (version 2.7.11b). The resulting BAM files were sorted and indexed, and gene expression levels were quantified using STAR (version 2.7.11b). Differential expression analysis was performed using DESeq2 [47] (version 1.40.2), with statistical significance determined at a false discovery rate (FDR) of <0.05. Gene ontology (GO) and pathway enrichment analyses were conducted using clusterProfiler [48] (version 4.15.1) to interpret biological functions associated with differentially expressed genes. All analyses were performed in R [49] (version 4.4.1) and Bioconductor packages (KEGG and Reactome analyses) in R Studio [50].
4.7. Tumor Tissue Immunofluorescence
Tumor tissue samples were embedded in paraffin and sectioned at 3-4 µm thickness. The slides were air-dried for at least 12 hours at 37°C. The sections were deparaffinized using xylene and subsequently hydrated through sequential alcohol and water baths. Antigen retrieval was performed by heating the sections at 95°C in citrate buffer for at least 40 minutes. The samples were then allowed to cool for 20 minutes at room temperature, followed by a wash in PBS buffer. Fluorochrome-labeled specific antibodies for antigen detection, including ERBB2, AKT-1, mTOR, BRAF, PI3K (both phosphorylated [active] and non-phosphorylated [inactive] forms), and MITF, were used at a 1:3000 dilution. After antibody staining, the sections were incubated with DAPI for nuclear counterstaining. Finally, the samples were mounted with glycerol and analyzed using a confocal laser scanning microscope (LSM 5 EXCITER, Carl Zeiss®). Image analysis (mean fluorescence intensity) was performed using ImageJ [51] (Version 1.54g).
4.8. Molecular Docking Studies
To elucidate the interactions of PTX and NCTD with key proteins involved in melanoma progression, oncogenic signaling, angiogenesis, and the tumor microenvironment, molecular docking studies were conducted. The structures of PTX and NCTD were obtained from the PubChem database [52]. The crystal structures of the proteins analyzed were retrieved from the Protein Data Bank (PDB) [53]. Protein-ligand masked docking studies were performed using Autodock Vina software, as previously reported [39]. The top-ranked complex from each study was analyzed to identify molecular interactions, following established protocols [39]. Visualization was performed using MAESTRO and PyMOL software as previously described [39,54].
4.9. Statical Analysis
The results were analyzed by ANOVA, followed by the post hoc Dunnett test. All p-values ≤ 0.05 were considered statistically significant. R and R Studio software were used for statistical analysis and graphic representation.
5. Conclusions
This study provides comprehensive preclinical evidence demonstrating that pentoxifylline (PTX) and norcantharidin (NCTD), administered either individually or in combination, effectively suppress melanoma progression in a murine model using B16-F1 cells implanted in DBA/2J mice. Both intraperitoneal and intratumoral administration routes were evaluated, with local intratumoral delivery showing superior efficacy in reducing tumor volume and inducing broader transcriptomic changes. At the molecular level, treatment with PTX and NCTD resulted in the downregulation of key oncogenic pathways, including the PI3K/AKT/mTOR and BRAF/ERK pathways, accompanied by a reduction in both total and phosphorylated protein levels of primary signaling mediators. Additionally, PTX promoted tumor cell differentiation, as evidenced by increased MITF expression and enhanced melanin production, suggesting a potential shift towards a less aggressive melanoma phenotype. RNA-seq analysis further revealed that the treatments modulated genes involved in cell proliferation, metabolism, immune response, and stress adaptation, with functional enrichment pointing to significant alterations in cancer-related, metabolic, and inflammatory pathways. Finally, in silico molecular docking studies supported these findings by predicting direct binding interactions of PTX and NCTD with multiple proteins involved in melanoma growth and survival, providing a plausible mechanistic basis for the observed in vivo effects. Together, these findings highlight the therapeutic potential of PTX and NCTD, particularly when combined, as promising candidates for melanoma treatment strategies aimed at simultaneously modulating multiple oncogenic pathways. Further studies, including in vitro mechanistic validation and clinical translation approaches, are warranted to explore their potential role in future melanoma therapy.
Supplementary Materials
The following supporting information can be downloaded at the website of this paper posted on Preprints.org. Table S1: Post hoc Tukey HSD pairwise comparisons for tumor volume between treatments and administration routes (IP vs IT) at day 9. Figure S1: Representative DBA/2J mice at baseline (D0) and day 6 (D6) showing tumor development prior to treatment initiation. Figure S2: Representative images of excised tumors from intratumorally treated mice after euthanasia, showing tumor size differences across treatment groups. Figure S3: Hierarchical clustering and heatmap visualization of differentially expressed genes (DEGs) in intraperitoneal treatment groups. Figure S4: Hierarchical clustering and heatmap of DEGs across all treatment groups and conditions.
Author Contributions
Conceptualization, I.L.-V. and A.V.-L.; methodology, I.L.-V. and M.N.-M.; software, I.L.-V; validation, data curation, formal analysis and visualization, M.N.-M. and A.V.-L.; writing—original draft, I.L.-V. and M.N.-M.; writing—review and editing, supervision, project administration and funding acquisition, A.V.-L. All authors have read and agreed to the published version of the manuscript.
Funding
This research was supported by Secretaría de Investigación y Posgrado (SIP) - Instituto Politécnico Nacional (IPN); SIP code SIP20240926.
Institutional Review Board Statement
The animal study protocol was approved by the ENCB Bioethics Committee of the Instituto Politécnico Nacional, with license number CEI-ENCB-ZOO-021-2020.
Data Availability Statement
The raw and proceeded data from RNA-seq supporting the conclusions of this article are available on GEO (Gen Expression Omnibus)-NCBI Repository: . The raw data supporting the conclusions of this article will be made available by the authors on request.
Acknowledgments
Author Lara-Vega I. is pursuing a Doctor of Science degree at the Instituto Politécnico Nacional and received financial support from BEIFI-IPN. Nájera-Martínez M. and Vega-López A. are recipients of the Estímulos al Desempeño en Investigación and Comisión y Fomento de Actividades Académicas awards from Instituto Politécnico Nacional, and members of the Sistema Nacional de Investigadoras e Investigadores (SNII), supported by CONAHCyT, Mexico.
Conflicts of Interest
The authors declare no conflicts of interest.
Abbreviations
The following abbreviations are used in this manuscript:
| CDH1 | E-cadherin |
| FZD8 | Frizzled-8 receptor |
| TGF-β1 | Transforming growth factor beta 1 |
| CTNND1 | p120-catenin |
| LFA-1 | CD11a/CD18 integrin complex = ITGAL/ITGB2 |
| CXCL12γ | C-X-C motif chemokine ligand 12, gamma subunit |
| Claudin-2 | CLDN2 |
| PIK3CA | PI3K catalytic subunit p110α |
| AKT1 | AKT serine/threonine-protein kinase 1 |
| mTOR | Mechanistic target of rapamycin |
| ERK2 | MAPK1 protein |
| CD117 | KIT receptor |
| KITLG | Stem Cell Factor (KIT ligand) |
| KDM5B | histone demethylase |
| MITF | Microphthalmia-associated TF |
| B-RAF | B-Raf proto-oncogene serine/threonine-protein kinase |
| ERBB2 | HER2 receptor |
| HIF1A | Hypoxia-inducible factor 1-alpha |
| VEGF-A | Vascular endothelial growth factor A |
| EGF | Epidermal growth factor |
| TWIST1 | Twist-related protein 1 |
| PTGS2 | Cyclooxygenase-2 |
| PDPK1 | 3-phosphoinositide-dependent protein kinase-1 |
| NF-κB | NF-κB complex |
| GO | Gene Ontology |
| KEGG | Kyoto Encyclopedia of Genes and Genomes |
| Reactome | Reactome Pathway Database |
| GSEA | Gene Set Enrichment Analysis |
References
- Schadendorf D, Fisher DE, Garbe C, Gershenwald JE, Grob J-J, Halpern A, et al. Melanoma. Nat Rev Dis Primers 2015;1:15003. [CrossRef]
- Wang X, Ma S, Zhu S, Zhu L, Guo W. Advances in Immunotherapy and Targeted Therapy of Malignant Melanoma. Biomedicines 2025;13:225. [CrossRef]
- Lara-Vega I, Vega-López A. Combinational photodynamic and photothermal - based therapies for melanoma in mouse models. Photodiagnosis Photodyn Ther 2023;43:103596. [CrossRef]
- Lara-Vega I. Upgrading Melanoma Treatment: Promising Immunotherapies Combinations in the Preclinical Mouse Model. Curr Cancer Ther Rev 2024;20:489–509. [CrossRef]
- Lara-Vega I, Correa-Lara MVM, Vega-López A. Effectiveness of radiotherapy and targeted radionuclide therapy for melanoma in preclinical mouse models: A combination treatments overview. Bull Cancer 2023. [CrossRef]
- Aszalos A, Grimley PM, Balint E, Chadha KC, Ambrus JL. On the mechanism of action of interferons: interaction with nonsteroidal anti-inflammatory agents, pentoxifylline (Trental) and cGMP inducers. J Med 1991;22:255–71.
- Inacio MD, Costa MC, Lima TFO, Figueiredo ID, Motta BP, Spolidorio LC, et al. Pentoxifylline mitigates renal glycoxidative stress in obese mice by inhibiting AGE/RAGE signaling and increasing glyoxalase levels. Life Sci 2020;258:118196. [CrossRef]
- Kulcu Cakmak S, Cakmak A, Gonul M, Kilic A, Gul U. Pentoxifylline Use in Dermatology. Inflammation & Allergy-Drug Targets 2012;11:422–32. [CrossRef]
- Zhou J, Ren Y, Tan L, Song X, Wang M, Li Y, et al. Norcantharidin: research advances in pharmaceutical activities and derivatives in recent years. Biomedicine & Pharmacotherapy 2020;131:110755. [CrossRef]
- Zeng B, Chen X, Zhang L, Gao X, Gui Y. Norcantharidin in cancer therapy – a new approach to overcoming therapeutic resistance: A review. Medicine 2024;103:e37394. [CrossRef]
- Correa-Lara MVM, Lara-Vega I, Nájera-Martínez M, Domínguez-López ML, Reyes-Maldonado E, Vega-López A. Tumor-Infiltrating iNKT Cells Activated through c-Kit/Sca-1 Are Induced by Pentoxifylline, Norcantharidin, and Their Mixtures for Killing Murine Melanoma Cells. Pharmaceuticals 2023;16:1472. [CrossRef]
- González-Quiroz JL, Ocampo-Godínez JM, Hernández-González VN, Lezama RA, Reyes-Maldonado E, Vega-López A, et al. Pentoxifylline and Norcantharidin Modify p62 Expression in 2D and 3D Cultures of B16F1 Cells. Int J Mol Sci 2024;25:5140. [CrossRef]
- Chen F, Wang S, Wei Y, Wu J, Huang G, Chen J, et al. Norcantharidin modulates the miR-30a/Metadherin/AKT signaling axis to suppress proliferation and metastasis of stromal tumor cells in giant cell tumor of bone. Biomedicine & Pharmacotherapy 2018;103:1092–100. [CrossRef]
- Madera-Sandoval RL, Tóvári J, Lövey J, Ranđelović I, Jiménez-Orozco A, Hernández-Chávez VG, et al. Combination of pentoxifylline and α-galactosylceramide with radiotherapy promotes necro-apoptosis and leukocyte infiltration and reduces the mitosis rate in murine melanoma. Acta Histochem 2019;121:680–9. [CrossRef]
- Martínez-Razo G, Pires PC, Avilez-Colin A, Domínguez-López ML, Veiga F, Conde-Vázquez E, et al. Evaluation of a Norcantharidin Nanoemulsion Efficacy for Treating B16F1-Induced Melanoma in a Syngeneic Murine Model. Int J Mol Sci 2025;26:1215. [CrossRef]
- Mahdi AF, Ashfield N, Crown J, Collins DM. Pre-Clinical Rationale for Amcenestrant Combinations in HER2+/ER+ Breast Cancer. Int J Mol Sci 2025;26. [CrossRef]
- Smith LK, Sheppard KE, McArthur GA. Is resistance to targeted therapy in cancer inevitable? Cancer Cell 2021;39:1047–9. [CrossRef]
- Jabbarzadeh Kaboli P, Ismail P, Ling K-H. Molecular modeling, dynamics simulations, and binding efficiency of berberine derivatives: A new group of RAF inhibitors for cancer treatment. PLoS One 2018;13:e0193941. [CrossRef]
- Yang H, Rudge DG, Koos JD, Vaidialingam B, Yang HJ, Pavletich NP. mTOR kinase structure, mechanism and regulation. Nature 2013;497:217–23. [CrossRef]
- Vadas O, Burke JE, Zhang X, Berndt A, Williams RL. Structural Basis for Activation and Inhibition of Class I Phosphoinositide 3-Kinases. Sci Signal 2011;4. [CrossRef]
- McDonough MA, Li V, Flashman E, Chowdhury R, Mohr C, Liénard BMR, et al. Cellular oxygen sensing: Crystal structure of hypoxia-inducible factor prolyl hydroxylase (PHD2). Proceedings of the National Academy of Sciences 2006;103:9814–9. [CrossRef]
- Nájera-Martínez M, Lara-Vega I, Avilez-Alvarado J, Pagadala NS, Dzul-Caamal R, Domínguez-López ML, et al. The Generation of ROS by Exposure to Trihalomethanes Promotes the IκBα/NF-κB/p65 Complex Dissociation in Human Lung Fibroblast. Biomedicines 2024;12:2399. [CrossRef]
- Yu Y, Wan Y, Huang C. The Biological Functions of NF-kappaB1 (p50) and its Potential as an Anti-Cancer Target. Curr Cancer Drug Targets 2009;9:566–71. [CrossRef]
- Anderson MG, Smith RS, Hawes NL, Zabaleta A, Chang B, Wiggs JL, et al. Mutations in genes encoding melanosomal proteins cause pigmentary glaucoma in DBA/2J mice. Nat Genet 2002;30:81–5. [CrossRef]
- Weinzweig J, Tattini C, Lynch S, Zienowicz R, Weinzweig N, Spangenberger A, et al. Investigation of the Growth and Metastasis of Malignant Melanoma in a Murine Model: The Role of Supplemental Vitamin A. Plast Reconstr Surg 2003;112:152–8. [CrossRef]
- Overwijk WW, Restifo NP. B16 as a Mouse Model for Human Melanoma. Curr Protoc Immunol 2000;39. [CrossRef]
- Champiat S, Tselikas L, Farhane S, Raoult T, Texier M, Lanoy E, et al. Intratumoral Immunotherapy: From Trial Design to Clinical Practice. Clinical Cancer Research 2021;27:665–79. [CrossRef]
- Levy C, Khaled M, Fisher DE. MITF: master regulator of melanocyte development and melanoma oncogene. Trends Mol Med 2006;12:406–14. [CrossRef]
- Hoek KS, Eichhoff OM, Schlegel NC, Döbbeling U, Kobert N, Schaerer L, et al. In vivo Switching of Human Melanoma Cells between Proliferative and Invasive States. Cancer Res 2008;68:650–6. [CrossRef]
- Ribas A, Flaherty KT. BRAF targeted therapy changes the treatment paradigm in melanoma. Nat Rev Clin Oncol 2011;8:426–33. [CrossRef]
- Chamcheu J, Roy T, Uddin M, Banang-Mbeumi S, Chamcheu R-C, Walker A, et al. Role and Therapeutic Targeting of the PI3K/Akt/mTOR Signaling Pathway in Skin Cancer: A Review of Current Status and Future Trends on Natural and Synthetic Agents Therapy. Cells 2019;8:803. [CrossRef]
- Rozeman EA, Dekker TJA, Haanen JBAG, Blank CU. Advanced Melanoma: Current Treatment Options, Biomarkers, and Future Perspectives. Am J Clin Dermatol 2018;19:303–17. [CrossRef]
- Marabelle A, Tselikas L, de Baere T, Houot R. Intratumoral immunotherapy: using the tumor as the remedy. Annals of Oncology 2017;28:xii33–43. [CrossRef]
- Rajasekaran S, Cheng S, Gajendran N, Shekoohi S, Chesnokova L, Yu X, et al. Transcriptomic analysis of melanoma cells reveals an association of α-synuclein with regulation of the inflammatory response. Sci Rep 2024;14:27140. [CrossRef]
- Yan G, Shi L, Zhang F, Luo M, Zhang G, Liu P, et al. Transcriptomic analysis of mechanism of melanoma cell death induced by photothermal therapy. J Biophotonics 2021;14:e202100034. [CrossRef]
- Li Q, Li Z, Luo T, Shi H. Targeting the PI3K/AKT/mTOR and RAF/MEK/ERK pathways for cancer therapy. Molecular Biomedicine 2022;3:47. [CrossRef]
- Qi X, Chen Y, Liu S, Liu L, Yu Z, Yin L, et al. Sanguinarine inhibits melanoma invasion and migration by targeting the FAK/PI3K/AKT/mTOR signalling pathway. Pharm Biol 2023;61:696–709. [CrossRef]
- Ferreira L, Dos Santos R, Oliva G, Andricopulo A. Molecular Docking and Structure-Based Drug Design Strategies. Molecules 2015;20:13384–421. [CrossRef]
- Lara-Vega I, Vega-López A. Molecular Docking Simulations of Protoporphyrin IX, Chlorin e6, and Methylene Blue for Target Proteins of Viruses Causing Skin Lesions: Monkeypox and HSV. Lett Drug Des Discov 2024;21:2939–57. [CrossRef]
- Savoia P, Cremona O, Fava P. New Perspectives in the Pharmacological Treatment of Non-Melanoma Skin Cancer. Curr Drug Targets 2016;17:353–74. [CrossRef]
- EUR-Lex. THE EUROPEAN PARLIAMENT AND THE COUNCIL OF THE EUROPEAN UNION. Directive 2010/63/EU of the European Parliament and of the Council of 22 September 2010 on the protection of animals used for scientific purposes Text with EEA relevance. Official Journal of the European Union 2010:33–79.
- Martínez-Razo G, Domínguez-López ML, de la Rosa JM, Fabila-Bustos DA, Reyes-Maldonado E, Conde-Vázquez E, et al. Norcantharidin toxicity profile: an in vivo murine study. Naunyn Schmiedebergs Arch Pharmacol 2023;396:99–108. [CrossRef]
- Tomayko MM, Reynolds CP. Determination of subcutaneous tumor size in athymic (nude) mice. Cancer Chemother Pharmacol 1989;24:148–54. [CrossRef]
- Andrews S. FastQC: a quality control tool for high throughput sequence data 2010.
- Bolger AM, Lohse M, Usadel B. Trimmomatic: a flexible trimmer for Illumina sequence data. Bioinformatics 2014;30:2114–20. [CrossRef]
- Dobin A, Davis CA, Schlesinger F, Drenkow J, Zaleski C, Jha S, et al. STAR: ultrafast universal RNA-seq aligner. Bioinformatics 2013;29:15–21. [CrossRef]
- Love MI, Huber W, Anders S. Moderated estimation of fold change and dispersion for RNA-seq data with DESeq2. Genome Biol 2014;15:550. [CrossRef]
- Yu G, Wang L-G, Han Y, He Q-Y. clusterProfiler: an R Package for Comparing Biological Themes Among Gene Clusters. OMICS 2012;16:284–7. [CrossRef]
- R Foundation for Statistical Computing VAustria. R: A language and environment for statistical ## computing. 2021.
- Posit Team / Software PBMA. RStudio: Integrated Development Environment for R. 2025.
- Schneider CA, Rasband WS, Eliceiri KW. NIH Image to ImageJ: 25 years of image analysis. Nat Methods 2012;9:671–5. [CrossRef]
- Kim S, Chen J, Cheng T, Gindulyte A, He J, He S, et al. PubChem 2025 update. Nucleic Acids Res 2025;53:D1516–25. [CrossRef]
- Berman HM. The Protein Data Bank. Nucleic Acids Res 2000;28:235–42. [CrossRef]
- Lara-Vega I, Vega-López A. Mapping immunogenic epitopes of F13L protein in Mpox Clade Ib: HLA-B*08 and HLA-DRB1*01 as predictors of antigen presentation, disease incidence, and lethality. Gene Rep 2025;40:102232. [CrossRef]
Figure 1.
Tumor growth. (a) Schematic representation of the experimental timeline. On day 0 (D0), B16-F1 melanoma cells were subcutaneously injected into the right flank of mice. Treatments were administered starting on day 6 (D6), according to the indicated schedule. Mice were euthanized on day 14 (D14) for final analysis. (b) Relative tumor volume progression over time in seven experimental groups treated via intraperitoneal administration: CONTROL, PTX 60 mg/kg, PTX 30 mg/kg, NCTD 3 mg/kg, PTX 60 mg/kg + NCTD 3 mg/kg, PTX 60 mg/kg + NCTD 0.75 mg/kg, and NCTD 0.75 mg/kg. (c) Relative tumor volume progression over time in four experimental groups treated via intratumoral administration: CONTROL, PTX 60 mg/kg, NCTD 3 mg/kg, and PTX 60 mg/kg + NCTD 3 mg/kg. In both panels, each point represents the mean ± SD of six replicates per group. Comparisons were performed on D14. Additionally, body weight was monitored throughout the experiment for both administration routes as an indicator of general health and treatment-related toxicity. Statistical analysis was conducted using ANOVA followed by Tukey’s post hoc test. Asterisks indicate significant differences versus CONTROL (*p < 0.05; **p < 0.01; ***p < 0.001).
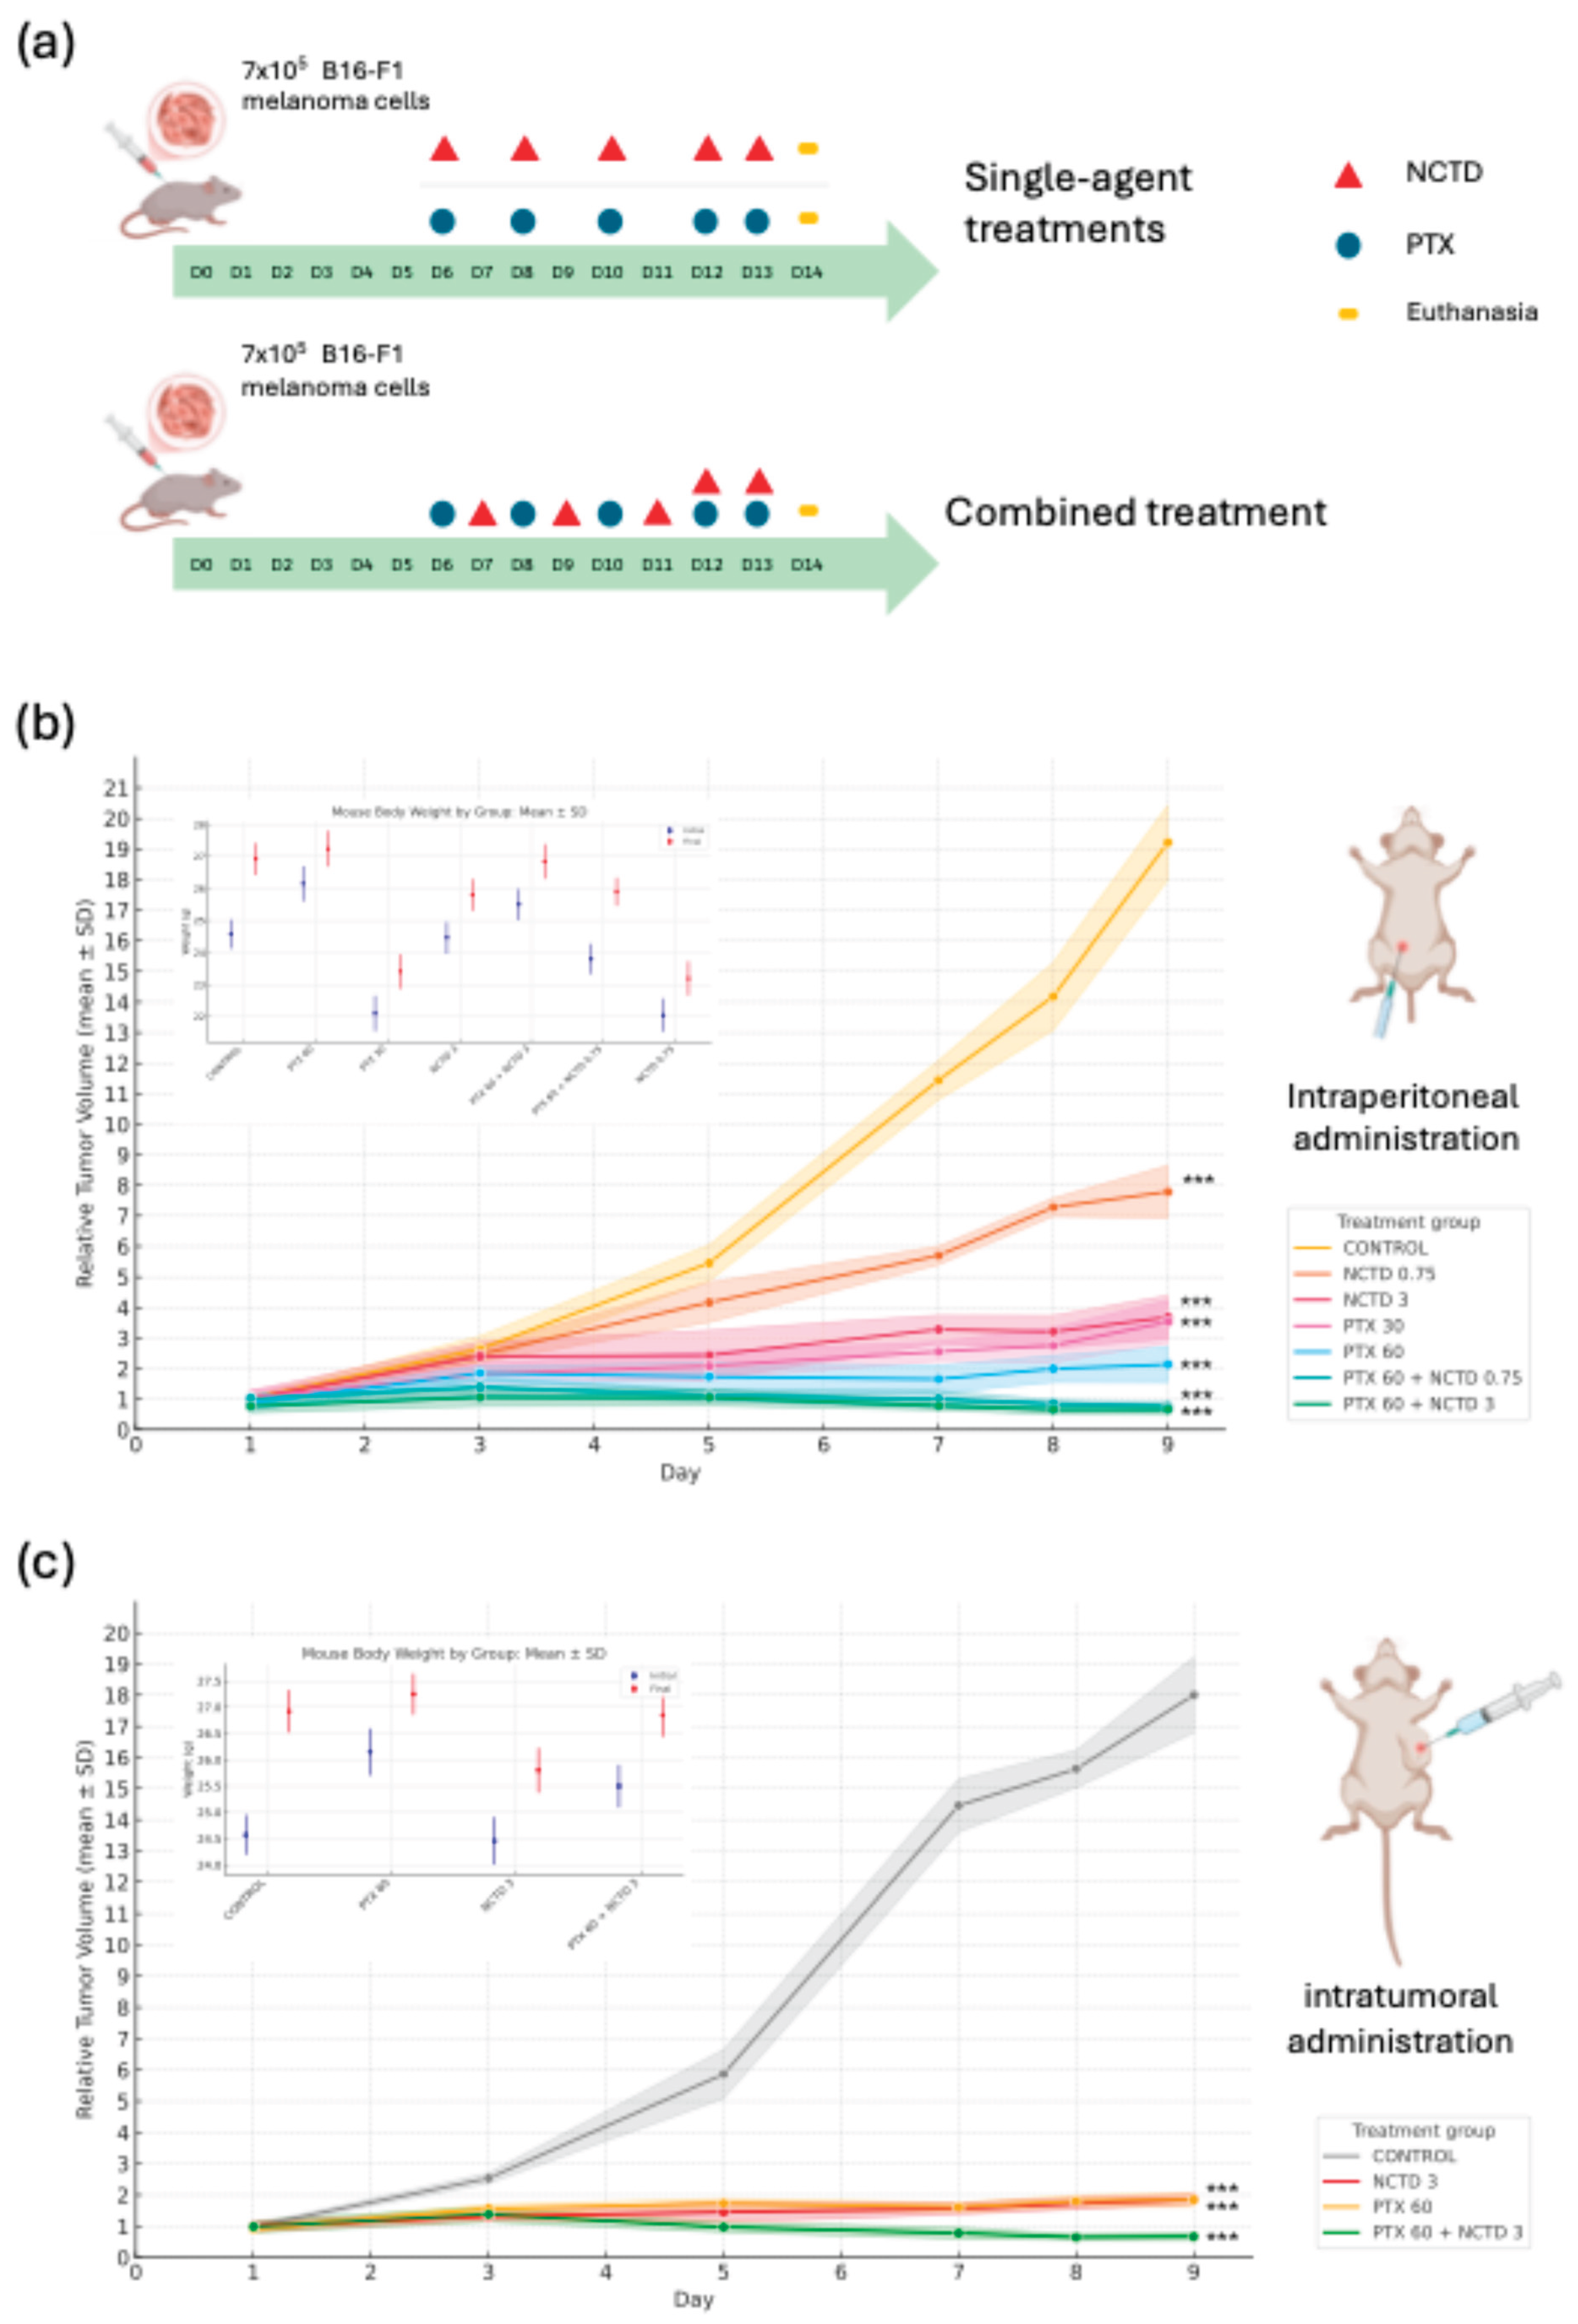
Figure 2.
Representative photographs of tumors excised from melanoma-bearing mice (D14), illustrating tumor size differences across treatment groups at day 9 after treatment; treatments were administered intratumorally with n = 6 mice per group. The groups include CONTROL (untreated), PTX (Pentoxifylline, 60 mg/kg), NCTD (Norcantharidin, 3 mg/kg), and PTX+NCTD (combined treatment at the same doses).
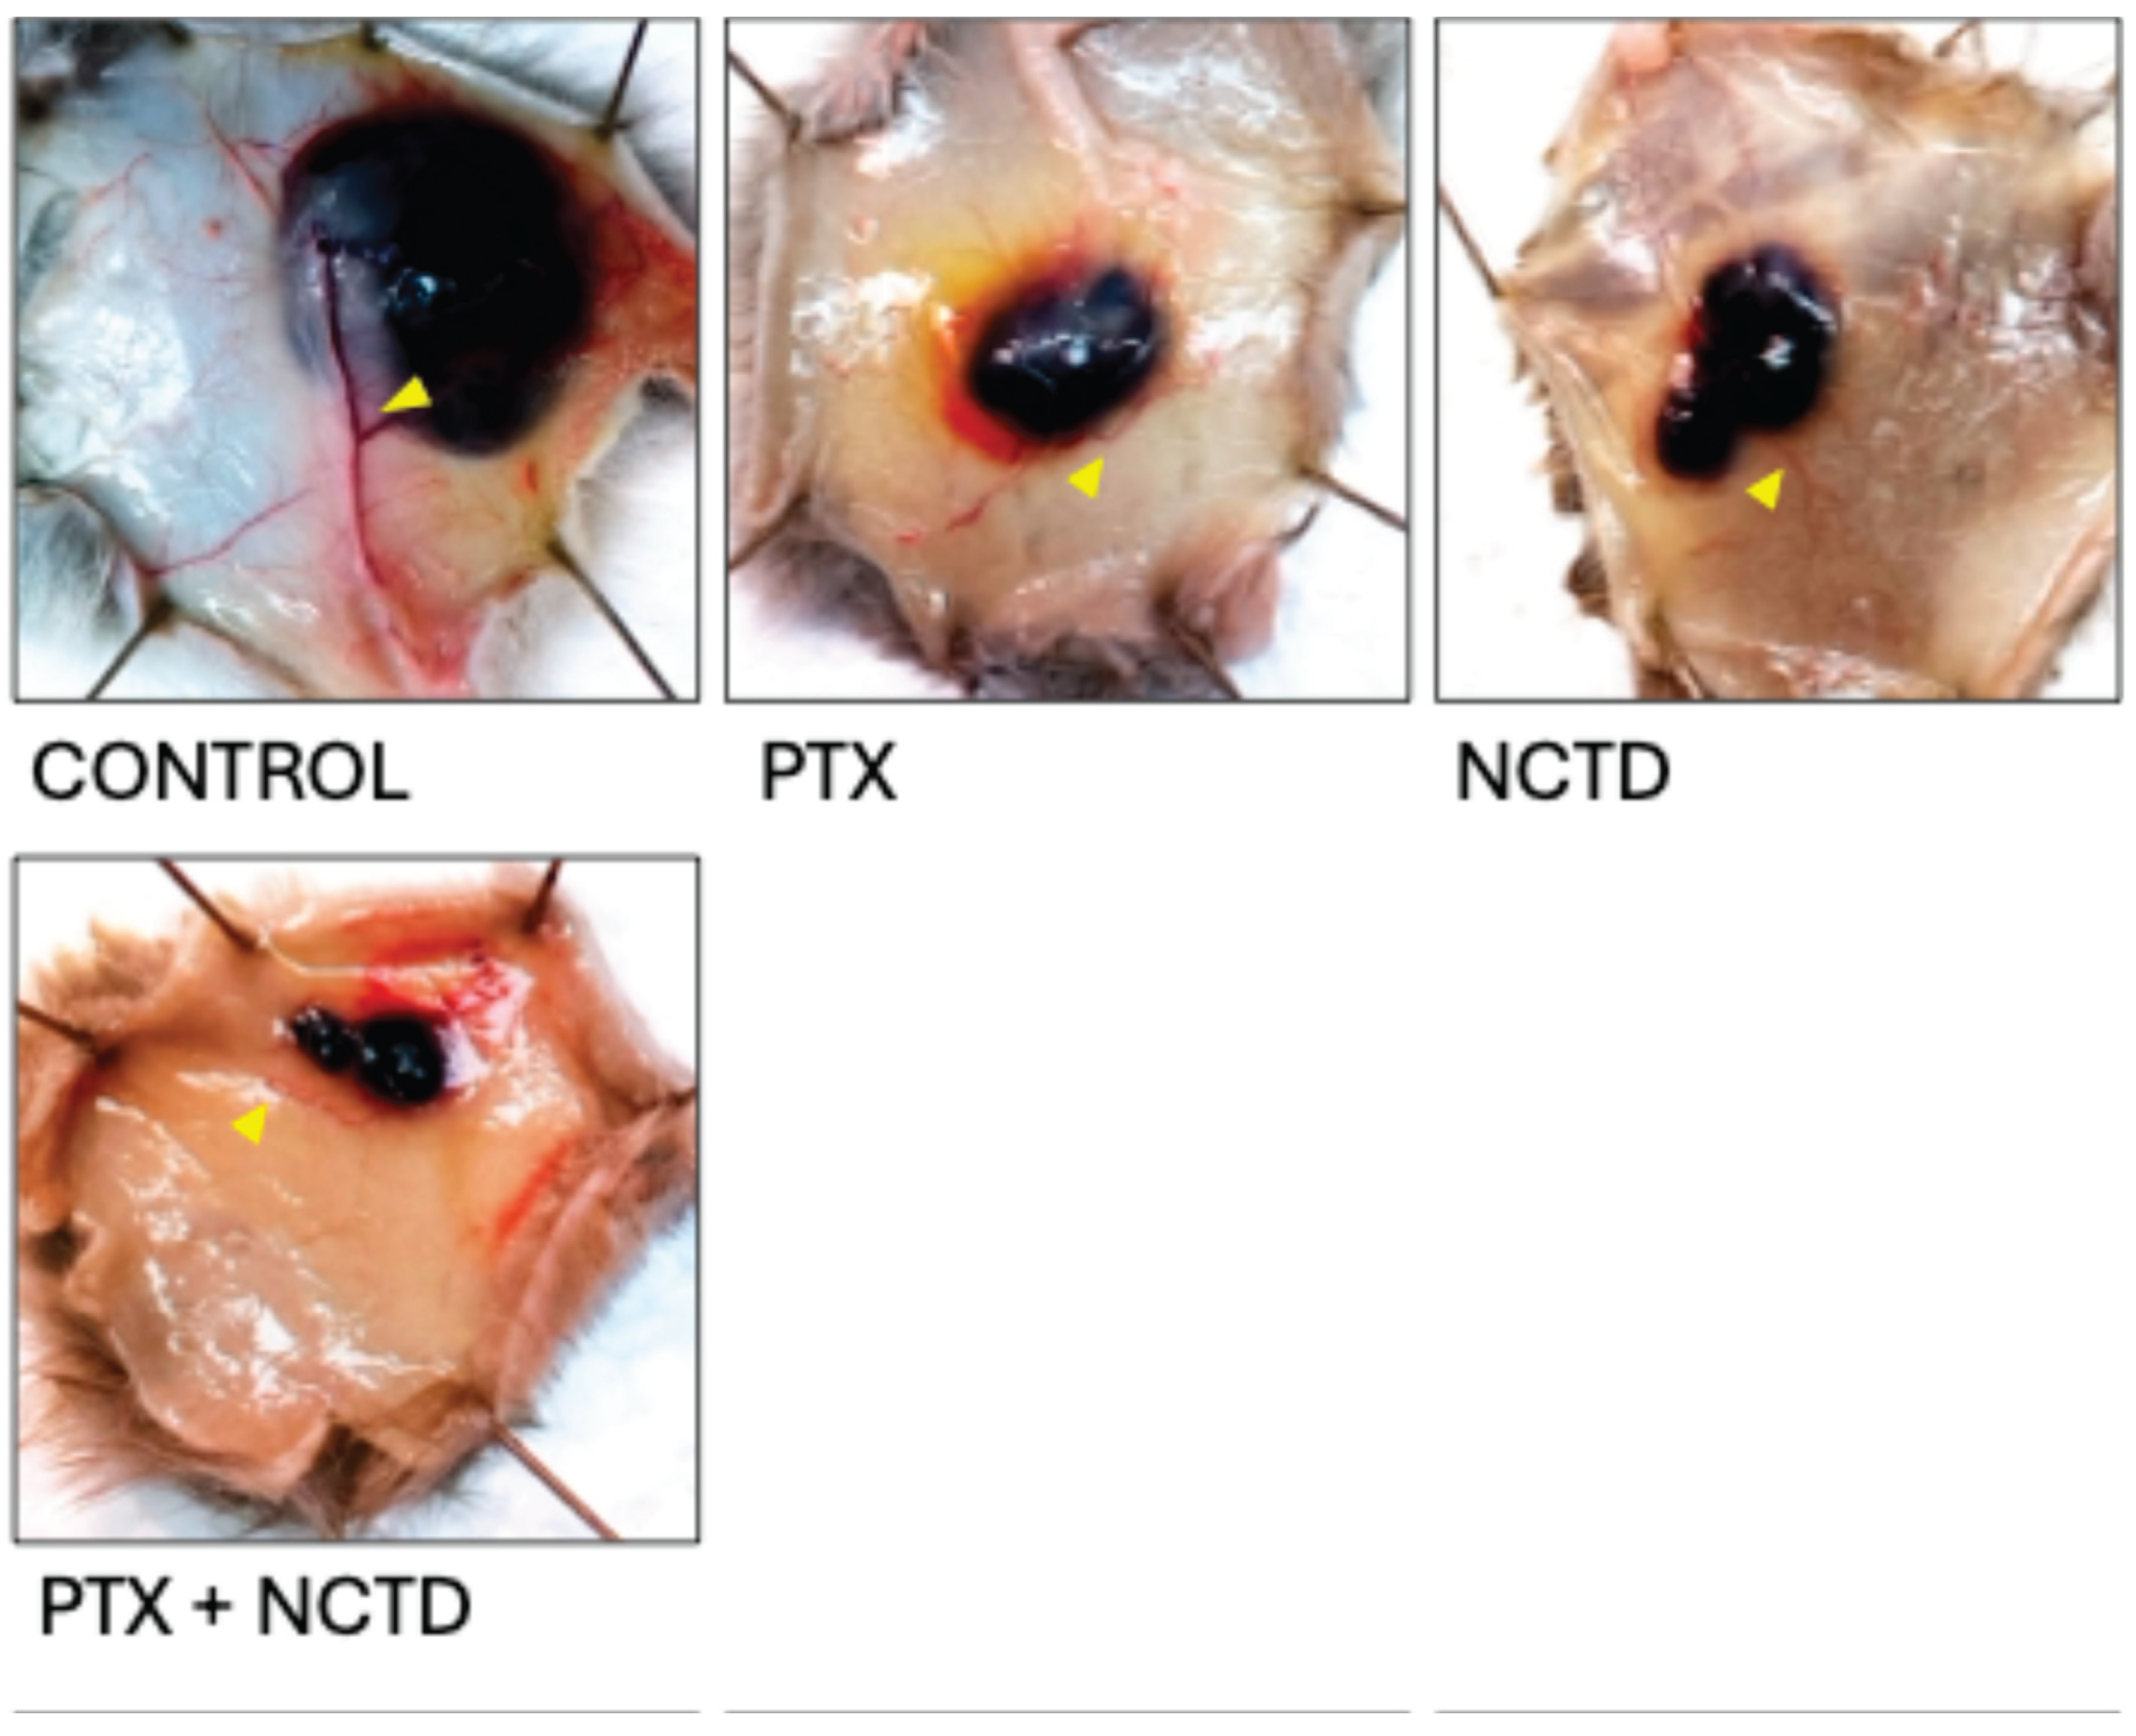
Figure 3.
Regulation of MITF expression in melanoma tumors following treatment. (a) Quantification of MITF expression levels in tumor tissues by calculating the MITF/DAPI fluorescence ratio. Treatments with PTX 30 mg/kg, PTX 60 mg/kg, PTX 60 mg/kg + NCTD 0.75 mg/kg, and PTX 60 mg/kg + NCTD 3 mg/kg significantly increased MITF expression compared to the CONTROL group (*p < 0.05, **p < 0.01, ***p < 0.001). (b) Representative immunofluorescence merge images at 10× magnification showing MITF staining (magenta/pink signal) in tumor sections from each treatment group. For each sample, three regions of interest were analyzed per tumor section, resulting in 18 data points per group (n = 6 mice). Nuclei were counterstained with DAPI (blue).
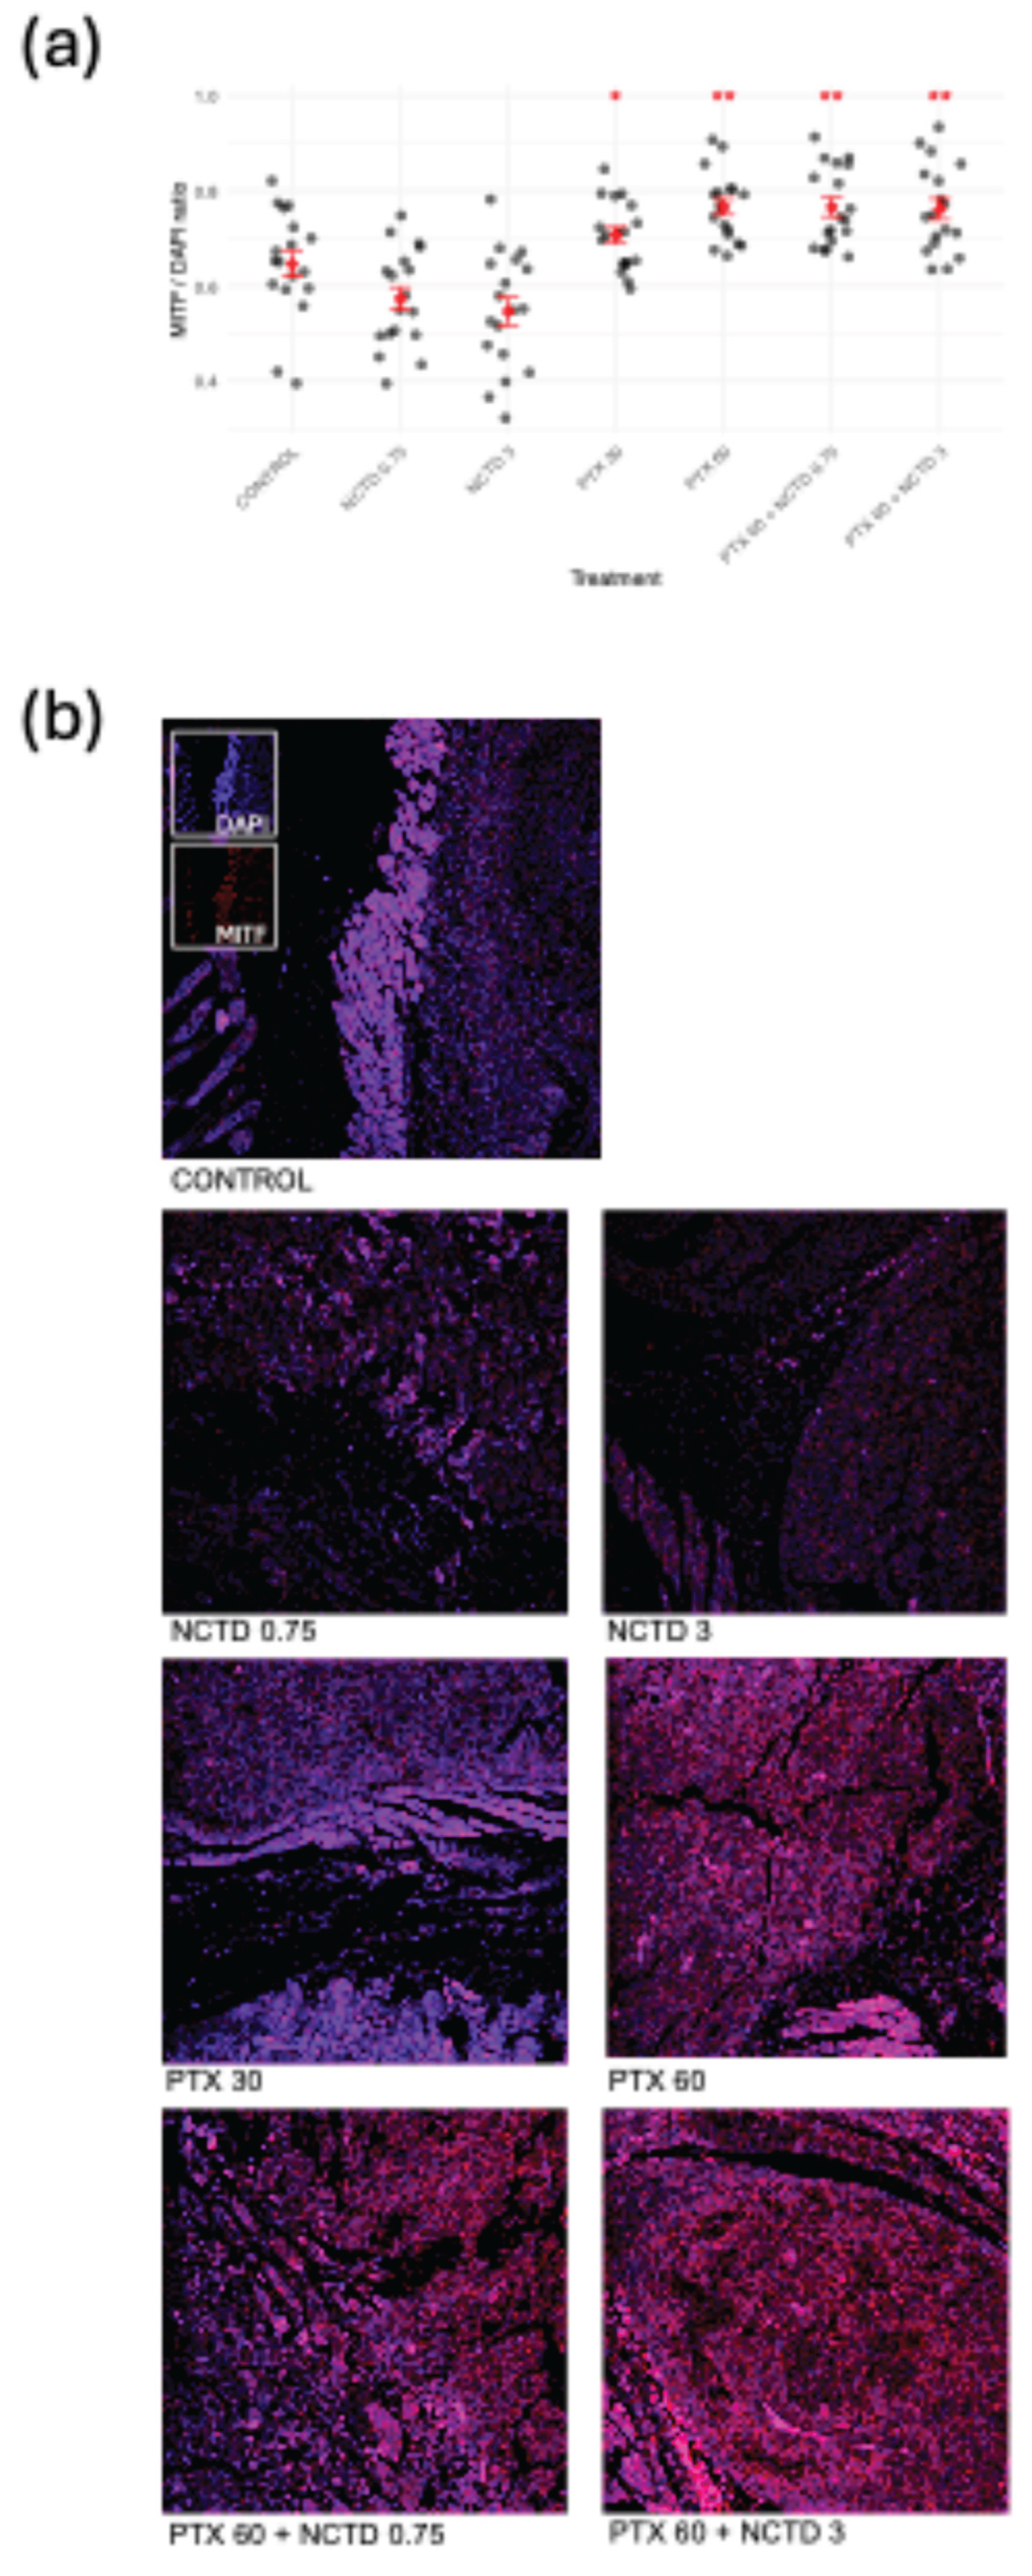
Figure 4.
Effects of treatments on the expression and activation of key signaling proteins in melanoma tumors. Quantification of total protein expression (protein/DAPI ratio, upper graphs in each panel) and phosphorylation status (phosphorylated protein/total protein ratio, lower graphs in each panel) for (a) ERBB2, (b) BRAF, (c) PI3K, (d) AKT1, and (e) mTOR. Representative immunofluorescence images at 10× magnification (located below each corresponding ratio graph) illustrate protein localization and relative fluorescence intensity in tumor sections from CONTROL and combined treatment (PTX 60 mg/kg + NCTD 3mg/kg). For each sample, three regions of interest were analyzed per tumor section, resulting in 18 data points per group (n = 6 mice). Results are presented as mean ± SD. Statistical analysis was performed using ANOVA followed by Tukey’s post hoc test. Asterisks indicate significant differences versus CONTROL (*p < 0.05; **p < 0.01; ***p < 0.001). Nuclei were counterstained with DAPI (blue).
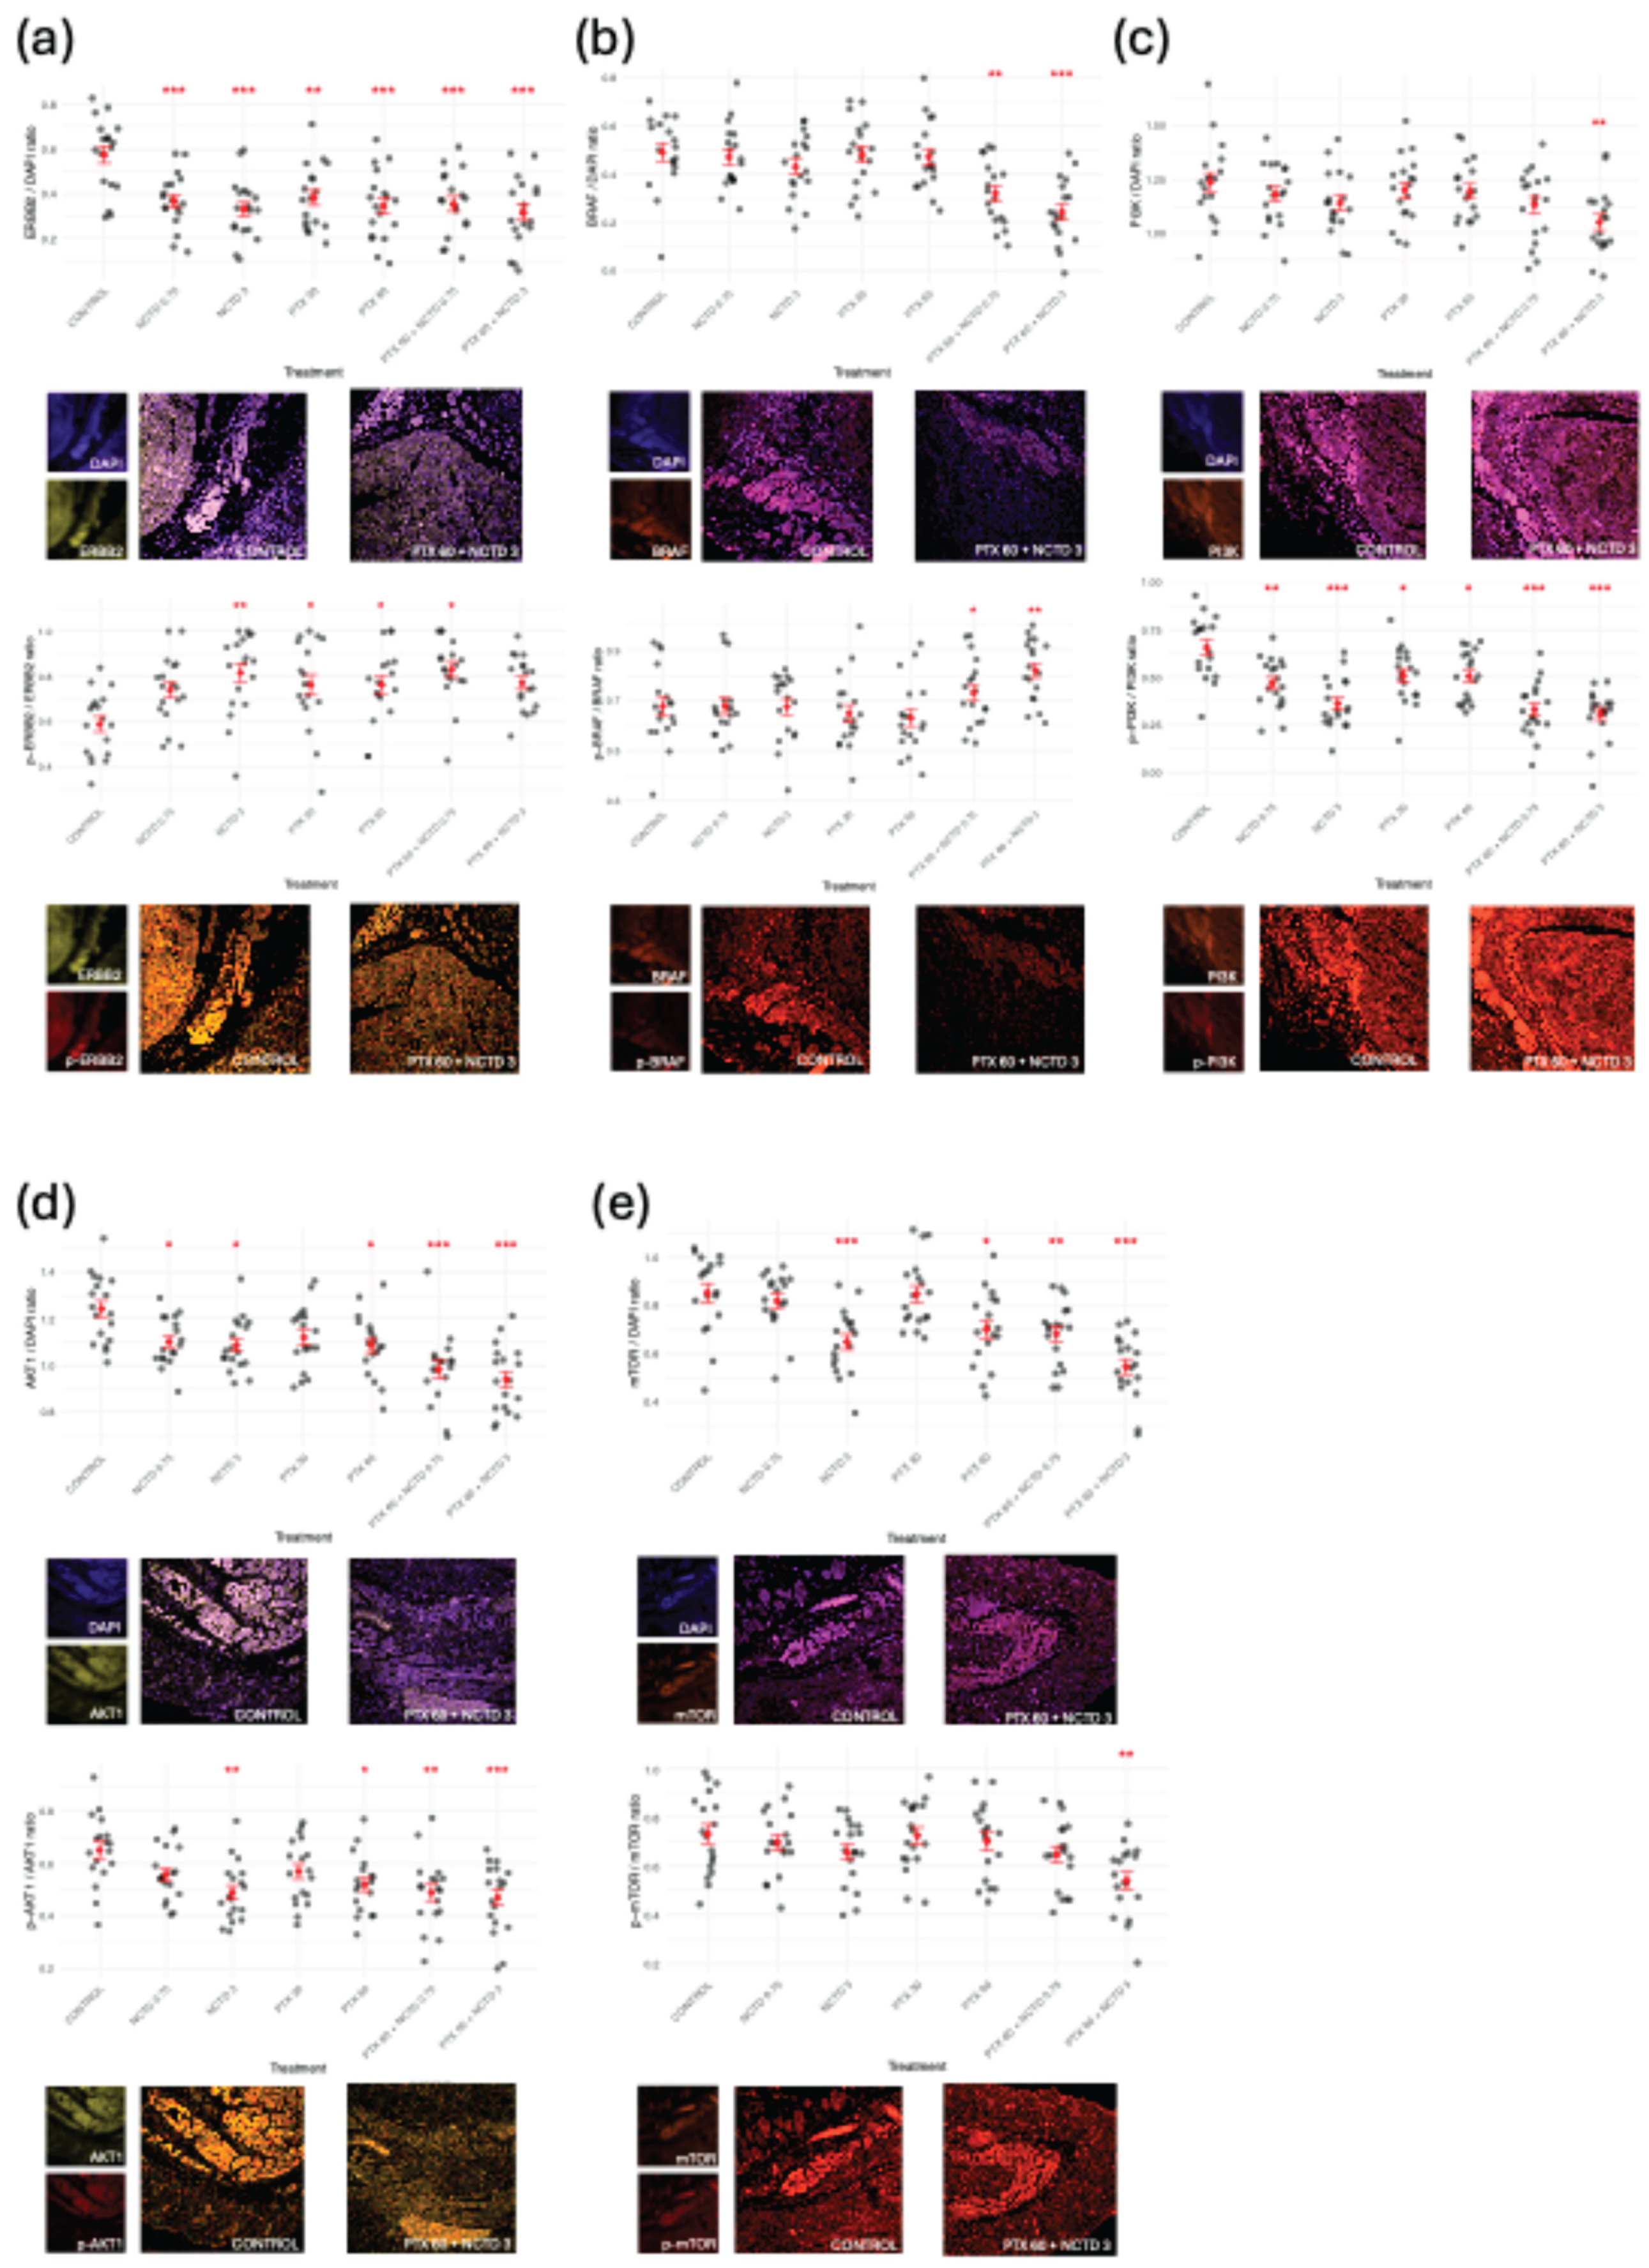
Figure 5.
Differentially expressed genes (DEGs) identified by RNA-seq analysis across treatments and administration routes. Venn diagrams showing the number of DEGs in tumor tissues from mice treated via intraperitoneal (left) or intratumoral (right) routes, compared to their respective controls (CONTROL_IP and CONTROL_IT). Each treatment group includes PTX, NCTD, and MIX (PTX + NCTD). The lower panel shows the overlap of DEGs between MIX_IP vs CONTROL_IP and MIX_IT vs CONTROL_IT comparisons, highlighting commonly regulated genes by the combination therapy regardless of the administration route.
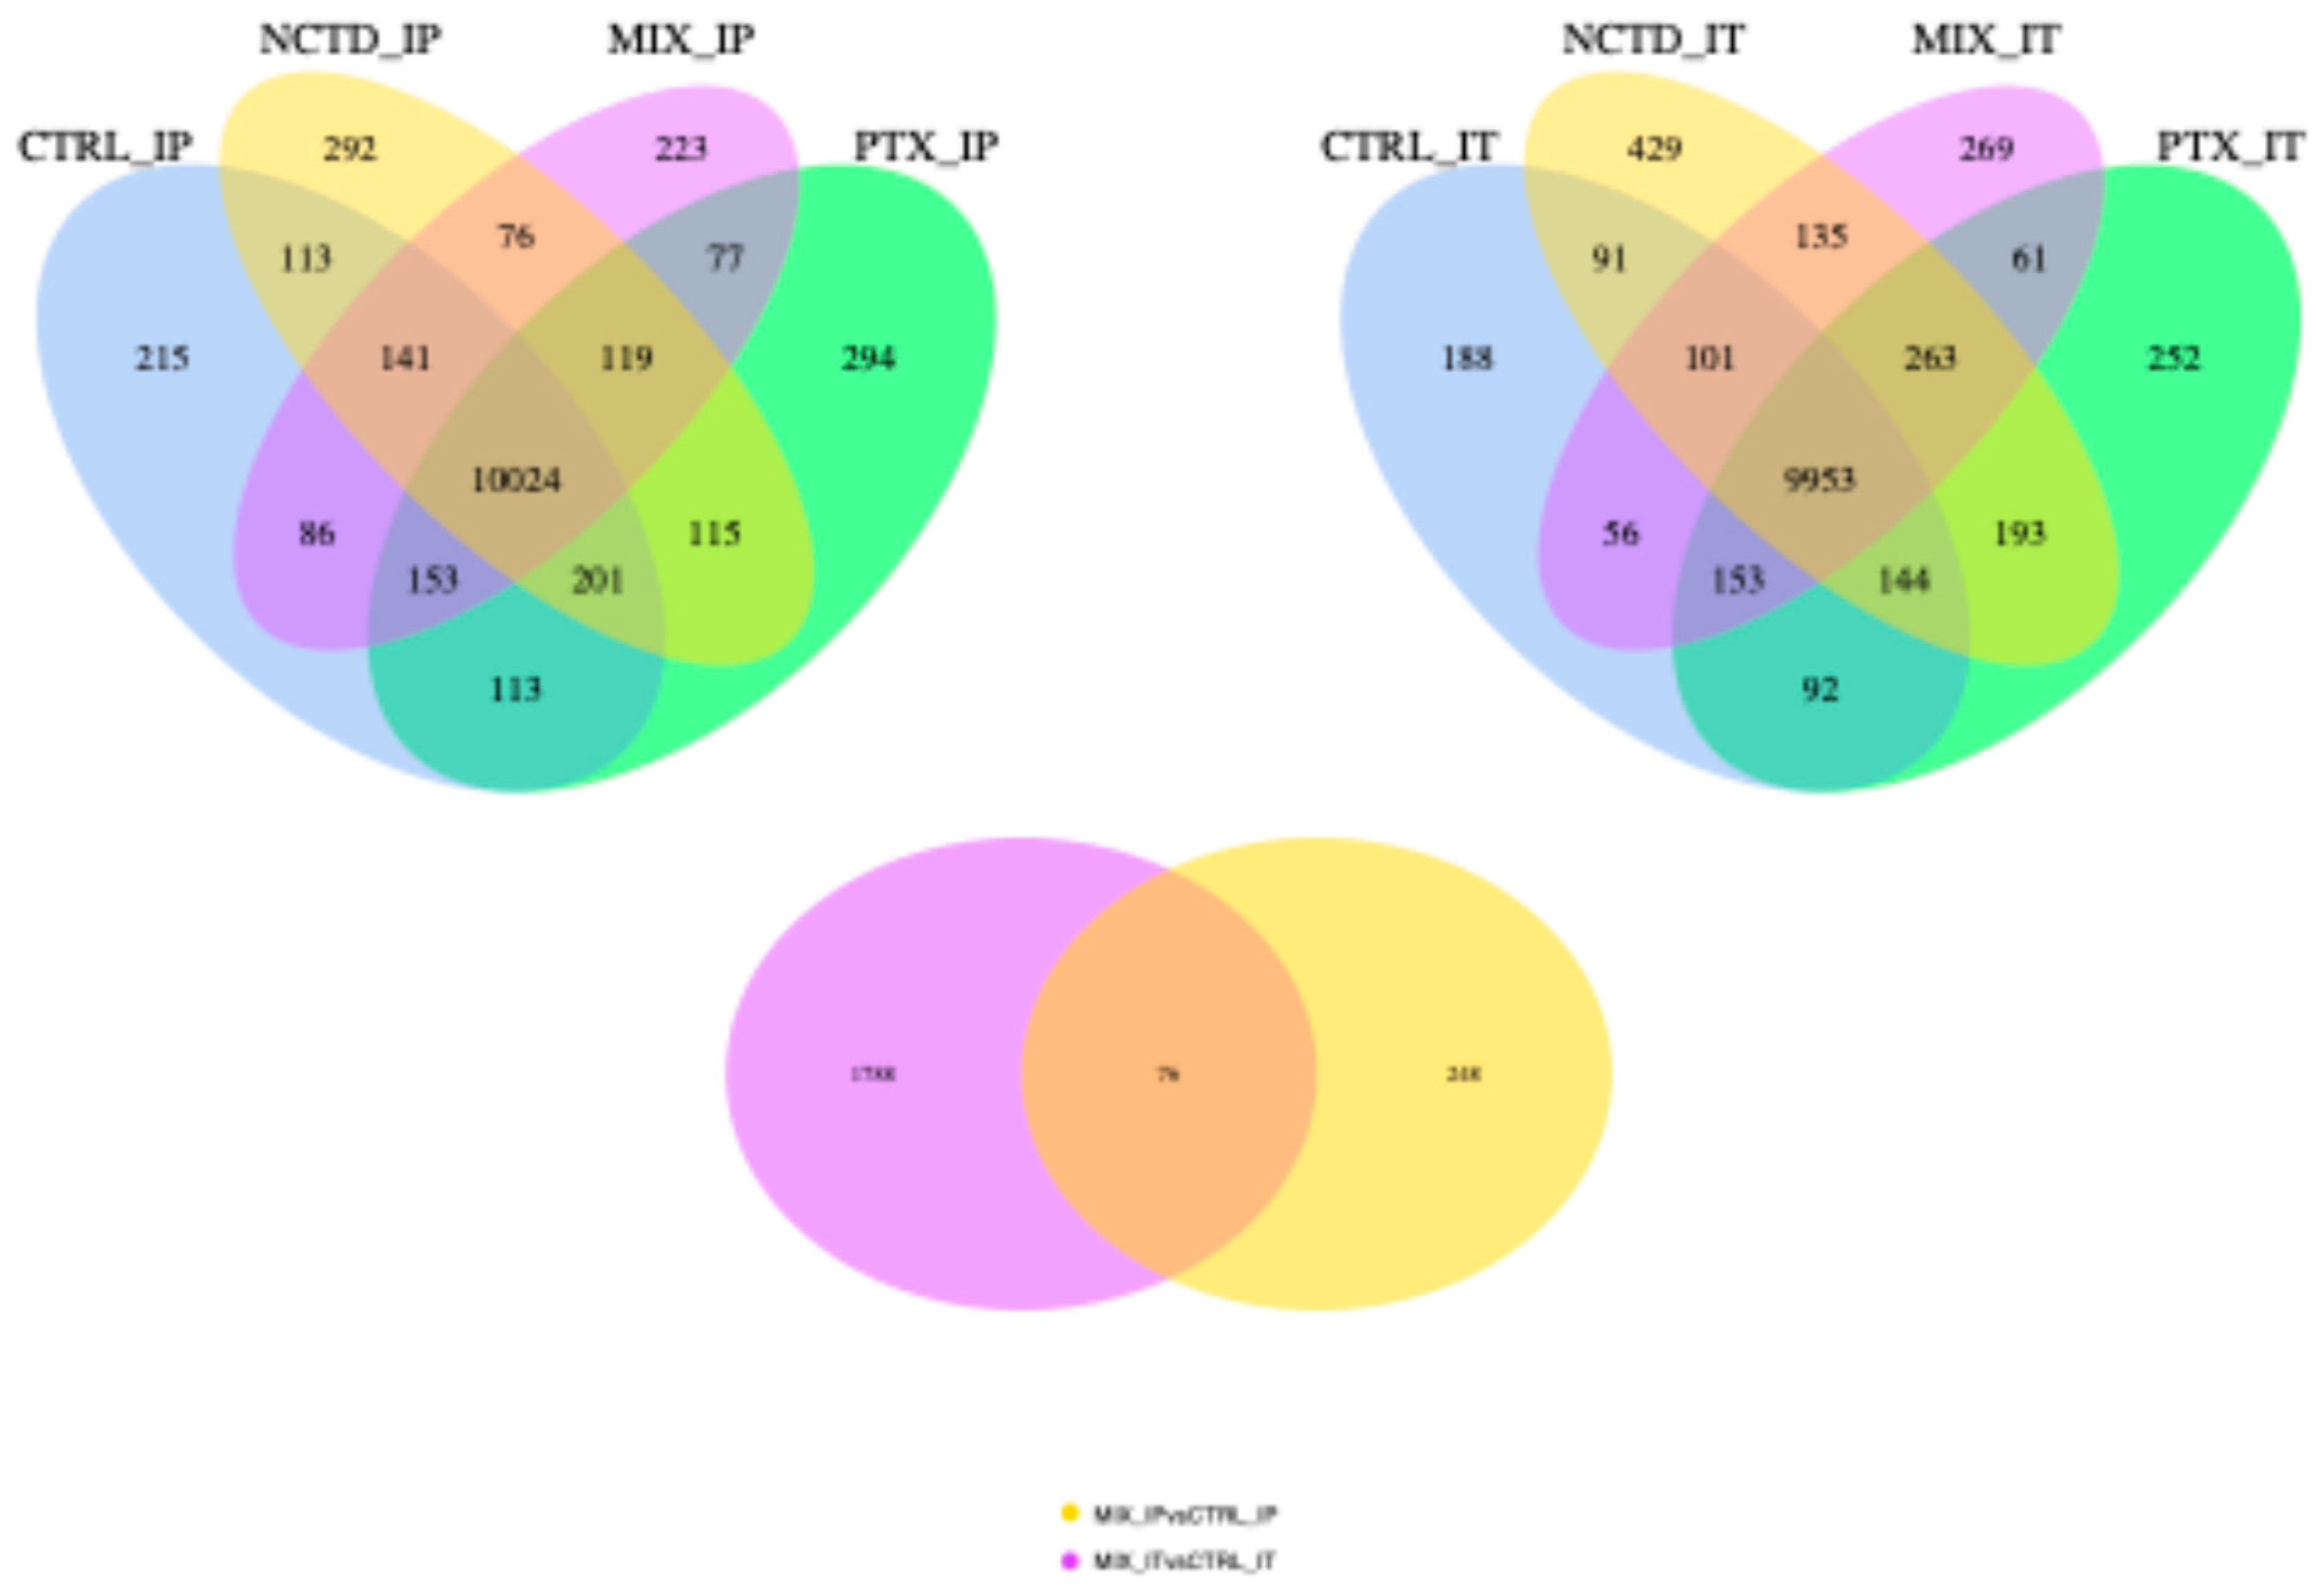
Figure 6.
Volcano plots illustrating differential gene expression profiles for each treatment versus control. (a) Intraperitoneal administration groups: PTX_IP vs CONTROL_IP (243 DEGs), NCTD_IP vs CONTROL_IP (288 DEGs), and MIX_IP vs CONTROL_IP (324 DEGs). (b) Intratumoral administration groups: PTX_IT vs CONTROL_IT (1,070 DEGs), NCTD_IT vs CONTROL_IT (3,233 DEGs), and MIX_IT vs CONTROL_IT (1,864 DEGs). Each plot displays log2 fold change (x-axis) versus –log10 adjusted p-value (y-axis). Red dots represent significantly upregulated genes, green dots indicate significantly downregulated genes (adjusted p < 0.05, |log2FC| > threshold), and blue dots represent non-significant genes. In each plot, the upper right panel shows the labels of representative differentially expressed genes to facilitate visualization.
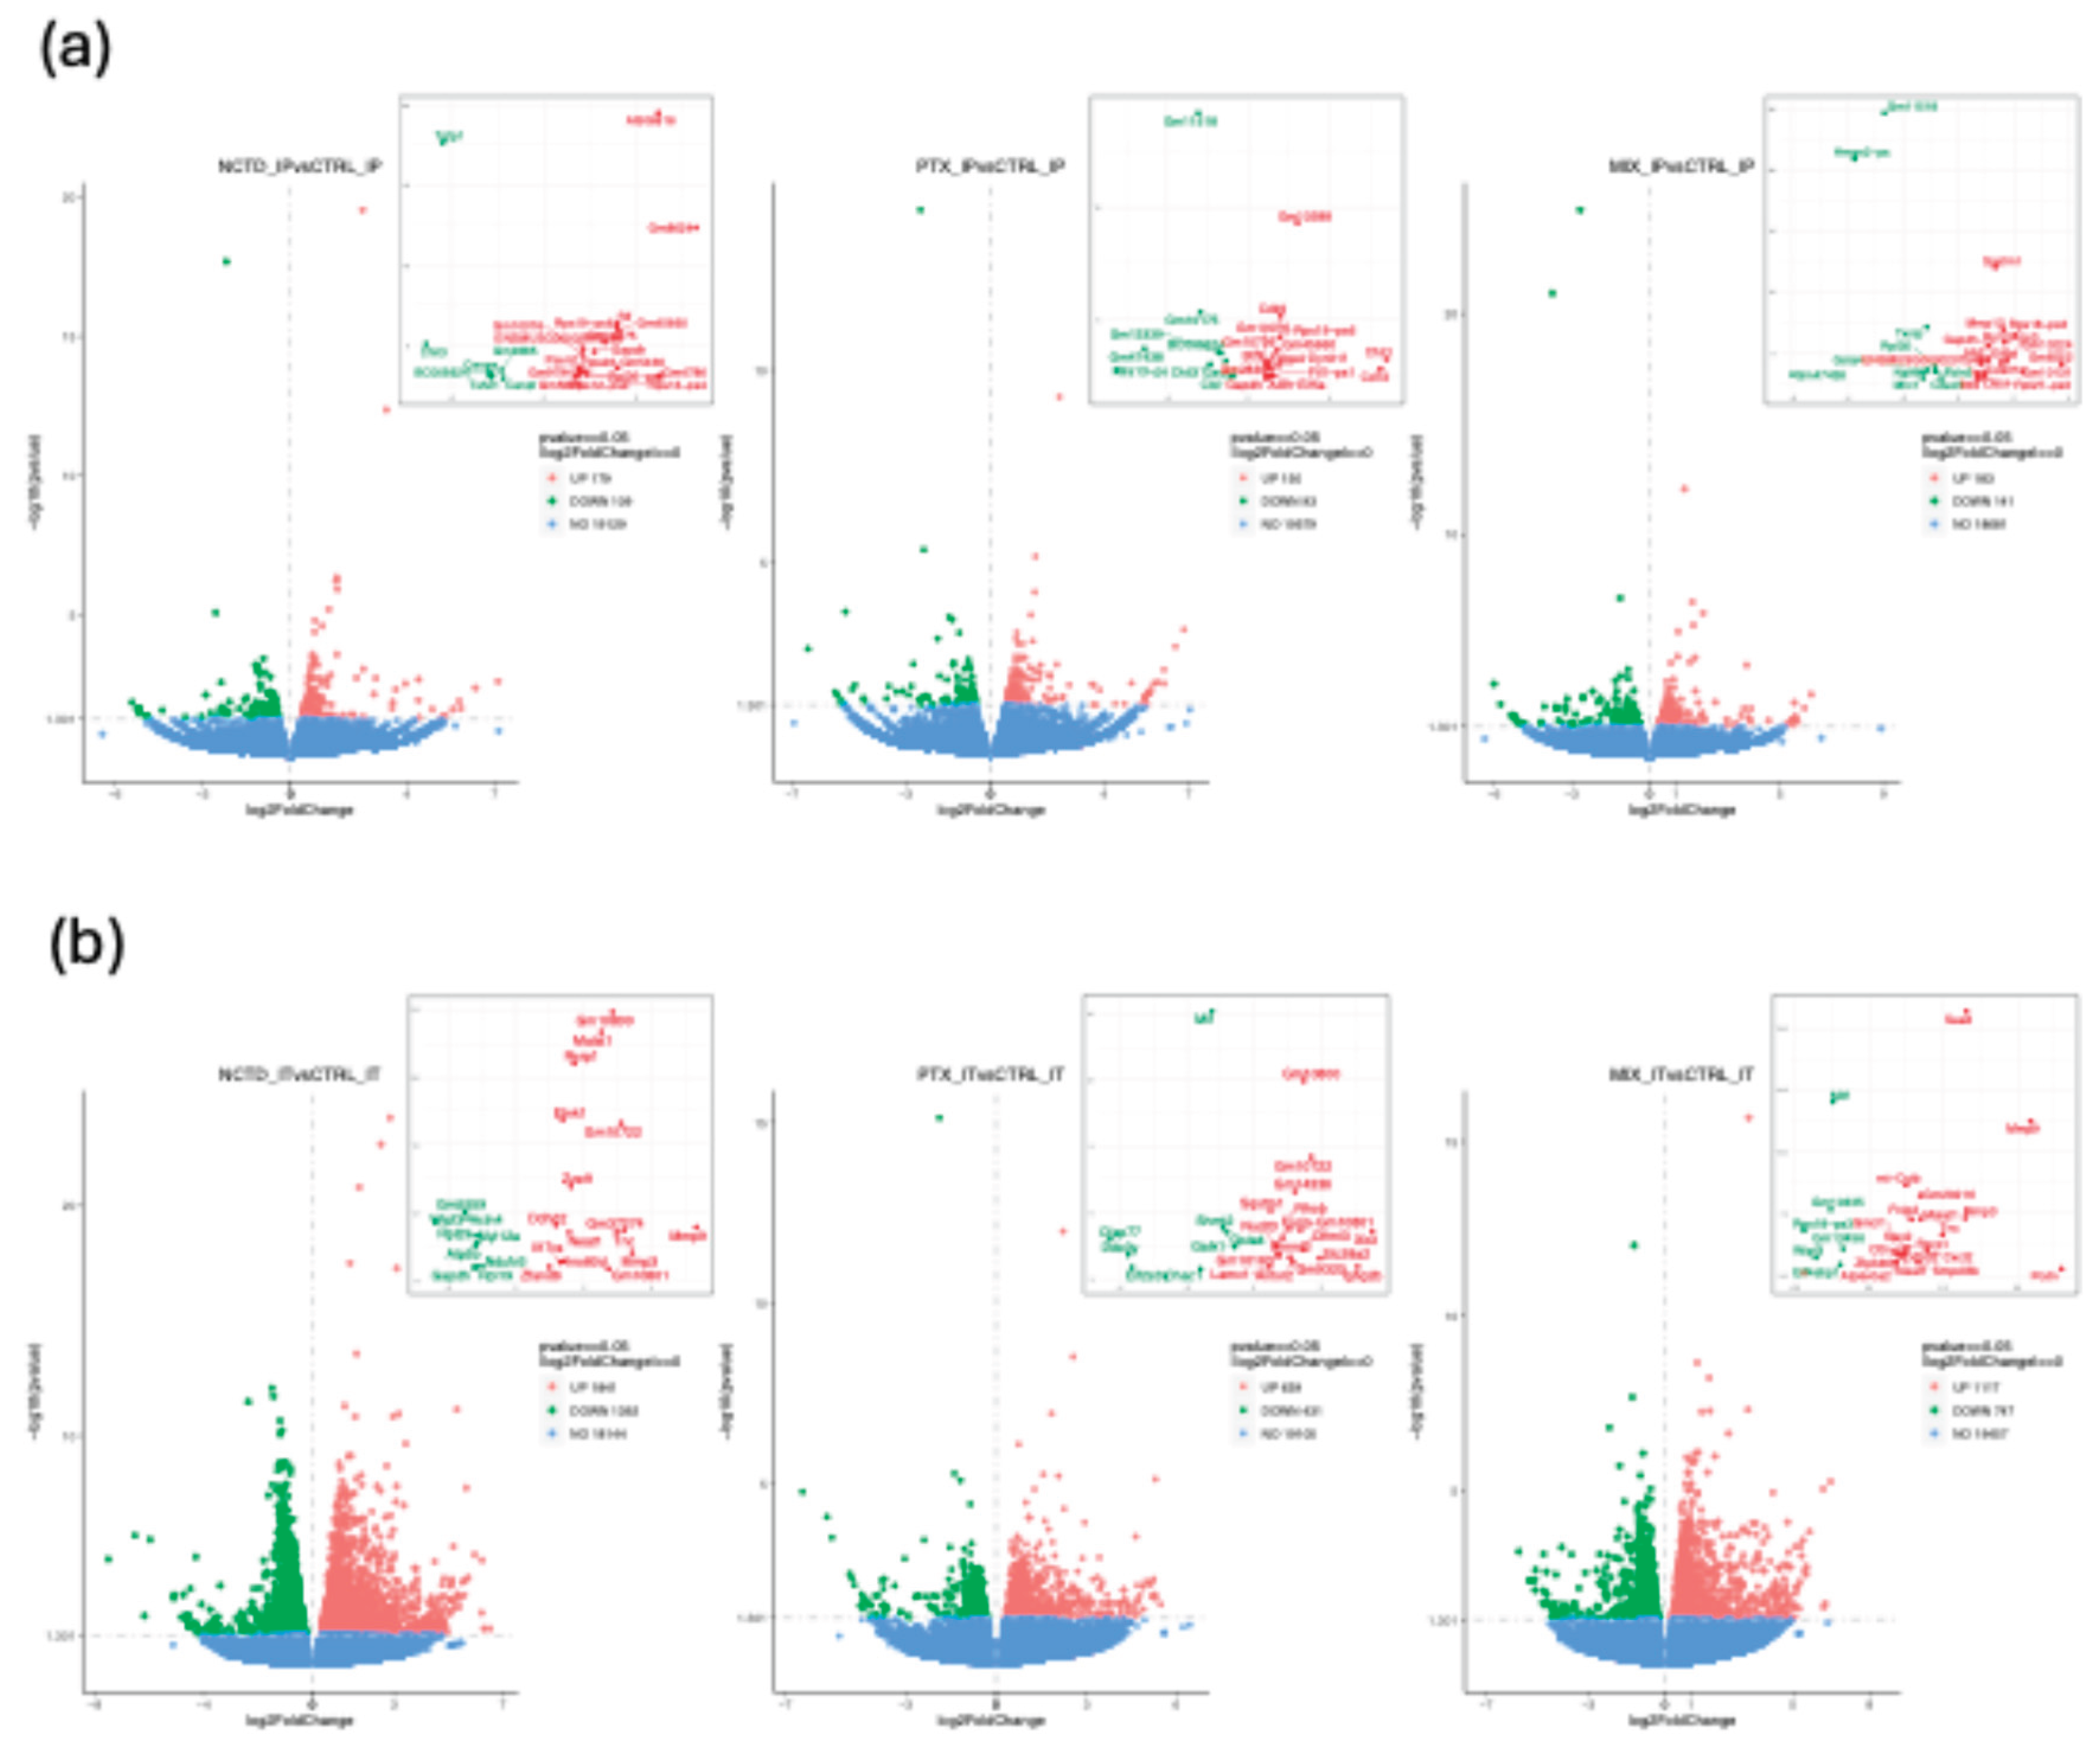
Figure 7.
Hierarchical clustering and heatmap visualization of differentially expressed genes (DEGs) in intratumoral treatment groups. Heatmaps from GSEA-GO enrichment analyses display the top 50 features for each phenotype based on read count data. Gene expression profiles are shown for NCTD_IT vs CONTROL_IT, PTX_IT vs CONTROL_IT, and MIX_IT vs CONTROL_IT. Each row represents a single gene, and each column corresponds to a tumor sample (n = 3–4 per group). The color scale indicates relative gene expression levels, with red representing upregulation and blue indicating downregulation.
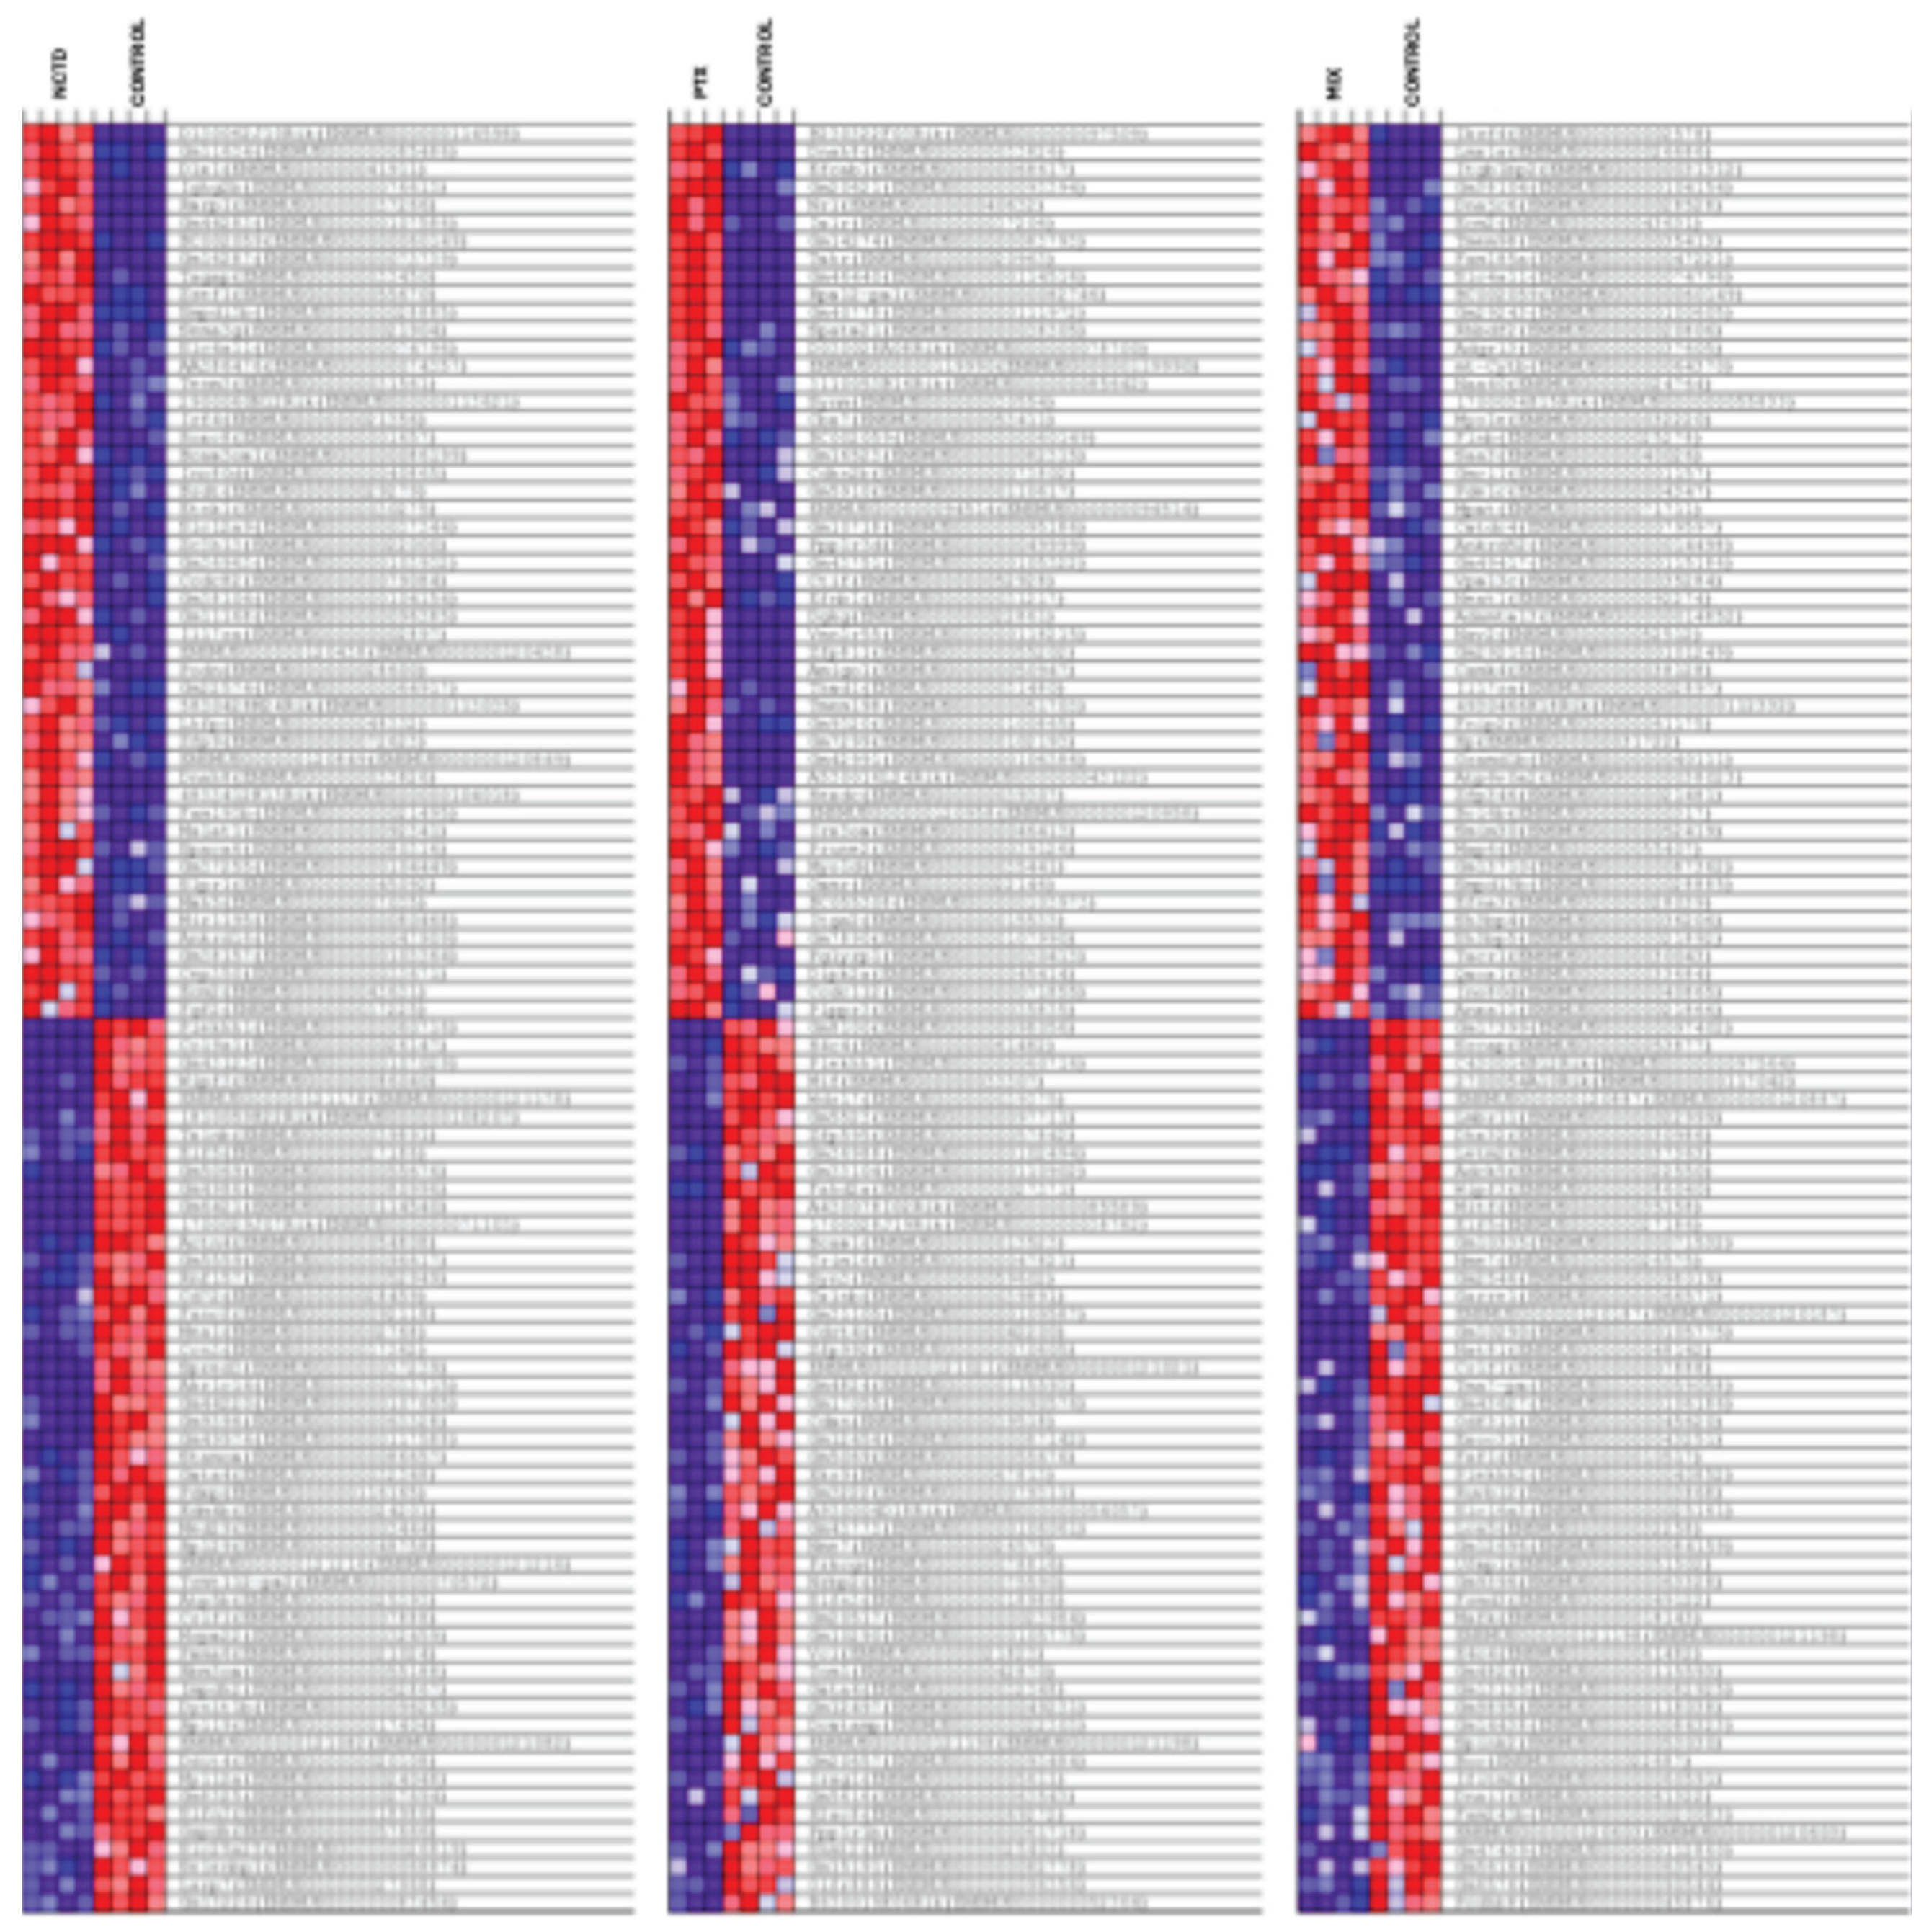
Figure 8.
KEGG pathway enrichment analysis of differentially expressed genes (DEGs) induced by treatments. (a) Enriched pathways for intraperitoneal administration groups (NCTD_IP, PTX_IP, and MIX_IP vs CONTROL_IP). (b) Enriched pathways for intratumoral administration groups (NCTD_IT, PTX_IT, and MIX_IT vs CONTROL_IT). Dot plots display the most significantly enriched KEGG pathways, with dot size indicating the number of DEGs associated with each pathway and color representing the adjusted p-value (padj). Pathways are ranked by statistical significance.
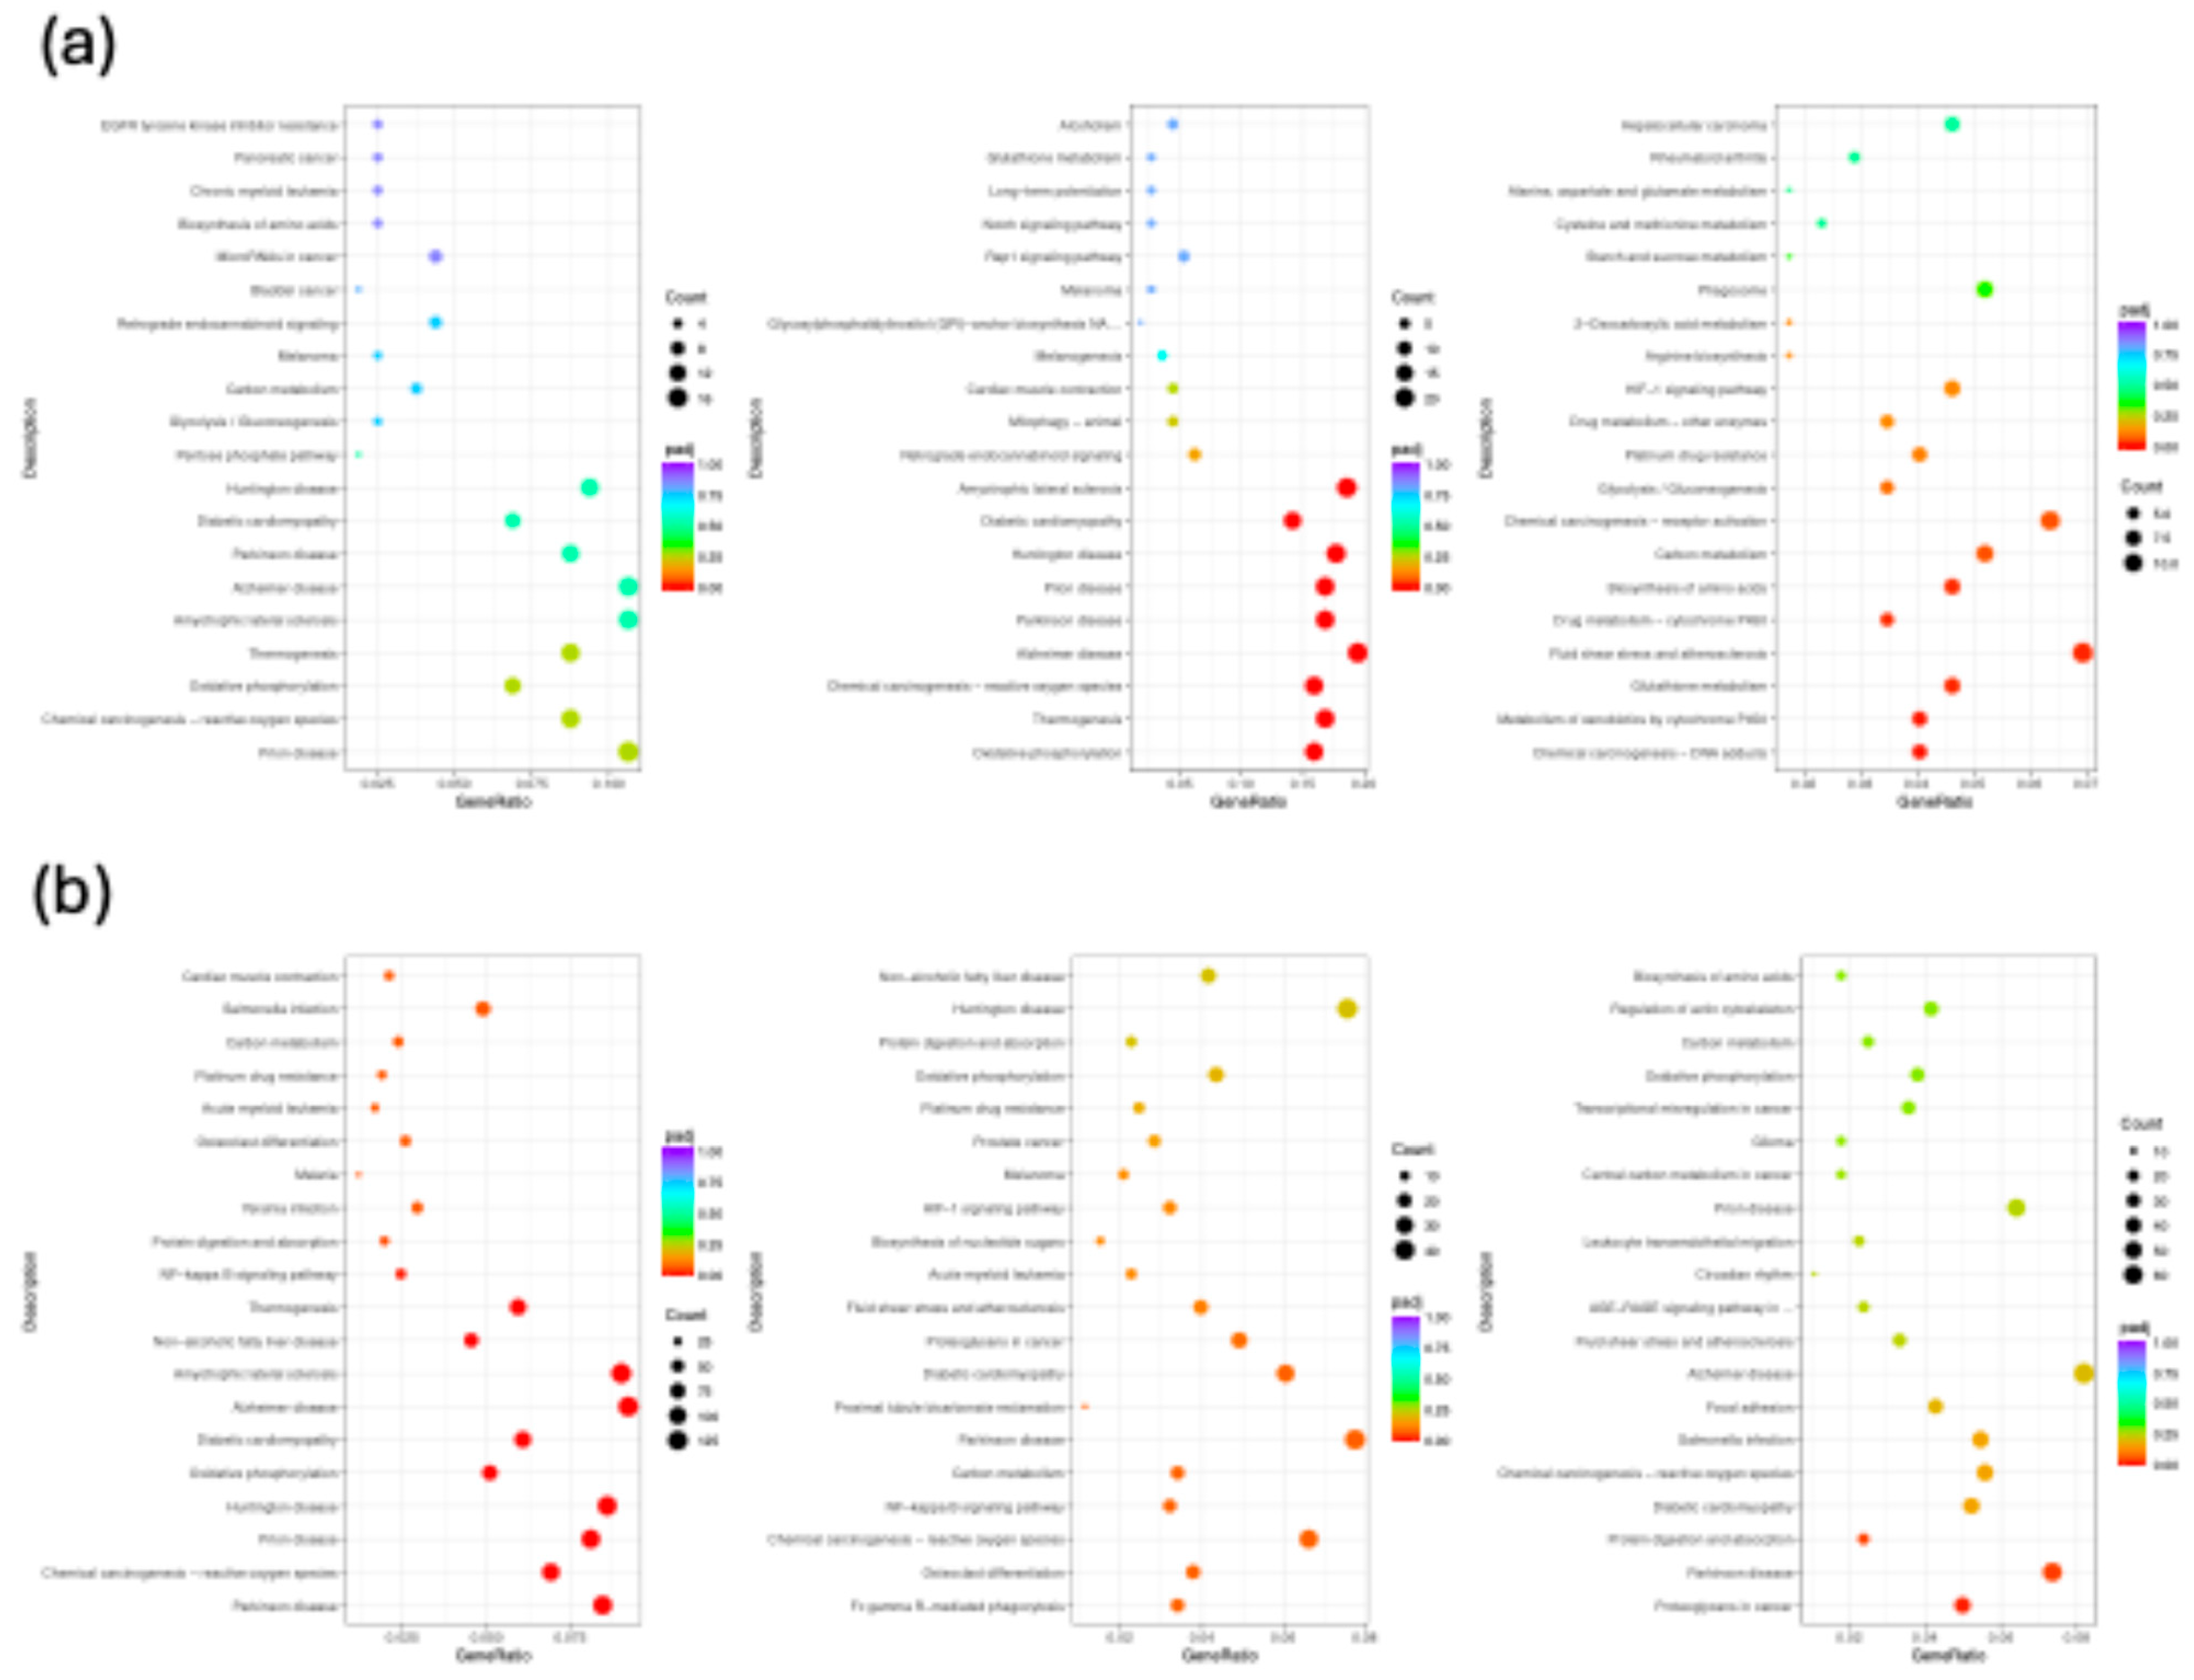
Figure 9.
Reactome pathway enrichment analysis of differentially expressed genes (DEGs) induced by treatments. (a) Enriched pathways for intraperitoneal administration groups (NCTD_IP, PTX_IP, and MIX_IP vs CONTROL_IP). (b) Enriched pathways for intratumoral administration groups (NCTD_IT, PTX_IT, and MIX_IT vs CONTROL_IT). Dot plots display the most significantly enriched Reactome pathways, with dot size indicating the number of DEGs associated with each pathway and color representing the adjusted p-value (padj). Pathways are ranked by statistical significance.
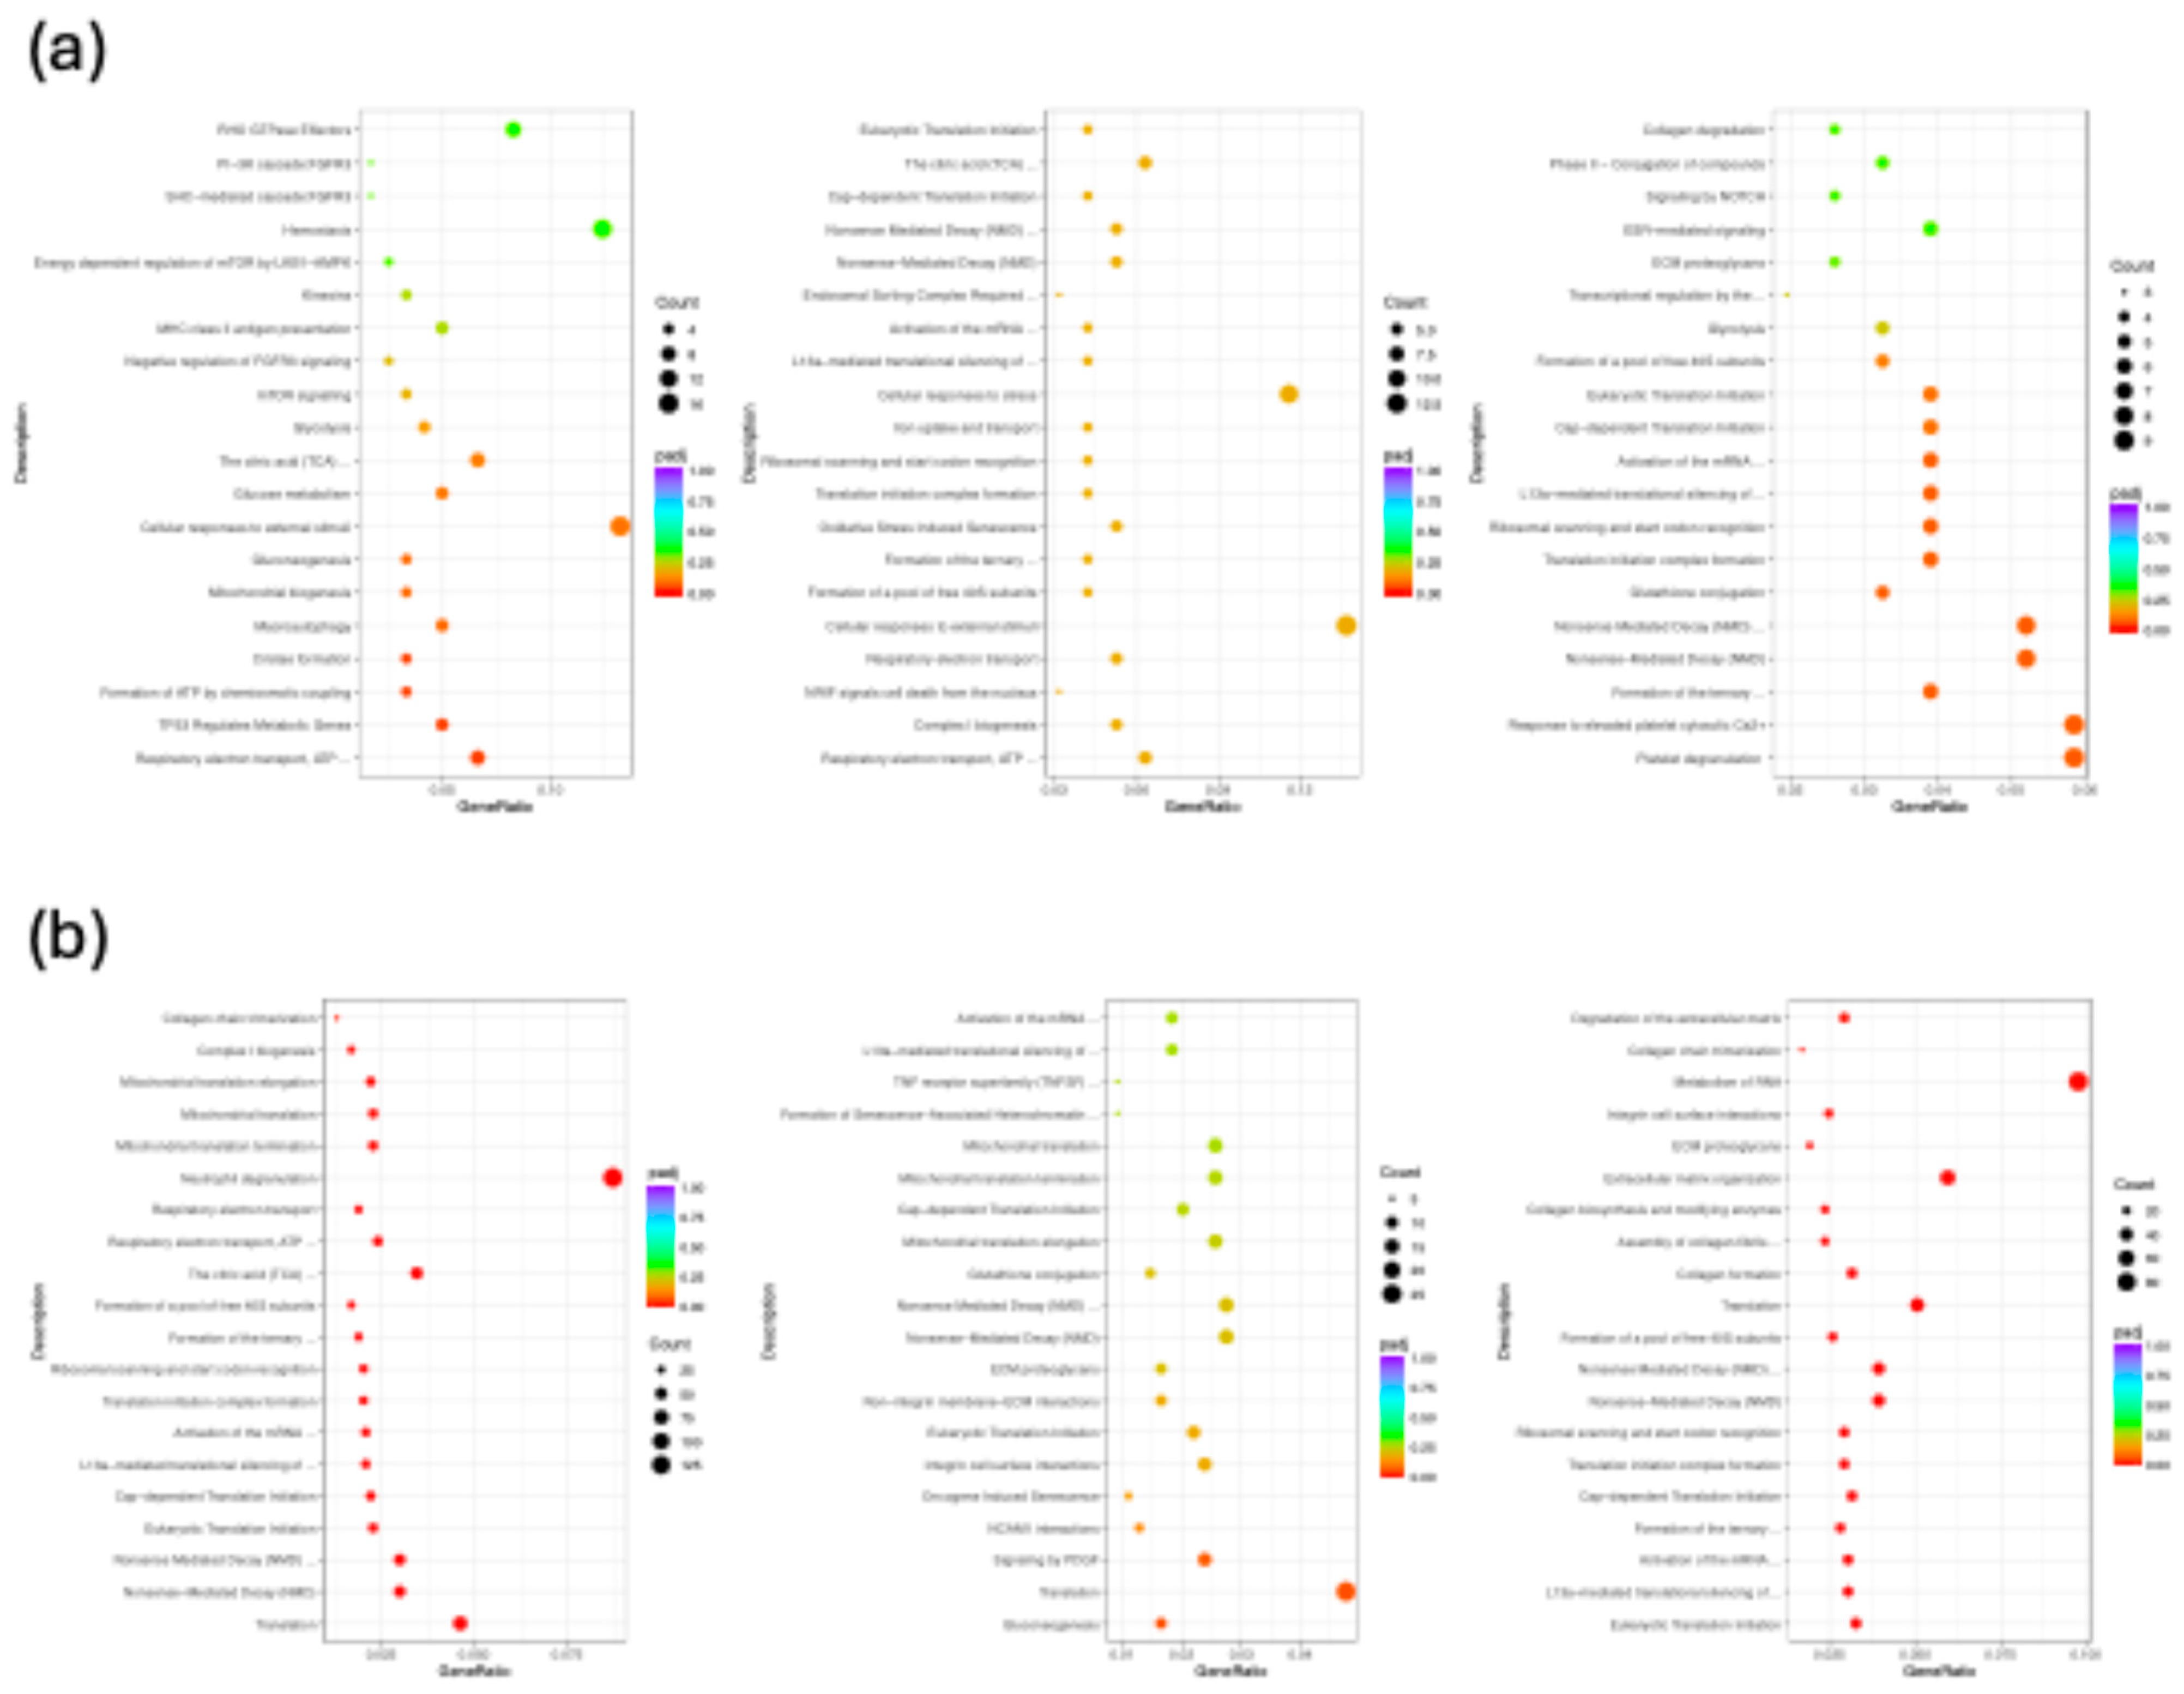
Figure 10.
Representative molecular docking results showing the interaction of pentoxifylline (PTX) and norcantharidin (NCTD) with key signaling proteins in the PI3K/AKT/mTOR pathway.(a) PI3K (PDB ID: 4A55), (b) AKT1 (PDB ID: 3O96), and (c) mTOR (PDB ID: 6BCX). For each target, the 3D binding pose of NCTD and PTX is shown (left panels), along with corresponding 2D interaction maps (right panels) detailing key amino acid residues involved in ligand binding. Binding energies (ΔG, kcal/mol) are indicated for each interaction.
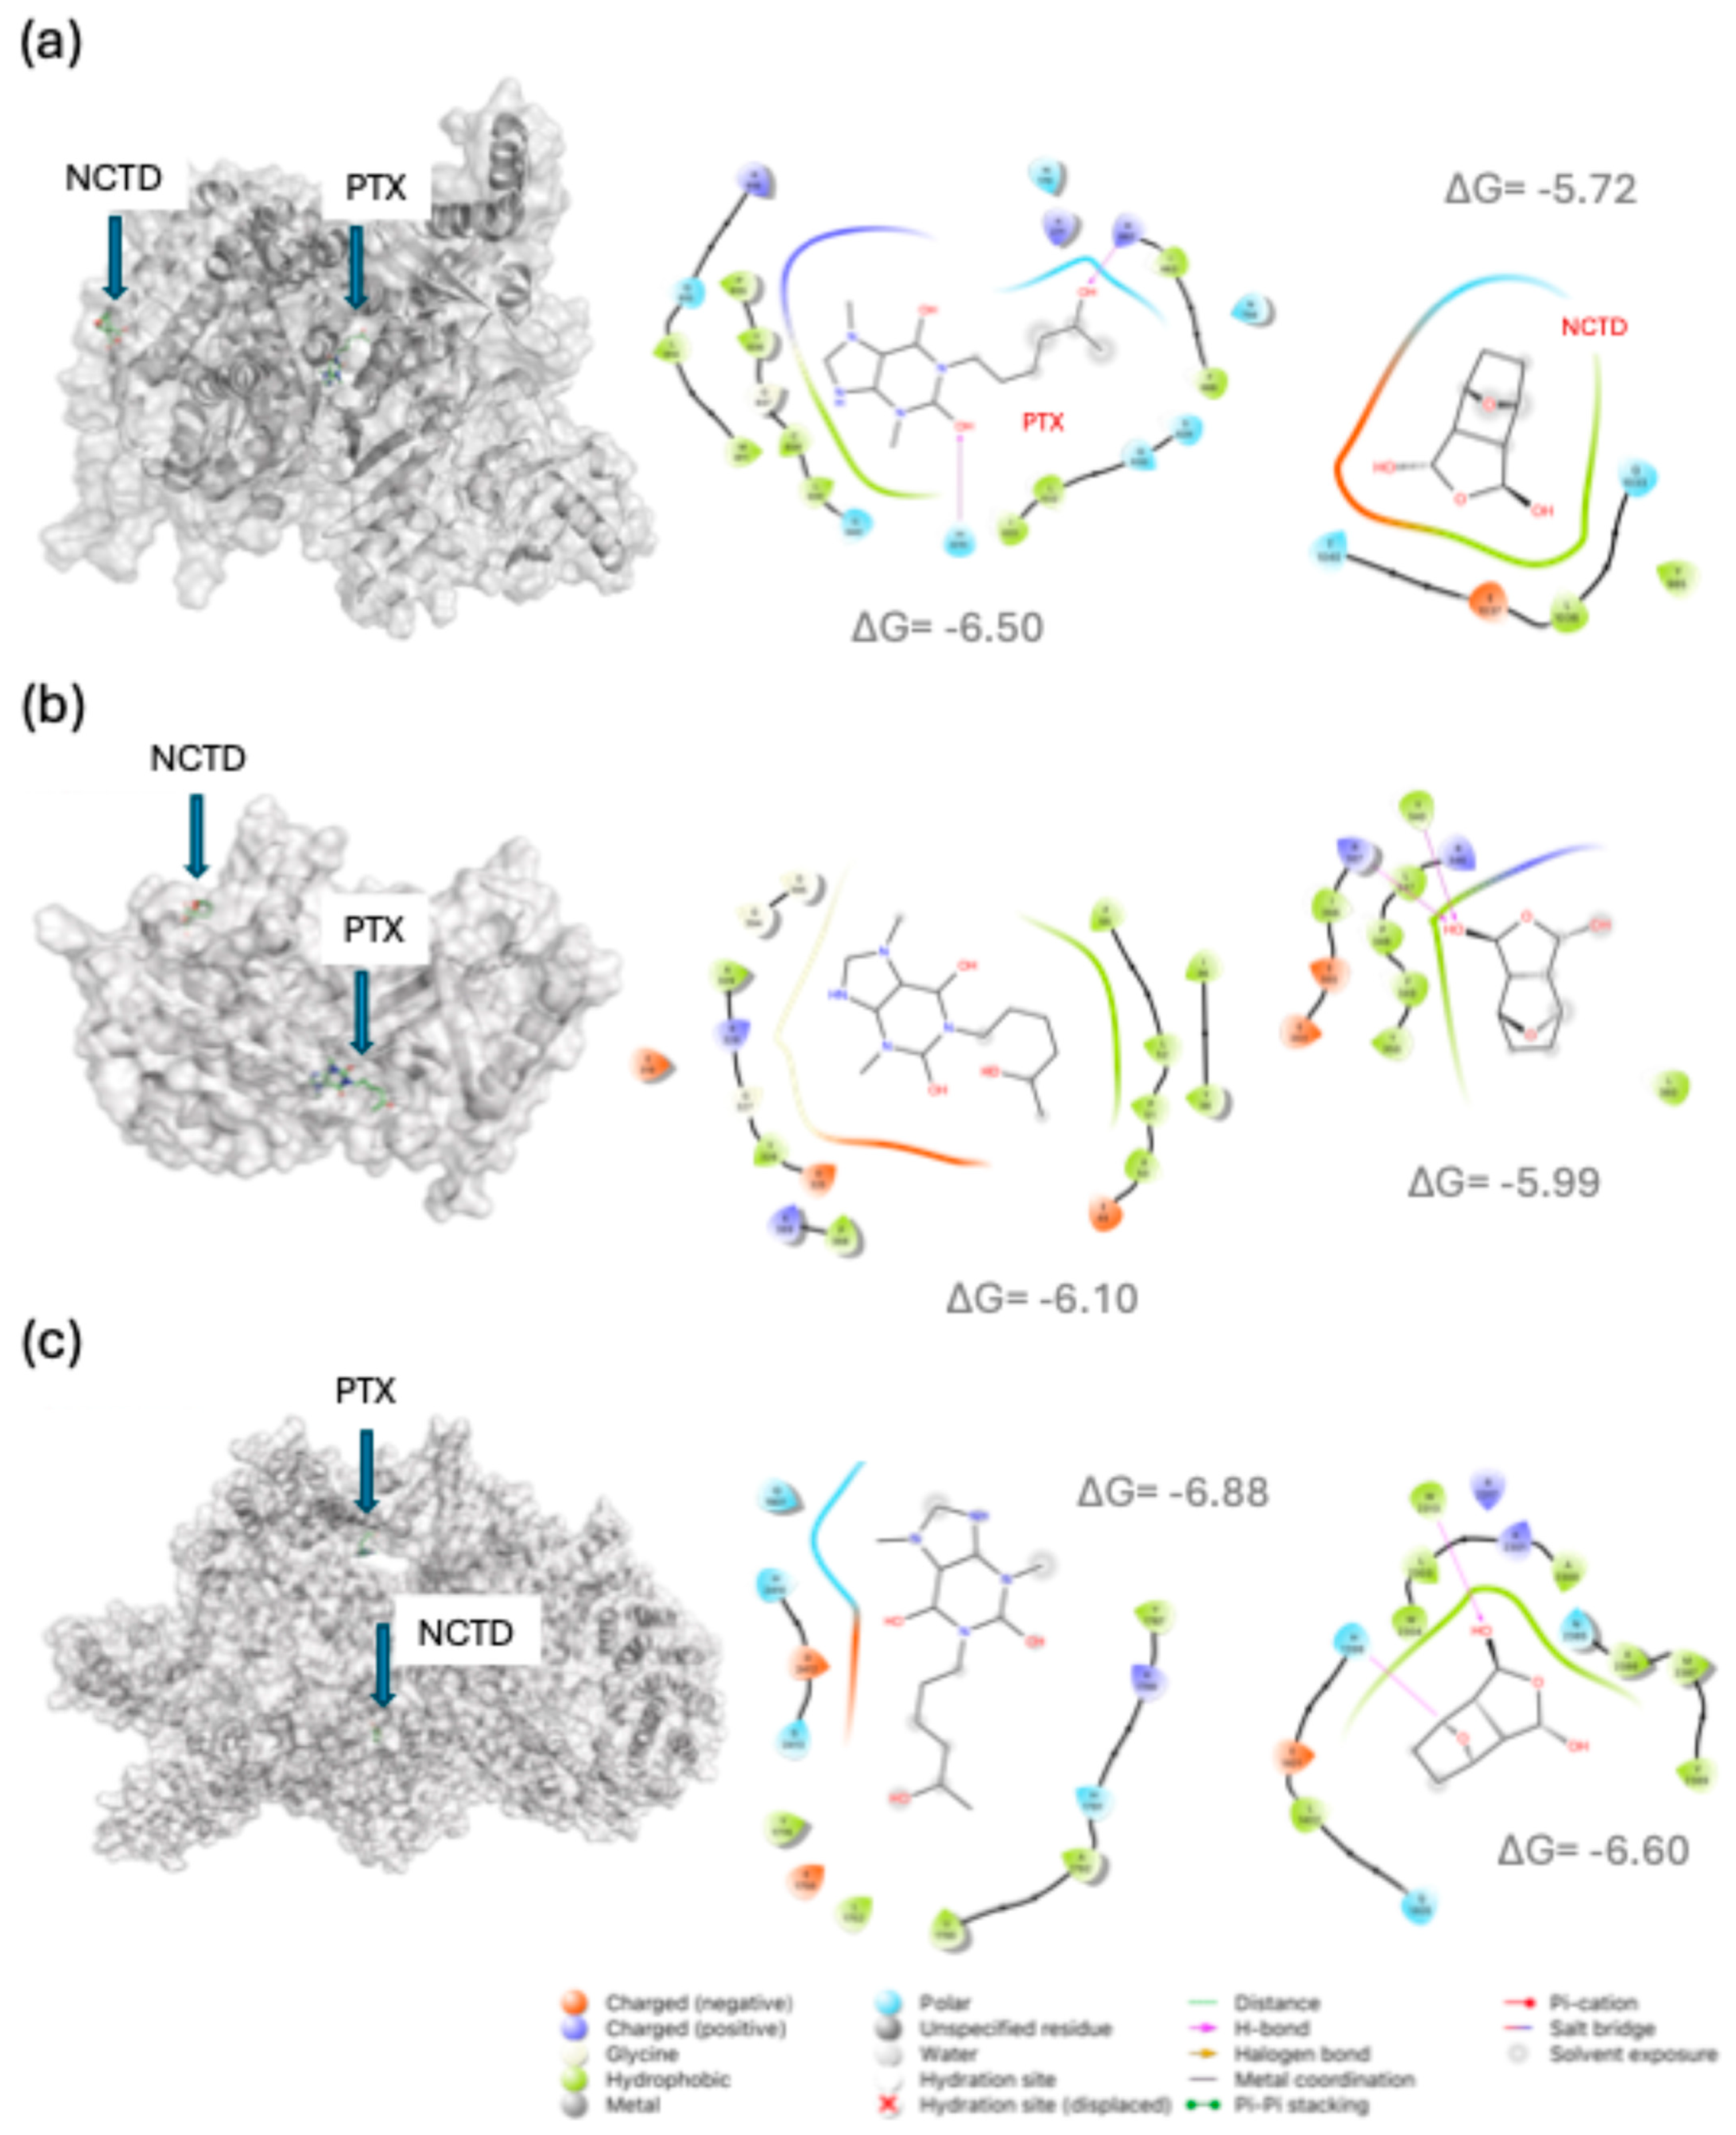
Figure 11.
Schematic summary of the main signaling pathways modulated by pentoxifylline (PTX), norcantharidin (NCTD), and their combination in B16-F1 melanoma tumors. The diagram illustrates key proteins involved in the PI3K/AKT/mTOR and ERBB2/BRAF/MEK/ERK pathways and their downstream effects on cell proliferation, survival, and melanogenesis. Reduced phosphorylation (P) levels in treated groups are indicated, along with increased MITF expression and melanin production observed mainly in PTX-treated tumors. The most extensive suppression of oncogenic signaling was observed in the combination group.
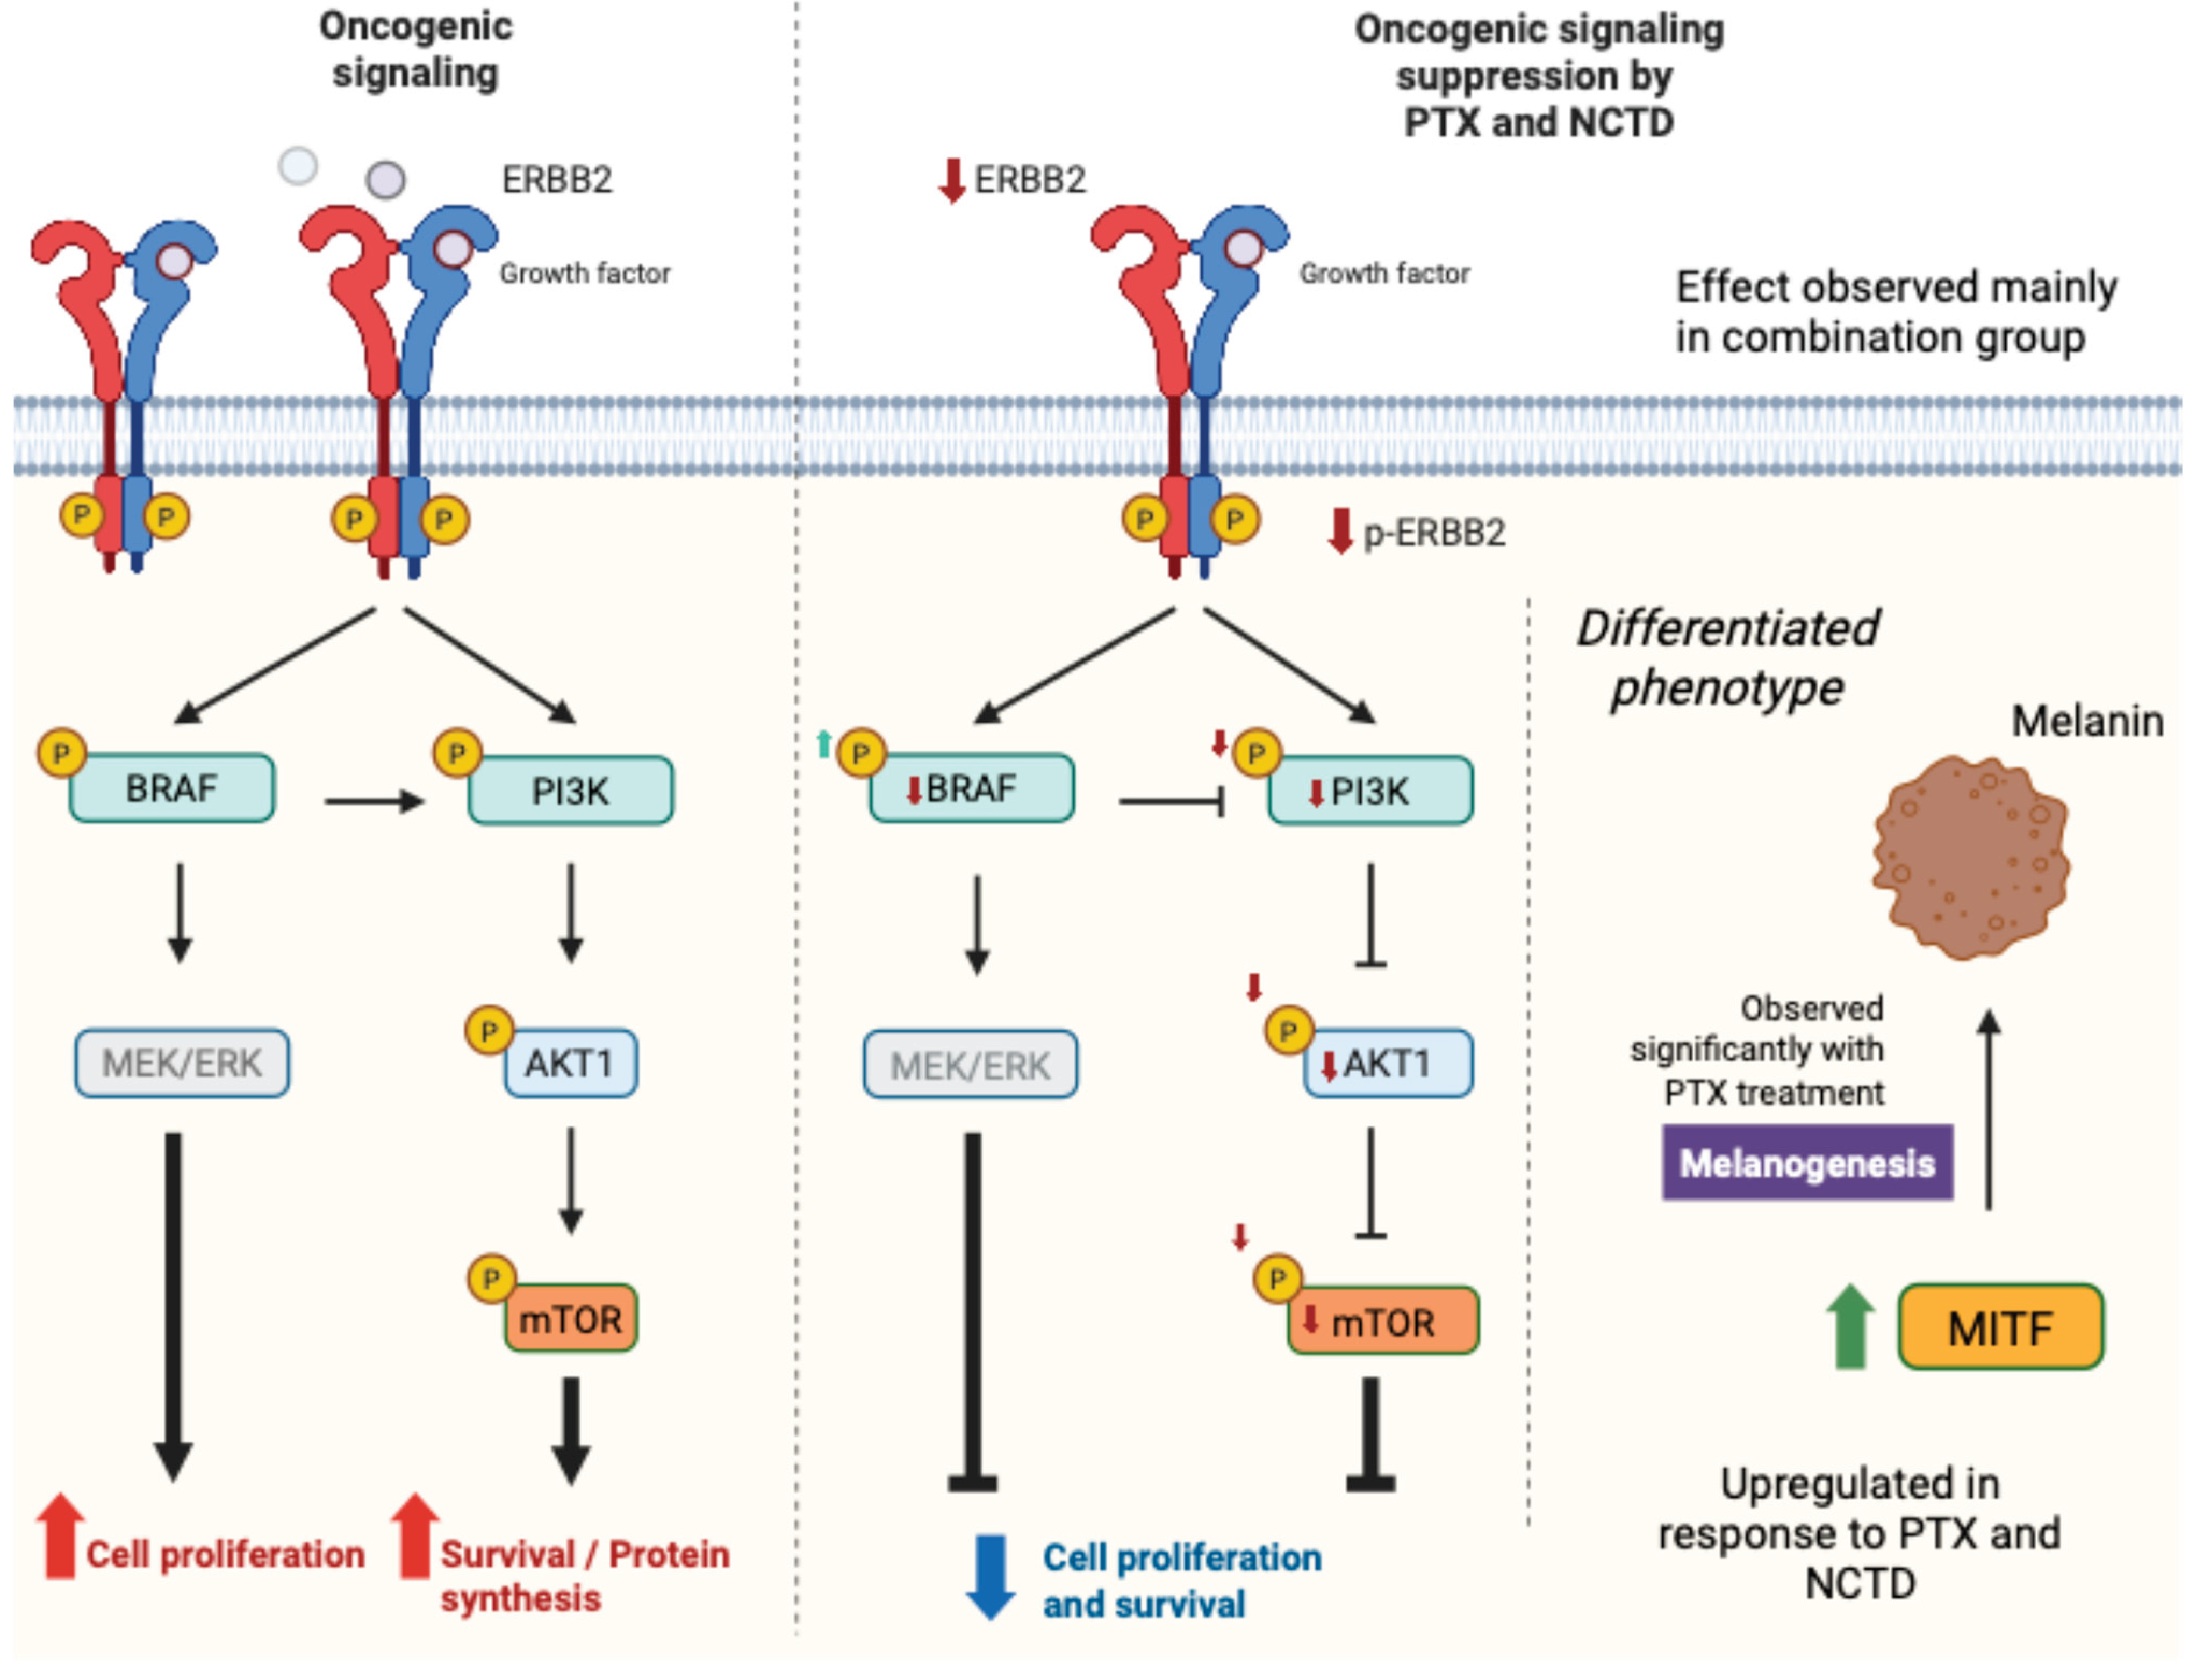

Table 1.
Docking Energy Values of PTX and NCTD with Putative Signaling Molecules, Transcription Factors, and Receptors Involved in Human and Murine Oncogenesis.
Table 1.
Docking Energy Values of PTX and NCTD with Putative Signaling Molecules, Transcription Factors, and Receptors Involved in Human and Murine Oncogenesis.
| Protein | PDB ID | Ligand | Binding Energy (ΔG, kcal mol-1) | Binding site / Residues |
| Epithelial–Mesenchymal Transition (EMT) | ||||
| CDH1 | 3Q2V | NCTD | -4.76 | Tyr175, Asp168. Leu167 |
| PTX | -4.96 | Met193, Glu190, His180 | ||
| LIM domain-binding protein 1 | 6PTL | NCTD | -5.47 | Gln125, Gly144, Glu143 |
| PTX | -5.23 | Ile165, Phe72, Ile70, Met128, Tyr91, Ile95, Ser94, His132 | ||
| FZD8 | 1IJY | NCTD | -6.16 | Gly113, Val114, Cys115, Val109, Pro108, Lys77 |
| PTX | -6.44 | Ser78, Cys115, Gly113, Lys77, Pro108, Lys74, Val109 | ||
| TGF-β1 | 1KLC | NCTD | -4.79 | Arg25, Lys37, Phe24, His34 |
| PTX | -5.00 | Arg25, Phe24, His34 | ||
| CTNND1 | 3L6X | NCTD | -5.52 | Asp510, Arg383 |
| PTX | -5.20 | Lue620, Glu521, Arg326, Arg329, Val514, Asn517 | ||
| LFA-1 | 3F74 | NCTD | -4.91 | Gly262, Leu289, Ile288, Asp290 |
| PTX | -5.06 | Thr164, Tyr166, Ser165, Thr231, Gly128 | ||
| CXCL12γ | 6EHZ | NCTD | -5.11 | Arg12, Cys50, Val49 |
| PTX | -5.06 | Arg12, Cys50, Arg47, Val39, Gln46 | ||
| Claudin-2 | 4YYX | NCTD | -6.18 | Ile38, Ile36, Gly35, Phe34, Leu95, Arg96 |
| PTX | -6.47 | Asn72, Arg74, Glu51, His46, Gly40, Val55 | ||
| Cell Proliferation | ||||
| PIK3CA | 4A55 | NCTD | -5.72 | Gln1033, Leu1036, Glu1037, Thr1040 |
| PTX | -6.50 | His670, Arg662, Asn170, Arg818, Cys838, Leu839 | ||
| AKT1 | 3O96 | NCTD | -5.99 | Leu360, Tyr340, Arg367, Arg346, Leu347, Pro358, Phe349, Tyr350 |
| PTX | -6.10 | Leu52, Pro51, Asp325, Gly327 | ||
| mTOR | 6BCX | NCTD | -6.60 | His1398, Trp2313, Trp2304, Ala2386 |
| PTX | -6.88 | Gln1901, His2410, Asp2412 | ||
| ERK2 | 6GJD | NCTD | -6.60 | Val39, Lys54, Thr105 |
| PTX | -6.70 | Leu156, Lys54, Ala52, Ile31, Ile86 | ||
| Melanoma Stem Cell Marker | ||||
| CD117 | 1PKG | NCTD | -6.62 | Ala621, Cys809, Leu799, Lys623, Thr670, Val603 |
| PTX | -7.40 | Ala597, Asp810, Asp677, Cys809, Gly596, Leu799, Lys623, Thr6670, Val603 | ||
| CD117 (Extracellular domain) | 2EC8 | NCTD | -4.90 | Gln346, Pro343 |
| PTX | -5.24 | Glu228, Glu368, Leu222, Leu223, Lys342, Thr230, Thr342 | ||
| KITLG | 1EXZ | NCTD | -5.56 | Ala147, Arg13, Gly151, Tyr150, Val73, Val170 |
| PTX | -6.01 | Ala147, Arg13, Arg14, Ile152, Ser11, Thr71 | ||
| KDM5B | 5A3P | NCTD | -6.52 | Leu716, Met701, Phe700 |
| PTX | -5.57 | Asp77, Leu81, Phe438, Pro439, Val440 | ||
| Key Drivers of Melanocytic Transformation | ||||
| MITF | 4ATK | NCTD | -4.66 | Asp252 |
| PTX | -5.53 | Ala249, Lys233, Met239, Pro232, Tyr253 | ||
| B-RAF | 4MNF | NCTD | -6.22 | Cys532, Phe583, Trp531 |
| PTX | -7.44 | Lys483, Ala481, Asp594, Gly466, Lau514, Phe583, Thr529 | ||
| RAF-MEK1 complex | 4MNE | NCTD | -6.34 | Leu74, Leu197, Met146 |
| PTX | -7.33 | Asp208, Gly210, Lys97, Met219, Leu215, Phe209 | ||
| ERBB2 | 2A91 | NCTD | -6.01 | Pro279, Phe270, Ans467 |
| PTX | -6.73 | Asn467, Gly443, Leu28, Tyr280, Val4 | ||
| NRAS GTPase | 6E6H | NCTD | -5.91 | Asp13, Gly15, Lys16, Ser17, Val14 |
| PTX | -6.61 | Asp13, Ala18, Ala146, Lys117, Lys147, Phe28, Ser17 | ||
| Vascularization and Angiogenesis | ||||
| HIF1A | 3HQR | NCTD | -7.83 | Arg383, Ile327, His374, Thr387, Val376 |
| PTX | -6.34 | Arg322, Ile251, Leu240, Tyr310, Val241, Val314 | ||
| VEGF-A | 2VPF | NCTD | -4.53 | Ile46, Phe36, Phe47 |
| PTX | -4.74 | Asp63, Cys61, Cys68, Glu64, Lys107 | ||
| EGF | 1IVO | NCTD | -3.51 | Lys48 |
| PTX | -4.43 | Gly36, Trp49, Trp50 | ||
| TWIST1 | 2MVJ | NCTD | -4.01 | Ala9 |
| PTX | -4.04 | Ala6, Ala9, Gly89, Lys10, Ser11 | ||
| PDPK1 | 1H1W | NCTD | -6.51 | Phe93, ser94, Val127 |
| PTX | -6.41 | Glu130, Lys111, Lys123, Leu113, Ser94 | ||
| PTGS2 | 1PXX | NCTD | -6.13 | Val291 |
| PTX | -7.33 | Arg44, Leu152, Lys468 | ||
| Matrix metalloproteinase-1 | 966C | NCTD | -5.90 | Thr241, Val246 |
| PTX | -5.53 | Arg214, Asn205, Asn211, his132, his213, Lys136 | ||
| Matrix metalloproteinase-2 | 1QIB | NCTD | -6.53 | Leu218, Thr227, Tyr223 |
| PTX | -6.83 | Leu164, Tyr223, Val198 | ||
| Matrix metalloproteinase-9 | 5UE3 | NCTD | -6.54 | Arg249, His228, Leu222, Leu243, Tyr248 |
| PTX | -7.02 | Arg249, His257, Leu243, Thr251 | ||
| NF-κB(p50 subunit) | 1SVC | NCTD | -5.42 | Lys147 |
| PTX | -5.34 | Lys147, Phe151, Thr205, Val150 | ||
Disclaimer/Publisher’s Note: The statements, opinions and data contained in all publications are solely those of the individual author(s) and contributor(s) and not of MDPI and/or the editor(s). MDPI and/or the editor(s) disclaim responsibility for any injury to people or property resulting from any ideas, methods, instructions or products referred to in the content. |
© 2025 by the authors. Licensee MDPI, Basel, Switzerland. This article is an open access article distributed under the terms and conditions of the Creative Commons Attribution (CC BY) license (http://creativecommons.org/licenses/by/4.0/).
Copyright: This open access article is published under a Creative Commons CC BY 4.0 license, which permit the free download, distribution, and reuse, provided that the author and preprint are cited in any reuse.


