
Submitted:
06 July 2025
Posted:
07 July 2025
You are already at the latest version
Abstract
Urban ills such as urban fragmentation and gentrification cause losses in the range of trillions of US-dollars in the United States alone. Here, we demonstrate how these urban ills can be avoided through implementation of a nonlinear modeling framework that we test on fifteen cities across the United States, Europe, and New Zealand. We refer to our framework as Chains of Urban Activity Models (CHOAMs). From a modeling perspective, CHOAMs stand out through the systematic introduction of nonlinear mathematics which can capture many nonlinear aspects of urban complexity, contextuality, diversity, antagonism, synergy, and, ultimately, perceived value. Typically, architects spend a whole career to develop an intuitive sense of these urban phenomena. By comparison, CHOAMs can be trained within hours, and their technology can be easily shared and expanded. This inspires us to suggest that CHOAMs could spearhead an evolution of new nonlinear urban modeling frameworks and theories.
Keywords:
urbanism
; urban life
; real estate investment
; architecture
; nonlinear modeling
Introduction
Architecture students spend significant time during their training in studio environments where they develop an intuitive sense of how a city works (Jacobs, 1961). Indeed, many aspects of urban life seem counterintuitive at first. Can there be urban segregation, even if nobody wants it (Schelling, 1978)? Gentrification is another similar problem that seems entirely odd. Sometimes an investor would spend a fortune on building urban infrastructure—an elegant office building, for example—only to find out that the completed building is less valuable than the construction materials and labor that were necessary to erect it. The really odd thing is that hundreds of elegant office buildings may already exist in the neighborhood, and that building those brought no losses. Other times, an intervention—building a school, for example—can generate synergistic value in a neighborhood, raising the value of the surrounding properties even if nothing at all is invested in them. Understanding such counterintuitive and clearly not straightforward aspects of urbanism is a long process that is only sometimes successful.
From the perspective of the professors who teach architecture, the problem is equally complex. They have to spend dedicated time with architecture students, helping them observe countless synergistic and antagonistic relationships between urban components. Frequently, the teaching environment resembles an apprenticeship in which a master passes down fine-tuned skillsets to a disciple. Yet, knowledge passed down in such close relationships often becomes fragmented, resulting in the formation of disagreeing schools of thought. Indeed, various urban theories have been developed and terms have been coined such as “contextual design” or “genius loci,” which have been pioneered by different people who may or may not agree on terminology, procedures, and even ultimate goals (Norberg-Schulz, 1980; Mavromatidis; 2020, 2024, 2025).
In response to these problems, we have developed CHOAMs—chains of urban activity models (Baciu, 2024). CHOAMs are developed to answer the question: What generates urban value? The answer relies on two main foundations:
- Urban activities are the main component that makes people value their time in cities. Activities can range from work to leisure, art appreciation, dwelling, shopping, and anything else people do in cities. Typically, activities can be classified into smaller and larger groups or types of activities.
- The relationship between quantity and value is not linear. In other words, the value of activities is frequency-dependent. Specifically, if the supply of one type of activity is too large, its perceived value may diminish. For example, the value of meeting yet another friend at a bar depends on how many friends one has already met at bars. Similarly, the value of having dinner depends on whether one has already eaten, or the value of owning gold depends on how much gold there is compared to other materials.
While our first assumption merely reaffirms a focus on people rather than inert matter, the second introduces nonlinearity (Baciu, 2024). The important part about nonlinearity is that, once it is introduced, it can be utilized to describe most nonlinear aspects of urban life.
Why Nonlinearity?
The name “nonlinearity” is a good choice because it visualizes the main idea. In a linear system, there are linear relationships between variables. As a concrete example, imagine utilizing a coordinate system to plot the relationship between the number of buildings in an area and their total value. If each added building adds one unit of value, the following numbers are obtained: 0 added buildings are 0 added value; 1 added building is 1 unit of value; 2 added buildings are 2 units of value; 3 added buildings are 3 units of value, and so on. Thus, the relationship between the total of added buildings and the total of added value is a diagonal line that passes through the origin of the coordinate system, rising at a 45-degree angle. In a nonlinear system, this type of relationship does not hold. Up to a certain point, adding new buildings may add value, but eventually the city becomes too dense, and adding more buildings does not add value. Sometimes, adding yet another building leads to overcrowding and even diminishes the overall value. The line plot is no longer a line but a curve. Hence, “nonlinearity” has entered the game.
Evidently, we can also refer to this phenomenon by other names. In particular, we can speak of “frequency dependency” because it matters how many buildings there are, “context dependency” because it matters in which context the building is placed, “complexity” because the value of the system is sometimes more, other times less than the sum of the system’s parts, “diversity” because it is not sufficient to only have buildings, but other components may also be valuable, such as roads and parks, “dynamical system” or “dynamical behavior” because the behavior is depends on context, frequency, etc., “chaotic behavior” because, not knowing how many buildings there are already, one cannot possibly tel what the effect of adding a building will be, or “genius loci” because a stupid robot operating on linear equations will not be able to handle the problem. Even mathematically, it can be demonstrated that all of these chaos and dynamical systems theories rely on the same mathematical setup: the introduction of multiplications between variables.
A mathematical model is referred to as “nonlinear” when it features multiplications between variables. This is easy to explain graphically. If two line segments are added together, they give a longer line segment. With additions, one starts with lines and one stays with lines. Everything remains linear. As long as only additions are utilized, adding more line segments will only create lines, not curves or spaces. In contrast, to calculate the volume of a cube, one has to multiply the lengths of its sides. This is why multiplications are the type of algebraic operations that are linked to nonlinearity. Technically speaking, volumes and curves are both nonlinear. Both involve rotation. A cube has three dimensions, pointing in independent directions. Transforming one axis into the other involves rotation. Therefore, one can think of space as something created by rotation. Similarly, following a curve involves moving in a direction and changing direction. Therefore, one can think of curves as something created by rotation. We explain all this simply to make it clear why we have chosen to develop CHOAMs based on nonlinear mathematics, and why we hold that the nonlinear mathematics can explain all of those dynamical, contextual, complex, diverse, and counterintuitive aspects of reality. The distinction between linearity and nonlinearity is foundational for all sciences. It is found in mathematics, geometry, logic, as well as all fields of human endeavor. When creating CHOAMs, we decided to build them on this deep foundation. This said, we do also value all the knowledge that has come from complexity theories, chaos theory, dynamical systems theories, genius loci, contextual design, etc. We interpret these emergent theories as responses to real, nonlinear questions.
CHOAMs stand out by systematically introducing nonlinearity in urban modeling. Technically, we feature multiplications between variables, which brings along nonlinearity and the ability to describe nonlinear phenomena (Baciu, 2024). A concrete example can illustrate the inner workings of CHOAMs, and how they differ from regular urban models.
Conventionally, an investor would compare investment options: hotels, restaurants, office buildings, apartment blocks, museums, etc. Each option promises a given revenue. The setup remains linear because the value of various investments simply adds up: the value of a hotel does not depend on how many restaurants there are nearby in the same urban context. CHOAMs radically change this setup. First, the focus is shifted from the buildings to the people who use them. CHOAMs consider the availability of urban activities for people, and not the inert matter without the people. This was our first foundation. Second, CHOAMs do not even assign value to individual activities. Only relationships between activities receive a value. For example, the activity “leisure” alone has no value, but each of the pairs “leisure-work”, “leisure-education”, or “leisure-leisure” have one. Through this setup, nonlinearity is introduced (Baciu, 2023; Baciu, 2022).
The systematic introduction of nonlinearity is vital. If nonlinearity is ignored, all nonlinear aspects of urban life are overlooked (Baciu, 2024). The consequences are dramatic. Without nonlinearity, context does not matter, overcrowding does not matter, synergies don’t matter, diversity does not matter… However, all of these things matter in real cities worldwide, and ignoring them is the source of many an urban ill.
Yet, why did it take so long to systematically introduce nonlinearity? The answer is easy, because “chaos” is not easy to handle. Training a nonlinear model is not easy, due to two primary reasons. First, in a nonlinear model, there are more parameters to train. In a linear model with n elements, there are n parameters. If five factories produce brick independently, their total output is the sum of the individual outputs, and it depends simply on the output capacity of each factory. With five factories, there are five output capacities to consider. Not so with nonlinear models. In a nonlinear model in which all pairwise relationships between n components are taken into account, there are n2 parameters. And since for any n > 1, it can be said that n2 > n, it follows that the nonlinear model has a larger number of parameters to train. If five brick layers work in groups of two, their output will depend on the capacity of 25 possible pairs of a lead worker and an assistant. Additionally, not only is the number of parameters larger, but the parameters are also harder to infer from real data. As a concrete example, imagine a complex relationship between a construction manager and the five brick layers. If the brick layers strike, the construction manager may still be unable to find out who initiated the strike because the brick layers may cover each other. The problem does not even have to involve deceit. As an example that does not involve intelligence imagine tuning a piano in which putting tension on one string may change the tension on the others (because the frame on which the strings are fixed is not rigid). Attempting to tune this piano may not produce any result because any good adjustment creates more wrong than good effects. Perhaps for this reason, nonlinear modeling has not yet been systematically introduced in urbanism. A city is a piano with very many and intricately connected strings. This is why training nonlinear models is difficult, at least until one has solved the math.
A Comparative Study of Fifteen Cities
We have introduced CHOAMs in earlier articles and lectures. Here we expand our study, reporting the results from a comparative analysis of fifteen cities across Europe, the United States, and New Zealand. The selected cities have been chosen randomly. Our only fixed limitation was that we selected cities that we have already visited or lived in. To evaluate the performance of CHOAMs on these cities, we have trained separate models on a dataset of millions of entries.
Having created these fifteen models for fifteen cities, we would now like to report on the results from comparing these models. The main point of interest is whether CHOAMs could help practitioners avoid urban ills. We discuss this in the RESULTS section, in a dedicated subsection. Furthermore, we discuss general rules that hold across continents. In particular, we demonstrate that diversity is good as a rule of thumb. However, there are also many idiosyncrasies within each city and across the bandwidth of cities that we studied. In particular, synergies between different activities differ across cities, and the rule of thumb that diversity is good is often only a vague approximation. Knowing to what exact extent pairs of activities generate synergistic value is crucial, and this is what makes CHOAMs particularly valuable. CHOAMs infer exactly these parameters from empirical data.
Throughout the article, these questions are answered with CHOAMs trained for each city, whereby the testing also involves a control case. In the standard setup, we train each CHOAM how urban value is generated. However, many schools of architecture have come to advocate for densification—perhaps because value seemed too much of a nonlinear a problem to tackle. In our control case, we demonstrate that this density-driven approach is problematic. While all our CHOAMs trained to predict value hence “CHOAMs-Value” help avoid urban ills such as fragmentation and gentrification, this cannot be said about the “CHOAMs-Density” trained to support densification. These latter CHOAMs-Density diminish most of the nonlinear mathematics during training. As a consequence, CHOAMs-Density are still successful in the sense that they would support practitioners in creating denser cities, but these cities turn out gentrified and devoid of value. Thus, we can confidently say that value is nonlinear—or value is diversity, not density.
In the sections that follow, we outline our results only. The methods are discussed in earlier articles and in the supplementary material, which also includes a summary of methods for data assembly and CHOAMs training. The computer code that has been utilized it is freely available from the authors upon request, and it has been shared in multiple academic settings, including seminars and workshops since 2023.
Results
CHOAMs Can Guide Practitioners to Build a Diverse City While Avoiding Urban Ills
In this section, we follow a simplified setup to check whether CHOAMs can guide investors, architects, and planners to build a diverse city while avoiding fragmentation and gentrification. Our investors, architects, and planners do not need to be sophisticated practitioners. We assume their actions are all profit-oriented. In principle, they would like to increase the value of a neighborhood, simply because this also brings them profit, but they are not always successful. Sometimes, they end up fueling urban ills such as fragmentation and gentrification only to generate real losses for themselves as well (Baciu et al., 2022).
We ask: if investors, architects, and planners all utilized our CHOAMs trained for their cities, would they end up building a diverse city? Answering this question also answers the question of whether CHOAMs can guide practitioners to avoid fragmentation and gentrification. Evidently, fragmentation and gentrification are cases in which urban diversity falls apart.
The method through which our CHOAMs can guide decision making is straightforward. In principle, a CHOAM trained for a given city is a collection of parameters representing all synergies and antagonism between pairwise activities. For example “leisure-eduction”, “leisure-shopping”, and “leisure-leisure” each have a value. If the value is above zero, we can refer to it as a synergy. If it is below, it is better referred to as antagonism or “anergy”. These parameters can be utilized to guide context-sensitive decisions.
The question a practitioner may ask is: Should I build a building that provides space for work, tourism, sports, leisure, cultural activities, or something else? To answer this question with a CHOAM, one must consider how much of each activity there already is in the urban context. Evidently, the activities that are already available generate synergies as well as antagonism. At the same time, all options to build something new add synergies and antagonism. The question of which option is best is thus broken down into how well the urban context functions by itself as it is before the intervention, and how well the insertion of each option plays into this context, generating new synergies while minimizing antagonism.
Utilizing this type of simulation, multiple investment options can be compared. The simulation estimates which option generates most total value for the entire urban context. It is in the own interest of the investor, architect, or practitioner to prioritize. The value that is generated benefits the urban context as a whole, including the practitioner who is a stakeholder in it.
In the simulation performed in the present section, we utilize this capacity of CHOAMs to simulate the effect of interventions and guide investors to prioritize the most valuable interventions. Following this logic, the stakeholder’s desire to generate value—and profit with it—is satisfied. The question is whether it is sufficient for stakeholders to simply wish to generate value and profit.
The answer that our experiments provide is clear. “Yes! It is sufficient to be value and profit-oriented, provided one utilizes CHOAMs or takes into account nonlinearity in some other way. This is shown in Figure 1.
Figure 1 also shows that taking into account nonlinearity is necessary, not optional. To demonstrate this, we designed an alternative setup that bypasses nonlinearity during modeling. In the standard setup, CHOAMs are trained to predict urban value, and the perception of value is always nonlinear. Value is complex, contextual, dynamic, chaotic—or you can use any other term that signifies nonlinearity. Our rationale in creating an alternative setup where nonlinearity is bypassed was to predict something that is linear. The choice fell on density because density is linear. It depends on the total count of items in an area, not on their pairwise interrelationship.
Thus, we develop a setup where we bypass nonlinearity by predicting density instead of value. The resulting models are trained based on the same activity data and with the same learning algorithms and training parameters. The difference is only that the predicted variable can be predicted through linear mathematics and does not require nonlinearity. The consequence is that the parameters that regulate the nonlinear behavior of the system are minimized. Therefore, our CHOAMs-Density are a way to downplay nonlinearity.
The problem is that this reduction in nonlinear behavior turns out fatal for the models. Just like any other CHOAMs, CHOAMs-Density can also be utilized to guide decisions. However, if the guidance is followed, the resulting cities do not grow diverse and valuable. They grow dense and monotonous. Gentrification and fragmentation are fueled. As soon as the city starts growing in one direction that can increase density, say “building more offices”, CHOAMs-Density will call for more densification with more offices. If investors, architects, and planners use CHOAMs-Density to guide their decision when building a new city, they end up building mono-functional, gentrified, cities. Fragmentation is a consequence of this type of mono-functionalization of cities. It’s all the same process where diversity, contextuality, complexity, and all other nonlinear aspects of urban life fall apart.
Diversity Is Good, as a Rule of Thumb, but Synergies Differ Greatly
Technically, CHOAMs are collections of parameters, each of which represents synergies or antagonism between pairs of urban activities. There are two types of pairs: same-type-pairs, e.g., “work, work”, and diverse-type pairs, e.g., “education, sports”. Studying these two different categories of pairs reveals an intriguing story about urban diversity. In our initial publication of CHOAMs, we specifically showcased that—as a rule of thumb—same-type transitions generate fewer synergies than diverse-type transitions (Baciu, 2025). This highlighted that urban diversity is beneficial, as a general rule.
However, it is important to be clear about the fact that diverse-type-pairs do not always create synergies. There is high variability across individual pairs. Some diverse-type-pairs may be particularly valuable, others are particularly problematic. Similarly, some same-type-pairs may not be too great, but others are fabulous. This observation has led us to conclude that it is crucial to train CHOAMs and obtain a clear, locally validated picture for each city (Baciu, 2024). However, this conclusion also prompted the question of how well the observation generalizes. Is diversity always good as a rule of thumb? Is there always high variability among the parameters?
In Figure 2, we showcase one main example, Boston. On the left is a statistic of parameter values separately into same-type-pairs and diverse-type-pairs. On close observation, one can see that the same-type-pairs are shifted slightly to the left, while the diverse-type-transitions are shifted slightly to the right. At the same time, the variance is much greater than the average shift. The distributions of parameter values for same-type-pairs and diverse-type-pairs mostly overlap.
The scatter plot on the right sides of Figure 2 visualizes the same-type-transitions, most of which fetch parameter values below zero, suggesting antagonism. The cloud on the upper left visualizes the diverse-type-pairs, with the yellow line marking the zero point. As can be seen, the cloud is shifted towards the right side of the yellow line.
Comparing all fifteen cities that we have studied the same picture emerges across all of them. As a rule of thumb, diversity is good, but variance is very high across parameter values, and it is crucial to be able to infer these values from empirical data, through CHOAMs or some other nonlinear framework.
As in the previous section, we can also work here with CHOAMs-Density. The CHOAMs-Density do not reveal the same properties. In particular, same-type-pairs are more valuable than diverse-type-pairs in CHOAMs-Density. This is the underlying reason why investment utilizing CHOAMs-Density fails to generate a diverse city, as has already been documented in Figure 1.
Facilitating Easy Access to Urban Activities Generates Value
To be precise, CHOAMs are not just there to learn the value of pairs like “sports–education”. We also take into account urban mobility. The pairs are actually transitions. A full transition is, for example, “sports — 6km/h × 10min — education”. Specifically, all our CHOAMs created for the set of fifteen cities take into account six different mobility options. The choice fell on 0.5, 4, 6, 15, 30, and 45 km/h, and is are explained in our earlier research.
Mobility has a very important role in urban life. It facilitates access to urban activities. Without access to activities, everything would fall apart. In general, easy access is crucial to all living systems, not just cities. The Constructal Law, formulated by Adrian Bejan (1997) goes so far as to state that living systems can only stay alive if they provide easy access to resources. Urbanism is certainly no exception (Bejan, Ledezma, 1998). Cities can only stay lively if they give inhabitants easy access to urban activities that engage them and sustain their livelihoods.
Considering such arguments, we’ve been particularly keen to empirically confirm whether access is valuable. Our studies of New York (Raszka, Baciu, 2022), Tel Aviv (Bianco, Baciu, 2022), and Wellington (2024) supported this conclusion. In New York, we found that commuter diversity attracted investors to build skyscrapers. In Tel Aviv, we’ve seen that the introduction of a light rail increased the perceived diversity of the city. In Wellington, we have discovered that different mobility options may even be related to different modes of life and value generation in different neighborhoods. The city center was more focused on slow-speed mobility, while peripheral areas functioned slightly differently, requiring faster means of transportation.
The present comparative study of fifteen cities reconfirms that urban mobility is valuable at multiple speeds. To illustrate this, we group CHOAM parameters by speed categories, and we look at the distributions of parameters in each category of 0.5, 4, 6, 15, 30, and 45 km/h. (This is an approach similar to the previous one when we grouped everything into same-type-pairs and diverse-type-pairs. The difference is that now the grouping is by speed classes instead of pair property.)
The study of various speed groups does reveal that some speeds are less valuable, but these are exactly the speed that are less realistic: 0.5km/h and 45km/h. As a matter of fact, 0.5km/h does not really reflect how people move through space. Walking speed is 4km/h. At the other end of the spectrum, 45km/h is also not particularly relevant. This may simply be the case because the option of driving through at this speed is mostly unavailable during regular business hours.
In Figure 3, we showcase a typical result of the speed category analysis, taking Boston as an example. As can be seen, the lowest speed of 0.5 km/h and the highest of 45 km/h have most CHOAM parameters close to zero. In contrast, large positive and negative values are found at the speeds in between.
A close look at the speed categories between 4km/h and 30km/h reveals something else, that we have previously observed. The parameter values vary very much within each speed category. It simply is not true that ten minutes by foot is good, while ten minutes by car is bad.
In recent years, some planners have advocated for the “10-minute city”. Apparently, one should be able to reach everything within ten minutes walking time. Our data both confirms and rejects this type of city. We do see slight ups and down, with speeds such as 6km/h and 30km/h generating more of the positive synergies in the case of Boston (Figure 3). Yet, already this case has both slow and fast mobility.
CHOAMs can be utilized to perform simulations and guide decisions on whether to build a particular road, bridge, or dedicated traffic lane. All one has to do is simulate how the changing mobility option changes the availability of activities, and, with it, the experienced urban value. The answer becomes straightforward. If a bike lane enhances urban value, it generates profit, and one should find a way to finance and build it.
What then, would be the result if investors followed the decisions suggested by CHOAMs simulations? Would they build a 10-minute walking-distance city? Utilizing CHOAMs practitioners would end up deciding to enhance the means of transportation that support mobility at certain speeds. In the case of Boston (Figure 3), these speeds are 6km/h and 30km/h. The reason is the same as in the case of diversity, where diverse-type-pairs were slightly better on average than same-type-pairs, which led investors to build a diverse city (Simulations in Figure 1). When it comes to Bostonian mobility, we see that 6km/h and 30km/h tend to produce a slightly higher number of synergies than the other speeds. When deciding which mobility options to expand, investors would be automatically guided towards these two. However, it should be said that these two speeds are not a universal result found in all cities. Cities vary in this respect and they can most likely also change over time. One could say, “The devil lies in the details!” CHOAMs can tirelessly infer the big picture together with the details.
CHOAMs Simulate the Effect of Interventions Locally and in Specific Time Frames
From empirical data, the CHOAMs framework infers all pairwise parameters for synergies and antagonism, taking into account means of transport that facilitate access to both same-type and diverse-type activities. In this way urban activities and mobility are both taken into account. This also means that CHOAMs can be utilized to perform at broad range of simulations. They can be used to simulate what happens to urban value when mobility options are changed. They can also be used to simulate what happens to urban values when the supply of different activities is changed. Thus, it is evident that CHOAMs can guide interventions that are sensitive to the urban network, the modes of transportation, the urban context, and different time frames (Baciu, 2024). Additionally, this guidance relies on parameters that have a clear physical meaning. Everything is transparent and reproducible. At the same time, simulations can be run in fractions of a second.
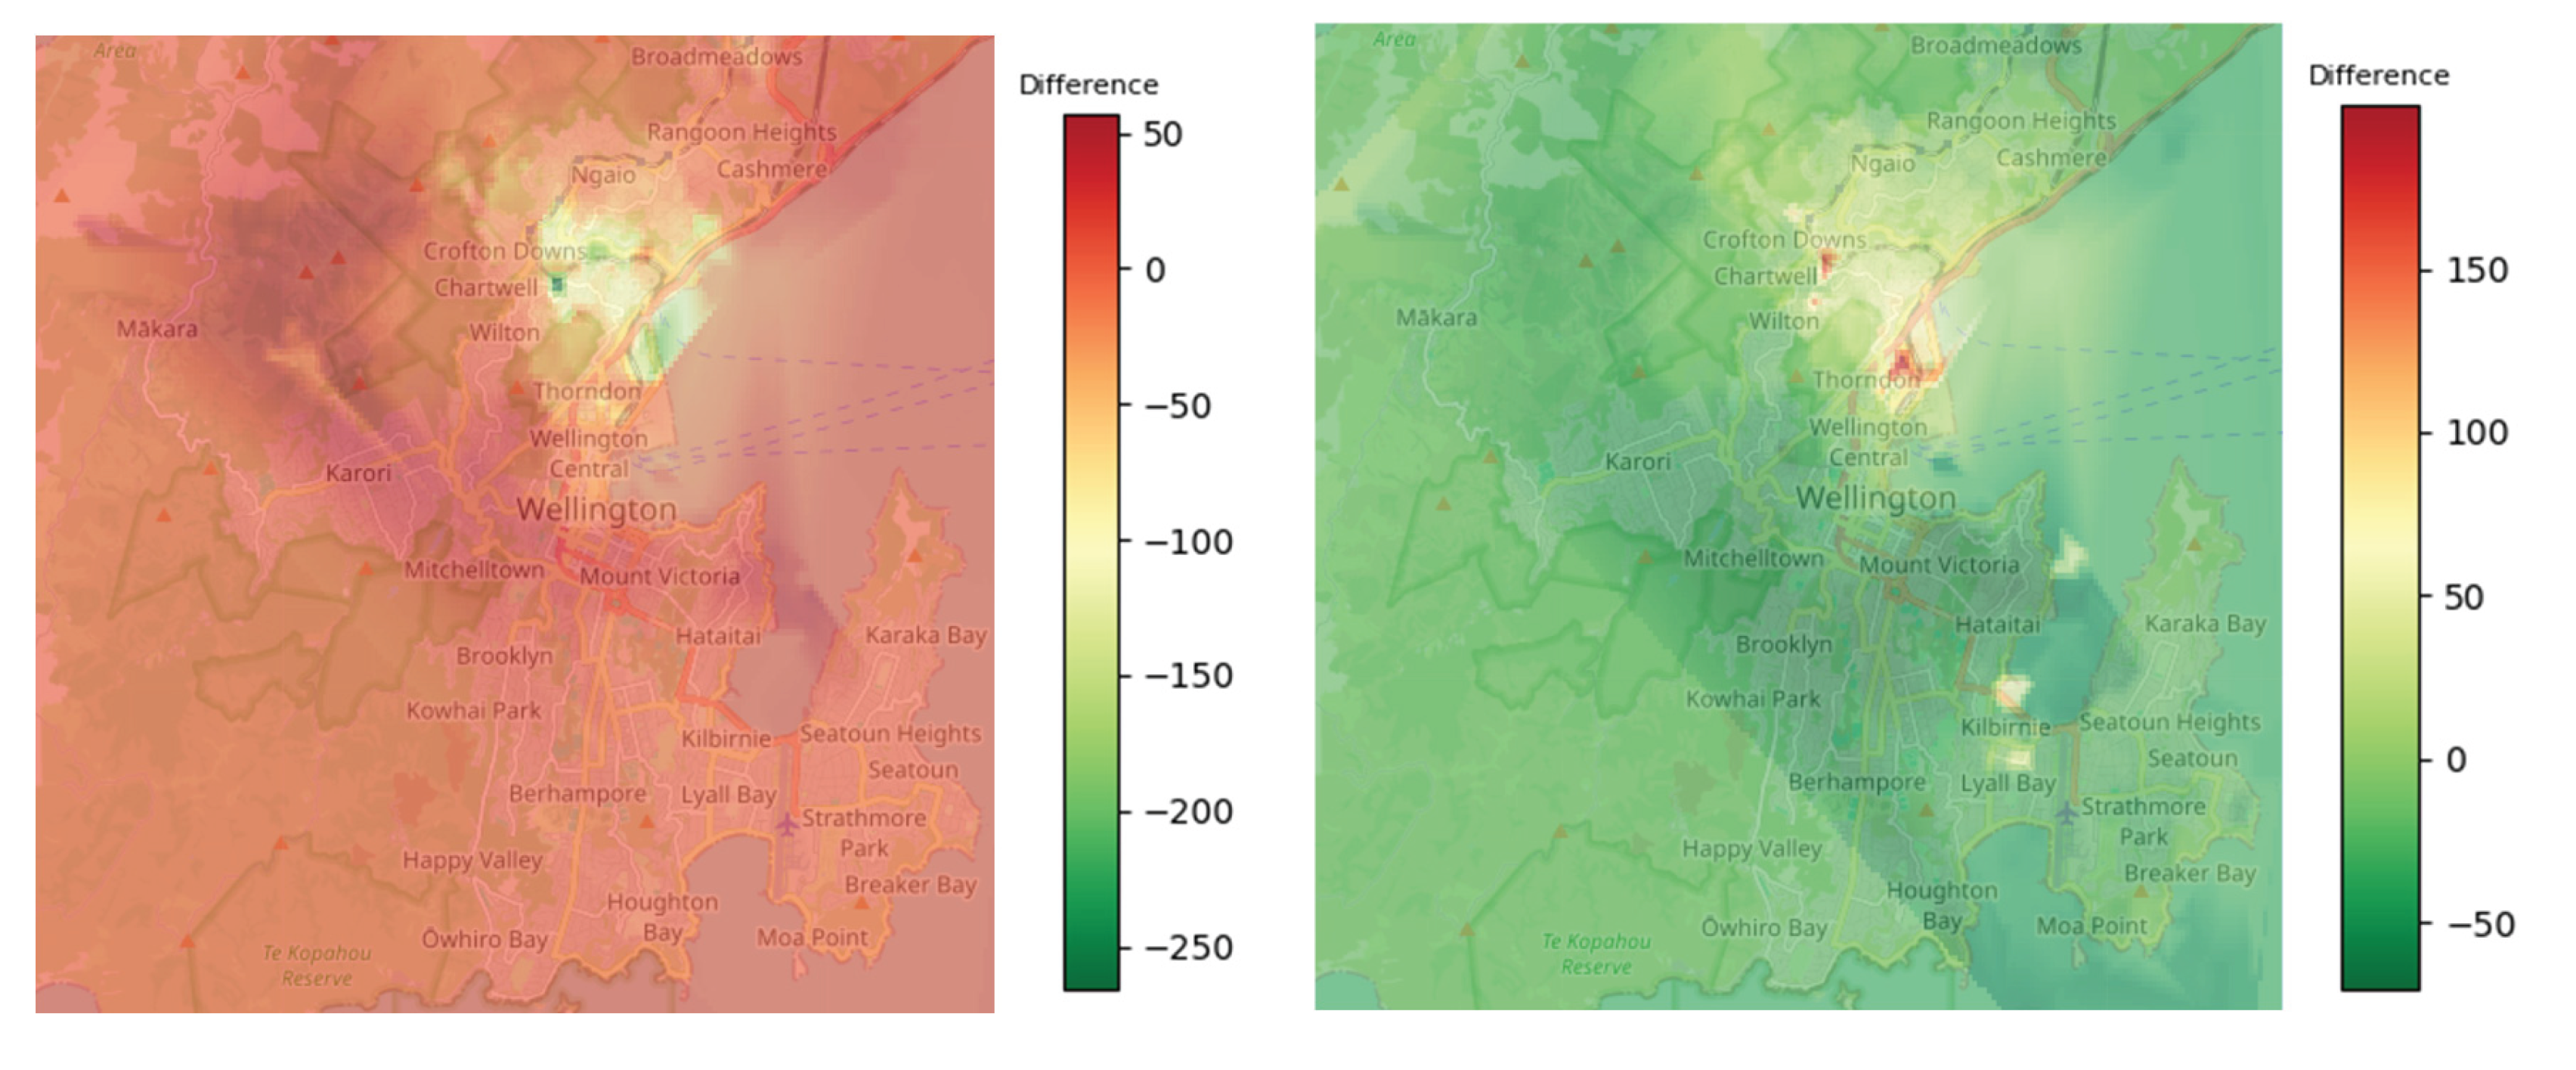
One example of how this works is shown below in Figure 4, which simulates what would happen if investors doubled their investment in two different types of buildings in Wellington, NZ. Rather than sitting and discussing endless hours and wildly speculating what the effect of such an increase would be—while never coming to a conclusion—CHOAMs can simulate the effect of doubling the availability of any activity. The simulation is run in fractions of a second, and it is based on transparent parameters that have been learned from empirical data.
Conclusion
Urban ills such as fragmentation and segregation still cause losses in the range of trillions of US-Dollars in the United States alone. The picture is similar in Europe, Oceania, and across the globe (Citigroup Global Perspectives & Solutions, 2020; Meltzer, 2016; Meltzer, Ghorbani, 2017; Metropolitan Planning Council, Urban Institute, 2017; Perry et al., 2018; World Bank, 2010). Here, we performed a comparative study of fifteen cities across Europe, Oceania, and the United States, demonstrating that the problem can be solved.
The solution is produced by systematically introducing nonlinear modeling in urbanism. Specifically, we implemented a mathematical framework that takes nonlinearity into account by describing city life through chains of urban activities models (CHOAMs). CHOAMs rely on nonlinear systems of equations to connect the supply of urban activities on one side of the system of equations with urban value on the other. Both sides of the systems of equations are complex. On the side of the supply of activities we have the activities themselves as well as different means of transportation that work at different speeds. On the side of the perceived value, the complexity is hidden in the numbers, which reflect urban value, which is something perceived by people and therefore a subjective part of human perception. The translation between these two complex sides is made through a nonlinear equations. Though the introduction of nonlinearity, the model can take into account a broad range of nonlinear phenomena of urban life: urban complexity, diversity, changing contexts and character, etc.
CHOAMs rely on nonlinear mathematics. Nevertheless, they can be trained within hours, and each parameter that is trained has a concrete physical meaning. This setup makes CHOAMs transparent and easy to handle, validate, and improved.
The main purpose of the present article is to compare the performance of CHOAMs across multiple cities. The results demonstrate that investors, architects, and planners relying on CHOAMs would successfully avoid gentrification, creating a diverse city in which different components work together to generate value, even in the starkest setting where they had to build a city from scratch.
By comparing different cities, the present study also reconfirms a number of rules that we postulated before ever having the cities:
- As a rule of thumb, diversity is valuable, while, at the same time, parameters vary greatly. Interplay between urban components results in synergies as well as antagonism. It is therefore particularly valuable to be able to infer parameters and perform simulations with CHOAMs.
- Bypassing nonlinearity is problematic and exacerbates urban ills. We demonstrated this by training CHOAMs-Density, which predict density—a variable that is computed through linear mathematics. These CHOAMs-Density fail to capture the value of the rich interplay between urban components, and, if utilized for decision making, would lead stakeholders astray, fueling urban ills, in particular gentrification and fragmentation. The result of utilizing CHOAMs-Density for decision making was mono-functional urban areas.
- Access to different activities is valuable, but it is relevant to consider what exact access is supported, because access can create new synergies as well as antagonism. CHOAMs can simulate how changes in mobility change the access to activities, often bolstering both, synergies and antagonism. As a concrete example, we found that pedestrian access can be valuable, but it can also be devoid of value, and the best mobility options of one city may not be ideal for another. Unlike the rule of thumb that diversity is valuable, on average, the mobility speed groups that are most valuable for a city may not be valuable for another. These groups are not universal. Advancing ideals of the kind of “build the-best-city-of-only-pedestrians” may not work in every city without other significant changes to the city’s design, available activities, and built urban infrastructures.
Architects, planners, and investors need a lifetime of experience to develop an internalized sense of their city’s nonlinear dynamics. The knowledge they acquire is hard to share. Similarly, it takes some time to learn how to ride a bike, and once learned, one cannot easily share the knowledge. By comparison, CHOAMs can be easily trained, they are transparent, and easily shareable and expandable. We hope that this will lead to an evolution of better and better models and ultimately to cities free of paradoxic losses in the range of trillions.
References
- Baciu, D.C. (2024). “Title How Changes In Urban Mobility Affect Experienced Urban Diversity: Case Study For Scenarios In Wellington.” SASBE conference, Auckland, NZ, 2024. [CrossRef]
- Baciu, D. C. (2023). Causal models, creativity, and diversity. Humanities and Social Science Communications. [CrossRef]
- Baciu, D.C. (2022). Mapping Urban Diversity: Applications. OSF Preprints. [CrossRef]
- Baciu, D. C., Mi, D., Birchall, C., Della Pietra, D., Loevezijn, L., & Nazou, A. (2022). Mapping diversity: From ecology and human geography to urbanism and culture. Springer Nature Social Sciences. [CrossRef]
- Bejan, A. (1997). Constructal-theory network of conducting paths for cooling a heat generating volume. International Journal of Heat and Mass Transfer, 40(4), 799–811. [CrossRef]
- Bejan, A., & Ledezma, G. A. (1998). Streets tree networks and urban growth: Optimal geometry for quickest access between a finite-size volume and one point. Physica A: Statistical Mechanics and Its Applications, 255(1–2), 211–217. [CrossRef]
- Bianco, C., & Baciu, D. C. (2024). Estimating how changes in mobility affect perceived urban diversity. Reinventing the City, Amsterdam Institute for Advanced Metropolitan Solutions, Amsterdam, Netherlands, April 26-28. https://osf.io/fhwr2/.
- Citigroup Global Perspectives & Solutions (2020). Closing the Racial Inequality Gaps: The Economic Cost of Black Inequality in the U.S.
- Jacobs, J. (1961). The Death and Life of Great American Cities. Random House.
- Mavromatidis, L. (2025). A constructal poly-narrative of architectural and urban practices and theories across history. Frontiers of Architectural Research. Advance online publication. [CrossRef]
- Mavromatidis, L. (2024). A heterogeneous architectural theory inspired by living thermodynamics: Unveiling “architectural ingenuity” using the constructal law. International Communications in Heat and Mass Transfer, 155, 107554. [CrossRef]
- Mavromatidis, L. (Ed.). (2020). Climatic Heterotopias as Spaces of Inclusion: Sew Up the Urban Fabric. ISTE Ltd. [CrossRef]
- Meltzer, R., & Ghorbani, P. (2017). Does gentrification increase employment opportunities in low-income neighborhoods? Regional Science and Urban Economics, 66, 52–73. [CrossRef]
- Meltzer, R. (2016). Gentrification and small business: Threat or opportunity? Cityscape, 18(3), 57–86.
- Metropolitan Planning Council & Urban Institute (2017). The Cost of Segregation: Lost Income, Lost Lives, Lost Potential. The Metropolitan Planning Council (with Urban Institute).
- Norberg-Schulz, C. (1980). Genius loci: Towards a phenomenology of architecture. New York, NY: Rizzoli.
- Perry, A., Rothwell, J., & Harshbarger, D. (2018). The Devaluation of Assets in Black Neighborhoods: The Case of Residential Property. Brookings Institution Metropolitan Policy Program.
- Raszka, P., & Baciu, D. C. (2022). Mapping commuter diversity in New York City: Diversification and vertical growth may form positive feedback loop. [CrossRef]
- Schelling, T. C. (1978). Micromotives and Macrobehavior. Fels Lectures on Public Policy Analysis. New York: W. W. Norton & Company.
- World Bank (2010). World Bank alerts European Governments to steep economic costs of Roma exclusion. Press release and accompanying study. worldbank.org.
Figure 1.
Shows how well the CHOAMs trained for our fifteen cities perform. We imagine starting to build a city from scratch. Each color represents a different type of activity. Clearly, CHOAMs trained to recognize synergies and antagonism will suggest building not a single type of the most profitable investment (Jane Jacobs’s “cash cow”) but a diverse city whose value exceeds the sum of its buildings. This is seen above in the explosion of many colors and growing diagonal line plots in each city. Conversely, utilizing the CHOAM-D trained to facilitate densification, below, leads to the creation of monotonous cities that may be dense, but are devoid of value due to their blatant monotony. If one adds buildings here, density increases, but value does not. This exemplifies the problem of gentrification: adding more items does not generate value, although they each cost. This effect emerges because the wrong items are added. CHOAMs-V avoids this.
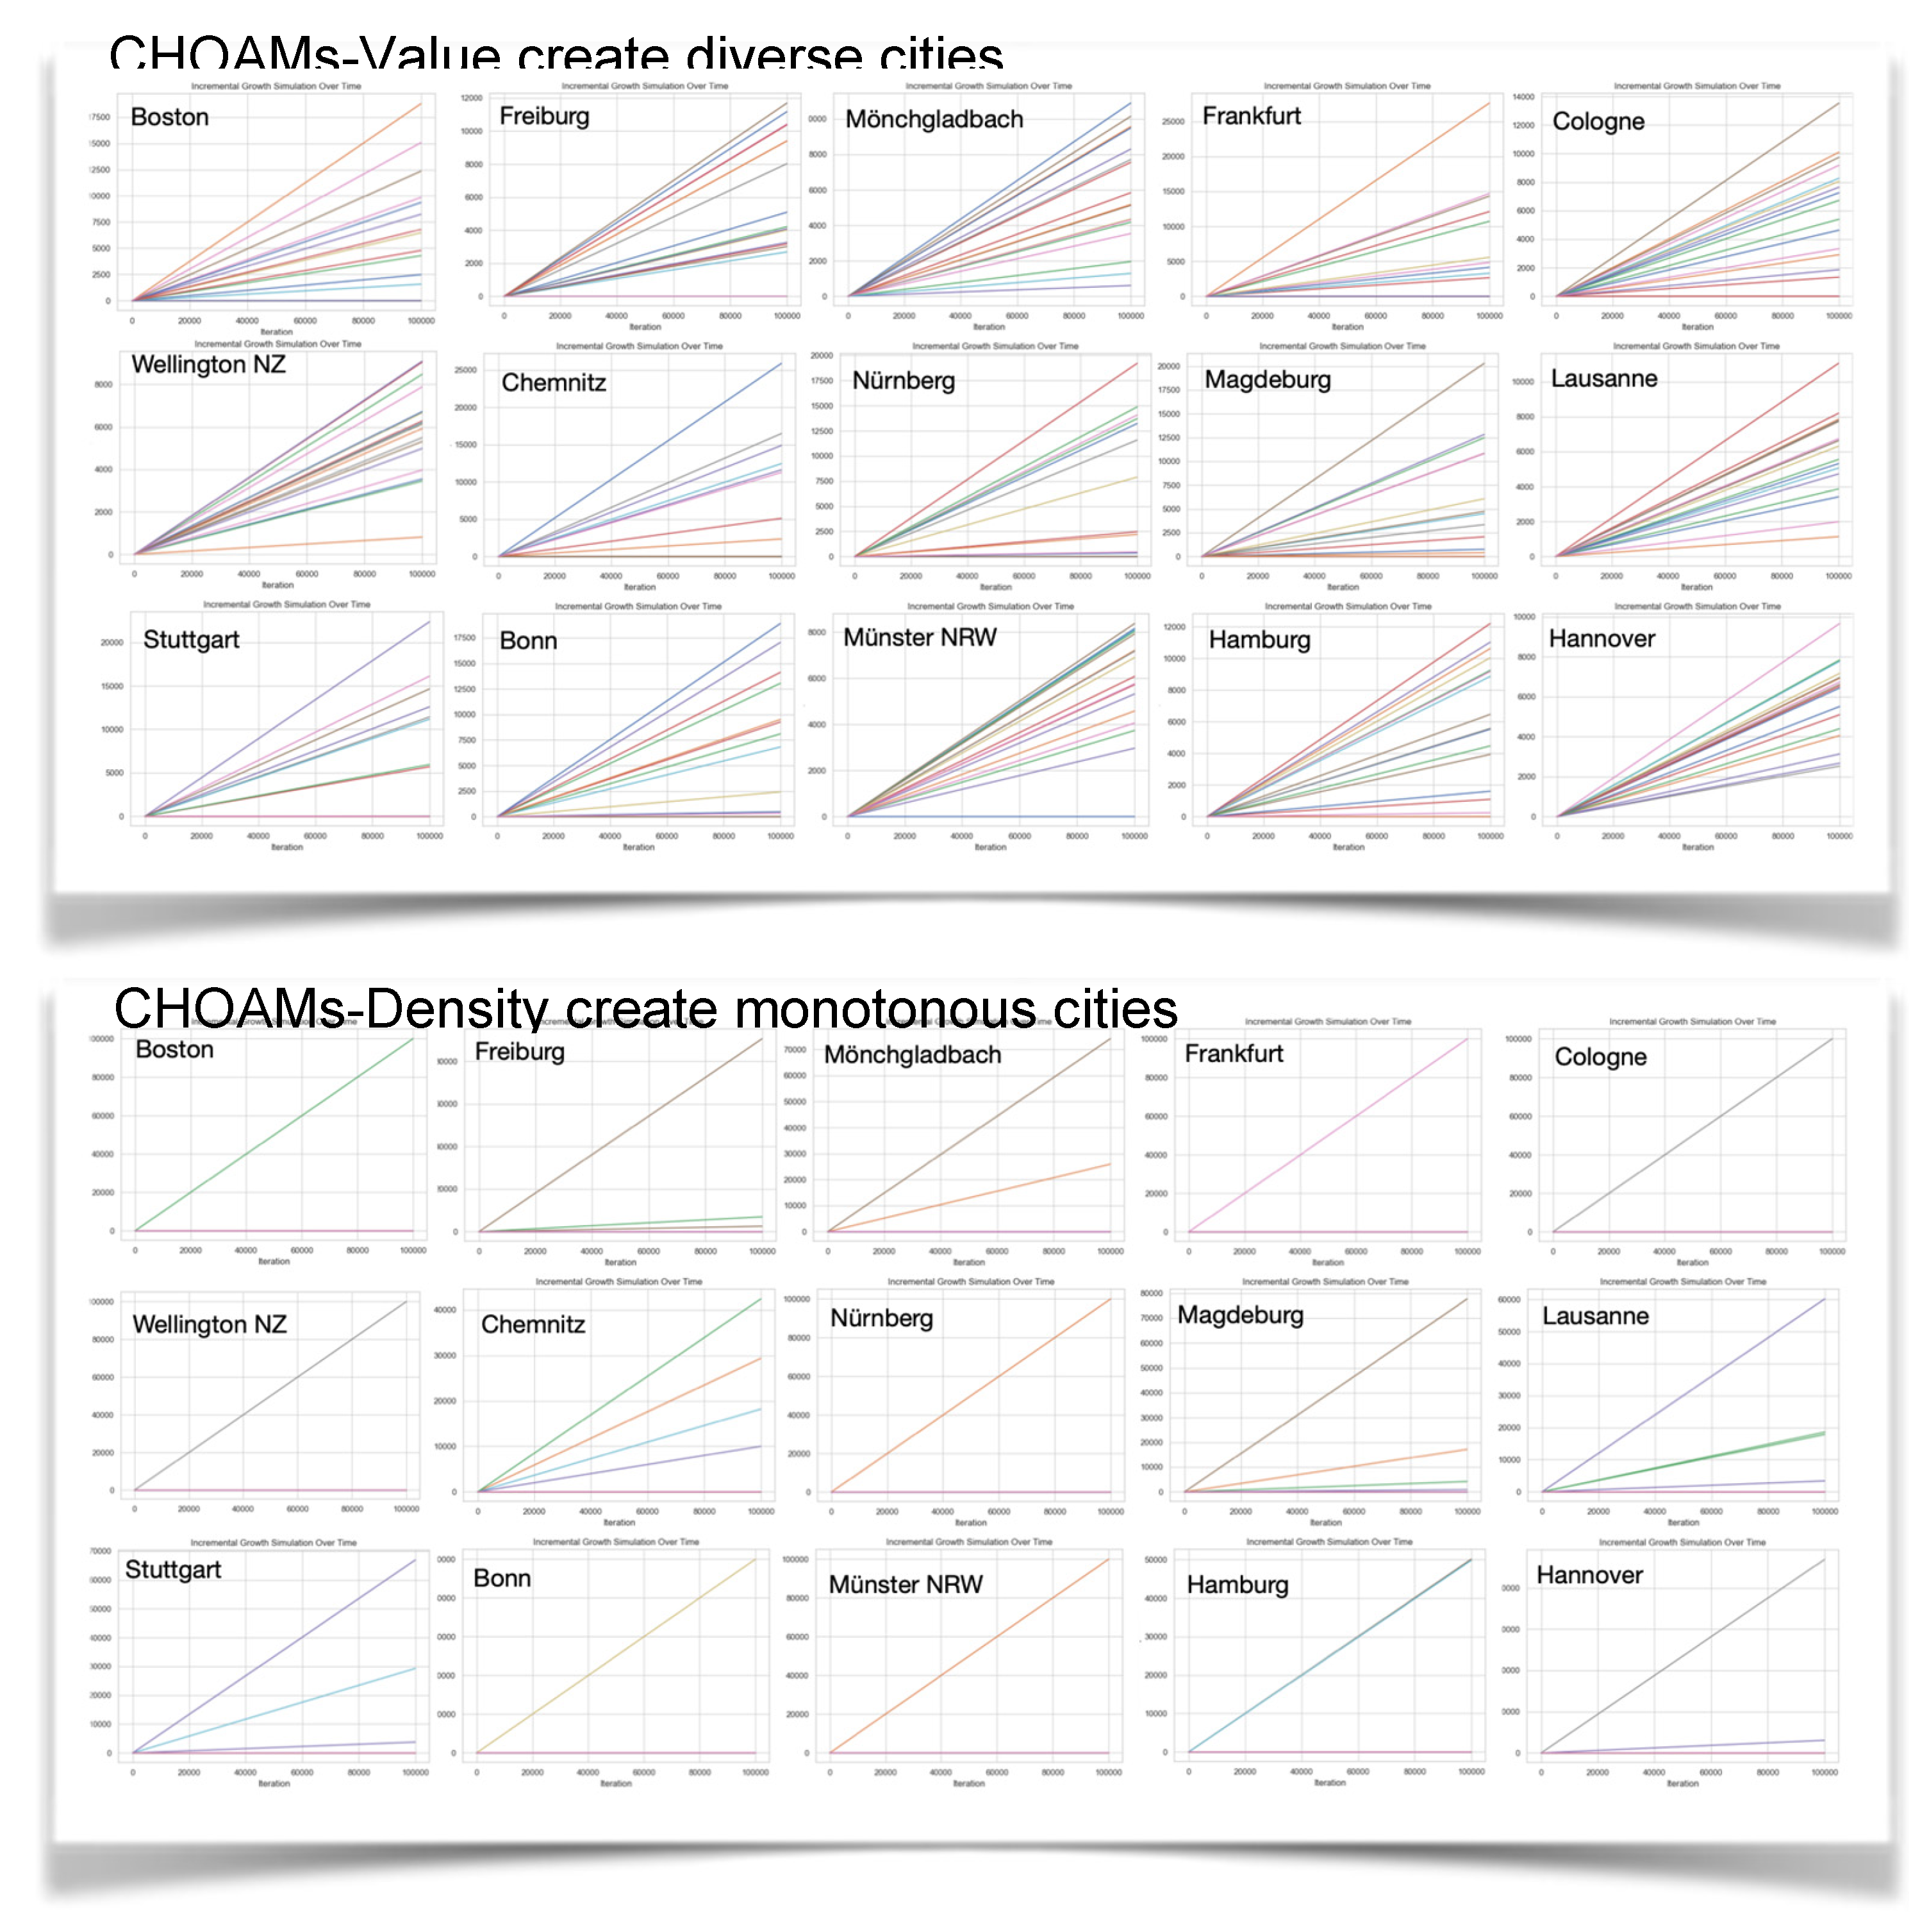
Figure 2.
Shows that parameters vary greatly. Same-type-pairs, such as “leisure-leisure”, are typically less valuable than diverse-type-pairs, such as “leisure-tourism”. This rule of thumb is a universal that holds across all cities. Nevertheless, it is also relevant to understand that there is great variation in the details. There are plenty of valuable same-type-pairs and plenty of worthless diverse-type-pairs. Left: The same-type-transitions are shifted slightly towards the left, while the diverse-type transitions are shifted towards the right. However, the variation within each of the two categories is much greater than this shift between them, making it crucial to learn the exact parameter values through CHOAM training. Right: Here on the x-axis is the value associated with each transition. Positive value means synergy. Negative value means antagonism within the transition. As can be seen, same-type-pairs are often negative. The y-axis is represents typical availability of the transition. Left above: The cloud of diverse-type-pairs has values shifted to the right of the yellow-zero line—a lot of positive synergies, and less antagonism. Nevertheless, the parameters vary greatly.
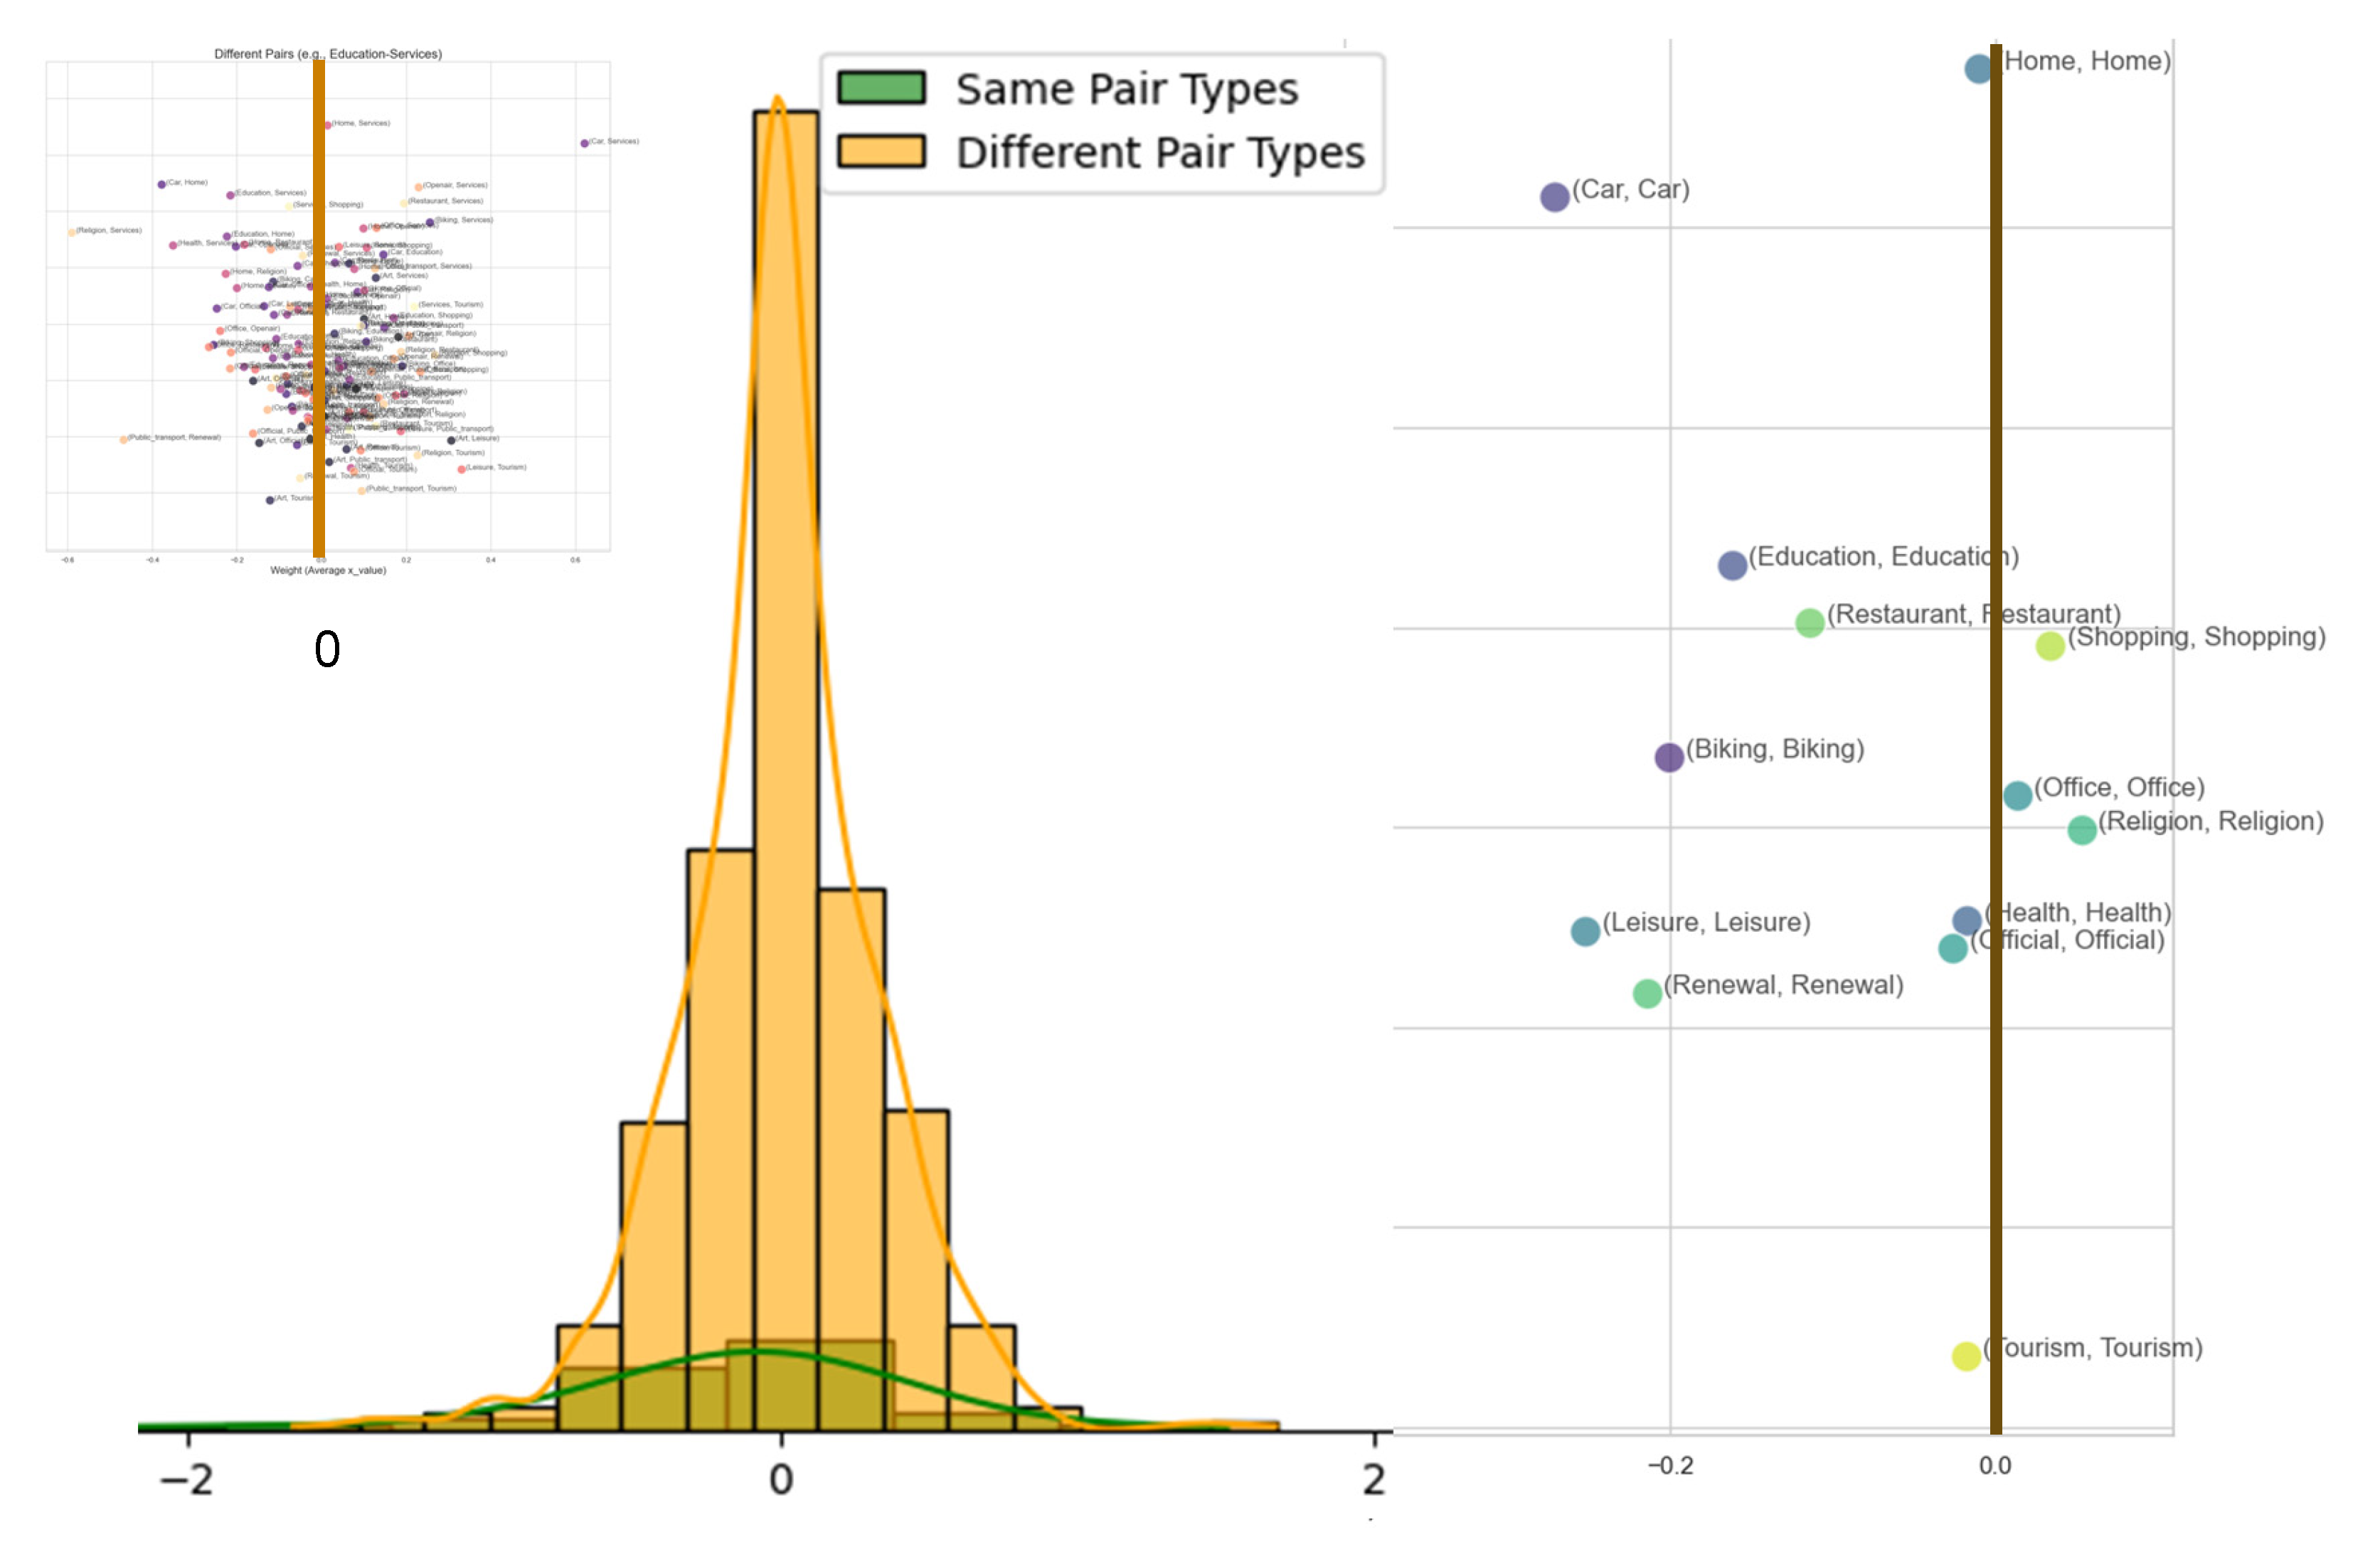
Figure 3.
Shows how different speeds generate urban value. From left to right, the speeds analyzed are 0.5, 4, 6, 15, 30, and 45 km/h. The colored bars signify mean plus one standard deviation on each side of the mean value. Evidently, the parameter values at 0.5 km/h and 45 km/h are closest to zero and therefore the least relevant. The speeds of 15 km/h and 30 km/h have a mean value slightly above zero. They are slightly more important towards generating synergies than the other speeds, but this is not a universal result valid across all cities. In addition, similar to the distinction between diverse-type-pairs and same-type-pairs, it is plainly visible that the variation within each speed is greater than the overall differences between different speeds. Here too, it is therefore valuable to train a CHOAM and know the exact parameter values.
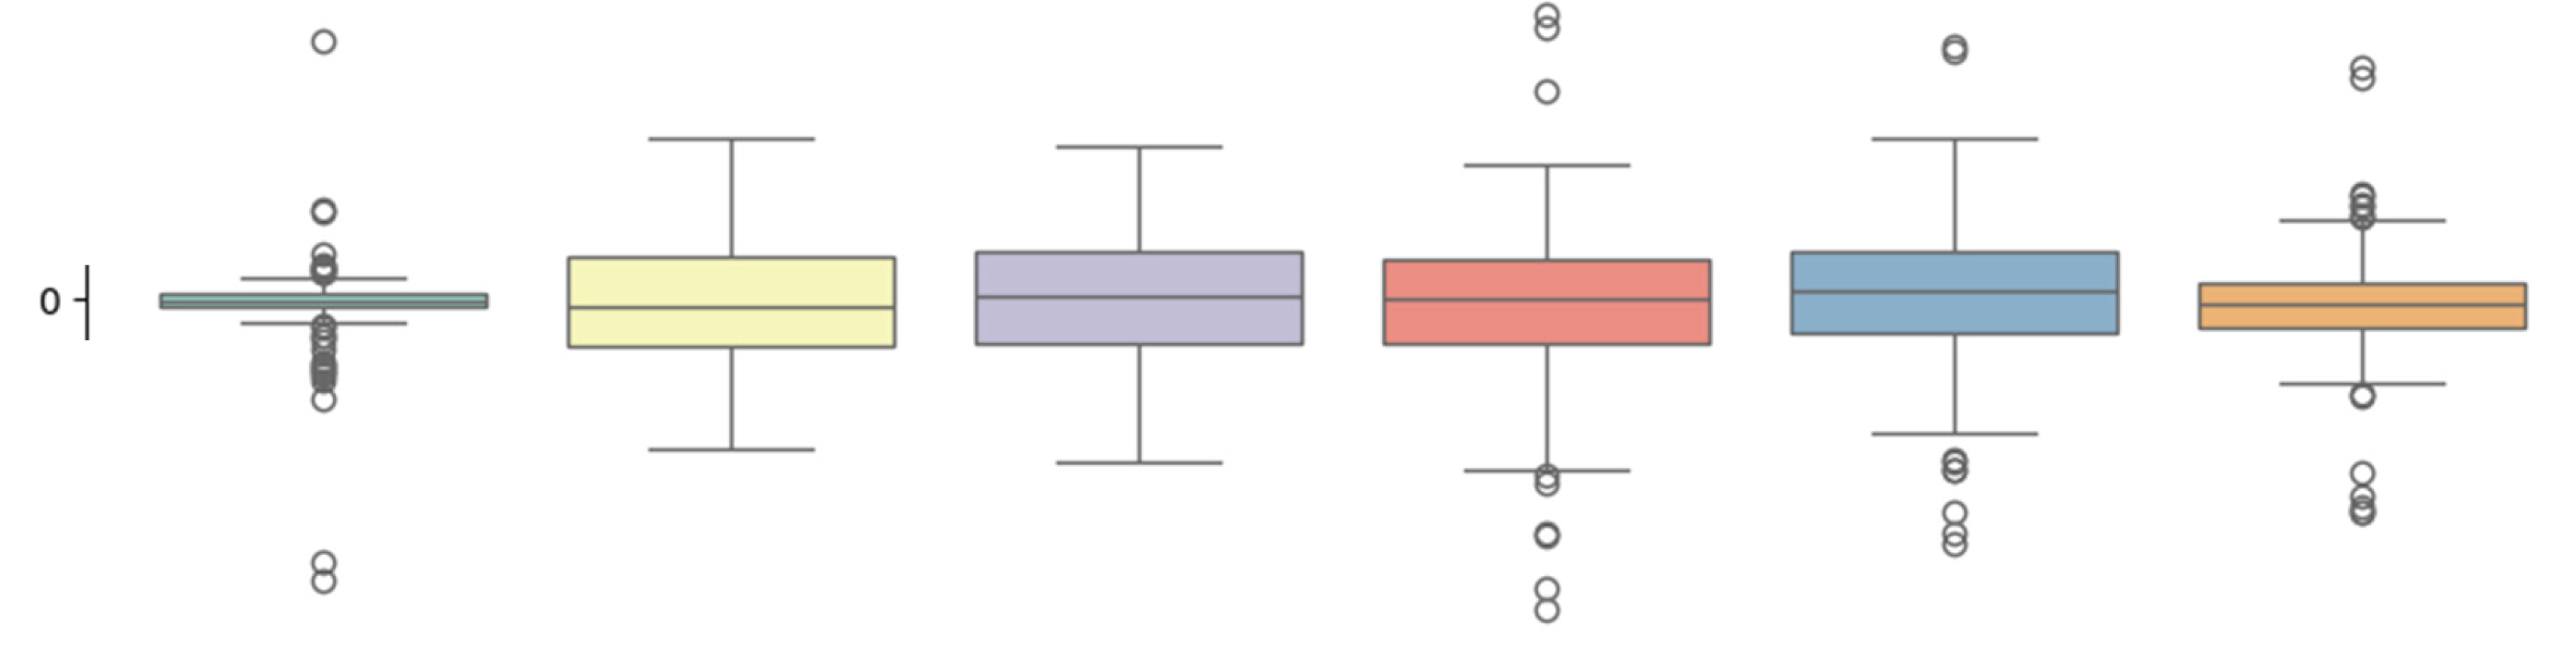
Figure 4.
Simulates what would happen if the number of touristic or educational activities were doubled in Wellington, NZ (Baciu, 2024). Left: touristic activities are doubled; this generates increased value especially outside the port areas, which are already flooded with tourism. Right: educational activities are doubled; this generates increased value in quite different places. Fieldwork quickly validated the results, suggesting they are realistic.
Disclaimer/Publisher’s Note: The statements, opinions and data contained in all publications are solely those of the individual author(s) and contributor(s) and not of MDPI and/or the editor(s). MDPI and/or the editor(s) disclaim responsibility for any injury to people or property resulting from any ideas, methods, instructions or products referred to in the content. |
© 2025 by the author. Licensee MDPI, Basel, Switzerland. This article is an open access article distributed under the terms and conditions of the Creative Commons Attribution (CC BY) license (http://creativecommons.org/licenses/by/4.0/).
Copyright: This open access article is published under a Creative Commons CC BY 4.0 license, which permit the free download, distribution, and reuse, provided that the author and preprint are cited in any reuse.


