Submitted:
30 June 2025
Posted:
02 July 2025
You are already at the latest version
Abstract
The increasing demand for edible flowers exhibiting both visual appeal and functional properties has prompted scholarly interest in light-based strategies to enhance their quality. This study investigated the impact of blue light duration on morphological traits, antioxidant activity, and phytochemical accumulation in two Viola cultivars with varying petal sizes. Plants were cultivated under a 12-hour daily photoperiod, during which the irradiation time of white (W) and blue (B) LEDs was varied among treatments (W12+B0, W8+B4, W4+B8, W0+B12), while maintaining constant total light intensity. The results indicated that prolonged B light exposure significantly elevated plant height and flowering rate, particularly in the smaller-petaled cultivar ‘Delta Beaconsfield’ (DB), while also promoting anthocyanin synthesis and ABTS-based antioxidant activity. Conversely, the cultivar ‘Delta Trueblue’ (DT) demonstrated higher total phenolic and flavonoid contents under mixed W+B illumination and exhibited a more robust DPPH radical scavenging capacity. Notably, DB maintained elevated chlorophyll levels even under monochromatic B light, suggesting a distinctive photoadaptive or light-harvesting mechanism. The differential responses observed between cultivars and assays reflect variations in the light-regulated synthesis of hydrophilic and lipophilic antioxidants. These findings underscore the potential of spectral manipulation, particularly through blue light, to enhance the functional quality of edible Viola flowers.
Keywords:
Antioxidant activity
; Blue light
; Edible flower
; Photomorphogenesis
; Photoperiod
; Viola × wittrockiana
1. Introduction
In recent years, the popularity of edible flowers has steadily grown, driven by consumer interest in naturally sourced ingredients that combine visual appeal with potential health-promoting properties[1]. Among the various edible flowers, the Viola genus (Violaceae) is highly regarded for its attractive blossoms and delicate sweetness, qualities that have led to its frequent use as a garnish in gourmet cuisine [2]. Beyond their culinary appeal, these flowers have also been used in traditional medicine for centuries, highlighting their historical and cultural relevance [2]. This dual significance is further supported by their rich nutritional profile, as Viola flowers are a source of bioactive compounds with antioxidant and anti-inflammatory properties [3,4]. The biological activities of Viola species, including antioxidant, anti-inflammatory, and antimicrobial effects, have been largely attributed to their phenolic and flavonoid content [5,6]. Among these, violanthin has been identified as principal constituent contributing to the antioxidant capacity of Viola flowers [7,8]. In addition to flavone glycosides, such as violanthin, purple-colored Viola petals are also rich in anthocyanins, which are water-soluble pigments that not only provide vibrant coloration but also exhibit strong antioxidant properties by scavenging free radicals and reducing oxidative stress [3,8,9]. The abundance of anthocyanins in Viola flowers further enhances their functional value, suggesting a potential role in promoting health when incorporated into the human diet [10].
Despite their established culinary and ornamental appeal, the nutritional and phytochemical qualities of Viola flowers remain highly dependent on cultivation practices. As these edible flowers are increasingly regarded as functional food sources, controlled environment agriculture has emerged as a vital approach to improving their physiological and metabolic quality [11]. In particular, the composition of bioactive compounds in Viola flowers can be enhanced by optimizing the light environment [11]. Among various environmental factors, light quality has been shown to directly influence not only biomass production but also the biosynthesis of health-related phytochemicals in several plant species [12,13]. Therefore, understanding and manipulating the light conditions provide a promising strategy to improve the functional value of these edible flowers, supporting their use as a rich source of health-promoting phytochemicals.
Among the environmental factors, light quality and duration induce the tissue development, coloration, and biochemical accumulation of ornamental plants [14]. In controlled cultivation environments, manipulating the light spectrum allows growers to regulate photosynthetic activity and steer the synthesis of secondary metabolites such as flavonoids, phenolic compounds, and anthocyanins, all of which contribute to the nutritional and sensory properties of edible flowers [11,15,16]. Particularly, blue light has garnered attention for its unique role in altering plant architecture, promoting chlorophyll synthesis, and stimulating the accumulation of flavonoids and anthocyanins [17,18,19,20]. As a result, targeted application of blue light may serve as an effective means to boost both the visual and functional qualities of Viola flower in controlled horticultural systems. Notably, blue light or ultraviolet wavelengths have attracted particular attention for their role in promoting the accumulation of these bioactive substances, enhancing both the health benefits and the visual vibrancy of floral tissues [16,21].
Although the impact of specific light wavelengths on several crops has been well established, relatively few studies have addressed how modifying daily exposure to blue light affects the antioxidant potential and phytochemical profile of edible Viola flowers with contrasting morphological characteristics. Moreover, the correlation between petal size differences and these chemical traits under varying light regimens remains poorly understood; yet, such knowledge could guide growers in producing high-value flowers with tailored functional attributes.
In this context, this study was conducted to evaluate how different daily schedules of blue light influence key bioactive properties, including antioxidant activity measured by DPPH and ABTS assays, total flavonoid content, total phenolic content, and anthocyanin levels, in purple-colored petals from two Viola cultivars that differ in petal size. By addressing these relationships, this study aims to provide practical insights for the horticultural industry to optimize light management for edible flower production, meeting the rising demand for fresh, nutrient-rich floral ingredients in modern cuisine.
2. Materials and Methods
2.1. Plant Samples
Two cultivars of Viola × wittrockiana were determined as experimental materials, including ‘Delta Trueblue (DT)’ and ’Delta Beaconsfield (DB)’. The two cultivars have purple-colored petals, which are larger in size in DT than in DB (Figure 1A). Their F1 seeds were sown in plug cell trays (128 cells, 2.8 cm width × 2.8 cm length × 4 cm height) filled with horticultural soil mixture of peatmoss and vermiculite at 3:1 (v:v) ratio. Ten days after sowing, the germinated seedlings were placed under a white LED light modulated with a 12-h photoperiod in a growth chamber controlled to 20 °C during the day and 15 °C at night, with 70% relative humidity. During the nursery period, a nutrient solution with an EC of 1.5 mS cm−1 and pH range of 5.5-6.0 was applied twice per week. The solution was prepared using calcium nitrate, potassium nitrate, monopotassium phosphate, and magnesium sulfate in the ratio N:P:K:Mg:Ca = 1:0.35:2:0.2:1, following a previous literature [22]. It provided approximately 100 ppm of N, 35 ppm of P, 200 ppm of K, 20 ppm of Mg, and 100 ppm of Ca. After a 4-week nursery period, when 8-10 true leaves appeared, the seedlings were individually transplanted into 10 cm (diameter) × 8 cm (height) plastic pots filled with a soil mixture of peatmoss and perlite at a 2:1 (v/v) ratio. For each cultivar, 15 seedlings were selected per replicate. Subsequently, the seedling pots were arranged in a randomized complete block design and placed in growth chambers maintained at 22 °C during the day and 18 °C at night, with a relative humidity of 70%. For each plant pot, 250 mL of nutrient solution was supplied weekly through an automatic drip irrigation system. The ratio of macro-elements was similar to nursery fertilizer, but the concentration was increased to exhibit 3.5 mS cm−1 of EC value and pH 5.5-6.0, including 1.4 g L−1 Ca(NO3)2·4H2O, 0.76 g L−1 KNO3, 0.34 g L−1 KH2PO4, and 0.45 g L−1 MgSO4·7H2O.
2.2. Artificial light treatments
After transplantation, four kinds of artificial light conditions were irradiated to DT and DB plants. Under the specified light conditions, total photoperiodic time and intensity were uniformly applied to all treatments, with a duration of 12 hours per day from 06:00 to 18:00 and an intensity of 100 µmol m−2 s−1, respectively. Two types of LED lamps were used to provide different light qualities, such as white T5 LED lamps (W) and blue T5 LED lamps (B). The W lamp includes broad wavelength range from 405 to 725 nm with a 453 nm of maximum peak and the B lamp emits narrow wavelength with maximum peak at 453 nm (Figure 1B). For 12 h of photoperiod, irradiation time of W and B lamps was modulated according to four categories: (1) W12+B0, (2) W8+B4, (3) W4+B8, and (4) W0+B12 (Figure 1C).
2.3. Biological Assays of Plant Growth
On 35th day after light treatment, vegetative and inflorescent qualities were measured, such as plant height, leaf area, total chlorophyll content (TCC), the number of flowers, and functional properties of flowers. Plant height (cm) was described as the length from the soil surface to the shoot apical meristem. Leaf area (cm²) was analyzed using ImageJ software (version 1.54, bundled with Java 8, National Institutes of Health, Bethesda, MD, USA) and presented as the average values of the 10th to 13th leaf area. TCC (mg g DW−1) was measured using absorbances at 645 and 663 nm of 80% methanol extraction from freeze-dried leaves. The TCC was calculated according to the revised equation [23]. The number of flowers was counted daily using fully bloomed flowers. Subsequently, the counted flowers were harvested and immediately kept at −80 °C until further analysis of functional properties.
2.4. Analysis of Functional Properties of Petals
2.4.1. Sample Extraction
From freeze-dried flowers, greenish sepals were removed, and petals were only collected. And then, the petals were finely ground. The ground powder (1 g) was extracted using 200 mL of 80% methanol (v/v) containing 1% HCl for 24 hours at 20 °C in a shaking incubator sustaining 120 rpm and in the dark. The extract was filtered through a 0.45 µm membrane filter (Futecs Co., Ltd., Daejeon, Republic of Korea), and then the solvent was removed using a rotary evaporator at 35 °C. Each concentrated sample was dissolved in the extraction solvent at a concentration of 1 mg mL−1 for functional property analysis.
2.4.2. DPPH and ABTS Assays
Antioxidant activities of petals were presented by radical-scavenging activities of 2,2-diphenyl-1-picrylhydrazyl (DPPH) and 2,2′-azino-bis (3-ethylbenzothiazoline-6-sulphonic acid) (ABTS). They were measured using a previously described method [24]. For DPPH activity, a 0.1 mM DPPH solution was prepared and adjusted to an absorbance value of 0.65 ± 0.02 at 517 nm. Then, each sample (50 µL) was added to 2.95 mL of the DPPH solution. The absorbance was measured at 517 nm after a 30-minute incubation at 23 °C in a dark chamber. For ABTS activity, 2.5 mM of ABTS and 1 mM of 2,2′-Azobis(2-amidinopropane) dihydrochloride in phosphate-buffered saline were mixed and heated at 70 °C for 40 min. The ABTS radical solution (0.98 mL), after filtering through a 0.45 μm syringe filter, was added to 0.02 mL of the sample (1 mg mL−1). The absorbance was measured at 734 nm after a 10-minute incubation at 37 °C. DPPH and ABTS radical-scavenging activities were expressed as milligrams of vitamin C equivalents (VCE) per gram dry weight.
2.4.3. Determination of Total Phenolic and Total Flavonoid Content
The total phenolic content (TPC) was estimated using the Folin–Ciocalteu colorimetric assay, as originally described in previous literature [25], with slight modifications. Specifically, 0.2 mL of the prepared extraction was diluted with 2.6 mL of distilled water, and then combined with 0.2 mL of Folin–Ciocalteu reagent (Sigma-Aldrich Co., MO, USA). Following a 6-minute reaction period at ambient temperature, 0.2 mL of 7% sodium carbonate was added, and the mixture was kept in the dark for 90 minutes. Absorbance was subsequently measured at 750 nm using a UV-Vis spectrophotometer (S-4100, Scinco Co., Seoul, Korea). TPC was expressed as milligrams of gallic acid equivalents (GAE) per gram dry weight.
The total flavonoid content (TFC) was measured using a colorimetric procedure outlined in a previous literature [26], with minor modifications. A 0.5 mL aliquot of the extract was combined with 0.15 mL of a 5% sodium nitrite solution and 3.2 mL of distilled water. After allowing the mixture to stand for 5 minutes, 0.15 mL of 10% aluminum chloride was added, followed by 1.0 mL of 1 M sodium hydroxide. The absorbance was then measured at 510 nm using a spectrophotometer. TFC was calculated as milligrams of catechin equivalents (CE) per gram dry weight.
2.4.4. Colorimetric Assay of Total Anthocyanin Content
Total anthocyanin content (TAC) was determined using a pH-dependent colorimetric method adapted from previous studies [11]. Briefly, 0.1 g of freeze-dried and finely ground petals was extracted in 80% methanol containing 1% HCl in the dark at 4°C for 12 h with gentle shaking. The extract was centrifuged at 14,000 g for 15 minutes to obtain a clear supernatant. The supernatant (0.001 L) was separately mixed with 0.009 L of 25 mM potassium chloride buffer (pH 1.0) and 0.009 L of 0.4 M sodium acetate buffer (pH 4.5). The absorbance of each dilution was measured at 520 nm and 700 nm using a UV–Vis spectrophotometer (S-4100, Scinco Co., Seoul, Korea). TAC was then calculated as milligrams of cyanidin-3-glucoside equivalents (C3GE) per gram dry weight using a previously described equation [11].
2.5. Statistical Analysis
In each treatment, 15 individual Viola plants were used per replicate, and the experiment was conducted in three independent replicates. All data are exhibited as mean values with standard errors of these three replicates (n = 3). Statistical differences among the treatments were determined through Tukey's studentized range test (HSD) at p < 0.05 level. Pearson's correlation coefficients and Principal component analysis (PCA) score plots were exhibited to compare the correlation among antioxidant activities in each Viola cultivar. The statistical data were calculated using SAS software (SAS Enterprise Guide, version 7.1; SAS Institute Inc., NC, USA).
3. Results
3.1. Vegetative Growth and Inflorescent Properties
The effects of varying durations of W and B LED irradiation on plant height in two Viola cultivars are presented in Table 1. Compared to continuous W LED, increasing the proportion of B LED exposure significantly increased plant height in both cultivars. In the DT cultivar, plant height was 3.30 ± 0.47 cm under W12+B0 treatment, and increased gradually to 11.50 ± 0.29 cm under continuous B LED irradiation (W0+B12). A similar effect was observed in the DB cultivar, where plant height ranged from 2.67 ± 0.20 cm under W12+B0 treatment to 16.40 ± 2.03 cm under W0+B12 treatment. Across all light treatments, the DB consistently displayed greater plant height than DT, with the most pronounced difference detected under the continuous B LED irradiation without W LED.
Leaf area was also affected by different durations of W and B LED irradiation, and these effects varied depending on the cultivar (Table 1). In the DT, continuous B LED irradiation significantly expanded the leaf area to 12.68 ± 0.42 cm2. In contrast, the other treatments with partial B LED irradiation of less than 8 hours could not induce comparable leaf expansion. The DB cultivar had the smallest leaf area under the W12+B0 treatment; however, leaf area expanded when B LED irradiation was applied for 4 hours or longer.
Total chlorophylls were accumulated the highest in Viola leaves, which had been exposed to continuous white light (Table 1). The TCC of the DT cultivar was gradually reduced as the duration of the B LED increased, resulting in the lowest TCC in the W0+B12 treatment. However, the DB cultivar exhibited a different pattern. The TCC decreased when the blue light had a 4-h or 8-h photoperiod, compared to continuous white light. In continuous B LED irradiation without W LED (W0+B12), the TCC increased again as 4.77 ± 0.14 mg g DW−1, which was similar to the TCC of W12+B0 treatment (5.05 ± 0.02 mg g−1 DW).
The number of flowers of the two Viola cultivars, DT and DB, was counted daily for 35 days after transplanting (DAP), and the plants were exposed to each light condition after transplanting. As shown in Figure 2, the continuous B LED irradiation without W LED (W0+B12) triggered the inflorescence of the two cultivars. Subsequently, flowers were observed in W8+B4 treatment on DAP 17 of DT and DAP 14 of DB (Figure 2). In the DT cultivar, all light treatments on DAP 20 induced the inflorescence. However, the DB cultivar exhibited flowering in the W8+B4 treatment on DAP 26, while the W0+B12 treatment group did not show any flowering at all for 35 days (Figure 2).

Table 2.
Vegetative growth parameters of two Viola cultivars, 'Delta Trueblue' (DT) and 'Delta Beaconsfield' (DB), cultivated under different light qualities and durations.
Table 2.
Vegetative growth parameters of two Viola cultivars, 'Delta Trueblue' (DT) and 'Delta Beaconsfield' (DB), cultivated under different light qualities and durations.
| Cultivar | Treatment | Plant Height (cm) | Leaf Area (cm2) | Total Chlorophyll Content (mg g−1 DW) |
|---|---|---|---|---|
| DT | W12+B0 | 3.30 ± 0.47 b | 10.80 ± 0.32 b | 3.36 ± 0.02 a |
| W8+B4 | 4.40 ± 0.49 b | 10.52 ± 0.39 b | 2.50 ± 0.02 c | |
| W4+B8 | 4.87 ± 0.07 b | 9.82 ± 0.48 b | 2.73 ± 0.02 b | |
| W0+B12 | 11.50 ± 0.29 a | 12.68 ± 0.42 a | 1.64 ± 0.03 d | |
| DB | W12+B0 | 2.67 ± 0.20 b | 3.99 ± 0.27 b | 5.05 ± 0.02 a |
| W8+B4 | 5.13 ± 0.07 b | 6.02 ± 0.16 a | 4.05 ± 0.01 b | |
| W4+B8 | 7.00 ± 0.64 b | 5.54 ± 0.11 a | 3.82 ± 0.03 b | |
| W0+B12 | 16.40 ± 2.03 a | 6.28 ± 0.38 a | 4.77 ± 0.14 a |
Different letters within each column indicate significant differences among treatments in each cultivar. The significant differences were analyzed by Tukey's HSD test at p < 0.05.
3.2. DPPH and ABTS Radical-Scavenging Activities
Antioxidant activities in petals of DT and DB Viola cultivars irradiated with different light conditions during the culture period were evaluated by determining radical-scavenging activities of DPPH and ABTS (Figure 3). Between the DT and DB cultivars, the DT cultivar showed higher DPPH and ABTS radical-scavenging activities than the DB cultivar. In the DT cultivar, the DPPH activity exhibited 137.1 mg VCE g−1 DW in W12+B0. The activity decreased as the duration of B LED increased, decreasing by 27.1% to 99.9 mg VCE g−1 DW in W0+B12. The ABTS activity in DT petals presented high value in W12+B0 and W4+B8 treatments, exhibiting 165.2 and 169.2 mg VCE g−1 DW, respectively (Figure 3). Meanwhile, the ABTS radical-scavenging activity was higher than DPPH activity in the petals of the DB cultivar. In particular, the DPPH activity in DB cultivar exhibited a relatively low value when the duration of B LED was longer than four hours; however, the ABTS activity gradually increased by B LED exposure (Figure 3).
3.3. Total Phenolic, Total Flavonoid, and Total Anthocyanin Content
Total phenolic content (TPC) and total flavonoid content (TFC) were measured in two Viola cultivars DT and DB under four different light treatments (Figure 4). In all light conditions, the TPC was consistently higher in DT than in DB (Figure 4A). Among the treatments, the TPC of DT ranged from 86.8 to 96.0 mg GAE g−1 DW, while that of DB remained considerably lower, ranging form 36.1 to 37.0 mg GAE g−1 DW. No significant variation in TPC was observed across the different light treatments within the DB cultivar, indicating a relatively stable response to blue light duration in terms of phenolic content.
Similarly, the TFC was substantially higher in DT compared with DB across all conditions (Figure 4B). In DT petals, TFC values ranged between 67.3 and 79.8 mg CE g−1 DW, whereas DB showed significantly lower TFC levels, ranging from 8.2 to 22.9 mg CE g−1 DW. Notably, the TFC in DB was more responsive to blue light duration, with the highest value observed under the longest B LED exposure (W0+B12).
The total anthocyanin content (TAC) in the petals of two Viola cultivars, DT and DB, was evaluated under four different light treatments (Figure 4C). Under each light condition, DB exhibited higher TAC compared with DT. In particular, the TAC in DB increased progressively with longer B LED exposure, reaching a maximum of 17.1 mg C3GE g−1 DW under the longest B LED (W0+B12).
3.4. Correlation Analysis and PCA
Pearson's correlation coefficients were calculated to examine the relationships among bioactive compounds and antioxidant activities in petal of the two Viola cultivars grown different light treatments (Figure 5). In the DT cultivar, a strong positive correlation was observed between ABTS and TPC (R = 0.765, p < 0.01), and also between DPPH and ABTS (R = 0.741, p < 0.01). TFC exhibited a significant negative correlation with DPPH (R = −0.585, p < 0.05), while significant correlations were hardly observed between TAC and any of the measured variables. The correlation between DPPH and TPC was moderate (R = 0.449), but not statistically significant. In the DB cultivar, more pronounced correlations were observed. TFC was significantly and positively correlated with both ABTS (R = 0.912, p < 0.001) and TPC (R = 0.820, p < 0.01), as well as with TAC (R = 0.905, p < 0.001). A strong correlation was also found between ABTS and TAC (R = 0.957, p < 0.001). In contrast, DPPH showed significant negative correlations with ABTS (R = −0.828, p < 0.01), TPC (R = −0.721, p < 0.05), TFC (R = −0.872, p < 0.01), and TAC (R = −0.706, p < 0.05). These correlation patterns suggest distinct relationships between antioxidant capacity and phenolic compound content, depending on the cultivar.
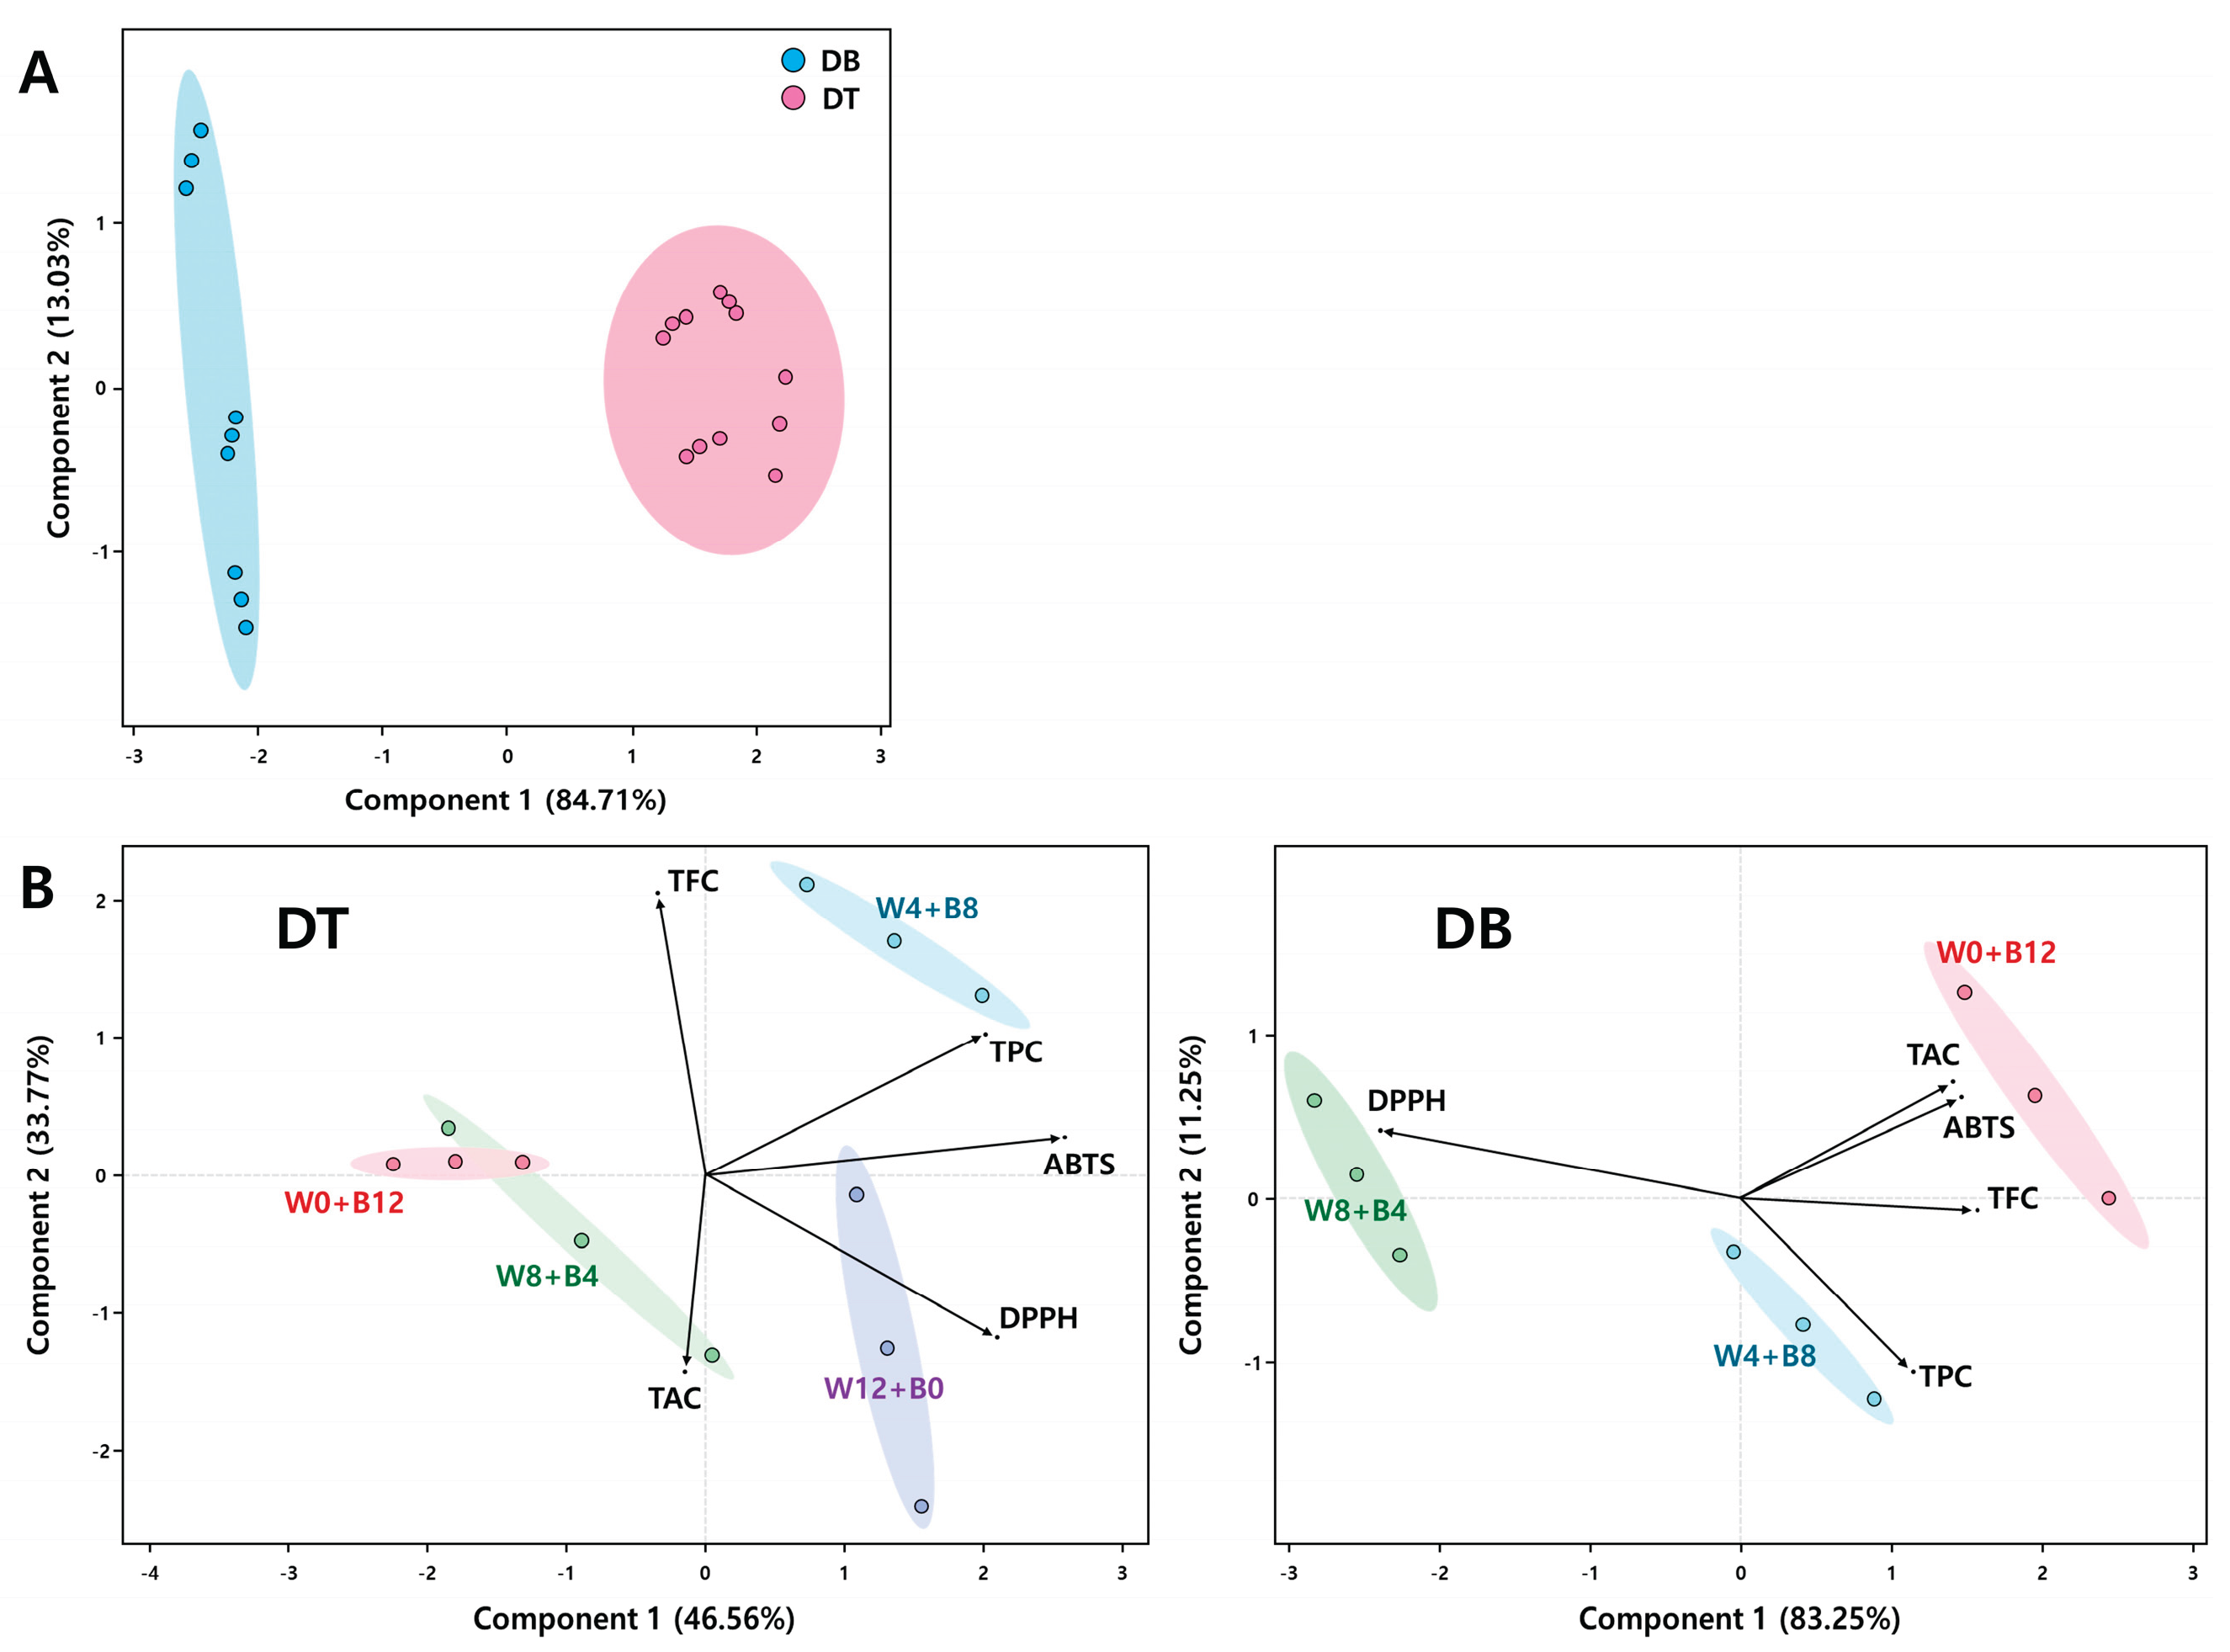
Principal component analysis (PCA) was conducted to evaluate the variation in bioactive compound accumulation and antioxidant capacity between Viola cultivars (DT and DB) and among light treatment groups (Figure 6). Figure 6A illustrates the PCA score plot comparing the two cultivars based on all measured variables. The first principal component (PC1) accounted for 84.71% of the total variance, while the second component (PC2) explained an additional 13.03%. A clear separation between DB and DT was observed along PC1, indicating that the two cultivars differ significantly in their overall phytochemical profiles and antioxidant activities. Figure 6B presents separate PCA biplots for each cultivar under different light treatments. For the DT cultivar, PC1 and PC2 explained 46.56% and 33.77% of the total variance, respectively. The W4+B8 treatment group clustered distinctly in the upper right quadrant and was strongly associated with higher TPC and TFC levels. In contrast, the W12+B0 group exhibited enhanced DPPH radical scavenging activity, while the W0+B12 and W8+B4 groups were positioned near the center and lower left, respectively, indicating relatively lower associations with antioxidant parameters. In the DB cultivar, PC1 and PC2 explained 83.25% and 11.25% of the variance, respectively. The W0+B12 group was clearly separated and aligned with elevated levels of TAC and ABTS activity, while the W4+B8 group was associated with TPC and TFC. The W8+B4 group formed a distinct cluster correlated with DPPH activity. These PCA results confirm that light quality and duration exert distinct effects on the accumulation of phenolics, flavonoids, anthocyanins, and antioxidant activity, and that the two cultivars respond differentially to these treatments.
4. Discussion
The present study demonstrated that the quality and duration of light during a photoperiod strongly affected morphological growth and the accumulation of bioactive compounds in Viola species. DT and DB cultivars consistently showed greater plant height and leaf area under extended exposure to B LED. These photomorphological differences may be due to the inherent species-specific sensitivity to blue light, which is known to regulate stem elongation and leaf expansion through cryptochrome-mediated signaling pathways [27,28].
Regarding photosynthetic pigment content, continuous white light (W12+B0) produced the highest TCC in both cultivars. However, the DB cultivar uniquely increased TCC under continuous blue light (W0+B12), whereas DT showed a gradual decrease in TCC as the duration of B LED increased. These findings suggest that DB might have a more efficient photoadaptive response to monochromatic blue light, potentially through improved chloroplast development or decreased photoinhibition under high-energy short-wavelength radiation [29]. In particular, although the leaf area of DB was exhibited as narrower than that of DT, the chlorophylls were more accumulated in the foliar tissues of the DB cultivar. These results suggest that the DB may possess a more efficient photosynthetic apparatus, allowing for greater chlorophyll accumulation per unit leaf area, despite a relatively small total leaf surface. Such a physiological trait is often associated with enhanced light capture efficiency and photochemical capacity, particularly under light-limited or high-energy light environments [29]. A high chlorophyll concentration in a compact leaf structure can be advantageous, as it increases the photosynthetic rate per unit area while minimizing resource allocation to leaf expansion [29,30]. This strategy has been observed in specific stress-tolerant or high-efficiency cultivars, where chloroplast density and pigment accumulation are optimized for better energy utilization [30]. Therefore, the significantly higher chlorophyll content in DB leaves suggests a possible photoprotective or light-harvesting adaptation under monochromatic blue light conditions, contributing to its overall photophysiological resilience.
The flowering response of the two Viola cultivars was strongly influenced by the spectral composition and duration of light during the daily photoperiod. In both DT and DB, continuous B LED irradiation (W0+B12) markedly promoted earlier flowering and produced a greater number of flowers compared to treatments with a longer duration of W LED. These findings suggest that an extended duration of blue light, rather than white light, can serve as a key environmental cue to accelerate floral induction and enhance reproductive development in Viola. Notably, DB exhibited no flowering under continuous white light (W12+B0) throughout the DAP 35 of the experimental period, instead maintaining a persistent vegetative growth. This phenomenon is closely linked to the physiological role of chlorophyll and its nitrogen-rich molecular structure [31]. Under the W12+B0 condition, the DB cultivar recorded the highest TCC among all treatments, suggesting a lowered carbon-to-nitrogen (C/N) ratio in plant tissue. A low C/N ratio is generally associated with sustained vegetative growth, as the relative abundance of nitrogen supports chlorophyll synthesis and primary metabolic processes rather than the transition to reproductive development [32]. Interestingly, despite their similarly high chlorophyll accumulation, the DB plants under the W0+B12 treatment did exhibit flowering, which initially appears contradictory. However, this can be interpreted as a specific photomorphogenic response to the high energy of short-wavelength radiation, specifically blue light, which is known to play a direct role in floral induction via cryptochrome-mediated signaling pathways [33]. Therefore, in the DB cultivar, the combination of high chlorophyll levels and extended exposure to blue light may have created a unique physiological context in which floral induction was promoted not by nutrient imbalance, but by strong blue light signaling. These findings emphasize the dual influence of both metabolic state and light quality on the transition from vegetative to reproductive growth in Viola.
The antioxidant activity in petals, measured by DPPH and ABTS radical-scavenging assays, showed distinct patterns not only between cultivars but also in relation to each assay’s physicochemical properties. DT consistently demonstrated higher overall antioxidant capacity than DB across all treatments, indicating a cultivar-specific tendency toward antioxidant biosynthesis or accumulation. However, it is also important to recognize the differing sensitivities of the two assays. The DPPH assay mainly reflects the scavenging ability of hydrophobic antioxidants, while the ABTS assay can detect both hydrophobic and hydrophilic antioxidant compounds [34]. In DT, antioxidant activity, measured by DPPH, decreased with increasing blue light exposure, suggesting that the biosynthesis or stability of hydrophobic antioxidants, such as tocopherols or carotenoids, may be less supported under monochromatic blue light conditions compared to white light conditions. Conversely, DB showed increased ABTS activity with more prolonged exposure to blue light, implying that hydrophilic antioxidants, such as phenolic acids or certain flavonoids, may have been induced under this specific spectral condition. These findings suggest that the differences in antioxidant capacity between cultivars are not solely genetic but also reflect the light spectrum’s regulatory effects on particular classes of antioxidant compounds with varying solubility and reactivity to light. Therefore, using both DPPH and ABTS assays together offers valuable complementary insights into how light quality influences the balance of hydrophobic versus hydrophilic antioxidants in edible flower petals.
Analysis of secondary metabolites further confirmed the distinction between cultivars. DT showed significantly higher TPC and TFC than DB, regardless of light conditions, indicating a more substantial capacity for biosynthesis of these compounds. Interestingly, while TPC remained relatively stable across all treatments in DB, TFC increased notably under W0+B12, suggesting that flavonoid biosynthesis in DB is more responsive to light than phenolic accumulation. In addition, the TAC was consistently higher in DB and increased with more prolonged exposure to B LED. Blue light is well-known to activate genes involved in anthocyanin biosynthesis, such as CHS, DFR, and ANS, through the activation of HY5 and other light-responsive transcription factors [35,36].
Correlation analysis revealed contrasting patterns of metabolic coordination between the two cultivars. In DT, ABTS activity was significantly associated with TPC, while TFC showed a negative correlation with DPPH activity, indicating different antioxidant mechanisms depending on the compound type. Conversely, in DB, strong and positive correlations were observed among TPC, TFC, and TAC, all of which also had high correlations with ABTS. These findings suggest that DB relies on a coordinated buildup of phenolics and flavonoids for antioxidant defense under light stress, whereas DT may employ a wider array of antioxidant pathways. PCA distinctly separated the two cultivars, and within each, distinguished between the light treatments. In DT, the W4+B8 treatment was linked to higher TPC and TFC levels. Meanwhile, W12+B0 was closely associated with DPPH activity, indicating that mixed-spectrum light can enhance both secondary metabolite production and antioxidant activity. In the case of the DB, W0+B12 was associated with higher TAC and ABTS values, while W8+B4 was more closely related to DPPH. These results emphasize the importance of both the light spectrum and photoperiod in shaping metabolic responses, highlighting the need for cultivar-specific optimization of light conditions in controlled environment agriculture, consistent with previous literature [37].
5. Conclusions
In conclusion, the two Viola cultivars exhibited significantly different responses to light quality and duration, particularly concerning antioxidant activity and secondary metabolite accumulation. These findings underscore the significance of cultivar-specific photophysiological traits and highlight spectral optimization as a non-chemical method for enhancing the functional quality of edible ornamental plants. Demonstrating that blue light can selectively influence the biosynthesis of vital phytochemicals based on genotype and exposure regime, this study offers a foundation for precise horticultural lighting aimed at achieving both aesthetic and nutritional objectives. Furthermore, the distinct biochemical responses imply that underlying regulatory pathways—potentially involving light-responsive transcription factors and metabolic pathways—are affected by specific light wavelengths. Consequently, future investigations should concentrate on transcriptomic and metabolomic analyses to elucidate the molecular mechanisms underlying these photomorphogenic and phytochemical alterations. Such comprehensive research will be instrumental in developing high-value ornamental crops with improved health benefits.
Author Contributions
Conceptualization, C.S.G.; methodology, S.J.; software, S.J.; validation, C.S.G.; formal analysis, S.J.; data curation, S.J. and C.S.G.; writing—original draft preparation, S.J.; writing—review and editing, C.S.G.; visualization, S.J.; supervision, C.S.G. All authors have read and agreed to the published version of the manuscript.
Data Availability Statement
The data generated and analyzed in this study are available from the corresponding author upon reasonable request.
Conflicts of Interest
The authors declare no conflicts of interest.
References
- Jadhav, H.B.; Badwaik, L.S.; Annapure, U.; Casanova, F.; Alaskar, K. A review on the journey of edible flowers from farm to consumer's plate. Appl. Food Res. 2023, 3, 100312. [CrossRef]
- Rodrigues, H.; Spence, C. Looking to the future, by studying the history of edible flowers. Int. J. Gastron. Food Sci. 2023, 34, 100805. [CrossRef]
- Ikeura, H.; Kobayashi, F.; Kai, T.; Tsuchiya, Y.; Tamaki, M. Flower colour and antioxidant activity of violas (Viola× wittrockiana) as edible flowers. J. Hortic. Sci. Biotechnol. 2023, 98, 678–684. [CrossRef]
- Carboni, A.D.; Di Renzo, T.; Nazzaro, S.; Marena, P.; Puppo, M.C.; Reale, A. A comprehensive review of edible flowers with a focus on microbiological, nutritional, and potential health aspects. Foods 2025, 14, 1719. [CrossRef]
- Piana, M.; Silva, M.A.; Trevisan, G.; Brum, T.F.; Silva, C.R.; Boligon, A.A.; Oliveira, S.M.; Zadra, M.; Hoffmeister, C.; Rossato, M.F.; Tonello, R.; Laporta, L.V.; Freitas, R.B.; Belke, B.V.; Jesus, R.S.; Ferreira, J.; Athayde, M.L. Antiinflammatory effects of Viola tricolor gel in a model of sunburn in rats and the gel stability study. J. Ethnopharmacol. 2013, 150, 458–465. [CrossRef]
- Hellinger, R.; Koehbach, J.; Fedchuk, H.; Sauer, B.; Huber, R.; Gruber, C.W.; Gründemann, C. Immunosuppressive activity of an aqueous Viola tricolor herbal extract. J. Ethnopharmacol. 2014, 151, 299–306. [CrossRef]
- Vukics, V.; Kery, A.; Bonn, G.K.; Guttman, A. Major flavonoid components of heartsease (Viola tricolor L.) and their antioxidant activities. Anal. Bioanal. Chem. 2008, 390, 1917–1925. [CrossRef]
- Koike, A.; Barreira, J.C.; Barros, L.; Santos-Buelga, C.; Villavicencio, A.L.; Ferreira, I.C. Edible flowers of Viola tricolor L. as a new functional food: Antioxidant activity, individual phenolics and effects of gamma and electron-beam irradiation. Food Chem. 2015, 179, 6–14. [CrossRef]
- Garcia, C.; Blesso, C.N. Antioxidant properties of anthocyanins and their mechanism of action in atherosclerosis. Free Radical Biol. Med. 2021, 172, 152–166. [CrossRef]
- Mittu, B.; Chaturvedi, A.; Sharma, R.; Singh, M.; Begum, Z. Chapter 18: Viola tricolor and Viola odorata. In Edible Flowers, Academic Press, 2024, pp. 325–354.
- Locatelli, S.; Zanin, G.; Sambo, P.; Nicoletto, C. Effects of LED irradiation and non-thermal plasma treatment on horned pansy during flowering: Enhancing yield and functional quality of edible flowers. Horticulturae 2024, 10, 1274. [CrossRef]
- Darko, E.; Hamow, K.A.; Marček, T.; Dernovics, M.; Ahres, M.; Galiba, G. Modulated light dependence of growth, flowering, and the accumulation of secondary metabolites in chilli. Front. Plant Sci. 2022, 13, 801656. [CrossRef]
- Loi, M.; Villani, A.; Paciolla, F.; Mulè, G.; Paciolla, C. Challenges and opportunities of light-emitting diode (LED) as key to modulate antioxidant compounds in plants. A review. Antioxidants 2020, 10, 42. [CrossRef]
- Murthy, H.N.; Joseph, K.S.; Paek, K.Y.; Park, S.Y. Light as an elicitor for enhanced production of secondary metabolites in plant cell, tissue, and organ cultures. Plant Growth Regul. 2024, 104, 31–49. [CrossRef]
- Fu, Z.; Shang, H.; Jiang, H.; Gao, J.; Dong, X.; Wang, H.; Li, Y.; Wang, L.; Zhang, J.; Shu, Q.; Chao, Y.; Xu, M.; Wang, R.; Wang, L.; Zhang, H. Systematic identification of the light-quality responding anthocyanin synthesis-related transcripts in Petunia petals. Hortic. Plant J. 2020, 6, 428–438. [CrossRef]
- Taulavuori, K.; Pyysalo, A.; Taulavuori, E.; Julkunen-Tiitto, R. Responses of phenolic acid and flavonoid synthesis to blue and blue-violet light depends on plant species. Environ. Exp. Bot. 2018, 150, 183–187. [CrossRef]
- Poudel, P.R.; Kataoka, I.; Mochioka, R. Effect of red-and blue-light-emitting diodes on growth and morphogenesis of grapes. Plant Cell Tissue Organ Cult. 2008, 92, 147–153. [CrossRef]
- Terfa, M.T.; Solhaug, K.A.; Gislerød, H.R.; Olsen, J.E.; Torre, S. A high proportion of blue light increases the photosynthesis capacity and leaf formation rate of Rosa× hybrida but does not affect time to flower opening. Physiol. Plant. 2013, 148, 146–159. [CrossRef]
- Zhang, Y.; Jiang, L.; Li, Y.; Chen, Q.; Ye, Y.; Zhang, Y.; Luo, Y.; Sun, B.; Wang, X.; Tang, H. Effect of red and blue light on anthocyanin accumulation and differential gene expression in strawberry (Fragaria× ananassa). Molecules 2018, 23, 820. [CrossRef]
- Lim, Y.J.; Kwon, S.J.; Eom, S.H. Red and blue light-specific metabolic changes in soybean seedlings. Front. Plant Sci. 2023, 14, 1128001. [CrossRef]
- Yang, J.; Song, J.; Jeong, B. R. Low-intensity blue light supplemented during photoperiod in controlled environment induces flowering and antioxidant production in kalanchoe. Antioxidants 2022, 11, 811. [CrossRef]
- Kentelky, E.; Szekely-Varga, Z.; Morar, I. M.; Cornea-Cipcigan, M. Morphological responses of Viola accessions to nutrient solution application and electrical conductivity. Plants 2022, 11, 1433. [CrossRef]
- Pan, W.; Cheng, X.; Du, R.; Zhu, X.; Guo, W. Detection of chlorophyll content based on optical properties of maize leaves. Spectrochim. Acta Part A: Mol. Biomol. Spectro. 2024, 309, 123843. [CrossRef]
- Lim, Y. J.; Kwon, S. J.; Qu, S.; Kim, D. G.; Eom, S. H. Antioxidant contributors in seed, seed coat, and cotyledon of γ-ray-induced soybean mutant lines with different seed coat colors. Antioxidants 2021, 10, 353. [CrossRef]
- Singleton, V. L.; Rossi, J. A. Colorimetry of total phenolics with phosphomolybdic-phosphotungstic acid reagents. Am. J. Enol. Vitic. 1965, 16, 144–158. [CrossRef]
- Zhishen, J.; Mengcheng, T.; Jianming, W. The determination of flavonoid contents in mulberry and their scavenging effects on superoxide radicals. Food Chem. 1999, 64, 555–559. [CrossRef]
- Wang, X.; Wang, Q.; Nguyen, P.; Lin, C. Cryptochrome-mediated light responses in plants. In The Enzymes; Academic Press, 2014; Volume 35, pp. 167–189.
- Lin, C.; Shalitin, D. Cryptochrome structure and signal transduction. Annu. Rev. Plant Biol. 2003, 54, 469–496. [CrossRef]
- Wang, X. Y.; Xu, X. M.; Cui, J. The importance of blue light for leaf area expansion, development of photosynthetic apparatus, and chloroplast ultrastructure of Cucumis sativus grown under weak light. Photosynthetica 2015, 53, 213–222. [CrossRef]
- Abidi, F.; Girault, T.; Douillet, O.; Guillemain, G.; Sintès, G.; Laffaire, M.; Ben Ahmed, H.; Smiti, S.; Huché-Thélier, L.; Leduc, N. Blue light effects on rose photosynthesis and photomorphogenesis. Plant Biol. 2013, 15, 67–74. [CrossRef]
- Koyama, Y.; Umemoto, Y.; Akamatsu, A.; Uehara, K.; Tanaka, M. Raman spectra of chlorophyll forms. J. Mol. Struc. 1986, 146, 273–287. [CrossRef]
- Tsai, S.S.; Chang, Y.C.A. Plant maturity affects flowering ability and flower quality in Phalaenopsis, focusing on their relationship to carbon-to-nitrogen ratio. HortSci. 2022, 57, 191–196. [CrossRef]
- Kong, Y.; Zheng, Y. Complex signaling networks underlying blue-light-mediated floral transition in plants. Plants 2025, 14, 1533. [CrossRef]
- Park, Y.R.; Kwon, S.J.; Kim, J.H.; Duan, S.; Eom, S.H. Light-induced antioxidant phenolic changes among the sprouts of lentil cultivar. Antioxidants 2024, 13, 399. [CrossRef]
- Ma, Y.; Ma, X.; Gao, X.; Wu, W.; Zhou, B. Light induced regulation pathway of anthocyanin biosynthesis in plants. Inter. J. Mol. Sci. 2021, 22, 11116. [CrossRef]
- Liu, C. C.; Chi, C.; Jin, L. J.; Zhu, J.; Yu, J. Q.; Zhou, Y. H. The bZip transcription factor HY5 mediates CRY1a-induced anthocyanin biosynthesis in tomato. Plant Cell Environ. 2018, 41, 1762–1775.
- Kim, J. H.; Duan, S.; Lim, Y. J.; Eom, S. H. Changes in quercetin derivatives and antioxidant activity in marigold petals (Tagetes patula L.) induced by ultraviolet-B irradiation and methyl jasmonate. Plants 2022, 11, 2947.
Figure 1.
(A) Floral morphology of two Viola × wittrockiana cultivars used in the experiment; 'Delta Trueblue' (DT) and 'Delta Beaconsfield' (DB). (B) Spectral distribution and light intensity profiles of the white (W) and blue (B) LEDs used in the experiment. (C) Schematic image of the four daily light treatments applied to the Viola plants.
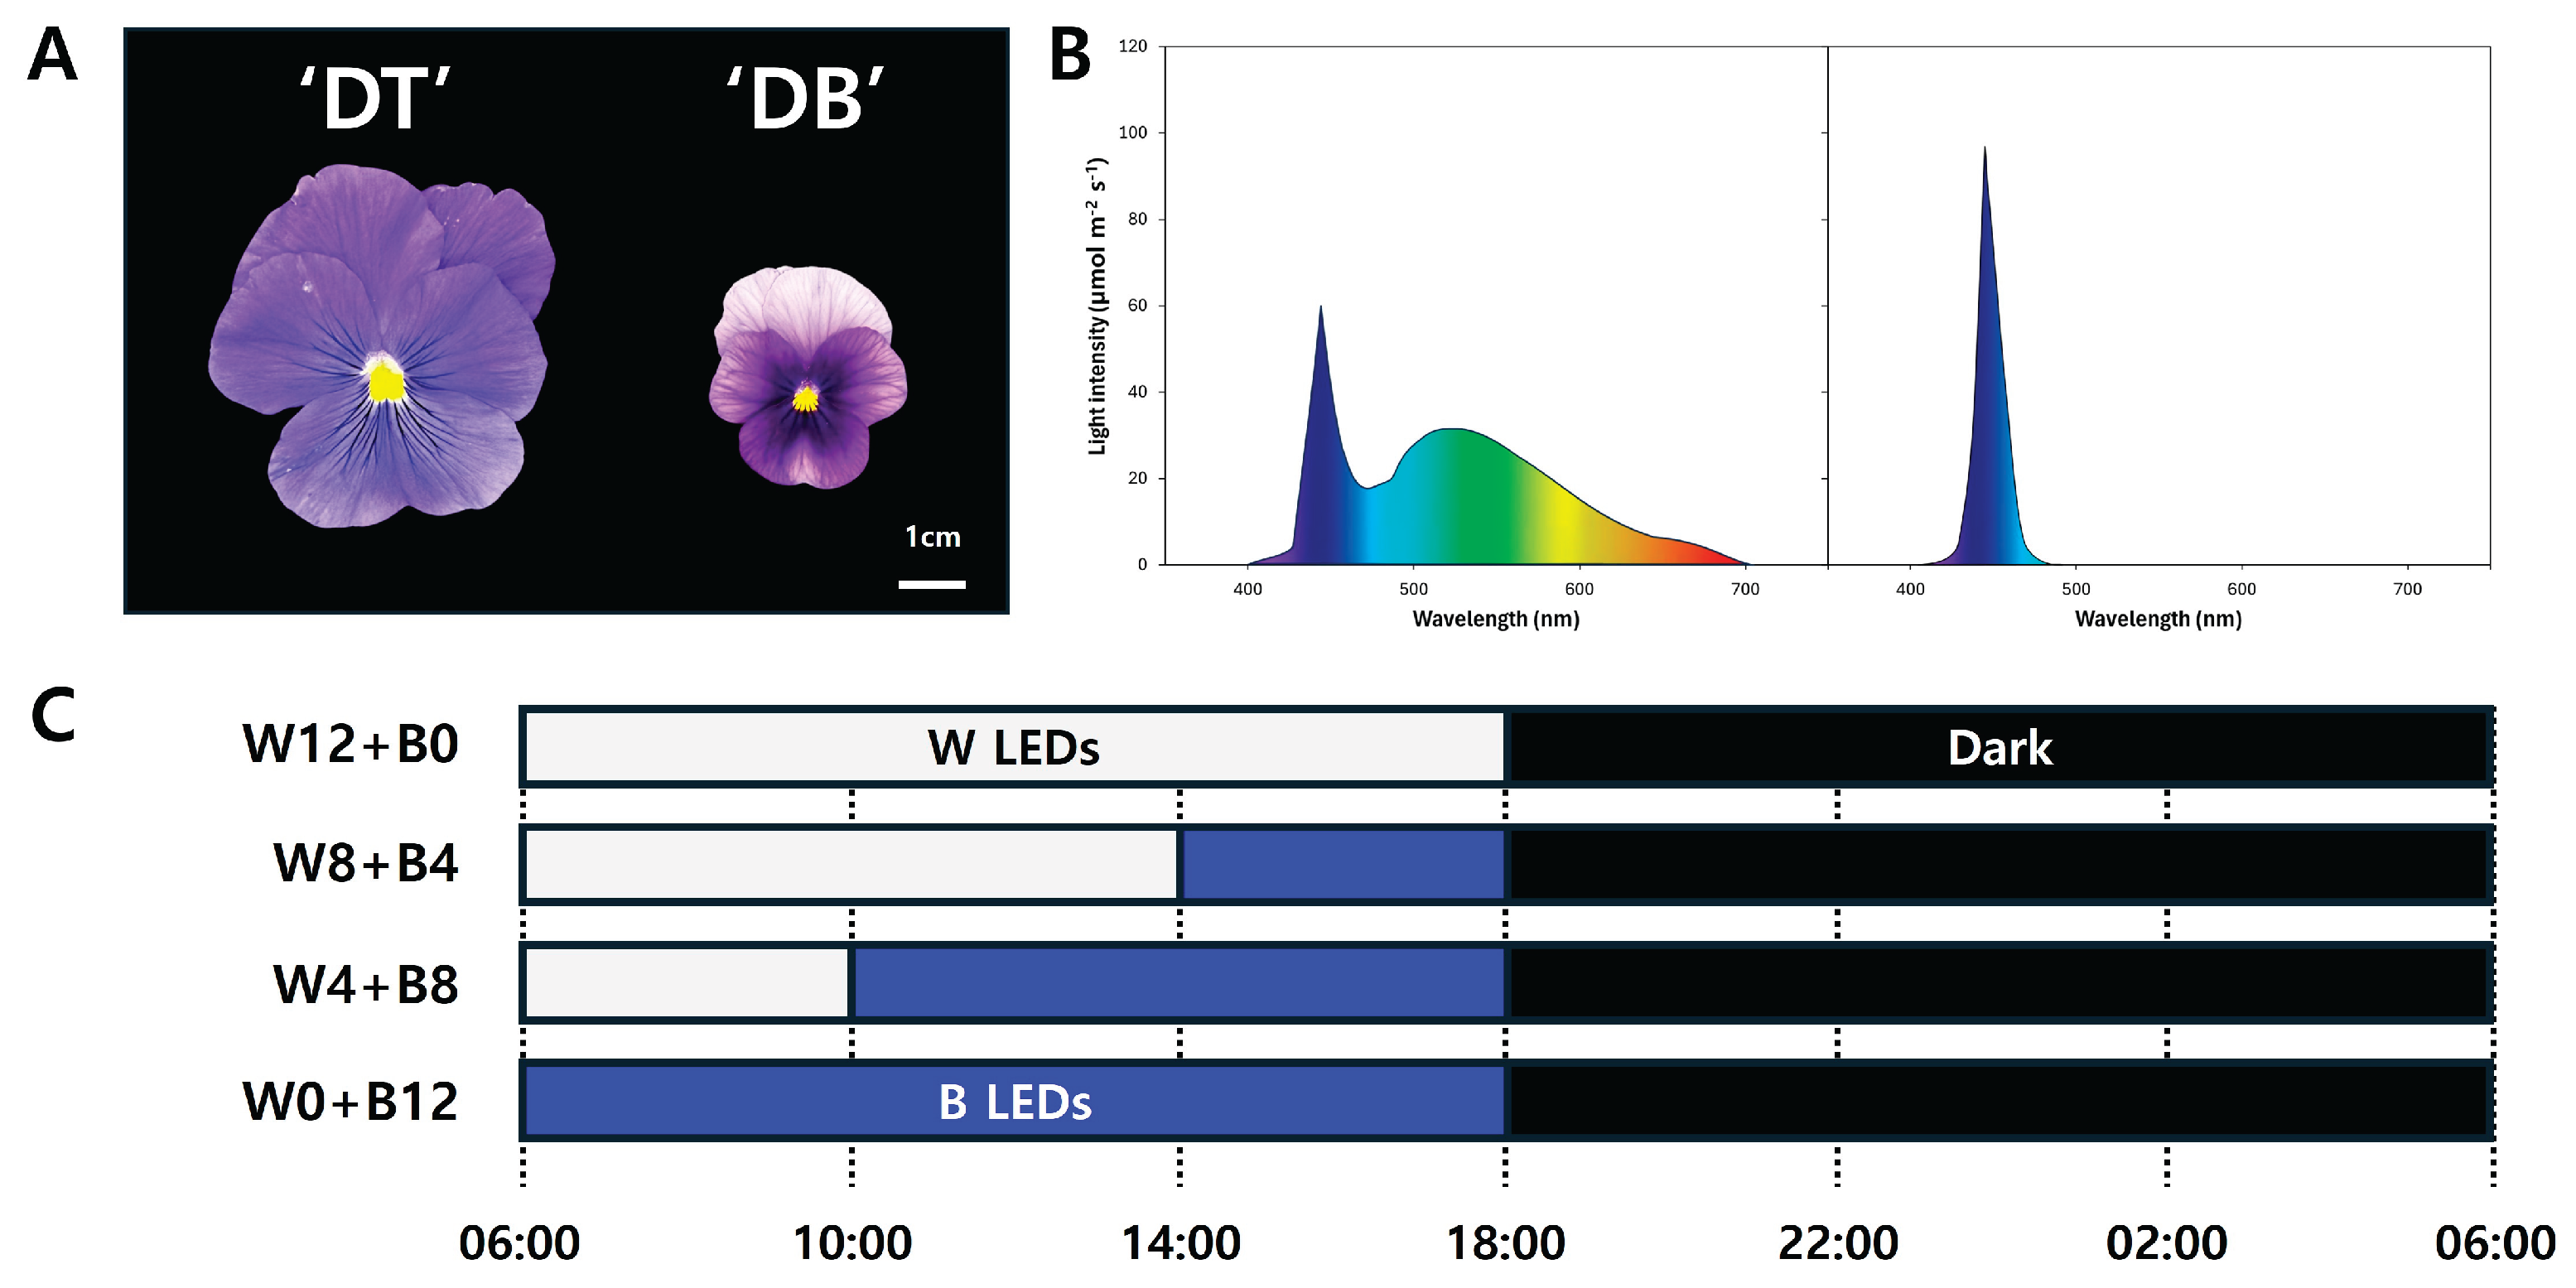
Figure 2.
Accumulated number of flowers in two Viola × wittrockiana cultivars (A) ‘Delta Trueblue’ (DT) and (B) ‘Delta Beaconsfield’ (DB) measured every day after transplanting (DAP) under four different light treatments (W12+B0, W8+B4, W4+B8, W0+B12). Each data point represents the mean ± standard error of three biological replicates, with 15 plants per replicate (n = 3).
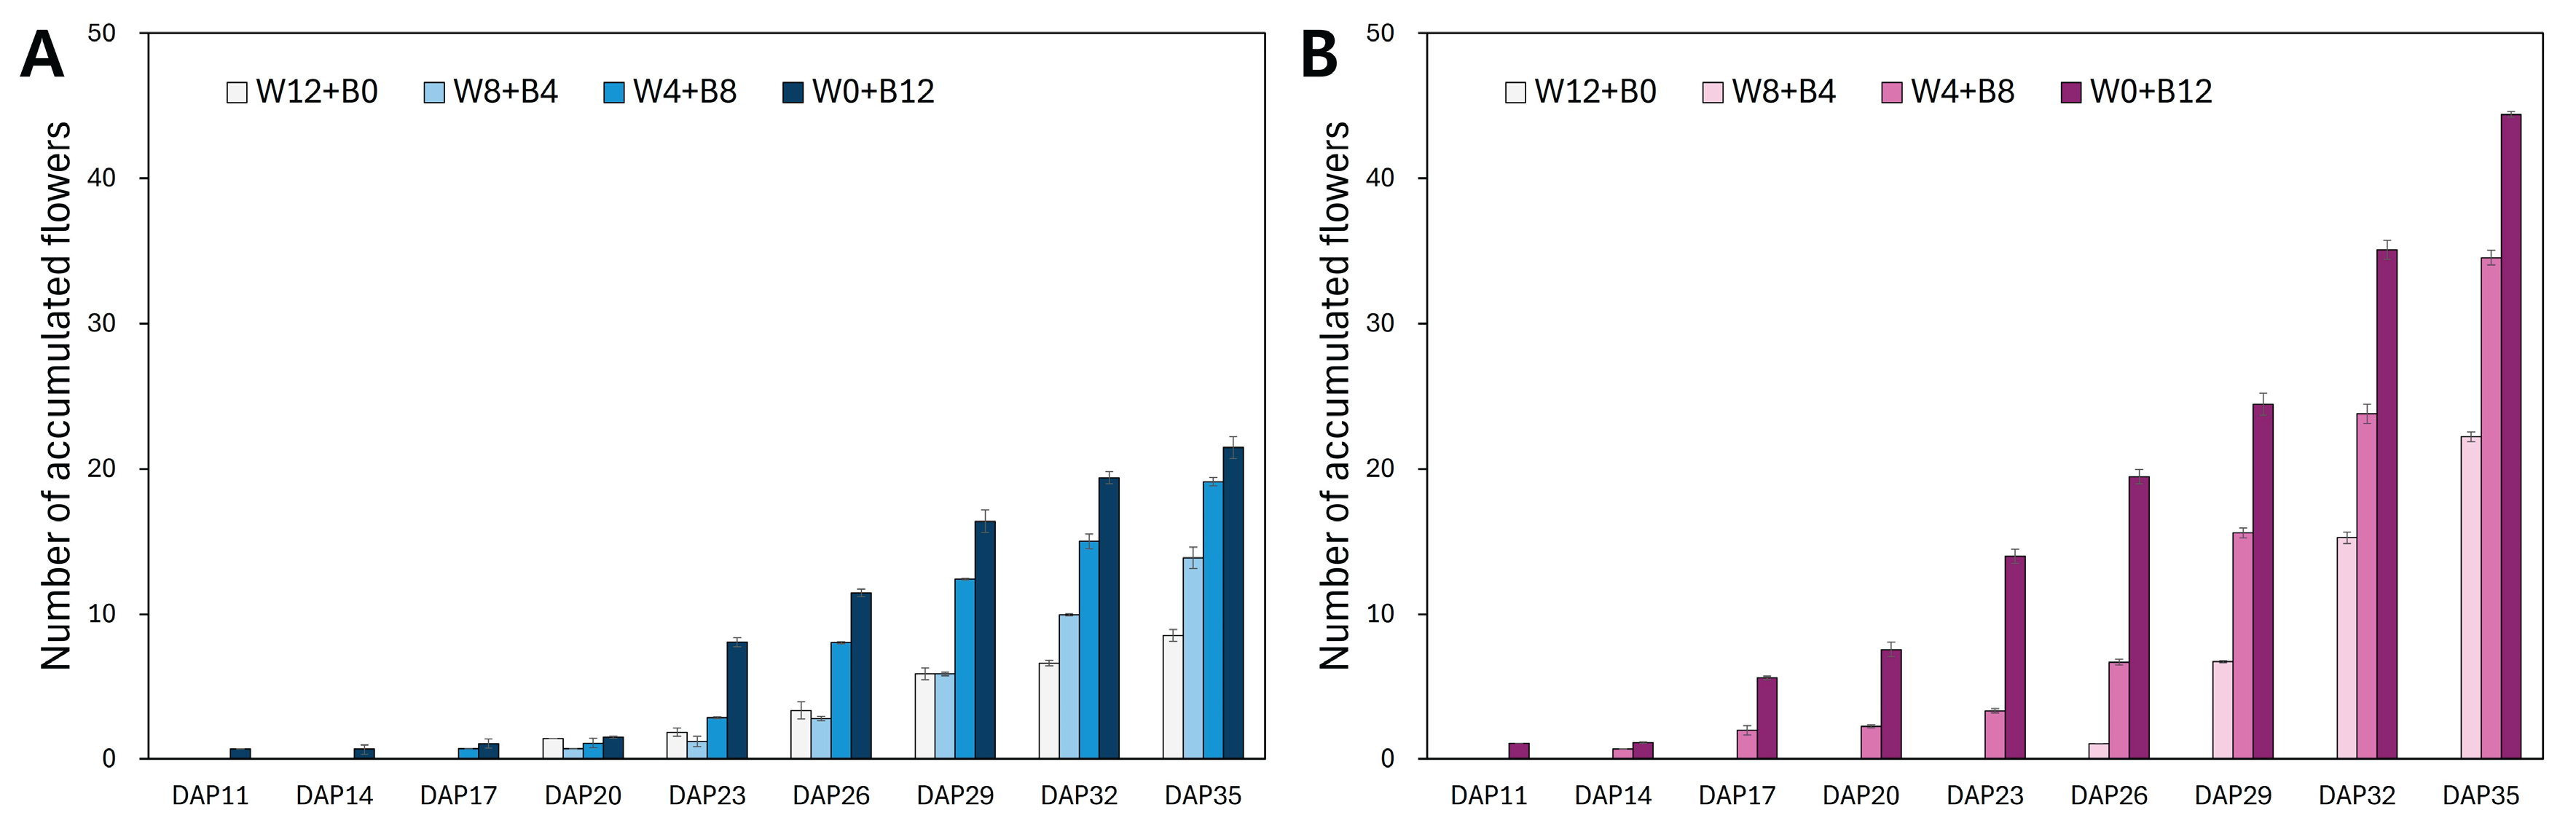
Figure 3.
Antioxidant activity of flower petals from two Viola × wittrockiana cultivars (A) ‘Delta Trueblue’ (DT) and (B) ‘Delta Beaconsfield’ (DB) described by DPPH and ABTS radical-scavenging activities. Results are expressed as mg vitamin C equivalent per gram of dry weight (mg VCE g⁻¹ DW). Each bar represents the mean ± standard error of three biological replicates (n = 3). Different letters over the bars indicate significant differences among treatments within each assay and cultivar based on Tukey’s HSD test (p < 0.05).
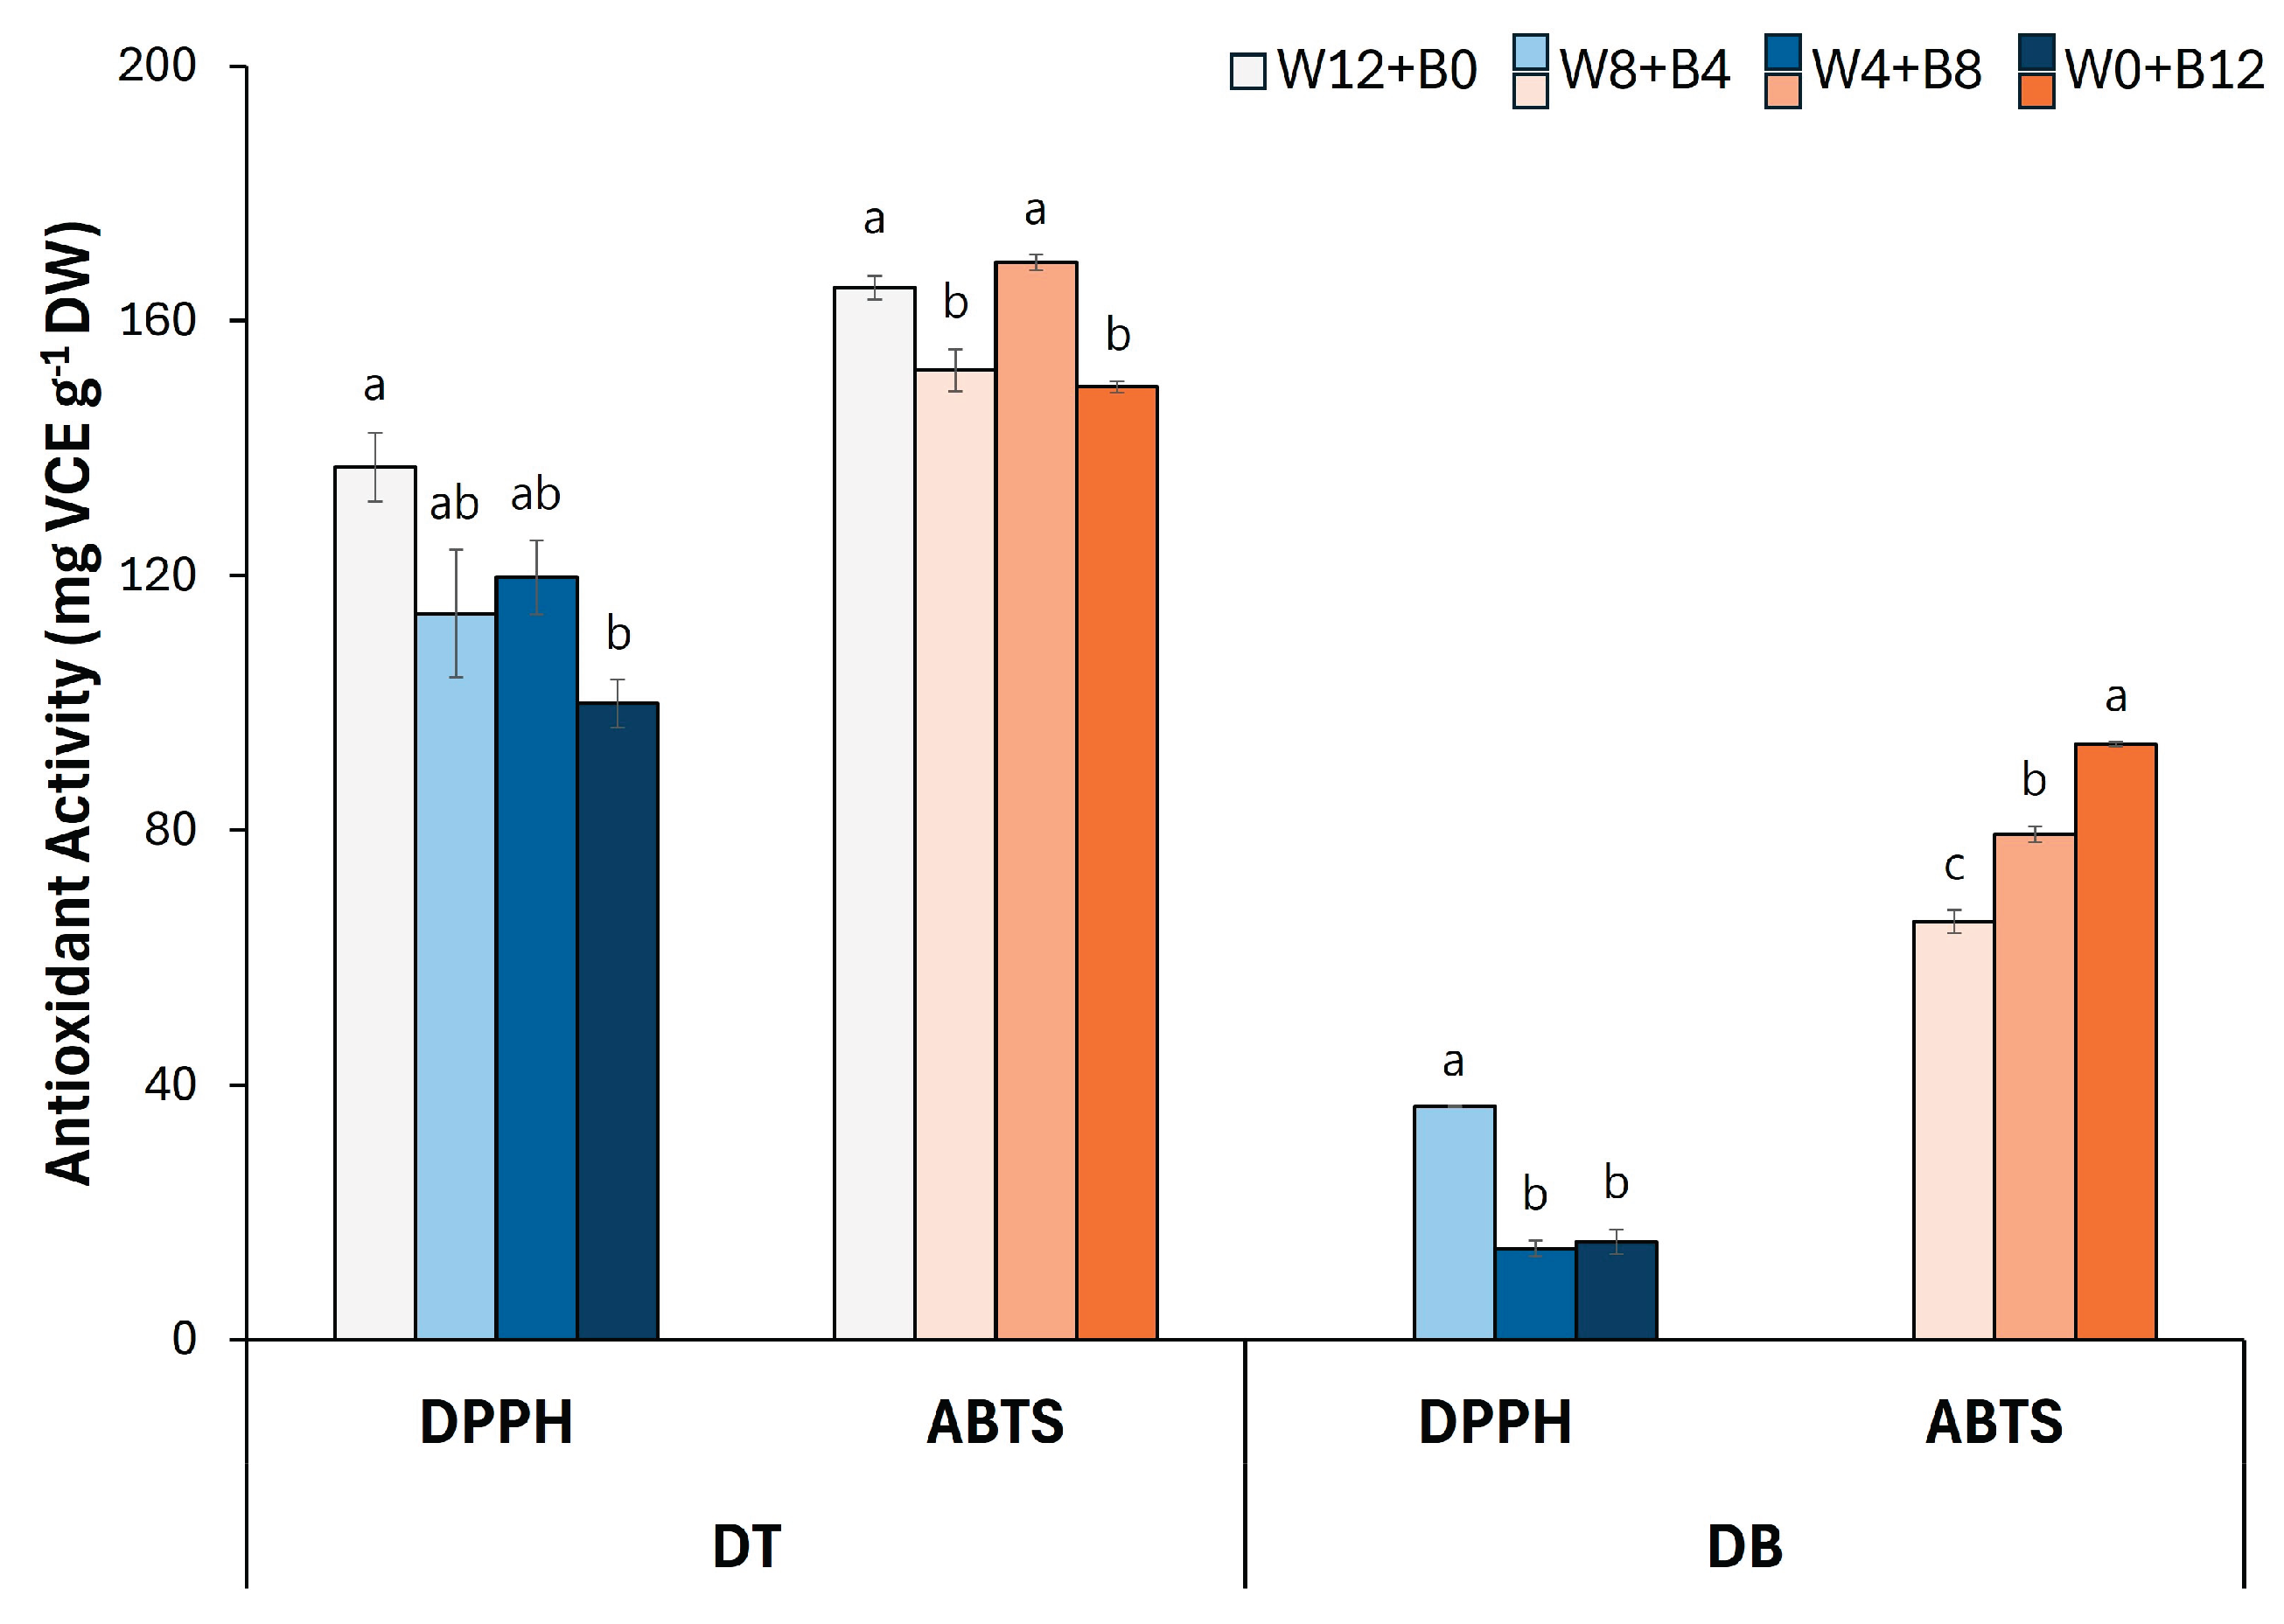
Figure 4.
(A) Total phenolic, (B) flavonoid, and (C) anthocyanin content of flower petals from two Viola × wittrockiana cultivars ‘Delta Trueblue’ (DT) and ‘Delta Beaconsfield’ (DB). Each bar represents the mean ± standard error of three biological replicates (n = 3). Different letters over the bars indicate significant differences among treatments within each assay and cultivar based on Tukey’s HSD test (p < 0.05).
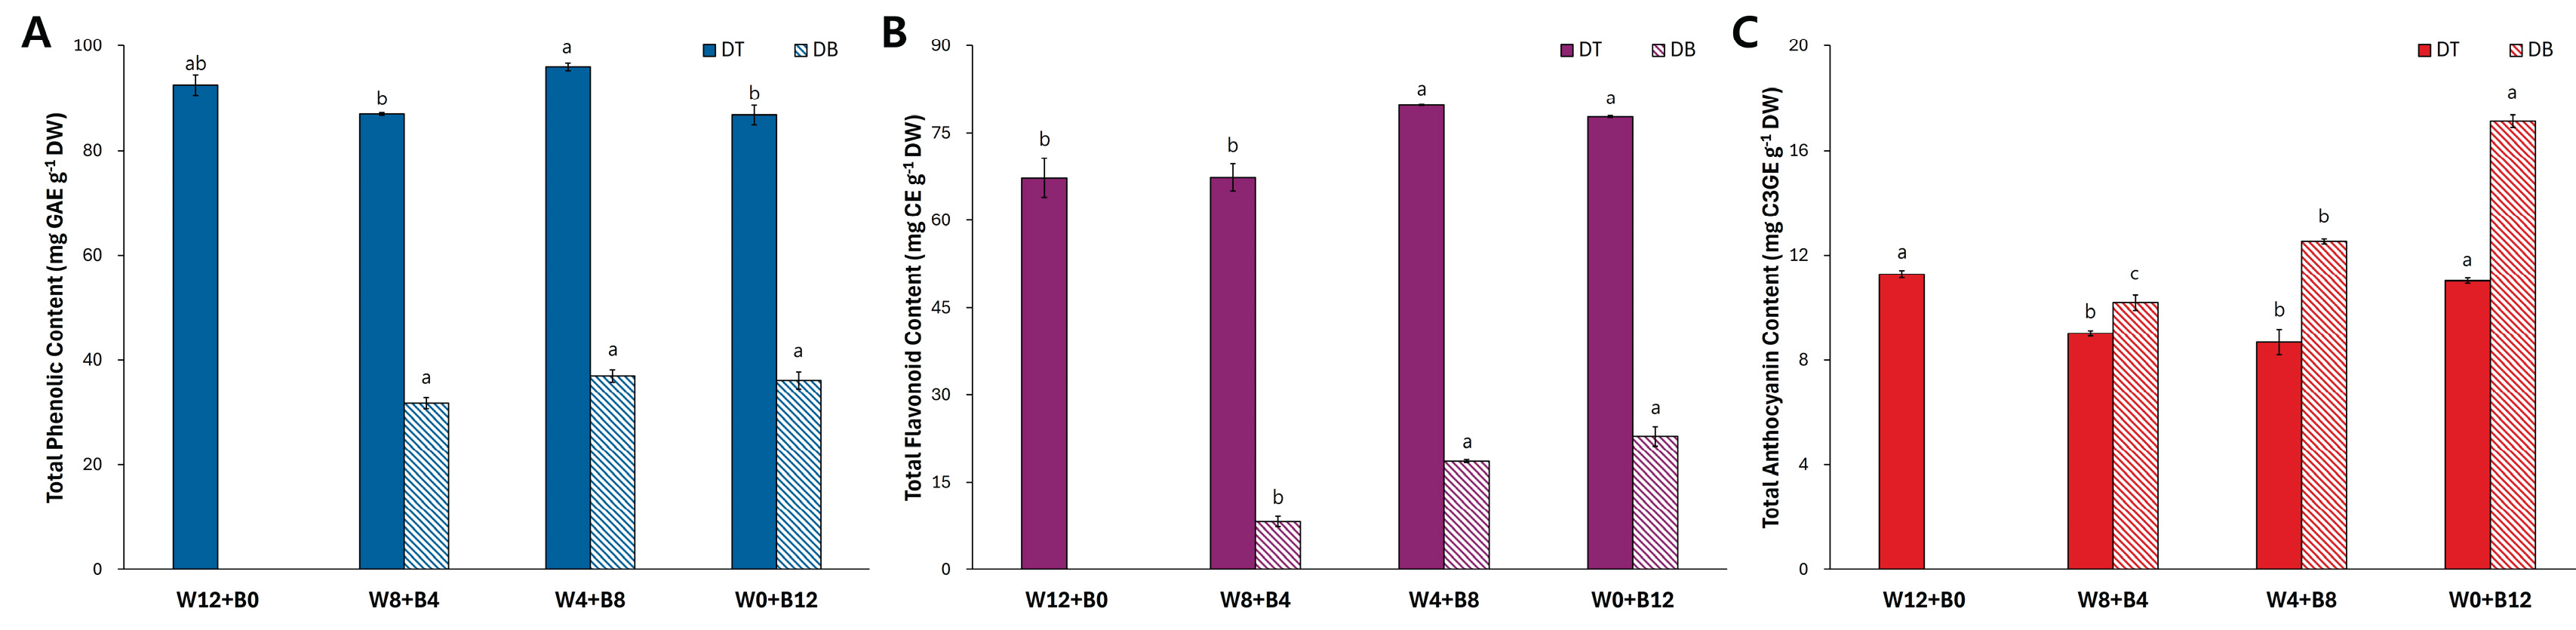
Figure 5.
Pearson correlation coefficients among antioxidant activity (DPPH and ABTS), total phenolic content (TPC), total flavonoid content (TFC), and total anthocyanin content (TAC) in the flower petals of two Viola × wittrockiana cultivars, ‘Delta Trueblue’ (DT) and ‘Delta Beaconsfield’ (DB). Asterisks indicate the level of statistical significance at * (p < 0.05), ** (p < 0.01), *** (p < 0.001), and ns = not significant (p ≥ 0.05).
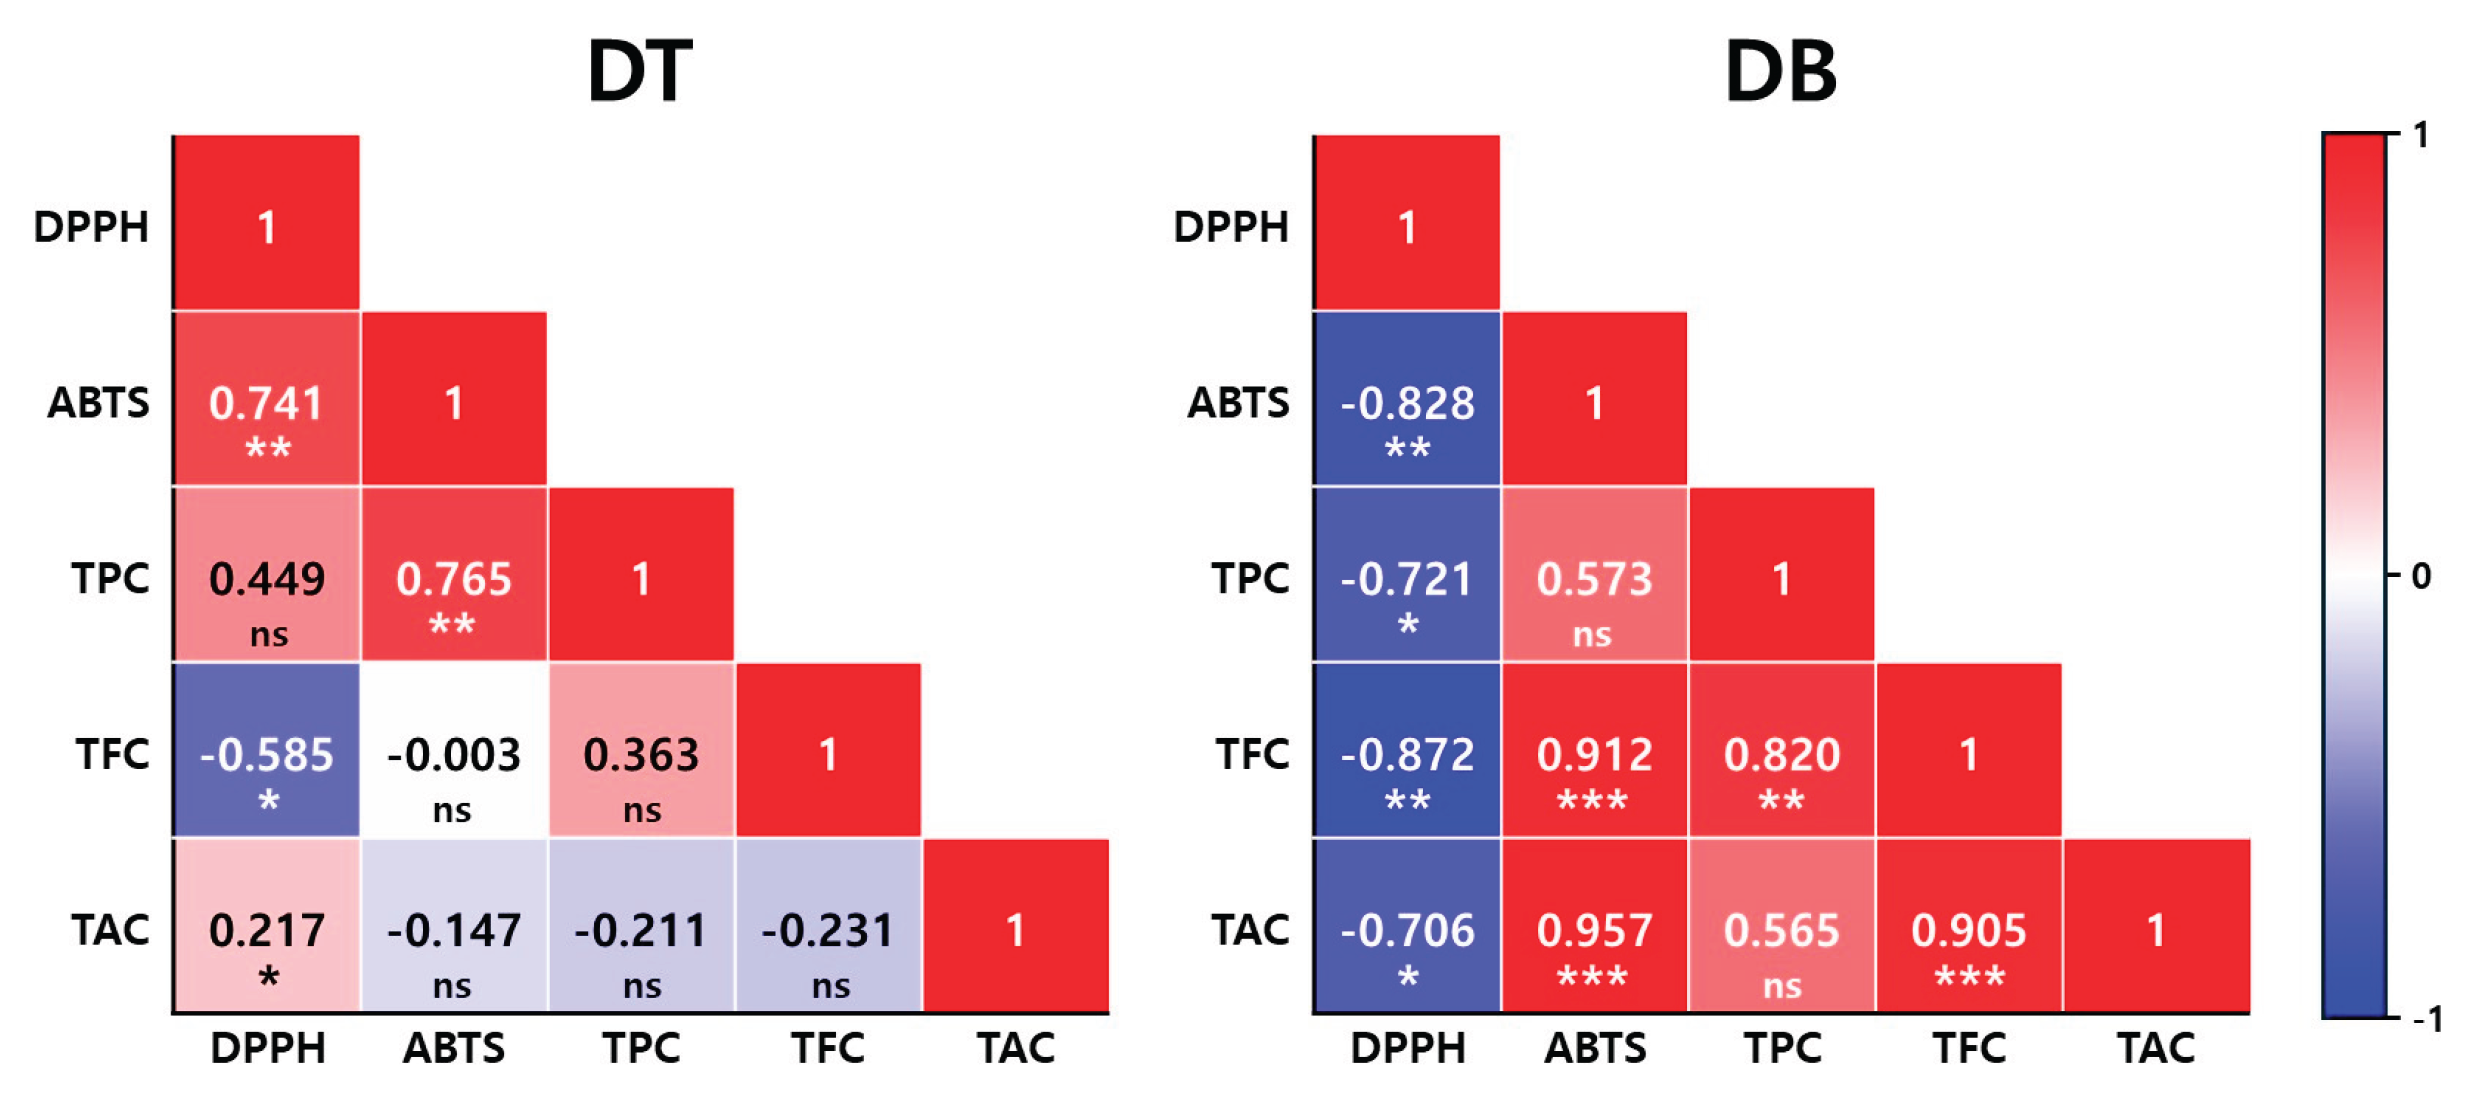
Figure 6.
Principal component analysis (PCA) of antioxidant activity and phytochemical contents in two Viola × wittrockiana cultivars, ‘Delta Trueblue’ (DT) and ‘Delta Beaconsfield’ (DB). (A) Score plot indicating clear separation between DT and DB based on principal components 1 and 2. (B) Biplots showing treatment-wise distribution within each cultivar based on PCA of DPPH, ABTS, total phenolic content (TPC), total flavonoid content (TFC), and total anthocyanin content (TAC). Ellipses represent 95% confidence intervals for each treatment group.
Disclaimer/Publisher’s Note: The statements, opinions and data contained in all publications are solely those of the individual author(s) and contributor(s) and not of MDPI and/or the editor(s). MDPI and/or the editor(s) disclaim responsibility for any injury to people or property resulting from any ideas, methods, instructions or products referred to in the content. |
© 2025 by the authors. Licensee MDPI, Basel, Switzerland. This article is an open access article distributed under the terms and conditions of the Creative Commons Attribution (CC BY) license (http://creativecommons.org/licenses/by/4.0/).
Copyright: This open access article is published under a Creative Commons CC BY 4.0 license, which permit the free download, distribution, and reuse, provided that the author and preprint are cited in any reuse.


