Submitted:
30 June 2025
Posted:
01 July 2025
You are already at the latest version
Abstract
Under normal conditions, the novel zinc blende beryllium oxide (zb BeO), exhibits in a metastable crystalline phase, which is less stable than its wurtzite counterpart. Ultrathin zb BeO epifilms have recently gained significant interest to create a wide range of advanced high-resolution, high-frequency, flexible, transparent, nano electronic and nanophotonic modules. BeO based ultraviolet photodetectors and biosensors are playing important roles in providing safety and efficiency to nuclear reactors for their optimum operations. In thermal management, BeO epifilms have also been used for many high-tech devices including medical equipment. Phonon characteristics of zb BeO at ambient and high-pressure P 0 GPa are required in the development of electronics that demand enhanced heat dissipation for improving heat sink performance to lower the operating temperature. Here we have reported methodical simulations to comprehend P-dependent structural, phonon and thermodynamical properties by using a realistic rigid-ion model (RIM). Unlike zb ZnO, the study of Grüneisen parameter γ(T) and thermal expansion coefficient α(T) in zb BeO has revealed atypical behavior. Possible reasons of such peculiar trends are attributed to the combined effect of short bond length and strong localization of electron charge close to the small core size Be atom in BeO. Results of RIM calculations are compared/contrasted against the limited experimental and first-principles data.
Keywords:
novel meta stable BeO
; rigid-ion-model
; lattice dynamics at ambient and high pressure
; thermodynamical properties
; Raman scattering and infrared spectroscopy
1. Introduction
Novel alkaline earth II-oxides (XO: X = Be, Mg, Zn and Cd) occur in different crystalline structures ranging from the wurtzite (wz) → zinc blende (zb) → rock salt (rs) phases. These II-O semiconductors are considered valuable in a broad range of applications [1,2,3,4,5,6]. Unlike other XOs, the beryllium oxide (BeO), commonly known as “beryllia” has attracted significant attention in recent years due to its fascinating electrical, mechanical and thermal properties. Among other II-Os, the BeO possesses a relatively low density, wide bandgap (WBG) high rigidity, high melting point 2570°C, and strong chemical bond As a ceramic, it exhibits an electrical insulating feature with exceptional thermal conductivity κ, and high temperature stability [7,8,9,10,11]. The unique basic properties of BeO have offered major contributions to materials science, condensed matter physics, and electrical engineering. Invaluable physical traits of the material have encouraged many physicists and chemists to investigate its electronic, elastic, thermal and phonon characteristics at ambient, and high-pressure environments [1,2,3,4,5,6]. In recent years, several engineers have meticulously designed BeO-based key electronic components in developing advanced micro-/nanoelectronics, suitable for high temperature applications. Major devices that have been acquired include the ultraviolet (UV) detectors, light emitting diodes (LEDs), laser diodes (LDs), gas sensors, and solar cells, etc. [1,2,3,4,5,6,7,8,9,10,11] Some of these modules are being incorporated in satellites/aircraft for space exploration, in nuclear reactors as neutron reflector; as well as in medical equipment for radiation detection and thermal management needs [7,8,9,10,11]. In medicine BeO ceramics have contributed to lasers used in DNA sequencers and tissue analysis. As a UV transparent conducting oxide (TCO), BeO has been employed in flat-panel displays. Many innovative BeO-based devices have also indicated significant potentials in managing excess heat generation during the operations of electronic and optoelectronic systems.
In BeO, the prospects of spontaneous polarization by an external electric field E can alter the presence of intrinsic defect structures [7,8,9,10,11]. Although not enough conclusive evidence exists of spontaneous polarization modifying the impurity configurations by E in BeO, it is theoretically possible from the available research on related materials [7,8,9,10,11]. An interplay between E and intrinsic defects is a complex subject and requires further study. Nevertheless, it has been substantiated that change of defect structure can alter both the bulk and surface characteristics of the material. Such changes are known to radically impact on the performance of BeO-based devices [7,8,9,10,11]. As a gate dielectric and oxygen diffusion barrier, BeO is established an extremely assuring high-k dielectric for designing metal–oxide–semiconductor field effect transistors (MOSFETs) [1,2,3,4,5,6]. It is also succeeded for engineering many electronic components for power generation requisites. As a well-known refractory compound, BeO is used as a heat sink and substrate in many high-power electronic devices to effectively dissipate heat and prevent overheating. In nuclear applications, the material has been employed as a neutron reflector and/or moderator for improving thermal management [12,13,14,15]. BeO has served as a dispersion phase fuel matrix (DPFM) in nuclear reactors due to its excellent mechanical, chemical, properties with high radiation resistance and good compatibility with uranium dioxide UO2. The DPFM has not only improved the overall performance of reactors but also provided safety to its fuel. In band gap engineering BeO is frequently mixed with other iso-structural XOs to prepare ternary XxBe1-xO and quaternary XxYyBe1-x-yO alloys. In low-dimensional heterostructures (LDHs) [viz., multi quantum wells (MQWs) and superlattices (SLs)] the integration of BeO-based epifilms has offered unlimited opportunities to develop electro-optical device structures. In recent years, many photonic devices are meticulously blended to accomplish and improve flexible micro- /nano-electronics [1,2,3,4,5,6].
To prepare ultrathin XO-based films, different growth methods have been frequently employed [16,17,18,19,20,21,22,23,24,25,26,27,28]. The epitaxial techniques commonly considered are the chemical vapor deposition (CVD), metal organic (MOCVD) [16,17], laser ablation [18,19,20], molecular beam epitaxy (MBE), pulsed laser deposition, and plasma-assisted PA-MBE [21,22,23,24,25,26,27,28], etc. Characterization efforts are also made [29,30,31,32,33,34,35,36,37,38,39,40,41,42,43,44,45,46,47,48,49,50,51] for analyzing and monitoring epifilms and their fundamental features using reflection high-energy electron diffraction (RHEED) [29,30], Auger electron spectroscopy (AES) [31], He+-Rutherford backscattering spectrometry (RBS) [32], atomic force microscopy (AFM) [33,34], high-resolution X-ray diffraction [34,35] (HR-XRD), cross sectional transmission electron microscopy (XTEM), photoluminescence (PL) [36,37,38,39,40], absorption, Fourier transform infrared (FTIR) [41,42], Raman scattering spectroscopy (RSS) [43,44,45,46,47,48], spectroscopic ellipsometry (SE), [49,50,51], etc. Certainly, these experimental methods have validated different crystal structures and also helped evaluate epifilm thickness, strain, electrical, and optical traits of intrinsic defects. In BeO material, the effect of high-pressure P using a diamond anvil cell is studied for assessing its structural, elastic, electronic, and dynamical properties. Analyses of such properties have validated its importance in high-temperature applications. Moreover, these efforts have facilitated in designing many optoelectronic devices viz., insulated gate bipolar transistors (IGBTs); TCO films for charge carrier transport; UV-LEDs; optoelectronic gas sensors; heterostructure field effect transistors (HFETs); high electron mobility transistors (HEMTs) etc. [1,2,3,4,5,6,7,8,9,10,11] Integration of such devices in flexible transparent nano-electronics/nano-photonics has helped achieving high-resolution medical imaging tools for physicians to diagnose, treat patients by recuperating their illnesses, and diseases [12,13,14,15].
Despite the successful growth [16,17,18,19,20,21,22,23,24,25,26,27,28] and characterization [29,30,31,32,33,34,35,36,37,38,39,40,41,42,43,44,45,46,47,48,49,50,51] of epifilms, there are still many basic issues of BeO-based device structures that remained unresolved. For instance, the structural, electronic, elastic, and vibrational traits of epitaxially grown epilayers have not yet been thoroughly investigated. The study of lattice dynamics of BeO is important for understanding its role in different device performance. Vibrational properties
are crucial for evaluating electron-phonon interactions, transport coefficients, as well as assessing the reliability and functionality of electronic devices. Among other II-Os, the phonons in BeO are suggested as the major heat carriers [7,8,9,10,11]. In designing device structures, the zb phase is preferred due to its unique optical and electronic properties. Specifically, the zb BeO has offered many advantages of lower carrier scattering and higher doping efficiencies as compared to the wz structure. The zb BeO is known to have higher κ value for causing higher thermal properties as compared to the wz BeO [7,8,9,10,11].
Inelastic neutron scattering (INS) spectroscopy is considered as one of the most powerful experimental techniques for studying the frequency-wavevector relationships of phonons in solids [47]. Careful analysis of energy lost and/or energy gained by the scattered neutrons in INS has been employed in determining the phonon dispersions. Except for zb ZnO, and wz ZnO [47], no experimental results exist for the lattice dynamics of zb BeO material. In the absence of INS measurements, RSS and FTIR spectroscopies are commonly employed [41,42,43,44,45,46,47,48] for assessing the phonon frequencies at high critical points in the Brillouin zone (BZ). In crystals with free charge carriers, Raman scattering has been exploited for comprehending the carrier-phonon interactions and phonon-assisted optical transitions [47,48,49,50,51]. In polar materials, while RSS perceives the inelastic scattering of light by phonons, the FTIR spectroscopy measures the absorption of infrared light by the vibrational modes.
In different solids, P-dependent shifts of phonon frequencies are measured experimentally by using RSS and FTIR spectroscopies. In semiconductors, the analyses of such results have helped gain valuable insights of their bonding characteristics (i.e., the hardening and/or softening of inter-molecular/ intra-molecular interactions). The information of P-dependent phonon shifts in II-VIs, III-Ns and IV-IV materials, has been used earlier for assessing the structural arrangements of atoms for identifying their phase transitions . Raman scattering spectroscopy is also exploited in understanding the T-dependent mode Grüneisen parameter In a solid, the information of at a given T signifies the sensitivity of P-dependent phonons to its volume change. The P-dependent vibrational modes in different materials have also helped researchers to understand their optical and thermodynamical properties including the specific heat , Debye temperature thermal expansion coefficient (TEC) , etc. [6].
From theoretical standpoints, several ab initio calculations of different wz XOs are performed earlier to understand their structural, electronic, and optical properties [52,53,54,55,56,57,58,59,60,61,62,63,64,65,66]. Typically, the first-principles simulations have employed either the density functional theories (DFT) and/or the density functional perturbation (DFP) methods. Calculations are known by using the full potential linear augmented plane wave (FP-LAPW), frozen phonon (FP), molecular dynamics (MD) and ab initio (AI-MD) schemes [52,53,54,55]. Very few studies exist, however, for materials in the zb phase. Some of the reported results on the zb ZnO material for the electronic and vibrational characteristics using first-principles methods are either inconsistent and/or questionable [52,53]. For instance, Chibueze [52] has recently adopted an ab initio approach to study the mechanical, phonon and electronic properties of zb ZnO. In the framework of DFT, the author [52] has employed a generalized gradient approximation (GGA) by considering a revised Perdew-Burke-Ernzerhof GGA method. In zb ZnO, the author has claimed [52] achieving the degenerate phonon energies at the center of the BZ [i.e., near This result for the zb ZnO material is in complete disagreement with the INS experimental as well as first principles theoretical results of phonon dispersions reported by Serrano et al. [48,49] and other LDA simulations [54].
Very few simulations are reported on the phonon dispersions of zb BeO [66]. Absolutely no attempts are made to comprehend the P-dependent and thermodynamical characteristics. High P-phonon studies reflect how the energies of atoms, molecules, or other structural units in solids are arranged for causing modifications in their atomic and/or molecular vibrations. Such studies are required in BeO to decide whether the material is stable or prone to instability. Systematic simulations by exploiting the realistic lattice dynamical models are essential. At ambient and high P, meticulous investigations of zb BeO are crucial to characterize its phonon dispersions and thermodynamical properties [viz., thermal expansion coefficient ; specific heat and Debye temperature . These traits are expected to play vital roles in evaluating its use in high-T applications especially for thermal management needs in nuclear reactors [7,8,9,10,11].
This paper aims to report the results of a methodical study on the novel zb BeO material by exploiting a rigid-ion model (RIM) [67,68,69,70,71,72,73]. Calculations are performed to understand the structural, phonon and thermodynamical properties of zb BeO at ambient and high P. In Section 2.1, different crystal structures of BeO are described. The salient feature of RIM is outlined in Section 2.2 and 2.2.1–2.2.4 with complete details reported elsewhere [67]. The RIM includes both the short-range and long-range Coulomb interactions. Unique optimization procedures [68] are applied to estimate the interatomic force constants (IFCs) at P = 0 GPa, and P = 20 GPa [75,76,77,78,79]. To achieve the optimized set of IFCs for zb BeO we have incorporated accurate values of phonon frequencies at Γ, X and L critical points in the BZ and the P-coefficients ∂/∂P as input, while employing the elastic constants , their pressure derivatives ∂/∂P (cf. Sections 3, 3.1-3.2), equilibrium lattice-constants and P-dependent as constraints. For zb BeO and using the Murnaghan’s equation of state [74] we have simulated P-dependent volume and/or lattice constant ratio by considering appropriate values of bulk modulus and its pressure derivative (cf. Sections 3, 3.1-3.2). In zb BeO, the RIM results of phonon dispersions and one-phonon g(ω) density of states (DOS) at P = 0 GPa, and P = 20 GPa are systematically employed in the quasi-harmonic approximation (QHA) to study (cf. Section 3, 3.1-3.3) its thermodynamical properties [e.g., Debye temperature (T), heat capacity at constant volume (T)]. By incorporating the results of Grüneisen dispersions , we have meticulously achieved the T-dependent Grüneisen parameter γ(T), and linear thermal expansion coefficient α(T). Unlike zb ZnO, the analysis of γ(T) and α(T) for the zb BeO material has revealed atypical behavior (cf. Section 3, 3.1-3.3). The possible explanation for such peculiar trends is ascribed to the combined effect of the short bond length and strong electron localization due to small core size of the electronic charge close to Be in BeO. Results of RIM calculations are compared/contrasted against the existing experimental and first-principles data [80,81,82,83], with concluding remarks presented in Section 4.
2. Theoretical Background
2.1. Structural Properties
Unlike other XOs, the earlier P-dependent measurements for the BeO material have exhibited two main crystal phases. These are (i) the hexagonal wz (B4) and (ii) the sodium chloride or rock salt (rs) (B1) structures. For low P and T (< 2500 K), while BeO occurs in the most stable wz structure it can attain, however, the rs phase at higher P and T [1,2,3,4,5,6]. By using an X-ray synchrotron radiation source, Mori et al. [75] have carried out phase transition studies under high P for BeO. The authors have established that the phase transition appears at from wz B4 → rs B1 structure Structural changes did not evolve for P ≤ 55 GPa. No phase transitionis detected from wz B4 → zb (B3) phase [75]. For theorists, the studies of phase transition have faced considerable challenges [84,85,86,87,88,89,90,91,92,93,94]. Unlike experimental studies, the calculations in BeO [84,85,86,87,88,89,90,91,92,93,94] predicted the phase transitions from wz (B4) → zb (B3) → rs (B1). However, the projected values of are perceived varying between 22 GPa 147 GPa. In Figure 1, we have displayed the three possible crystal structures of XOs.
Phase transition
Several DFT simulations are available for the BeO material [84,85,86,87,88,89,90,91,92,93,94] to comprehend its structural phase transitions from B4 → B3 → B1. However, the studies have predicted significantly different values of . From these calculations, an average value of has been established at nearly ~84 GPa. For BeO, a soft nonlocal pseudopotential method is adopted earlier by Van Camp et al. [93] in the local density function (LDF) approximation. The authors [93] have projected the phase transitions from B4 → B3 and B3 → B1 at 74 and 137 GPa, respectively. Using all electronic and full-potential electronic structure method in the framework of LDF, Boettger et al. [94] have reported the corresponding transitions at 63–76 GPa and 95 GPa. Later, Park et al. [92] suggested the phase transitions in BeO from B4 → B3 at 91 GPa, and B3 → B1 at 147 GPa by adopting a first-principles soft nonlocal pseudopotential method in the generalized gradient approximation. In Table 1, we have listed the calculated values of the equilibrium obtained for the BeO material between B4 → B3 → B1 by several researchers using different ab initio methods [84,85,86,87,88,89,90,91,92,93,94]. Obviously, the high-pressure status of BeO has been and still is extremely ambiguous [75,84,85,86,87,88,89,90,91,92,93,94].
2.2. Computational Methodology of Lattice Dynamics
In a crystal lattice, the simulated phonon dispersions are used to describe its collective atomic vibrations. In semiconductors, the study of lattice dynamics has played a crucial role for understanding their structural, thermal, optical, and electrical properties. For comprehending in zb materials, two types of theoretical methods are frequently employed. These are: (i) the microscopic or first-principles approaches [52,53,54,55,56,57,58,59,60,61,62,63,64,65,66,67], and (ii) the macroscopic techniques [68,69,70,71,72,73,74]. Phonon dispersion studies in solids using microscopic theories rely on their fundamental physical principles which allow detailed understanding of atomic interactions. Macroscopic schemes have, however, employed phenomenological models which require systematic evaluation of the general interatomic force constants. The later methods have often used the simplified representations for numerical evaluation of IFCs by linking them to the material’s fundamental traits rather than examining individual atomic interactions.
In essence, the microscopic techniques provide substantial details for understanding the vibrational characteristics of materials, while the macroscopic methods offer, simplified and efficient perspectives via IFCs to study the lattice dynamical features. For zb BeO, we have exploited a macroscopic RIM (cf. Section 2.2.1) and methodically obtained the optimized sets of its eleven IFCs (cf. Section 2.2.3) at ambient P by incorporating accurate values of phonons (see Table 2), elastic constants , and lattice constant
2.2.1. Rigid-ion Model
The macroscopic RIM that we have adopted here to study the vibrational characteristics of zb BeO material includes both the short-range (up to 2nd nearest neighbors) and long-range Coulomb interactions [67]. In this model, an atom is identified by using two indices: l and κ. The term l represents the number of unit cells while κ signifies the two types of atoms (i.e., κ = 1 (O) and κ = 2 (Be)). In RIM [67], the polarization of zb crystal lattice is determined by point ions displacements from their equilibrium positions anticipating them to be rigid and non-polarizable. For zb BeO, the phonon dispersions are obtained in the harmonic approximation by solving the crystal Hamiltonian [67]:
, (1)
where represents the displacement of -component for the
th (≡1, 2) type atom from equilibrium in th unit cell. The term signifies the corresponding components of its momentum. For zb crystals, one can write the potential energy by splitting it into a short-range repulsive, and long-range attractive Coulomb part as [67]:
, (2)
with e (≡) being the charge on the type ions.
The equations of motion in the harmonic approximation take the following form [67]:
, (3)
where the atomic displacement is expressed as a plane wave of the type:
; with x, y, z , (4)
with being the time; and represent the position and mass of the atom, respectively. Substituting Equation (4) into Equation (3), it is possible to re-write the equations of motion as [67]:
(5)
where represents the dynamical matrix comprising of the short-range and long range Coulomb interactions. For each mode the components of its eigenvectors in Equation (5) satisfy the familiar orthogonality [67]:
, (6a)
and closure relations
. (6b)
2.2.2. The Quasi Harmonic Approximation
In the harmonic approximation the knowledge of IFCs at ambient P for zb BeO is required to obtain the phonon dispersions (cf. Section 3). The inclusion of higher terms in Equation (1) makes the exact solutions to the equations of motion impossible. Thus, approximations must be made. A QHA is employed to calculate thermodynamical properties of materials for predicting their phase diagram at higher P and T [84]. In this approximation, the simulations are made to study how the atomic vibrations (phonons) of a solid change with temperature, T and volume V. In QHA, the interatomic potential is still terminated at the quadratic term, allowing the definition of normal modes as in the harmonic approximation. But now the IFCs are allowed to alter with the change of interatomic distance . This means that the strength of IFCs is modified either by the variation of volume V, or pressure P. Thus, one expects the phonon dispersions and density of states DOS of the material (cf. Section 3, 3.1-3.2) to shift with the change of V (or P), be it due to thermal expansion or by an externally applied stress (pressure, P).
2.2.3. Interatomic Force Constants of zb BeO at P = 0 GPa
Systematic procedures [68] are followed to optimize the eleven RIM parameters at ambient conditions P = 0 GPa for zb BeO. Appropriate values of phonon frequencies at critical points (see 2nd column of Table 2) are used as input while the elastic- and lattice- constants are employed as constraints. To obtain IFCs (see Table 3) at P = 20 GPa, we have considered the values of /∂P as input from high-P RSS measurements [95] or reliable theoretical methods and used simulated pressure-dependent elastic- and lattice constants (cf. Section 3) as constraints. Once the optimized set of RIM interatomic force constants , and effective charge e) are obtained for the zb BeO material at ambient pressure (P= 0) and high pressure (P = 20 GPa), it is straight forward to simulate one phonon DOS by using Equation (5).
2.3. Thermodynamical properties
Application of isotropic P in solids causes the decrease (increase) of atomic distances (bonding interactions). These changes trigger the variations in their phonon frequencies. The T- and/or P-dependent lattice parameter in a solid is commonly measured by HR-XRD [76,77]. In most semiconductors the effect of P is known to produce stiffening of the longitudinal-, transverse-optical () phonons, longitudinal acoustic () modes while instigating softening in their transverse acoustic () phonon branches. Pressure-induced stiffening/softening influences the phase space for phonon scattering and thus affects their thermal conductivity. Besides thermal conductivity κ, specific heat , thermal expansion coefficient and Grüneisen parameters , are the other three most important characteristics of the zb semiconductors [76,77]. These features have contributed to the fundamental understanding of lattice anharmonicity.
The impact of P on is rather complex. The compression often leads to increase in the vibrational frequencies. One, therefore, expects shift of peak to higher T. Debye temperature relates to the maximum vibrational frequency of a solid and can decrease at lower T due to softening of modes [76,77]. Grüneisen parameter describes the anharmonicity of lattice vibrations and is related to the P dependence of phonon modes. Thermal expansion coefficient describes how a material expands or contracts with the change of T and can be affected by pressure, P. Researchers have typically used a differential scanning calorimetry [76,77] to study experimentally the specific heat of a material. In this method the crystal is heated at a controlled rate by comparing heat flow to the reference sample. This study allows estimation of based on the temperature change and heat absorbed by the crystal. Debye temperature is assessed from the experimental data of specific heat. Thermal expansion coefficient is generally measured in a three-terminal capacitance dilatometer [76]. Except for the wz BeO, no experimental TEC results
are known for the zb BeO material. Thermodynamic characteristics of zb BeO material can help evaluate the functionality of its use in thermal-management applications [1,2,3,4,5,6,7,8,9,10,11]. In the absence of experimental data, one must study these thermodynamical traits (cf. Section 2.3.1) by using a realistic lattice dynamical model.
2.3.1. Thermodynamical properties
At a constant P, the thermal expansion coefficient of a material reflects the fractional change of its dimension (either length l, or V) per degree change in the temperature, T. It accounts for the V- and/or P-dependent phonon frequencies. In an isotropic solid can be calculated in the QHA by minimizing the Helmholtz free energy with respect to V, while considering the temperature dependence of lattice constant and phonon mode frequencies [76,77]:
, (7)
where is the bulk modulus. In Equation (7), the summation on the right-hand side is performed over the phonon modes. At a constant volume, the vibrational frequencies of a material are assumed independent of T. The relative change of phonon frequencies with volume V (or pressure P, ) is usually described by the mode Grüneisen dispersions This dimensionless quantity is defined as [76,77]:
. (8)
The above Equation (8) serves to quantify the vibrational anharmonicity. Positive sign of implies that the phonon frequencies are increasing with the decrease in V (or increase in P). This causes a positive coefficient of thermal expansion and allows for dimensional stability of the material when exposed to T variations. This crucial property of the material is essential for applications requiring high thermal conductivity and electrical insulation. The low positive in a semiconductor helps minimize stress and potential damage caused by T fluctuation. The relevance of a positive for zb BeO will be discussed in Sections (3.3-3.4).
, (9)
where the contribution of each mode to is weighted by its contribution to the specific heat. The denominator in Equation (9) is the heat capacity at constant volume which can take the following form [76,77]:
. (10)
Where T is the temperature; and are the Boltzmann and Planck constants, respectively. It is possible to express via the calculated phonon dispersions and DOS . Thus, an equivalent form of Equation (10) can be rewritten as [76,77]:
(11)
. (12)
, (13)
In zb BeO, once the complete phonon dispersions Grüneisen dispersions are obtained for the wave vectors throughout the BZ, thermodynamical characteristics including the Debye temperature or can be easily simulated.
3. Numerical Computations, Results and Discussions
For zb BeO, the RIM phonon dispersions and DOS are required for assessing its thermodynamic characteristics. By using the structural and elastic properties of the material we have obtained in Section 2.2.3, the unique set of eleven IFCs at ambient P = 0 GPa. The simulated P-dependent lattice and elastic constants (cf. Section 3.1) of zb BeO are necessary for obtaining IFCs at higher P≠ 0 GPa.
3.1. Pressure Dependent Lattice and Elastic Constabts of zb BeO
Murnaghan equation of state (MEOS) is a simple relationship which links the applied P to the lattice constant a (or volume V) of a material [75]. It can be used to understand how much a solid compress by increasing isotropic P. By using appropriate parameters (see Table 2) of zb BeO we have calculated the P-dependent changes in [75]:
or , (14)
where is the bulk modulus and is its pressure derivativeThe results of P-dependent variations of and , are displayed in Figure 2 a) and 2b) respectively for 0 < P < 120 GPa. Modifications in P-dependent elastic constants displayed in Figure 2c) revealed satisfying the mechanical stability conditions in zb BeO.
3.1.1. Interatomic Force Constants of zb BeO at P≠ 0 Gpa
For zb BeO we have optimized the set of eleven RIM parameters (see Section 2.2.3) at ambient P. To achieve IFCs at P ≠ 0, the P-dependent ∂ω/∂P phonons at a few critical points are used as input while ∂a/∂P (see Figure 2 (a)) and ∂cij/∂P (see Figure 2 (c)) are employed as constraints. Perusal of Table 3 has clearly indicated that IFCs of zb BeO changed significantly with P. These outcomes are consistent with similar results obtained earlier in many compound semiconductors [69,70,71,72,73,74]. To appreciate the importance of two sets of RIM parameters, we have considered a linear interpolation scheme [69,70]:
, (15)
where (I = 1, 11) represents the values of RIM parameters. By using Equation (15) and IFCs (see Table 3) one can calculate P-dependent force constants at any desired pressure. These RIM force constants have helped us assessing the P-dependent phonon dispersions (see Section 3.1.2) for comprehending different thermodynamical (see Section 3.1.3) characteristics of zb BeO.
3.1.2. Phonon Dispersions and Density of States
For zb BeO, the RIM calculations of phonon dispersions at ambient P = 0 (blue color lines) and P = 20 Gpa (red color lines) are displayed in Figure 3 a) along the high symmetry directions (Γ → X → K → Γ → L → X → W → L) of the BZ. Simulated one-phonon DOS at P = 0 and P = 20 Gpa are also displayed in Figure 3 b). In the absence of experimental data, the RIM phonon values at P = 0 Gpa are compared reasonably well with the ab initio results [66]. Like ambient pressure P (= 0), the RIM results at P = 20 Gpa (red color lines) in zb BeO material for and exhibited identical features (Figures 3 a), 3 b)). Unlike zb ZnO and other II-VI semiconductors, in zb BeO our study has noticed atypical phonon features [95,96,97]. The study projected no appreciable P-dependent changes in the modes while all other phonons are shifted to higher frequencies at P = 20 Gpa. Similar outcomes can be examined from the calculated one phonon DOS (red color lines) revealing no noticeable changes in the modes. Other high frequency phonon branches have indicated upward shifts resulting in a relatively wider minimum phonon gap between 850 cm-1 – 960 cm-1.
The study of phonon dispersions for the zb BeO has revealed a large optical phonon splitting ~353 cm-1at the center of the BZ (i.e., at Γ point). Moving away from Γ point, the modes have exhibited high (low) dispersive behavior along the [Γ - X], [X- Γ], and [Γ - L] directions (see Figure 3 a)). The effect of such behavior is clearly reflected in the calculated DOS (see Figure 3 b)). Results of disclosed a broad band between 825 cm-1-1075 cm-1 with a minimum gap appearing in the frequency range of 744 cm-1 – 825 cm-1 at P = 0 Gpa (blue colored arrows), which shifts to higher frequency range of 850 cm-1 – 960 cm-1at P = 20 Gpa (red colored arrows).
Different from II-VI materials, another unusual behavior is noticed in zb BeO along the Γ-X and Γ-L directions where the modes (see Figures 3 a)) exhibit higher frequencies than phonons (i.e., . The higher frequency of mode than could potentially influence thermal conductivity by impacting phonon scattering mechanisms. Again, unlike zb BeO, most zb II-VI materials including zb ZnO have shown flatness of branches along the [Γ - X], and [Γ - L] directions. Accordingly, in our study (see Figures 3 b)) perceived no clear phonon gap between the acoustic and optical phonon branches. Interestingly, identical trends are noted in zb BN and diamond C, for their [96,97,98,99,100]. This provides a strong support to our earlier assertion that the structural, elastic and vibrational characteristics of zb BeO exhibit similarities with super hard BN and C materials [71]. Moreover, in zb BeO the eigenvectors are linked to vibrations of lighter Be atom and heavier O oscillation to phonon [66]. In Table 4, results of RIM phonon frequencies at high critical points are listed along with linear pressure coefficients (cm-1/Gpa) and Grüneisen parameters .
The results of and for zb BeO at ambient and higher P are used next to simulate the thermodynamical characteristics. Major impact of T is reported on different quantities including the Debye temperature , specific heat Grüneisen dispersions and linear thermal expansion coefficient (see Section 3.1 and 3.2).
(cm-1/Gpa) and Grüneisen parameters are also reported.
3.1.3. Debye Temperature and Specific Heat
In Figure 4 a) we have displayed our calculated RIM results of zb BeO for the Debye temperatureat P = 0 (blue colored line) and P = 20 Gpa (red colored lines) in the T range, 0 ≤ T ≤ 1600 K. Similar calculations are reported in Figure 4 (b) for the specific heat for T between 0 ≤ T ≤ 1800 K at P = 0 (blue colored line) and P = 20 Gpa (red colored lines), respectively.
At P = 0 GPa, the RIM calculation of for zb BeO provided a value of ~ 1390 K at nearly 0 K. It attained a minimum at ~ 124 K and reached a higher value of ~ 1187 K at RT, respectively. In the absence of P-dependent measurements of , the study for zb BeO at P = 20 GPa predicted a slight decrease in ~ 1370 K, while attaining ∼ 1177 K at 93 K and achieving ~1291 K at RT, respectively. The simulated trends in zb BeO have agreed reasonably well with the behavior noticed in many compound semiconductors [69,70,71,72,73,74]. The rise of at T > RT
can be attributed to the P-dependent stiffening of high frequency , , and phonons. In Table 5, we have summarized our RIM results by comparing them with the limited theoretical and/or experimental data for , , in (K). Similar comparison of RIM calculations of (100), (297), (High T) in (J/mol-K); and in (10-6 K−1) [6,80,81] with experimental data are also reported in Table 5.
3.2. Pressure Dependent Characteristics of zb BeO
By using the diamond anvil cell, many P-dependent Raman scattering studies are performed for comprehending the acoustical and optical phonons in several tetrahedrally coordinated elemental group IV and II-VI, III-V compound semiconductors [69,70,71,72,73,101]. Except for III-Ns and SiC, the existing data on most materials have confirmed [101] observing pressure-induced mode softening of zone edge transverse acoustical The P-induced stiffening is perceived, however, in every material for their zone edge longitudinal acoustical and high frequency optical phonons. Compression induced softening of phonons in II-VI materials and zb ZnO have triggered the negative tension in their bonds due to increased repulsion of electron-charge overlaps. Such mode softening is responsible for attributing negative thermal expansion coefficients in many elemental and II-VI compound semiconductors [101] including zb ZnO [102].
3.2.1. Grüneisen Dispersions
we have reported in Table 4, our RIM results of the linear pressure coefficients (≡ ) and . The methodology succinctly outlined in Section 2.3.1 is adopted to simulate -dependent Grüneisen dispersions for zb BeO. It can be noted that the Grüneisen constants for the zone edge revealed very small negative values (see Table 4) as compared to the large positive results noticed for high frequency longitudinal acoustic and optical phonons. For zb BeO, the T-dependent simulations of linear thermal expansion coefficient reported in Section 3.2.2 will be compared/contrasted and discussed with the existing experimental [80,81] and theoretical [82,83] data. In Figure 5, we have displayed our systematically simulated results of the mode Grüneisen dispersions for zb BeO along the high symmetry directions.
The results of Grüneisen dispersions (see Figure 5) and the selected values listed in Table 4 at a few high critical points have attested some important facts that for the zb BeO material, the of zone edge phonons exhibit much smaller negative values as compared to the large positive values of for high frequency longitudinal acoustical and optical modes. The impact of these-dependent Grüneisen dispersions on the linear thermal expansion coefficient of zb BeO is reported in Section 3.2.2.
3.2.2. Thermal Expansion Coefficient
In Section 3.3.1, we have described the RIM results of mode Grüneisen dispersions for the zb BeO material. By carefully incorporating values of and in Equations (7-9), we have simulated T-dependent linear thermal expansion coefficient . For zb BeO the results are displayed in Figure 6 for 0 ≤ T ≤ 1900 K. Unlike zb ZnO which showed negative thermal expansion [102] at low temperature, the RIM study of zb BeO has exhibited positive in the entire T range. Theoretical study has provided (green color line) a reasonably good comparison with the existing experimental data of Slack and Bartram [80] (open red square) and Kozlovskii et al. [81] (open inverted black triangle). Obviously, the RIM simulations have established an important fact that the sum of positive high frequency Grüneisen in Equation (7) are dominated over the very small negative values of . Thus, at low T our study for zb BeO has offered no negative (see Figure 6) values of .
4. Concluding Remarks
Understanding the electronic, structural, and thermal properties of a solid requires precise knowledge of its vibrational characteristics [77]. In the absence of INS data for zb XOs, theoretical simulations of lattice dynamics
and thermo dynamical properties have played crucial roles in solid state physics, materials science, and electronics. Among the II-Os, the wide bandgap BeO material has offered an exceptional thermal conductivity, chemical stability and high melting temperature. BeO is considered valuable for designing optoelectronics, power electronics, and thermal management systems. To develop LDHs-based advanced flexible micro-, nano electronics, the knowledge of phonon dispersion and thermal properties [e.g., γ(T), α(T)] of zb BeO is crucial. By adopting a realistic RIM, we have reported results of our methodical studies at ambient and high-pressure P to comprehend its structural, phonon, and thermodynamical properties. At ambient P = 0 GPa, the study has provided accurate in good agreement with the first-principles calculations [66]. At higher P = 20 GPa, the predictions are made for the , as well as T-dependent and .
Unlike zb ZnO, our RIM study has exhibited atypical phonon and thermodynamical properties for the zb BeO material. In zb BeO, the mode frequencies along Γ-X and Γ-L directions are higher than the phonons. Vibrational characteristics in zb ZnO are analogous to the conventional II-VI compound semiconductors. Like zb BeO, unusual trends in the phonon characteristics are also noticed in zb BN and diamond C materials [96,97,98,99,100]. These features have provided strong corroboration to our earlier assertion that the structural, elastic and vibrational traits of zb BeO exhibit similarities to the super hard BN and C materials [71]. In zb BeO, phonons are the major heat carriers. In modes, the Be and O atoms vibrate in the same direction as the wave propagation. However, in the phonons, the atoms move perpendicular to the wave propagation. As , one expects modes to carry more energy than the phonons. This could lead to increased scattering rates and possibly lower the thermal conductivity of zb BeO. The interplay between and modes and their respective scattering mechanisms is a challenging issue and requires further studies for accurately predicting and understanding thermal transport properties in zb BeO.
As compared to zb ZnO, the zone edge Grüneisen constants for the in zb BeO material have revealed very small negative values. Thus, our systematic calculations in the zb ZnO have exhibited negative at low T while positive results are predicted for zb BeO material in the entire 0 ≤ T ≤ 1900 K range. In semiconductors, the mode-softening of triggers negative tension in their atomic bonding due to increased repulsion of electron-charge overlaps to cause phase transitions. Both the zb BeO, ZnO and their BexZn1-xO alloys [103] are known to play important roles for managing heat dissipation in high-power electronics, optoelectronic devices, and flexible nano modules operating at varying temperatures which specifically require precise dimensional stability. Controlling and designing novel materials with a specific value of is essential for managing heat especially in miniaturized high-density devices are needed in the high-speed integrated electronics. By combining zb BeO and ZnO materials with positive and negative thermal expansion, it is quite likely to create LDH-based structures with tailored even for achieving near-zero value.
Author Contributions
DT has been responsible for the conceptualization, developing methodology, investigations for the computational analysis of results that are reported here and for writing the original manuscript. As a supervisor PB, has provided important feedback on the methodology used in the manuscript for assessing the structural, elastic and mechanical characteristics – checked, reviewed, and edited the original draft.
Funding
This research has received no external funding.
Acknowledgments
The work reported here was done at the Physics Department, University of North Florida (UNF) in Jacksonville, FL 32224. The author DT would like to thank Deanne Snavely, Dean College of Natural Science and Mathematics at Indiana University of Pennsylvania, for the travel support and Innovation Grant that he received from the School of Graduate Studies which made this research possible. D.N.T. would also like to thank Jason Haraldsen of the UNF, Physics Department providing the Origin 2017 software for data analysis and graphing
References
- Sharma, D.K.; Shukla, S.; Sharma, K.K.; Kumar, V. A review on ZnO: Fundamental properties and applications. Mater. Today: Proc. 2022, 49, 3028–3035. [Google Scholar] [CrossRef]
- Pushpalatha, C.; Suresh, J.; Gayathri, V.; Sowmya, S.; Augustine, D.; Alamoudi, A.; Zidane, B.; Albar, N.H.M.; Patil, S. Zinc Oxide Nanoparticles: A Review on Its Applications in Dentistry. Front. Bioeng. Biotechnol. 2022, 10, 917990. [Google Scholar] [CrossRef]
- Borysiewicz, M.A. ZnO as a Functional Material, a Review. Crystals 2019, 9, 505. [Google Scholar] [CrossRef]
- Pearton, S.; Norton, D.; Ip, K.; Heo, Y.; Steiner, T. Recentprogress in processing and properties of ZnO. Prog. Mater. Sci. 2005, 50, 293–340. [Google Scholar] [CrossRef]
- Schmidt-Mende, L.; MacManus-Driscoll, J.L. ZnO nanostructures, defects, and devices. Mater. Today 2007, 10, 40–48. [Google Scholar] [CrossRef]
- Ozgür, Ü.; Alivov, Y.I.; Liu, C.; Teke, A.; Reshchikov, M.A.; Doğan, S.; Avrutin, V.; Cho, S.-J.; Morkoç, H. A comprehensive review of ZnO materials and devices. J. Appl. Phys. 2005, 98, 041301. [Google Scholar] [CrossRef]
- A Sashin, V.; A Bolorizadeh, M.; Kheifets, A.S.; Ford, M.J. Electronic band structure of beryllium oxide. J. Physics: Condens. Matter 2003, 15, 3567–3581. [Google Scholar] [CrossRef]
- Subramanian, M.A.; Shannon, R.D.; Chai, B.H.T.; Abraham, M.M.; Wintersgill, M.C. Dielectric Constants of BeO, MgO, and CaOUsing the Two-Terminal Method. Phys. Chem. Miner. 1989, 16, 741–746. [Google Scholar] [CrossRef]
- Yim, K.; Yong, Y.; Lee, J.; Lee, K.; Nahm, H.-H.; Yoo, J.; Lee, C.; Hwang, C.S.; Han, S. Novel high-κ dielectrics for next-generation electronic devices screened by automated ab initio calculations. NPG Asia Mater. 2015, 7, e190–e190. [Google Scholar] [CrossRef]
- Yum, J.; Akyol, T.; Lei, M.; Ferrer, D.; Hudnall, T.; Downer, M.; Bielawski, C.; Bersuker, G.; Lee, J.; Banerjee, S. Electrical and physical characteristics for crystalline atomic layer deposited beryllium oxide thin film on Si and GaAs substrates. Thin Solid Films 2011, 520, 3091–3095. [Google Scholar] [CrossRef]
- Yum, J.H.; Akyol, T.; Ferrer, D.A.; Lee, J.C.; Banerjee, S.K.; Lei, M.; Downer, M.; Hudnall, T.W.; Bielawski, C.W.; Bersuker, G. Comparison of the self-cleaning effects and electrical characteristics of BeO and Al2O3 deposited as an interface passivation layer on GaAs MOS devices. J. Vac. Sci. Technol. A 2011, 29, 061501. [Google Scholar] [CrossRef]
- Camarano, D.M.; Mansur, F.A.; Santos, A.M.M.; Ribeiro, L.S. Thermal Conductivity of UO2–BeO–Gd2O3 Nuclear Fuel Pellets. Int. J. Thermophys. 2019, 40, 110. [Google Scholar] [CrossRef]
- Chandramouli, D.; Revankar, S.T. Development of Thermal Models and Analysis of UO2-BeO Fuel during a Loss of Coolant Accident. Int. J. Nucl. Energy 2014, 2014, 1–9. [Google Scholar] [CrossRef]
- Chen, S.; Yuan, C. Neutronic study of UO2-BeO fuel with various claddings. Nucl. Mater. Energy 2020, 22. [Google Scholar] [CrossRef]
- Garcia, C.B.; Brito, R.A.; Ortega, L.H.; Malone, J.P.; McDeavitt, S.M. Manufacture of a UO2-Based Nuclear Fuel with Improved Thermal Conductivity with the Addition of BeO. Met. Mater. Trans. E 2017, 4, 70–76. [Google Scholar] [CrossRef]
- Nicolay, S.; Faÿ, S.; Ballif, C. Growth Model of MOCVD Polycrystalline ZnO. Cryst. Growth Des. 2009, 9, 4957–4962. [Google Scholar] [CrossRef]
- Zhang, J.; Cui, X.; Shi, Z.; Wu, B.; Zhang, Y.; Zhang, B. Nucleation and growth of ZnO films on Si substrates by LP-MOCVD. Superlattices Microstruct. 2014, 71, 23–29. [Google Scholar] [CrossRef]
- Youdou, Z.; Shulin, G.; Jiandong, Y.; Wei, L.; Shunmin, Z.; Feng, Q.; Liqun, H.; Rang, Z.; Yi, S. , MOCVD Growth and Properties of ZnO and Znl-x,MgxO Films, IEEE 2003, 0-7803-7887-3/03/$17. 00 0 2003.
- Kadhim, G.A. Study of the structural and optical traits of In:ZnO thin films via spray pyrolysis strategy: Influence of laser radiation change in different periods. 2ND INTERNATIONAL CONFERENCE FOR ENGINEERING SCIENCES AND INFORMATION TECHNOLOGY (ESIT 2022): ESIT2022 Conference Proceedings. LOCATION OF CONFERENCE, IraqDATE OF CONFERENCE; p. 240006.
- Wei, X.H.; Li, Y.R.; Zhu, J.; Huang, W.; Zhang, Y.; Luo, W.B.; Ji, H. Epitaxial properties of ZnO thin films on SrTiO3 substrates grown by laser molecular beam epitaxy. Appl. Phys. Lett. 2007, 90, 151918. [Google Scholar] [CrossRef]
- Wei, X.H.; Li, Y.R.; Zhu, J.; Huang, W.; Zhang, Y.; Luo, W.B.; Ji, H. Epitaxial properties of ZnO thin films on SrTiO3 substrates grown by laser molecular beam epitaxy. Appl. Phys. Lett. 2007, 90, 151918. [Google Scholar] [CrossRef]
- Opel, M.; Geprägs, S.; Althammer, M.; Brenninger, T.; Gross, R. Laser molecular beam epitaxy of ZnO thin films and heterostructures. J. Phys. D: Appl. Phys. 2013, 47, 034002. [Google Scholar] [CrossRef]
- Chauveau, J.-M.; Morhain, C.; Teisseire, M.; Laügt, M.; Deparis, C.; Zuniga-Perez, J.; Vinter, B. (Zn, Mg)O/ZnO-based heterostructures grown by molecular beam epitaxy on sapphire: Polar vs. non-polar. Microelectron. J. 2009, 40, 512–516. [Google Scholar] [CrossRef]
- Peltier, T.; Takahashi, R.; Lippmaa, M. Pulsed laser deposition of epitaxial BeO thin films on sapphire and SrTiO3. Appl. Phys. Lett. 2014, 104, 231608. [Google Scholar] [CrossRef]
- Triboulet, R.; Perrie`re, J. , Epitaxial growth of ZnO films, Progress in Crystal Growth and Characterization of Materials 2003, 47 65-138.
- Yıldırım, Ö.A.; Durucan, C. Synthesis of zinc oxide nanoparticles elaborated by microemulsion method. J. Alloy. Compd. 2010, 506, 944–949. [Google Scholar] [CrossRef]
- Mao, Y.; Li, Y.; Zou, Y.; Shen, X.; Zhu, L.; Liao, G. Solvothermal synthesis and photocatalytic properties of ZnO micro/nanostructures. Ceram. Int. 2019, 45, 1724–1729. [Google Scholar] [CrossRef]
- Araujo Jr, E.A.; Nobre, F.X.G.S.; Cavalcante, L.S.; Santos, M.R.M. C.; Souza, F. L.; de Matos, J.M.E. , Synthesis, growth mechanism, optical properties and catalytic activity of ZnO microcrystals obtained via hydrothermal processing, RSC Adv. , 2017, 7, 24263–24281. [Google Scholar]
- Brown, R.A.; Evans, J.E.; Smith, N.A.; Tarat, A.; Jones, D.R.; Barnett, C.J.; Maffeis, T.G.G. The effect of metal layers on the morphology and optical properties of hydrothermally grown zinc oxide nanowires. J. Mater. Sci. 2013, 48, 4908–4913. [Google Scholar] [CrossRef]
- Horio, Y.; Yuhara, J.; Takakuwa, Y.; Ogawa, S.; Abe, K. Polarity identification of ZnO(0001) surface by reflection high-energy electron diffraction. Jpn. J. Appl. Phys. 2018, 57. [Google Scholar] [CrossRef]
- Chen, Y.; Bagnall, D.; Yao, T. ZnO as a novel photonic material for the UV region. Mater. Sci. Eng. B 2000, 75, 190–198. [Google Scholar] [CrossRef]
- Huang, M.R.S.; Erni, R.; Lin, H.-Y.; Wang, R.-C.; Liu, C.-P. Characterization of wurtzite ZnO using valence electron energy loss spectroscopy. Phys. Rev. B 2011, 84. [Google Scholar] [CrossRef]
- Kaida, T.; Kamioka, K.; Ida, T.; Kuriyama, K.; Kushida, K.; Kinomura, A. Rutherford backscattering and nuclear reaction analyses of hydrogen ion-implanted ZnO bulk single crystals. Nucl. Instruments Methods Phys. Res. Sect. B: Beam Interactions Mater. Atoms 2014, 332, 15–18. [Google Scholar] [CrossRef]
- Ismail, M.A.; Taha, K.K.; Modwi, A.; Khezami, L. , ZnO Nanoparticles: Surface and x-ray profile analysis, Journal of Ovonic Research 2018, 14, 381 – 393.
- Mohan, A.C.; Renjanadevi, B. Preparation of Zinc Oxide Nanoparticles and its Characterization Using Scanning Electron Microscopy (SEM) and X-Ray Diffraction(XRD). Procedia Technol. 2016, 24, 761–766. [Google Scholar] [CrossRef]
- Martínez-Tomás, M.C.; Hortelano, V.; Jiménez, J.; Wang, B.; Muñoz-Sanjosé, V. High resolution X-ray diffraction, X-ray multiple diffraction and cathodoluminescence as combined tools for the characterization of substrates for epitaxy: the ZnO case. CrystEngComm 2013, 15, 3951–3958. [Google Scholar] [CrossRef]
- Chao, L.-C.; Yang, S.-H. Growth and Auger electron spectroscopy characterization of donut-shaped ZnO nanostructures. Appl. Surf. Sci. 2007, 253, 7162–7165. [Google Scholar] [CrossRef]
- Ni, H.; Li, X. Young’s modulus of ZnO nanobelts measured using atomic force microscopy and nanoindentation techniques. Nanotechnology 2006, 17, 3591–3597. [Google Scholar] [CrossRef]
- Kirmse, H.; Sparenberg, M.; Zykov, A.; Sadofev, S.; Kowarik, S.; Blumstengel, S. Structure of p-Sexiphenyl Nanocrystallites in ZnO Revealed by High-Resolution Transmission Electron Microscopy. Cryst. Growth Des. 2016, 16, 2789–2794. [Google Scholar] [CrossRef]
- Li, X.; Cheng, S.; Deng, S.; Wei, X.; Zhu, J.; Chen, Q. Direct Observation of the Layer-by-Layer Growth of ZnO Nanopillar by In situ High Resolution Transmission Electron Microscopy. Sci. Rep. 2017, 7, 40911. [Google Scholar] [CrossRef]
- Raouf, D. , Synthesis and photoluminescence characterization of ZnO nanoparticles, Journal of Luminescence 2013, 134, 213–219.
- Saadatkia, P.; Ariyawansa, G.; Leedy, K.D.; Look, D.C.; Boatner, L.A.; Selim, F.A. Fourier Transform Infrared Spectroscopy Measurements of Multi-phonon and Free-Carrier Absorption in ZnO. J. Electron. Mater. 2016, 45, 6329–6336. [Google Scholar] [CrossRef]
- Keyes, B.; Gedvilas, L.; Li, X.; Coutts, T. Infrared spectroscopy of polycrystalline ZnO and ZnO:N thin films. J. Cryst. Growth 2005, 281, 297–302. [Google Scholar] [CrossRef]
- Damen, T.C.; Porto, S.P.S.; Tell, B. Raman Effect in Zinc Oxide. Phys. Rev. B 1966, 142, 570–574. [Google Scholar] [CrossRef]
- Calleja, J.M.; Cardona, M. , Resonant raman scattering in ZnO, Phys. Rev. B 1977, 16, 3753. [Google Scholar] [CrossRef]
- Manjón, F.J.; Syassen, K.; Lauck, R. Effect of Pressure on Phonon Modes in Wurtzite Zinc Oxide. High Press. Res. 2002, 22, 299–304. [Google Scholar] [CrossRef]
- Kokila, A. Jagannatha Reddy, M.K.; Nagabhushana, H.; Rao, J.L.; Shivakumara, C.; Nagabhushana, B.M.; Chakradhar, R.P.S.
- Combustion synthesis, characterization and Raman studies of ZnO nano powders, Spectrochimica Acta Part A 2011, 81 53–58.
- Serrano, J.; Manjón, F.J.; Romero, A.H.; Ivanov, A.; Cardona, M.; Lauck, R.; Bosak, A.; Krisch, M. , Phonon dispersion relations of zinc oxide: Inelastic neutron scattering and ab initio calculations, Phys. Rev. B 2010, 81, 174304. [Google Scholar] [CrossRef]
- Serrano, J.; Romero, A.H.; Manjo’n, F.J.; Lauck, R.; Cardona, M.; Rubio, A. , Pressure dependence of the lattice dynamics of ZnO: An ab initio approach, Phys. Rev. B 2004, 69, 094306. [Google Scholar] [CrossRef]
- Serrano, J.; Manjón, F.J.; Romero, A.H.; Ivanov, A.; Lauck, R.; Cardona, M.; Krisch, M. The phonon dispersion of wurtzite-ZnO revisited. Phys. Status solidi (b) 2007, 244, 1478–1482. [Google Scholar] [CrossRef]
- Bohórquez, C.; Bakkali, H.; Delgado, J.J.; Blanco, E.; Herrera, M.; Domínguez, M. Spectroscopic Ellipsometry Study on Tuning the Electrical and Optical Properties of Zr-Doped ZnO Thin Films Grown by Atomic Layer Deposition. ACS Appl. Electron. Mater. 2022, 4, 925–935. [Google Scholar] [CrossRef]
- Bhandari, K.P.; Sapkota, D.R.; Ramanujam, B. Spectroscopic-ellipsometry study of the optical properties of ZnO nanoparticle thin films. MRS Commun. 2024, 14, 1085–1089. [Google Scholar] [CrossRef]
- Chibueze, T. Ab initio study of mechanical, phonon and electronic Properties of cubic zinc-blende structure of ZnO. Niger. Ann. PURE Appl. Sci. 2021, 4, 130–138. [Google Scholar] [CrossRef]
- Zafar, M.; Ahmed, S.; Shakil, M.; Choudhary, M.A. First-principles calculations of structural, electronic, and thermodynamic properties of ZnxO1−xSx alloys. Chin. Phys. B 2014, 23, 106108. [Google Scholar] [CrossRef]
- Yu, Y.; Zhou, J.; Han, H.; Zhang, C.; Cai, T.; Song, C.; Gao, T. , Ab initio study of structural, dielectric, and dynamical properties of zinc-blende ZnX (X = O, S, Se, Te), Journal of Alloys and Compounds 2009, 471, 492–497.
- Singh, J.; Jain, V.K. , Structural, Electronic and Optical Properties of ZnO Material Using First Principle Calculation, Journal of Polymer & Composites 2023, 11, S27; ISSN: 2321-8525.
- Mohammadi, A.S.; Baizaee, S.M.; Salehi, H. , Density Functional Approach to Study Electronic Structure of ZnO Single Crystal, World Appl. Sci. J. 2011, 14, 1530–1536. [Google Scholar]
- Charifi, Z.; Baaziz, H.; Reshak, A.H. Ab-initio investigation of structural, electronic and optical properties for three phases of ZnO compound. Phys. Status solidi (b) 2007, 244, 3154–3167. [Google Scholar] [CrossRef]
- Qing, X.; Zhang, C.; Gong, J.; Chen, S. Ab initio study of photoelectric properties in ZnO transparent conductive oxide. Vacuum 2021, 191. [Google Scholar] [CrossRef]
- Song, H.-F.; Liu, H.-F.; Tian, E. Structural and thermodynamic properties of hexagonal BeO at high pressures and temperatures. J. Physics: Condens. Matter 2007, 19. [Google Scholar] [CrossRef]
- Bocharov, D.; Pudza, I.; Klementiev, K.; Krack, M.; Kuzmin, A. Study of High-Temperature Behaviour of ZnO by Ab Initio Molecular Dynamics Simulations and X-ray Absorption Spectroscopy. Materials 2021, 14, 5206. [Google Scholar] [CrossRef]
- Bachmann, M.; Czerner, M.; Edalati-Boostan, S.; Heiliger, C. Ab initio calculations of phonon transport in ZnO and ZnS. Eur. Phys. J. B 2012, 85, 146. [Google Scholar] [CrossRef]
- Wang, Z.; Wang, F.; Wang, L.; Jia, Y.; Sun, Q. First-principles study of negative thermal expansion in zinc oxide. J. Appl. Phys. 2013, 114, 063508. [Google Scholar] [CrossRef]
- Ren, D.; Xiang, B.; Gao, Y.; Hu, C.; Zhang, H. Ab initio study of lattice instabilities of zinc chalcogenides ZnX (X=O, S, Se, Te) induced by ultrafast intense laser irradiation. AIP Adv. 2017, 7. [Google Scholar] [CrossRef]
- Calzolari, A.; Nardelli, M.B. Dielectric properties and Raman spectra of ZnO from a first principles finite-differences/finite-fields approach. Sci. Rep. 2013, 3, srep02999. [Google Scholar] [CrossRef]
- Liu, J.; Allen, P.B. Internal and external thermal expansions of wurtzite ZnO from first principles. Comput. Mater. Sci. 2018, 154, 251–255. [Google Scholar] [CrossRef]
- Duman, S.; Sütlü, A.; Bağcı, S.; Tütüncü, H.M.; Srivastava, G.P. Structural, elastic, electronic, and phonon properties of zinc-blende and wurtzite BeO. J. Appl. Phys. 2009, 105, 033719. [Google Scholar] [CrossRef]
- Kunc, K. Dynamique de réseau de composés ANB8-N présentant la structure de la blende. Ann. Phys. (Paris) 1973– 1974, 8, 319–401. [Google Scholar] [CrossRef]
- Talwar, D.N. Computational phonon dispersions structural and thermodynamical characteristics of novel C-based XC (X = Si, Ge and Sn) materials. Next Mater. 2024, 4. [Google Scholar] [CrossRef]
- Talwar, D.N.; Vandevyver, M. Pressure-dependent phonon properties of III-V compound semiconductors. Phys. Rev. B 1990, 41, 12129–12139. [Google Scholar] [CrossRef]
- Talwar, D.N.; Becla, P. Microhardness, Young’s and Shear Modulus in Tetrahedrally Bonded Novel II-Oxides and III-Nitrides. Materials 2025, 18, 494. [Google Scholar] [CrossRef] [PubMed]
- Talwar, D.N.; Sherbondy, J.C. Thermal expansion coefficient of 3C–SiC. Appl. Phys. Lett. 1995, 67, 3301–3303. [Google Scholar] [CrossRef]
- Talwar, D.N. Phonon excitations and thermodynamic properties of cubic III nitrides. Appl. Phys. Lett. 2002, 80, 1553–1555. [Google Scholar] [CrossRef]
- Talwar, D.N. Pressure-dependent mode Grüneisen parameters and their impact on thermal expansion coefficient of zinc-blende InN. J. Mater. Sci. 2023, 58, 8379–8397. [Google Scholar] [CrossRef]
- Murnaghan, F.D. The Compressibility of Media under Extreme Pressures. Proc. Natl. Acad. Sci. 1944, 30, 244–247. [Google Scholar] [CrossRef]
- Mori, Y.; Niiya, N.; Ukegawa, K.; Mizuno, T.; Takarabe, K.; Ruoff, A.L. High-pressure X-ray structural study of BeO and ZnO to 200 GPa. Phys. Status solidi (b) 2004, 241, 3198–3202. [Google Scholar] [CrossRef]
- Boer, K.W.; Pohl, U.W. , Phonon-induced thermal properties, Semiconductor Physics DOI 10, 1007/978-3-319-06540-3_5-1 (Springer International Publishing Switzerland 2014).
- Morkoç, H.; Özgür, Ü. Zinc Oxide: Fundamentals, Materials and Device Technology; Wiley-VCH: Weinheim, Germany, 2009; ISBN 978-3-527-40813-9. [Google Scholar]
- Yates, B.; Cooper, R.F.; Kreitman, M.M. Low-Temperature Thermal Expansion of Zinc Oxide. Vibrations in Zinc Oxide and Sphalerite Zinc Sulfide. Phys. Rev. B 1971, 4, 1314–1323. [Google Scholar] [CrossRef]
- Ibach, H. Thermal Expansion of Silicon and Zinc Oxide (II). Phys. Status solidi (b) 1969, 33, 257–265. [Google Scholar] [CrossRef]
- Slack, G.A.; Bartram, S.F. Thermal expansion of some diamondlike crystals. J. Appl. Phys. 1975, 46, 89–98. [Google Scholar] [CrossRef]
- Kozlovskii, Y.M.; Stankus, S.V. Thermal expansion of beryllium oxide in the temperature interval 20−1550°C. High Temp. 2014, 52, 536–540. [Google Scholar] [CrossRef]
- Luo, F.; Cheng, Y.; Cai, L.C.; Chen, X.R. , Structure and thermodynamic properties of BeO: Empirical corrections in the quasi-harmonic approximation, J. Appl. Phys. 2013, 113, 033517. [Google Scholar] [CrossRef]
- Wdowik, U.D. , Structural stability and thermal properties of BeO from the quasi-harmonic approximation. J. Phys. Condens. Matter 2010, 22, 045404. [Google Scholar] [CrossRef]
- Sahariah, M.B.; Ghosh, S. Dynamical stability and phase transition of BeO under pressure. J. Appl. Phys. 2010, 107, 083520. [Google Scholar] [CrossRef]
- Yu, B.-R.; Yang, J.-W.; Guo, H.-Z.; Ji, G.-F.; Chen, X.-R. Phase transition and elastic properties of BeO under pressure from first-principles calculations. Phys. B: Condens. Matter 2009, 404, 1940–1946. [Google Scholar] [CrossRef]
- Zhang, Q.L.; Zhang, P.; Song, H.F.; Liu, H.F. , Mean-field potential calculations of high-pressure equation of state for BeO. Chin. Phys. B 2008, 17, 1341–1348. [Google Scholar]
- Bosak, A.; Schmalzl, K.; Krisch, M.; van Beek, W.; Kolobanov, V. , Lattice dynamics of beryllium oxide: inelastic x-ray scattering and ab initio calculations, Phys. Rev. B 2008, 77, 224303. [Google Scholar] [CrossRef]
- Sahariah, M.B.; Ghosh, S. , Ab initio calculation of lattice dynamics in BeO, J. Phys. Condens. Matter 2008, 20, 395201. [Google Scholar] [CrossRef]
- Amrani, B.; Hassan, F.E.H.; Akbarzadeh, H. First-principles investigations of the ground-state and excited-state properties of BeO polymorphs. J. Physics: Condens. Matter 2007, 19. [Google Scholar] [CrossRef]
- Song, H.-F.; Liu, H.-F.; Tian, E. Structural and thermodynamic properties of hexagonal BeO at high pressures and temperatures. J. Physics: Condens. Matter 2007, 19. [Google Scholar] [CrossRef]
- Cai, Y.; Wu, S.; Xu, R.; Yu, J. Pressure-induced phase transition and its atomistic mechanism in BeO: A theoretical calculation. Phys. Rev. B 2006, 73, 184104. [Google Scholar] [CrossRef]
- Park, C.-J.; Lee, S.-G.; Ko, Y.-J.; Chang, K.J. Theoretical study of the structural phase transformation of BeO under pressure. Phys. Rev. B 1999, 59, 13501–13504. [Google Scholar] [CrossRef]
- E Van Camp, P.; E Van Doren, V. Ground-state properties and structural phase transformation of beryllium oxide. J. Physics: Condens. Matter 1996, 8, 3385–3390. [Google Scholar] [CrossRef]
- Boettger, J.C.; Wills, J.M. Theoretical structural phase stability of BeO to 1 TPa. Phys. Rev. B 1996, 54, 8965–8968. [Google Scholar] [CrossRef]
- Kourouklis, G.A.; Sood, A.K.; Hochheimer, H.D.; Jayaraman, A. High-pressure Raman study of the optic-phonon modes in BeO. Phys. Rev. B 1985, 31, 8332–8334. [Google Scholar] [CrossRef] [PubMed]
- Karch, K.; Bechstedt, F. , Ab initio lattice dynamics of BN and AlN: Covalent versus ionic forces, Phys. Rev. B 1997, 56, 7404. [Google Scholar] [CrossRef]
- Pavone, P.; Karch, K.; Schiitt, O.; Windl, W.; Strauch, D.; Giannozzi, P.; Baroni, S.
- Phys. Rev. B 1993, 48, 3156. [Google Scholar]
- Erba, A. On combining temperature and pressure effects on structural properties of crystals with standard ab initio techniques. J. Chem. Phys. 2014, 141, 124115. [Google Scholar] [CrossRef]
- Hao, Y.-J.; Chen, X.-R.; Cui, H.-L.; Bai, Y.-L. First-principles calculations of elastic constants of c-BN. Phys. B: Condens. Matter 2006, 382, 118–122. [Google Scholar] [CrossRef]
- Wang, H.; Xu, H.; Wang, X.; Jiang, C. High-pressure lattice dynamics and thermodynamic properties of zinc-blende BN from first-principles calculation. Phys. Lett. A 2009, 373, 2082–2086. [Google Scholar] [CrossRef]
- Weinstein, B.A.; Zallen, R. , Pressure-Raman effects in covalent and molecular solids, in Light Scattering in Solids IV, edited by M. Cardona and G. Guntherodt, Topics in Applied Physics (Springer, Berlin, 1984), Vol. 54, pp. 463–527; see, especially, Table 8.1 and pp. 492–497 in this review.
- Wang, S.-M.; Wu, J.-X.; Gunawan, H.; Tu, R.-Q. Optimization of Machining Parameters for Corner Accuracy Improvement for WEDM Processing. Appl. Sci. 2023, 12, 10324. [Google Scholar] [CrossRef]
- Talwar, D.N.; Becla, P. Composition-Dependent Structural, Phonon, and Thermodynamical Characteristics of Zinc-Blende BeZnO. Materials 2025, 18, 3101. [Google Scholar] [CrossRef]
Figure 1.
Three possible crystal structures of XOs: (a) wurtzite (B4), (b) rock-salt (B1) and (c) zinc-blende (B3). The X and O atoms are shown by using shaded grey and solid yellow color spheres, respectively.
Figure 1.
Three possible crystal structures of XOs: (a) wurtzite (B4), (b) rock-salt (B1) and (c) zinc-blende (B3). The X and O atoms are shown by using shaded grey and solid yellow color spheres, respectively.
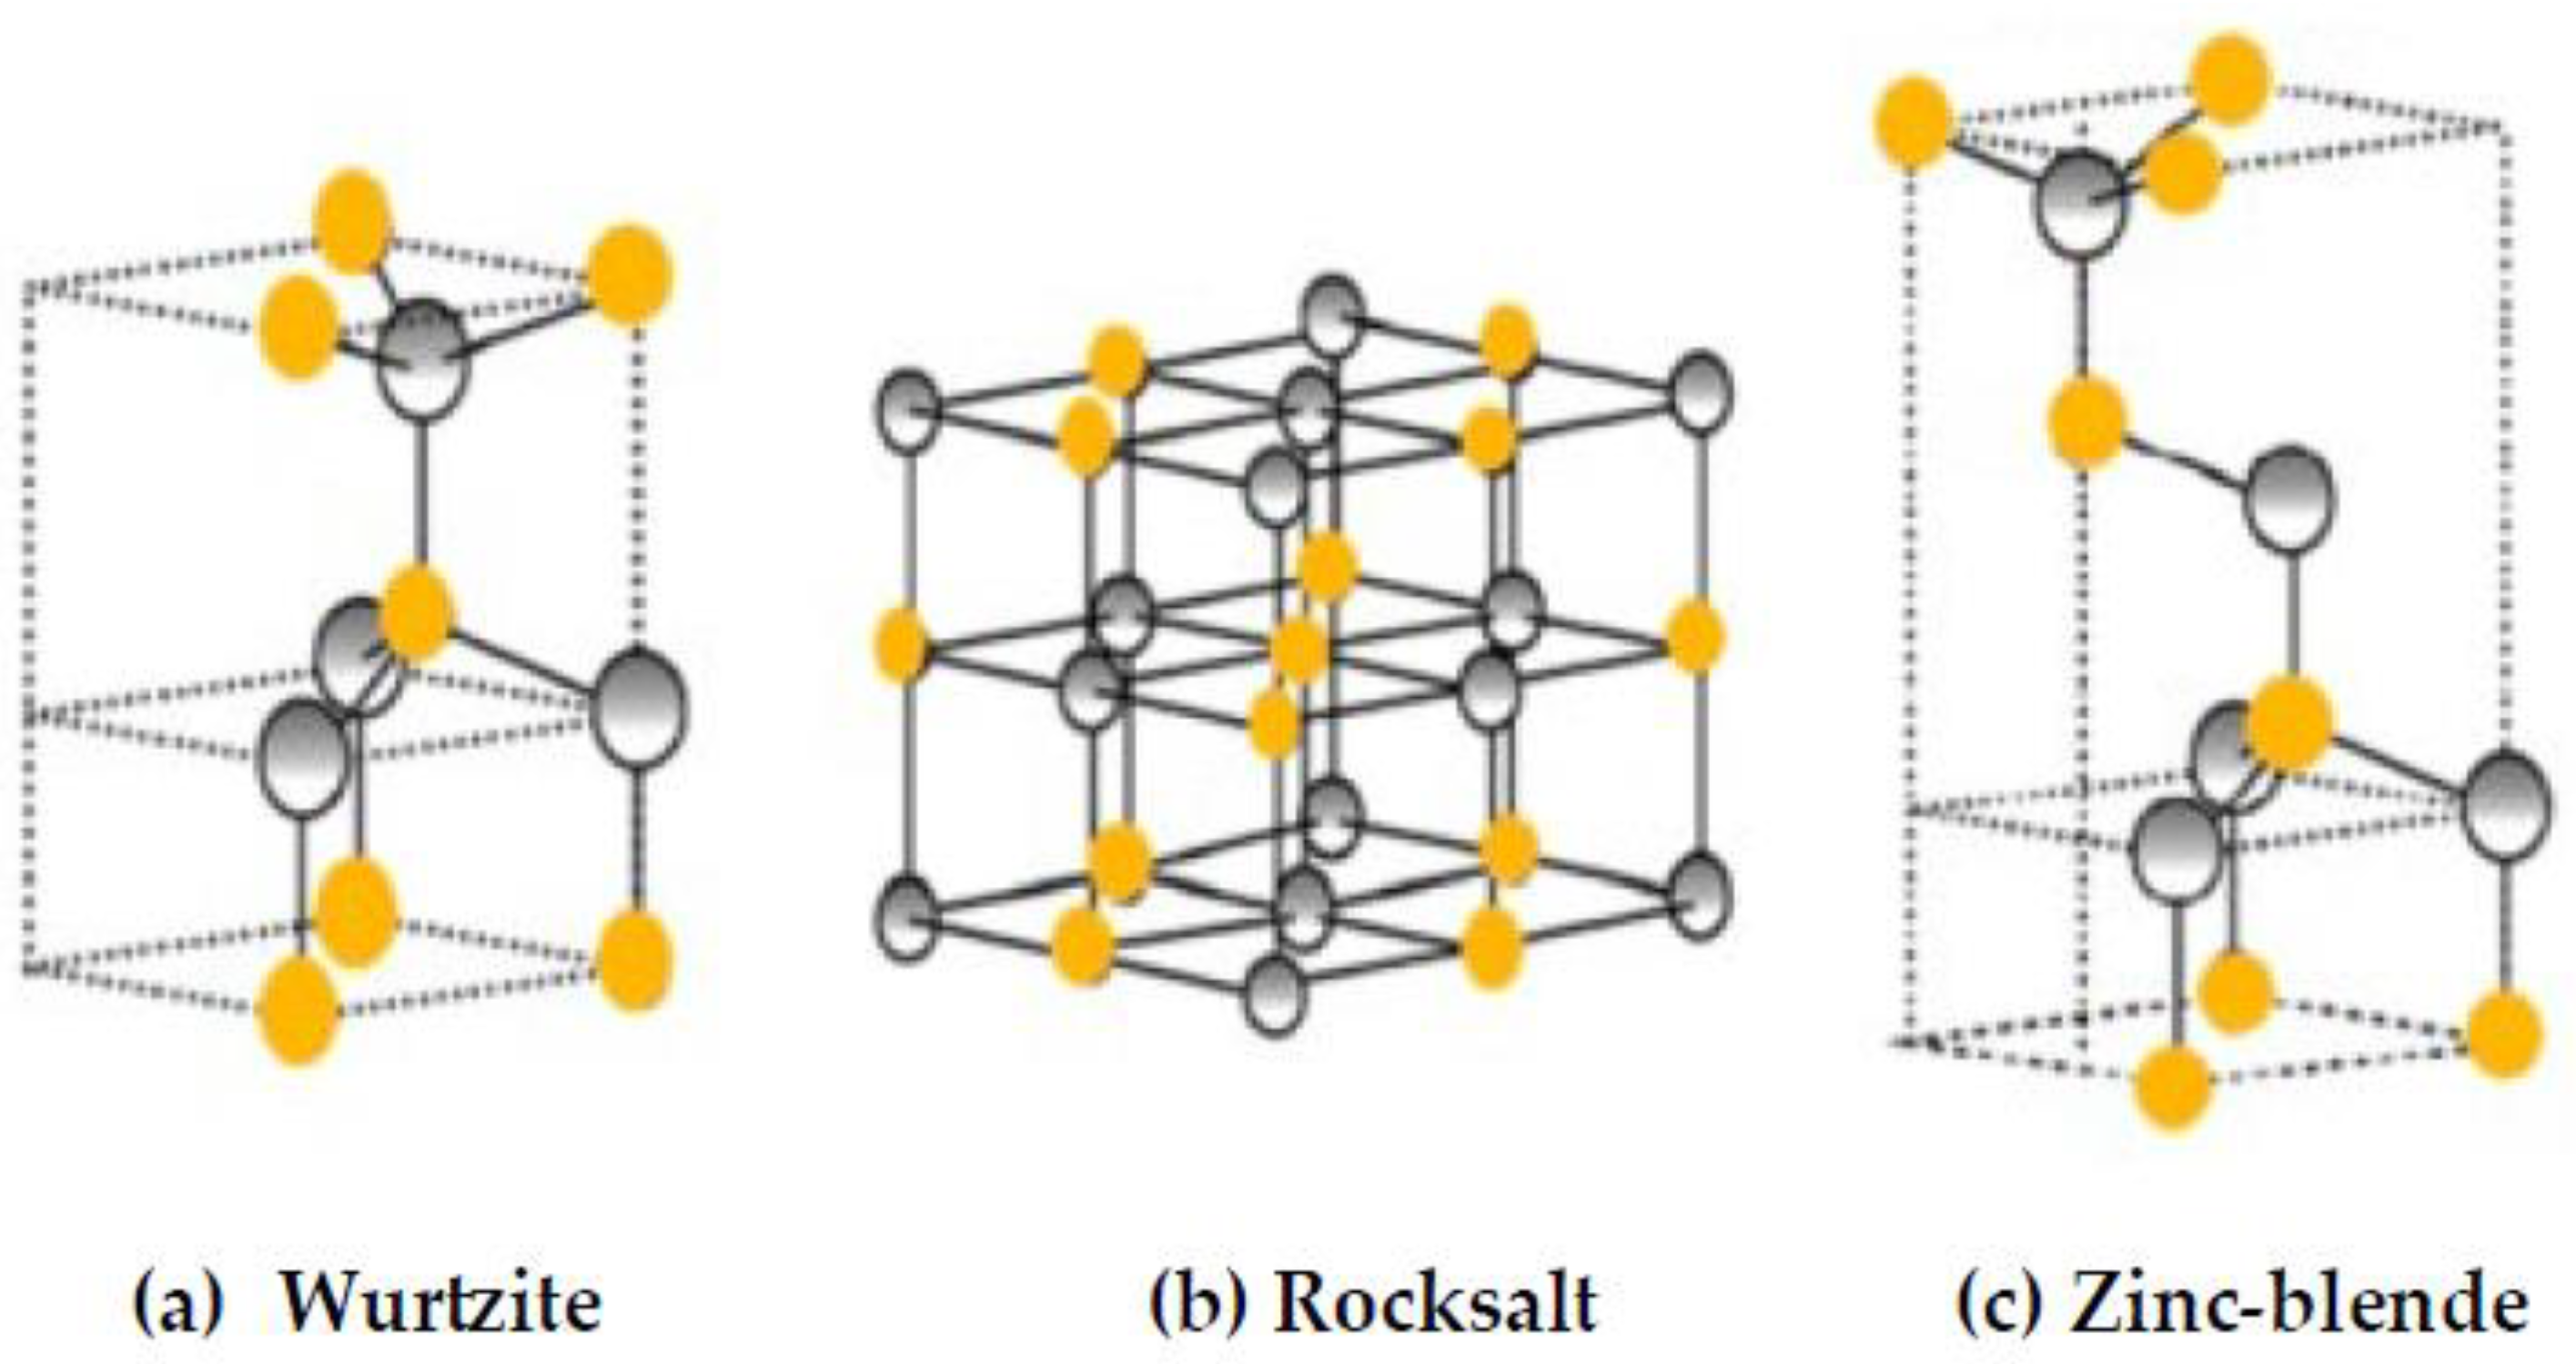
Figure 2.
(a) Murnaghan’s equation of state is used to calculate lattice constant ratio as a function of P, (b) comparison of P-dependent volume ratio with the experimental data, (c) ) calculated variations of the elastic constants of , , and as a function of P, satisfying the mechanical stability conditions, viz., ( – ) > 0, ( + 2) > 0, and > 0.
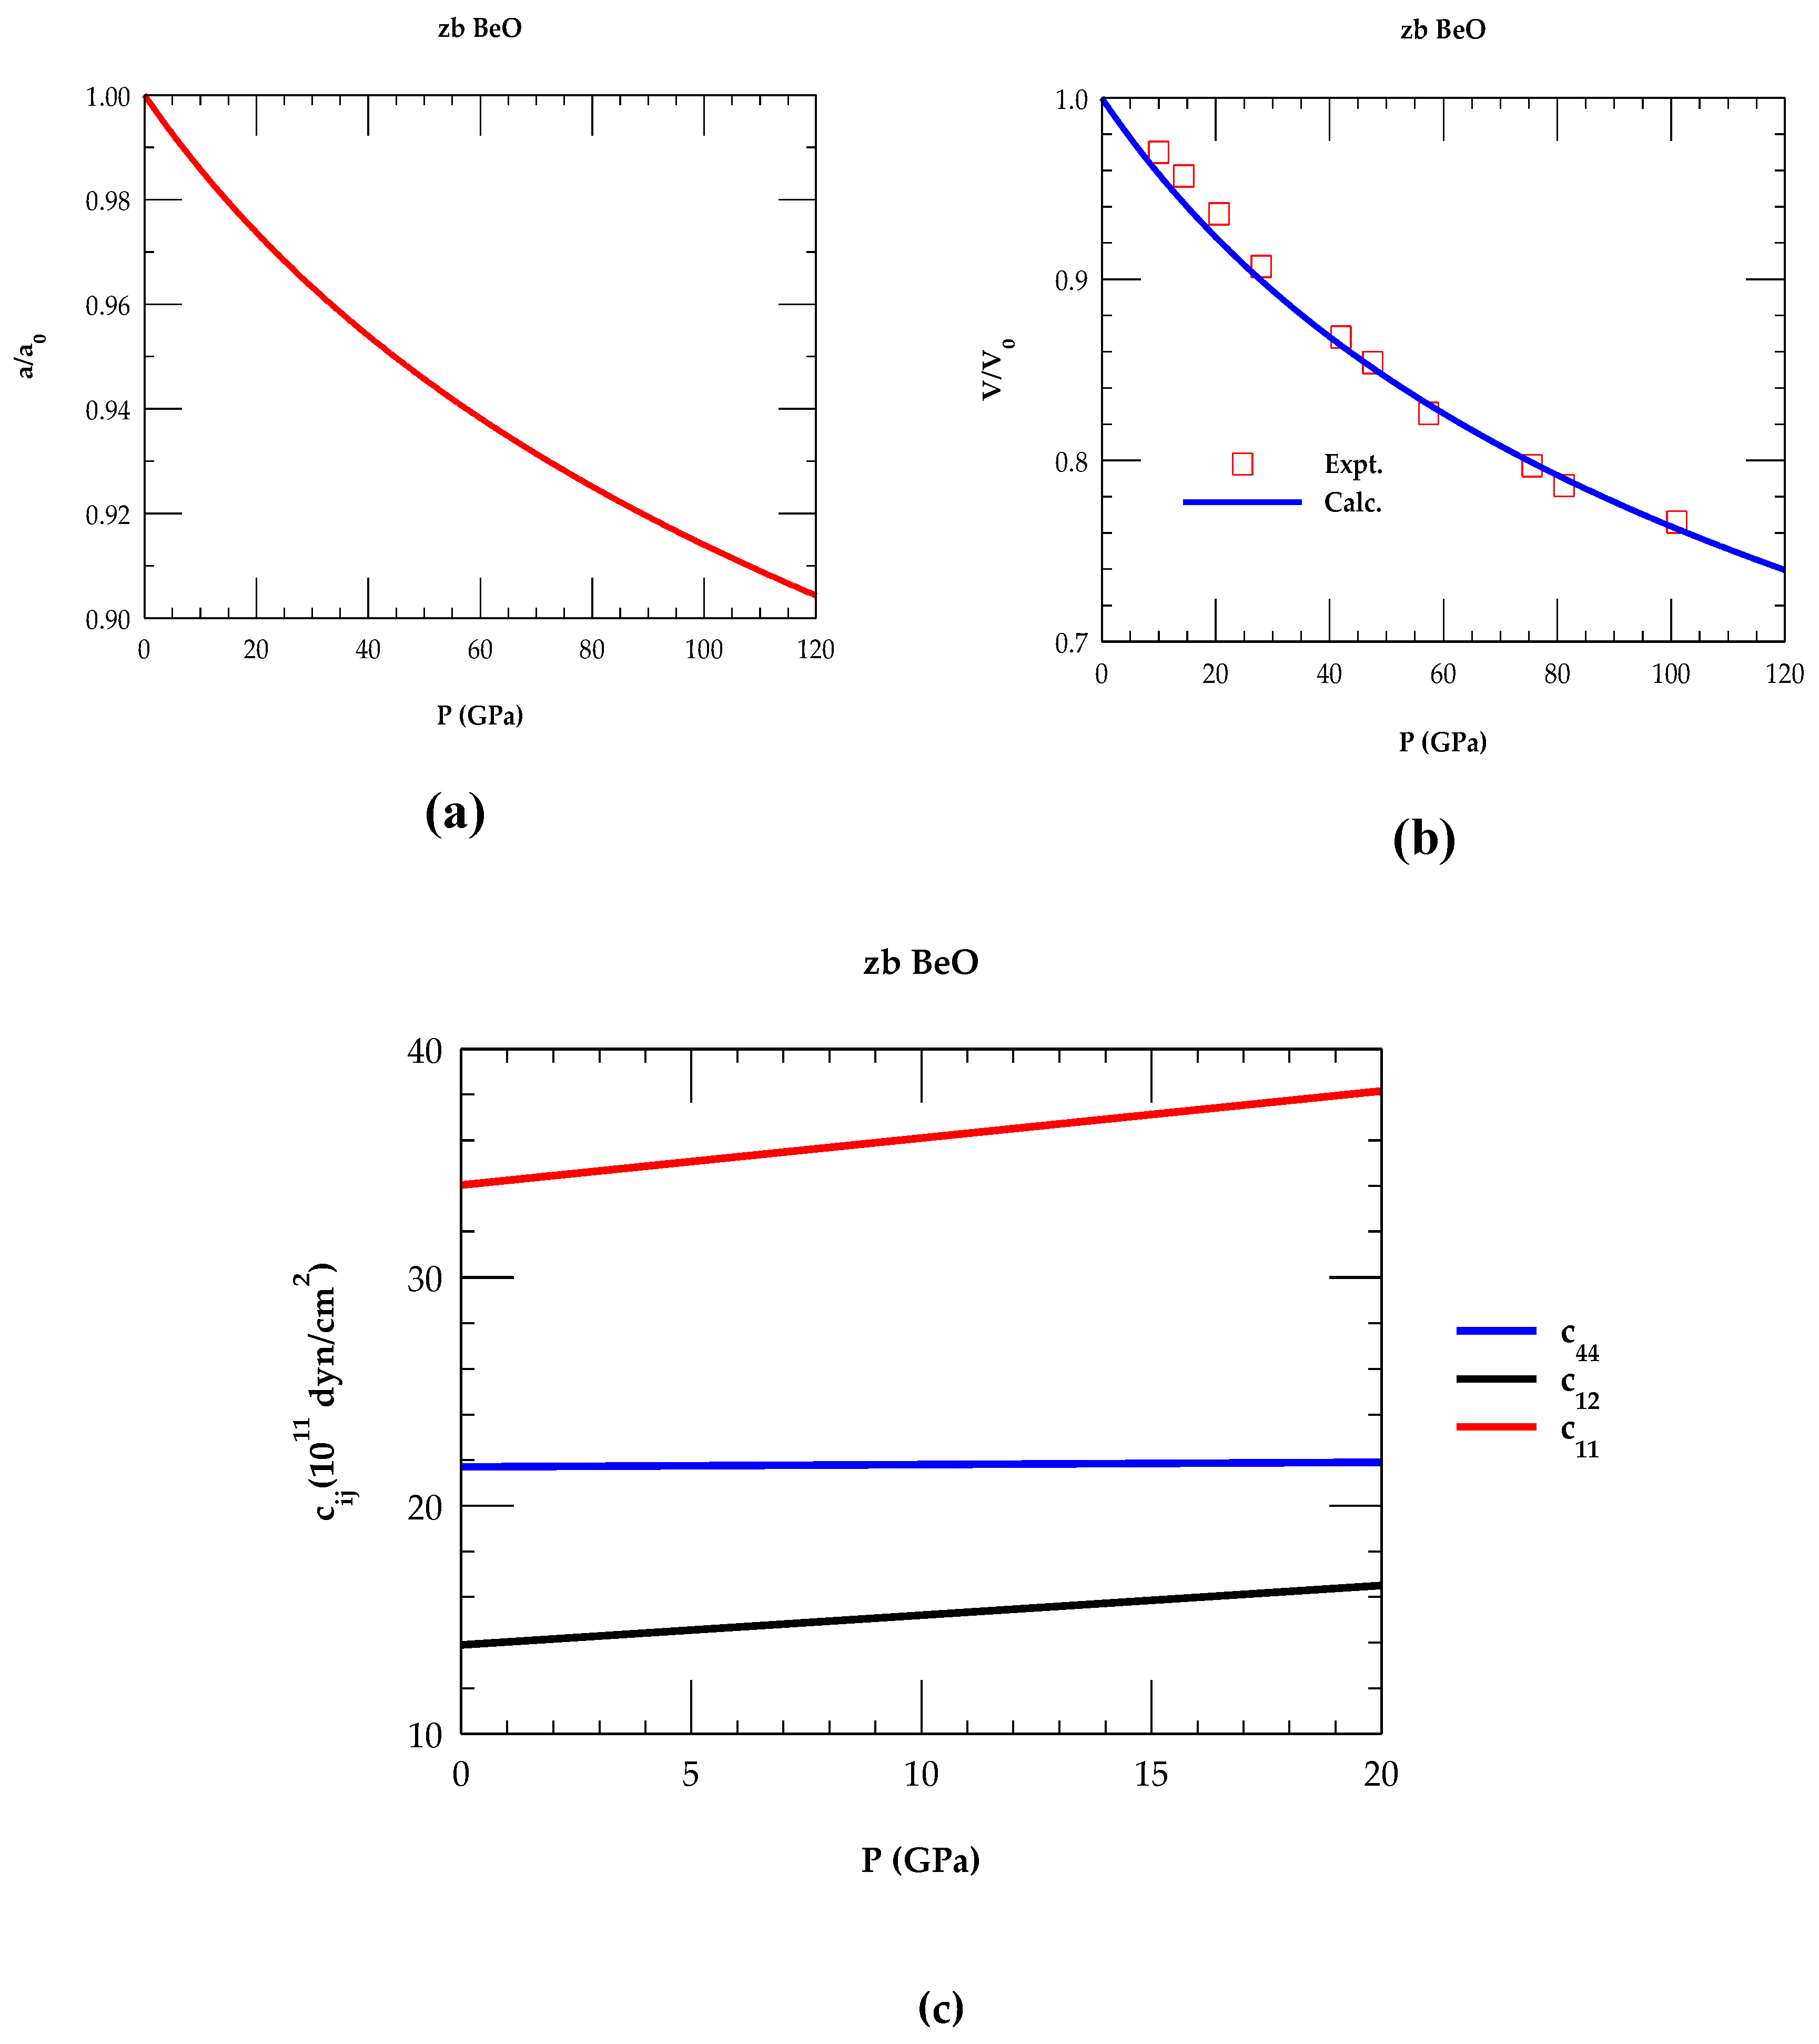
Figure 3.
(a) Rigid-ion-model calculations of phonon dispersions for zb BeO where blue and red color lines represent our results at ambient P = 0, and P = 20 GPa, respectively; (b) same as (a) but for the one phonon density of states blue and red color arrows show gap at high frequency at P = 0, and P = 20 Gpa.
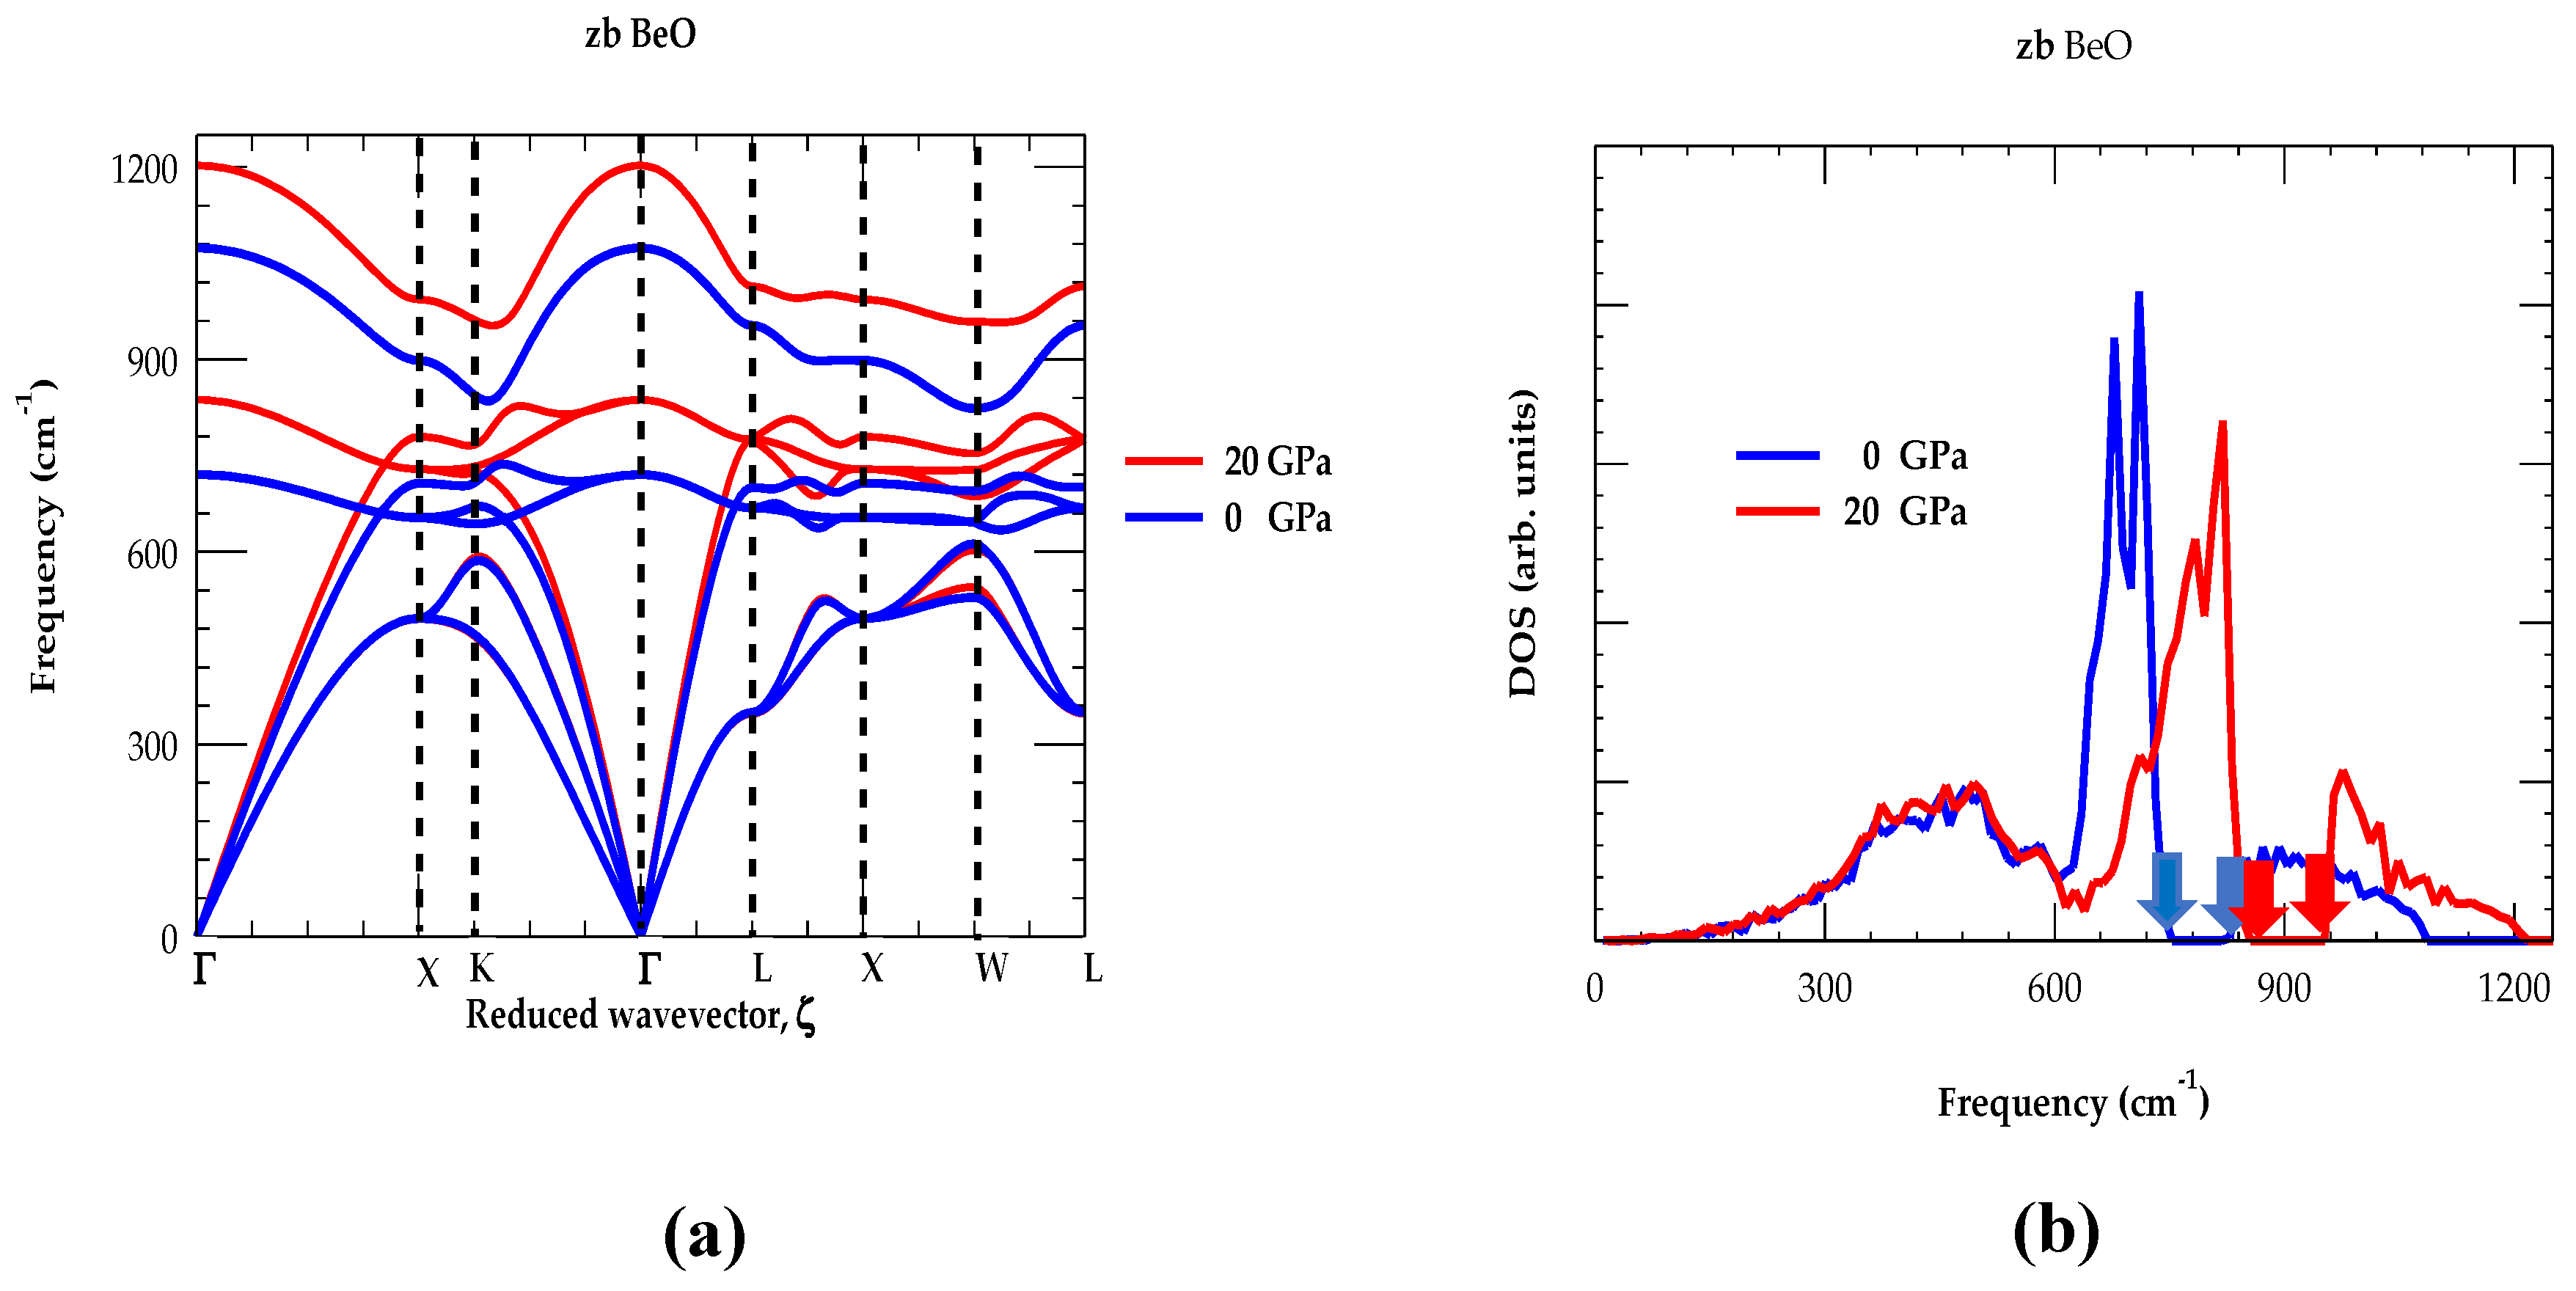
Figure 4.
(a) Rigid-ion model calculations of the Debye temperature for the zinc-blende BeO material as a function of T. The full blue- and red-color lines represent our calculated results at 1 atm or P = 0 and P = 20 GPa, respectively. (b) Comparison of the rigid-ion model calculations of specific heat at constant volume for the zb BeO as a function of T with experimental data (inverted black triangle). Solid blue- and red-color lines represent our calculated results at 1 atm or P = 0 and P = 20 GPa, respectively.
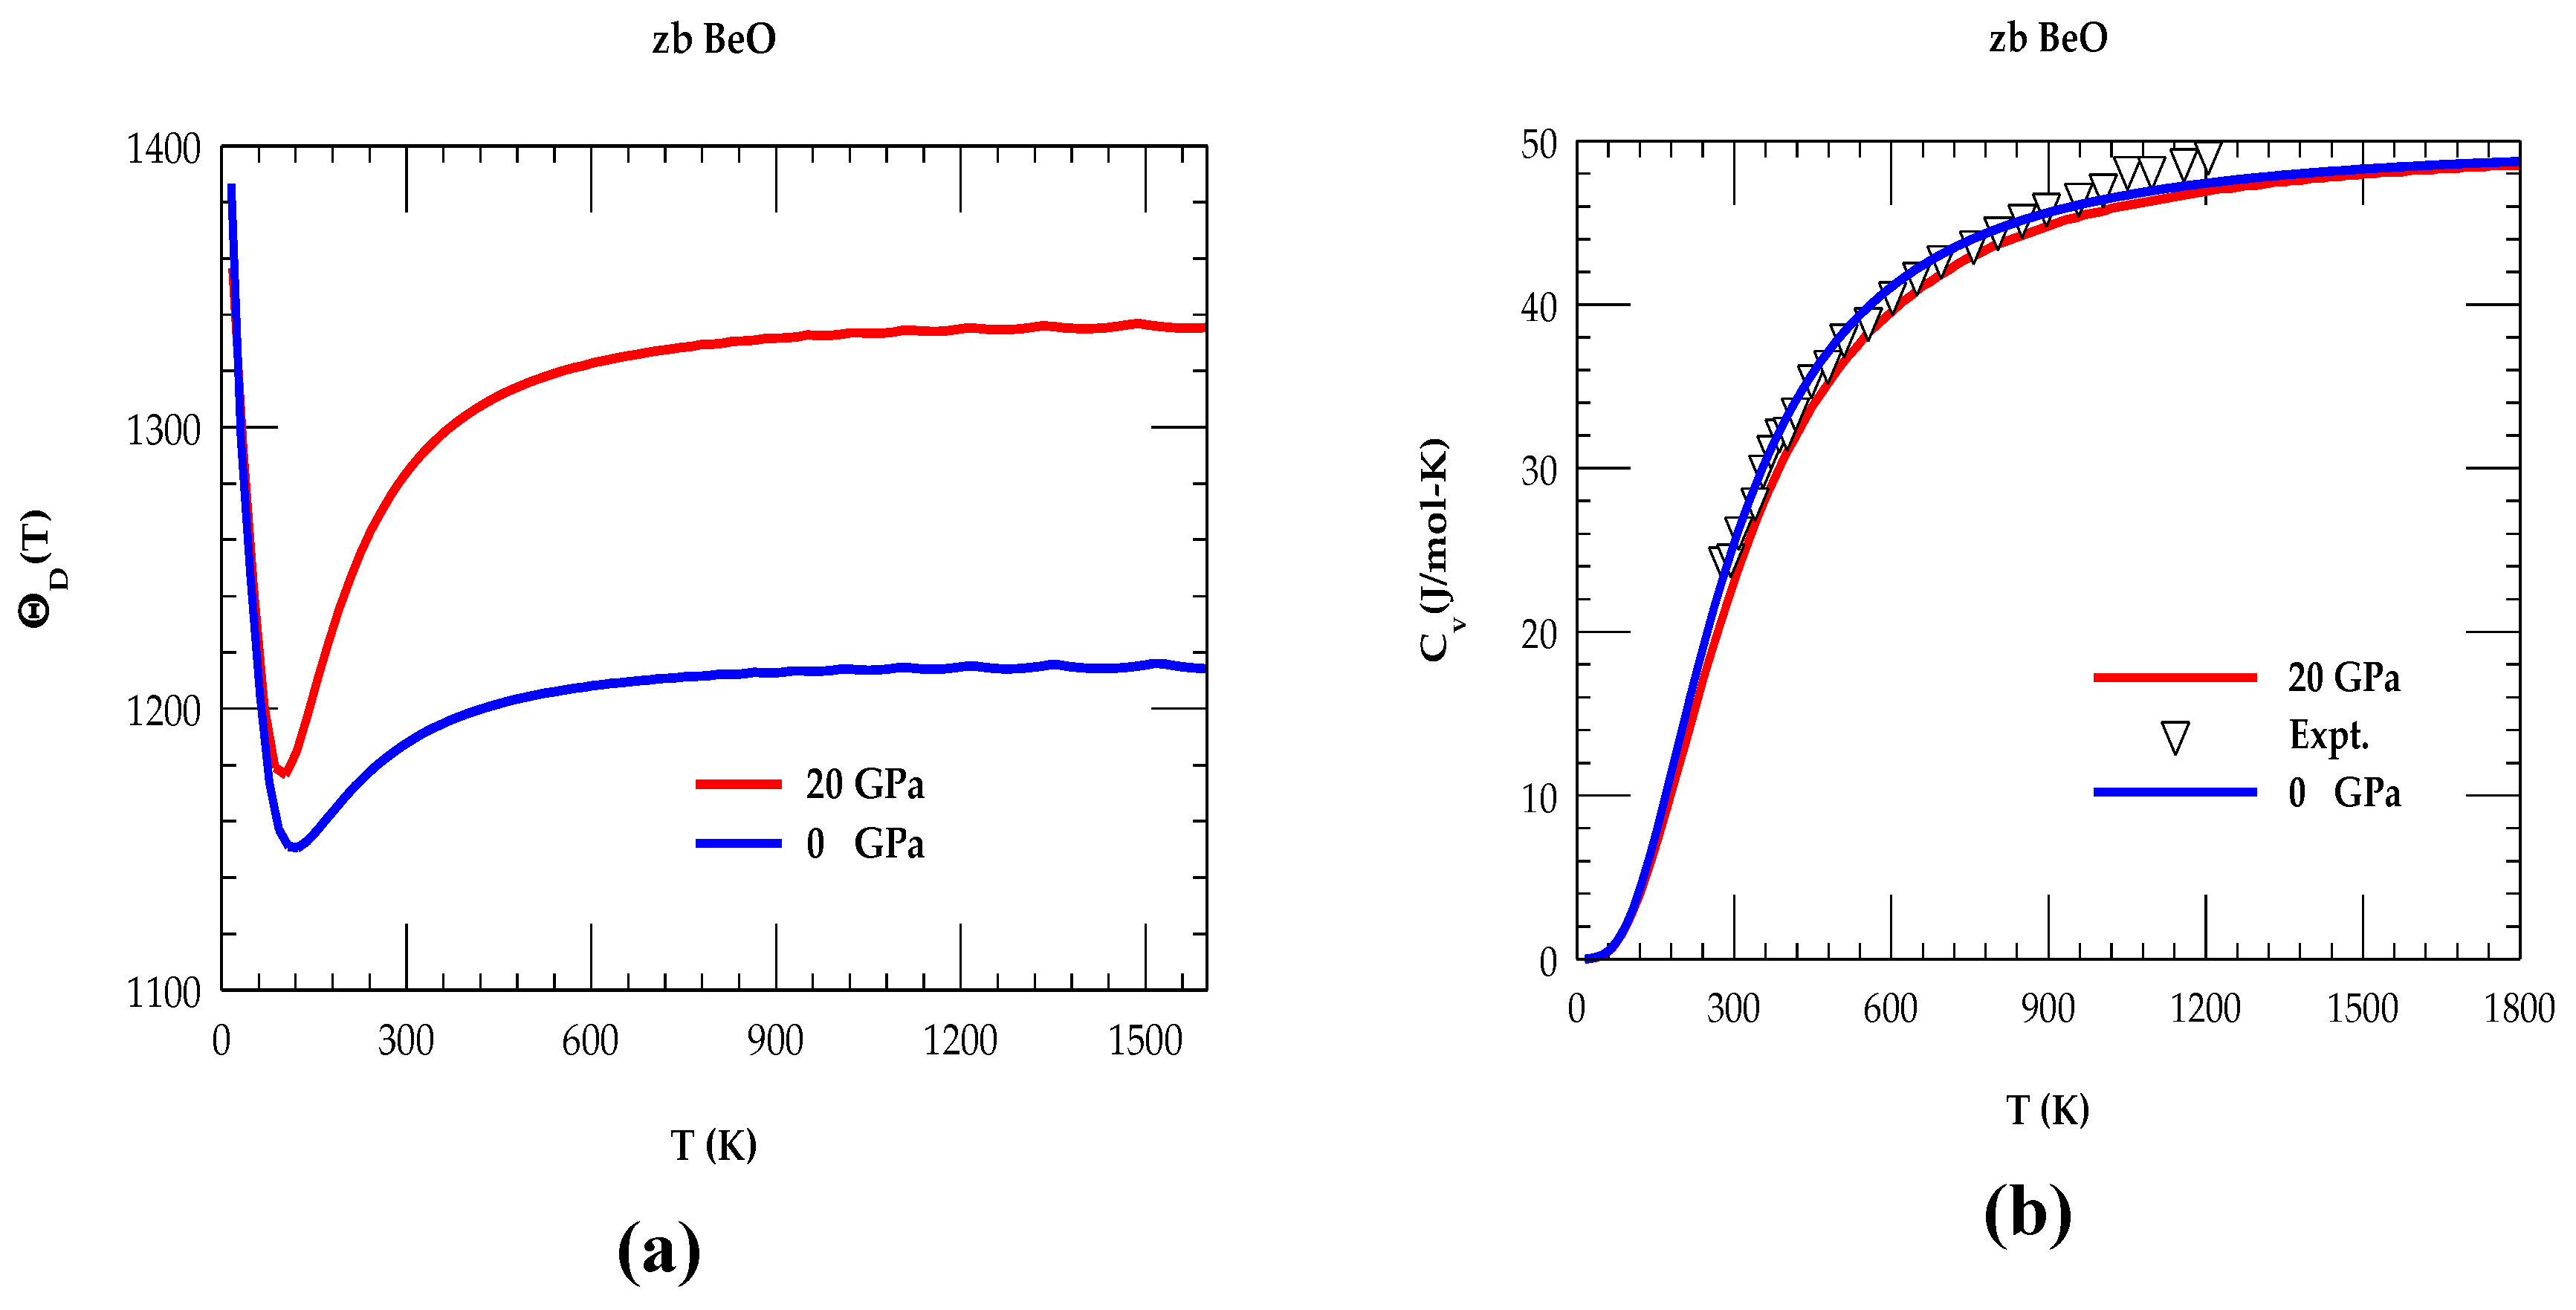
Figure 5.
Rigid-ion-model calculations of mode Grüneisen dispersions of the zinc-blende BeO along high symmetry direction ((Γ → X → K → Γ → L → X → W → L)) of the BZ. Different colored symbols on the right-hand side of the graph represent the for optical and acoustical modes.
Figure 5.
Rigid-ion-model calculations of mode Grüneisen dispersions of the zinc-blende BeO along high symmetry direction ((Γ → X → K → Γ → L → X → W → L)) of the BZ. Different colored symbols on the right-hand side of the graph represent the for optical and acoustical modes.
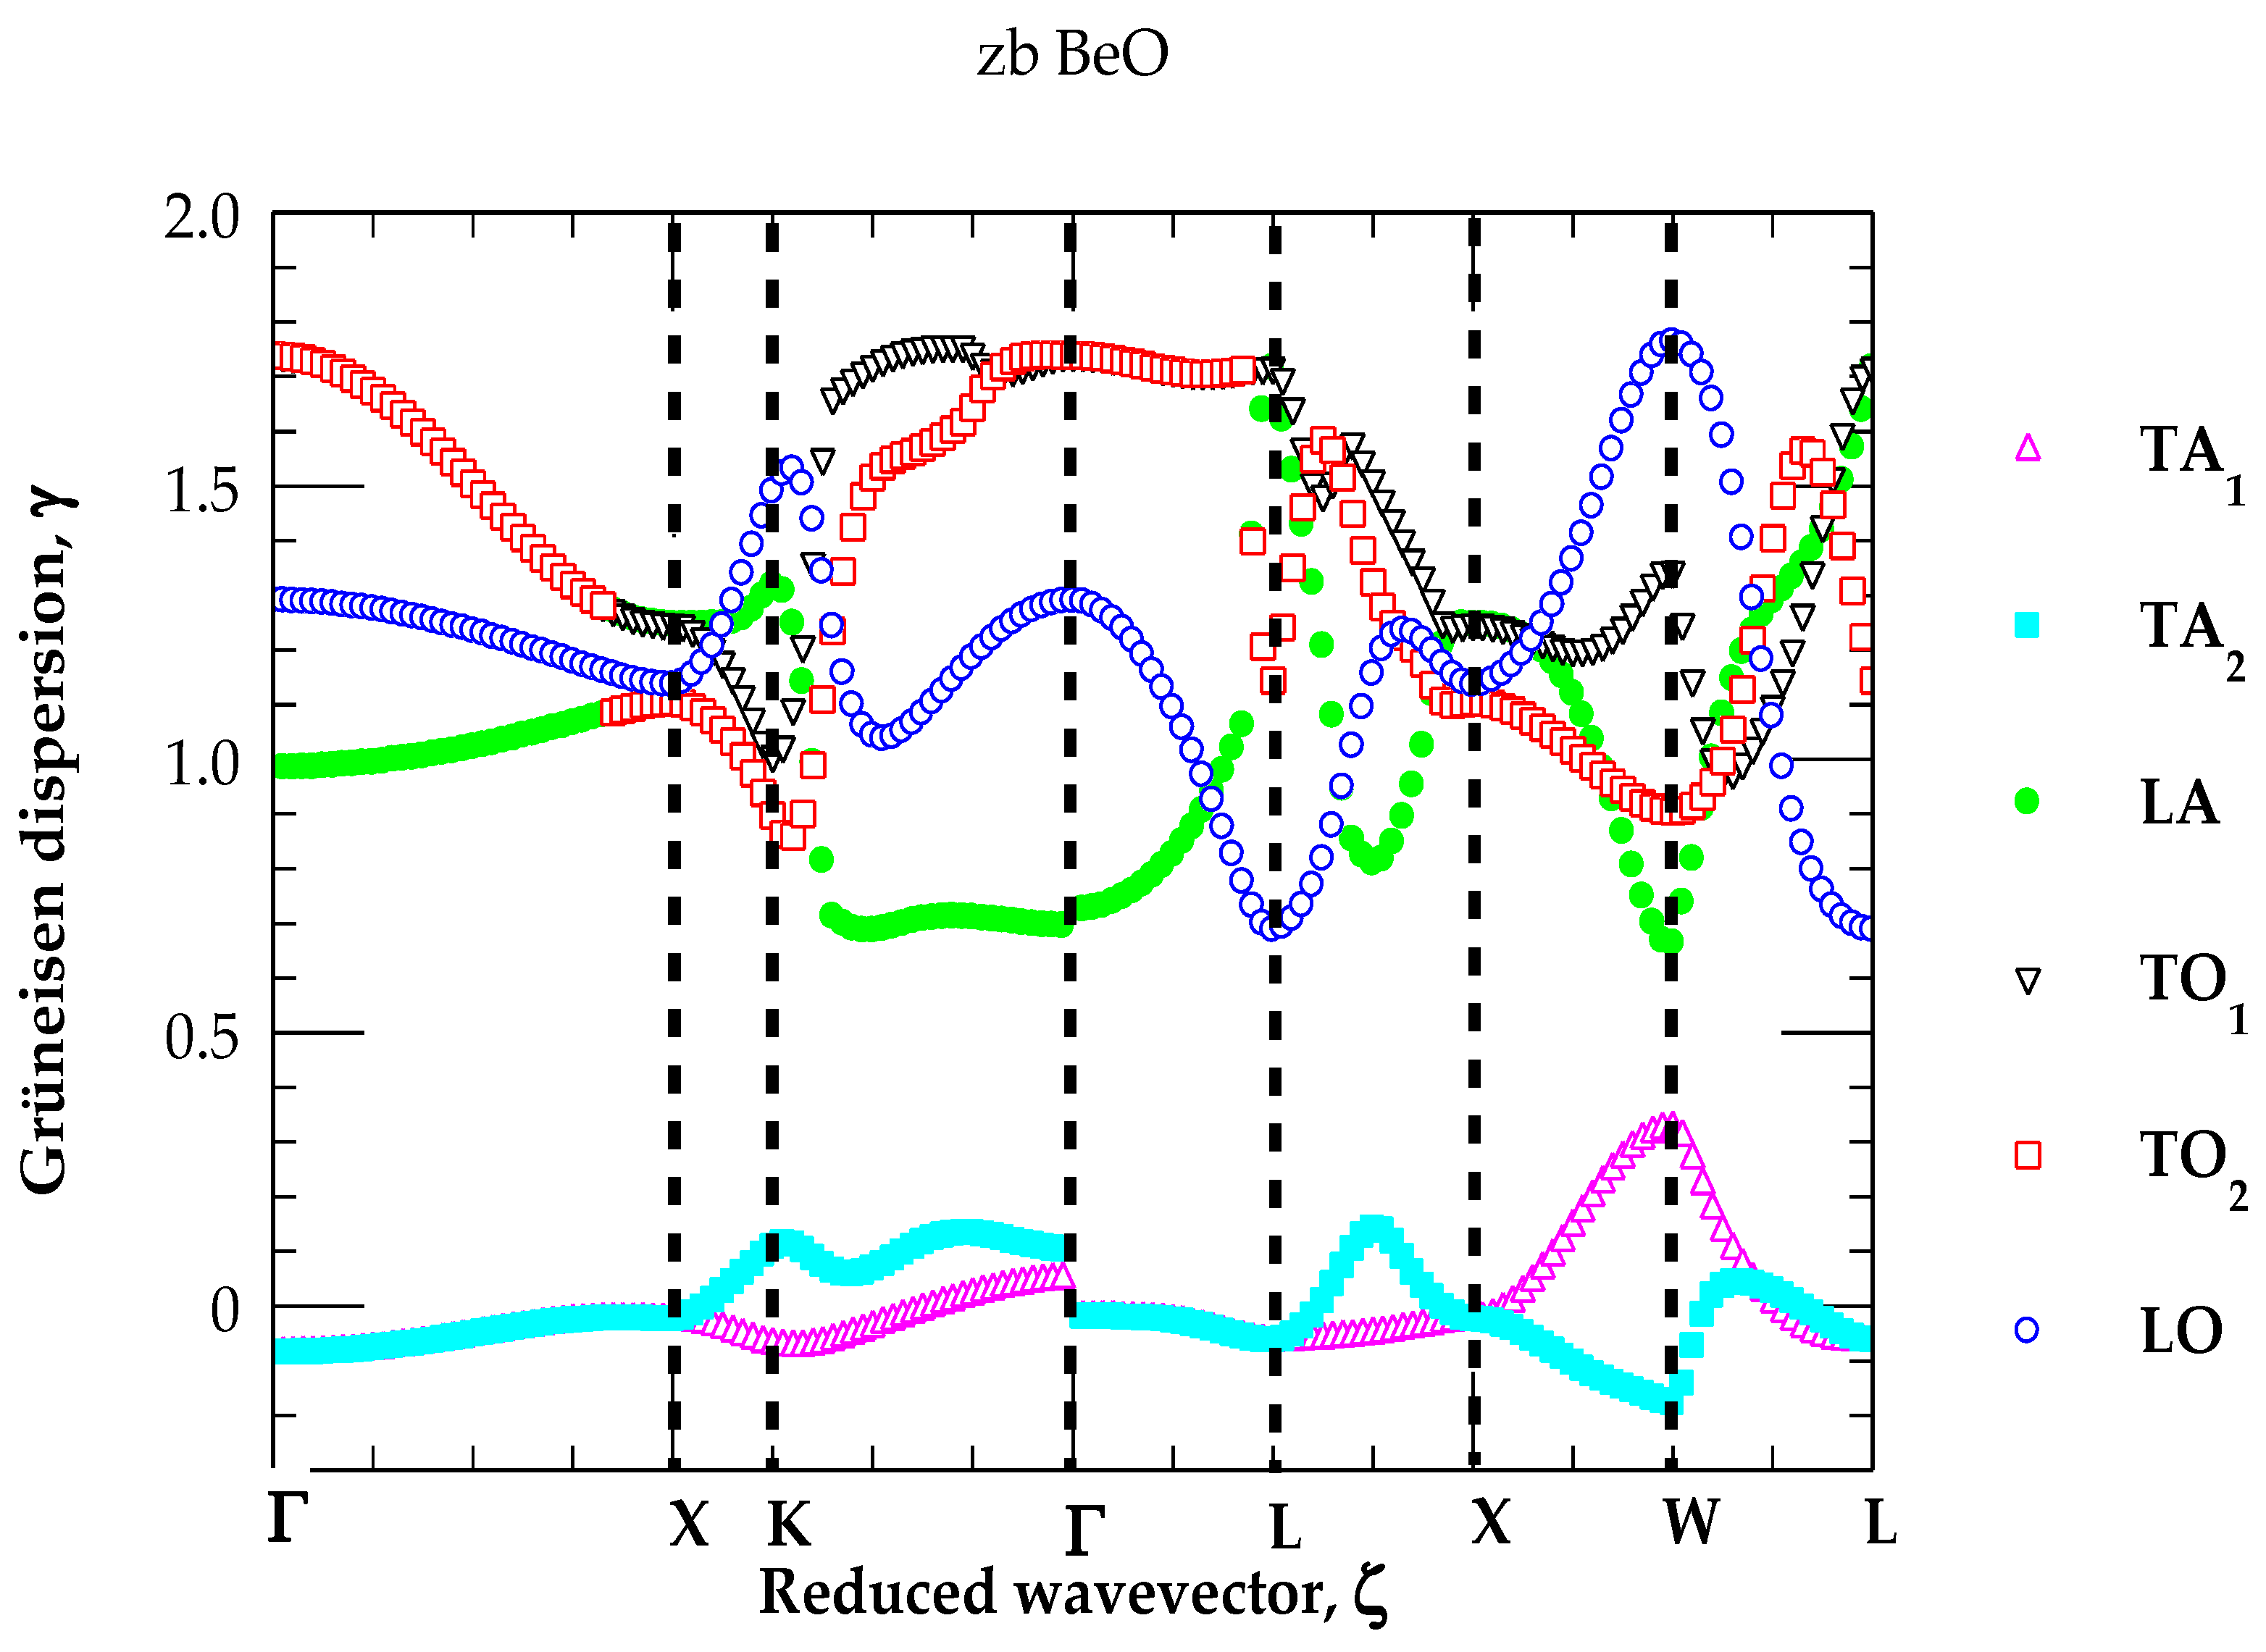
Figure 6.
For zinc blende BeO, the comparison of rigid-ion-model calculations (green color line) of linear thermal expansion coefficient α(T) as a function of T with available experimental data. The experimental results shown by red color open squires are taken from Slack and Bartram [81] while black colored inverted triangles are from Kozlovskii et al. [82].
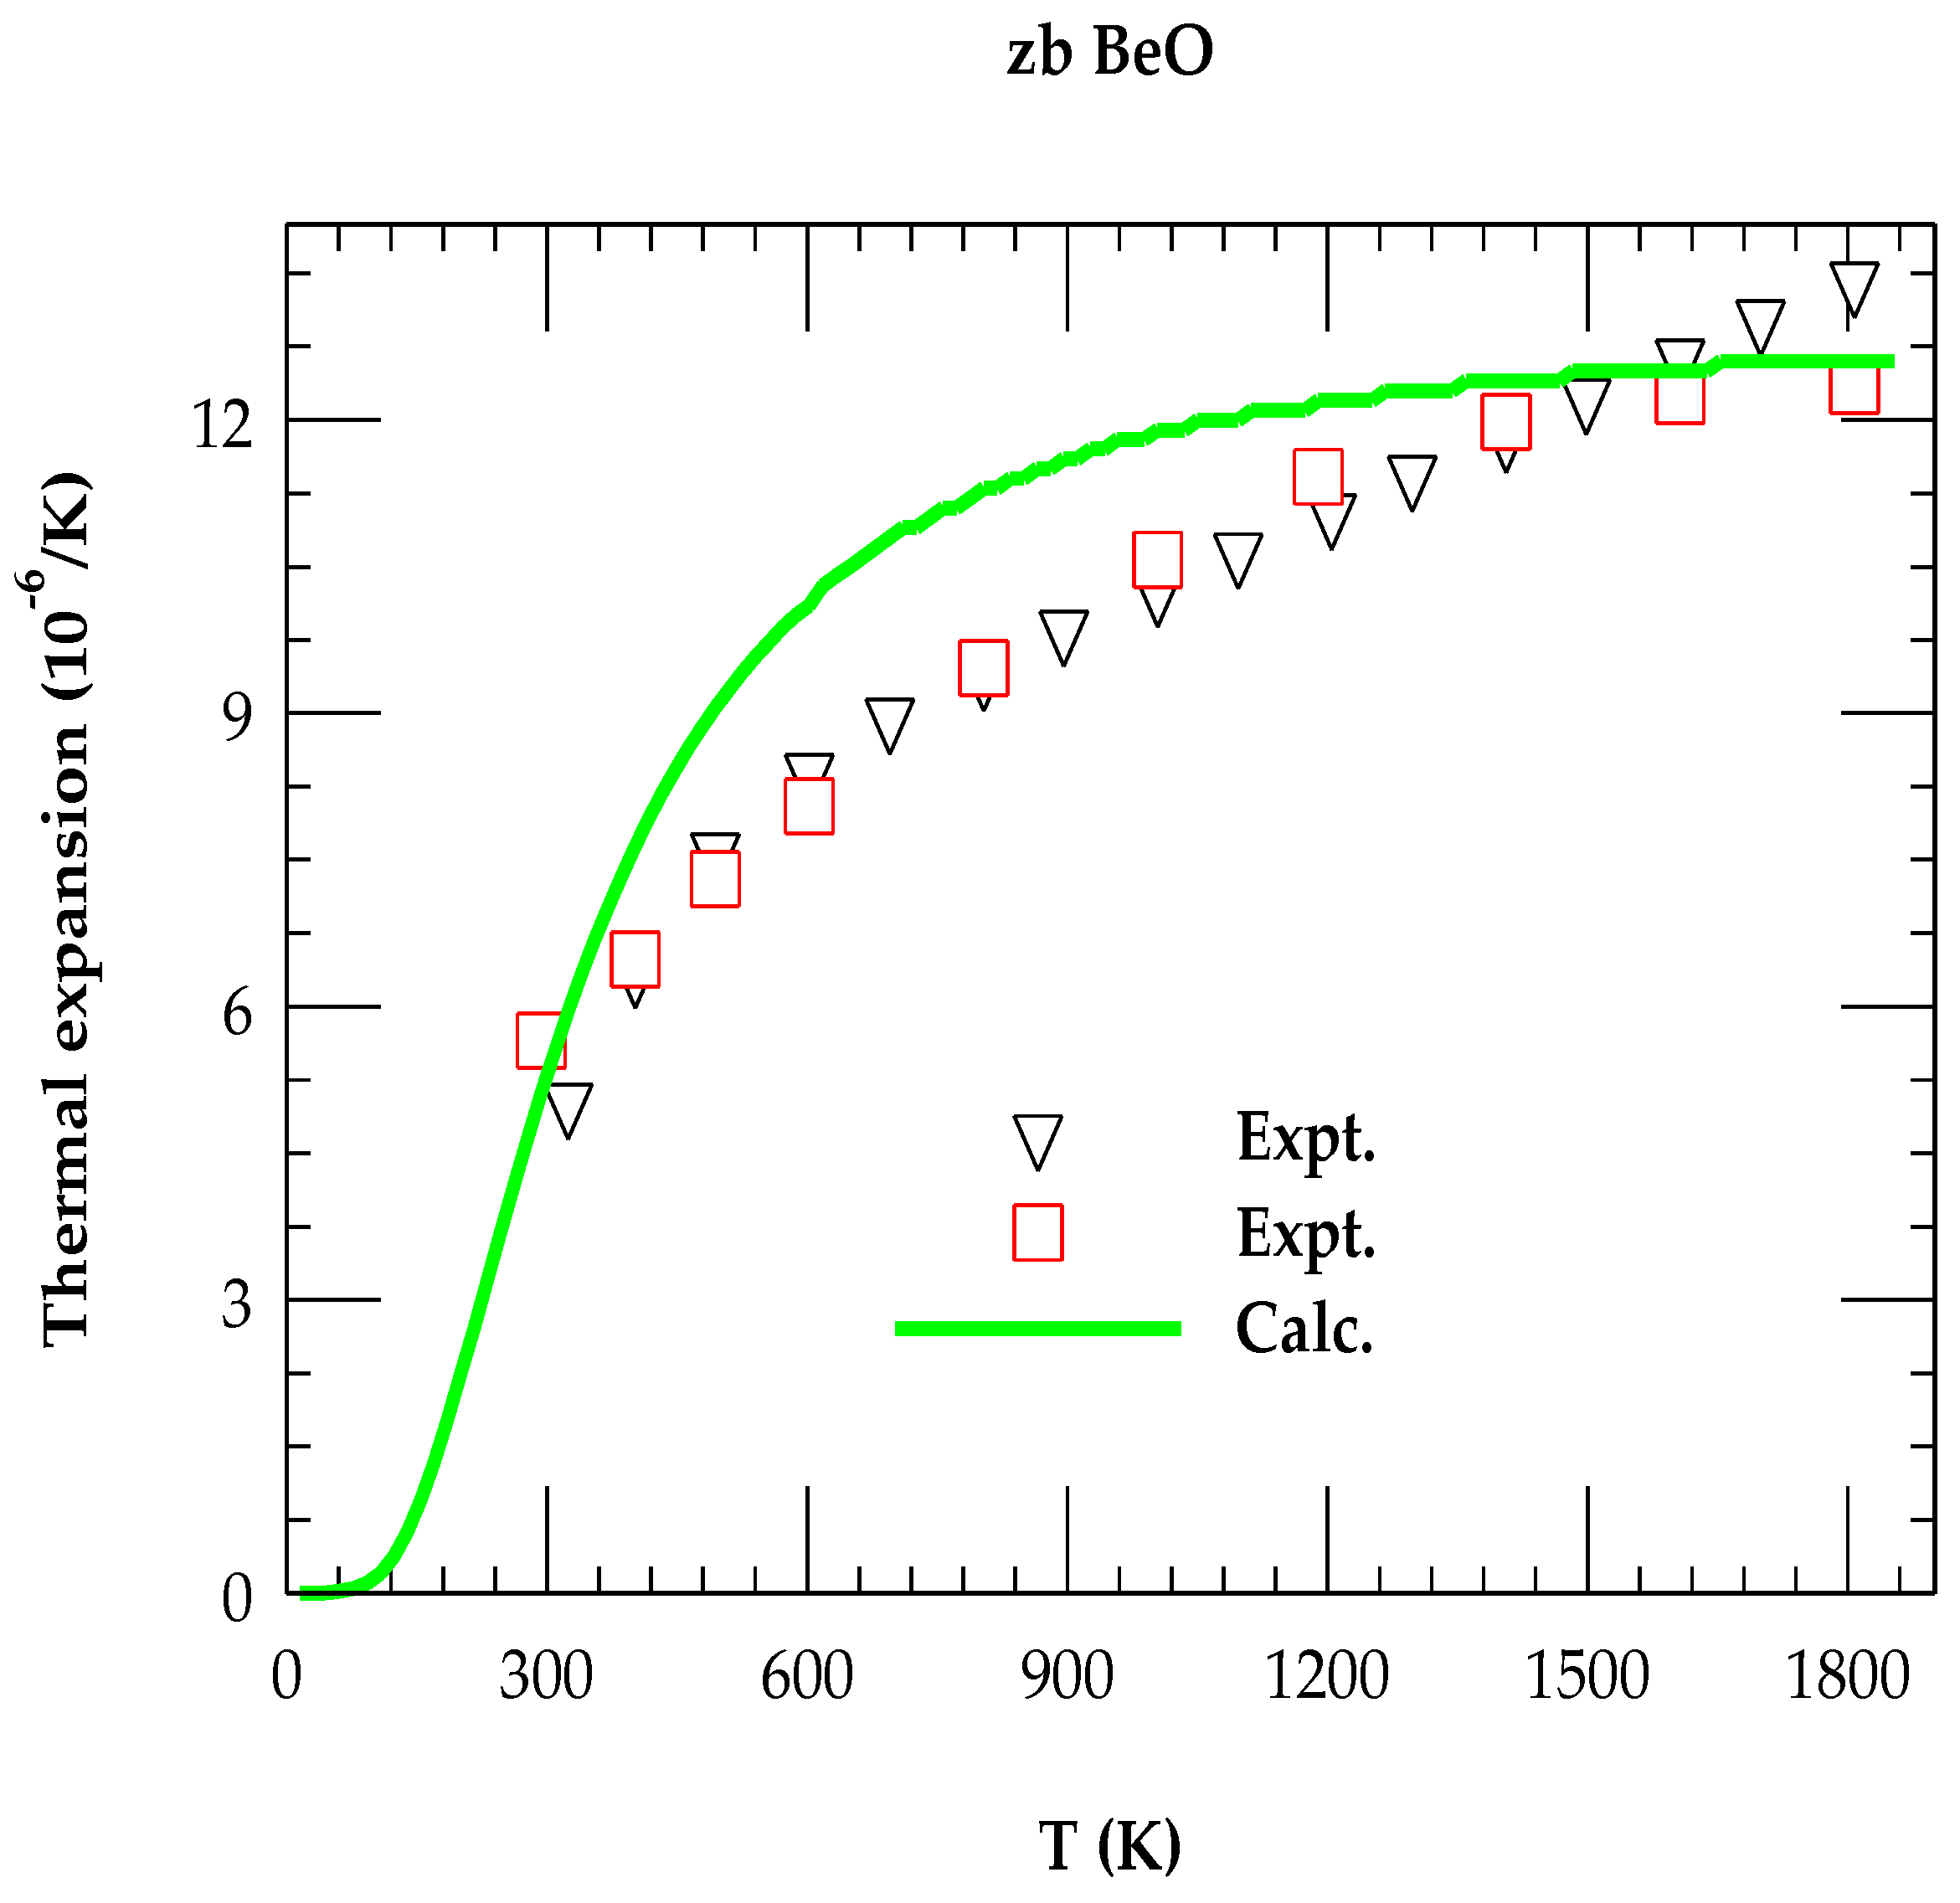

Table 1.
The transition pressures and relative volume changes for wurtzite BeO to rock-salt (B4 → B1), zinc-blende to rock-salt (B3 → B1), and wurtzite to zinc-blende (B4 → B3) structures.
Table 1.
The transition pressures and relative volume changes for wurtzite BeO to rock-salt (B4 → B1), zinc-blende to rock-salt (B3 → B1), and wurtzite to zinc-blende (B4 → B3) structures.
| Material |
a) and / |
B4→ B1 a) | Others a) | B3→ B1 a) | Othersa) | B4→ B3 a) | Others a) |
| BeO |
(GPa) |
137.3 147.0 |
21.7; 40.0; 95.0 | 139.0 95.0 |
94.0-147.0 94.0-96.0 |
74.0 91.0 |
62–91 |
|
(%) |
11.20 | 11.0 |
Table 2.
Critical point phonon frequencies (cm-1) of zb ZnO and BeO, lattice constants in (Å) elastic constants 1011dyn/cm2, transition pressure Pt (GPa) These parameters are used for evaluating the rigid-ion-model (RIM) parameters at ambient pressure (cf. Section 3).
Table 2.
Critical point phonon frequencies (cm-1) of zb ZnO and BeO, lattice constants in (Å) elastic constants 1011dyn/cm2, transition pressure Pt (GPa) These parameters are used for evaluating the rigid-ion-model (RIM) parameters at ambient pressure (cf. Section 3).
| zb BeO (our) a), | Others b) | |
|
|
1074 721 |
1060 683 |
|
|
899 653 707 496 |
900 655 708 493 |
|
|
953 669 701 349 |
902 663 702 310 |
|
|
3.81 | 3.72-3.83 |
|
|
34.2 | 34.2 |
|
|
13.9 | 13.9-14.8 |
|
|
21.7 | 20.8-21.7 |
| B0 | 207 | 201-229 |
|
|
3.7 | 3.65-3.96 |
a) Our b) Refs. [67].
Table 3.
Optimized set of rigid-ion-model parameters (105 dyn/cm) for zb BeO at P= 0 and P = 20 GPa in the notation of Ref. [67]. The term Zeff is the effective charge.
Table 3.
Optimized set of rigid-ion-model parameters (105 dyn/cm) for zb BeO at P= 0 and P = 20 GPa in the notation of Ref. [67]. The term Zeff is the effective charge.
| RIM a) | zb BeO | |
| Parameters | P = 0 GPa | P= 20 GPa |
| A | -0.62022 | -0.806 |
| B | -0.55000 | -0.74 |
| C1 | -0.06650 | -0.0715 |
| C2 | -0.09300 | -0.102 |
| D1 | -0.04144 | -0.02497 |
| D2 | -0.14900 | -0.1634 |
| E1 | -0. 10000 | -0.18 |
| E2 | 0.04000 | 0.04 |
| F1 | 0.15500 | 0.218 |
| F2 | -0.12500 | -0.106 |
| Zeff | 1.0133 | 1.056 |
a)Ref. [67].
Table 4.
Comparison of critical point phonon frequencies (cm-1) at P = 0, for zb BeO using rigid-ion-model (RIM) with estimated ab initio calculation values. The RIM phonons at P = 20 Gpa and linear pressure coefficients
Table 4.
Comparison of critical point phonon frequencies (cm-1) at P = 0, for zb BeO using rigid-ion-model (RIM) with estimated ab initio calculation values. The RIM phonons at P = 20 Gpa and linear pressure coefficients
|
Modes zb BeO |
Our RIMa) P = 0 Gpa |
Abinitio Calc.b) P = 0 Gpa |
Our RIMa) P = 20 Gpa |
RIM a) |
RIM a) |
|
|
1074 721 899 653 707 496 953 669 701 349 |
1060 683 900 655 708 493 902 663 702 310 |
1201 836 993 730 779 494 1013 775 777 347 |
6.35 5.75 4.70 3.85 3.60 -0.10 3.00 5.30 3.80 -0.10 |
1.29 1.74 1.14 1.25 1.10 -0.06 1.14 1.72 0.70 -0.06 |
a)Our b)Ref. [66] estimated values.
Table 5.
For zb BeO, the RIM calculations of Debye temperature , , in (K), (297) in (J/mol-K), and in (10-6K−1) are compared with the existing experimental and/or theoretical data from the literature.
Table 5.
For zb BeO, the RIM calculations of Debye temperature , , in (K), (297) in (J/mol-K), and in (10-6K−1) are compared with the existing experimental and/or theoretical data from the literature.
| zb BeO Quantity | RIM, P = 0 GPaa) |
Others b) |
Others c) |
Others d) |
RIM, P = 20 GPaa) |
|
|
1390 | 1270; 1280 | 1370 | ||
|
|
1150 @ 124 K | 1177@ 93 K | |||
|
|
1187 | 1291 | |||
|
|
1214 @ 1000 K | 1335 @ 1850 K | |||
|
(100) |
3.17 | 2.67 | |||
|
(297) |
24.78 | 25.51-26.11 | 22.5 | ||
|
(High T) |
48.83 @ 1850 K | 48.72 @ 1150 K | 48.7 @ 1850 K | ||
|
|
5.12 | 5.65 @ 300 | 4.99 @ 293 | ||
|
|
7.64 | 6.48 @ 400 | 6.33 @ 373 | ||
|
|
9.24 | 7.30 @ 500 | 7.55 @ 473 | ||
|
|
12.5 | 12.25 @ 1600 | 12.60 @ 1573 |
Disclaimer/Publisher’s Note: The statements, opinions and data contained in all publications are solely those of the individual author(s) and contributor(s) and not of MDPI and/or the editor(s). MDPI and/or the editor(s) disclaim responsibility for any injury to people or property resulting from any ideas, methods, instructions or products referred to in the content. |
© 2025 by the authors. Licensee MDPI, Basel, Switzerland. This article is an open access article distributed under the terms and conditions of the Creative Commons Attribution (CC BY) license (https://creativecommons.org/licenses/by/4.0/).
Copyright: This open access article is published under a Creative Commons CC BY 4.0 license, which permit the free download, distribution, and reuse, provided that the author and preprint are cited in any reuse.


