Submitted:
30 June 2025
Posted:
01 July 2025
You are already at the latest version
Abstract
The mexican market is flooded with different marks of agavins (agave inulins) claiming to have health wellness. Agavins are highly branched neo-fructans whose sales, into the prebiotic supplements market, have been increased significantly lately. However, the tendency to maximize profits, by some traders, have carry out too vulnerable agavins to adulteration. In the present study, two chromatography techniques (HPTLC and HPAEC-PAD) as well as Fourier transform infrared spectroscopy (FTIR) were used to evaluate the authenticity of commercial agavins. Combination of these analytical tools allowed the identification of authentic commercial brands. Of note, the majority of evaluated commercial agavins were found to be adulterated with cheap polysaccharides such as polydextrose, maltodextrin, and/or oligofructose. Partial or total adulteration of prebiotics compromises their quality, security, and efficacy, which may have serious health hazard effects on the consumers. Hence, regulatory authorities should intervene to assure the authenticity of commercial agavins as a prebiotic supplement.
Keywords:
Adulteration
; agave
; agavins
; authenticity
; fructans
; inulin
; prebiotics
1. Introduction
At world level, the demand of functional foods such as prebiotic supplements shows a pronounced increasing trend. The rise of this trend can be attributed to the consumer interest driven to improve their life quality or to help manage some health conditions [1]. Agavins, colloquially known as agave inulin, are a prebiotic supplement now available on the market. In the last decade, a growing body of preclinical and clinical research have demonstrated that agavins intake provides health benefits, such as body weight loss, glucose and lipid levels reduction, improve of mineral absorption, decrease oxidative stress, and importantly, strengthen the immune system [2]. Furthermore, in the alimentary industry, agavins have several applications in the development of functional foods as fat and sugar replacement [3].
Agavins are a mixture of polysaccharides of various chain lengths; with a peculiar structure composed by fructose units linked by β 2-1 and branched fructose units such β 2-6 as well as an internal glucose [4]. In the last years, agavins have increased their popularity into the prebiotic market ingredients. According to the Secretariat Economy of Mexico data, in the 2023 year $15.8 million dollars were reported in agavins international sales [5]. Nevertheless, the tendency to reduce costs and maximize profits have aroused the interest for some dishonest traders [6]; making agavins vulnerable for adulteration or fraud.
Since ancient times, food has been susceptible to different degrees of adulteration. However, nowadays food adulteration is a growing worldwide serious problem with consequences that can be devastating to the public, from health to economic losses [7]. Adulterants can be found in several foodstuffs that we consume daily, such as milk, meat, fruits, vegetables, oils, fats, spices, juices, coffee, and tea, to mention some [8]. In the alimentary industry, adulteration of foods products takes place deliberately [9]. Commonly, it is carried out to reduce the cost of products through addition or subtraction of high value ingredients by cheaper or low-quality ones; affecting the normal composition, functionality, and the nutritional value of the product [6]. In additon, the intake of adulterated foods might have serious health hazard effects on the consumers [7].
An adulteration compromises the foodstuffs quality; therefore, their detection is crucial to ensure their safety. In addition, adulteration undermines consumer confidence reducing the demand and sales of foodstuffs generating severe economic consequences [8]. In turn, this also has an adverse impact on farmers, producers, enterprises, and government leading to reduced economic growth [9]. On the other hand, prebiotic supplements are not considered as medicine or therapeutic agents; therefore, they are subject to few quality controls with respect to the ingredients that are listed on their labels [1,10].
Therefore, the authentication of food products is a significant challenge due to the diverse methods used by fraudsters for deceiving consumers. Hence, is necessary to employ different analytical tools to assessing the authenticity of a product [11]. Infrared spectroscopy (IR) and chromatography are two analytical techniques widely used to analyze the origin, quality control, and authenticity of food products [7,12]. IR is a simple, rapid, precise, eco-friendly, and non-destructive spectral technique [12,13]. Moreover, based on IR fingerprints spectra and chemometrics techniques such as principal component analysis (PCA), it is possible to distinguish between authentic and adulterated products [12].
Despite the growing use of commercial agavins as prebiotic supplement, studies on the evaluation of their authenticity have not been reported. In the present study high-performance thin layer chromatography (HPTLC) and high-performance anion exchange chromatography with pulsed amperometric detector (HPAEC-PAD) as well as Fourier transform infrared spectroscopy (FTIR) in combination with PCA were used to establish the authenticity of twelve commercial products available in the market and label as purely natural agave inulin.
2. Materials and Methods
Twelve commercial products, labeled as purely natural agave inulin, were purchased online in March 2024. In addition, two agavin samples from our laboratory (AR1 and AR2); oligofructose (OFS), and raftiline (RNE) from Beneo (Mannheim, Germany); as well as maltodextrin (MDX) and polydextrose (PDX) obtained from Ingredion (Zapopan, Jalisco, Mexico), were included in the present study as reference samples.
2.1. High-Performance Thin Layer Chromatography (HPTLC)
HPTLC analysis was carried out following the protocol of Salomé-Abarca et al. [14] with minor modifications. Briefly, a sample of seven mg of each reference sample (AR1, AR2, OFS, RNE, MDX, and PDX) and commercial agavin products (P1 to P12) were dissolved in 300 μL of distilled water followed by addition of 700 μL of absolute ethanol. The samples were mixed and sonicated for two minutes. Seven microliters of each sample were applied on silica gel HPTLC plate (20 x 10 cm; F254, Merck). A CAMAG-HPTLC system equipped with an automatic ATS4-TLC sampler, an ADC2-TLC developer, an automatic derivatizer (version 1.0 AT), and a TLC visualizer (Muttenz, Switzerland) were used for separation and analysis of samples. The chromatographic elution consisted of a two-ascendant separation. The first mobile phase was a mixture of isopropanol-butanol-water-acetic acid (14:10:4:2 by volume); whereas the second mobile phase was a mixture of isopropanol-butanol-water-acetic acid-formic acid (14:10:4:1:1 by volume). Chamber saturation time was 20 min for each developmental step. For the first chromatographic separation the solvent migration distance (measured from the sample application point) was 75 mm and 85 mm for the second one. Developed HPTLC plate was derivatized by immersion in a diphenylamine-aniline-phosphoric acid in acetone mixture. Finally, the HPTLC plate was heated in an oven at 120 °C by 3 min for spots visualization.
2.2. Fourier Transform Infrared Spectroscopy (FTIR)
Reference samples and commercial products (P1 to P12) were analyzed in a mid-infrared (MIR) spectroscopy provided with an attenuated total reflectance (ATR) with a diamond crystal (Thermo Scientific; Waltham, MA). A small sample (5 mg) references and commercial products was placed directly on the ATR crystal followed by the application of optimal pressure to warrant spectral uniformity. Ambiental conditions were used as reference background spectra. Samples were analyzed by duplicate. The spectrum of each sample was obtained by taking the average of 32 scans at resolution of 4 cm-1. The spectral range considered was 4000 to 400 cm-1. Analysis of spectra was carried out using the OMNIC software (Thermo Scientific; Waltham, MA). MIR spectral data were exported to ChemoSpec package within the R studio software version 4.4.0. Data were smoothing, derived (sgfSpectra function), and normalized (normSpectra function and zero2one method). Afterwards, a PCA plot was performed using robust option (function r_pcaSpectra) with no scaling in the fingerprint region (1200 – 800 cm-1).
2.3. High-Performance Anion Exchange Chromatography Coupled to a Pulsed Amperometric Detector (HPAEC-PAD)
Samples AR1, AR2, OFS, RNE, MDX, and PDX as well as commercial products (P1 to P12) were diluted with ultrapure water at 0.5 mg/mL. All samples were analyzed in a liquid ion-exchange chromatograph DIONEX ICS-3000 (Thermo Scientific; Waltham, MA) equipped with a Carbopac PA-200 precolumn (40 x 25 mm) and an analytical Carbopac PA-200 (40 x 250 mm) column. Samples separation was performed using a gradient of NaOH [0.23 M], CH3COONa [0.5 M], and water at constant flow of 2 mL/min [15]. The gradient started with 70% of water (A), 30% of aqueous NaOH (B), and 0% of NaOH/CH3COONa (C). Afterwards, percentual ratios of A, B, and C were 50:50:0 for 5 min; 45:40:15 for 8 min; 40:30:30 for 27 min; 30:20:50 for 15 min; 15:10:75 for 10 min; and 50:50:0 for 10 min. Samples were detected with an amperometric detector. The potential used for amperometric detection was +0.1, -2.0, +0.6 and -0.1 V for E1 (400 ms), E2 (20 ms), E3 (20 ms) and E4 (60 ms), respectively [14].
3. Results and Discussion
3.1. Authentication of Commercial Agavins by HPTLC
HPTLC of reference samples (AR1, RNE, OFS, MDX, and PDX) showed different profiles with red or blue colored bands (Figure 1). The developed colors by reference polysaccharides provided very valuable information on their structural composition. Bands in red color indicate fructose-containing polysaccharides whereas bands in blue color denote glucose-containing polysaccharides [16]. Thus, fructans that possess mostly fructose in their structure such as agavins (AR1) and inulins (RNE and OFS), exhibited red color bands. In contrast, MDX and PDX containing mainly or only glucose in their chemical structure displayed blue color bands. On the other hand, the uppermost spots (Rf = 0.66) in the HPTLC belong to fructose and glucose (basic units of all analyzed polysaccharides) which possess the lowest molecular mass. The next spot is sucrose (DP2; Rf = 0.59) and gradually each spot denoted an increment in the degree of polymerization (DP) of all polysaccharides (Figure 1). In this regard, HPTLC exhibited that AR1, RNE, and MDX possess polysaccharides with a large DP; in contrast, OFS and PDX contain mostly short DP.
In the Figure 1 several differences were observed in the HPTLC profiles of commercial products labeled as purely natural agave inulin. Notably, from the twelve commercial products evaluated, only P3 and P10 displayed an identical HPTLC profiles, with typical Rf´s and bands in red color, as reference sample AR1. On the other hand, several of the analyzed commercial products presented adulterations. For instance, the HPTLC chromatographic profiles of P1, P2, and P5 showed that they have a similar pattern to the agavins reference sample (AR1). However, a background in blue color also is observed in these products, indicating the presence of an adulterant (Figure 1). P12 was another product in which an adulterant was detected. The HPTLC pattern exhibited by P12 denoted that this commercial product contains agavins due to presence of Rf bands colored in red, resembling to AR1. Nevertheless, bands in blue color were also observed, suggesting the use of MDX as the adulterant (Figure 1).
Moreover, most commercial products evaluated did not contain agavins. In this regard, P4 was a product identified as fraud, because it is very clear that its HPTLC chromatographic profile is identical to PDX reference sample. On the other side, the chromatographic patterns of P6, P7, P8, P9, and P11 revealed that they do not belong to the agavin-type fructans but to MDX, OFS or a blend of these two (Figure 1). In this regard, HPTLC showed that the P6 profile is very similar to the displayed by MDX, with bands in blue color and polysaccharides possessing a large DP. In contrast, P9 displayed an identical pattern to the exhibited by OFS, with bands colored in red and a polysaccharide of short DP. While the chromatographic profiles of P7, P8, and P11 were comparable to that of both MDX and OFS, since they exhibited bands in blue and red color. In addition, they also have a mixture of polysaccharides of large and short DP (Figure 1).
Altogether, HPTLC resulted be a rapid, simple, and precise method for the authentication of commercial products labeled as natural agave inulin, evidencing that several of them are counterfeiting or are partially adulterated. Replacement of agavins (wholly or partially) by any other ingredient, without the purchaser´s knowledge, is a fraud. In addition, adulterated prebiotic supplements could be no safe to well-being of the consumers. Therefore, is necessary that regulatory authorities to put attention to these products that are sell as agave inulin as well as their possible effects on consumers health.
On the other hand, although HPTLC provided valuable information regarding to authenticity of commercial agavins, FTIR and HPAEC-PAD were employed to confirm these findings.
3.2. Authentication of Commercial Agavins Employing FTIR Coupled to PCA Analysis
FTIR reference samples profiles also provided an excellent data. All spectra showed a strong and broad band at approximately 3300 cm-1, corresponding to O-H stretching; next to, the moderate bands located between 3000 and 2800 cm-1 are attributed to the symmetric and asymmetric stretching vibrations of skeletal CH and CH2 [17]; while the band at 1640 cm-1 is always associated to water absorption [13] (Figure S1). Moreover, the fingerprint region from 1200 to 800 cm-1 of FTIR spectra, contains a complex series of absorption band arising from multiple deforming bonds producing a unique carbohydrate spectral pattern [17]. Therefore, this region was used to analyze, with greater detail reference samples. In the Figure 2, the band around 1120 cm-1 corresponds to the C-O-H stretching vibration; while, the glycosidic linkage (C-O-C) stretching vibration, a key feature of polysaccharides, appear approximately at 1015 cm-1 [18]. In addition, the band around 926 cm-1 was assigned to α-D-glycosidic bond present in the polysaccharide structure [19]. Moreover, bands in the 900-800 cm-1 region, can be used to differentiate the alpha and beta configuration of anomeric carbons [17]. Interestingly, AR1, AR2, RNE, and OFS showed a band around 869 cm-1, which indicates the existence of β-configuration [20], a distinctive linkage present in fructans. Furthermore, the band approximately at 815 cm-1 is associated with the presence of furanose rings [21]. In contrast, the band exhibited by MDX at 846 cm-1 indicates the existence of α-configuration [22]; whereas the bands at 1147 and 1077 cm-1 are characteristic of pyranose rings [13]. With respect to PDX, this polysaccharide showed bands at 1147, 1075, and 1011 cm-1 which have been reported as relevant feature absorption marker for this carbohydrate [23].
In the Figure 3 are shown the fingerprint FTIR spectra of commercial agave inulins. In this figure is observed that all commercial products displayed the characteristic band of polysaccharides around of 1015 cm-1 and the band associated with α-D-glycosidic bonds approximately at 925 cm-1 [18,19]. On the other hand, in a similar way that in the HPTLC, FTIR spectra of P3 and P10 are very like to reference samples (AR1 and AR2). In addition, P3 and P10 showed bands around of 815 cm-1 and 869 cm-1, denoting the presence of furanose rings and the existence of β-configuration, respectively [20,21]; indicating that these are fructan-type products (Figure 3). On the other side, in the FTIR data of P1, P2, P5, P7, P8, P9, and P12 also were located the characteristic bands associated with the fructans presence (β-linkages and furanose rings). However, employing only FTIR it was not possible to distinguish between branched fructans (agavins) and linear fructans (inulins). Additionally, is very clear that P6, P7, P8, and P11 displayed bands around of 1147, 1077, and 846 cm-1 (Figure 3), and as aforementioned, these are feature absorption bands characteristic of MDX. Hence, these results evidenced the presence of this polysaccharide in the so-called agave inulins. With respect to P4, the FTIR spectrum of this product exhibited the marker absorption bands of PDX at 1147, 1075, and 1011 cm-1 (Figure 3) corroborating that this product does not belong to the agavin-type fructans but to PDX.
Since the FTIR spectra were complicated to interpret directly, a PCA analysis was applied to the fingerprint region (1200 to 800 cm-1). PCA plot showed differences between authentic fructans (AR1, AR2, RNE, and OFS) as well as between MDX and PDX (Figure 4). In the PCA plot, the first and second PCs account for 73% and 10% of the variance, respectively. PC1 axis separated the reference samples according to their DP. As previously was shown by HPTLC, AR1, AR2, RNE, and MDX possess a large DP, while OFS and PDX have a short DP. On the other side, PC2 allowed a distinction between fructans (AR1, AR2, RNE, and OFS) and other polysaccharides (MDX and PDX).
Regarding commercial products, PCA plot showed that P3 and P10 were grouped very near to agavin reference samples, reaffirming that these products are authentic agavin-type fructans (Figure 4). On the other hand, in the PCA plot, P1, P2, and P5 were placed in the center of the plot, revealing the presence of a mixture of polysaccharides of large and short DP (Figure 4). Additionally, P12 was located between the agavins and MDX reference samples. While P4 appeared very close to PDX, reaffirming that this product is not of an agave origin but a PDX (Figure 4). In addition, PCA plot ratified that P6, P7, P8, P9, and P11 are not authentic agavins. In Figure 4, P9 appears very close to OFS; P6 and P11 are nearby to MDX, and P7 and P8 were placed in the center of PCA plot due to their peculiarity of possessing a mixture of polysaccharides of large (MDX) and short (OFS) DP. Thus, the use of FTIR coupled to a PCA analysis resulted to be a quick, affordable, highly reproducible, and effective method for distinguish between authentic and adulterated commercial agavins.
3.2. Authentication of Commercial Agavins Employing FTIR Coupled to PCA Analysis
HPAEC-PAD results displayed significant differences in the profile of reference samples (Figure 5). In the left side of Figure 5, the amounts of free sugars such as glucose, fructose, and sucrose are showed, these saccharides are present in all reference samples; instead, in the right side the polysaccharides fraction with a DP > 3 are showed. In Figure 5, agavin reference samples (AR1 and AR2) exhibited a typical chromatographic profile for these highly branched fructans, in which mountains instead of single peaks are visualized as the agavins DP increases [24]. This is due to agavins structural complexity as well as the isomeric numerous forms present in for each DP [15]. In contrast, OFS, RNE, and MDX, displayed well resolved peaks; each peak corresponding to a single DP [16,25]. In addition, OFS and RNE reference samples showed their well-known profiles of a short and large DP inulin-type fructans, respectively; with both GFn and Fn molecules, (G for glucose, F for fructose, and n indicating DP) [16]. On the other hand, PDX showed a poor separation of its components. This is because, PDX is obtained by polycondensation of glucose process, in the presence of sorbitol and citric acid, producing glucose polymers containing all possible glycosidic linkages (α and β) [26]. Hence, a good chromatographic separation by HPAEC-PAD, using the same conditions employed to identify fructans was not possible to characterize this polysaccharide.
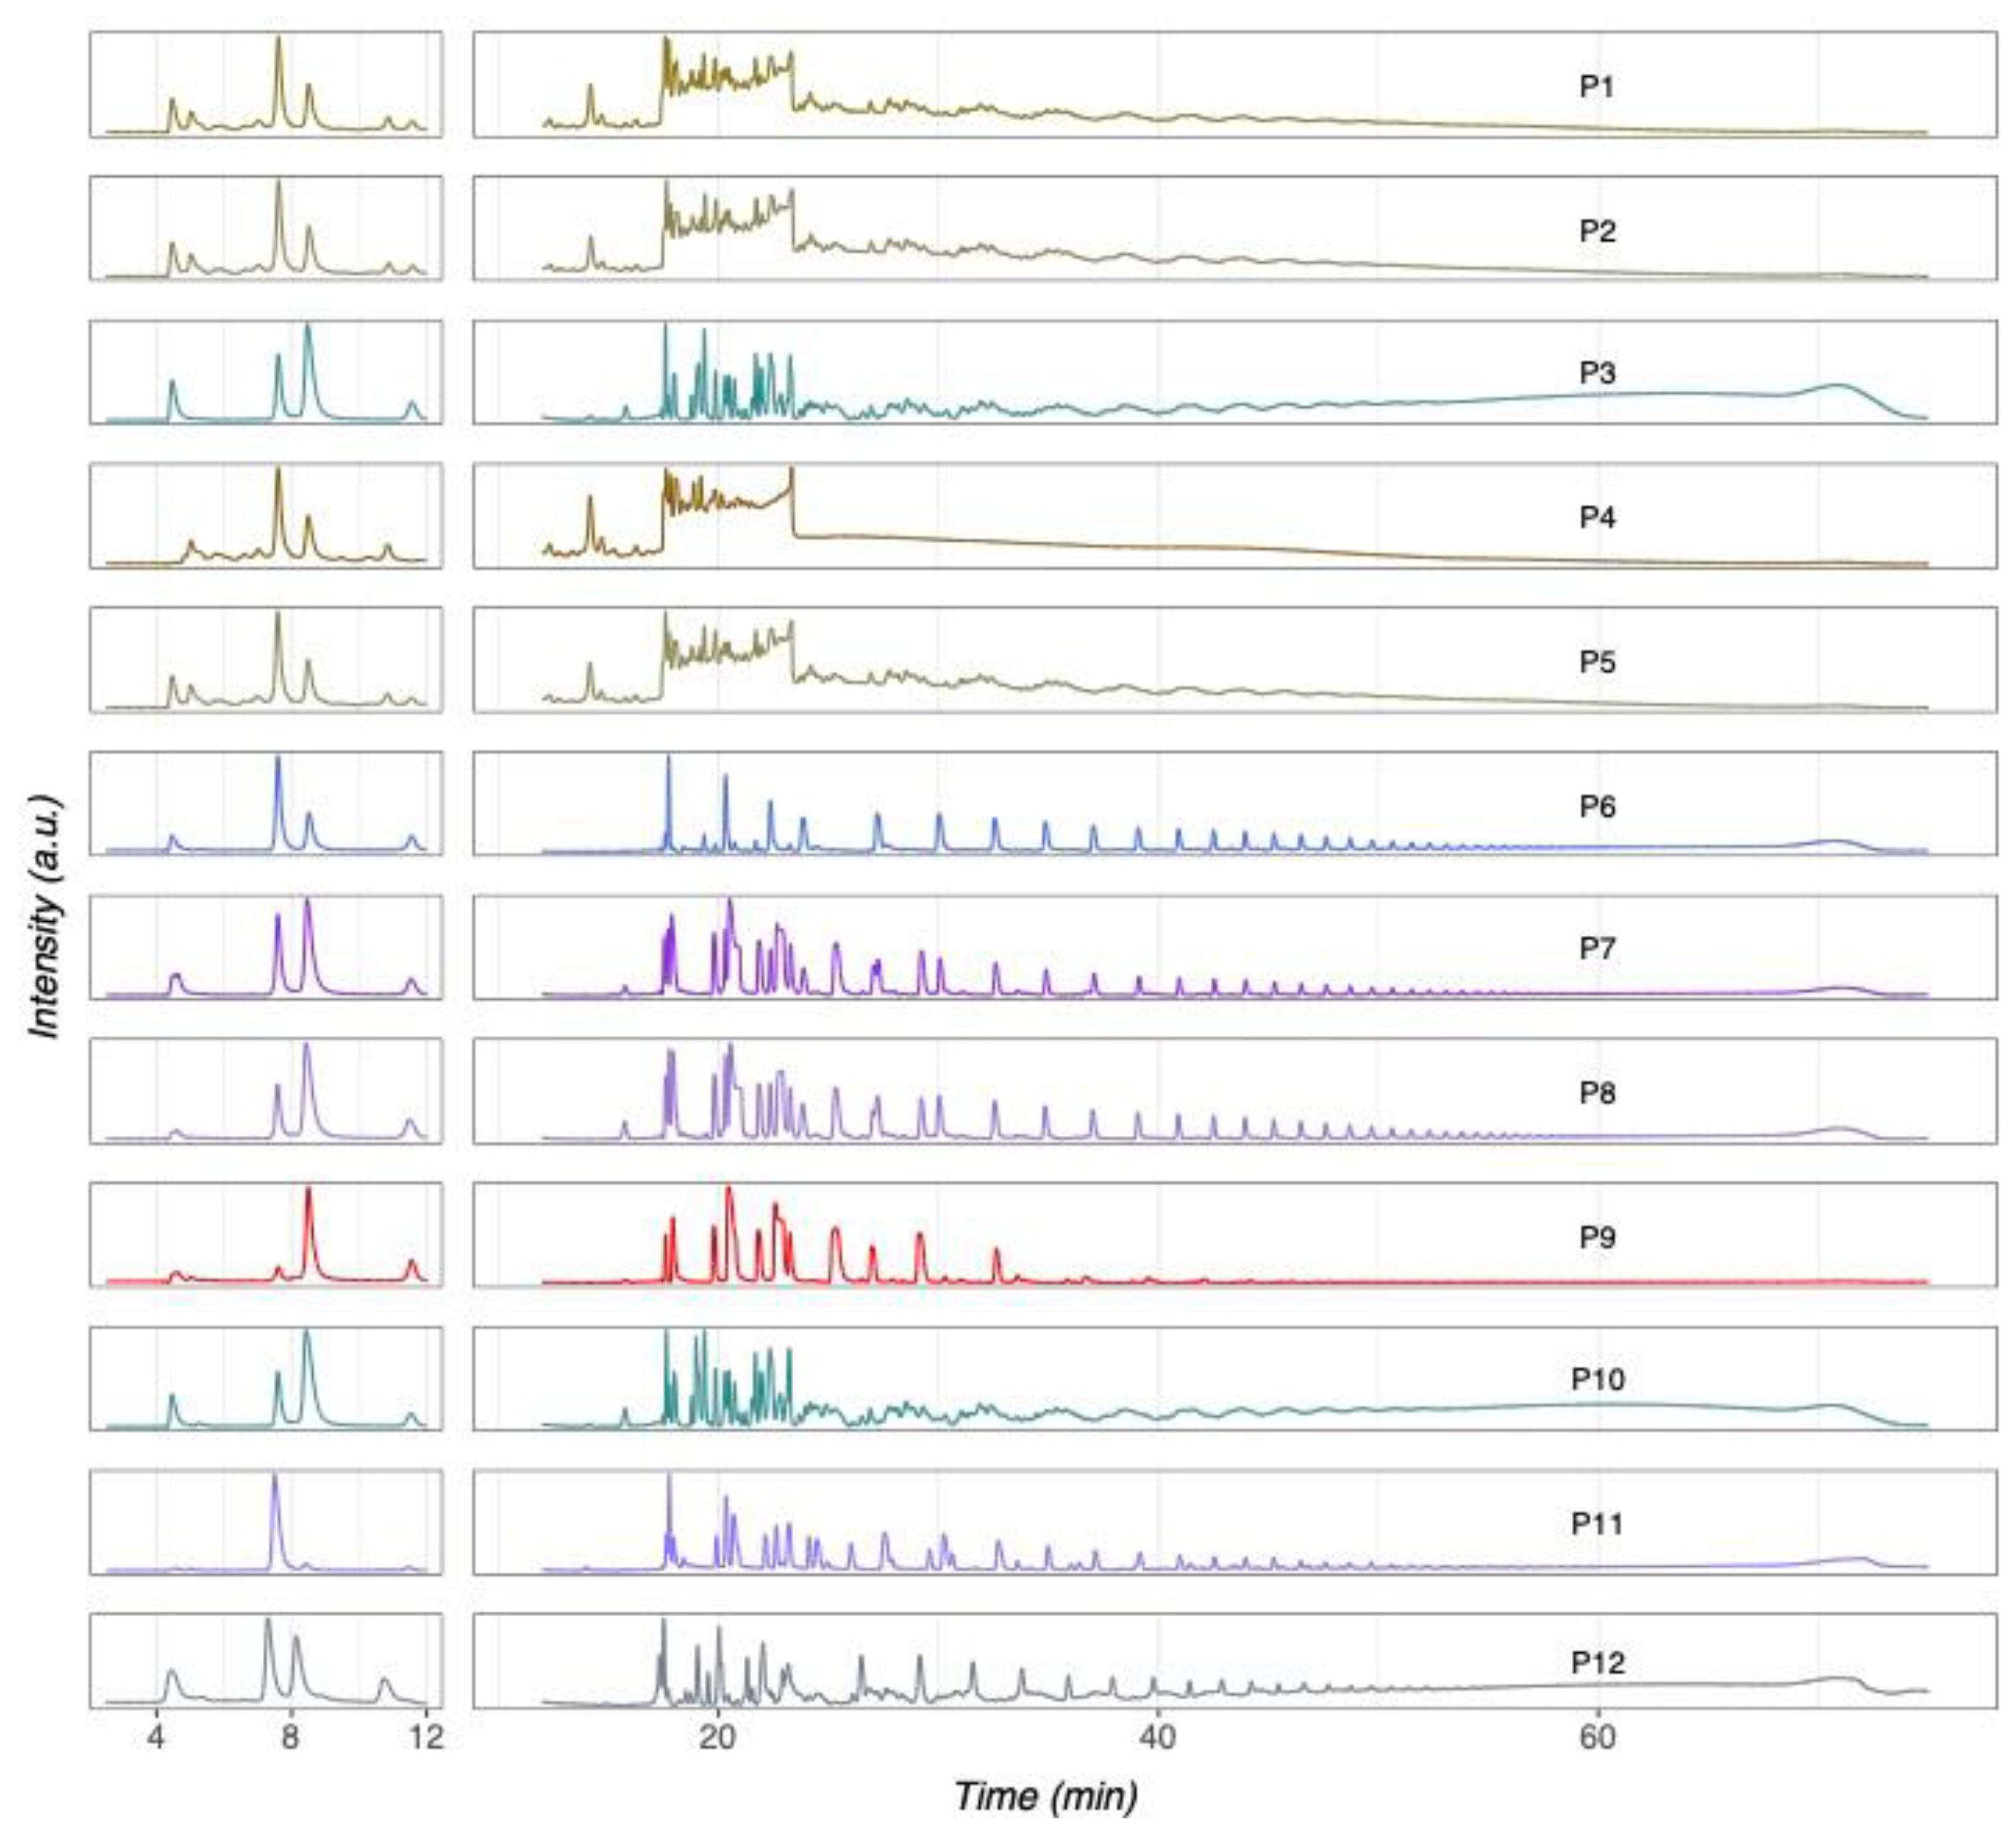
In relation to commercial products labeled as purely natural agave inulin, HPAEC-PAD profiles showed several differences (Figure 6). Notably, HPAEC-PAD confirmed that P3 and P10 correspond to authentic agavin products; since the chromatographic profiles exhibited the peculiar chromatographic pattern, with their characteristic mountains as the DP increases, observed in all authentic agave samples (Figure 6). On the other hand, an adulterant in the P1, P2, and P5 was detected using HPTLC (Figure 1); through HPAEC-PAD, it was confirmed that these commercial products contained agavins adulterated with PDX, because their chromatographic profiles are match with PDX reference sample (Figure 5 and Figure 6). Thus, in comparison to HPTLC, HPAEC-PAD is a tool much more sensitive since it allowed an easy distinction between the pattern of an authentic from an adulterated agave product.
Moreover, the HPAEC-PAD profile of P12 showed that this product contained agavins; however, the presence of MDX as adulterant was confirmed by their chromatographic pattern display an overlapping between characteristic peaks of AR1 or AR2 and MDX (Figure 5 and Figure 6). Regarding commercial products that do not contain agavins, such as P4, is very clear that its HPAEC-PAD chromatographic profile is identical to PDX reference sample. Additionally, the HPAEC-PAD profiles of P6 and P9 confirm that these products are not agavins but MDX and OFS; respectively. In this sense, product P6 showed defined peaks with large DP; in contrast, P9 displayed a short DP and key characteristics of OFS such as peaks corresponding to GFn and Fn molecules (Figure 6). Regarding to P7, P8, and P11, they showed an overlapping of chromatographic profile to that of MDX and OFS, confirming that these are a blend of both polysaccharides (Figure 6).
Altogether, these findings confirmed that several commercial products sell as agave inulins are a fraud. Adulteration of agavins compromise their quality, security, and efficacy, with a significant threat to the health of consumers. Therefore, assuring the authenticity of commercial agavins supplement is critical for preventing not only economic fraud, but also to avoid any affectation on consumer's health as well as recuperate their trust.
Moreover, consumption of adulterated prebiotic supplements might have serious health hazard effects on the consumers. With respect to the use of PDX as adulterant, in the food industry this polysaccharide is employed as a low-calorie bulking agent for sugar and fat replacement. Although, in the last decade, PDX has been gaining popularity as a dietary fiber ingredient, due to its wide range of glycosidic linkages, PDX is resistant to digestion in the upper gastrointestinal tract, reaching the large intestine where it is partially fermented by the gut microbiota resident [27]. However, the prebiotic status of PDX is still a matter of debate [27,28]. Therefore, it is necessary that regulatory authorities draw their attention to commercial products labeled as agave inulins but adulterated with PDX as well as their possible effects on host health.
On the other hand, in relation to the use of OFS as adulterant, this linear fructan is recognized, at world level, by stimulating the growth and/or activity of good bacteria in the colon, promoting the host health [29]. However, it is also well known that the chemical structure of fructans affect their prebiotic properties, such as the enrichment of specific bacterial taxa in the gut [30]. In this regard, in comparison to agavins, OFS has distinct prebiotic beneficial effects on the host [30,31]. On the other side, the substitution of agavins by economic edible carbohydrates such as MDX creates opportunities for some traders to maximize profits. However, the use of this ingredient decreases the quality of products because compared with agavins, MDX does not have prebiotic properties and is usually employed as placebo [32]. Hence, commercial agavin products adulterated with MDX could be healthy ineffective. Therefore, guaranteeing the authenticity of any food, including prebiotic supplements such as agavins, should be a priority for the government regulatory authorities.
In summary, the majority of commercial agavins, labeled and sold in the market as pure agave inulin, are not authentic. Polydextrose, oligofructose, and maltodextrin were the identified adulterants in the commercial products. On the other hand, the combination of HPTLC, FTIR, and HPAEC-PAD are reliable and attainable tools for the authentication of agavins. Detection and prevention of any kind of adulteration is always relevant and should be prohibited by regulatory authorities, not only related to an economic fraud, but more importantly due a negative impact on health consumers.
Supplementary Materials
The following supporting information can be downloaded at the website of this paper posted on Preprints.org, Figure S1: FTIR spectra of reference samples. AR1, agavins reference sample 1; AR2, agavins reference sample 2; OFS, oligofructose; RNE, raftiline; MDX, maltodextrin; PDX, polydextrose.
Author Contributions
Conceptualization, A.H.G.; methodology, A.H.G. and M.G.L.; formal analysis, A.H.G.; investigation, A.H.G. and M.G.L.; writing—original draft preparation, A.H.G.; writing—review and editing, M.G.L. and A.H.G. All authors have read and agreed to the published version of the manuscript.
Funding
This research received no external funding
Data Availability Statement
Some data might will made available on request.
Conflicts of Interest
The authors declare no conflicts of interest.
References
- Webb, G.P. An overview of dietary supplements and functional foods. In Dietary Supplements and Functional Foods; Webb, G.P., Ed.; Blackwell Publishing Ltd: Oxford, UK, 2006; pp. 1–37. [Google Scholar] [CrossRef]
- Huazano-García, A.; Silva-Adame, M.B.; López, M.G. Preclinical and clinical fructan studies. In The Book of Fructans; Van den Ende, W., Toksoy Öner, E., Eds.; Academic Press: London, UK, 2023; pp. 235–256. [Google Scholar] [CrossRef]
- Espinosa-Andrews, H.; Urías-Silvas, J.; Morales-Hernández, N. The role of agave fructans in health and food applications: a review. Trends Food Sci. Technol. 2021, 114, 585−598. [Google Scholar] [CrossRef]
- Mancilla-Margalli, N.A.; López, M.G. Water-soluble carbohydrates and fructan structure patterns from Agave and Dasylirion species. J. Agric. Food Chem. 2006, 54, 7832−7839. [Google Scholar] [CrossRef]
- Secretaria de economía. Available online: https://www.economia.gob.mx/datamexico/en/profile/product/inulin (accessed on 4 February 2025).
- Momtaz, M.; Bubli, S.Y.; Khan, M.S. Mechanisms and health aspects of food adulteration: a comprehensive review. Foods 2023, 12, 199. [Google Scholar] [CrossRef] [PubMed]
- Cozzolino, D.; Dayananda, B.; Chapman, J. Food adulteration. In Chemometrics Data Treatment and Applications; Narciso Fernandes, F.A., Rodrigues, S., Eds.; Elsevier: Amsterdam, Netherlands, 2024; pp. 273–291. [Google Scholar] [CrossRef]
- Vinothkanna, A.; Iqbal Dar, O.; Liu, Z.; Jia, A.Q. Advanced detection tools in food fraud: a systematic review for holistic and rational detection method based on research and patents. Food Chem. 2024, 446, 138893. [Google Scholar] [CrossRef] [PubMed]
- Haji, A.; Desalegn, K.; Hassen, H. Selected food items adulteration, their impacts on public health, and detection methods: a review. Food Sci. Nutr. 2023, 11, 7534−7545. [Google Scholar] [CrossRef]
- Shao, A. Global market entry regulations for nutraceuticals, functional foods, dietary/food/health supplements. In Developing New Functional Food and Nutraceutical Products; Bagchi, D., Nair, S., Eds.; Academic Press: London, UK, 2016; pp. 279–290. [Google Scholar] [CrossRef]
- Pierre-Luc, L.; Hua, M.Z.; Hu, Y.; Elliott, C.; Lu, X. Editorial: food authentication. Trends Food Sci. Technol. 2024, 150, 104616. [Google Scholar] [CrossRef]
- Deconinck, E.; Vanhamme, M.; Bothy, J.L.; Courselle, P. A strategy based on fingerprinting and chemometrics for the detection on regulated plants in plant food supplements from the belgian market: two case studies. J. Pharm. Biomed. Anal. 2019, 166, 189−196. [Google Scholar] [CrossRef]
- Rodriguez-Saona, L.E.; Giusti, M.M.; Shotts, M. Advances in infrared spectroscopy for food authenticity testing. In Advances in Food Authenticity Testing. Downey, G., Ed.; Woodhead Publishing: Duxford, UK, 2016; pp. 71–116. [Google Scholar] [CrossRef]
- Salomé-Abarca, L.F.; Márquez-López, R.E.; Santiago-García, P.A.; López, M.G. HPTLC-based fingerprinting: an alternative approach for fructooligosaccharides metabolism profiling. Curr. Res. Food Sci. 2023, 6, 100451. [Google Scholar] [CrossRef]
- Mellado-Mojica, E.; López, M.G. Fructan metabolism in A. tequilana Weber blue variety along its developmental cycle in the field. Agric. Food Chem. 2012, 60, 11704−11713. [Google Scholar] [CrossRef]
- López, M.G. Chemical and structural-functional features of fructans. In The Book of Fructans, 1st ed.; Van den Ende, W., Toksoy Öner, E., Eds.; Academic Press: London, UK, 2023; pp. 11–23. [Google Scholar] [CrossRef]
- Hong, T.; Yin, J.Y.; Nie, S.P.; Xie, M.Y. Applications of infrared spectroscopy in polysaccharide structural analysis: progress, challenge and perspective. Food Chem. X 2021, 12, 100168. [Google Scholar] [CrossRef]
- Wannasutta, R.; Laopeng, S.; Yuensuk, S.; McLoskey, S.; Riddech, N.; Mongkolthanaruk, W. Biopolymer-levan characterization in Bacillus species isolated from traditionally fermented soybeans (Thua Nao). ACS Omega 2025, 10, 1677−1687. [Google Scholar] [CrossRef] [PubMed]
- Zhang, S.; Zhang, Q.; An, L.; Zhang, J.; Li, Z.; Zhang, J.; Li, Y.; Tuerhong, M.; Ohizumi, Y.; Jin, J.; Xu, J.; Guo, Y. A fructan from Anemarrhena asphodeloides Bunge showing neuroprotective and immunoregulatory effects. Carbohydr. Polym. 2020, 229, 115477. [Google Scholar] [CrossRef]
- Bu, Y.; Yin, B.; Qiu, Z.; Li, L.; Zhang, B.; Zheng, Z.; Li, M. Structural characterization and antioxidant activities of polysaccharides extracted from Polygonati rhizoma pomace. Food Chem. X 2024, 23, 101778. [Google Scholar] [CrossRef] [PubMed]
- Tang, Z.; Shao, T.; Gao, L.; Yuan, P.; Ren, Z.; Tian, L.; Liu, W.; Liu, C.; Xu, X.; Zhou, X.; Han, J.; Wang, G. Structural elucidation and hypoglycemic effect of an inulin-type fructan extracted from Stevia rebaudiana roots. Food Funct. 2023, 14, 2518−2529. [Google Scholar] [CrossRef] [PubMed]
- Li, Q.; Wang, W.; Zhu, Y.; Chen, Y.; Zhang, W.; Yu, P.; Mao, G.; Zhao, T.; Feng, W.; Yang, L.; Wu, X. Structural elucidation and antioxidant activity a novel Se-polysaccharide from Se-enriched Grifola frondosa. Carbohydr. Polym. 2017, 161, 42−52. [Google Scholar] [CrossRef]
- Wang, H.; Shi, Y.; Le, G. Rapid microwave-assisted synthesis of polydextrose and identification of structure and function. Carbohydr. Polym. 2014, 113, 225−230. [Google Scholar] [CrossRef]
- Huazano-García, A.; López, M.G. Enzymatic hydrolysis of agavins to generate branched fructooligosaccharides (a-FOS). Appl. Biochem. Biotechnol. 2018, 184, 25−34. [Google Scholar] [CrossRef]
- White, D.R. Jr.; Hudson, P.; Adamson, J.T. Dextrin characterization by high-performance anion-exchange chromatography−pulsed amperometric detection and size-exclusion chromatography−multi-angle light scattering−refractive index detection. J. Chromatogr. A 2003, 997, 79−85. [Google Scholar] [CrossRef]
- Radosta, S.; Boczek, P.; Grossklaus, R. Composition of polydextrose® before and after intestinal degradation in rats. Starch 1992, 44, 150−153. [Google Scholar] [CrossRef]
- Stowell, J.D. Prebiotic potential of polydextrose. In Prebiotics and Probiotics Science and Technology; Charalampopoulos, D., Rastall, R.A., Eds.; Springer: New York, USA, 2009; pp. 337–352. [Google Scholar] [CrossRef]
- do Carmo, M.M.; Walker, J.C.; Novello, D.; Caselato, V.M.; Sgarbieri, V.C.; Ouwehand, A.C.; Andreollo, N.A.; Hiane, P.A.; Dos Santos, E.F. Polydextrose: physiological function, and effects on health. Nutrients 2016, 8, 553. [Google Scholar] [CrossRef]
- Qin, Y.Q.; Wang, L.Y.; Yang, X.Y.; Xu, Y.J.; Fan, G.; Fan, Y.G.; Ren, J.N.; An, Q.; Li, X. Inulin: properties and health benefits. Food Funct. 2023, 14, 2948−2968. [Google Scholar] [CrossRef] [PubMed]
- Huazano-García, A.; Shin, H.; López, M.G. Modulation of gut microbiota of overweight mice by agavins and their association with body weight loss. Nutrients 2017, 9, 821. [Google Scholar] [CrossRef] [PubMed]
- Huazano-García, A.; López, M.G. Agavins reverse the metabolic disorders in overweight mice through the increment of short chain fatty acids and hormones. Food Funct. 2015, 6, 3720−3727. [Google Scholar] [CrossRef] [PubMed]
- Silva-Adame, M.B.; Martínez-Alvarado, A.; Martínez-Silva, V.A.; Samaniego-Méndez, V.; López, M.G. Agavins impact on gastrointestinal tolerability-related symptoms during a five-week dose-escalation intervention in lean and obese mexican adults: exploratory randomized clinical trial. Foods 2022, 11, 670. [Google Scholar] [CrossRef]
Figure 1.
HPTLC profiles of reference samples and commercial products labeled as purely natural agave inulin. P1 to P12 are commercial products of different brands. AR1, agavins reference sample 1; PDX, polydextrose; OFS, oligofructose; RNE, raftiline; and MDX, maltodextrin; Rf, retention factor.
Figure 1.
HPTLC profiles of reference samples and commercial products labeled as purely natural agave inulin. P1 to P12 are commercial products of different brands. AR1, agavins reference sample 1; PDX, polydextrose; OFS, oligofructose; RNE, raftiline; and MDX, maltodextrin; Rf, retention factor.
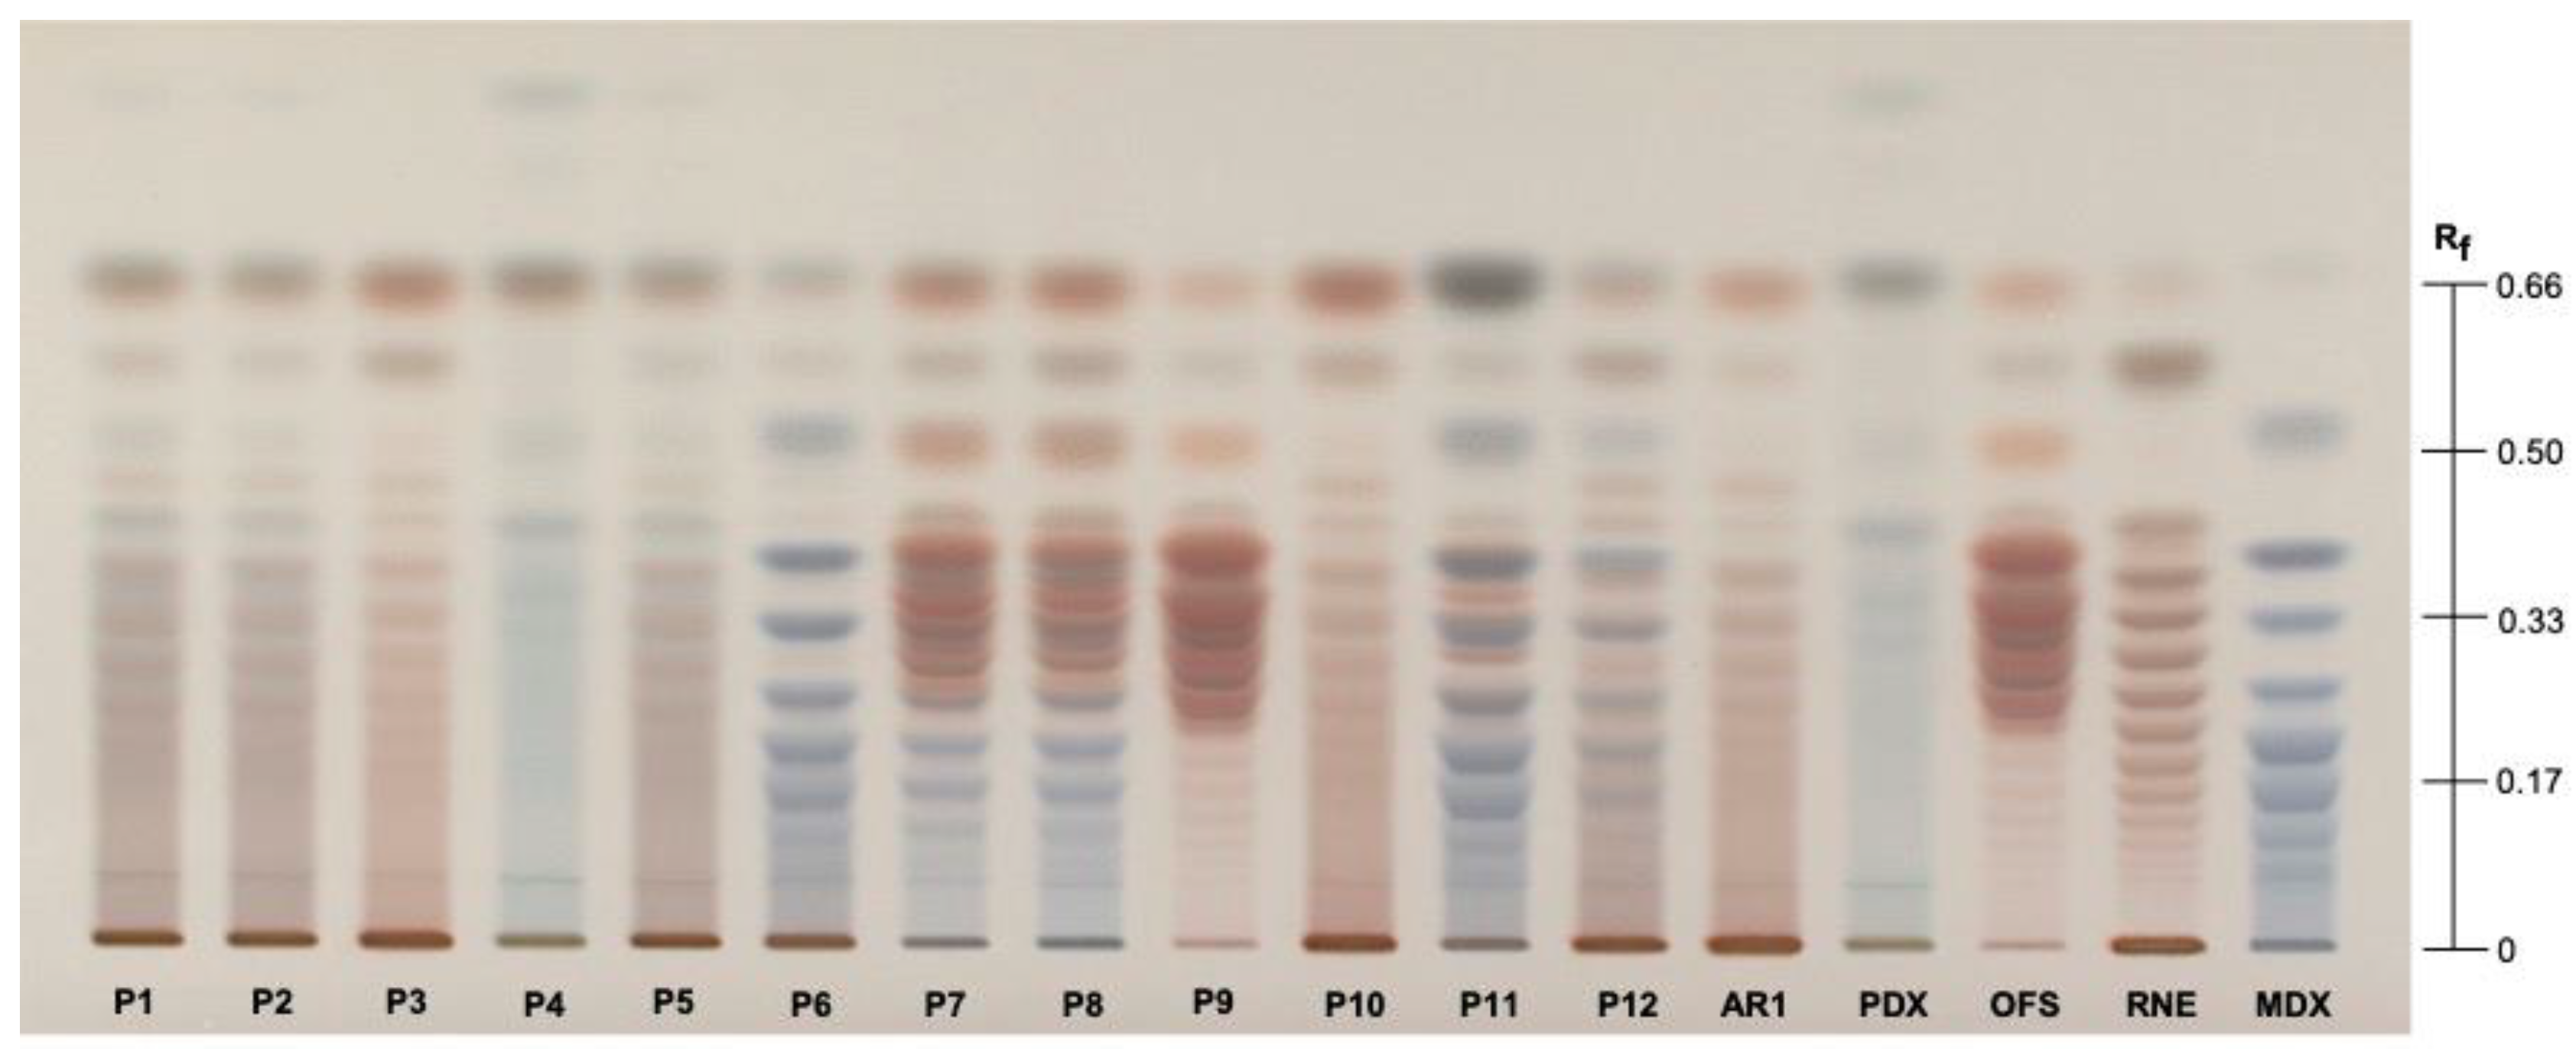
Figure 2.
FTIR spectra of reference samples at the fingerprint region (1200-800 cm-1). AR1, agavins reference sample 1; AR2, agavins reference sample 2; OFS, oligofructose; RNE, raftiline; MDX, maltodextrin; PDX, polydextrose. All spectra were normalized based on the highest peak abundance.
Figure 2.
FTIR spectra of reference samples at the fingerprint region (1200-800 cm-1). AR1, agavins reference sample 1; AR2, agavins reference sample 2; OFS, oligofructose; RNE, raftiline; MDX, maltodextrin; PDX, polydextrose. All spectra were normalized based on the highest peak abundance.
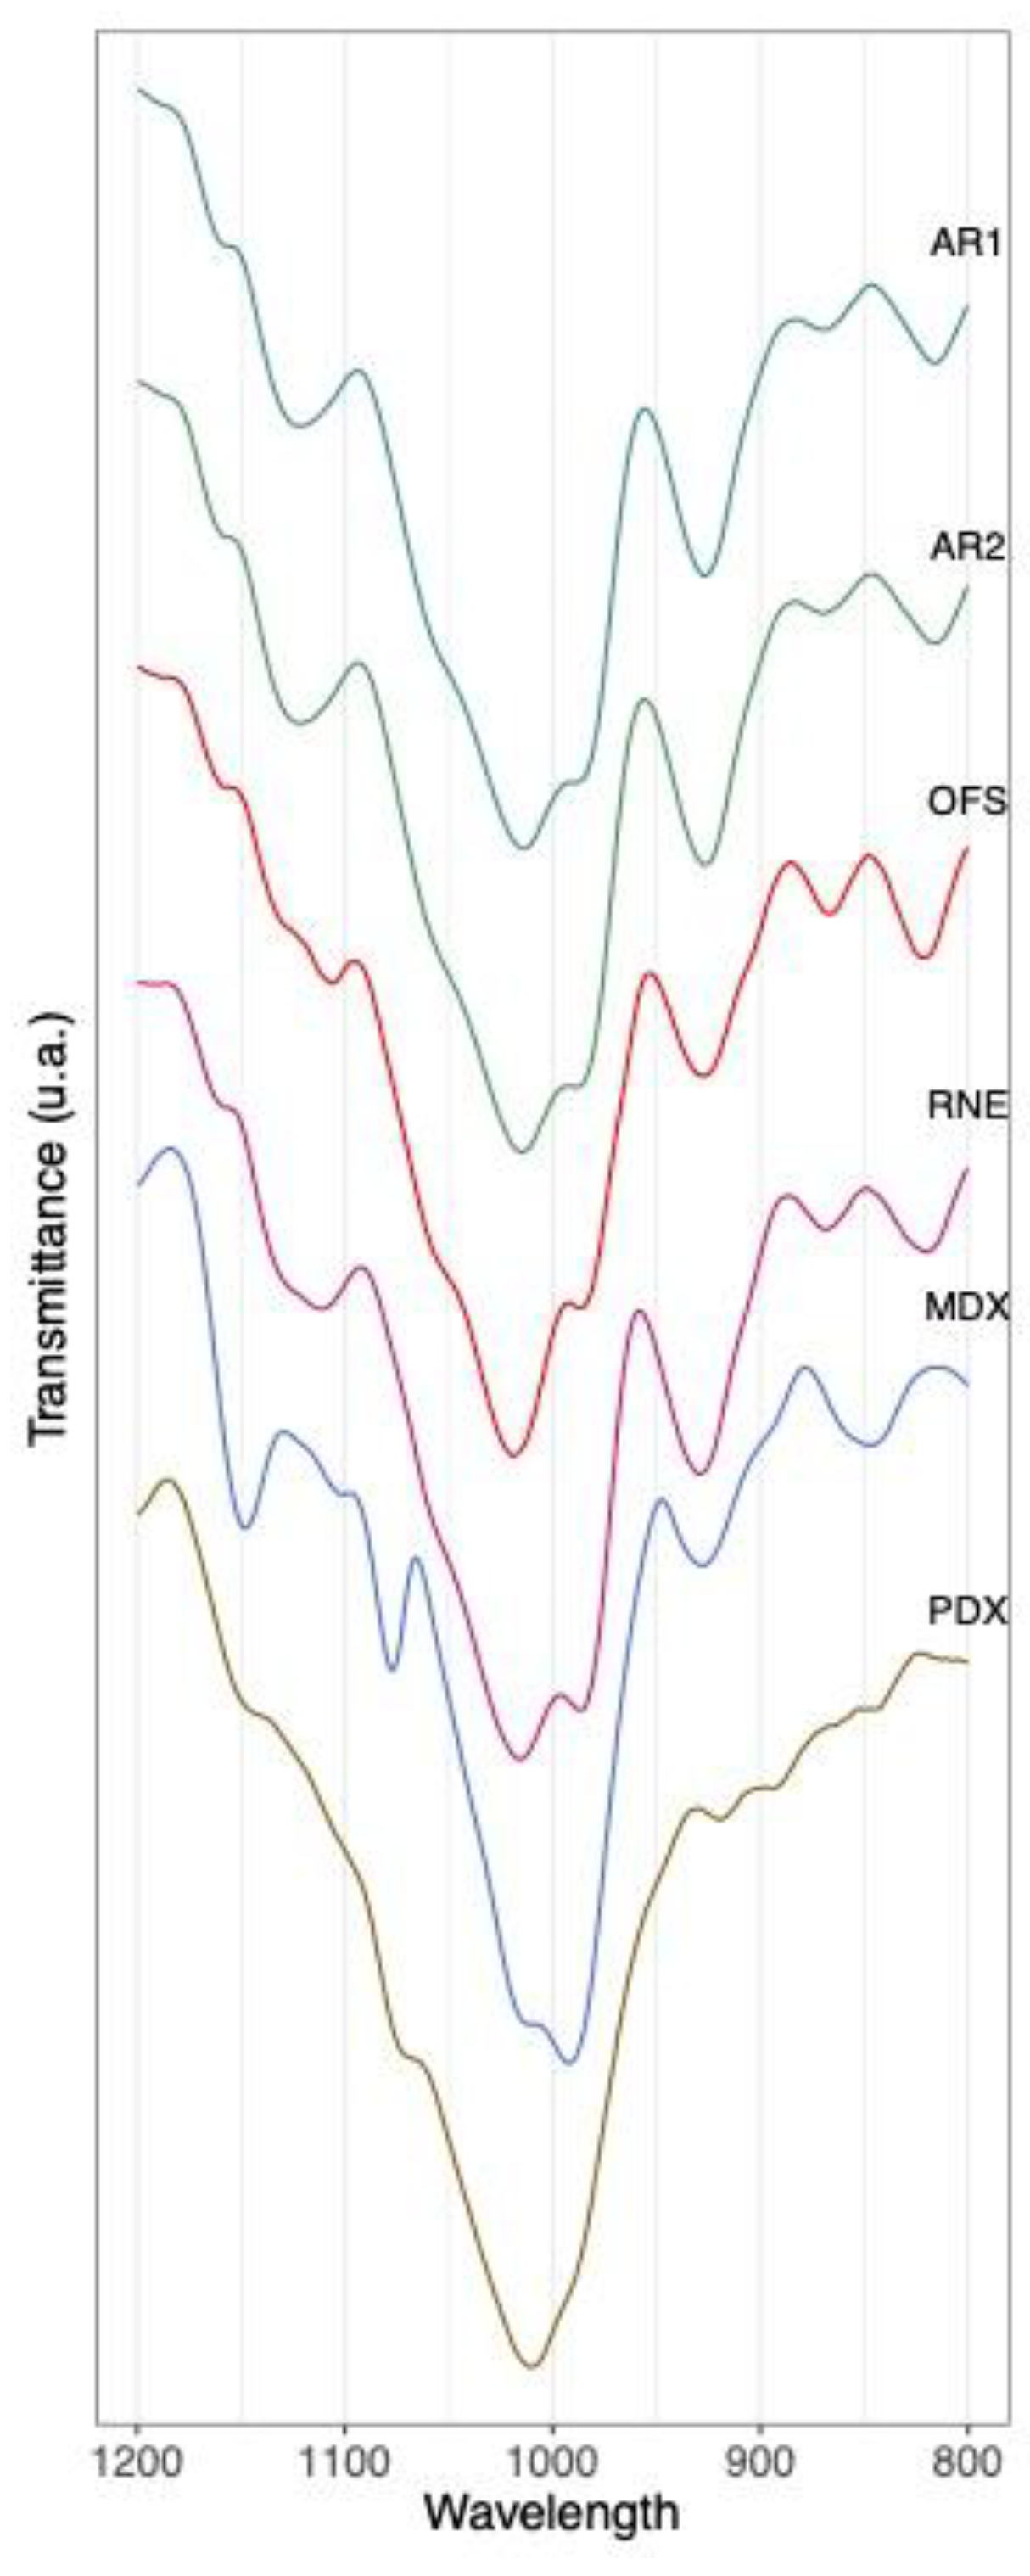
Figure 3.
FTIR spectra at the fingerprint region (1200-800 cm-1) of twelve commercial products labeled as purely natural agave inulin. All spectra were normalized based on the highest peak abundance.
Figure 3.
FTIR spectra at the fingerprint region (1200-800 cm-1) of twelve commercial products labeled as purely natural agave inulin. All spectra were normalized based on the highest peak abundance.
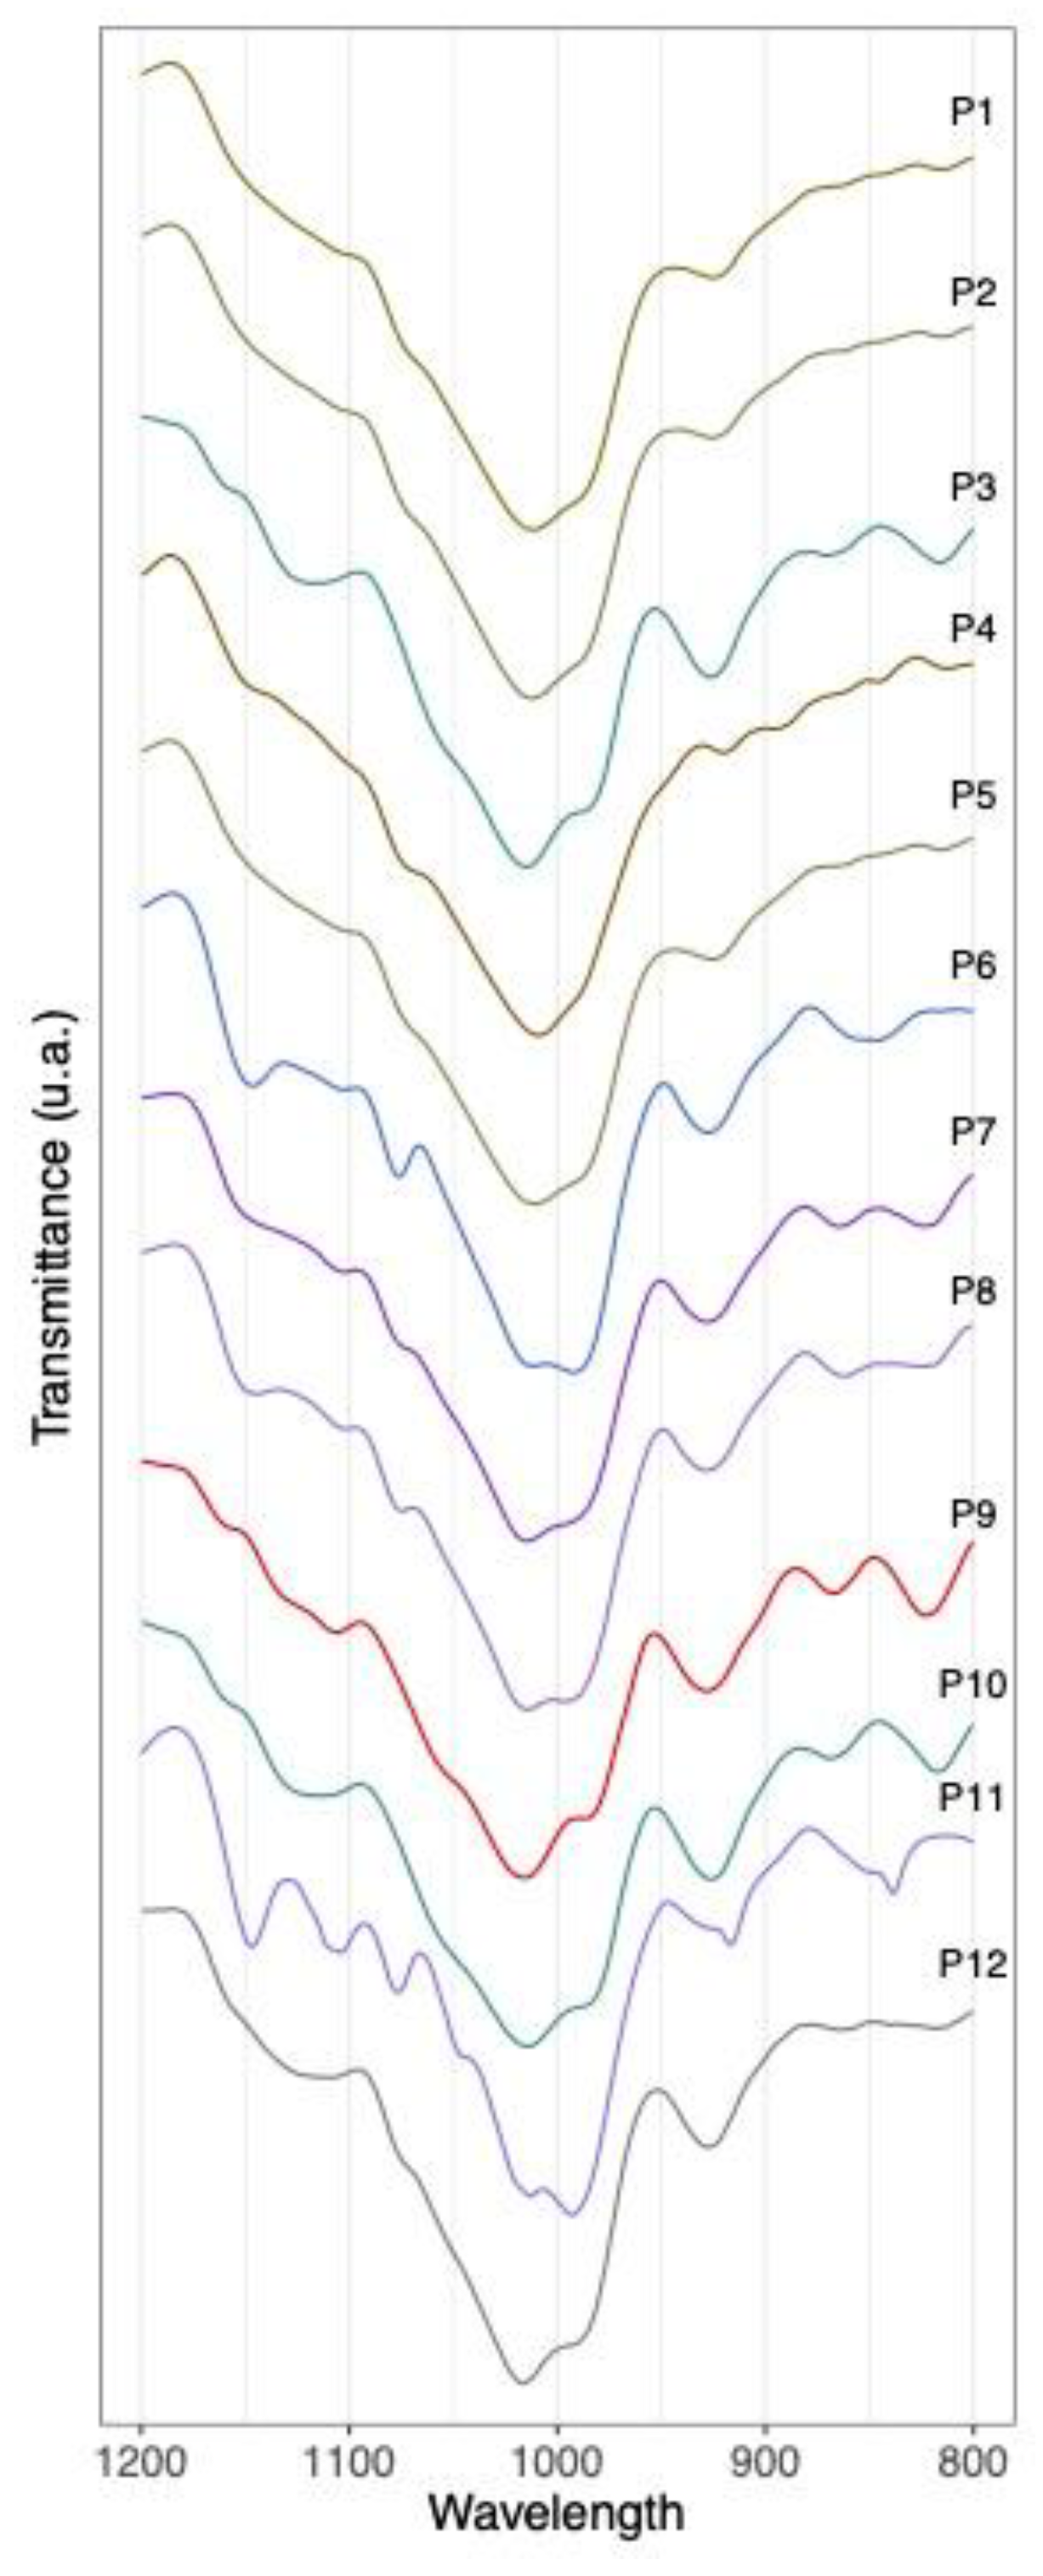
Figure 4.
PCA plot of the FTIR at the fingerprint region (1200-800 cm-1) of the reference samples and commercial products. AR1, agavins reference sample 1; AR2, agavins reference sample 2; OFS, oligofructose; RNE, raftiline; MDX, maltodextrin; PDX, polydextrose; P1 to P12 are commercial products available in the market labeled as purely natural agave inulin. A and B correspond to the same sample evaluated by duplicate.
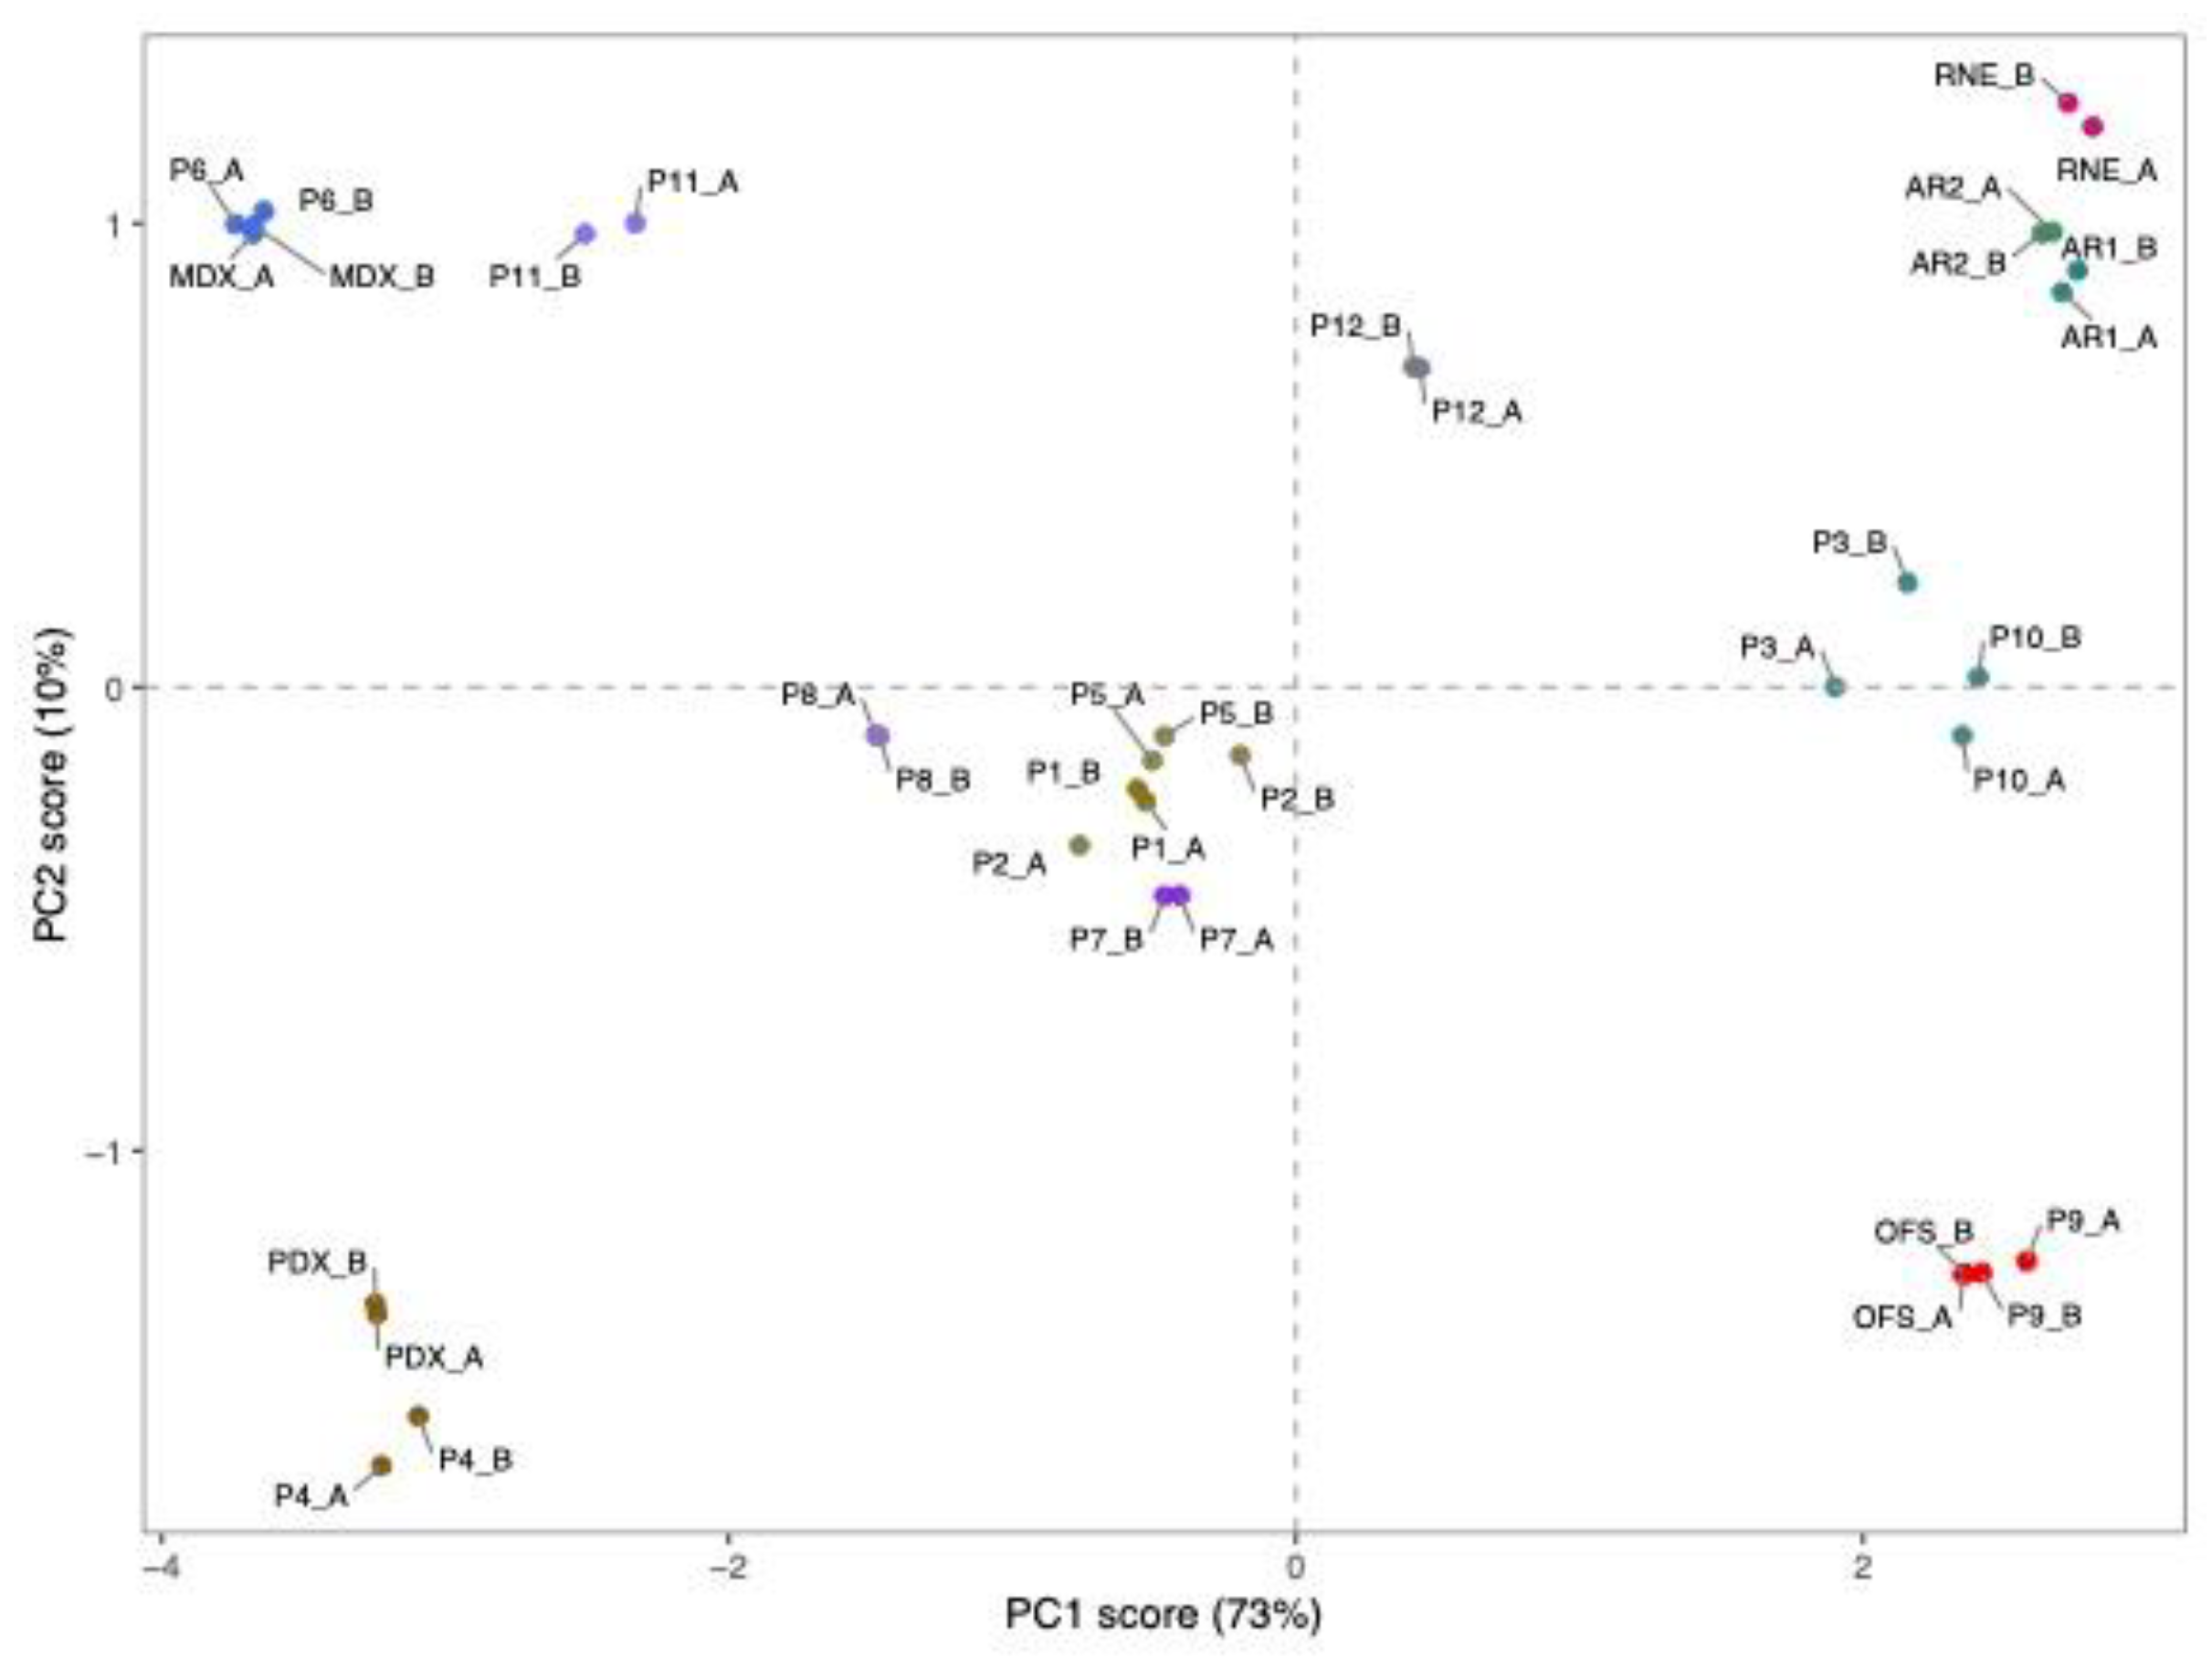
Figure 5.
HPAEC-PAD profiles of reference samples. AR1, agavins reference sample 1; AR2, agavins reference sample 2; OFS, oligofructose; RNE, raftiline; MDX, maltodextrin; PDX, polydextrose. All chromatograms were normalized based on the highest peak abundance.
Figure 5.
HPAEC-PAD profiles of reference samples. AR1, agavins reference sample 1; AR2, agavins reference sample 2; OFS, oligofructose; RNE, raftiline; MDX, maltodextrin; PDX, polydextrose. All chromatograms were normalized based on the highest peak abundance.
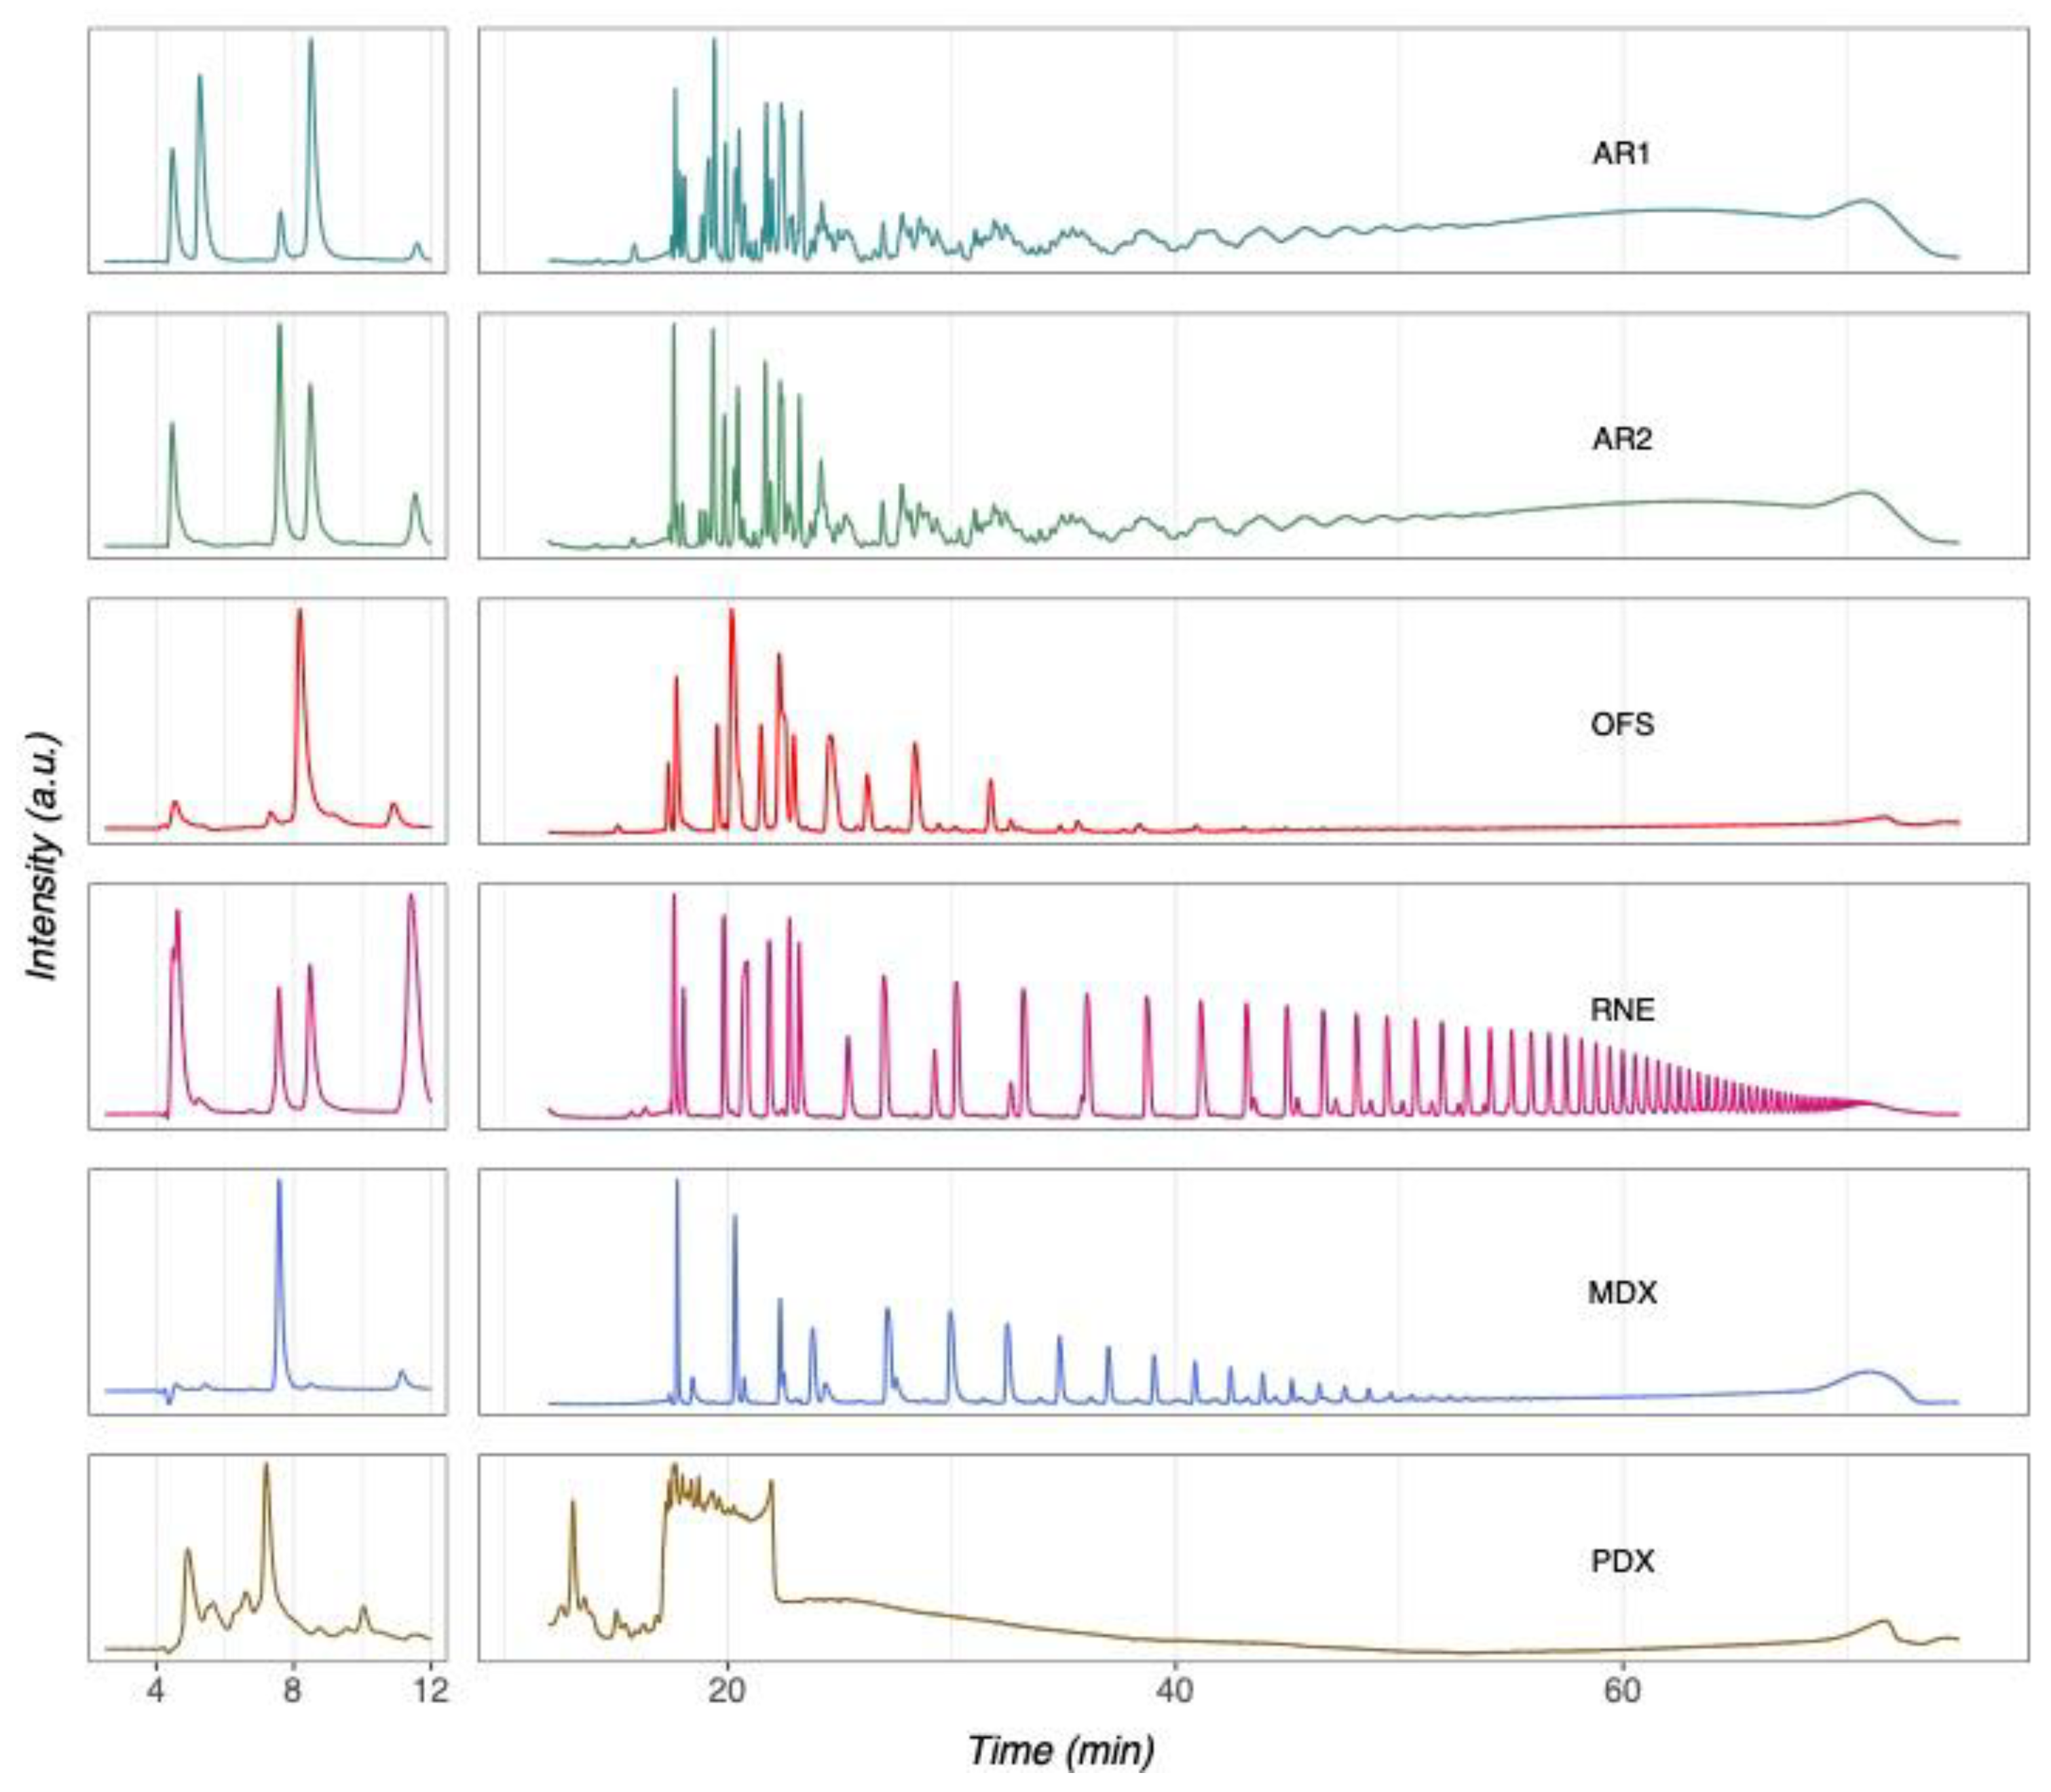
Figure 6.
HPAEC-PAD patterns of twelve commercial products labeled as purely natural agave inulin. All chromatograms were normalized based on the highest peak abundance.
Figure 6.
HPAEC-PAD patterns of twelve commercial products labeled as purely natural agave inulin. All chromatograms were normalized based on the highest peak abundance.
Disclaimer/Publisher’s Note: The statements, opinions and data contained in all publications are solely those of the individual author(s) and contributor(s) and not of MDPI and/or the editor(s). MDPI and/or the editor(s) disclaim responsibility for any injury to people or property resulting from any ideas, methods, instructions or products referred to in the content. |
© 2025 by the authors. Licensee MDPI, Basel, Switzerland. This article is an open access article distributed under the terms and conditions of the Creative Commons Attribution (CC BY) license (http://creativecommons.org/licenses/by/4.0/).
Copyright: This open access article is published under a Creative Commons CC BY 4.0 license, which permit the free download, distribution, and reuse, provided that the author and preprint are cited in any reuse.


