
Submitted:
11 March 2025
Posted:
11 March 2025
You are already at the latest version
Abstract
Argan oil is known wordwide for its nutritional, therapeutic and cosmetic benefits. However, the extraction process produces 40-50% of Argan Press Cake (APC), which is rich in protein, fiber, and minerals. Despite its nutritional potential,the high saponin content of APC imparts a bitter taste and anti-nutritional properties, making it unsuitable for human consumption and often wasted. This study addresses this issue by using boiling treatments with citric acid (CA) and distilled water (DW) to reduce the saponin content, while evaluating the impact on APC quality. In addition , the study explores for the first time, the incorporation of treated argan press cake, APC-CA and APC-DW, at different levels (5%, 10%, 15% and 20%) into whole wheat flour (WWF) for bread production to improve the nutritional profile. The results indicate that both treatments significantly reduce saponin content while maintaining nutritional quality comparable to untreated APC. This includes a 50% reduction in phytic acid levels. The absence of tryptophan fluorescence emission was observed in APC-CA, which may be related to chemical degradation or interactions with other molecules. Substitution of APC-CA and APC-DW increased the protein of composite flours in a level-dependent manner. At substitution levels up to 10%, APC-CA and APC-DW positively influenced the technological properties of the bread. This study demonstrates the potential of APC to improve the nutritional value of bread and supports zero-waste initiatives by reusing by-products.
Keywords:
Argan press cake
; bread
; Mixograph
; consumer evaluation
; waste management
1. Introduction
The argan tree (Argania spinosa (L) Skeels), an endemic species of southwestern Morocco, is cultivated by 235 development units and involves 2 million beneficiaries in rural areas. There are 16 production areas, 375 cooperatives, 450 companies, 6 EIGs, and 3 unions [1]. It is a a multipurpose tree that plays a crucial socio-economic and environmental role for the Moroccan Berber population. Argan oil is the main important product internationally known for its nutritional properties as well as its therapeutic and cosmetic benefits, which are highly valued and sought after by the cosmetic industry [2,3]. According to Zeghlouli et al. [4]., 35 kg of argan fruit yields about 1 L of argan oil so the production process generates substantial amounts of biomass, including about 39% of pulp; 53 % of shells and 6% of seeds [5,6,7]. During the argan oil production process, 2% of argan press cake is generated [8] which is mostly wasted or used as animal feed [9].
Several studies have been conducted to demonstrate the importance of the APC. It has various applications, including shampoo production, treatment of sprains and scabies treatment and wound healing. In addition , it has an inhibitory effect on melanogenesis in B16 melanoma cells [10]. APC is also used as a nano-adsorbent [3], and there are ongoing efforts to valorize it by extracting of the saponins. Various applications are being investigated, including emulsifying [2] and anti-hyperglycemic agents [4].
The APC contains high levels of protein (41-47%), dietary fiber (16-17%), carbohydrate (9-12%), and crude lipid (18-23%) [4,11]. However, its use in nutrition is limited [12], due to the presence of saponins (4%, which have been shown to inhibit digestive enzymes such as amylase, glucosidase, trypsin, chymotrypsin, and lipase. These inhibitory effects could potentially contribute to health problems associated with indigestion [13] and reduce the availability of essential micronutrients in the human diet [14].
For this purpose, the aim of this study is to reduce the saponin content of APC using hot water or a hot citric acid solutionThe efficacy of these solutions was then evaluated by incorporating the treated APC into whole wheat flour to produce bread. This study then provides insight into the potential use of argan press cake as a functional ingredient that can reduce waste from argan oil production.
2. Materials and Methods
2.1. Chemical Reagents
All chemical reagents were of analytical grade and were provided by Sigma-Aldrich, St. Louis, MO, USA.
2.2. Raw Materials
The whole wheat flour (WWF) used in this study was produced from ‘LINA’, a bread wheat variety (Triticum aestivum L.) obtained from the INRA in Rabat (Morocco). The APC was obtained from an argan oil producing cooperative located in the Taroudant region of southwestern Morocco. A cyclone mill (UDY Corporation, Fort Collins, CO, USA) was used to produce fine flour with uniform particle size.
2.3. APC Treatment
The saponin content of APC was reduced using hot distilled water (DW) or a hot solution of citric acid (1%; CA). This process was performed at 90 °C for 10 min using a reflux system. After the treatment, the solutions were separated from the APC by vacuum filtration. The APC cake was rinsed with distilled water and dried in a hot air oven at 40 °C. The resulting powder samples were stored in hermetically sealed plastic containers at 25 °C for future use.
2.4. Proximate Analysis
Proximate analysis of whole wheat flour and mixed flours was performed according to the approved methods of the American Association of Cereal Chemists (AACC, 2000). Total nitrogen was determinedby the Kjeldahl method and then multiplied by the conversion factor to determine protein content (Method 46–13). Acid hydrolysis with 1.25% H2SO4 followed by alkaline hydrolysis with 1.25% NaOH was used to determine crude fiber (Method 32-10). Total ash was determined by high temperature combustion at 585 °C (Method 08-01). Moisture content was determined by drying the samples at 130 °C to constant weight (Method 44-15). Samples were exhaustively extracted by Soxhlet using hexane as solvent to determine crude fat (Method 30-25). All analyses were performed in triplicate.
2.5. Mineral Content
Mineral concentrations were measured according to a previously published method [15]. Briefly, 0.5 g of each sample was weighed into a glass tube and then 6 mL of 65% nitric acid was added. The prepared mixture was then placed in the digestion block (QBlock series, Ontario, Canada) and after 1 hour of heating at 90°C, 3 mL of hydrogen peroxide 30% was added to each tube. The mixture was further heated at 90°C for 15 min. Then 3mL of 6 M hydrochloric acid was added to each sample tube. At the end, a clear solution was obtained, which was then transferred to a volumetric flask and diluted with ultrapure water to a volume of 10 mL. Calcium, zinc, and iron were analyzed using the Inductively Coupled Plasma ICP Ultima 2 (Horiba Jobin Yvon, Longjumeau, France), and calibration curves were constructed using serial dilutions from 0.1 to 100 mgL−1.
2.6. Phytic Acid Content
For the evaluation of phytic acid content in a 50 mL vial, 1 g of each sample was digested with 20 mL of 0.66 M HCl solution and stirred overnight at room temperature to release the inorganic phosphorus from the phytic acid. The phosphorus content was the determined using a Megazyme Phytic Acid Assay Kit (Megazyme, Wicklow, Ireland). The phytic acid content of the samples was calculated using the following formula:
The molar ratios phytic acid/iron and phytic acid/zinc were calculated according to the following equation:
where: PA is phytate acid content; MWPA is PA molecular weight (660.04 g mol−1); MN is micronutrient content (zinc or iron); MWMN is micronutrient molecular weight (Zn = 65.4 g mol−1; Fe = 55.85 g mol−1).
2.7. Saponin Content
Twenty grams of each sample was placed in a conical flask and 100 mL of aqueous ethanol (80/20 v/v) was added. The mixture was then heated in a water bath (Büchi Labortechnik AG, Flawil, Switzerland) at approximately 55°C for 4 hours with continuous stirring. The mixture was filtered through a paper filter to separate the extract from the residue. The residue was re-extracted with 200 mL of aqueous ethanol (80/20 v/v). The two extracts were mixed and then reduced to 40 mL using a water bath at 90°C. Forty milliliters of the extract was transferredto a 250 mL separating funnel, and then 20 mL of diethyl ether was added. The mixture was the shaken vigorously to allow the separation of the saponins into the aqueous phase, and the ether layer was discarded. The purification process was repeated again by shaking the mixture again with diethyl ether. Then, 60 mL of n-butanol were added to the aqueous layer obtained in the previous step. After shaking the mixture, the n-butanol extract was washed twice with 10 mL of 5% aqueous sodium chloride. The remaining solution obtained in the previous step was heated in a water bath to evaporate the solvent and to remove the n-butanol. Finally, the resulting sample was dried in an oven until a constant weight was obtained. The saponin content of the dried sample was then calculated [16].
2.8. Fluorescence Spectroscopy
Fluorescence analysis was performed using a Fluoro-Max-4 spectrofluorometer (Thermo-Scientific, Horiba, France), equipped with a 150 W xenon lamp, and a Haake A25 AC 200 temperature controller, with the angle of incidence of the excitation radiation is set at 60° to reduce the reflected light. Fluorescence emission spectra were recorded at 20 °C between 270-650 nm, with excitation wavelengths between 250-602 nm, respectively.
2.9. Infrared Spectroscopy Measurements
Fourier Transform Infrared (FTIR) spectroscopy was used to provide information on the treatment effect on the protein network of APC. Spectra were recorded at room temperature (25 °C) between 4000 and 400 cm−1 with a resolution of 4 cm−1 using an IRTracer-100 Fourier transform spectrometer (Shimadzu, Duisburg, Germany) mounted with an attenuated total reflection (ATR) accessory equipped with a handle (Pike Technologies, Madison, WI, USA). The ATR cell was made of a diamond crystal. Before each measurement, the spectrum of the diamond crystal was recorded and used as a background. Between different sample measurements, the crystal was carefully cleaned with ethanol and ultrapure water. Further data processing was performed according to [17] to obtain the second derivative function of the spectral region between 1550 and 1700 cm-1. The relevant contribution of the obtained sub-bands was calculated by the curve fitting method using the free software MagicPlotStudent 2.9.3.
2.10. Breadmaking
The APCs were used to replace whole wheat flour in the bread production at four concentrations (5, 10, 15 and 20%). For 300 g of whole wheat flour or mixed flour,s 9.0 g of of olive oil, 12 g of sucrose, 6 g of sodium chloride and 95 ml of water were added. The breads were prepared using a household bread maker Backmeister 68511 (Unold, Hockenheim, Germany). Each sample received 3% freeze-dried yeast and underwent a "basic" program with the following steps: preheating for 17 minutes, initial kneading for 5 minutes, secondary kneading for 13 minutes, first proofing for 45 minutes, smoothing for1 minute g, second proofing for 18 minutes, another 1 minute of smoothing, third proofing for 45 minutes, and finally, baking for 55 minutes.
2.11. Technological Quality Parameters
The color of flour and bread was determined using a Chroma Meter CR 400 (Konica Minolta-Carrieres-sur-seine, France). The instrument was calibrated against a white calibration plate. Gluten strength was estimated by SDS-Sedimentation according to the international standard ISO 5529. This method requires 1 g of each sample in a solution based on 6 mL of 3% sodium dodecyl sulfate with 6 mL of 1.3 N lactic acid and in the presence of bromophenol blue This test is based on the measurement of the volume of deposit formed afterstirring and swelling [18].
2.12. Mixograph
The mixing properties of wheat flour without and with the addition of APC flour were evaluated using a mixograph (National Mfg. Co., Lincoln, NE). Water absorption, mixing time and peak height of the tested composite flours were measured according to AACC Method 54–40.02 (AACC, 1999).
2.13. Loaf Volume
Loaf volume was determined using rsubstitute rapeseed seeds according to the Method 10-05 (AACC, 2000). Each loaf of bread was placed in a 4 dm3 beaker and rapeseed was added from a graduated cylinder until the beaker was full and the volume of the bread was determined.
2.14. Image Analysis for Crumb Characteristics
Bread images were captured using CanoScan LiDE 220 scanner (Canon, Tokyo, Japan) and stored in JPEG format. Image analysis was performed using ImageJ software (version 1.46d). The center of each section was cut into a 10 × 10 cm2 square and subjected to binarization analysis. The software measured the total number of cells, total cell area, average cell area, and porosity which are defined as the ratio of cell area to total area.
2.15. Statistical Analysis
Results are summarized as mean (n=3) ± standard deviation. ANOVA and Tukey’s post-hoc test were used to compare differences between means at p < 0.05 using the SPSS software version 25.0. Pearson’s correlation coefficient (r) was calculated using the Metan package. Principal component analysis (PCA) was performed using the Factoextra and FactoMineR packages with RStudio version 1. 3.1093.
3. Results and Discussion
3.1. Characterization of APC
A significant difference (p < 0.05) was observed between untreated (UAPC) and treated APC samples in several parameters (Table 1). In particular, the saponin content showed a significant reduction, with decreases of approximately 83% and 75% for APC-CA and APC-DW, respectively, compared to the initial value in UAPC. This can be attributed to the effectiveness of heat treatment in reducing saponin content, as demonstrated by numerous studies aimed at reducing antinutritional composition [15,19]. The use of a citric acid solution was found to be more effective than distilled water in reducing saponin levels. This can be explained by the ability of saponins to form complexes with metal ions [20]. For example, citric acid acts as a chelating agent and forms a complexes with metal ions [21]. Phytic acid, also known as phytate or myoinositol 1,2,3,4, S,6-hexakis dihydrogen phosphate, is a common component of legumes, seeds, and grains. Phytic acid can reduce the bioavailability of minerals and the digestibility of proteins and carbohydrates, by inhibiting the normal activity of digestive enzymes such as pepsin, trypsin, and amylase. Phytic acid acts as a chelating agent for cations and is a form of cation as well as for phosphorus storage agent in many seeds [22]. In our study, phytic acid levels were reduced by approximately 36% in both treatments, indicating effective removal. These results are consistent with those of a previous study that investigated the effect of washing, soaking, and malting processes on the level of phytic acid in sorghum [23]. The study reported reductions in phytic acid levels of 15.6%, 43.7%, and 54.9%, respectively. In addition, boiling maize products in distilled water and roasting them reduced the phytic acid levels by approximately 18.9% and 23.7%, respectively [24]. The reduction in phytic acid can be attributed to the heat treatment, which facilitates phytase hydrolysis [28, 29]. A slight decrease in protein content was observed, with reductions of only 0.6% for APC-CA and 1.7% for APC-DW relative to UAPC. Protein content was not significantly affected by processing method as previously reported [26]. However, our results are in contrast to those of Moutik et al. [7], who reported a significant decrease in soybean protein content with the use of citric acid. This discrepancy may be due to differences in treatment duration. Both treatments significantly reduced lipid, ash and fiber content. The reductions were about 35%, 9% and 9% respectively for CA and 25%, 38% and 19% for DW. The large reduction in lipid can be attributed to the increased activity of lipolytic enzymes. These enzymes facilitate the breakdown of triacylglycerols into simpler compounds, including fatty acids, sterol esters, and polar lipids [28]. Fiber content was reduced to a greater extent with a citric acid solution than with a distilled water solution. This finding is consistent with a study by Wanjekeche et al. [29] who reported a 26% and 52%reduction in dietary fiber content when Mucuna pruriens was boiled in citric acid and distilled water, respectively. In contrast, the results of [30], who investigated the effect of different concentrations of CA (1% or 3%) and a drying temperature of 65°C on sweet potato flour, reported that the fiber content was significantly increased. In addition, the treatment process reduced the moisture content by 10% with citric acid and 20% with distilled water. These results are in agreement with those reported by Kumar et al. [20], who observed a 7% reduction in the initial moisture content of mushrooms after soaking in a 5% citric acid solution.
With respect to mineral content, the treatments had contrasting effects: iron content increased by 33.3% for APC-CA and 51.7% for APC-DW, while calcium content decreased by 19.8% and 32.7%, respectively. Zinc showed different trends, with a 47% decrease in APC-CA and a 47.6% increase in APC-DW. The phytate/iron and zinc molar ratios, showed significant changes: the phytate/iron ratio was reduced by 51.6% for APC-CA and 58.8% for APC-DW, while the phytate/zinc ratio increased by 31% for APC-CA but decreased by 57.4% for APC-DW. However, our results, consistent with those of Alajaji and Adawy [31] who showed that boiling chickpea in water results in a significant loss of calcium, with a reduction of up to 30%. Therfore, it is important to consider alternative cooking methods in order to preserve the calcium content. Another study on theeffect of thermal processing on the mineral content of African walnut kernels showed a significant reduction of 71% in calcium content [32]. The bioavailability of iron is known to be influenced by various dietary components, including inhibitors such as phytic acid, tannins, dietary fiber, and calcium. Conversely, organic acids, on the other hand, are known to promote iron absorption [33]. Previous research suggests that the addition of phytase, citric acid, and ascorbic acid significantly improves the iron availability [34]. Our results show that the pre-treatment methods positively affected the concentration of iron in the APC, which may have implications for its use in preventing nutritional deficiencies.
Color is an important charachteristic in the assessment of flour quality for the production of many products [35]. Color measurements revealed significant differences (p < 0.05) between treated and untreated samples. Lightness (L*) decreased slightly by about 2.5% for APC-CA and 0.8% for APC-DW. Redness (a*) showed a slight decrease of approximately 3.5% and 7% for APC-CA and APC-DW, respectively. However, no significant change was observed in the yellowing (b*) was observed between treatments. Our results are similar to those of Ngoma et al. [36], who observed a decrease in L* value due to the application of citric acid. The reduction in L* can be attributed to several potential factors, including changes in carotenoid content, oxidative processes, caramelization reactions, or changes in phenolase activity [37]. The appearance of browning indicates a decrease in clarity , which is associted with the formation of brown pigments due to non-enzymatic reactions (Maillard reaction) generated by heat treatments [38]. The increase in b* (yellowness) when distilled water and citric acid are heated may be due to the Maillard reaction, which is a complex series of chemical reactions between amino acids (from proteins) and reducing sugars [39]. This reaction is responsible for the browning and development of a yellow to brown color in various foods when cooked or heated. The Maillard reaction results in the production of yellow and brown pigments, which contribute to an increase in color value. Overall, industrial food by-products represent are an excellent source of functional ingredients [40].
In this work for the first time, the secondary protein structure of APC was studied, revealing a profile similar to that of other oil-cakes [41]. The APC protein is composed of approximately 41% albumins and 50% globulins of the total extractable protein. Disulfide bonds are the key to stabilize the protein structure, while gluten and gliadin are less. Figure 1 shows the FTIR normalized full spectra of UAPC and treated APC. The peaks recorded in the region between 1300 and 1400 cm−1 are attributed to nitrogen, the main component of the proteins. The bands in the 1700–1500 cm−1 region are associated with protein molecules and are attributed to the amide I (80% CC = O stretch, 10% C–N stretch) and amide II (60%NH stretch, 30%C-N stretch, and 10% C–C stretch) bond vibrations [42,43]. The spectra were analyzed in the amide I region, which provides the most information about the secondary structure of proteins, and it was observed that heat treatment does not cause the transformation of major functional groups. The spectra of UAPC, APC-CA and APC-DW were similar. Boiling treatment of APC also affected the amide I and II absorbances, indicating changes in the protein structures due to the high temperature applied. Using the second derivative signal of the amide I (Figure 2), absorbances centered in the regions 1620–1644 and 1680- 1700 cm− 1 were attributed to β-sheet conformation, 1660-1680 cm−1 to β-turn conformation, 1650-1665 cm− 1 to α-helix, 1644-1652 cm−1 to random coils [42,43]. ~1613 cm−1 to pseudo-β-sheet [44]. The relative proportions of each secondary structure for each sample are shown in Figure 2d. The protein in UAPC contained β-sheet (31.8 % of the total secondary structure) as one of the major secondary structures. Heat treatments on distilled water led to a decrease in β-sheet, α-helix, while β-turn and random coil showed the opposite trend. Citric acid treatment led to a decrease in β-sheet and an increase in β-turn, while it did not significantly affect α-helix and random coil structure. Pseudo-β-sheet showed a small reduction for both treatments, (from 28% to 26%) and (from 28% to 27%) for APC-CA and APC-DW, respectively. Similar results were found in the study of the effect of heat treatment on the secondary structure of camelina seed protein and quinoa protein isolates [49, 50], probably due to the denaturation of the proteins due to the destruction of the hydrogen bonds between peptides leading to the transformation of the α-helix and β-sheet into β-turn and random coil [47,48]. In the case of citric acid treatment, which lowers the pH to an acidic range, a decrease in the content of β-sheet, α-helix, and pseudo-β-sheet content was observed, while the content of β-turn increased. However, these results contrast with those of Wang et al. [49], who reported that acidic conditions decreased α-helix content and increased β-sheet content. On the other hand, the study by Uranga et al. [50], observed that citric acid-incorporated fish gelatin/chitosan, showed a decrease in the content of the β-sheet conformation and an increase in the α-helix/random coil. From this perspective, changes in the molecular conformation of the α-helix and β-sheet may be due to the high hydrogen bond content originating from citric acid. This citric acid can potentially replace the hydrogen bonds that typically form between different protein chains and between protein chains and water molecules. Consequently, this can lead to an increase in α-helix and a decrease in other structural forms [51].
The study of intrinsic fluorescence provides a means of investigating chemical changes associated with the treatment process[52]. Figure 3 shows the fluorescence excitation and emission spectra of APC before and after treatment. Two characteristic regions are observed in the spectra of UAPC and APC-DW (regions I and II), while APC-CA is characterized by one region (region II). One region (region I), corresponding to tryptophan emission (386 nm < λ < 400 nm) [53], while the other (region II), corresponding to fluorescence emission from non-protein compounds, with an Em peak located at (405 < λem < 650 nm), was contributed by riboflavin [54], with UAPC exhibiting region I (λEx = 280-310 nm, λEm = 360-390 nm) and region II (λEx = 370-440 nm, λEm = 440-510 nm). Treatment with distilled water caused a slight shift in tryptophan emission, resulting in region I (λEx = 285-315 nm, λEm = 360-400 nm) and region II (λEx = 370-480 nm, λEm = 445-555 nm) for APC-DW. In contrast, APC-CA exhibited only region II (λEx = 450-490 nm, λEm = 510-575 nm) with showed a shift compared to UAPC, while region I was absent. When the proteins unfold, the buried tryptophan residues are exposed to a more polar environment. Boiling with distilled water causes a shift in the maximum emission wavelength of tryptophan of about 10 nm. These emission spectrum results are in agreement with the findings of [59, 60]. A shift of the fluorescence emission peak to longer wavelengths indicates that the tryptophan side chains move from a hydrophobic to a hydrophilic environment. In general, a maximum fluorescence emission wavelength (λmax) of <330 nm indicates that tryptophan residues are embedded in a hydrophobic environment, whereas λmax > 330 nm indicates exposure to the aqueous environment [57]. Missing tryptophan fluorescence intensity region in APC-CA, might be caused by more conformational changes at acidic pH as described by Abdollahi and Pezeshk. [58,59], also reported that tryptophan fluorescence intensity in acid-produced protein isolate of kilka and rainbow, due to the interaction of polysaccharides with the polar parts of proteins, which exposed more tryptophan residues and shifted them to a more hydrophobic environment under acidic condition [64, 65].
3.2. Characterization of Flour Blends
When comparing the proximate composition of different blends of whole wheat flour (WWF) with APC-CA and APC-DW, it was found that they were statistically different (Table 2). Protein, ash, lipids, fiber and the essential minerals iron, zinc and calcium were increased in all flour blends, indicating an improvement in nutritional value. Previous studies have also demonstrated an increase in nutritional quality with the incorporation of seeds, and press cake flour by-products such as, moringa seeds, flaxseed cake, hemp seeds, and beniseed [62,63,64,65]. However, a significant reduction in moisture content was observedOn the other hand, phytic acid levels and PA/Fe and PA/Zn molar ratios increased slightly, suggesting a potential reduction in mineral bioavailability despite higher mineral content. These trade-offs highlight the need for a balanced approach to optimize nutritional and functional qualities. The addition of APC-CA and APC-DW also significantly increased color values (L* and a*).
The Mixograph provides invaluable insight into the dynamics of dough development and gluten formation. The duration of the mixing process is a crucial aspect in the baking industry, as it directly affects the quality of the final product.
Table 3 shows the variations in mixing peak height, mixing peak time, water absorption, and gluten strength for the WWF and the mixes with APC-CA and APC-DW. The results indicate that the WWF had the lowest water absorption of 63,40%. However, all the composite flours had higher water absorption as the proportion of APC content increased from 5% to 20%. This value further increased in both APC-CA, and APC-DW with a range of 64.4% to 66.9% and 64.5% to 67.6%, respectively. Furthermore, it was observed that the use of distilled water for treatment resulted in an increase in water absorption of almost 1% compared to citric acid treatment for all composites. The peak mixing time required for dough development, ranged between 3.06 and 4.72 min for different flour blends, it was determined that two treated argan press cakes, have remarkably reduced mixing time. The lowest value of 3.90 min was registered for the flour blend containing 20% APC-CA, while the highest mixing time of 4.72 min was observed for WWF. It can observed that the gluten straight, of WWF decreased as the incorporation ratio increased.
The results of this study indicate that the enrichment of whole wheat flour with treated APC resulted in a decrease in mixing time and an increase in water absorption compared to whole wheat flour alone. This trend was also observed in bread made from wheat and peanut flour [67]. This can be attributed to the rapid formation of the gluten network in the dough, resulting in a reduced need for prolonged mixing due to the gluten-free flour. The observed increase in water absorption, which correlates with the higher APC-CA and APC-DW proportions, can be attributed to the increased fiber content present in these composite flours. This is because the fibers contain a greater number of hydroxyl groups, which form stronger bonds with water. The difference in water absorption between APC-DW and APC-CA can be attributed to the influence of citric acid, as previously mentioned by Gupta et al., [68]. This leads to changes in the rheological properties of the dough, a phenomenon that has been confirmed by previous research [73, 74]. A shorter mixing time is often desirable as it reduces energy consumption and water absorption [71].
3.3. Characterization of Bread
The bread obtained with WWF had the highest loaf volume with a value of 1150 cm3 (Table 4) The addition of 5% APC-CA did not affect the loaf volume, while the mixture of 10% APC-CA reduced the volume to 750 cm3. The loaf volume was reduced to 500 cm3 and 370 cm3 for the last two percentages, 15% and 20%, respectively, resulting in a deformed bread shape that prevented measurement of the other parameters. Blendingof APC-DW caused a reduction in loaf volume from 850 to 650 cm³ as the rate increased from 5% to 20%. The color of bread the crumb changed from white to brown with a decrease in L* and b* values from 64.03 to 56.9 and from 25,38 to 21.44 respectively, while a* increased from 4.21 to 5.71 (Figure 4). Compared to the control bread, the blended breads containing 5% (APC-CA and APC-DW) showed a statistically significant decrease in the number of cells, while the average size increased. No significant changes (p<0.05) were observed in total area and porosity. Among the different breads tested (10% APC-CA, 10% APC-DW, 15% APC-DW and 20% APC-DW), the bread with 10% APC-CA showed a significant reduction in porosity and total surface area, while a high number of cells and a reduced average cell size were observed.
The reduction in bread volume can be attributed to the high fiber content, which can also form hydrogen bonds with water and inhibit gluten network formation [76,77]. Another factor contributing to the reduction in bread volume is the high protein and lipid content, which results in a reduced swelling index [74,75,76]. The color of the bread is a critical factor in consumer acceptance [77], as it affects the overall perception of the product. Similar to our findings, the effects of different legume flour additions were cumulative on the original wheat flour color [78]. During baking, the thermal profile resulted in a decrease in the L* value of the composite bread crumb, while the crumb a* and b* value increased. This fact can be attributed to the reduction in moisture content, as observed by [79]. The incorporation of two treated APCs at a level of 5% (especially of APC-CA) resulted in a significant reduction in the number of cells in the bread and an increase in the average cell size, leading to an improvement in bread quality. However, when the incorporation level exceeded 10%, a deterioration in bread quality was observed. This suggests that the gluten matrix in the dough was unable to adequately accommodate gas molecules, resulting in the formation of dense, tightly packed cells during the fermentation and baking process [80].
4. Conclusions
The present study showed that a pretreatment with hot water or a hot citric acid solution resulted in a significant reduction of saponin and phytic acid concentration in APC . The incorporation of APC-CA and APC-DW resulted in an improved nutritional profile of the produced bread with an increased level of protein, lipids, fiber and mineral content without significant change rheological profile of the dough. Then the results of this study indicate that it is possible to reduce saponine and phytic acid in the APC without significant reduction in its nutritional value and the obtained treated APC can be added to the whole wheat bread flour for the production of a bread with an higher content of protein, lipid and fiber.
Finally these results may contribute to the widespread use of APC in the food sector, capitalizing on its nutritional benefits while mitigating the undesirable aspects associated with its initial composition.
Author Contributions
For research articles with several authors, a short paragraph specifying their individual contributions must be provided. The following statements should be used “Conceptualization, H.E.M; A.E.K; and G.Z.; methodology, A.E.K; H.C and H.E.M.; software, H.C and A.E.K.; validation, B.E.K and H.E.M.; formal analysis, A.E.K; H.C; A.S and A.B. ; investigation, A.E.K; H.C; B.E.K and H.E.M; resources, B.E.K; M.T and H.E.M data curation, A.E.K and H.C.; writing—original draft preparation, A.E.K and H.E.M..; writing—review and editing, G.Z; H.C and A.S.; visualization, H.E.M; G.Z and B.E.K.; supervision, H.E.M; project administration, H.E.M and B.E.K. All authors have read and agreed to the published version of the manuscript.
Funding
This research received no external funding.
Data Availability Statement
The original contributions presented in the study are included in the article further inquiries can be directed to the corresponding author.
Conflicts of Interest
The authors declare no conflict of interest.
References
- Filière de l’argane - Fellah Trade Available online: https://www.fellah-trade.com/fr/filiere-vegetale/chiffres-cles-arganier (accessed on 21 March 2024).
- El Monfalouti, H.; Guillaume, D.; Denhez, C.; Charrouf, Z. Therapeutic Potential of Argan Oil: A Review. J. Pharm. Pharmacol. 2010, 62, 1669–1675. [CrossRef]
- Moutik, S.; Benali, A.; Bendaou, M.; Maadoudi, E.H.; Kabbour, M.R.; El Housni, A.; Es-Safi, N.E. The Effect of Using Diet Supplementation Based on Argane (Argania Spinosa) on Fattening Performance, Carcass Characteristics and Fatty Acid Composition of Lambs. Heliyon 2021, 7, e05942. [CrossRef]
- Zeghlouli, J.; Guendouz, A.; Duchez, D.; El Modafar, C.; Michaud, P.; Delattre, C. Valorization of Co-Products Generated by Argan Oil Extraction Process: Application to Biodiesel Production. Biofuels 2022, 13, 771–777. [CrossRef]
- Demnati, D.; Sánchez, S.; Pacheco, R.; Zahar, M.; Martínez, L. Comparative Study of Argan and Olive Fruits and Oils. Actes Prem. Congrès Int. L’Arganier 2011, 7, 435–441.
- El Monfalouti, H.; Charrouf, Z.; Belviso, S.; Ghirardello, D.; Scursatone, B.; Guillaume, D.; Denhez, C.; Zeppa, G. Analysis and Antioxidant Capacity of the Phenolic Compounds from Argan Fruit ( Argania Spinosa (L.) Skeels). Eur. J. Lipid Sci. Technol. 2012, 114, 446–452. [CrossRef]
- Rahib, Y.; Sarh, B.; Chaoufi, J.; Bonnamy, S.; Elorf, A. Physicochemical and Thermal Analysis of Argan Fruit Residues (AFRs) as a New Local Biomass for Bioenergy Production. J. Therm. Anal. Calorim. 2020, 145, 2405–2416. [CrossRef]
- Zouhair, F.Z.; Benali, A.; Kabbour, M.R.; EL Kabous, K.; El Maadoudi, E. haj; Bouksaim, M.; Essamri, A. Typical Characterization of Argane Pulp of Various Moroccan Areas: A New Biomass for the Second Generation Bioethanol Production. J. Saudi Soc. Agric. Sci. 2020, 19, 192–198. [CrossRef]
- Hilali, M.; Bey, M.; Oubarka, S.; Lebkiri, A. Effects of Argan Cake (Argania Spinosa (L.,) Saptaceae) Substitution on the Growth Performance, Nutritional Value, and Economic Efficacy of Broiler Chickens. J. Glob. Innov. Agric. Sci. 2022, 10, 55–60. [CrossRef]
- Kotecka-Majchrzak, K.; Sumara, A.; Fornal, E.; Montowska, M. Oilseed Proteins – Properties and Application as a Food Ingredient. Trends Food Sci. Technol. 2020, 106, 160–170. [CrossRef]
- El Abbassi, A.; Khalid, N.; Zbakh, H.; Ahmad, A. Physicochemical Characteristics, Nutritional Properties, and Health Benefits of Argan Oil: A Review. Crit. Rev. Food Sci. Nutr. 2014, 54, 1401–1414. [CrossRef]
- Charrouf, Z.; Wieruszeski, J.M.; Fkih-Tetouani, S.; Y, L.; Charrouf, M.; Fournet, B. Triterpenoid Saponins from Argania Spinosa. Phytochemistry 1992, 31, 2079–2086. [CrossRef]
- Ali, H.; Houghton, P.J.; Soumyanath, A. α-Amylase Inhibitory Activity of Some Malaysian Plants Used to Treat Diabetes; with Particular Reference to Phyllanthus Amarus. J. Ethnopharmacol. 2006, 107, 449–455. [CrossRef]
- Wang, N.; Daun, J. Effects of Variety and Crude Protein Content on Nutrients and Anti-Nutrients in Lentils (). Food Chem. 2006, 95, 493–502. [CrossRef]
- Thavarajah, P.; Thavarajah, D.; Vandenberg, A. Low Phytic Acid Lentils (Lens Culinaris L.): A Potential Solution for Increased Micronutrient Bioavailability. J. Agric. Food Chem. 2009, 57, 9044–9049. [CrossRef]
- Edeoga, H.O.; Okwu, D.E.; Mbaebie, B.O. Phytochemical Constituents of Some Nigerian Medicinal Plants. Afr. J. Biotechnol. 2005, 4, 685–688. [CrossRef]
- Bosmali, I.; Kotsiou, K.; Matsakidou, A.; Irakli, M.; Madesis, P.; Biliaderis, C.G. Fortification of Wheat Bread with an Alternative Source of Bean Proteins Using Raw and Roasted Phaseolus Coccineus Flours: Impact on Physicochemical, Nutritional and Quality Attributes. Food Hydrocoll. 2025, 158, 110527. [CrossRef]
- International Organization for Standardization. ISO 5529:2007 Wheat—Determination of the Sedimentation Index—Zeleny Test; International Organization for Standardization: Geneva, Switzerland, 2007.
- Hussain, M.; Saeed, F.; Niaz, B.; Afzaal, M.; Ikram, A.; Hussain, S.; Mohamed, A.A.; Alamri, M.S.; Anjum, F.M. Biochemical and Nutritional Profile of Maize Bran-Enriched Flour in Relation to Its End-Use Quality. Food Sci. Nutr. 2021, 9, 3336–3345. [CrossRef]
- Kumar, A.; Singh, M.; Singh, G. Effect of Different Pretreatments on the Quality of Mushrooms during Solar Drying. J. Food Sci. Technol. 2013, 50, 165–170. [CrossRef]
- Shinta, Y.C.; Zaman, B.; Sumiyati, S. Citric Acid and EDTA as Chelating Agents in Phytoremediation of Heavy Metal in Polluted Soil: A Review. IOP Conf. Ser. Earth Environ. Sci. 2021, 896, 012023. [CrossRef]
- Urbano, G.; López-Jurado, M.; Aranda, P.; Vidal-Valverde, C.; Tenorio, E.; Porres, J. The Role of Phytic Acid in Legumes: Antinutrient or Beneficial Function? J. Physiol. Biochem. 2000, 56, 283–294. [CrossRef]
- Mahgoub, S.E.O.; Elhag, S.A. Effect of Milling, Soaking, Malting, Heat-Treatment and Fermentation on Phytate Level of Four Sudanese Sorghum Cultivars. Food Chem. 1998, 61, 77–80. [CrossRef]
- Khan, N.; Zaman, R.; Elahi, M. Effect of Heat Treatments on the Phytic Acid Content of Maize Products. J. Sci. Food Agric. 1991, 54, 153–156. [CrossRef]
- Beal, L.; Mehta, T. Zinc and Phytate Distribution in Peas. Influence of Heat Treatment, Germination, pH, Substrate, and Phosphorus on Pea Phytate and Phytase. J. Food Sci. 1985, 50, 96–100. [CrossRef]
- Lakram, N.; Zouhair, F.Z.; Ennahli, Y.; Moutik, S.; Mohamed, B.; Naciri, M.; ELMAADOUDI, El.; Housni, A.; Kabbour, M. The Impact of Optimizing the Detoxification of Argane (Argania Spinosa) Press Cake on Nutritional Quality and Saponin Levels. 2019, 9, 235–246.
- Sharma, S.; Goyal, R.; Barwal, S. Domestic Processing Effects on Physicochemical, Nutritional and Anti-Nutritional Attributes in Soybean (Glycine Max L. Merill). Int. Food Res. J. 2013, 20.
- Effect of Different Processing Methods, on Nutrient Composition, Antinutrional Factors, and in Vitro Protein Digestibility of Dolichos Lablab Bean [Lablab Purpuresus (L.) Sweet]. Pak. J. Nutr. 2007.
- Wanjekeche, E.; Wakasa, V.; Mureithi, J.G. Effect of Germination, Alkaline and Acid Soaking and Boiling on the Nutritional Value of Mature and Immature Mucuna (Mucuna Pruriens) Beans. Trop. Subtrop. Agroecosystems 2003, 1, 183–192.
- Kuyu, C.G.; Tola, Y.B.; Mohammed, A.; Ramaswamy, H.S. Determination of Citric Acid Pretreatment Effect on Nutrient Content, Bioactive Components, and Total Antioxidant Capacity of Dried Sweet Potato Flour. Food Sci. Nutr. 2018, 6, 1724–1733. [CrossRef]
- ALAJAJI, S.A.; EL-ADAWY, T.A. Nutritional Composition of Chickpea (Cicer Arietinum L.) as Affected by Microwave Cooking and Other Traditional Cooking Methods. Nutr. Compos. Chickpea Cicer Arietinum Affect. Microw. Cook. Tradit. Cook. Methods 2006, 19, 806–812.
- Tonfack Djikeng, F.; Selle, E.; Morfor, A.T.; Tiencheu, B.; Hako Touko, B.A.; Teboukeu Boungo, G.; Ndomou Houketchang, S.; Karuna, M.S.L.; Linder, M.; Ngoufack, F.Z.; et al. Effect of Boiling and Roasting on Lipid Quality, Proximate Composition, and Mineral Content of Walnut Seeds (Tetracarpidium Conophorum) Produced and Commercialized in Kumba, South-West Region Cameroon. Food Sci. Nutr. 2018, 6, 417–423. [CrossRef]
- Platel, K.; Srinivasan, K. Bioavailability of Micronutrients from Plant Foods: An Update. Crit. Rev. Food Sci. Nutr. 2016, 56, 1608–1619. [CrossRef]
- Porres, J. m.; Etcheverry, P.; Miller, D. d.; Lei, X. g. Phytase and Citric Acid Supplementation in Whole-Wheat Bread Improves Phytate-Phosphorus Release and Iron Dialyzability. J. Food Sci. 2001, 66, 614–619. [CrossRef]
- Zhang, K.-P.; Chen, G.-F.; Zhao, L.; Liu, B.; Xu, X.-B.; Tian, J.-C. Molecular Genetic Analysis of Flour Color Using a Doubled Haploid Population in Bread Wheat (Triticum Aestivum L.). Euphytica 2009, 165, 471–484. [CrossRef]
- Ngoma, K.; Mashau, M.E.; Silungwe, H. Physicochemical and Functional Properties of Chemically Pretreated Ndou Sweet Potato Flour. Int. J. Food Sci. 2019, 2019, 1–9. [CrossRef]
- Ameny, M.A.; Wilson, P.W. Relationship between Hunter Color Values and β-Carotene Contents in White-Fleshed African Sweetpotatoes (Ipomoea Batatas Lam). J. Sci. Food Agric. 1997, 73, 301–306. [CrossRef]
- Akyıldız, A.; Öcal, N.D. Effects of Dehydration Temperatures on Colour and Polyphenoloxidase Activity of Amasya and Golden Delicious Apple Cultivars. J. Sci. Food Agric. 2006, 86, 2363–2368. [CrossRef]
- Singh, K.; Tripathi, S.; Chandra, R. Maillard Reaction Product and Its Complexation with Environmental Pollutants: A Comprehensive Review of Their Synthesis and Impact. Bioresour. Technol. Rep. 2021, 15, 100779. [CrossRef]
- Wani, A.A.; Sogi, D.S.; Singh, P.; Khatkar, B.S. Influence of Watermelon Seed Protein Concentrates on Dough Handling, Textural and Sensory Properties of Cookies. J. Food Sci. Technol. 2015, 52, 2139–2147. [CrossRef]
- Ortolan, F.; Urbano, K.; Netto, F.M.; Steel, C.J. Chemical and Structural Characteristics of Proteins of Non-Vital and Vital Wheat Glutens. Food Hydrocoll. 2022, 125, 107383. [CrossRef]
- Bock, J.E.; Connelly, R.K.; Damodaran, S. Impact of Bran Addition on Water Properties and Gluten Secondary Structure in Wheat Flour Doughs Studied by Attenuated Total Reflectance Fourier Transform Infrared Spectroscopy. Cereal Chem. 2013, 90, 377–386. [CrossRef]
- Sivam, A.S.; Sun-Waterhouse, D.; Perera, C.O.; Waterhouse, G.I.N. Application of FT-IR and Raman Spectroscopy for the Study of Biopolymers in Breads Fortified with Fibre and Polyphenols. Food Res. Int. 2013, 50, 574–585. [CrossRef]
- Nawrocka, A.; Krekora, M.; Niewiadomski, Z.; Miś, A. FTIR Studies of Gluten Matrix Dehydration after Fibre Polysaccharide Addition. Food Chem. 2018, 252, 198–206. [CrossRef]
- He, X.; Wang, B.; Zhao, B.; Meng, Y.; Chen, J.; Yang, F. Effect of Hydrothermal Treatment on the Structure and Functional Properties of Quinoa Protein Isolate. Foods 2022, 11, 2954. [CrossRef]
- Meziani, S.; Jasniewski, J.; Ribotta, P.; Arab-Tehrany, E.; Muller, J.-M.; Ghoul, M.; Desobry, S. Influence of Yeast and Frozen Storage on Rheological, Structural and Microbial Quality of Frozen Sweet Dough. J. Food Eng. 2012, 109, 538–544. [CrossRef]
- Liu, G.; Li, J.; Shi, K.; Wang, S.; Chen, J.; Liu, Y.; Huang, Q. Composition, Secondary Structure, and Self-Assembly of Oat Protein Isolate. J. Agric. Food Chem. 2009, 57, 4552–4558. [CrossRef]
- Peng, Q.; Khan, N.A.; Wang, Z.; Yu, P. Moist and Dry Heating-Induced Changes in Protein Molecular Structure, Protein Subfractions, and Nutrient Profiles in Camelina Seeds. J. Dairy Sci. 2014, 97, 446–457. [CrossRef]
- Wang, M.; Li, Y.; Ma, C.; Zhang, Z.; Guo, L.; Huang, M.; Sun, J. Stability of Native/Thermally Denatured Myofibrillar Protein Particles: Improvement with Decreasing pH. Food Hydrocoll. 2023, 140, 108628. [CrossRef]
- Uranga, J.; Puertas, A.I.; Etxabide, A.; Dueñas, M.T.; Guerrero, P.; de la Caba, K. Citric Acid-Incorporated Fish Gelatin/Chitosan Composite Films. Food Hydrocoll. 2019, 86, 95–103. [CrossRef]
- Ramirez, D.O.S.; Carletto, R.A.; Tonetti, C.; Giachet, F.T.; Varesano, A.; Vineis, C. Wool Keratin Film Plasticized by Citric Acid for Food Packaging. Food Packag. Shelf Life 2017, 12, 100–106. [CrossRef]
- Locquet, N.; Aït-Kaddour, A.; Cordella, C.B.Y. 3D Fluorescence Spectroscopy and Its Applications. In Encyclopedia of Analytical Chemistry; John Wiley & Sons, Ltd, 2018; pp. 1–39 ISBN 978-0-470-02731-8.
- Gorokhov, V.V.; Knox, P.P.; Korvatovsky, B.N.; Lukashev, E.P.; Goryachev, S.N.; Paschenko, V.Z.; Rubin, A.B. Comparison of Spectral and Temporal Fluorescence Parameters of Aqueous Tryptophan Solutions Frozen in the Light and in the Dark. Chem. Phys. 2023, 571, 111919. [CrossRef]
- Najib, M.; Botosoa, E.P.; Hallab, W.; Hallab, K.; Hallab, Z.; Hamze, M.; Delaplace, G.; Karoui, R.; Chihib, N.-E. Utilization of Front-Face Fluorescence Spectroscopy for Monitoring Lipid Oxidation during Lebanese Qishta Aging. LWT 2020, 130, 109693. [CrossRef]
- Miriani, M.; Keerati-u-rai, M.; Corredig, M.; Iametti, S.; Bonomi, F. Denaturation of Soy Proteins in Solution and at the Oil–Water Interface: A Fluorescence Study. Food Hydrocoll. 2011, 25, 620–626. [CrossRef]
- Rahimi Yazdi, S.; Corredig, M. Heating of Milk Alters the Binding of Curcumin to Casein Micelles. A Fluorescence Spectroscopy Study. Food Chem. 2012, 132, 1143–1149. [CrossRef]
- Ji, W.; Yang, F.; Yang, M. Effect of Change in pH, Heat and Ultrasound Pre-Treatments on Binding Interactions between Quercetin and Whey Protein Concentrate. Food Chem. 2022, 384, 132508. [CrossRef]
- Abdollahi, M.; Rezaei, M.; Jafarpour, A.; Undeland, I. Dynamic Rheological, Microstructural and Physicochemical Properties of Blend Fish Protein Recovered from Kilka (Clupeonella Cultriventris) and Silver Carp (Hypophthalmichthys Molitrix) by the pH-Shift Process or Washing-Based Technology. Food Chem. 2017, 229, 695–709. [CrossRef]
- Pezeshk, S.; Rezaei, M.; Hosseini, H.; Abdollahi, M. Impact of pH-Shift Processing Combined with Ultrasonication on Structural and Functional Properties of Proteins Isolated from Rainbow Trout by-Products. Food Hydrocoll. 2021, 118, 106768. [CrossRef]
- Chang, C.; Wang, T.; Hu, Q.; Luo, Y. Caseinate-Zein-Polysaccharide Complex Nanoparticles as Potential Oral Delivery Vehicles for Curcumin: Effect of Polysaccharide Type and Chemical Cross-Linking. Food Hydrocoll. 2017, 72, 254–262. [CrossRef]
- Wang, S.; Yang, J.; Shao, G.; Liu, J.; Wang, J.; Yang, L.; Li, J.; Liu, H.; Zhu, D.; Li, Y.; et al. pH-Induced Conformational Changes and Interfacial Dilatational Rheology of Soy Protein Isolated/Soy Hull Polysaccharide Complex and Its Effects on Emulsion Stabilization. Food Hydrocoll. 2020, 109, 106075. [CrossRef]
- Ikpeme, C.; Eneji, C.; Igile, G. Nutritional and Organoleptic Properties of Wheat (Triticum Aestivum) and Beniseed (Sesame Indicum) Composite Flour Baked Foods. J. Food Res. 2012, 1, 84.
- Chinma, C. e.; Gbadamosi, K. b.; Ogunsina, B. s.; Oloyede, O. o.; Salami, S. o. Effect of Addition of Germinated Moringa Seed Flour on the Quality Attributes of Wheat-Based Cake. J. Food Process. Preserv. 2014, 38, 1737–1742. [CrossRef]
- Ogunronbi, O.; Jooste, P.J.; Abu, J.O.; Van Der Merwe, B. Chemical Composition, Storage Stability and Effect of Cold-Pressed Flaxseed Oil Cake Inclusion on Bread Quality. J. Food Process. Preserv. 2011, 35, 64–79. [CrossRef]
- Sharma, S.; Prabhasankar, P. Effect of Whole Hempseed Flour Incorporation on the Rheological, Microstructural and Nutritional Characteristics of Chapati – Indian Flatbread. LWT 2021, 137, 110491. [CrossRef]
- Soares, N.F.F.; Rutishauser, D.M.; Melo, N.; Cruz, R.S.; Andrade, N.J. Inhibition of Microbial Growth in Bread through Active Packaging. Packag. Technol. Sci. 2002, 15, 129–132. [CrossRef]
- Shongwe, S.G.; Kidane, S.W.; Shelembe, J.S.; Nkambule, T.P. Dough Rheology and Physicochemical and Sensory Properties of Wheat–Peanut Composite Flour Bread. Legume Sci. 2022, 4. [CrossRef]
- Gupta, S.; Shimray, C.A.; Venkateswara Rao, G. Influence of Organic Acids on Rheological and Bread-Making Characteristics of Fortified Wheat Flour. Int. J. Food Sci. Nutr. 2012, 63, 411–420. [CrossRef]
- Bora, P.; Ragaee, S.; Abdel-Aal, E.-S.M. Effect of Incorporation of Goji Berry By-Product on Biochemical, Physical and Sensory Properties of Selected Bakery Products. LWT 2019, 112, 108225. [CrossRef]
- Hussain, A.; Kausar, T.; Aslam, J.; Quddoos, M.Y.; Ali, A.; Kauser, S.; Zerlasht, M.; Rafique, A.; Noreen, S.; Iftikhar, K.; et al. Physical and Rheological Studies of Biscuits Developed with Different Replacement Levels of Pumpkin (Cucurbita Maxima) Peel, Flesh, and Seed Powders. J. Food Qual. 2023, 2023, e4362094. [CrossRef]
- Hussain, M.; Saeed, F.; Niaz, B.; Afzaal, M.; Ikram, A.; Hussain, S.; Mohamed, A.A.; Alamri, M.S.; Anjum, F.M. Biochemical and Nutritional Profile of Maize Bran-enriched Flour in Relation to Its End-use Quality. Food Sci. Nutr. 2021, 9, 3336–3345. [CrossRef]
- Shilbi, A.Z.N.A.; Murtini, E.S. Optimization of Ginger (Zingiber Officinale) and Cinnamon (Cinnamomum Verum) on Total Phenolics, Antioxidant Activity and Loaf Volume of Bread. Adv. Food Sci. Sustain. Agric. Agroindustrial Eng. AFSSAAE 2022, 5, 102–110. [CrossRef]
- Bhatt, S.M.; Gupta, R.K. Bread (Composite Flour) Formulation and Study of Its Nutritive, Phytochemical and Functional Properties. J. Pharmacogn. Phytochem. 2015, 4, 254–268.
- Ragaee, S.; Abdel-Aal, E.-S.M. Pasting Properties of Starch and Protein in Selected Cereals and Quality of Their Food Products. Food Chem. 2006, 95, 9–18. [CrossRef]
- Ikegwu, O.J.; Okechukwu, P.E.; Ekumankana, E.O. Physico-Chemical and Pasting Characteristics of Flour and Starch from Achi Brachystegia Eurycoma Seed. J. Food Technol. 2010, 8, 58–66.
- Julianti, E.; Rusmarilin, H.; Ridwansyah; Yusraini, E. Functional and Rheological Properties of Composite Flour from Sweet Potato, Maize, Soybean and Xanthan Gum. J. Saudi Soc. Agric. Sci. 2017, 16, 171–177. [CrossRef]
- Martins, Z.E.; Pinho, O.; Ferreira, I.M.P.L.V.O. Fortification of Wheat Bread with Agroindustry By-Products: Statistical Methods for Sensory Preference Evaluation and Correlation with Color and Crumb Structure. J. Food Sci. 2017, 82, 2183–2191. [CrossRef]
- Fenn, D.; Lukow, O.M.; Humphreys, G.; Fields, P.G.; Boye, J.I. Wheat-Legume Composite Flour Quality. Int. J. Food Prop. 2010, 13, 381–393.
- Jafari, M.; Koocheki, A.; Milani, E. Effect of Extrusion Cooking of Sorghum Flour on Rheology, Morphology and Heating Rate of Sorghum–Wheat Composite Dough. J. Cereal Sci. 2017, 77, 49–57. [CrossRef]
- Sun, X.; Ma, L.; Zhong, X.; Liang, J. Potential of Raw and Fermented Maize Gluten Feed in Bread Making: Assess of Dough Rheological Properties and Bread Quality. LWT 2022, 162, 113482. [CrossRef]
Figure 1.
Normalized FTIR spectra of UAPC, APC-CA, APC-DW band derived from amide I.
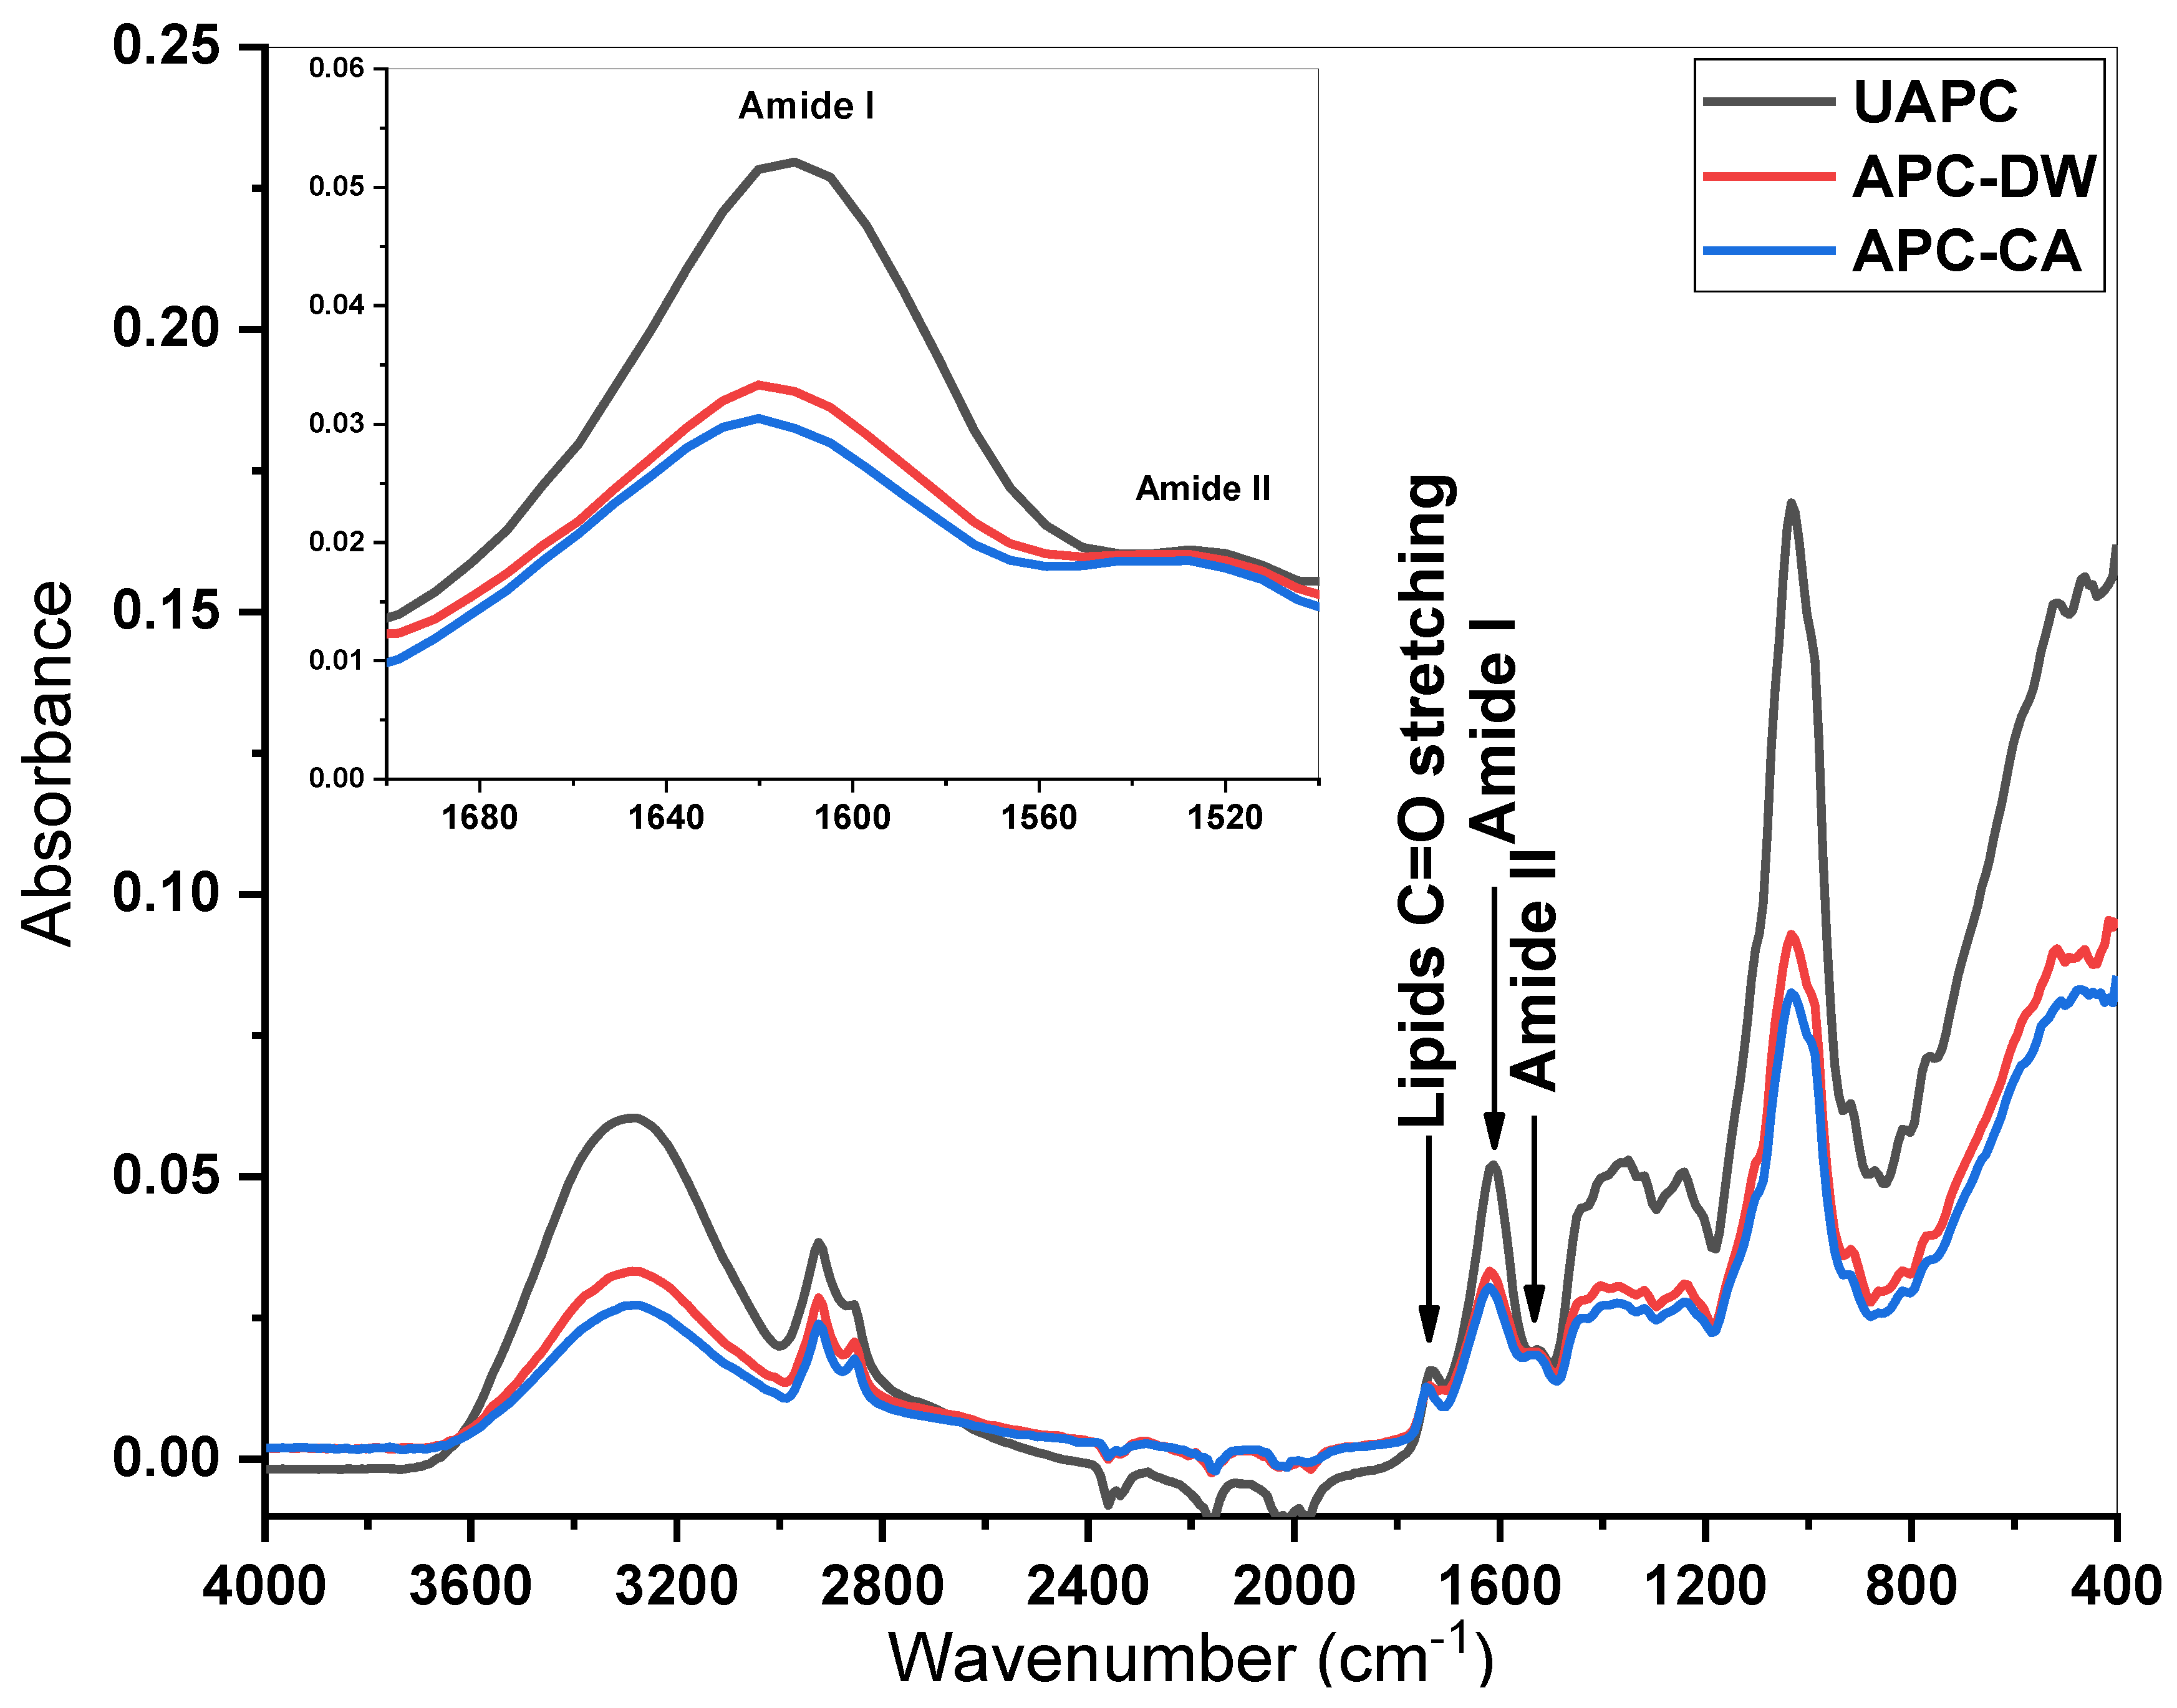
Figure 2.
Normalized FTIR spectra, protein secondary structures (a, b, c), relative percentages of each secondary structure (d).
Figure 2.
Normalized FTIR spectra, protein secondary structures (a, b, c), relative percentages of each secondary structure (d).
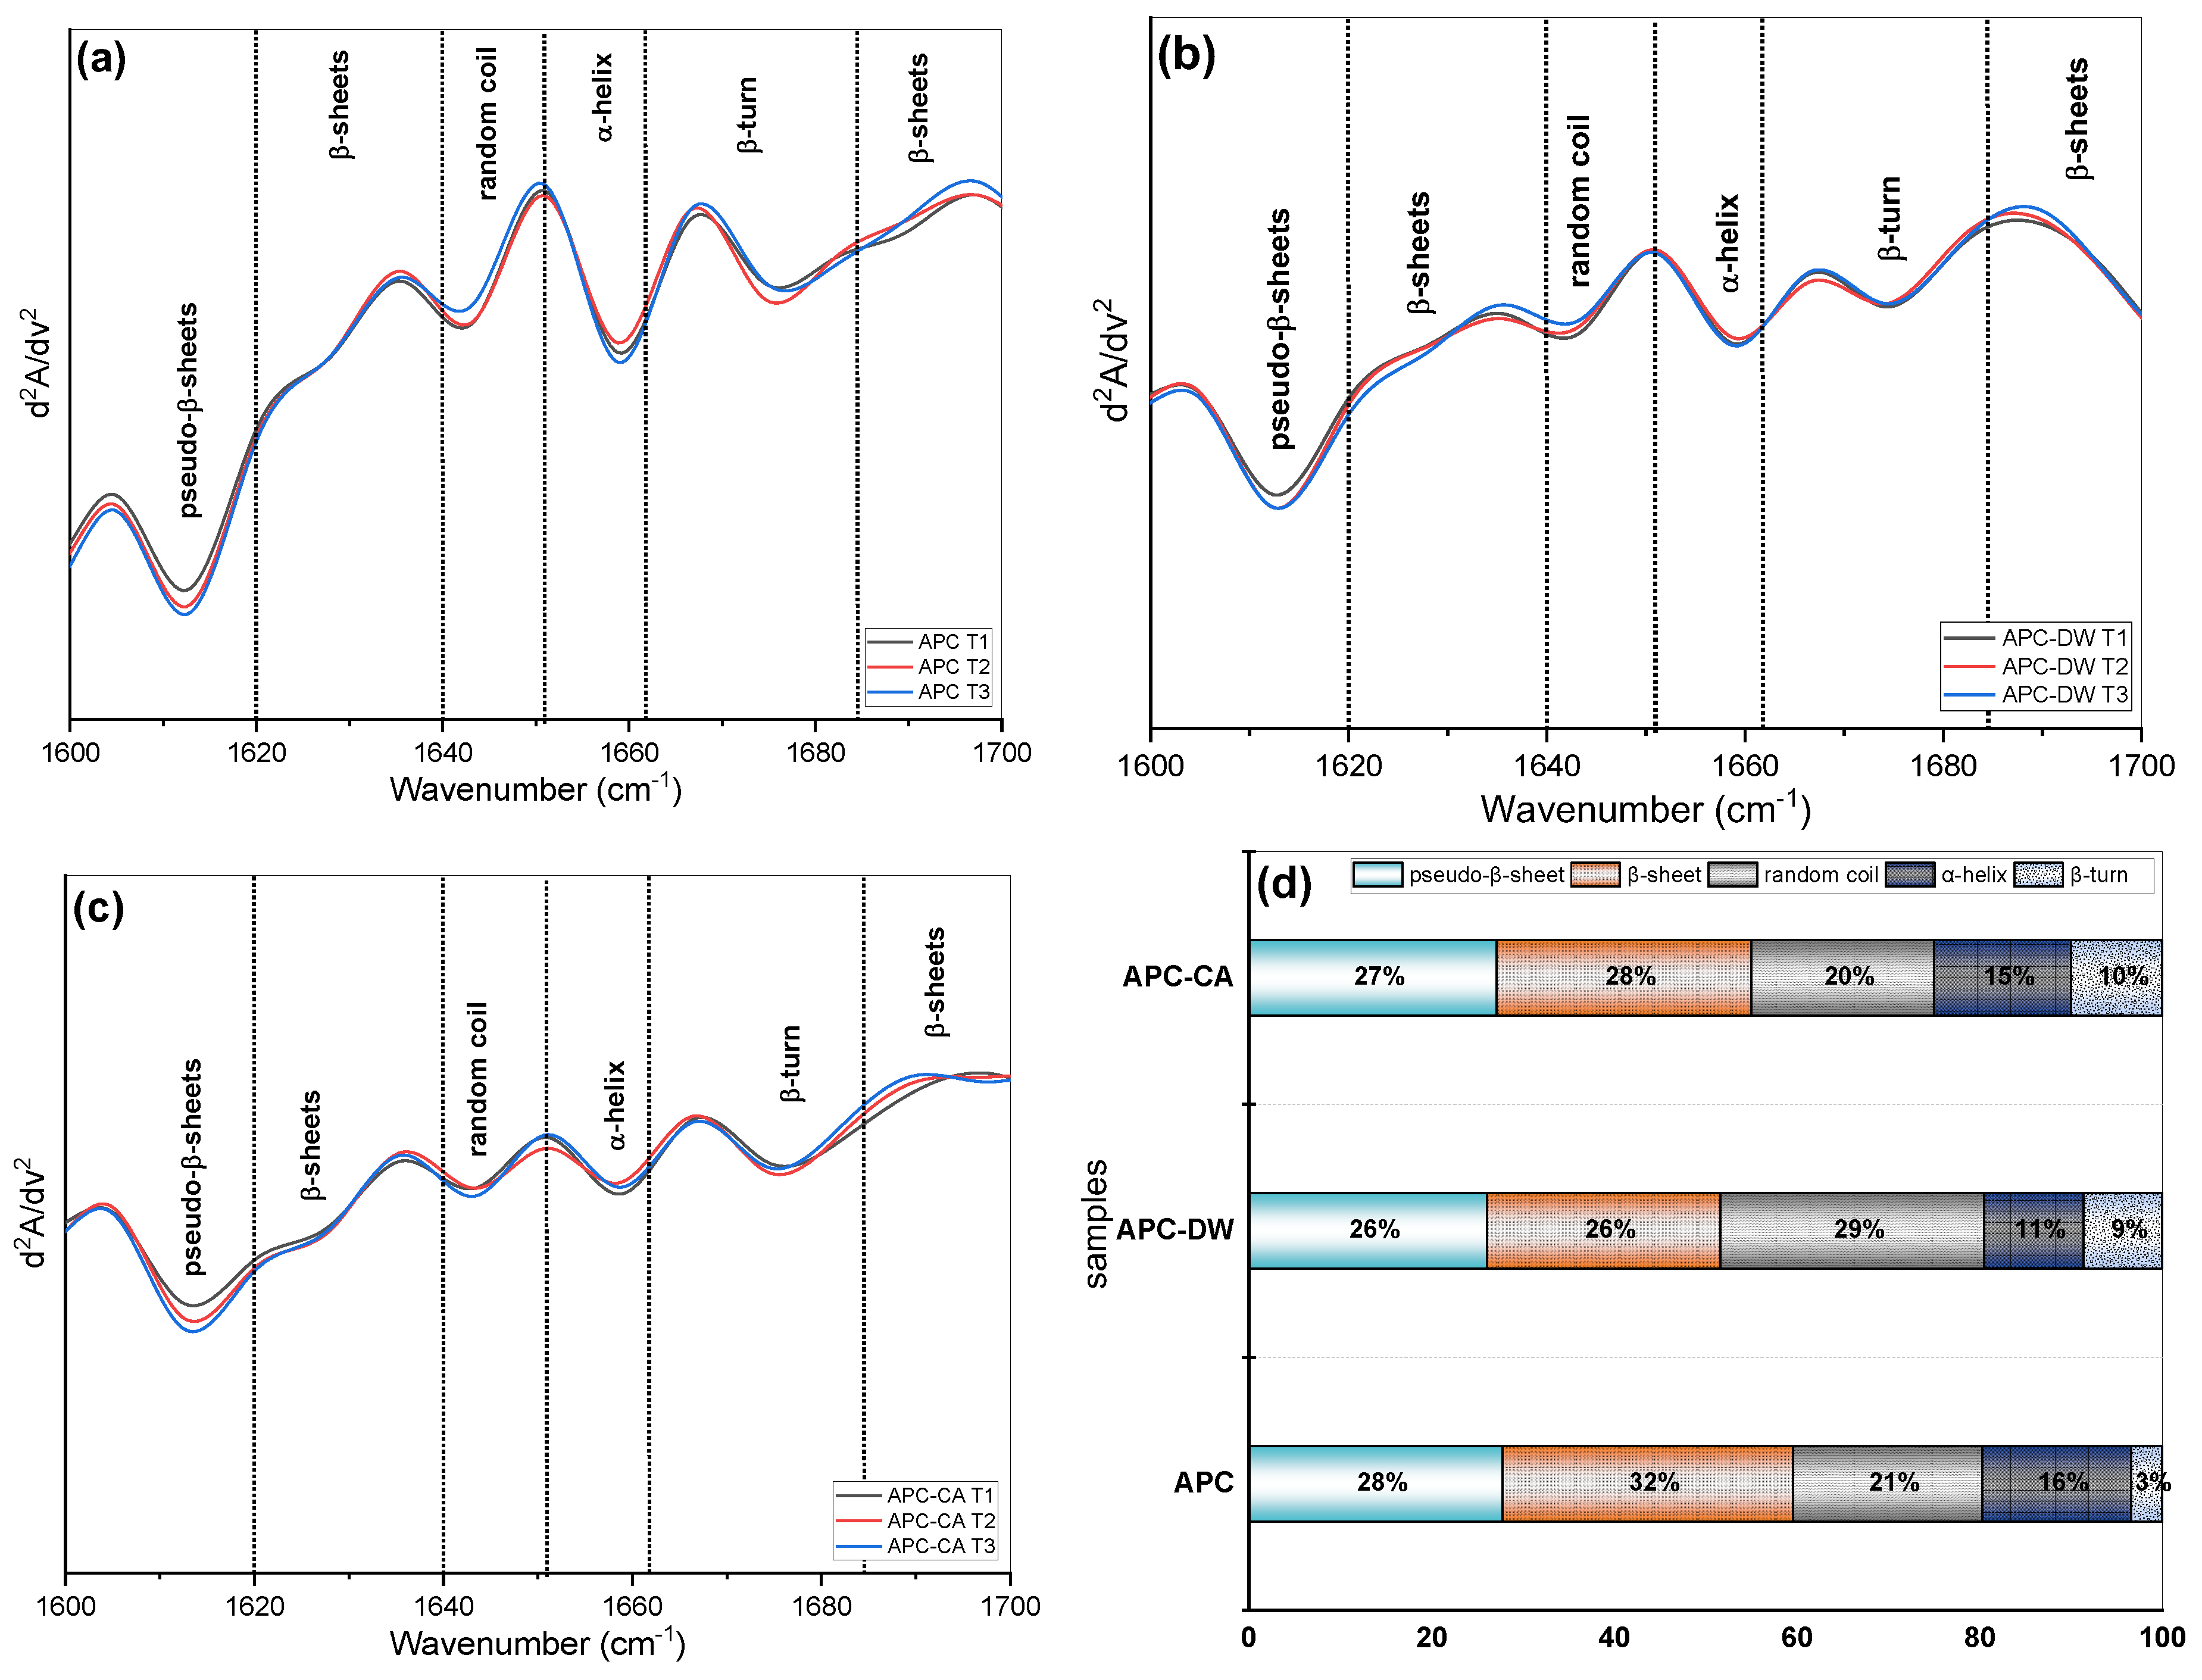
Figure 3.
Fluorescence spectra, corresponding (a): UAPC, (b): APC-CA and (c): APC-DW.
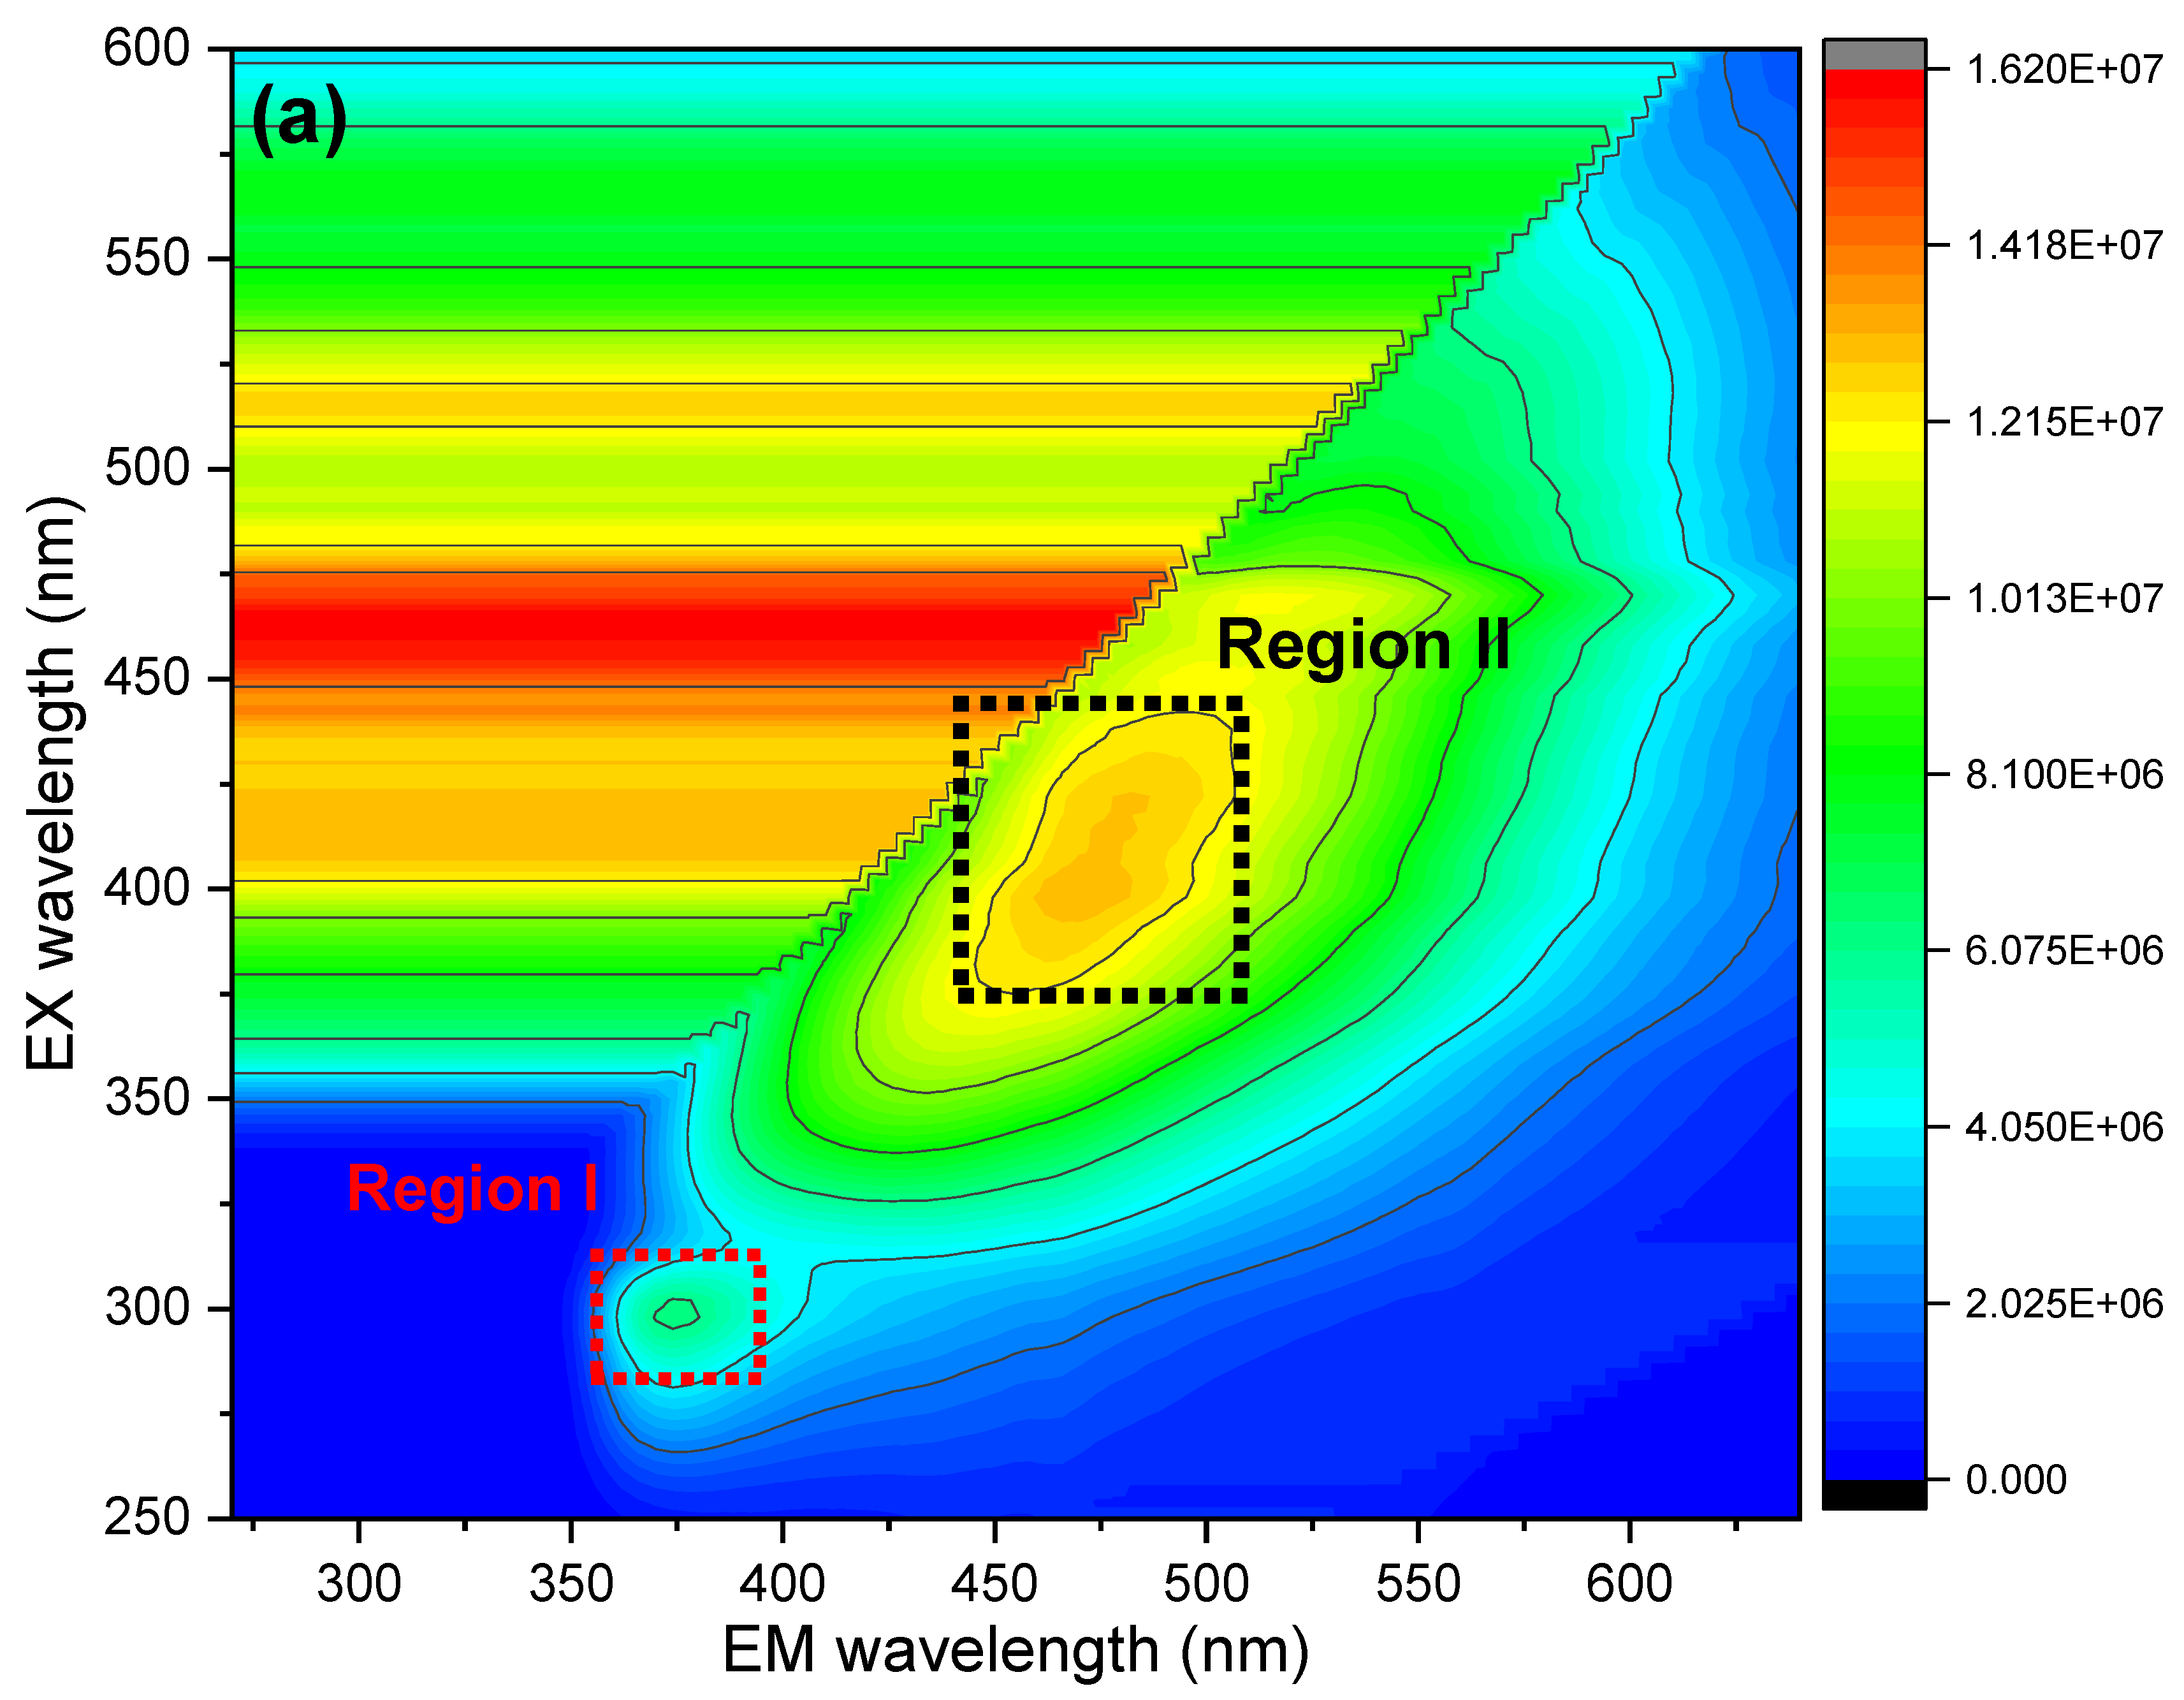
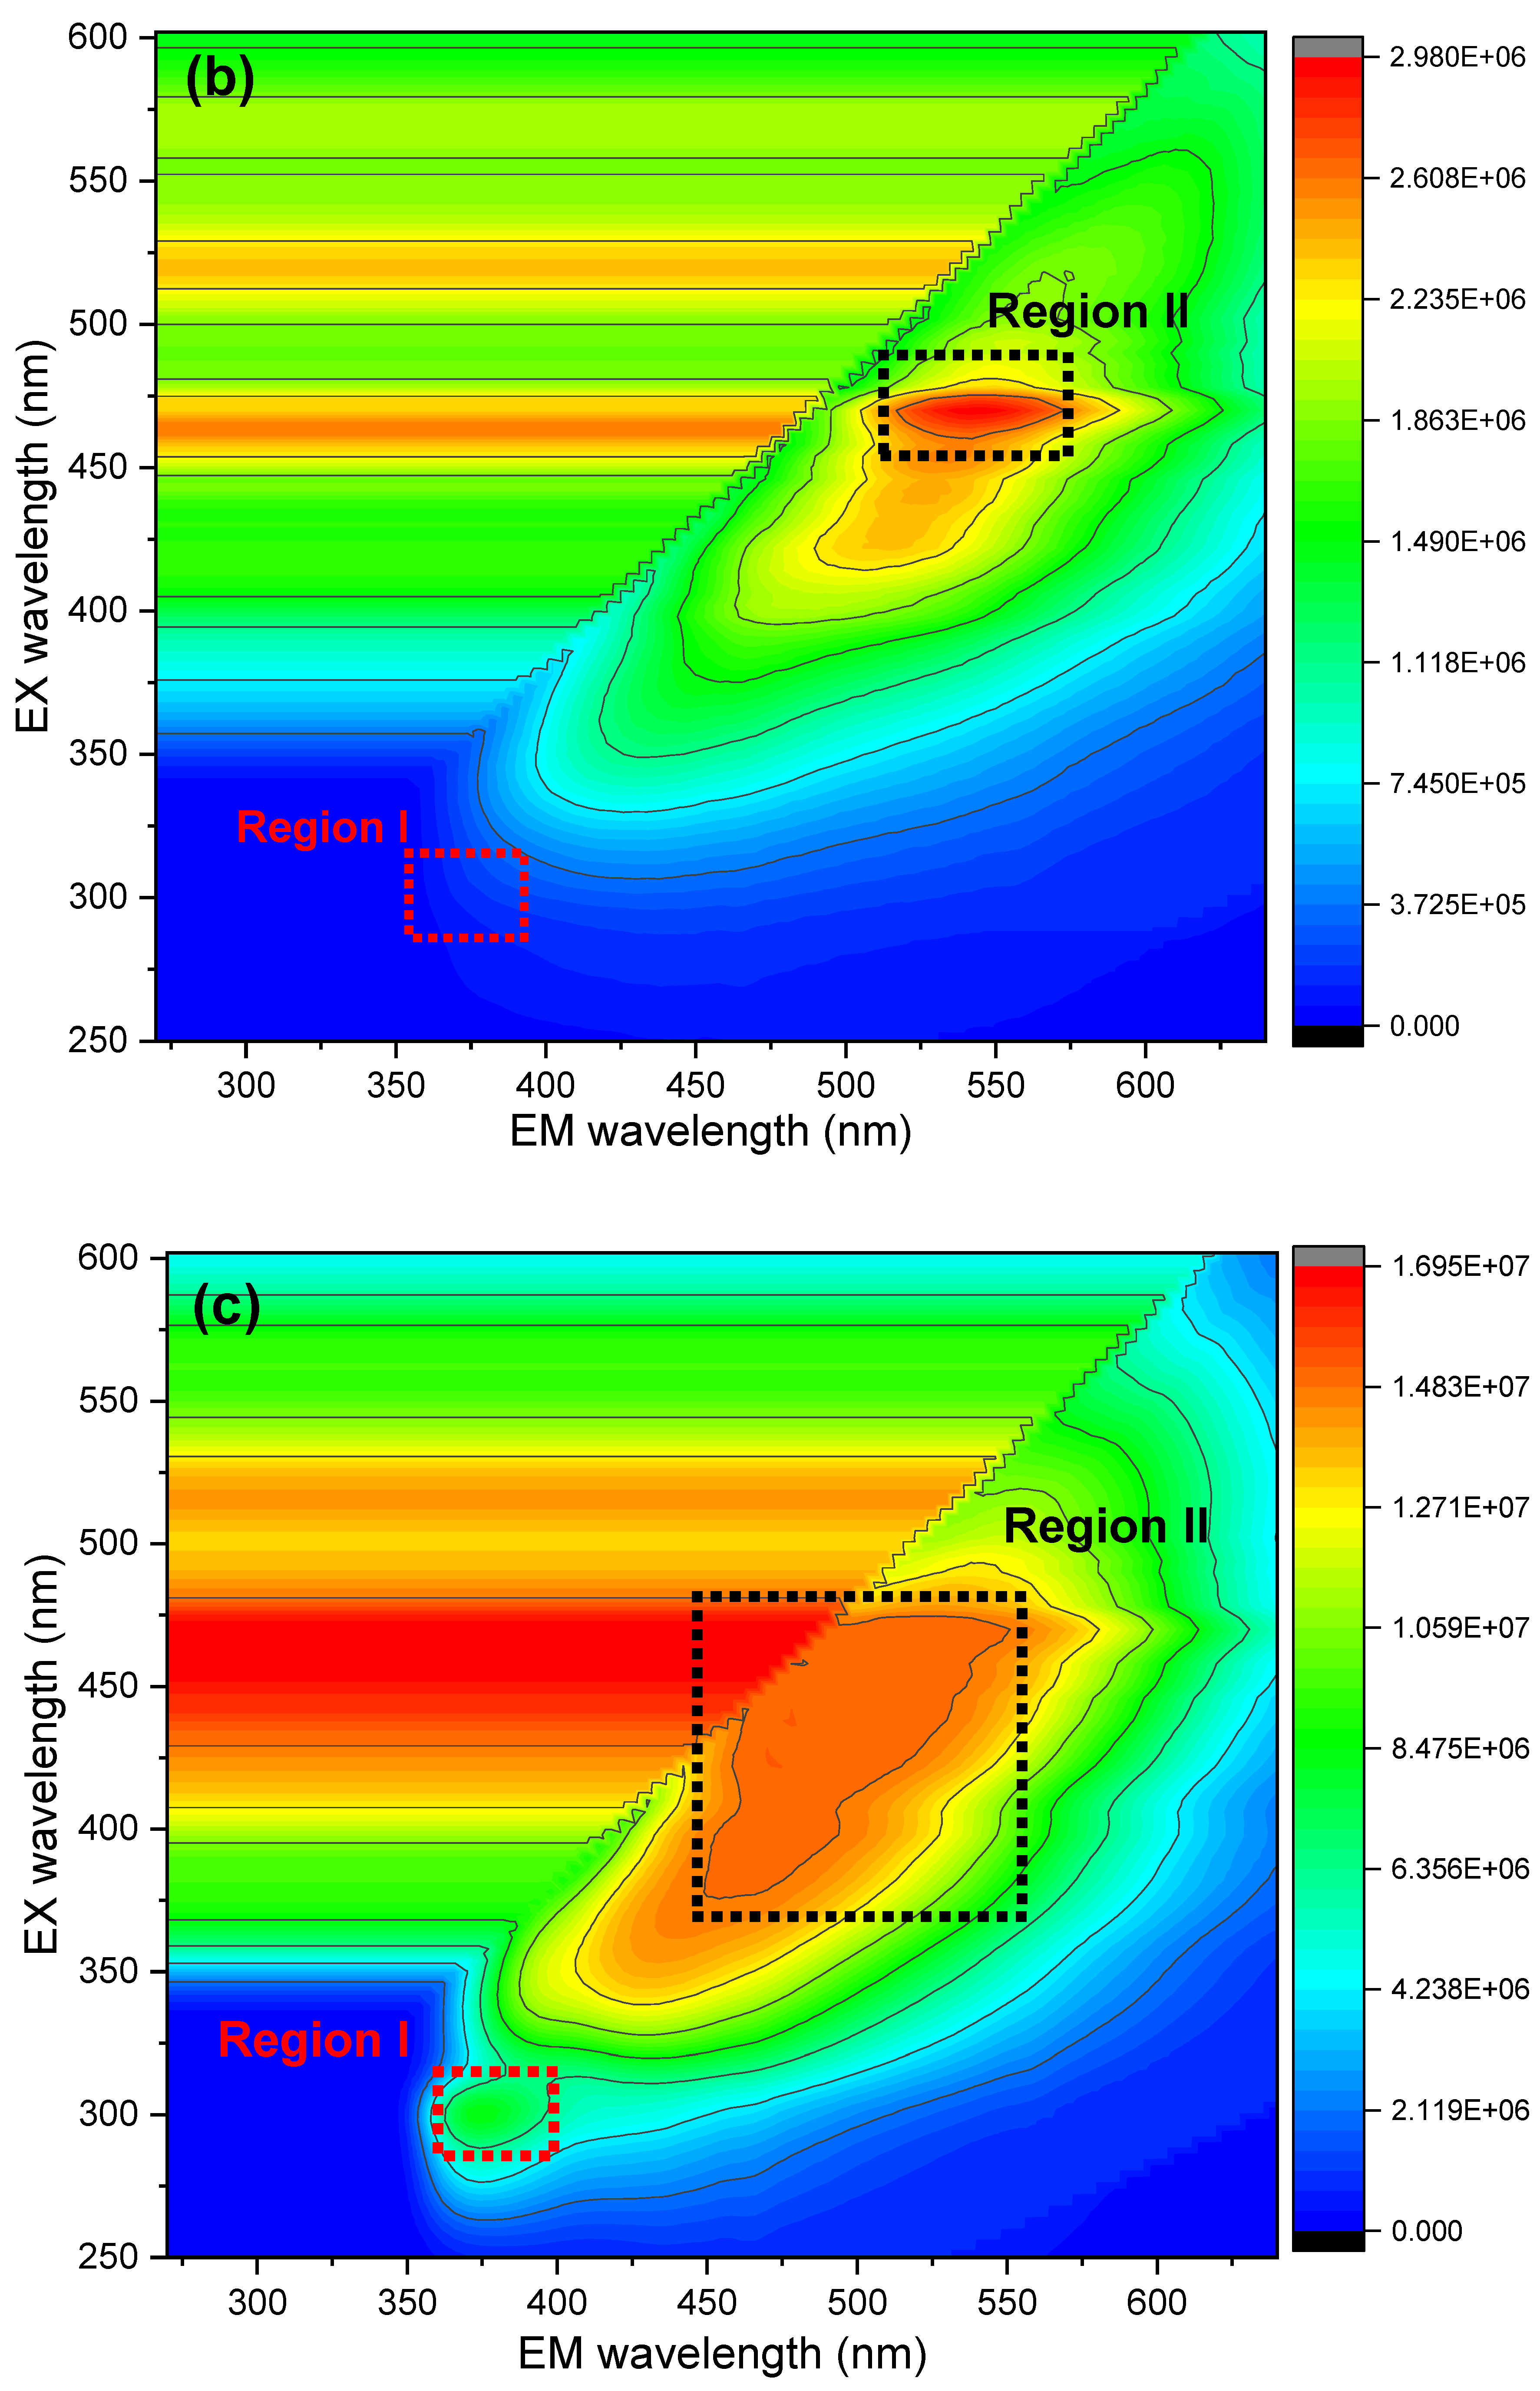
Figure 4.
Aspect of bread obtained with WWF and addition of different quantities of APC-CA or APC-DW.
Figure 4.
Aspect of bread obtained with WWF and addition of different quantities of APC-CA or APC-DW.
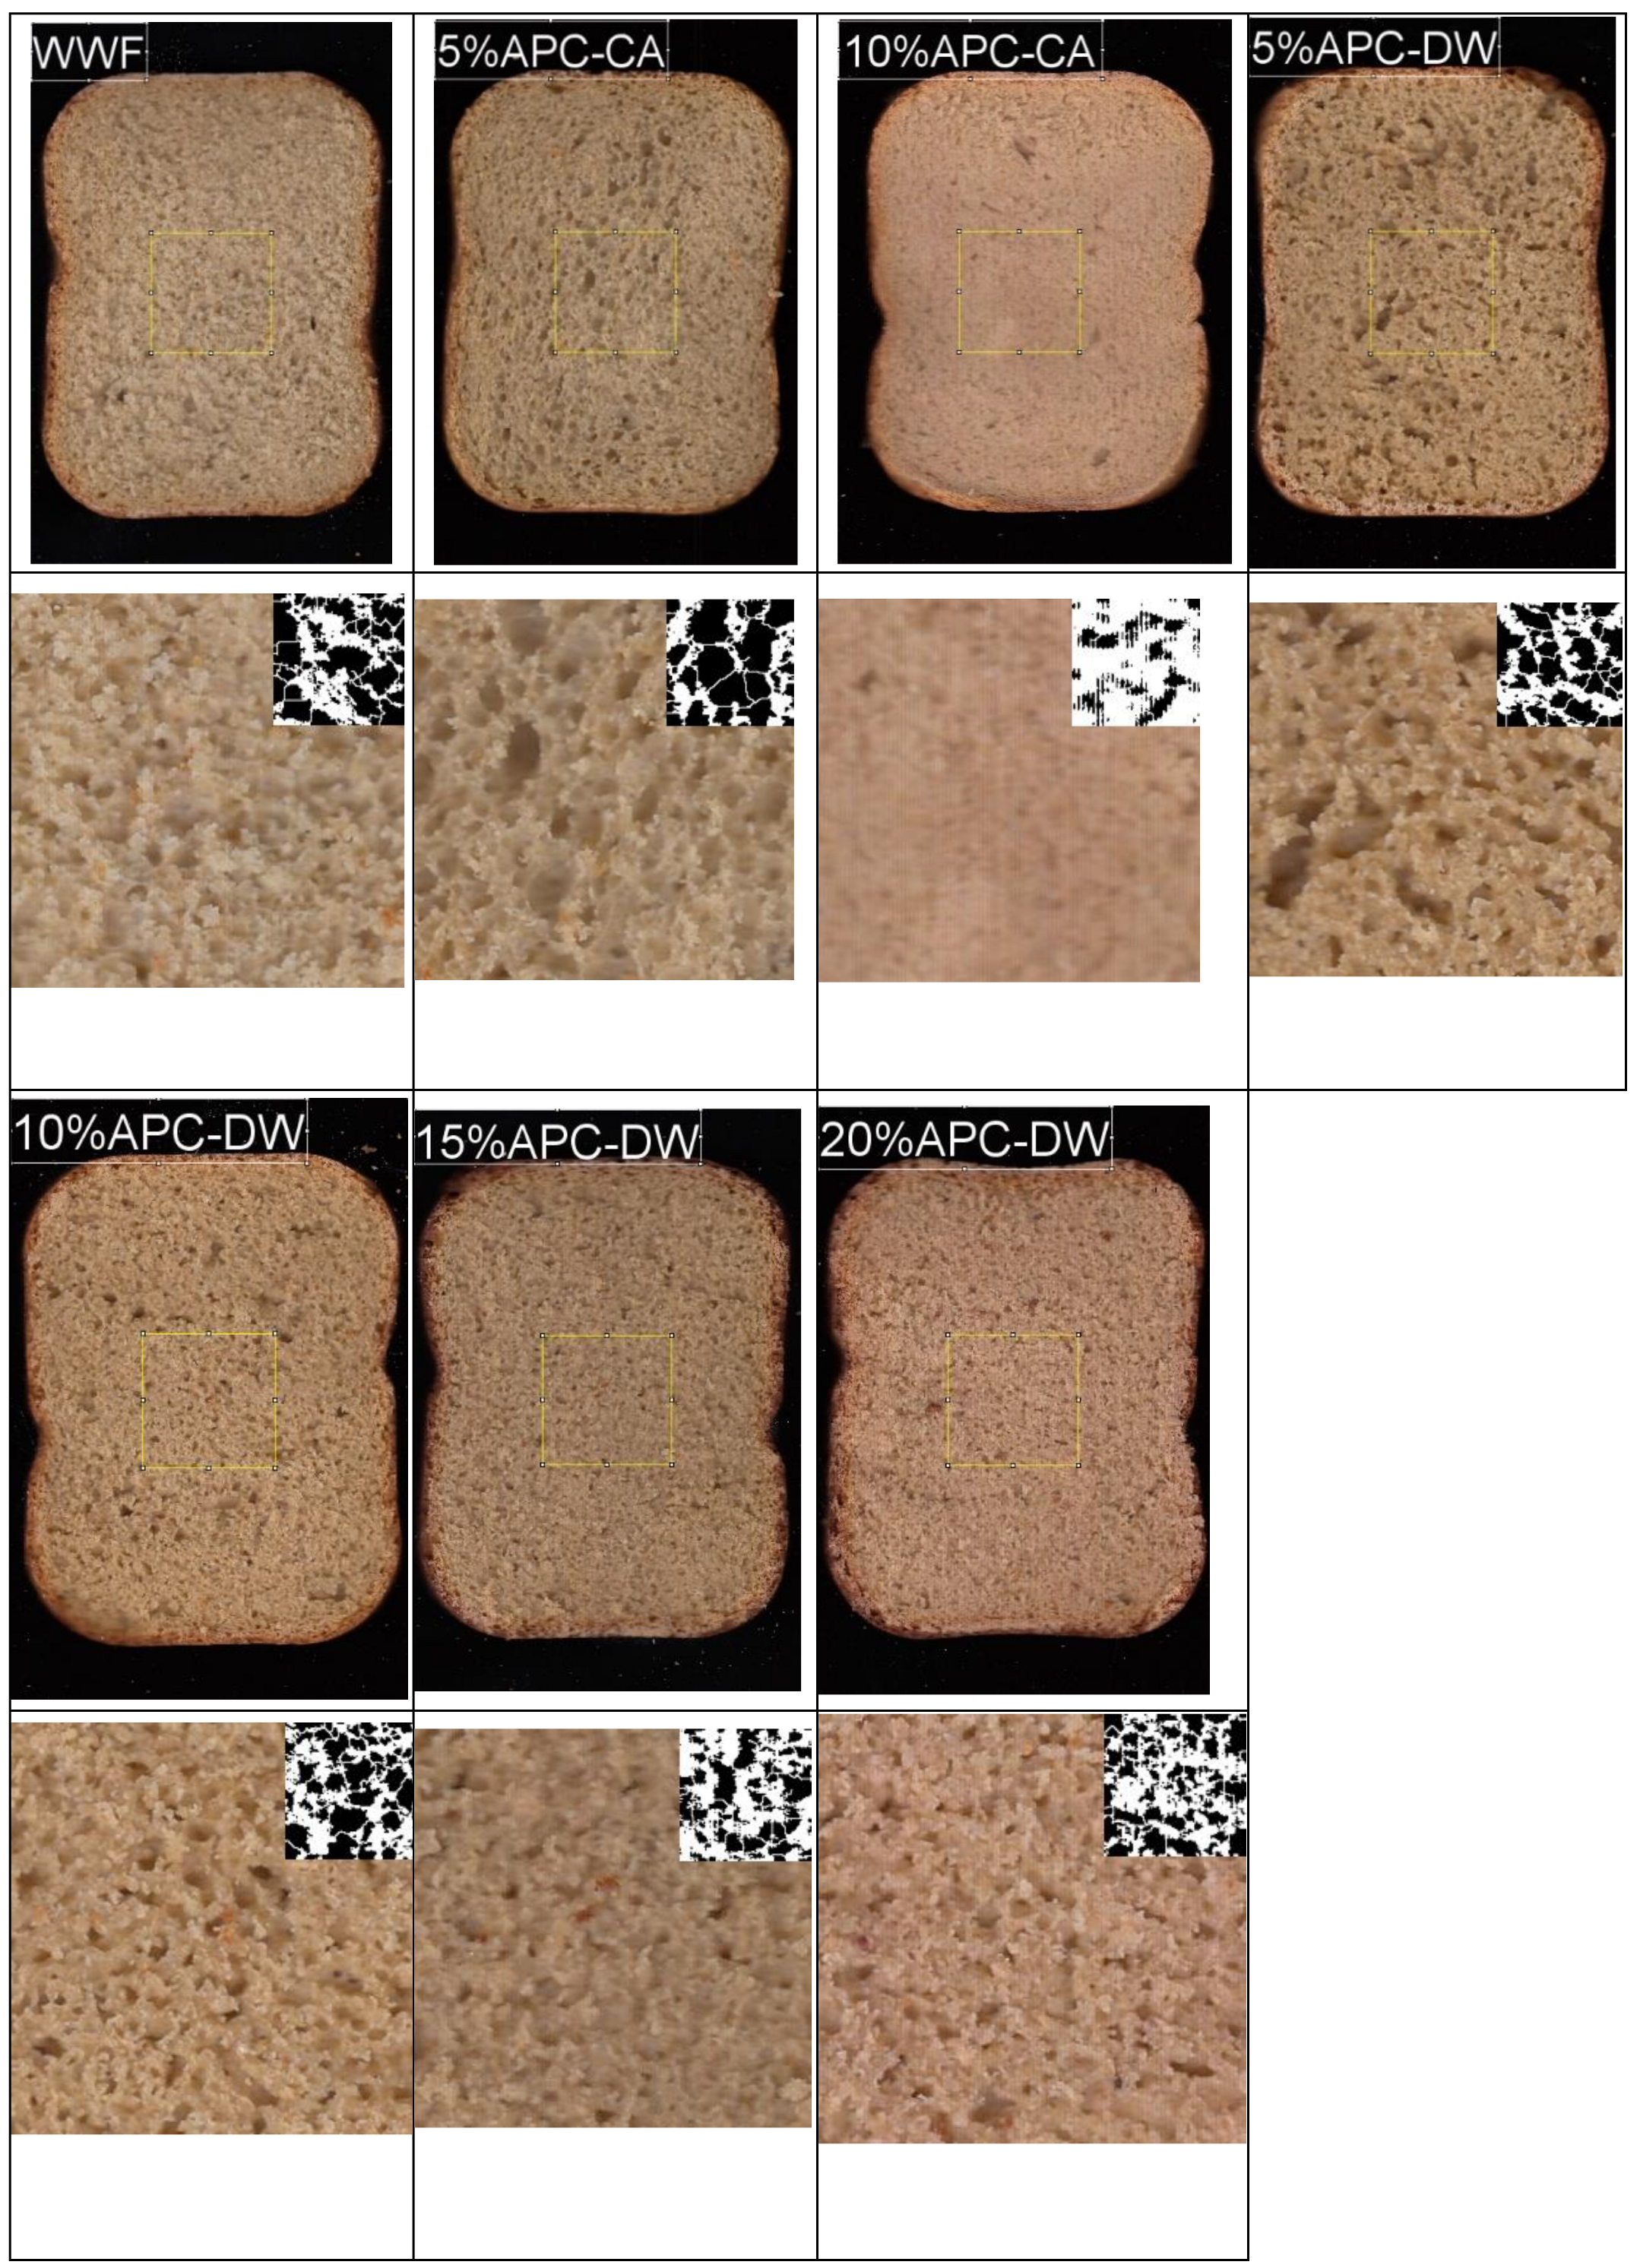

Table 1.
Chemico-physical characteristics of untreated (UAPC) and treated (APC-CA, APC-DW) argan press cake.
Table 1.
Chemico-physical characteristics of untreated (UAPC) and treated (APC-CA, APC-DW) argan press cake.
| Traits | UAPC | APC-CA | APC-DW |
| Saponin (mg/g) | 4.71 ± 0.10 a | 0.80±0.12b | 1.20± 0.10c |
| Lipid (%) | 20.30 ± 0.20a | 15.30 ± 0.10 b | 13.20 ± 0.20 c |
| Ash (%) | 5.09 ± 0.02a | 3.18 ± 0.05 b | 4.66 ± 0.03 c |
| Fiber (%) | 17.83 ± 0.20 a | 14.13 ± 0.10 b | 15.82 ± 0.20c |
| Protein (%) | 47.70 ± 0.10a | 47.40 ± 0.10a | 46.88 ± 0.06 b |
| Moisture (%) | 9.00 ± 0.02a | 7.33 ± 0.03b | 8.01 ± 0.25c |
| Ca (mg/100g) | 690.5± 0.13a | 553.4± 0.10b | 464.7± 0.11c |
| Fe (mg/100g) | 8.7 ± 0.04a | 11.6 ± 0.02b | 13.2 ± 0.01c |
| Zn (mg/100g) | 6.3 ± 0.00 a | 3.1 ± 0.01b | 9.3 ± 0.00c |
| Pythic acid (mg/100g) | 1.63 ± 0.10a | 1.05 ± 0.01b | 1.03 ± 0.01b |
| Phytic Acid/Iron | 15.98 ± 0.67a | 7.73 ± 0.18b | 6.58 ± 0.6b |
| Phytic Acid/Zinc | 25.74 ± 0.06a | 33.71 ± 0.87b | 10.95 ± 0.06c |
| L* | 80.21 ± 0.02a | 78.18 ± 0.05b | 79.53 ± 0.10c |
| a* | 1.70 ± 0.01a | 1.64 ± 0.01b | 1.58 ± 0.01c |
| b* | 12.21 ± 0.02a | 12.28 ± 0.03a | 12.24 ± 0.50a |
Values followed by the different small letters are significantly different at p < 0.05 according to ANOVA and Tukey HSD test.
Table 2.
Chemico-physical characteristics of mixture experiments flours.
| Traits | WWF | 5%APC-CA | 10%APC-CA | 15%APC-CA | 20%APC-CA | 5%APC-DW | 10%APC-DW | 15%APC-DW | 20%APC-DW |
| Lipid (%) | 1.71 ± 0.03a | 2.69 ± 0.01b | 3.37 ± 0.04c | 3.92 ± 0.03d | 4.89 ± 0.04e | 2.17 ± 0.06ab | 3.31 ± 0.03c | 4.02 ± 0.06d | 4.36 ± 0.05d |
| Ash (%) | 1.54 ± 0.03a | 1.55 ± 0.03ab | 1.63 ± 0.02ab | 1.72 ± 0.01ac | 1.77 ± 0.01c | 1.67 ± 0.01b | 1.90 ± 0.01d | 1.94 ± 0.01de | 2.04 ± 0.02e |
| Fiber (%) | 2.60 ± 0.10a | 3.27± 0.05b | 4.73 ± 0.03c | 5.22 ± 0.05de | 5.35 ± 0.06ef | 3.38 ± 0.02b | 4.90 ± 0.01cd | 5.36 ± 0.04ef | 5.69 ± 0.03f |
| Protein (%) | 13.56 ± 0.03a | 14.51 ± 0.02b | 15.15 ± 0.01c | 15.85 ± 0.01de | 16.62 ± 0.01ef | 14.17 ± 0.01f | 15.13 ± 0.03c | 15.62 ± 0.03d | 16.33 ± 0.03f |
| Moisture (%) | 11.40 ± 0.10a | 11.25 ± 0.02a | 10.92 ± 0.02ab | 10.87 ± 0.01ab | 10.64 ± 0.01bc | 10.91 ± 0.01ab | 10.55 ± 0.01bc | 10.33 ± 0.01cd | 10.11 ± 0.01d |
| Ca (mg/100g) | 15.15 ± 0.01a | 15.24 ± 0.04a | 16.48 ± 0.03b | 17.28 ± 0.03bd | 17.75 ± 0.09bd | 15.92 ± 0.03a | 17.28 ± 0.03c | 18.71 ± 0.06d | 19.88 ± 0.03d |
| Fe (mg/100g) | 3.92 ± 0.01a | 4.51 ± 0.02b | 5.42 ± 0.03cd | 5.60 ± 0.02cd | 5.65 ± 0.03d | 5.01 ± 0.02bc | 5.63 ± 0.01d | 5.80 ± 0.01d | 5.92 ± 0.01d |
| Zn (mg/100g) | 2.40 ± 0.02a | 2.41 ± 0.01a | 2.60 ± 0.03a | 2.63 ± 0.02a | 2.81 ± 0.03ab | 3.42 ± 0.01abc | 3.74 ± 0.02abc | 3.93 ± 0.01c | 4.12 ± 0.02c |
| Pythic acid (mg/100g) | 0.62 ± 0.01a | 0.73 ± 0.01bc | 0.81 ± 0.02cd | 0.88 ± 0.01de | 0.95 ± 0.02e | 0.69 ± 0.01ab | 0.74 ± 0.02bc | 0.83 ± 0.02 d | 0.92 ± 0.02ef |
| Phytic Acid/Iron | 13.76 ± 0.20ab | 13.69 ± 0.19abc | 12.65 ± 0.31bcd | 13.67 ± 0.16ab | 14.39 ± 0.30a | 11.86 ± 0.24cd | 11.40 ± 0.31d | 12.32 ± 0.31bcd | 13.39 ± 0.29ae |
| Phytic Acid/Zinc | 27.83 ± 0.42a | 29.98 ± 0.51a | 33.26 ± 0.71b | 33.35 ± 0.38b | 33.14 ± 0.70b | 20.13 ± 0.30d | 19.48 ± 0.52d | 21.81 ± 0.52cd | 22.88 ± 0.50c |
| L*(Flour) | 77.14 ± 0.08a | 85.31 ± 0.09d | 85.27 ± 0.02cd | 85.20 ± 0.57cd | 84.29 ± 0.02bc | 83.68 ± 0.08b | 85.26 ± 0.11cd | 84.60 ± 0.06bcd | 84.17 ± 0.05b |
| a*(Flour) | 1.79 ± 0.05a | 0.69 ± 0.01 bd | 0.56±0.01c | 0.57 ± 0.02c | 0.68 ± 0.01bd | 0.69 ± 0.00bd | 0.62 ± 0.01bc | 0.73 ± 0.02d | 0.76 ± 0.01d |
| b*(Flour) | 12.56 ± 0.03a | 12.78 ± 0.05g | 12.10 ± 0.02bd | 12.10 ± 0.01bd | 11.97 ± 0.02bc | 11.83 ± 0.03c | 12.41 ± 0.07aef | 12.65 ± 0.04g | 12.46 ± 0.02af |
Values followed by the different small letters are significantly different at p < 0.05 according to ANOVA and Tukey HSD test, WWF Whole wheat flour; APC-CA: Treated Argan press cake with citric acid, APC-DW: Treated Argan press cake with distilled water.
Table 3.
Reological parameters of whole wheat flour (WWF) and mixes with treated argan cake at different proportions (5, 10, 15, and 20 %).
Table 3.
Reological parameters of whole wheat flour (WWF) and mixes with treated argan cake at different proportions (5, 10, 15, and 20 %).
| WWF | 5%APC-CA | 10%APC-CA | 15%APC-CA | 20%APC-CA | 5%APC-DW | 10%APC-DW | 15%APC-DW | 20%APC-DW | |
| Gluten straight (mL) | 56.46±0.1a | 51.55±0.2b | 44.19±0.1c | 42.71 ±0.5cd | 39.28 ±0.2e | 47.62±0.5f | 41.73 ±0.1cde | 40.75 ±0.5de | 39.28±0.0c |
| Mixing time (min) | 4.72 ±0.2a | 3.98 ±0.1b | 2.96±0.2c | 3.96±0.1d | 4.40±0.0e | 4.12±0.2f | 3.08±0.1c | 3.06±0.1c | 3.16±0.2g |
| Peak Height | 43.8 ±0.0a | 47.6 ±0.1b | 50.0±0.0c | 47.6±0.0b | 50.7±0.1bc | 45.32 ±0.0e | 43.04±0.0a | 43.00±0.0a | 43.0±0.0a |
| Water absorption | 63.4 ±0.0a | 64.4±0.1b | 65.0±0.0c | 66.0±0.1d | 66.9±0.1e | 64.5±0.2b | 65.4±0.0f | 66.4±0.0g | 67.6±0.2h |
Values followed by the different small letters are significantly different at p < 0.05 according to ANOVA and Tukey HSD test. WWF: whole wheat flour, APC-CA: Treated Argan press cake with citric acid, APC-DW: Treated Argan press cake with distilled water.
Table 4.
Physical and textural characteristics of breads produced with the WWF and mixes with APC-CA and APC-DW.
Table 4.
Physical and textural characteristics of breads produced with the WWF and mixes with APC-CA and APC-DW.
| WWF | 5%APC-CA | 10%APC-CA | 5%APC-DW | 10%APC-DW | 15%APC-DW | 20%APCDW | |
| Cells Numbers | 66.6±0.03a | 35.20±0.0b | 75.25±0.0c | 54.33±0.02d | 84.75±0.03 e | 84.25±0.03e | 107.5±0.03 f |
| Total Area | 288.09±0.02a | 265.31±0.01a | 113.98±0.01b | 272.88±0.02a | 305.03±0.02c | 236.52±0.0d | 247.55±0.02e |
| Average size (mm2) | 4.4±0.02a | 7.83±0.01b | 1.53±0.01c | 5.01±0.02d | 3.59±0.02e | 2.81±0.0f | 2.32±0.02g |
| Porosity (%) | 32.01±0.02a | 29.47±0.01ab | 12.66±0.01c | 30.32±0.02a | 33.89±0.02a | 26.28±0.0b | 27.50±0.02b |
| L*(Bread) | 64.03±0.02a | 62.86±0.01b | 60.44±0.02c | 58.87±0.02d | 58.20±0.02d | 57.27±0.03d | 56.90±0.03 d |
| a*(Bread) | 4.21±0.02a | 4.35±0.01a | 4.61±0.02b | 5.35±0.03c | 5.53±0.03d | 5.69±0.02e | 5.71±0.02e |
| b*(Bread) | 25.37±0.03a | 24.25±0.03b | 23.72±0.01c | 24.98±0.01d | 24.27±0.02b | 22.63±0.02e | 21.44±0.02f |
| Loaf volume (cm3) | 1150.00 ±2.00a | 1150.00 ±1.00a | 750.00 ±2.00b | 850.00 ±1.00c | 700.00 ±1.00d | 670.00 ±1.00e | 650.00±2.00f |
Values followed by the different small letters are significantly different at p < 0.05 according to ANOVA and Tukey HSD test. WWF: whole wheat flour, APC-CA: Treated Argan press cake with citric acid, APC-DW: Treated Argan press cake with distilled water.
Disclaimer/Publisher’s Note: The statements, opinions and data contained in all publications are solely those of the individual author(s) and contributor(s) and not of MDPI and/or the editor(s). MDPI and/or the editor(s) disclaim responsibility for any injury to people or property resulting from any ideas, methods, instructions or products referred to in the content. |
© 2025 by the authors. Licensee MDPI, Basel, Switzerland. This article is an open access article distributed under the terms and conditions of the Creative Commons Attribution (CC BY) license (http://creativecommons.org/licenses/by/4.0/).
Copyright: This open access article is published under a Creative Commons CC BY 4.0 license, which permit the free download, distribution, and reuse, provided that the author and preprint are cited in any reuse.


