
Submitted:
28 June 2025
Posted:
30 June 2025
You are already at the latest version
Abstract
Polymeric biocomposites are emerging as a new generation of eco-friendly and cost-effective materials that provide sustainable alternatives for the polymer industry while supporting en-vironmental conservation. This study investigates the mechanical behavior of Low-Density Polyethylene (LDPE) compounds blended with Natural Rubber (NR) and reinforced with si-lanized Sugarcane Bagasse Ash (SCBA), chemically modified with bis(3 triethoxysilylpropyl) tetrasulfide (TESPT). Blends were formulated in LDPE/NR weight ratios (wt%) of 90/10, 70/30, and 50/50, and processed at mixing speeds of 40 and 80 rpm to evaluate their potential as thermo-plastic additives. Mechanical testing showed that blends mixed at 80 rpm achieved an 86% in-crease in elongation, while those processed at 40 rpm demonstrated a 78% enhancement in tensile strength. The incorporation of NR and vulcanizing systems markedly improved the overall mechanical properties of the composites. These biocomposites present promising applications in the footwear industry (especially for soles) and in ergonomic molded components with an ad-vantageous combination of mechanical performance and aesthetic appeal. Furthermore, their development supports innovative manufacturing processes and contributes to the reduction of carbon footprints, mitigating their negative impact on the planet.
Keywords:
natural rubber
; low-density polyethylene
; thermoplastic composites
; waste
; sugarcane bagasse
; eco-friendly composites
1. Introduction
This study focuses on the preparation and characterization of composites based on a Low-Density Polyethylene (LDPE) thermoplastic matrix blended with Natural Rubber (NR) and Sugarcane Bagasse Ash (SCBA) as a reinforcing component. The research is driven by the commercial potential of LDPE-based Thermoplastic Elastomers (TPEs) and the limited exploration of natural reinforcements, such as sugarcane residues, in these materials. The study highlights the diverse physical and mechanical properties of TPEs, which are influenced by the elastomer-to-thermoplastic ratio and the processing techniques employed, including vulcanizing agents.
A key aspect of this study is the emphasis on understanding and controlling the manufacturing processes of these composites, particularly the interfacial adhesion between SCBA and NR. Effective control of this adhesion is essential for tailoring composite materials for various applications, thereby enhancing their adaptability and performance in different industrial sectors. The process for obtaining these composites is illustrated in Figure 1.
In this work, SCBA with a particle size of 45–90 µm was used as a filler in NR, forming a mixture referred to as the masterbatch, which was subsequently blended with LDPE. The study involved preparing blends both with and without the application of a silane coupling agent to SCBA and then assessing their physical and mechanical properties. The silane coupling agent was employed to enhance the interaction between the components, yielding significant effects on the mechanical performance of the elastomeric compounds. The study determined that an SCBA content of 25 phr in the NR blend, particularly when treated with silanization, provided optimal mechanical performance. This finding guided further exploration of the most effective processing systems for TPEs, both in the presence and absence of vulcanizing agents, and the impact of processing speed on material properties.
Additionally, the use of curing agents was found to improve the mechanical properties of TPEs, indicating a viable manufacturing strategy that outperforms similar compounds without vulcanizing agents. In a preliminary study using polyethylene-graft-maleic anhydride (PE-g-MA) [1] as an interfacial coupling agent, improvements in tensile strength with respect to the pure material were observed. However, the present study opted to evaluate alternative blending systems without PE-g-MA and to compare their elongation and resistance behavior.
The increasing global demand for sustainable materials has spurred the development of innovative solutions in polymer science. As the world becomes more environmentally conscious, industries face pressure to transition away from petroleum-based materials and adopt alternatives that offer a lower environmental impact. TPEs represent one such innovation, combining the elastic properties of rubber with the processability of plastics. Unlike traditional thermoset rubbers, TPEs can be melted and remolded, offering advantages in recycling and manufacturing efficiency [2]. Moreover, in the last decade, the integration of natural reinforcing fillers into TPEs has emerged as a strategy to further enhance their sustainability and performance. This approach has gained traction in industries such as automotive, construction, packaging, and consumer goods [3].
TPEs possess a unique combination of elasticity, strength, and plasticity, which makes them suitable for a wide range of applications [4]. In their pure form, TPEs are already valued for their flexibility, wear resistance, ease of shaping, and recyclability [5]. However, as industries demand higher performance without sacrificing sustainability, research has shifted toward integrating natural fillers into TPE matrices. Traditionally, TPEs have relied on synthetic fillers such as carbon black or silica to reinforce their structure and improve their mechanical properties [6]. Nonetheless, these fillers increase the environmental burden due to their petroleum-based origin and energy-intensive production [7].
The introduction of natural fillers, including cellulose, starch, rice husk, wood flour, and agricultural waste, addresses these environmental concerns [8] by offering a renewable, biodegradable, and often lower-cost alternative to synthetic reinforcements [9]. Their use also aligns with circular economy principles, which emphasize minimizing waste and extending the life cycle of materials [10]. Consequently, the integration of these bio-based fillers into TPEs offers significant benefits across multiple sectors.
In the automotive industry, for example, there is a growing need for lightweight materials that can reduce vehicle weight and improve fuel efficiency [11]. In this sense, TPEs reinforced with natural fibers such as hemp, flax, or bamboo provide enhanced tensile strength and impact resistance without the weight penalty associated with traditional materials [12]. These improvements can ultimately contribute to overall reductions in greenhouse gas emissions [13]. Additionally, natural filler-reinforced TPEs are suitable for automotive interior components, exterior trims, and under-the-hood applications, replacing heavier, non-renewable materials [14].
In the packaging industry, the integration of natural fillers offers a pathway to reducing the environmental impact of single-use plastics [15], considering the substantial contribution of this sector to global plastic pollution [16]. Such integration allows manufacturers to develop packaging solutions that are not only stronger and more durable but also potentially biodegradable or compostable [17]. This innovation would help reduce the accumulation of plastic waste in landfills and oceans, favoring cleaner ecosystems and mitigating microplastic pollution [18]. Particularly, TPEs reinforced with starch or wood flour can be used to create high-performance and environmentally friendly food packaging [19].
In the construction and infrastructure industries, natural filler-based TPEs offer promising applications in insulation, flooring, and sealing systems [20]. Fillers such as jute, coconut husk, and rice husk improve the thermal and acoustic insulation properties of TPEs, making them ideal for use in energy-efficient buildings [21]. Moreover, these composites exhibit excellent weather resistance and durability, ensuring long service life even under harsh environmental conditions [22]. As a result, they are well-suited for green building projects, where both sustainability and performance are key considerations [23].
In the consumer goods sector, TPEs with natural fillers are finding increasing use in the production of footwear, sporting equipment, and household items [24]. Natural fillers not only enhance the sustainability of the final products but also impart desirable aesthetic qualities, such as natural textures and finishes [25]. Additionally, bio-based fillers provide a marketing advantage, as environmentally conscious consumers increasingly seek out eco-friendly alternatives [26].
In summary, one of the primary benefits of incorporating natural fillers into TPEs is their potential for reducing environmental impact 27. Sourced from renewable materials such as agricultural by-products, plant fibers, or wood waste, these fillers represent a sustainable alternative to petroleum-based components [28]. Many are also biodegradable, allowing products to naturally decompose at the end of their life cycle, thus reducing the environmental burden of plastic waste [29]. This is a significant advantage over conventional fillers, which exacerbate the growing problem of non-degradable waste in landfills and oceans [30].
Moreover, the production of natural fillers typically consumes less energy than the production of synthetic counterparts [31]. For example, the cultivation of flax or hemp requires significantly less energy and fewer chemical inputs compared to the energy-intensive manufacturing of synthetic materials such as carbon black [32]. This lower energy demand contributes to a reduced carbon footprint for the final product [33]. In addition, natural fillers are often by-products of agricultural activities, meaning that their use in TPE production can reduce resource consumption and promote more efficient material utilization [34].
Natural fillers also have the potential for carbon sequestration, as many plant-based materials capture atmospheric carbon dioxide during growth [35]. Incorporating these materials into durable products contributes to carbon storage and the reduction of greenhouse gas emissions over the product’s life cycle [36]. Consequently, TPEs with natural fillers represent a valuable component of sustainable manufacturing processes, which align with global efforts to combat climate change [37].
Despite their numerous advantages, the widespread adoption of natural filler-reinforced TPEs presents several challenges [38]. One of the primary obstacles is ensuring compatibility between the polymer matrix and the natural fillers [39]. Achieving uniform dispersion and strong interfacial adhesion is crucial for optimizing the mechanical properties of the composite [40]. Incompatibility can lead to poor performance, reduced durability, and inconsistent product quality [41]. To address this issue, researchers are exploring surface treatments and coupling agents to improve the interaction between natural fillers and TPE matrices, paving the way for more reliable and consistent composite materials [42].
Supply chain stability and cost competitiveness present another challenge to the adoption of plant-based fillers [43]. While these are generally more affordable than synthetic alternatives, fluctuations in agricultural yields and supply chain disruptions could affect their availability and pricing [44]. Consequently, as demand for these materials grows, the development of sustainable sourcing strategies will be essential to ensure a steady supply of high-quality natural fillers [45].
In conclusion, the integration of natural reinforcing fillers into TPEs holds great promise for industries seeking to improve both performance and sustainability [46]. Their reduced environmental impact, enhanced mechanical properties, and cost efficiency make these composites attractive for a wide range of applications [47]. As research continues to address compatibility challenges and supply chain considerations, TPEs with natural fillers are poised to play a critical role in the transition toward more sustainable manufacturing processes [48]. By leveraging renewable resources and minimizing reliance on petroleum-based materials, these composites represent a meaningful step toward a greener, more circular economy [49].
For their part, TPEs based on NR and polyethylene (PE) or polypropylene (PP) combine the elasticity of rubber with the processability of thermoplastics. These materials are produced through the dynamic vulcanization of NR in a matrix of LDPE, High-Density Polyethylene (HDPE), or PP. The result is a material exhibiting excellent tensile strength, elongation at break, and abrasion resistance, which are attributed to the rubber phase dispersed within the thermoplastic matrix. LDPE-based TPEs are known for their flexibility and low hardness, while HDPE-based TPEs exhibit higher stiffness and tensile strength [50]. Similarly, PP-based TPEs stand out for their excellent chemical resistance [51], durability at elevated temperatures, and ease of processing [52,53].
These elastomers also find applications across multiple industries. In the automotive sector, they are used in seals, gaskets, and flexible components due to their durability and resistance to deformation [54]. In consumer products, they are employed in soft-touch grips, shoe soles, and packaging, owing to their impact resistance and flexibility [55,56]. In the medical field, their biocompatibility and flexibility make them suitable for tubing, seals, and diaphragms [57,58]. Furthermore, TPEs are recyclable, making them a sustainable choice [59] for various industrial applications [60,61].
Considering the above, this study evaluated the conditions for improving the mechanical response of LDPE/NR/SCBA, with a particular focus on the degree of reinforcement achieved between treated and untreated fillers and the polymer matrix. The results, compared across density measurements and confirmed through stress–strain testing, Dynamic Mechanical Analysis (DMA), Differential Scanning Calorimetry (DSC), Thermogravimetric Analysis (TGA), Fourier-Transform Infrared Spectroscopy with Attenuated Total Reflectance (FTIR-ATR), and Scanning Electron Microscopy (SEM) analyses, are presented below. This approach provides insights into the matrix–filler interactions with a specific focus on applications in the footwear industry.
2. Materials and Methods
At this stage, the LDPE/masterbatch blends (with and without surface treatment) exhibiting the best mechanical performance were selected for further analysis. These blends were combined with vulcanizing agents, including a sulfur donor and TESPT (a coupling agent). The goal was to obtain a composite with minimal sulfur content, which results in a more sustainable material for industrial applications. Mixtures of LDPE/masterbatch with vulcanizing agents were prepared using a Haake mixer, where the influence of rotor speed was studied at 40 and 80 rpm. This approach was adopted to evaluate how crosslinking and mixing speed influenced key properties of the composites, including elongation, tensile strength, and constituent dispersion. The LDPE/silanized masterbatch mixtures selected for testing were (A) 90/10, (B) 70/30, and (C) 50/50.
Composite Manufacturing Methodology
To prepare the LDPE/masterbatch thermoplastic composites containing silanized NR–SCBA [62], the SCBA and vulcanization activators were initially incorporated into NR using an open mixer. Component proportions were calculated in parts per hundred rubber (phr), according to the formulation shown in Table 1.
To assess vulcanization behavior, rheometry experiments were performed using a Haake rheometer. Key parameters during the mixing process included cylinder rotation speed during mastication (24–40 rpm), approximate mixing time (30 minutes), final mastication temperature (45–60 ºC), and vulcanization temperature (150 ºC). The optimum cure time was determined using the oscillating disk cure meter method, following ASTM D 2084 and ASTM D 5289 [63].
Ash content from SCBA was classified using a No. 110 sieve, then analyzed by X-Ray Fluorescence (XRF) spectroscopy according to procedures EP-LEQ007 and PE-LE008, and ASTM 323-56. Abrasion resistance tests were conducted in triplicate using a revolving drum, as specified in ASTM D 5963 [64]. During the test, the samples were subjected to a friction distance of 40 m, equivalent to 84 drum rotations, under a load of 5 ± 0.2 N (1.125 ± 0.02 lbf). Additionally, hardness tests were performed on a Kiltler durometer graduated in the Shore A scale, according to ASTM D 2240 [65].
Stress–strain tests were performed on type C samples using a Lloyd AGS-X 20 KN testing machine, in compliance with ASTM D 412 Method A. The tests were performed at a speed of 500 mm/min, using a 0.5 kN load cell and an internal deformation transducer [66]. Morphological analysis of the composite surfaces and SCBA particles was conducted via SEM using a Carl Zeiss EVO LS15 microscope equipped with a backscatter detector, operating in high vacuum mode at 20 kV. Prior to imaging, samples were sputter-coated with a thin layer of gold using a Quorum Q150R ES coater.
Thermal stability and transitions were evaluated using simultaneous TGA and DSC on a Netzsch STA 209 instrument. For each test, 15 mg of sample was placed in an alumina (Al2O3) crucible, with pure nitrogen gas (N2) as carrier at a flow rate of 15 mL/min-1. The heating rate was set at 10°C/min-1, and the room temperature ranged from 20°C to 500°C.
Similarly, DMA was performed on a NETZSCH DMA 242C analyzer equipped with a TASC 414/3A interface and a 242 controller. Measurements were conducted in three-point bending mode at a frequency of 5.0 Hz, over a temperature range of -120°C to 150°C, at a heating rate of 5°C/min, with a maximum dynamic force of 5.0 N, and with a static force of 1.5 N. The cooling process was carried out under a N2 atmosphere. The average sample dimensions were 11 mm (length), 5.0 mm (width), and 1.5 mm (thickness). All characterizations were conducted following compression molding of the blends at Laboratório de Tecnología de Borrachas e Aplicações (LTBA) in Presidente Prudente, São Paulo, Brazil, as part of the elastomer thermoplastics research program.
Shore A hardness measurements were conducted using a Bareiss durometer in accordance with ASTM D2240. FTIR was also employed to analyze the chemical structure of the composites [67,68] using a Bruker Vector 22 spectrometer in the 4000 to 600 cm-1 range. After specimen preparation, additional analyses were performed to evaluate the properties imparted by the manufacturing process. The results demonstrated an improvement in the physical–mechanical properties, indicating that the developed material possesses competitive characteristics suitable for multiple industrial applications.
3. Results and Discussion
3.1. Rheological Analysis
The compounds were processed with vulcanizing agents to observe differences in physical–mechanical properties, specifically elasticity and tensile strength. Figure 2 shows the torque curves as a function of time for pure LDPE and NR. A substantial increase in torque is observed during the first minute when LDPE and NR are added. The energy required by the torque pair to break the chains and achieve the sliding associated with the release of the chain segments [69] was remarkable. After this initial peak, a decrease in torque was observed and then the curve stabilized, reflecting the easier movement of polymer chains until the mixture completion, requiring minimal additional energy.
Figure 1.
Rheological behavior of LDPE and NR obtained using the Haake rheometer at 40 rpm. Source: Own work.
Figure 1.
Rheological behavior of LDPE and NR obtained using the Haake rheometer at 40 rpm. Source: Own work.
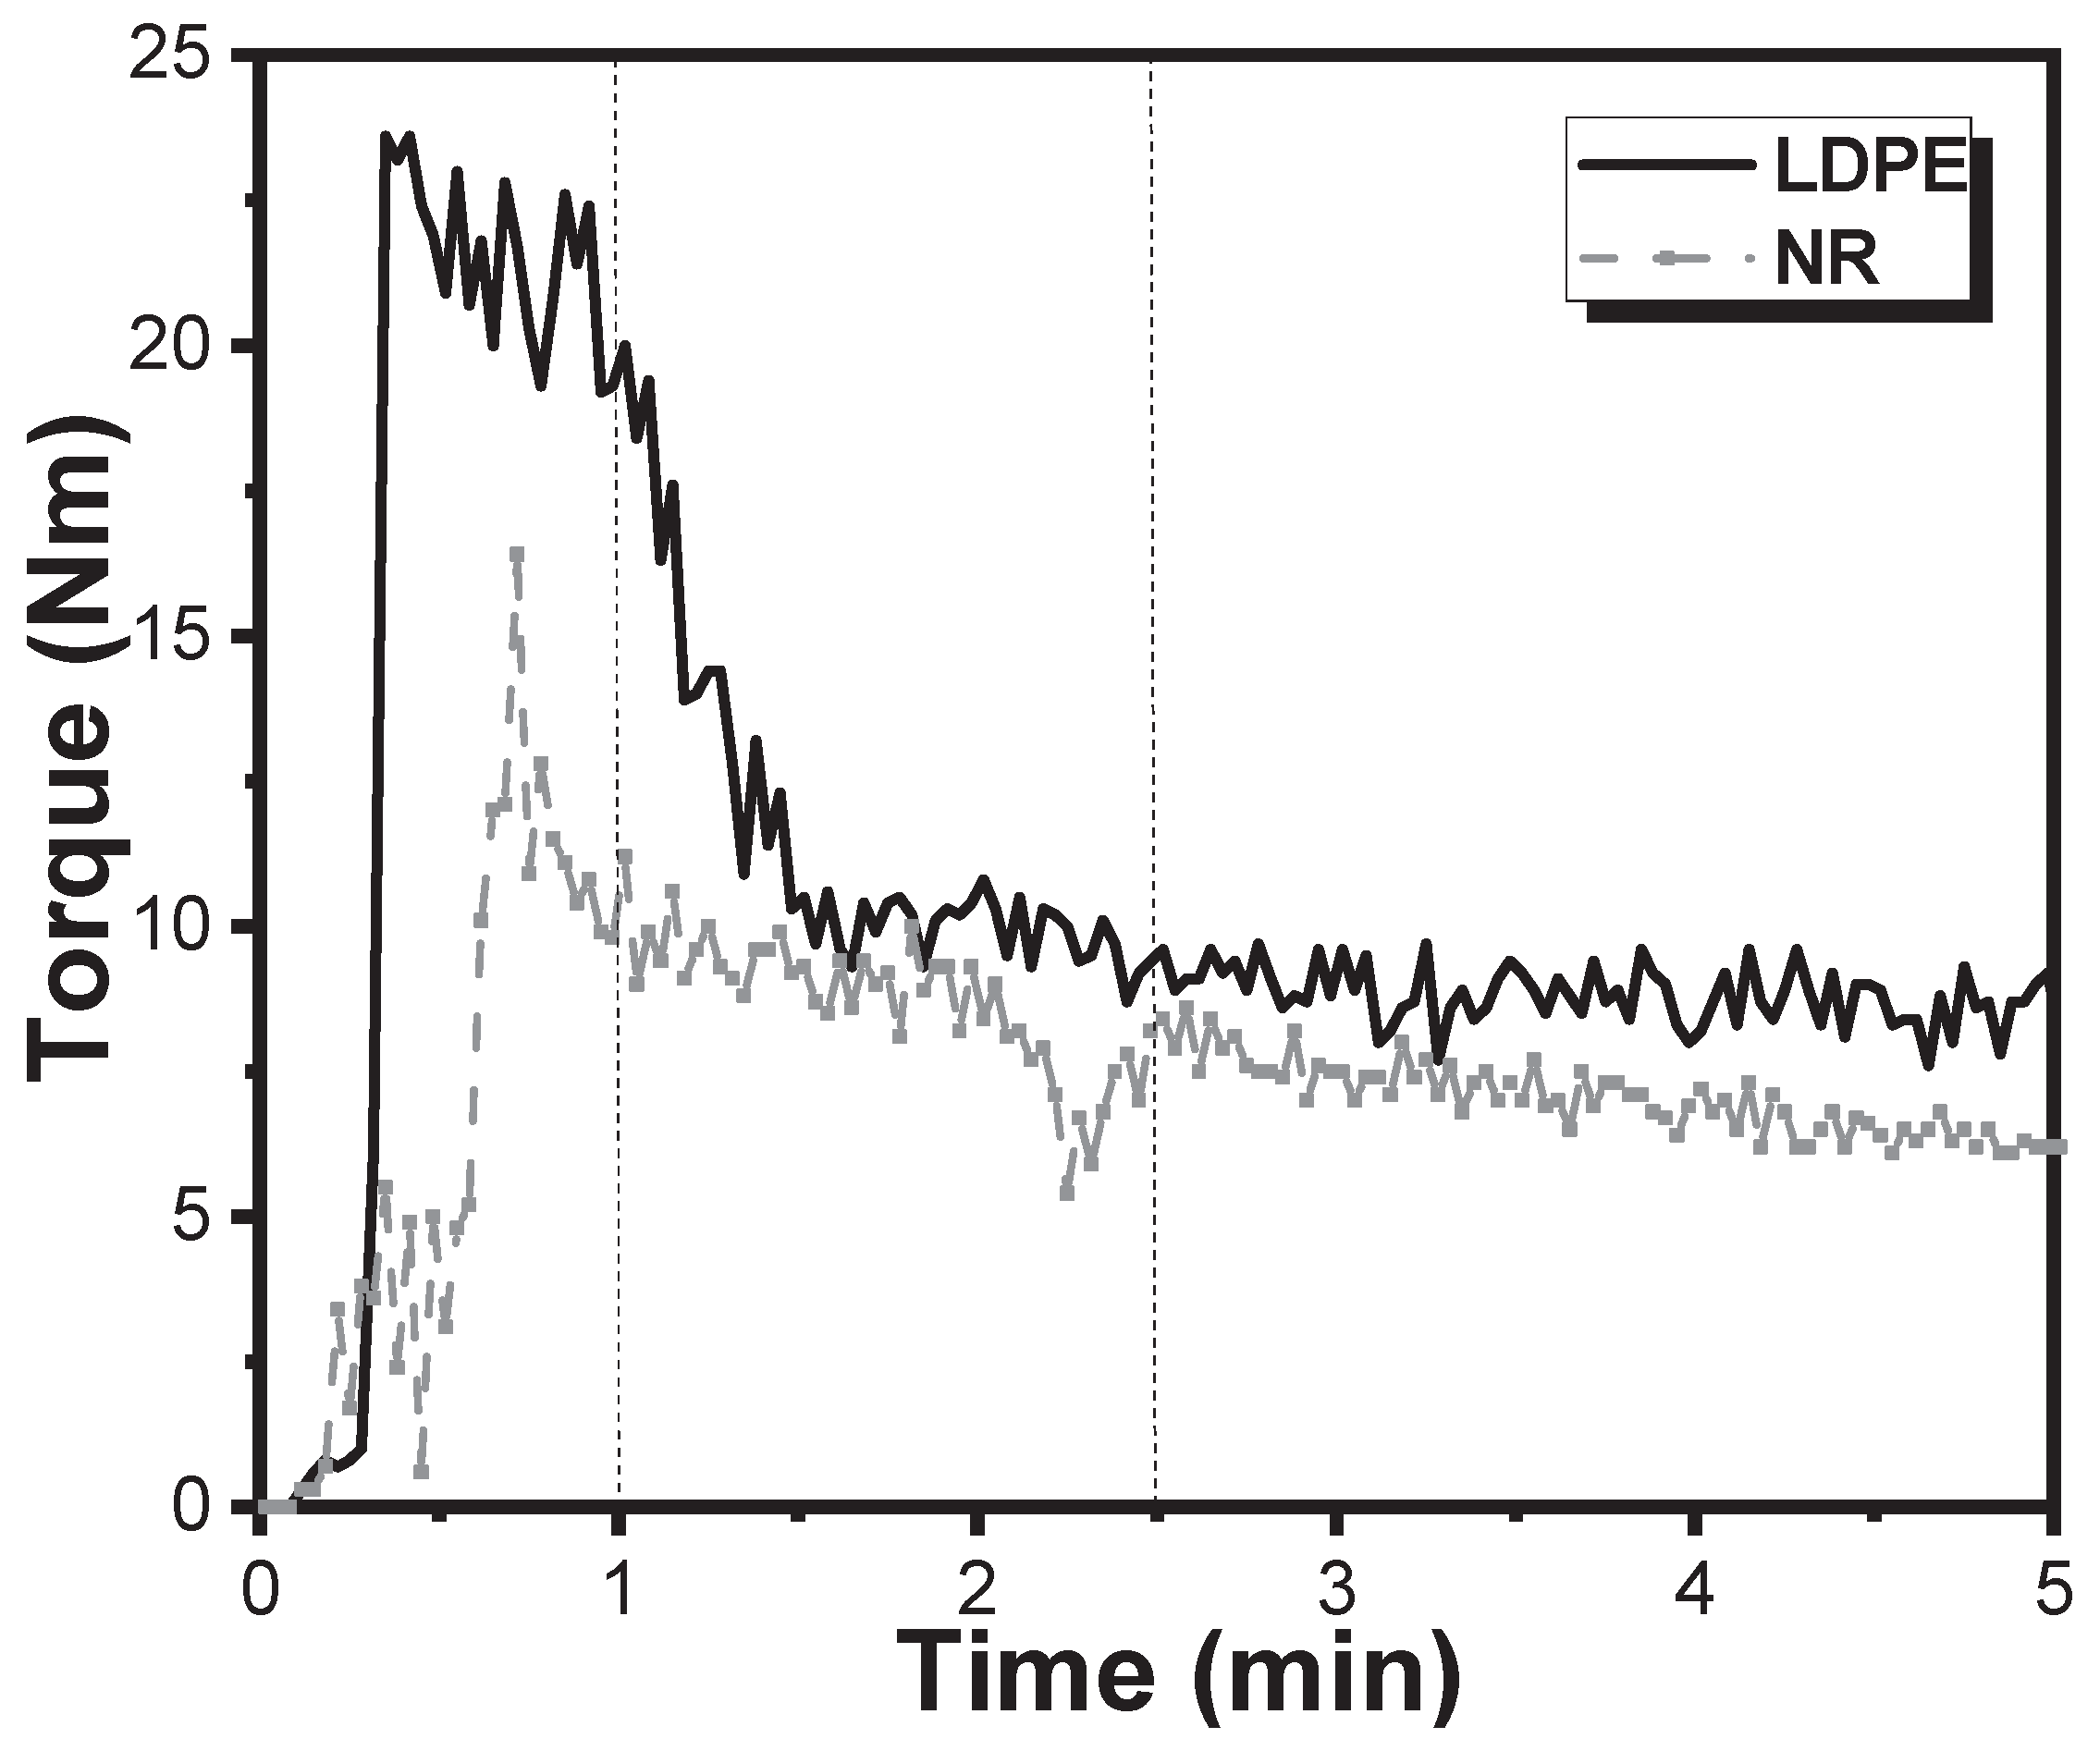
The rheological curves of the LDPE/NR blends at mass ratios of 90/10, 70/30, and 50/50 (without SCBA) were analyzed to understand the baseline behavior of the LDPE/NR system with vulcanizing agents and to provide a reference for final composite performance comparison. Rheometry indicated an increase in torque with the addition of PE, suggesting good material interaction. This result was later confirmed by the increased tensile strength and elongation observed in tensile test.
Table 2 presents the results for LDPE/silanized masterbatch blends at mass ratios of 90/10, 70/30, and 50/50 with 25% SCBA, compared with those for individual LDPE, NR, and LDPE/NR blends. The samples were processes at 40 and 80 rpm with vulcanizing agents. The goal was to obtain TPEs and evaluate the influence of component coupling and processing parameters on the tensile and elongation response.
During the first minute of mixing, the increase in torque values corresponded to the start of the LDPE melting process. The addition of the masterbatch caused the mixture to soften, leading to a torque decrease as chain disentanglement occurred. Subsequent increases in final torque in certain samples indicated resistance to the rotor motion, which suggests the occurrence of crosslinking reactions and increased molar mass and viscosity. Conversely, a low final torque indicates constituent compatibility and complete fusion during processing.
The increased final torque in the samples blended with vulcanizing agents was associated with higher tensile strength and elasticity compared to the LDPE/NR blends without SCBA. Therefore, it was concluded that the blended materials exhibited good compatibility and that the vulcanizing system successfully optimized the final properties.
3.2. Stress–Strain Behavior
The stress–strain curves for the LDPE/NR blends are shown in Figure 3, and those for the LDPE/silanized masterbatch blends processed with a vulcanizing system at 80 rpm are shown in Figure 4. In Figure 3, the tensile strength of the 90/10 and 70/30 blends was primarily influenced by the LDPE content. As the LDPE content increased, the blends exhibited greater stiffness due to the thermoplastic chains that limited deformation. Conversely, the 50/50 blend displayed higher maximum deformation, indicating a tendency toward elastic behavior. This suggests that the 50/50 blend behaves like a TPE, combining the semi-crystalline properties of the LDPE with the elastic behavior of the amorphous NR chains.
Comparison of the yield strength (Sy) of blends with and without vulcanizing agents revealed a clear enhancement upon vulcanization. Samples without vulcanization exhibited chain slippage at stress levels below 1.0 MPa. In contrast, vulcanized samples processed at 80 rpm achieved a Sy above 2.94 MPa, as is the case of the 50/50 blend. Additionally, the elastic range and overall stress–strain response were superior in the vulcanized samples, indicating improved constituent interaction.
A comparison of the tensile and elongation curves in Figure 4 with those in Figure 5 and Figure 6 highlights a significant improvement in performance. This improvement can be attributed to the optimization of the blend through the addition of vulcanizing agents, which enhanced interfacial adhesion and the distribution of reinforcing particles. Blends processed at 40 rpm exhibited good tensile strength; however, those processed at 80 rpm showed superior elongation, indicating enhanced constituent interaction and better polymer chain entanglement. The stress–strain results for all blend compositions are summarized in Table 3.
Subsequent analyses were carried out using dynamic, mechanical, thermal, and structural techniques, including DMA, TGA, DSC, and FTIR. As the 40 rpm samples showed no significant improvements, only results from samples processed at 80 rpm are presented, given the superior behavior observed in the stress and strain analyses for the thermoplastic composite with a 50/50 mass ratio.
3.3. Dynamic Mechanical Analysis
This technique was used to evaluate the viscoelastic and elastic behaviors of the samples. The storage modulus (E’) indicates the material’s elastic response, while the loss modulus (E’’) reflects its viscous behavior. The Tan δ (damping factor) provides insight into energy dissipation within the material. As the analysis temperature rose, the Tan δ values revealed more extensive molecular movements, suggesting increased free volume and reduced chain–particle interactions. Near the melting point of the thermoplastic phase, the SCBA particles no longer significantly influenced the material’s properties, as the polymer chains became more separated—this behavior was evident in the α-transition.
3.3.1. Tan δ Behavior
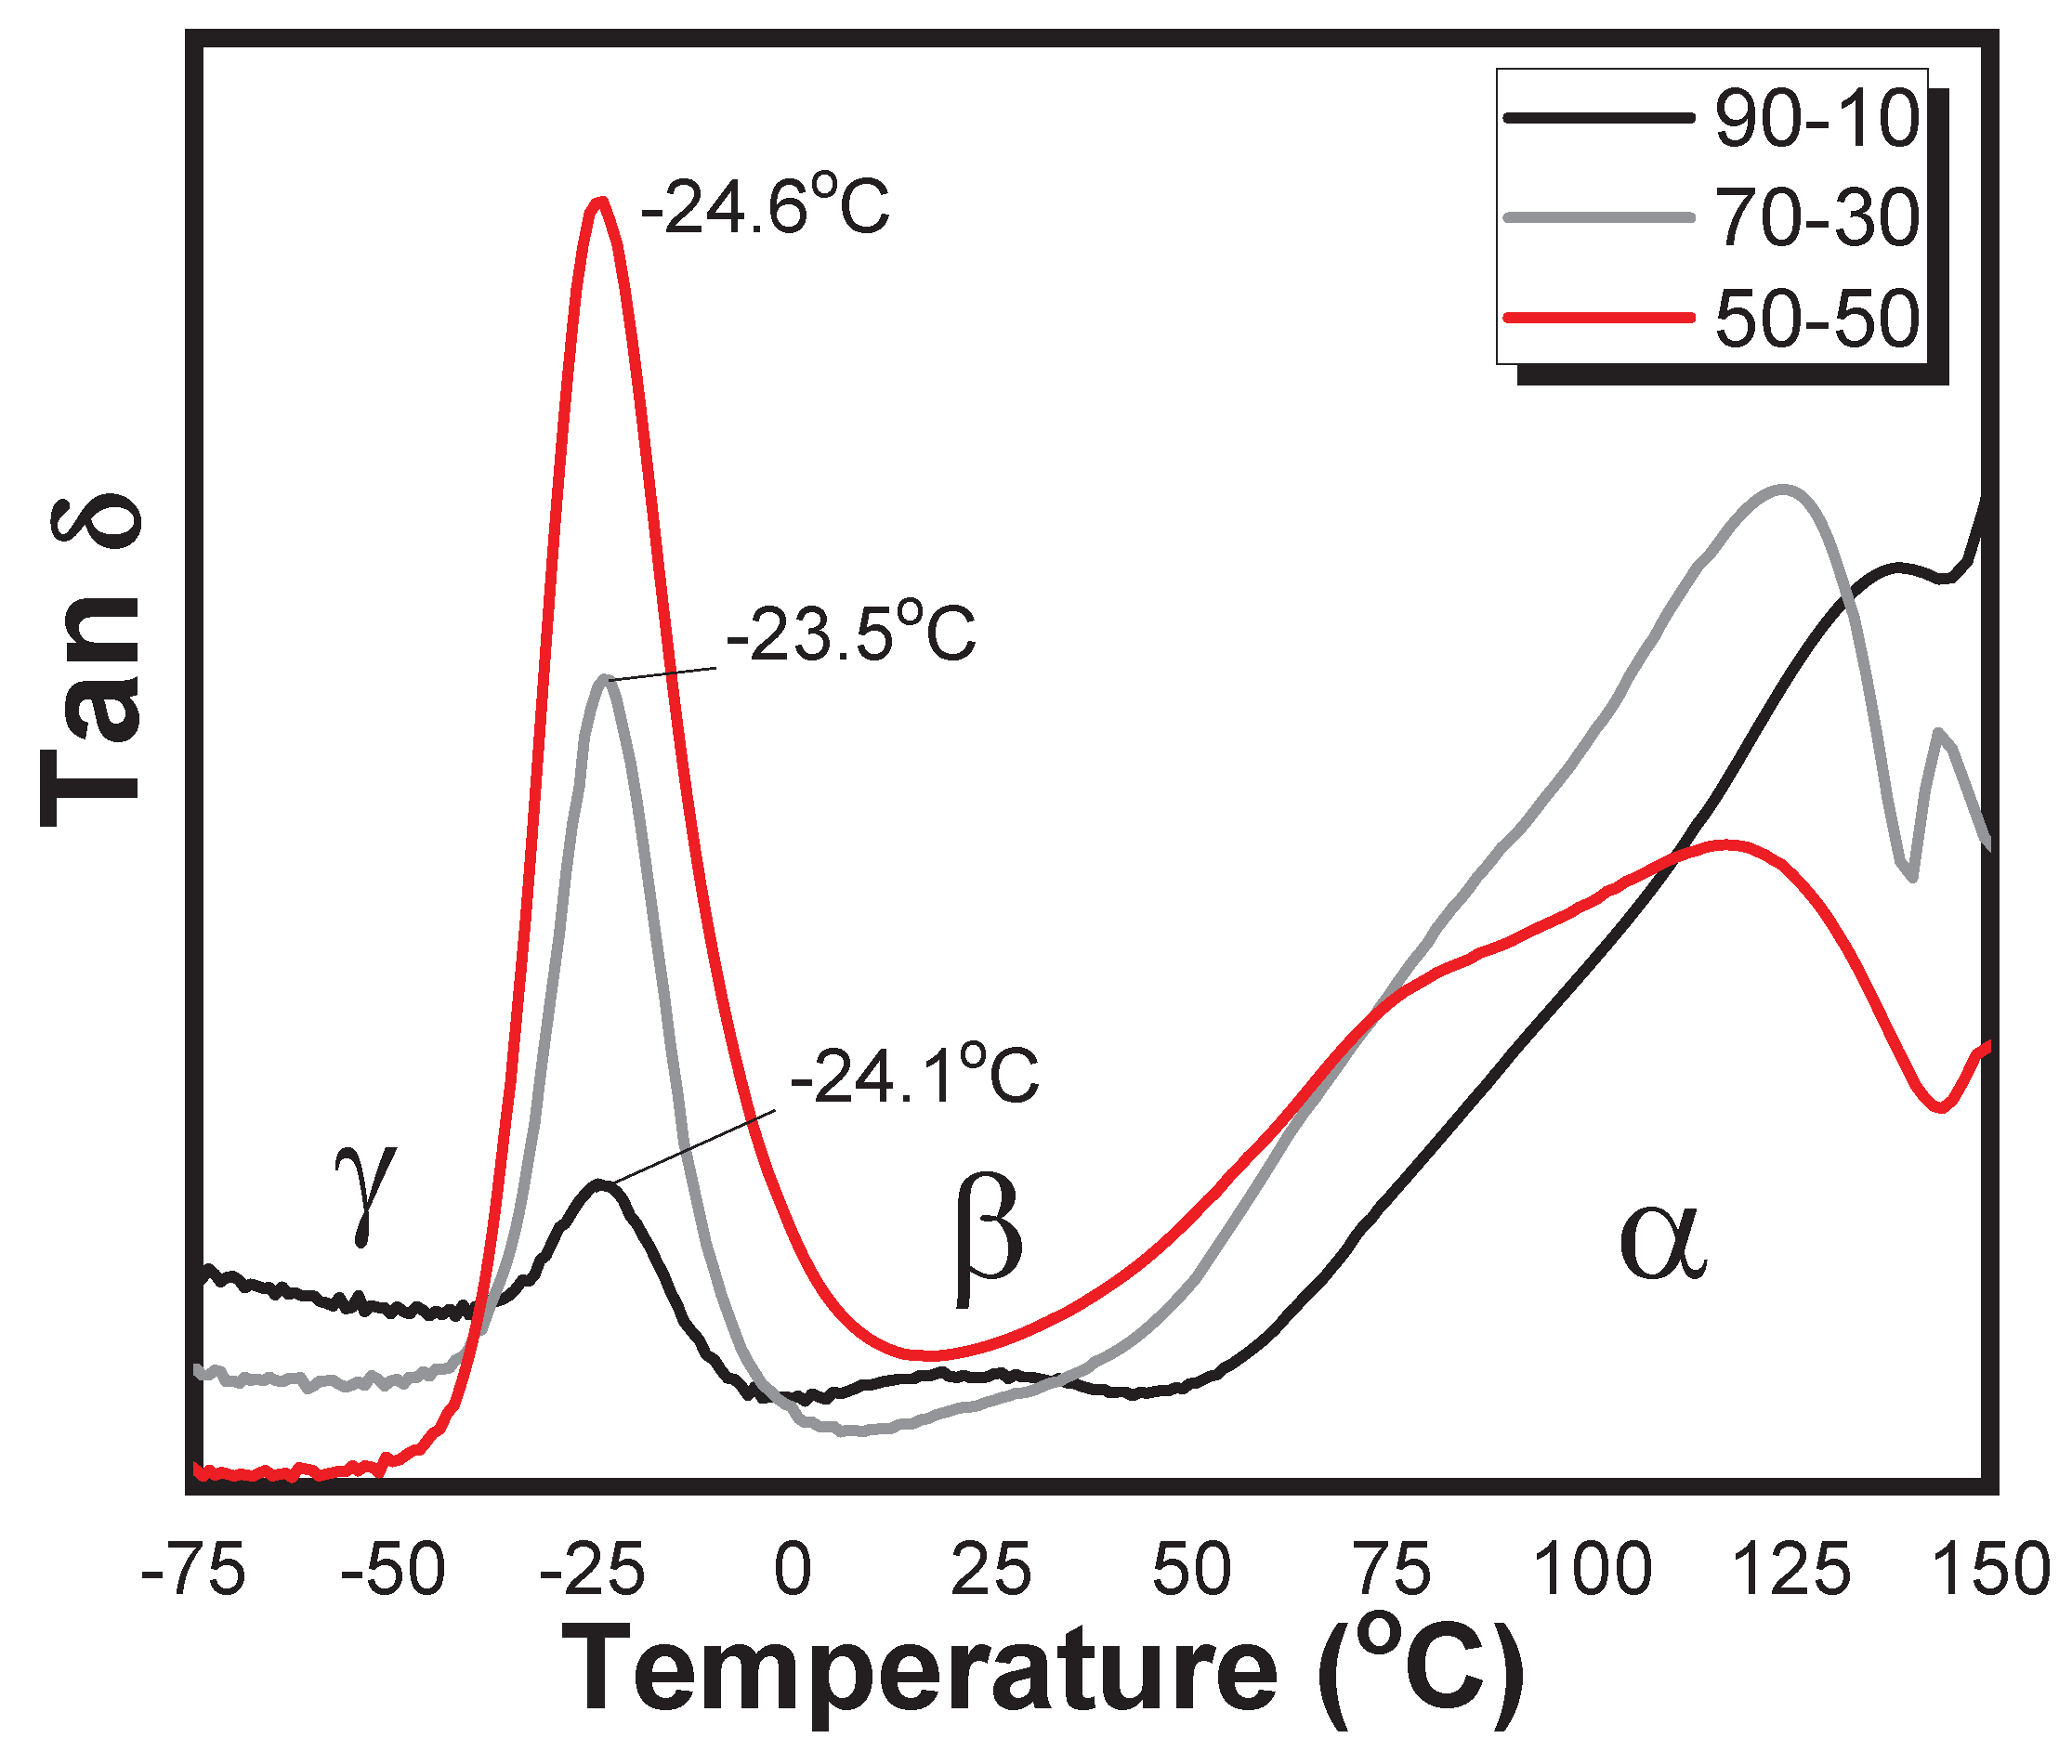
Figure 5 shows the Tan δ curves for the samples processed at 80 rpm. The most prominent Tan δ peak was observed in the blend with the highest NR content, indicating the most favorable ratio of dissipated to stored energy. This suggests a pronounced elastic behavior with a tendency for energy dissipation, as supported by the E’’ values shown in Figure 6. During deformation, the material exhibited low chain mobility within the temperature range of -49°C to -10°C, with the Tan δ peak occurring at -24.6°C. A decrease in the peak height of the Tan δ curve corresponded to an increase in the material’s elastic modulus. Maximum modulus values were obtained from blends containing 90% LDPE, particularly at 25°C.
A shift in the glass transition temperature (Tg) was observed after the incorporation of LDPE and SCBA into the NR matrix. As shown in Figure 8, the Tg of pure NR started at around -45°C. With the addition of the fillers, the Tg approached -25°C, a value consistent with those reported in the literature. This integration broadened the range of semi-crystalline behavior of the samples, resulting in increased composite stiffness.
The relaxation of the polymer chains involves localized molecular motions. Below Tg, chain mobility is significantly reduced, resulting in a more rigid material behavior. In the blends, Tg is associated with the amorphous phase and is characterized by limited molecular movement in the temperature range of -30°C and -20°C, as also evidenced by the abrupt drop in E’. The different molecular motion stages observed in the Tan δ curves indicate that in the γ region, between -70°C to -50°C, the chains exhibit a glassy behavior typical of NR, with restricted movement. As the temperature increases, the β region marks the beginning of chain relaxation, which intensifies until reaching the α transition, where the constituent polymer chains experience maximum relaxation. This occurs between 100°C and 150°C, corresponding to the melting point of the PE phase and indicating the transition to a molten state.
The mobility of the polymer chains is closely related to the polymorphic nature of the NR/ LDPE blends containing SCBA. Compared to pure NR, the blends exhibited reduced elasticity due to the presence of SCBA particles. However, an increase in both the E’ and elasticity observed in the stress–strain analyses indicates an improved matrix–filler interaction, especially as the LDPE content increases. Furthermore, the presence of narrow peaks supports the uniform distribution of SCBA particles in the matrix [70].
Figure 5.
Tan curves for the LDPE/masterbatch blends processed at 80 rpm. Source: Own work.
3.3.2. Storage Modulus
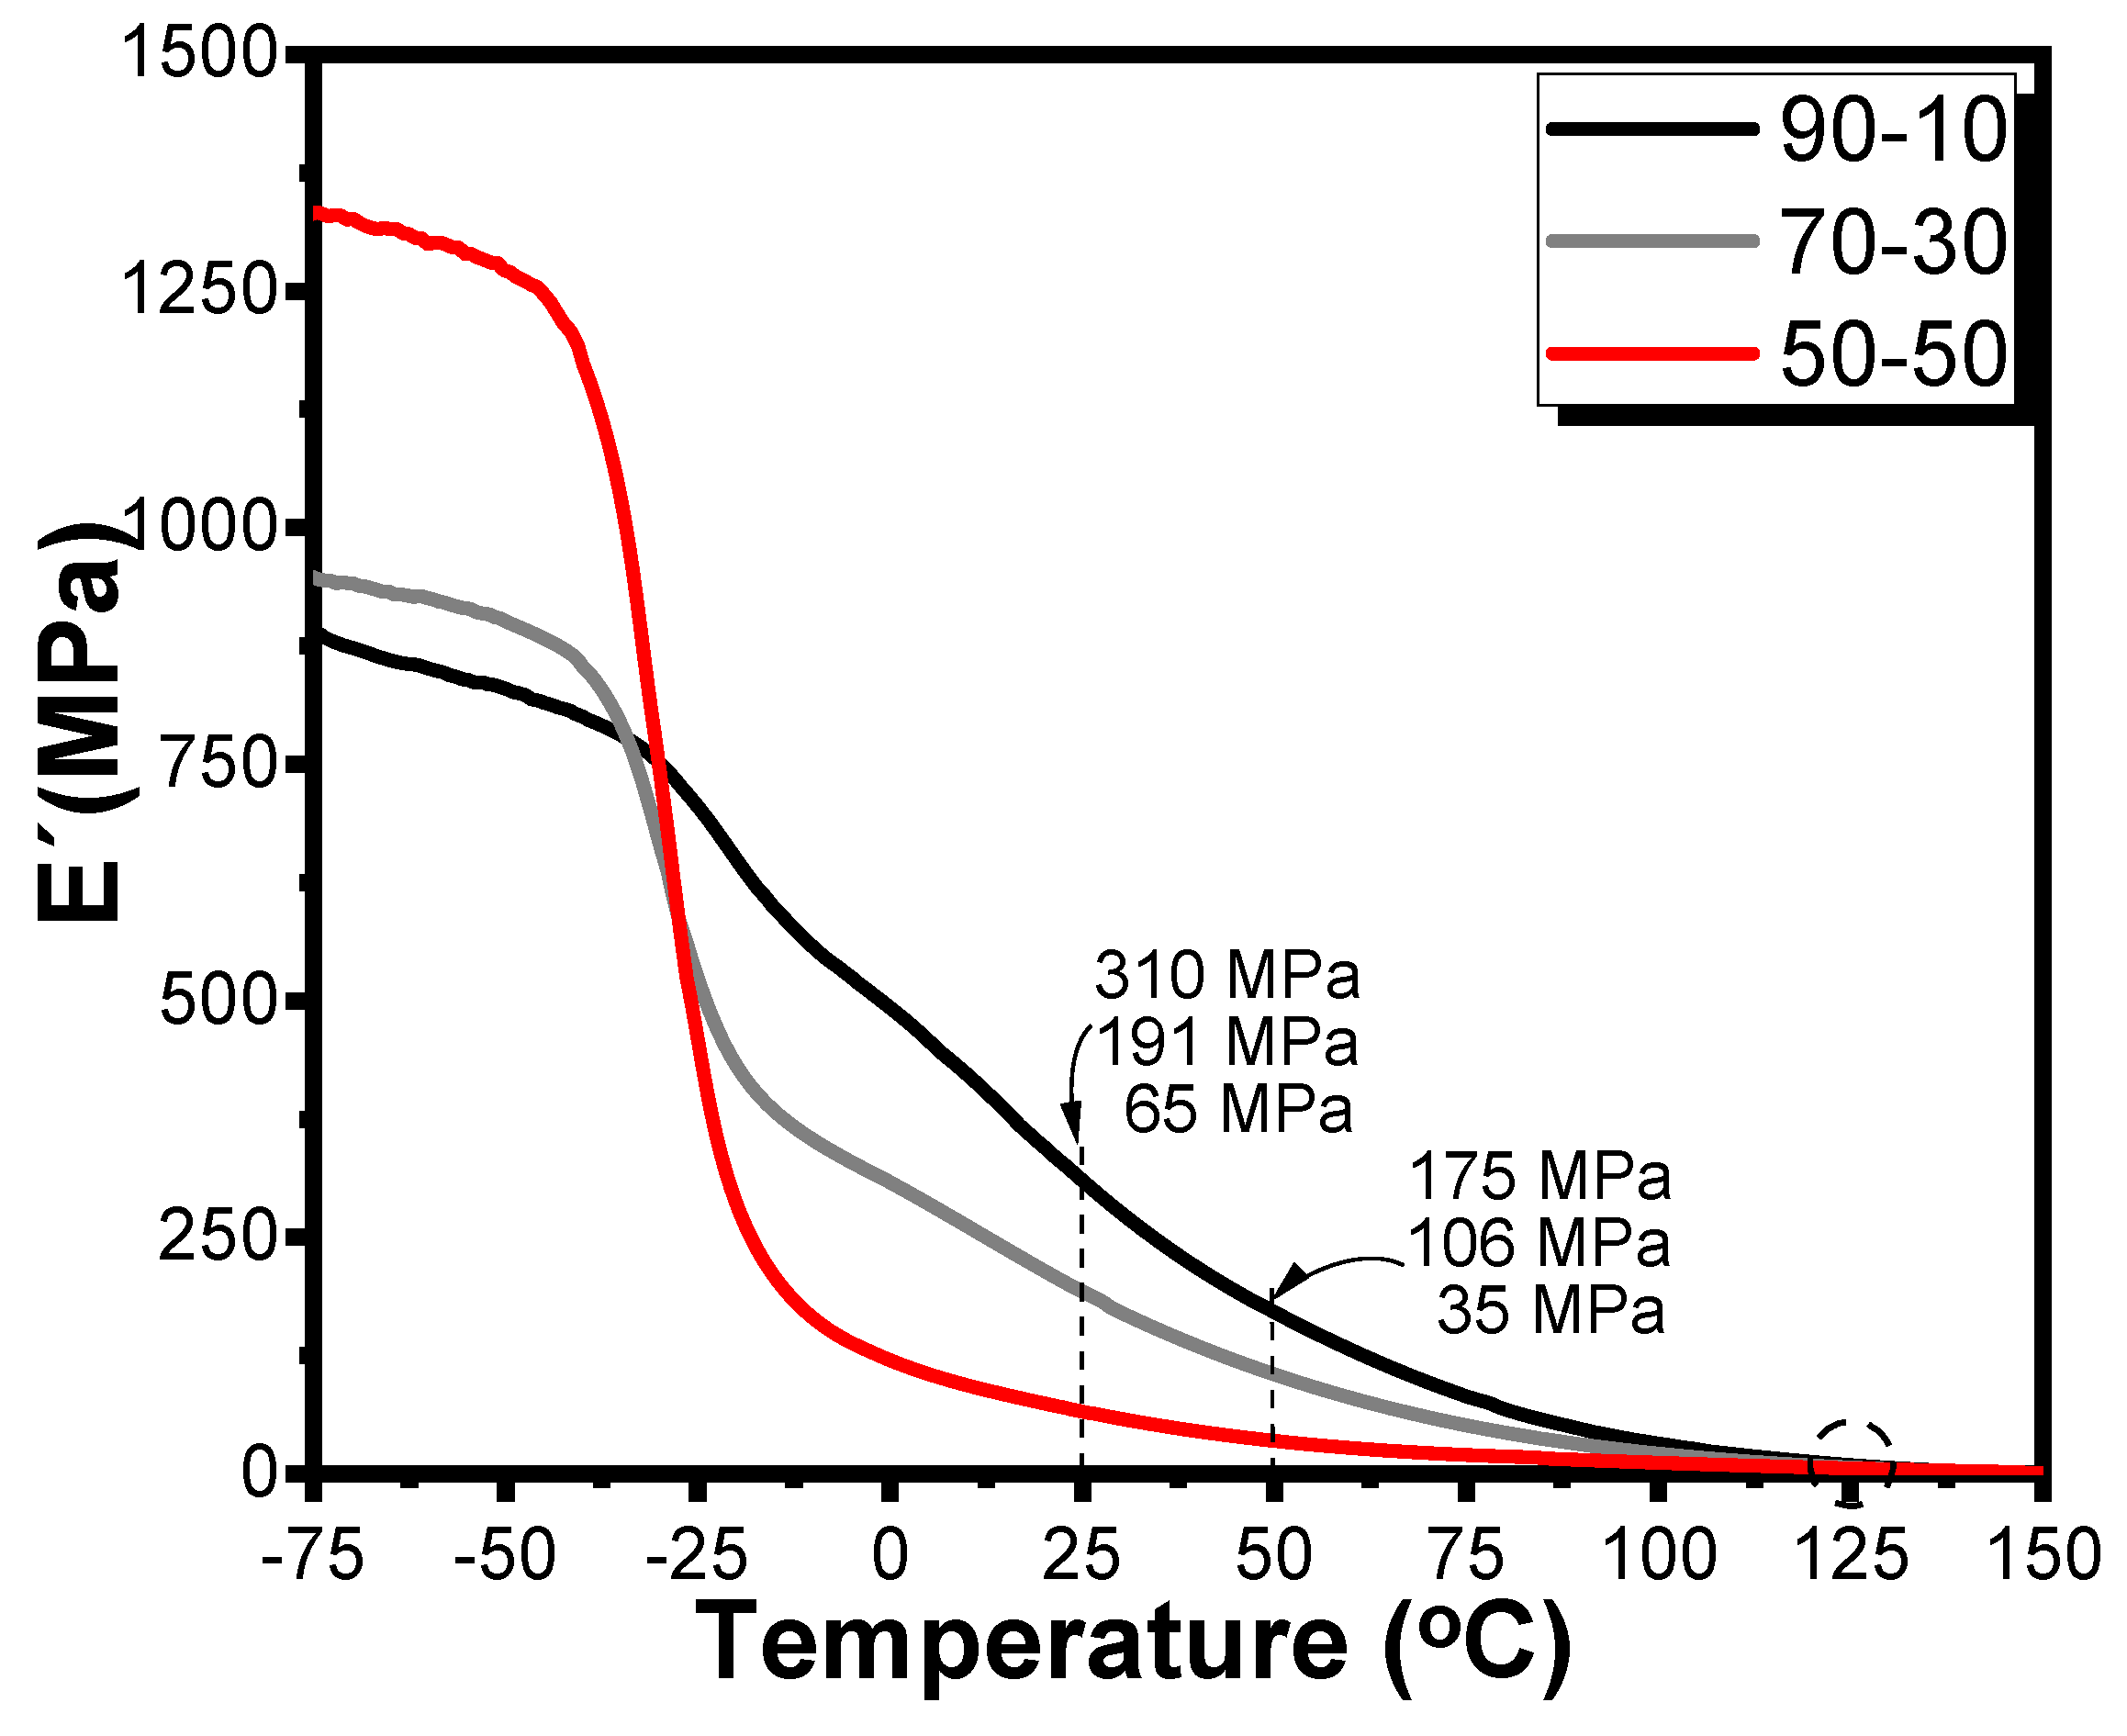
Figure 6 displays the E’ for the LDPE/silanized masterbatch blends processed with vulcanizing agents. At low temperatures (-75°C), all blends exhibited high E’ values, which reflected limited polymer chain mobility and increased stiffness due to the glassy state of the material in this temperature range. Moreover, E’ values gradually decreased with increasing temperature, reaching approximately 12 MPa at 126°C, where the material approaches the softening region. These E’ values were also compared at 25°C and 50°C—temperatures relevant to industrial applications. At these points, the highest modulus values were observed in blends with higher LDPE content, as shown by the curves. Notably, among the blends processed at 80 rpm, the 50/50 composite demonstrated the most favorable E’ profile. The analysis of the dynamic mechanical behavior serves as a valuable tool for identifying potential applications and guiding the industrial use of the developed materials.
Figure 6.
Storage modulus curves for the LDPE/silanized masterbatch blends. Source: Own work.
3.3.3. Loss Modulus
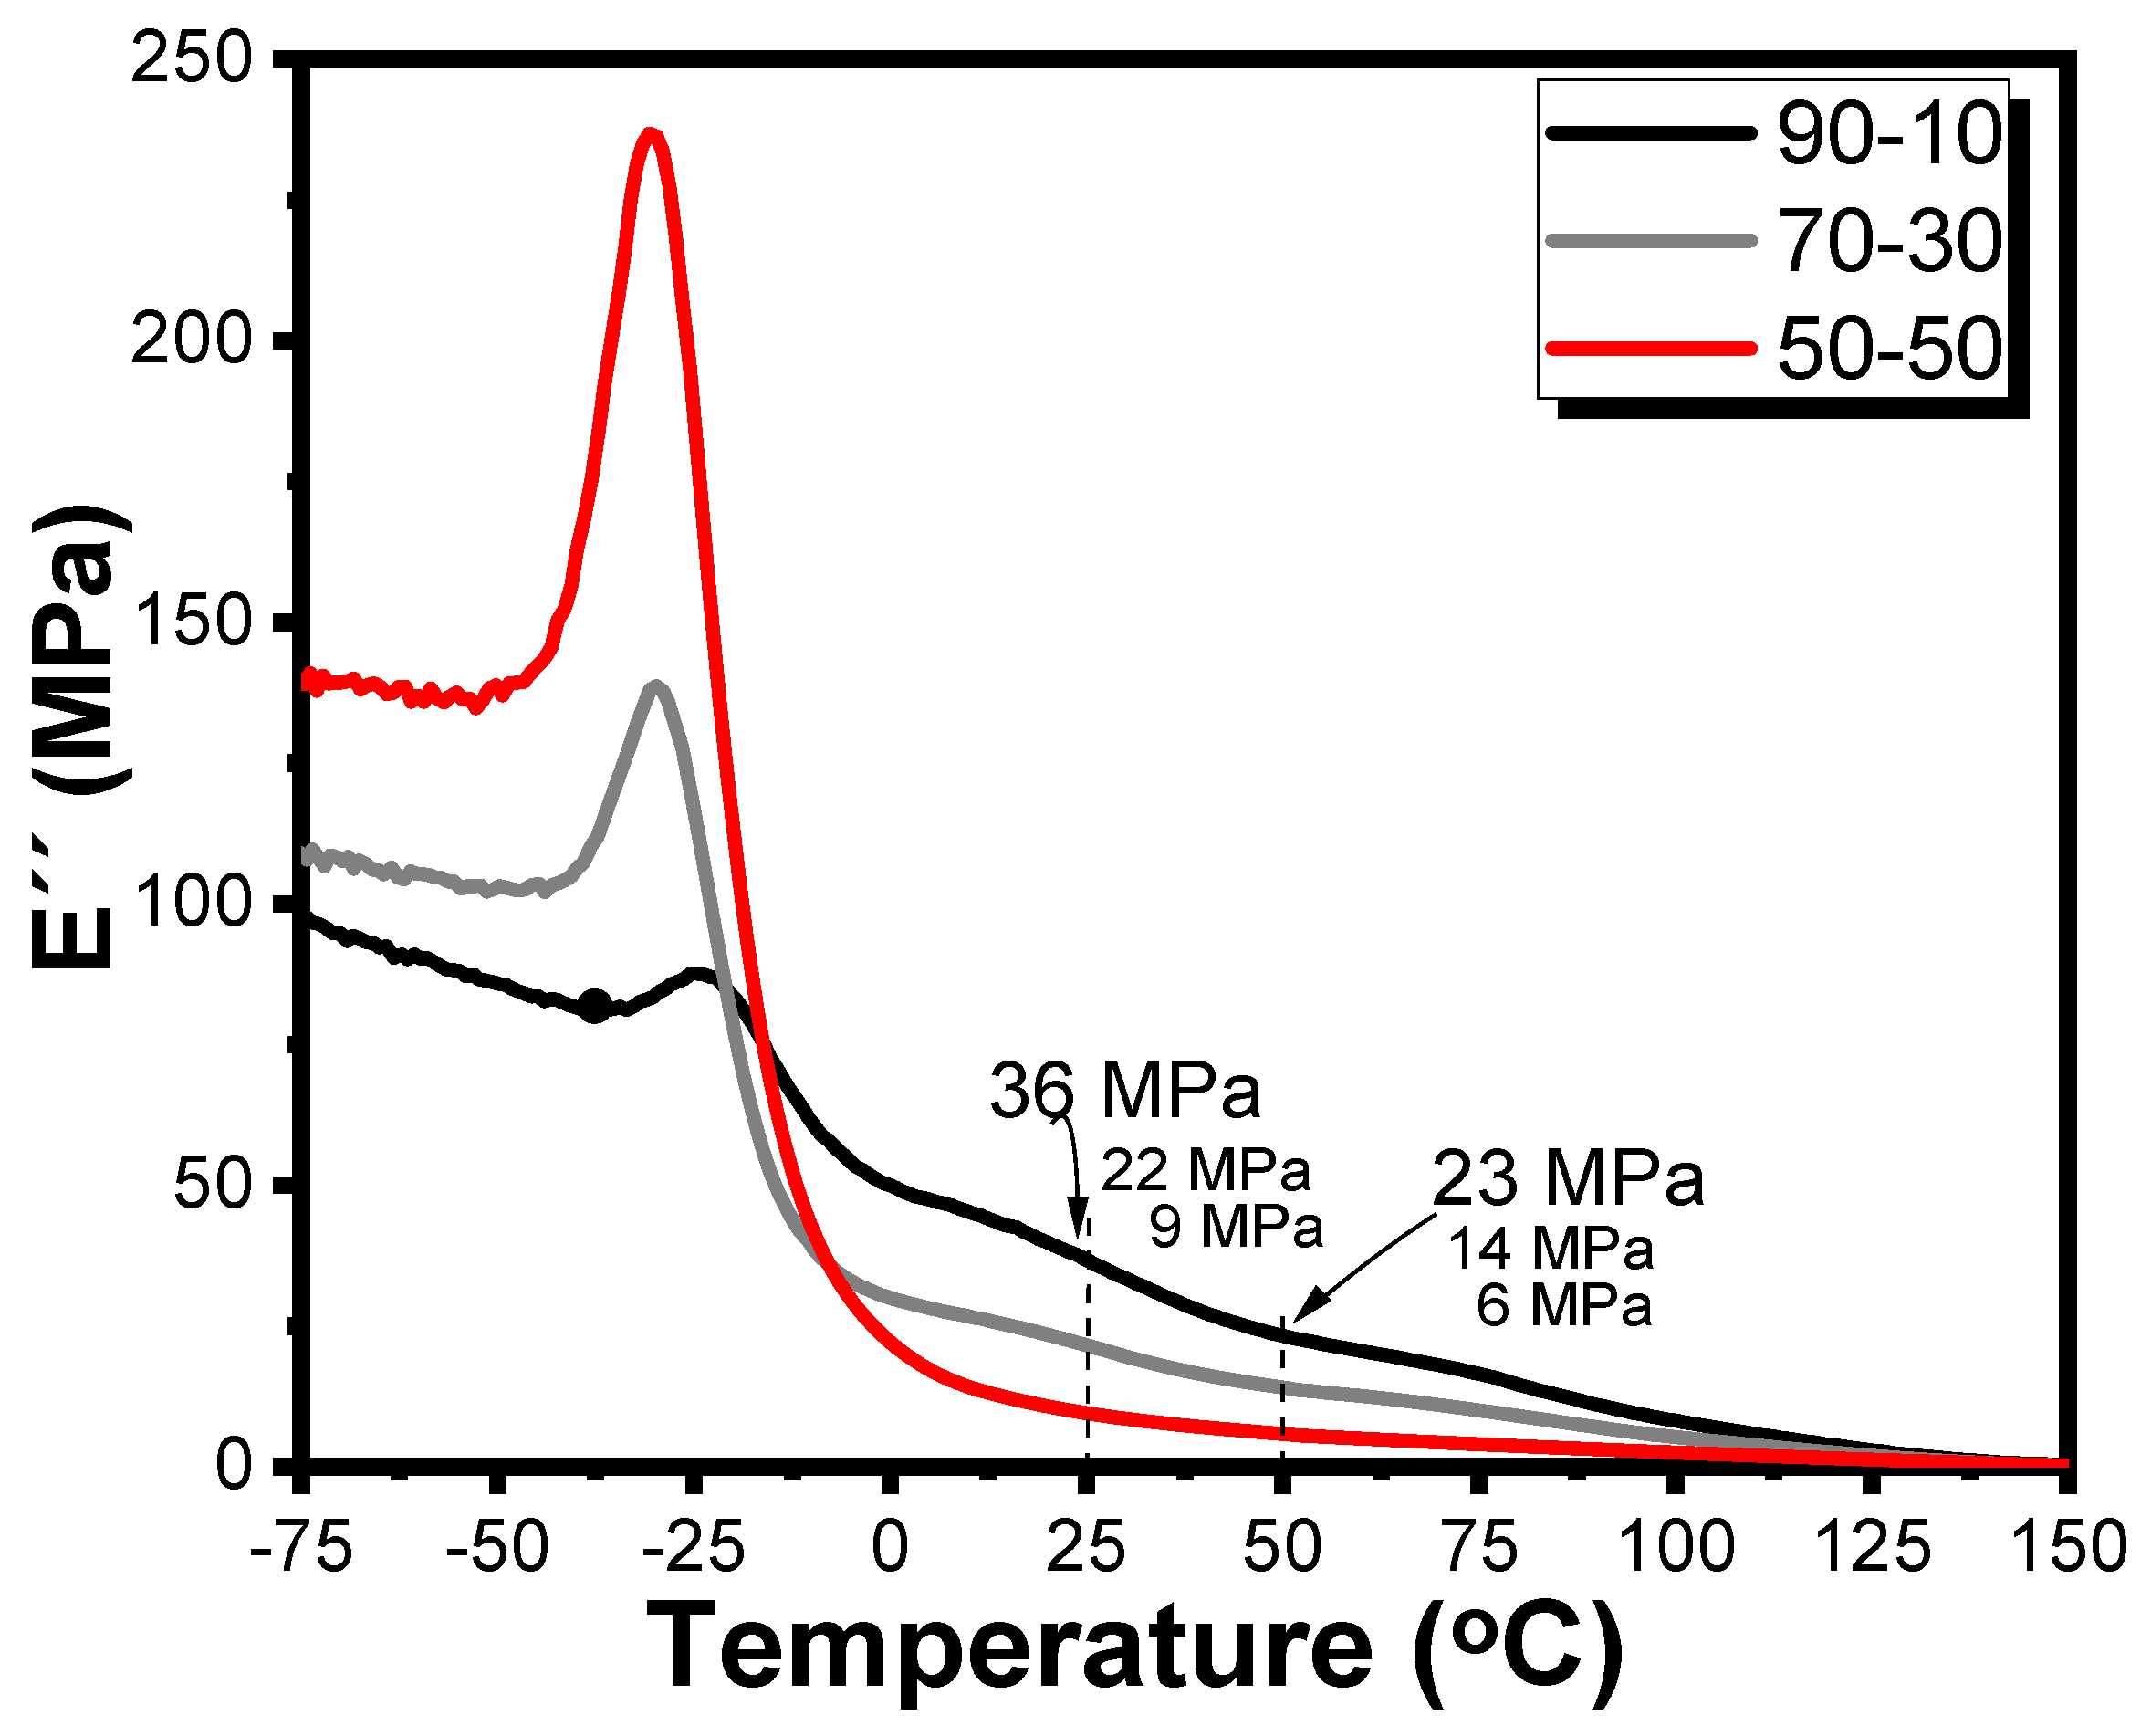
Figure 7 presents the E’’ curves for the LDPE/silanized masterbatch blends processed with vulcanizing agents. At low temperatures (-75°C), the developed blends exhibited high energy dissipation modulus values. As the temperature rose during the analysis, the E’’ values decreased proportionally, reaching approximately 12 MPa at 126°C for all the blends studied. When comparing the E’’ values at 25°C and 50°C, the highest values were observed in blends with a dominant presence of the semi-crystalline LDPE phase, which contributed to improved thermal behavior. Consequently, the dynamic and mechanical response of these composites confirms their potential for industrial applications.
Figure 7.
Loss modulus curves for the LDPE/silanized masterbatch blends. Source: Own work.
It can be concluded that SCBA particles interact with the polymer chains, causing a decrease in damping (Tan δ), while still maintaining favorable performance in both the E’ and E’’ in samples containing 90% and 30% LDPE by mass. Based on the literature, [71], the observed blends exhibited a good degree of coupling, as evidenced by the Tan δ curves and the E’ and E’’ behavior. In addition, the blends demonstrated strong interactions, and no significant change in the Tg was detected.
3.4. Thermogravimetry
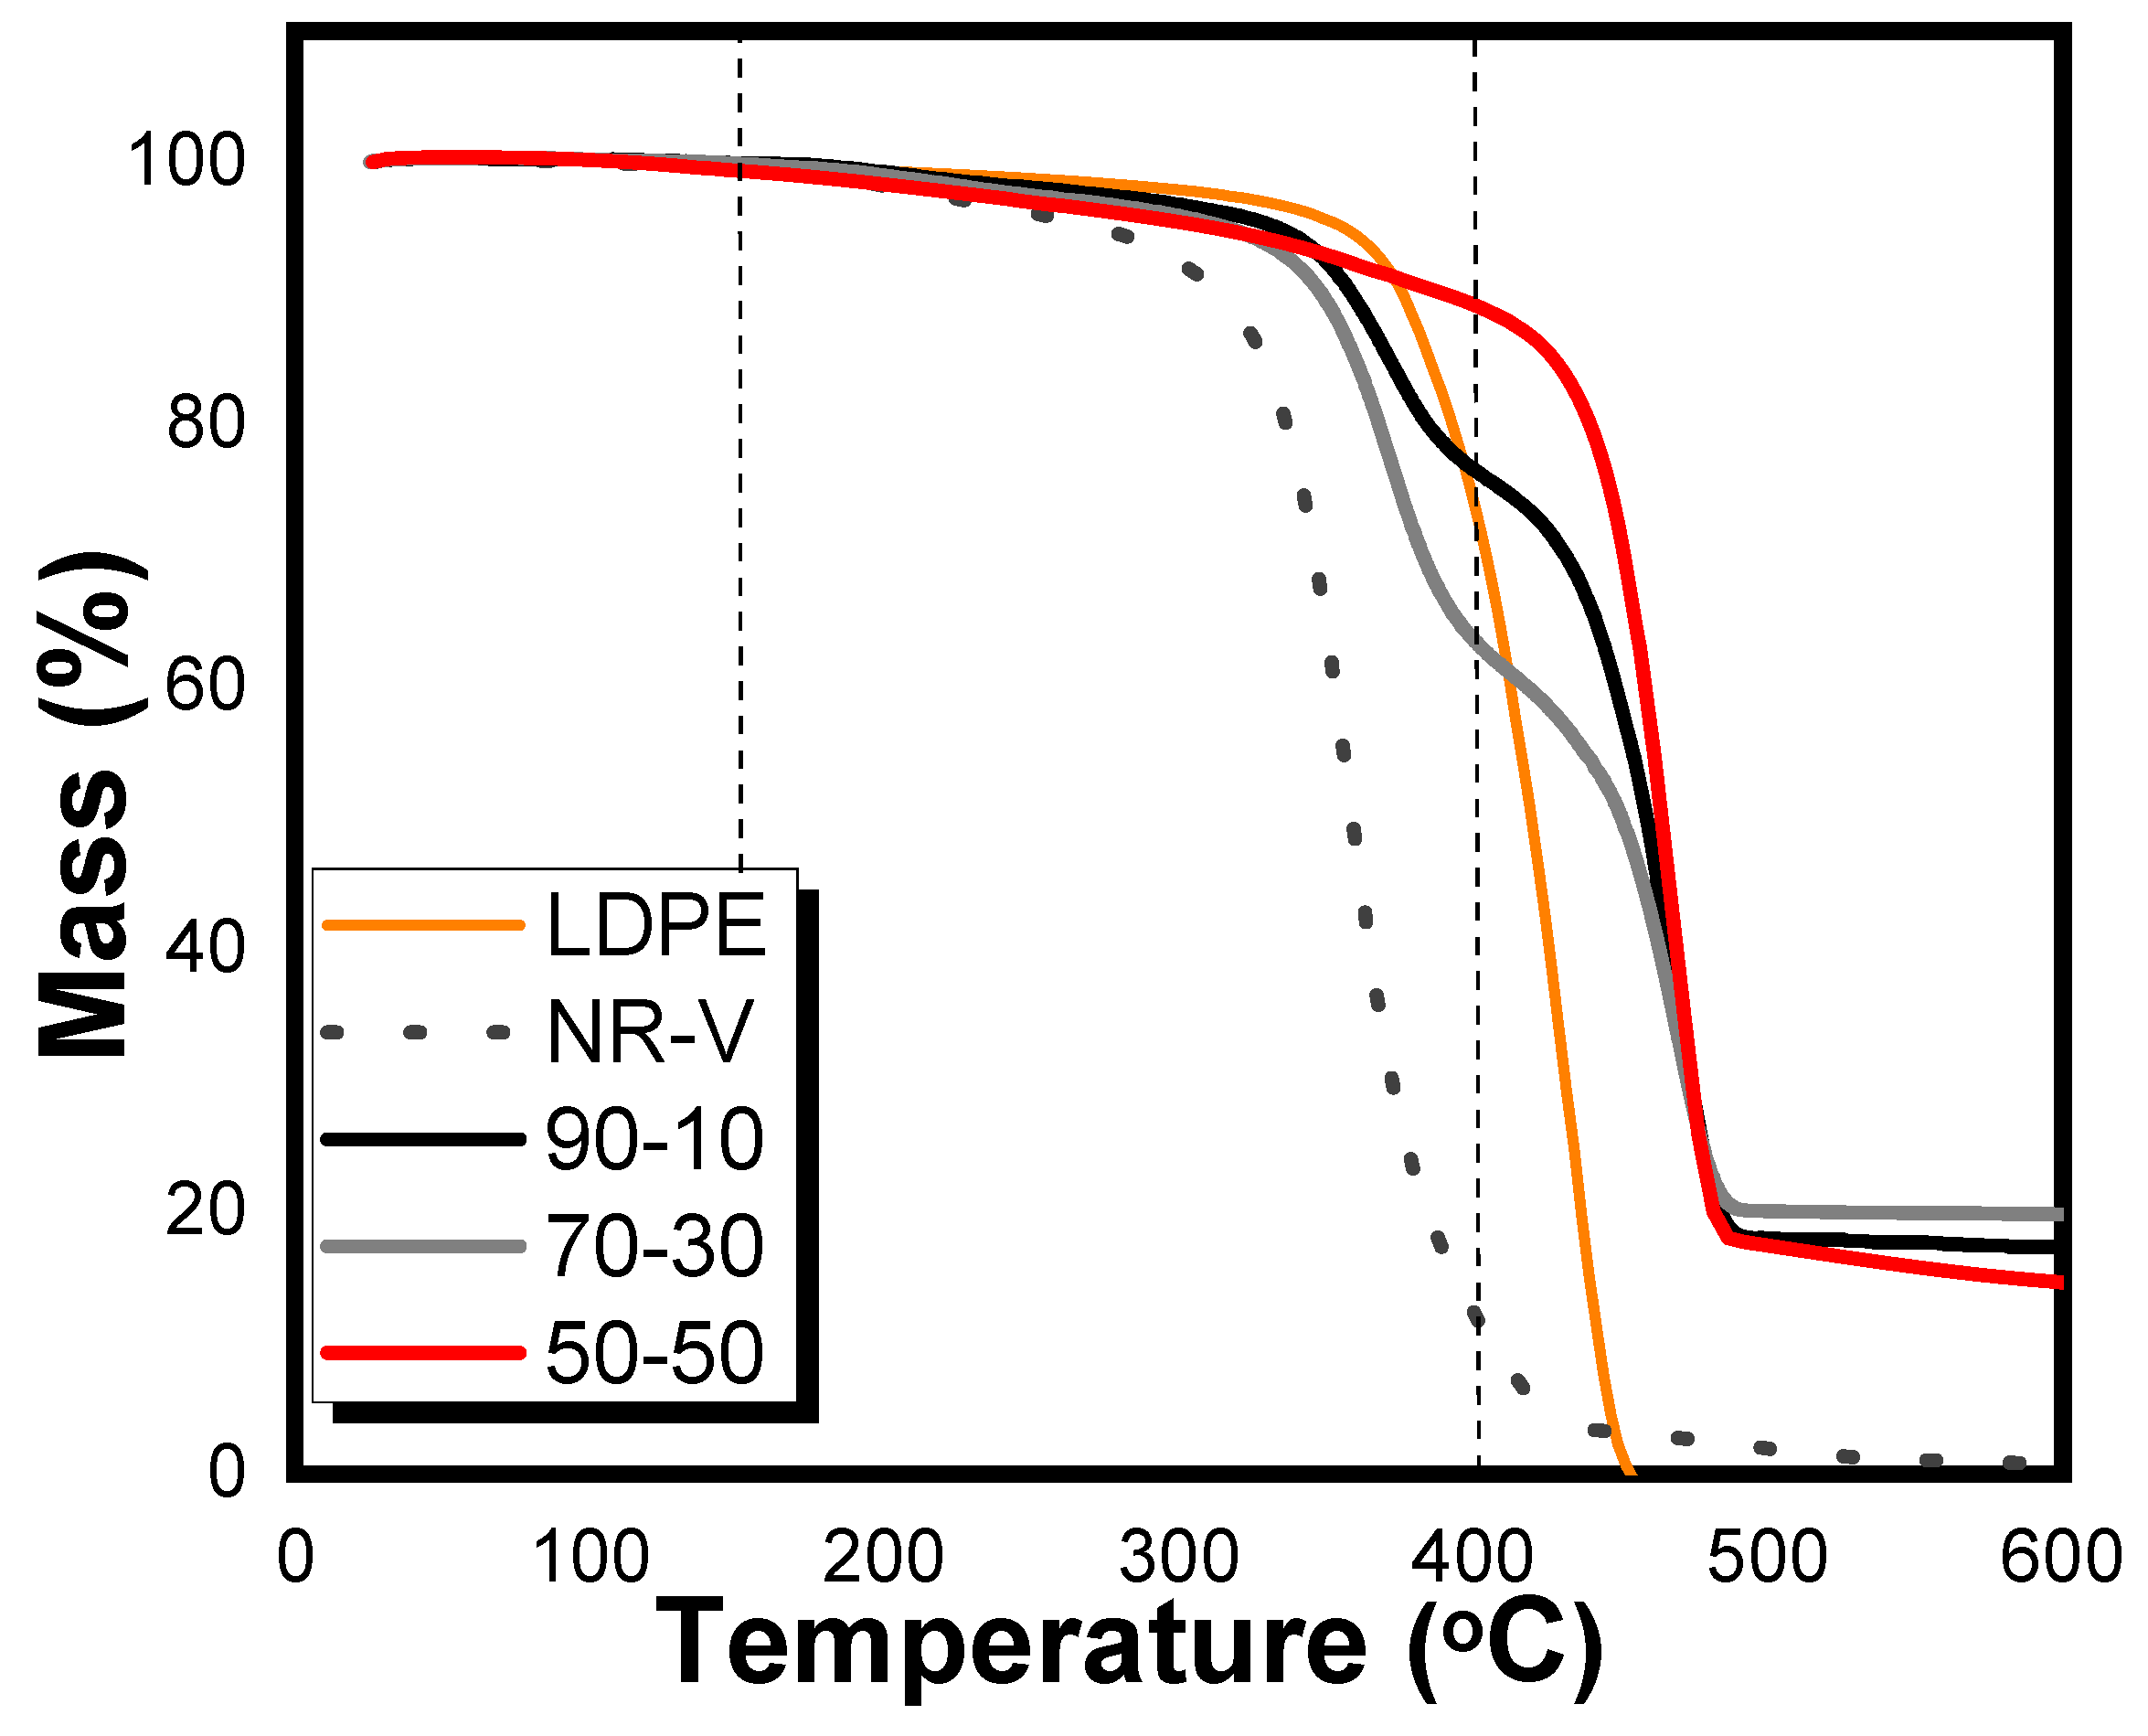
The thermal degradation of the samples processed at 80 rpm, analyzed using the TG technique, is shown in Figure 8. Mass changes reflect the behavior of the materials, where homogenization of the phases occurred due to the increased shear rate. This shear facilitated the orientation of the ash fraction within the polymer matrix, contributing to the favorable thermal performance previously observed only in rubber blends. Notably, thermal degradation was more pronounced in samples with lower LDPE and higher NR content, indicating greater mass loss with increasing NR content. Specifically, the 90/10 blend showed an 11% reduction in mass; the 70/30 blend, a 24% reduction; and the 50/50 blend, a 33% reduction.
Thermal degradation occurred in three phases. In the first phase, between 0°C and 200°C, materials exhibited less than 1% mass loss. In the next phase, between 200°C and 400°C, vulcanized NR degradation took place. In the final phase, between 400°C and 600°C, a significant 82% mass loss was observed, leaving a residual mass of 18%, which corresponds to the SCBA content.
Figure 8.
Thermogravimetric curves for the LDPE/silanized masterbatch blends with curing agents and NR. Source: Own work.
Figure 8.
Thermogravimetric curves for the LDPE/silanized masterbatch blends with curing agents and NR. Source: Own work.
It can be concluded that the analyzed materials exhibit good thermal stability for industrial applications, as evidenced by the minimal degradation of up to 150°C. This behavior is attributed to the mixing process, which promoted a good degree of coupling.
3.5. Differential Scanning Calorimetry
Figure 9 and Figure 10 show the DSC curves for the 90/10, 70/30, and 50/50 mass proportions of the different compatibilization systems under study. The curves reveal that the baseline gradient associated with the Tg of NR decreases as the LDPE content in the blend increases. This behavior corroborates the tensile strength test results, which indicate that the polymer present in greater proportion acts as the continuous phase in the blend, with its properties prevailing in the final material.
According to Figure 9, the Tg of NR occurs at a temperature of -60°C, in agreement with literature values that report Tg around -67°C. The curve for SCBA exhibits a linear profile, attributed to the high silica content, and displays the expected thermal behavior up to 900°C. For LDPE, a first-order transition is recorded at 115°C, which is also observed in the PE-g-AM samples, indicating the melting of the material. This transition corroborates the results of the torque rheometry tests conducted in the initial stage of the study. The broadness of the peak observed in the DSC curve is attributed to the wide molar mass distribution, which is influenced by molecular branching and the variability in crystal size. Figure 10 displays similar behavior, with no major changes in the enthalpy values across the samples analyzed.
3.6. Fourier Transform Infrared Spectroscopy
Figure 11 and Figure 12 show the FTIR spectra of the LDPE/NR and LDPE/masterbatch blends with the vulcanization system. These spectra complement the previous analyses of the blended materials without the vulcanization system. The spectral region between 4000 and 2000 cm-1 was omitted in this analysis because no relevant changes in the vibrations were detected. The structural analyses were carried out to detect possible chemical bonding or to confirm the presence of physical blends with improved physical and mechanical properties. These results are further supported by the stress–strain curves in Figure 3 and Figure 4.
Figure 11 illustrates the spectra of the LDPE/NR blend containing vulcanizing agents. The bands observed between 720 and 780 cm-1 correspond to the bending vibrations of the CH group and the angular bending of the CH2 group, characteristic of LDPE. The bands in the region between 950 and 1400 cm-1 are typical of functional groups present in cis-1,4-polyisoprene. In particular, the band at 1375 cm-1 corresponds to the asymmetric deformation of the CH3 group. Bands around 1450 to 1542 cm-1 are related to the axial deformation modes of the CH2 and CH3 groups. Notably, no significant differences were observed among the spectra of the various blends, establishing a baseline for identifying potential spectral changes caused by the presence of SCBA, as shown in Figure 11 and Figure 12.
Figure 12 displays the FTIR spectra of the LDPE/masterbatch blends with the vulcanization system. Notably, characteristic bands of SCBA appear between 500 and 1100 cm-1, corresponding to the siloxane (Si-O-Si) functional groups. The bands between 950 and 1100 cm-1 are attributed to the presence of silane and siloxane groups associated with the silane-treated SCBA in the masterbatch. As the proportion of masterbatch in the LDPE blend increases, the intensity of the peaks in the spectrum also grows.
Based on these results, no chemical bond formation was detected in the blends, confirming the development of a physical polymer blend.
3.7. Scanning Electron Microscopy
Figure 13 presents SEM micrographs of the cryogenically fractured surfaces of the LDPE/NR blends. All images were captured at 200x magnification. Particularly, Micrograph A (90/10) reveals a surface with staggered fractures and small smooth regions, indicating good interfacial cohesion. This morphology is typical of thermoplastics and correlates with the enhanced tensile strength observed in mechanical testing.
Micrograph B (70/30) displays an increase in fracture density, indicating a more brittle behavior. This change in fracture pattern is associated with reduced tensile strength and elongation at break. In addition, this micrograph shows the presence of vulcanizing agents on the fracture surface.
Lastly, Micrograph C (50/50) exhibits a widespread distribution of fracture lines across the entire surface. The increased appearance of vulcanization residues in this sample correlates with the higher NR content in the blend. This morphology suggests a more ductile fracture mechanism compared to the other blends.
3.7.1. Vulcanized LDPE/NR Blend
Figure 14 shows SEM micrographs of cryogenic tensile fracture surfaces for the LDPE/masterbatch blends containing vulcanizing agents and mixed at 80 rpm, also in 90/10, 70/30, and 50/50 proportions, illustrated in images (D), (E), and (F). These images were also captured at 200x magnification. In Micrograph D (90/10), a smooth fracture surface without tear lines is observed, indicating brittle behavior and low tensile strength. In addition, the presence of charge particles (highlighted in red) suggests poor interfacial adhesion between the polymer matrix and the SCBA particles, further compromising the tensile strength capacity of the blend.
Micrograph E (70/30) shows a significant increase in fracture lines and a rougher surface, indicating more ductile behavior due to the presence of NR in the blend. Minimal outcropping of reinforcing particles is observed, and these appear similar to those in blends containing vulcanizing agents.
Micrograph F (50/50) displays a morphology with fewer fracture lines but some visible pores, likely resulting from weak interfacial interaction between SCBA particles and the polymer matrix. The overall amorphous and heterogeneous surface suggests ductile fracture behavior caused by the balanced composition of LDPE and NR. In this blend, the interaction between SCBA particles and the polymer matrix appears optimal, yielding improved elongation and fracture resistance.
3.7.2. Vulcanized LDPE /Masterbatch Blend
These SEM observations are consistent with the mechanical test results, confirming that the vulcanizing agents play a critical role in enhancing tensile strength and elongation. The overall morphology indicates improved interfacial cohesion and better integration of SCBA particles within the LDPE/NR matrix, especially at higher NR contents.
3.8. Comparison of the Tension and Deformation Properties of the LDPE/Masterbatch Blends with and Without Curing Agents
Figure 15 compares the elasticity response of the samples under study. The blends contaninig vulcanizing agents exhibited superior elastic behavior, attributed to improved interaction between the constituent materials. In the 90/10 blends, the deformation responses showed no significant differences across samples. In these blends, LDPE dominated the mechanical behavior, contributing primarily to the observed tensile strength.
In the 70/30 blends, the most significant elasticity responses were observed in the samples mixed with vulcanizing agents at 40 rpm. Similarly, in the 50/50 blends, samples incorporating vulcanizing agents showed the highest degree of compatibility between SCBA and NR particles. This enhanced coupling was first identified during the preparation of the masterbatch, described in the initial stage of this study. The presence of SCBA in these samples led to improved elastic deformation when compared to the base LDPE/NR blend without ash reinforcements. The SCBA particles interacted more homogeneously with both LDPE and NR during the mixing process in the torque rheometer. The introduction of vulcanizing agents optimized the behavior of the 50/50 blend, particularly where NR was predominant, compared to stage II blends.
Figure 16 compares the mechanical responses of the composites obtained across the different stages of the study: Stage I (without curing agents), Stage II (with curing agents mixed at 40 rpm), and Stage III (with curing agents mixed at 80 rpm). The 50/50 blends processed with curing agents at 40 rpm and 80 rpm exhibited better tensile strength than the samples without vulcanizing agents. This is likely due to the fact that the interaction between the curing agents and the constituents did not occur as expected. In blends with LDPE content above 50%m (90/10 and 70/30), improvements in mechanical behavior were more limited. The dominant PE phase formed rigid polymer chains that did not interact effectively with the elastomeric NR phase, resulting in reduced elongation at break. In contrast, the 50/50 blends processed at 80 rpm exhibited the best combination of elongation and tensile strength, indicating the formation of a TPE.
The analyses demonstrated that the constituents of the samples mixed with vulcanizing agents had good physical interaction. NR contributed predominantly to elongation and tensile behavior, while the improved dispersion of SCBA during torque rheometry promoted an effective interaction between the NR chains and SCBA particles. However, interaction between LDPE and NR remained limited. In terms of stress response, the thermoplastic phase was dominant—as LDPE content increased, so did the stress response. To further enhance the chemical compatibility between LDPE and NR, future studies could introduce chemical bonding agents. This could be achieved by using free-radical initiators, such as thermally degradable organic peroxides (e.g., dicumyl peroxide) to initiate silane grafting [72]. This would improve chemical bonding, in addition to the physical interaction caused by shear in the Haake rheometer. Lastly, it is worth mentioning that the elongation properties of the optimized blends were superior, and the Shore A hardness values where comparable to those reported by Passador and colleagues, who used PP–NR blends reinforced with commercial silica [73]. These findings underscore the industrial potential of SCBA as an effective and sustainable reinforcing agent.
3.9. Hardness
The hardness of the composites was mainly influenced by the percentage of LDPE and the interactions between SCBA and NR in the masterbatch. These interactions affected the stiffness of the polymer chains, as shown in the Haake rheology curves, where the highest torque values were linked to blends with greater LDPE content. Table 4 presents the Shore A hardness values for various compositions. The composites with 90% LDPE and 10% masterbatch exhibited the highest hardness values. These results are consistent with the modulus of elasticity obtained in the stress–strain tests. In addition the values obtained were 2% higher than those for similar composites processed without vulcanizing agents in a previous stage of this study. Although the differences between the blends are small, the results are promising and suggest strong industrial potential, for example in the development of shock-absorbing components and household appliance parts.
In the Table 4, it was shown that the addition of SCBA particles had a direct influence on the hardness results. The bars on the left of the graph represent the LDPE/NR blends without SCBA, which exhibited lower hardness compared to the blends of the same composition with SCBA (90/10, 70/30, and 50/50). In these samples, LDPE had a stronger influence on the properties of the blends than NR, as seen in the higher hardness values of the test specimens.
The LDPE/NR blends without vulcanizing agents exhibited higher hardness compared to the samples without SCBA. In addition, the samples mixed with vulcanizing agents at 40 rpm and 80 rpm and thermopressed at 150°C behaved similarly to the samples without vulcanizing agents, that is, they maintained high hardness due to the addition of SCBA and LDPE. This fact was confirmed by the DMA and stress–strain tests, which highlighted the stiffness and good interaction of the constituents as a result of the entanglement of the polymer chains with the reinforcing particles, creating physical bonds during Haake processing.
The values of the samples without SCBA were significantly lower than those obtained from samples both with and without the vulcanization process. This finding aligns with the modulus of elasticity results, confirming that increased sample stiffness has a direct influence on hardness and elasticity. The improved mechanical properties indicate that these composites exhibit promising characteristics for shock absorber applications. When compared to the study by Nakason and Kaewsakul [74], the 70/30 LDPE/NR blend containing SCBA outperformed the PP–NR composite used by those authors.
3.10. Comparison of the Dynamic and Mechanical Analysis Results
3.10.1. Storage Modulus
Figure 18 shows a comparison of the E’ values measured at 25°C. The incorporation of curing agents enhanced the interaction between LDPE and the silanized masterbatch, resulting in improved chain entanglement and more consisten E’ values when processed in the Haake rheometer. Blends processed with curing agents exhibited a linear increase in E’ with increasing LDPE content. These findings align with the stress–strain results discussed earlier. In contrast, samples processed without curing agents showed less consistent behavior, possibly due to the lack of homogeneous chain entanglement. However, the best E’ among these samples was observed in the 90/10 composition, which may be due to good interactions during the rheometry process. This performance matches the stress–strain and hardness results, indicating superior stress transfer between the constituents.
3.10.2. Tan δ
Figure 19 shows the Tan δ results, where an inverse relationship between the stiffness and damping behavior was observed. The highest damping capacity was observed in the 50/50 blends, which corresponds to the greater elasticity. Conversely, the lowest damping values occurred in the stiffer 90/10 samples. Thus, the inclusion of curing agents improved the damping capacity of the blends, as these agents facilitated better stress distribution and dissipation across the matrix-reinforcement interface. Moreover, based on the curves, the incorporation of PE restricted the mobility of NR chains within the masterbatch, reducing flexibility and thus decreasing the damping properties. This effect was further reinforced by the presence of SCBA, which maintaned good interaction with both the vulcanizing agents and the NR matrix but limited the system’s vibration dissipation capacity.
These results confirm that the dynamic mechanical behavior of the composites stems from the synergistic interaction between SCBA and the curing agents. These materials served as a reinforcing phase, increasing both hardness and E’, while slightly reducing damping. These characteristics indicate potential for application in shock absorbers and other industrial components, particularly in formulations with high LDPE content. Furthermore, at higher masterbatch content levels, the composites show promise for the development of broader industrial products.
4. Conclusions
This study demonstrates that SCBA is an excellent waste product with strong potential as a reinforcing material in the elastomer and termoplastic elastomer industries. As a particulate filler, SCBA can be effectively incorporated into LDPE and NR blends to produce not only compatible polymer blends but also TPEs with properties suitable for competitive industrial applications.
The study confirmed that the masterbatch composed of natural rubber and silanized SCBA is a promising raw material for blending with LDPE, enabling the development of composite materials for a range of industrial uses. The LDPE/NR-SCBA blends exhibited good physical interaction between constituents, with behavior characteristic of thermoplastic composites.
Notably, the 50/50 (%m) LDPE/masterbatch blends displayed the typical behavior of TPEs. When vulcanized, these samples exhibited good elongation, yield strength, and tensile strength properties, indicating their suitability for demanding industrial applications.
From a thermal standpoint, the composites exhibited good thermal stability, with degradation starting around 160°C. The properties of the LPDE matrix predominated, acting as a continuous phase due to its higher content in the blends.
Microstructural analysis revealed surface flaws in samples containing 25% SCBA, indicating limited filler–matrix cohesion and a lack of continuity in the polymer matrix. However, lower SCBA loadings should be further studied.
Overall, silanized LDPE/masterbatch composites present significant application potential. Their adaptability in terms of mass ratios and tunable mechanical and physical properties make them suitable for a wide range of uses, including footwear.
These composites are also promising for the production of handles for gardening tools, given their high degree of flexibility and permeability. Additionally, they could be used in the manufacture of agricultural and household packaging films, tubes and hoses, and resins for TPEs, among other commercial purposes.
Furthermore, combining SCBA with alternative materials, such as leather waste and NR, can support the development of sustainable, value-added products with a positive environmental impact.
It is crucial to inform small and medium-sized producers about sustainable alternatives for industrial waste valorization, using tools such as clean production and design engineering. This study demonstrates the feasibility of implementing collaborative processes across different production areas, fostering innovation while promoting sustainability.
These efforts directly support the United Nations’ Sustainable Development Goals 12 (Responsible Consumption and Production), 9 (Industry, Innovation, and Infrastructure), and 17 (Partnership for the Goals). Moreover, they strengthen the social and economic fabric of local communities.
Author Contributions
Conceptualization: G. Barrera Torres, Flavio Camargo C.; validation: Jaime A. Jaramillo Carvalho, Juan C. Sánchez; data curation: G. Barrera Torres and Aldo E. Job; visualization: Renivaldo J. Santos and Leonardo L. Paim; supervision: G. Barrera Torres and Elton Prado dos reis. All authors have read and agreed to the published version of the manuscript.
Funding
This research was funded by Instituto Tecnológico Metropolitano (Grant number P20203) and Centro para la Manufactura Avanzada, SENA, Antioquia.
Acknowledgments
The authors thank the Instituto Tecnológico Metropolitano (Research code PCI 23205); Agencia de Servicios Lingüísticos ITM; Centro para la Manufactura Avanzada, SENA, Antioquia; Asociación Iberoamericana de Posgrados (AUIP); and UNESP's PAEDEX for the grant—without which this study would not have been possible. The authors also thank Prof. Dr. Joé Alexandrino de Souza for providing access to the polymer laboratory at UFSCAR's- DEM, which enabled the preparation of test specimens and the performance of HAAKE rheometry analyses.
Conflicts of Interest
The authors declare no conflicts of interest.
References
- Torres, G.B.; Dognani ,G.; Cabrera, F.C., et al. “Sustainable blends of LDPE/NR and sugarcane bagasse ashes with PE-g-MA thermomechanical relationships”. Revista Matéria, v. 24, n. 3, 2019. Doi. 10.1590/S1517-707620190003.0726.
- Françoise Berzin, Bruno Vergnes. Thermoplastic Natural Fiber Based Composites. Fiber Reinforced Composites Constituents, Compatibility, Perspectives, and Applications, 2021, 10.1016/B978-0-12-821090-1.00015-6.hal-03843581.
- Kirk-Othmer Encyclopedia of Chemical Technology. Copyright © 2022 John Wiley & Sons, Inc. All rights reserved. [CrossRef]
- R. Brown, Natural Fillers in Elastomeric Composites, 2nd ed., New York, NY: Wiley, 2018, pp. 68-73.
- Nursel Karakaya, Osman G. Ersoy, Mehmet A. Oral, Turgay Gonul, Veli Deniz. Effect of Different Fillers on Physical, Mechanical, and Optical Properties of Styrenic-Based Thermoplastic Elastomers. Polymer Engineering & Science · April 2010. [CrossRef]
- L. Zahir, T. Kida, R. Tanaka et al. Synthesis of thermoplastic elastomers with high biodegradability inSeawater. Polymer Degradation and Stability 184 (2021). DOI. 109467.
- P. Novak, "Reinforcement of polymers using bio-based materials," in Bio-based Composites: Materials and Processing, 1st ed., M. Peterson, Ed. Cambridge, MA: Elsevier, 2019, pp. 201-230.
- R. Lozada, E.; Gutiérrez Aguilar, C.M.; Jaramillo Carvalho, J.A.; Sánchez, J.C.; Barrera Torres, G. Vegetable Cellulose Fibers in Natural Rubber Composites. Polymers 2023, 15, 2914. [CrossRef]
- N. Patel and S. Kumar, "Performance evaluation of natural fiber-reinforced elastomers," Materials Today: Proceedings, vol. 34, pp. 56-61, Jan. 2023. [CrossRef]
- M. Thomas, "Biodegradable polymer composites: A sustainable future," Journal of Green Materials, vol. 19, no. 1, pp. 10-20, Jan. 2023. [CrossRef]
- D. F. Miller and H. Kim, "A study on the lifecycle analysis of bio-composite TPEs," Plastics Research Journal, vol. 29, no. 3, pp. 173-185, Mar. 2022. [CrossRef]
- P. Turner and E. Green, "Hemp fiber-reinforced TPEs for automotive applications," Automotive Materials Journal, vol. 39, no. 5, pp. 315-325, May 2021. [CrossRef]
- L. Zhang, "Reduction of vehicle weight using bio-based materials in automotive components," Journal of Sustainable Engineering, vol. 27, no. 8, pp. 523-530, Aug. 2020. [CrossRef]
- B. Singh and R. Patel, "The impact of bamboo fillers on the mechanical properties of thermoplastic elastomers," in Proc. Int. Conf. Adv. Green Polymers, Tokyo, Japan, 2021, pp. 98-105. [CrossRef]
- K. Wilson and M. Edwards, "Sustainable packaging materials: Natural fillers in TPE blends," Packaging Technology Today, vol. 45, no. 3, pp. 100-109, Mar. 2022. [CrossRef]
- R. Gomez, "Combating plastic pollution with biodegradable TPE composites," Environmental Polymer Chemistry, vol. 12, no. 6, pp. 301-312, June 2021. [CrossRef]
- P. Nguyen and S. Zhao, "Bio-based packaging for food applications: The role of natural fillers," Journal of Food Packaging, vol. 38, no. 9, pp. 801-809, Sept. 2023. [CrossRef]
- J. A. Garcia and L. Sanchez, "Reducing microplastic pollution with bio-filler-based polymers," Ocean Sustainability Review, vol. 8, no. 5, pp. 113-120, May 2023. [CrossRef]
- M. Johnson, "Wood flour in TPEs: A sustainable approach to food packaging," Sustainable Materials Science, vol. 17, no. 2, pp. 50-59, Feb. 2023. [CrossRef]
- K. Mathew, "Natural fiber-reinforced thermoplastic elastomers for green buildings," Journal of Building Materials, vol. 16, no. 7, pp. 890-899, July 2022. [CrossRef]
- H. Lee, "Coconut husk fillers for thermal insulation in eco-friendly buildings," Construction and Building Materials, vol. 55, pp. 603-610, Aug. 2021. [CrossRef]
- S. Patel and M. Kumar, "Weather-resistant TPE composites with natural fillers for infrastructure applications," Construction Technology Journal, vol. 44, no. 9, pp. 411-421, Sept. 2022. [CrossRef]
- Thompson, "Green building projects: The role of TPE composites," Sustainable Architecture Review, vol. 29, no. 10, pp. 215-221, Oct. 2021. [CrossRef]
- J. Walker and B. Lee, "Natural fiber-reinforced TPEs in consumer goods: Footwear and sporting applications," Consumer Goods Materials Journal, vol. 12, no. 4, pp. 173-180, Apr. 2022. [CrossRef]
- Y. Wang, "Natural textures in bio-filler-based TPEs for consumer products," Aesthetic Materials Engineering, vol. 4, no. 2, pp. 78-85, Feb. 2023. [CrossRef]
- R. Bell and A. Cooper, "Eco-friendly alternatives: Marketing bio-based products," Green Marketing Review, vol. 23, no. 1, pp. 112-120, Jan. 2022. [CrossRef]
- F. Gomez, "Environmental impact of biodegradable TPEs with natural fillers," Environmental Science and Technology, vol. 50, no. 11, pp. 1102-1110, Nov. 2021. [CrossRef]
- G. Luo and P. Chen, "Renewable resources in polymer composites: An overview of natural fillers," Journal of Renewable Materials, vol. 21, no. 6, pp. 601-609, June 2021. [CrossRef]
- J. Kim and H. Park, "The biodegradability of bio-based fillers in polymer composites," Journal of Environmental Polymer Deg-radation, vol. 14, no. 3, pp. 390-399, Mar. 2022. [CrossRef]
- M. S. Rana, "Biodegradable waste reduction through natural fillers in elastomeric composites," Waste Management Journal, vol. 39, no. 5, pp. 1020-1030, May 2022. [CrossRef]
- Mahmood and S. Chowdhury, "Energy consumption in bio-filler production: A comparison with synthetic fillers," Journal of Materials and Energy, vol. 48, no. 9, pp. 875-884, Sept. 2021. [CrossRef]
- N. Patel, "Hemp and flax as sustainable alternatives to synthetic fillers," Bio-Based Materials Review, vol. 9, no. 7, pp. 530-540, July 2020. [CrossRef]
- R. Zhang and T. Shen, "Carbon footprint analysis of natural fillers in polymer composites" Journal of Polymer Science, vol. 33, no. 2, pp. 153-162, Feb. 2021. [CrossRef]
- M. Diaz, "Utilizing agricultural by-products in TPE production," Agricultural Materials Journal, vol. 19, no. 1, pp. 98-106, Jan. 2023. [CrossRef]
- Y. Chen and G. Lin, “The role of carbon sequestration in bio-based filler production,” Environmental Materials Science, vol. 22, no. 4,pp. 402-411, Apr. 2022. [CrossRef]
- Patel, "Long-term carbon sequestration in TPE composites with bio-based fillers," Journal of Carbon Capture and Storage, vol. 15, no. 5, pp. 702-711, May 2023. [CrossRef]
- T. Nakamura, "Combating climate change with bio-filler-based elastomers," Climate and Materials Science, vol. 11, no. 3, pp. 215-223,Mar.2022. [CrossRef]
- F. Liu and M. Yang, "Improving compatibility between natural fillers and TPE matrices," Journal of Polymer Interfaces, vol. 29, no. 8, pp. 408-416, Aug. 2021. [CrossRef]
- K. Dawson and J. Rodriguez, "Surface treatment techniques for natural fiber reinforcement in TPEs," Polymer Treatment Journal, vol. 14, no. 9, pp. 1215-1223, Sept. 2021. [CrossRef]
- J. Singh, "Optimization of dispersion in bio-filler-based composites," Journal of Polymer Science, vol. 38, no. 12, pp. 905-913, Dec. 2022. [CrossRef]
- P. Gupta, "Challenges in scaling bio-filler-based TPE production," Journal of Industrial Polymers, vol. 30, no. 6, pp. 410-418, June 2022. [CrossRef]
- T. Howard, "Coupling agents for enhanced filler-matrix adhesion," Adhesion Science and Engineering, vol. 20, no. 2, pp. 195-203, Feb. 2023. [CrossRef]
- R. Cooper, "Supply chain considerations for natural filler production," Journal of Sustainable Sourcing, vol. 15, no. 10, pp. 500-511, Oct. 2022. [CrossRef]
- M. Zhang, "Agricultural yield variability and its impact on bio-based filler supply chains," Journal of Agri-Industrial Materials, vol. 13, no. 5, pp. 377-386, May 2021. [CrossRef]
- J. Wong, "Sustainable sourcing strategies for bio-filler materials," Sustainable Industry Review, vol. 18, no. 6, pp. 412-420, June 2022. [CrossRef]
- L. Nguyen, "Performance of bio-based fillers in high-demand applications," Journal of Industrial Materials Science, vol. 44, no. 11, pp. 1345-1353, Nov. 2021. [CrossRef]
- P. Garcia, "Reducing environmental impact through natural fillers in TPEs," Journal of Green Engineering, vol. 26, no. 3, pp. 225-233, Mar. 2023. [CrossRef]
- H. Liu, "The role of renewable materials in sustainable manufacturing," Renewable Materials Review, vol. 10, no. 8, pp. 655-663, Aug. 2022. [CrossRef]
- P. Singh, "Toward a circular economy: Thermoplastic elastomers with natural fillers," Circular Materials Science, vol. 16, no. 9, pp. 289-297, Sept. 2022. [CrossRef]
- P. Y. Wong, et al., "Microstructure and Mechanical Properties of NR/PP Thermoplastic Elastomers," IEEE Polymer Physics, vol. 18, no. 2, pp. 89-95, 2019.
- R. K. Gupta, et al., "Effect of Crosslinking on the Properties of TPEs," IEEE Rubber Chemistry and Technology, vol. 11, no. 2, pp. 143-149, 2017.
- M. H. Ismail, et al., "Thermal and Mechanical Properties of Natural Rubber/HDPE Thermoplastic Elastomer Blends," IEEE Transactions on Materials Science, vol. 62, no. 2, pp. 178-185, 2020.
- R. Azura, et al., "Properties of Natural Rubber/LDPE Composites," IEEE Polymer Journal, vol. 15, no. 1, pp. 45-52, 2019.
- H. Nguyen, et al., "Dynamic Vulcanization of NR/PP Blends for Automotive Applications," IEEE Automotive Engineering, vol. 8, no. 2, pp. 99-108, 2021.
- L. J. Xu, et al., "Impact Resistance of Thermoplastic Elastomers in Footwear Applications," IEEE Polymer Applications, vol. 28, no. 3, pp. 312-318, 2018.
- S. D. Kumar, et al., "TPEs in Packaging: Flexibility and Strength," IEEE Packaging Science, vol. 14, no. 4, pp. 125-131, 2020.
- M. A. Jafferson, et al., "Medical Applications of NR/PP Blends," IEEE Biomedical Materials, vol. 9, no. 1, pp. 58-63, 2019.
- T. L. Chan, et al., "Development of Biocompatible TPEs for Medical Devices," IEEE Healthcare Materials, vol. 11, no. 3, pp. 189-195, 2021.
- K. N. Goh, et al., "Processing and Properties of Recycled NR/PE Blends," IEEE Green Materials Science, vol. 10, no. 1, pp. 211-217, 2021.
- J. W. Chen, et al., "Recyclability of Thermoplastic Elastomers," IEEE Sustainable Materials Engineering, vol. 6, no. 2, pp. 67-72, 2020.
- L. Tan, et al., "Environmentally Friendly Elastomers: A Review," IEEE Environmental Engineering, vol. 7, no. 3, pp. 201-209, 2022.
- Barrera T. et al Potential Eco-friendly Application of Sugarcane Bagasse Ash in the Rubber Industry. Waste and Biomass Val-orization (2021) 12:4599–4613. doi.org/10.1007/s12649-020-01309-6.
- Standard Test Method for Rubber Property—Vulcanization Using Rotorless Cure Meters.American Society for Testing Materials (ASTM) (2010) D 5963 test method for rubber property—abrasion resistance rotary drum abrader.
- American Society for Testing Materials (ASTM) (2010) D 2240. Test method for rubber property—durometer hardness.
- Maiza dos S. Ozorio, E. Ap. P. dos Reis, S. R. Teixeira, F. S. Bellucci and A. E. Job. Sugarcane Bagasse Ash as a Reinforcing Filler in Thermoplastic Elastomers: Structural and Mechanical Characterizations. J. of App. Polym. Sci., No 132, pp. 1-7. 2015.
- S. R. Teixeira, A. E. de Souza, A. F. V. Peña, R. G. de Lima and A. G. Miguel. Use of charcoal and partially pirolysed biomaterial in fly ash to produce briquettes: Sugarcane Bagasse. Alternative Fuel.Cap. 8. Pp 184-190.Intech Open. 2011.
- R. Godoy de Lima and A. Gil Miguel. Use of Charcoal and Partially Pirolysed Biomaterial in Fly Ash to Produce Briquettes: Sugarcane Bagasse. www.Intechopen.com.pp. 189-194. 2011.
- Rheology and mechanical properties of polymers. FRED W. BILLMEYER, Jr. pp.301-329.texbook of polymer science, 3 ed.John Wiley and sons.1984.
- Agnes F. Martins, Leila L.Y. Visconte, Regina C.R. Nunes. Propriedades Reológicas e Dinâmicas de Composições Não-Vulcanizadas de Borracha Natural com Celulose Regenerada. Polímeros: Ciência e Tecnologia, vol. 12, nº 4, p. 295-300, 2002.
- S. Navarro Cassu E M. Isabel Felisberti. Comportamento Dinâmico-Mecânico e Relaxações Em Polímeros e Blendas Poliméricas. Quim. Nova, Vol. 28, No. 2, 255-263. 2005.
- J. Morshedian, P. Mohammad Hoseinpour, H. Azizi, R. Parvizzad. Effect of polymer structure and additives on silane grafting of polyethylene. express Polymer Letters Vol.3, No.2 pp. 105–115.2009.
- F. R. Passador, Galia J. Alzate R., Luiz A. Pessan. Thermoplastic Elastomers Based on Natural Rubber/Polypropylene Blends: Effect of Blend Ratios and Dynamic Vulcanization on Rheological, Thermal, Macromolecular Sc., Part B: Physics, 52:1142–1157, 2013.
- Ch. nakason And W. Kaewsakul. Influence of Oil Contents in Dynamically Cured Natural.
- Rubber and Polypropylene Blends. J. of Applied Polymer Science, Wiley Periodicals, Inc.V.115, 540–548. 2010.
Figure 1.
Compatibility control Thermoplastic–elastomer blending at 40–80 rpm Without vulcanizing agents with vulcanizing agents.
Figure 1.
Compatibility control Thermoplastic–elastomer blending at 40–80 rpm Without vulcanizing agents with vulcanizing agents.
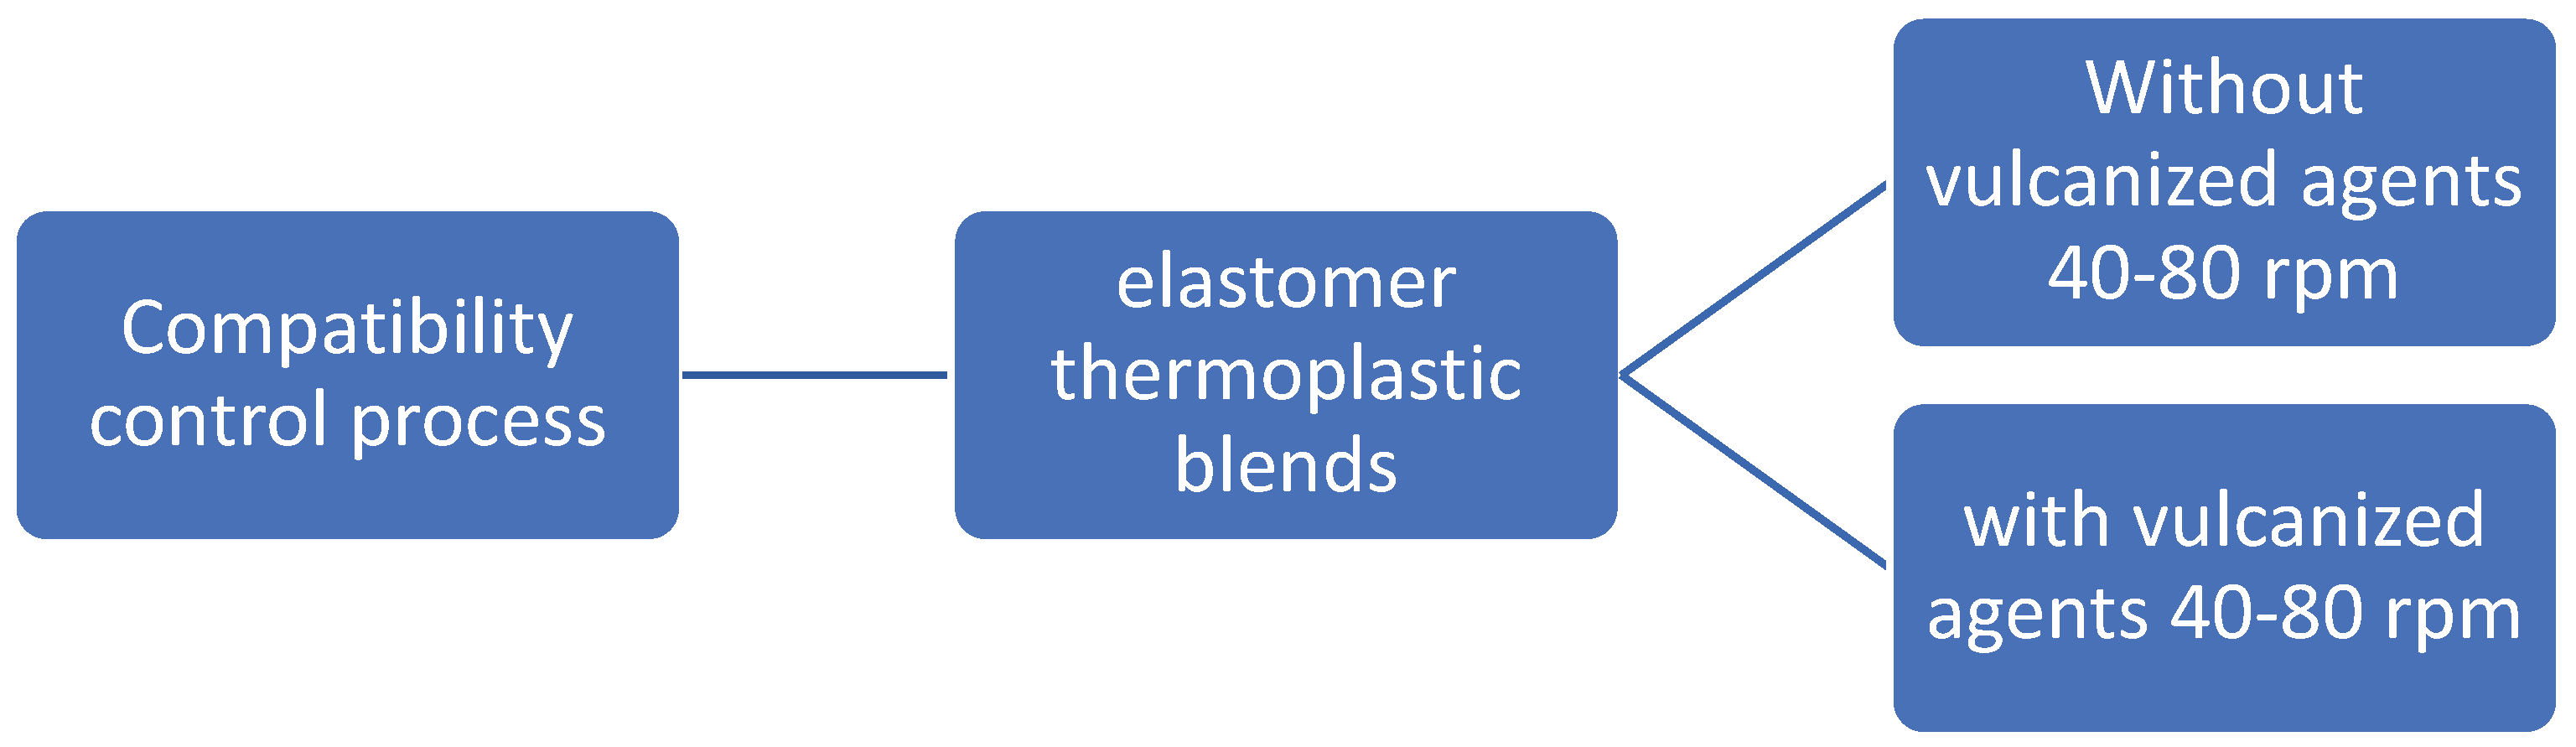
Figure 3.
Stress–strain curves for the LDPE/NR blends with curing agents processed at 40 rpm. Source: Own work.
Figure 3.
Stress–strain curves for the LDPE/NR blends with curing agents processed at 40 rpm. Source: Own work.
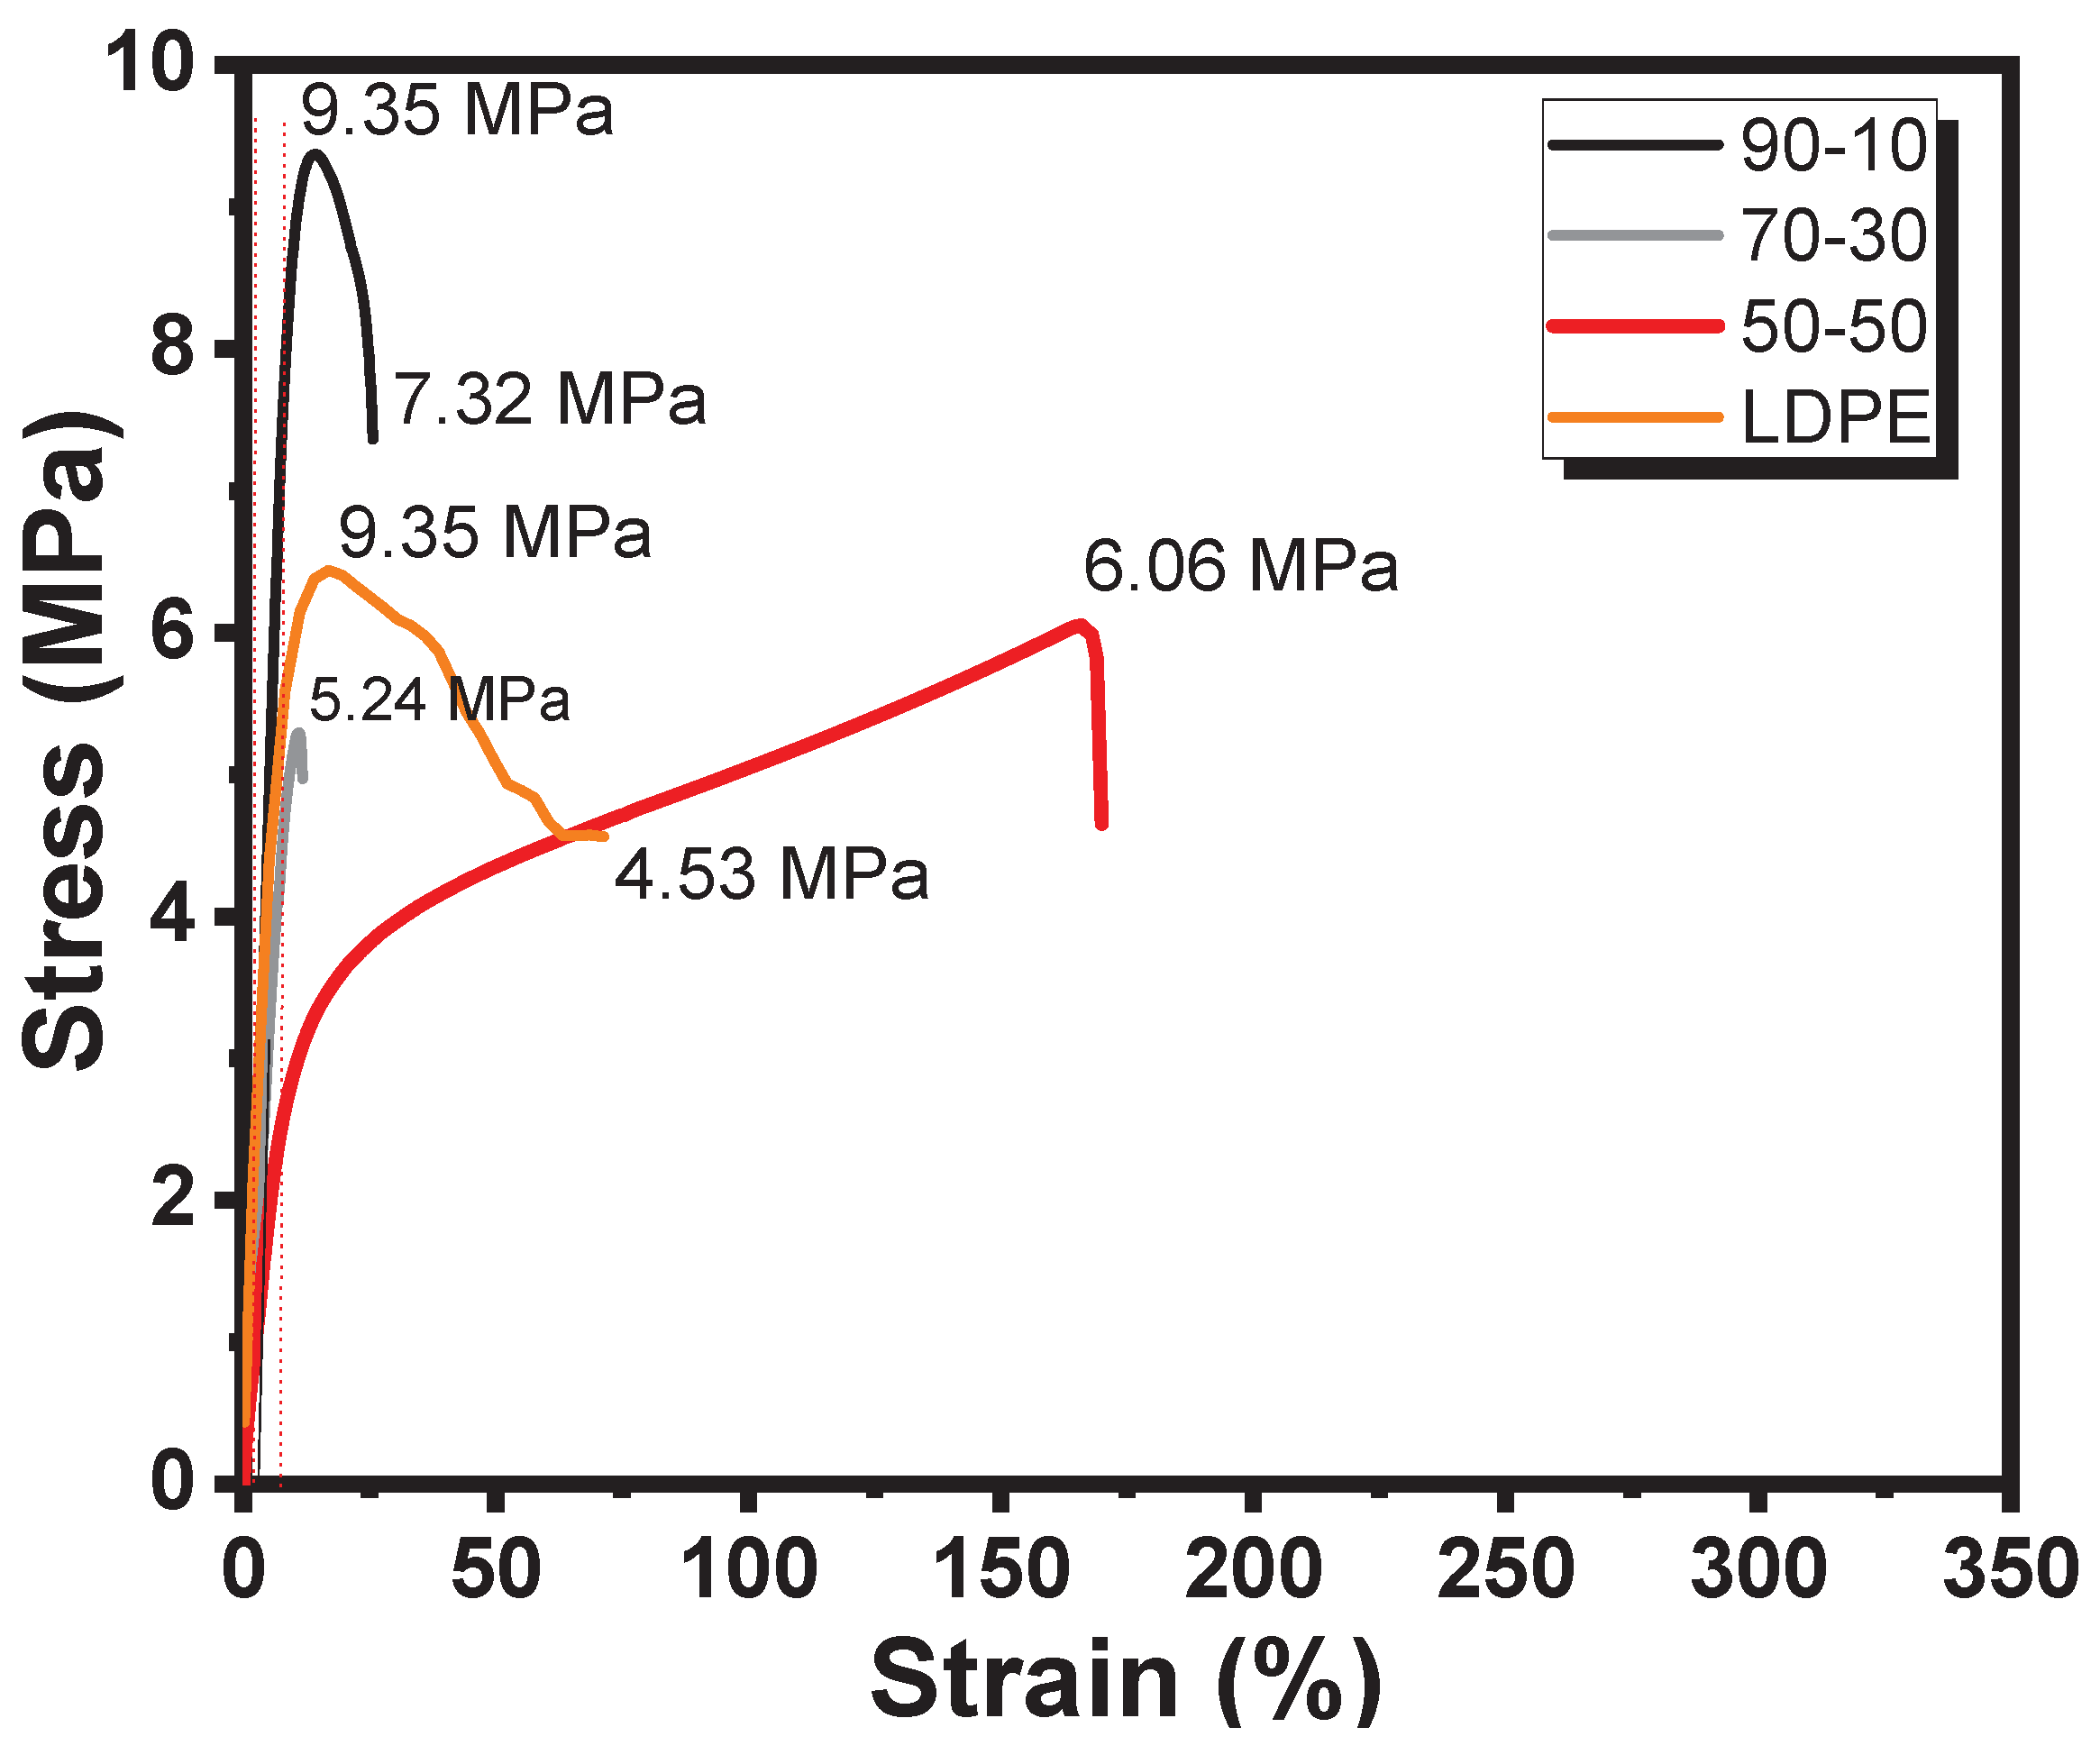
Figure 4.
Stress–strain curves for the LDPE/silanized masterbatch blends with curing agents processed at 80 rpm. Source: Own work.
Figure 4.
Stress–strain curves for the LDPE/silanized masterbatch blends with curing agents processed at 80 rpm. Source: Own work.
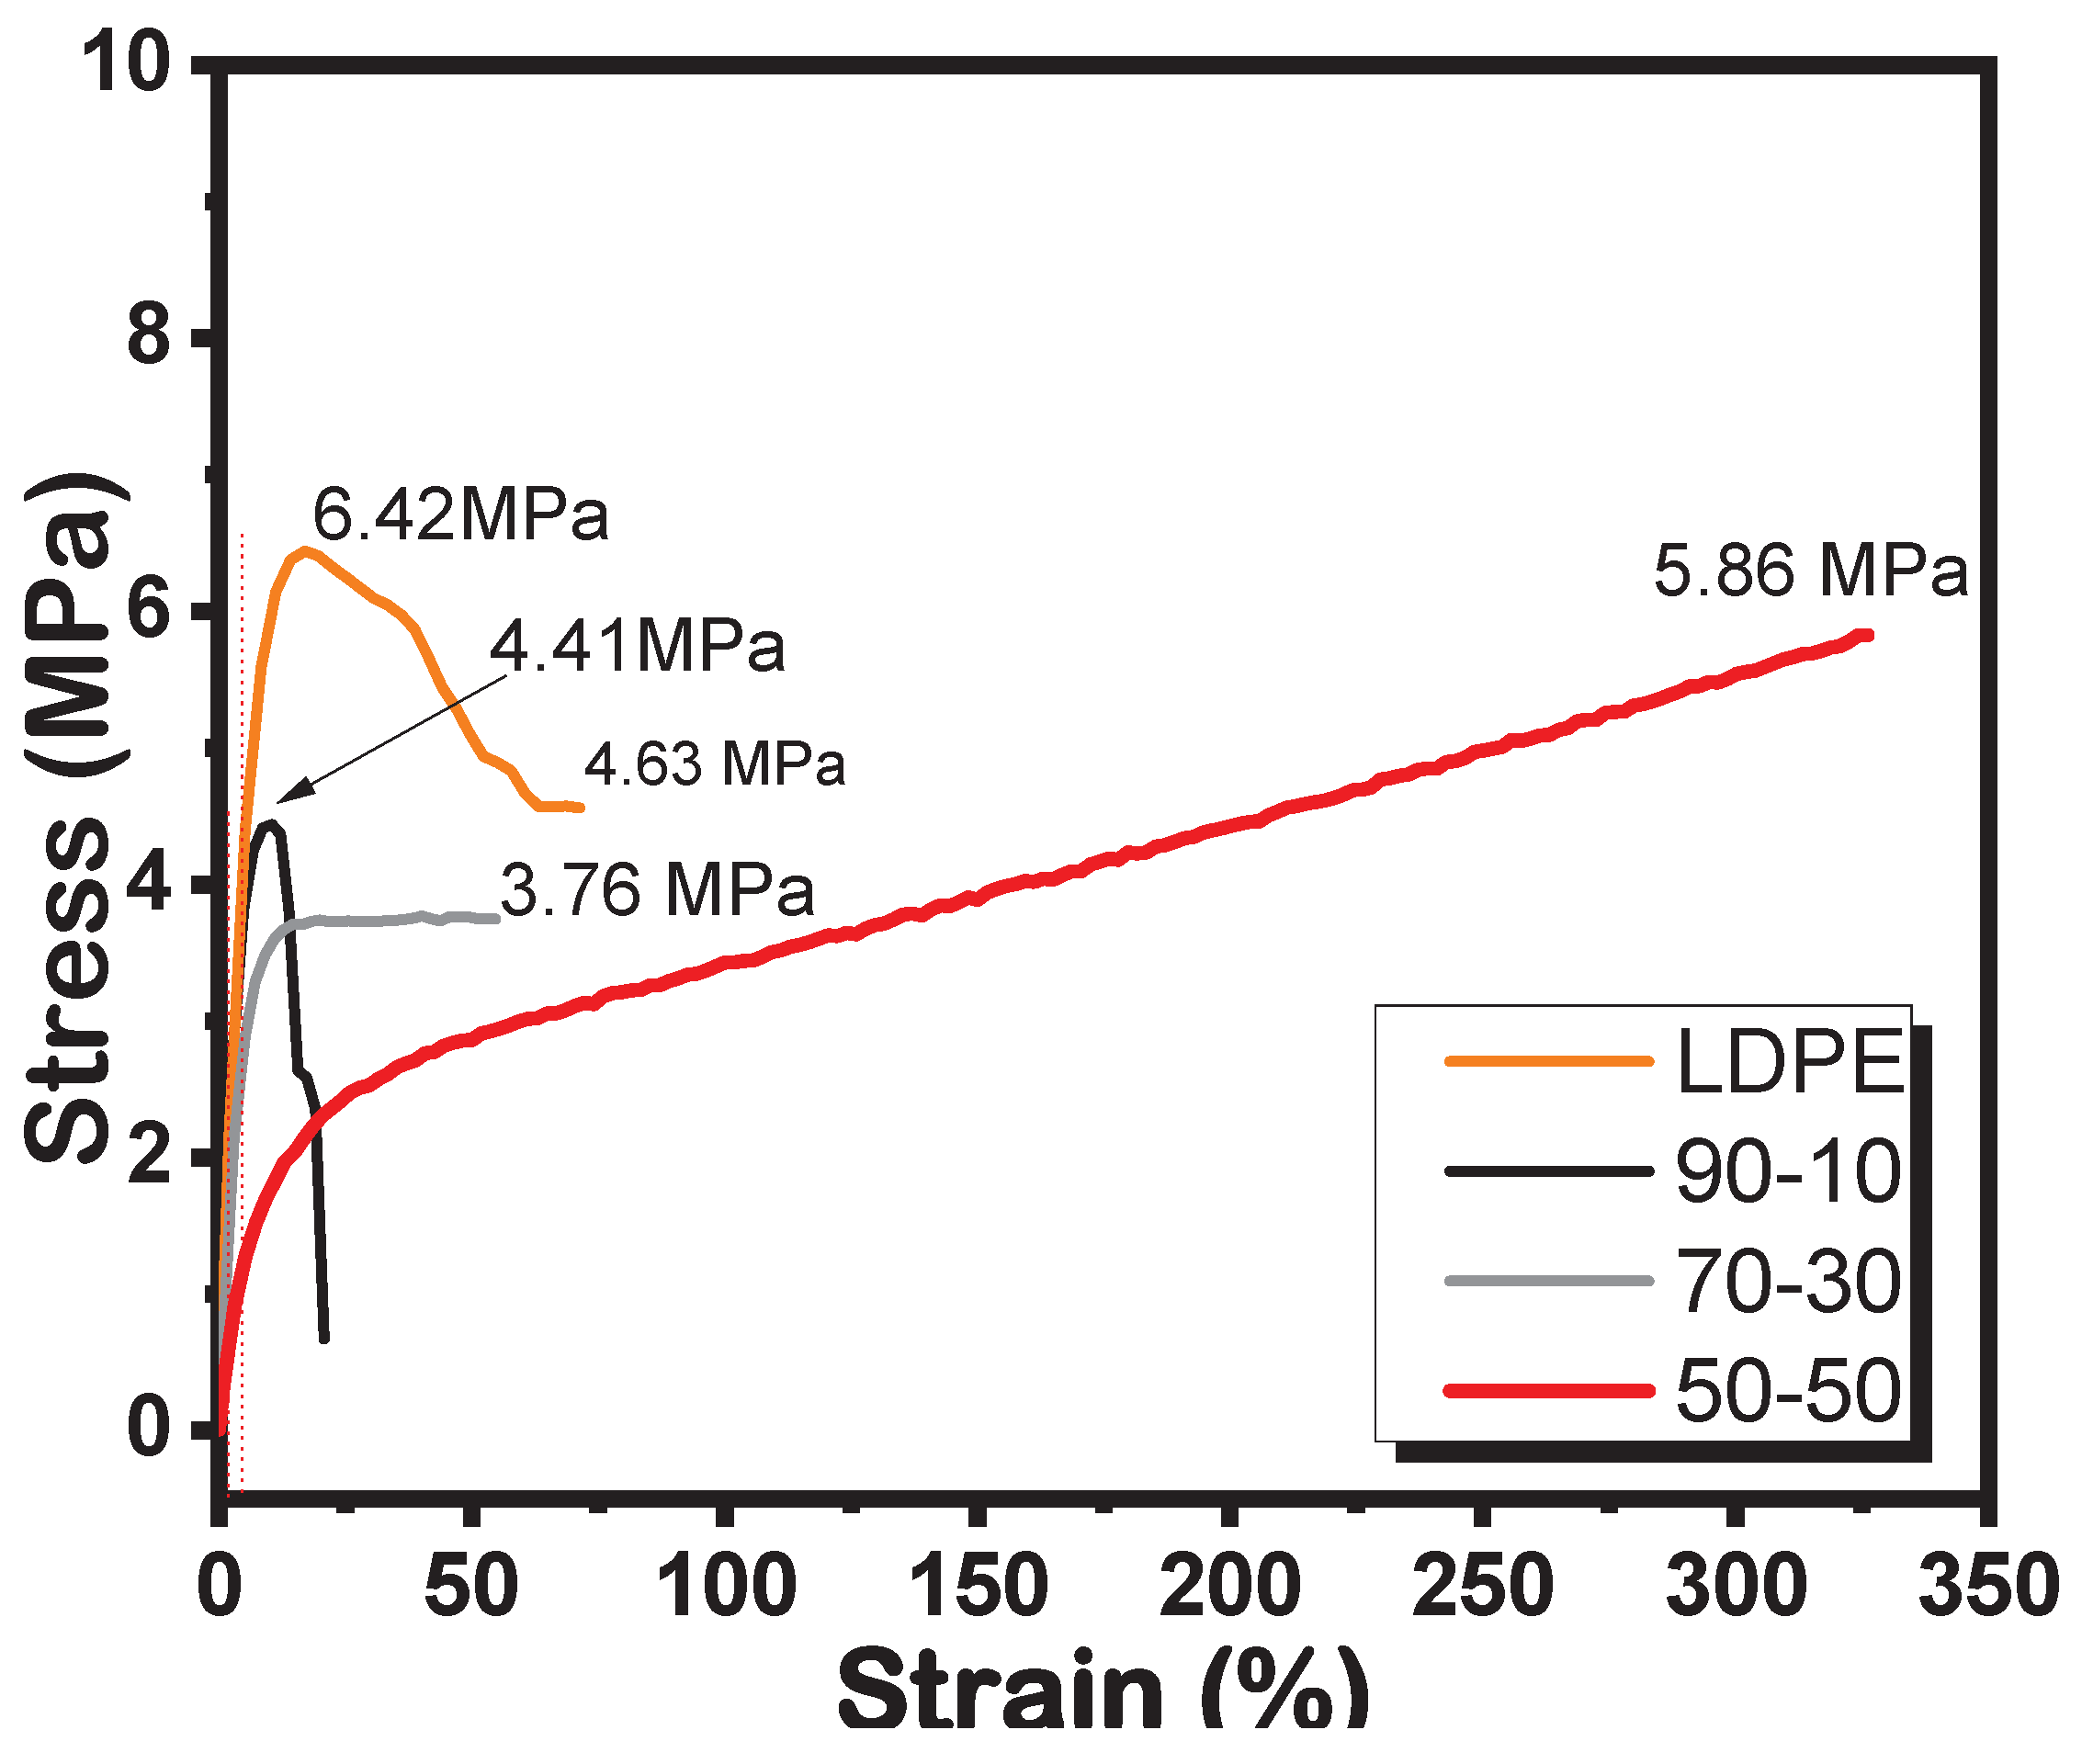
Figure 9.
DSC curves of NR, LDPE, and the vulcanized LDPE/NR blends. Source: Own work.
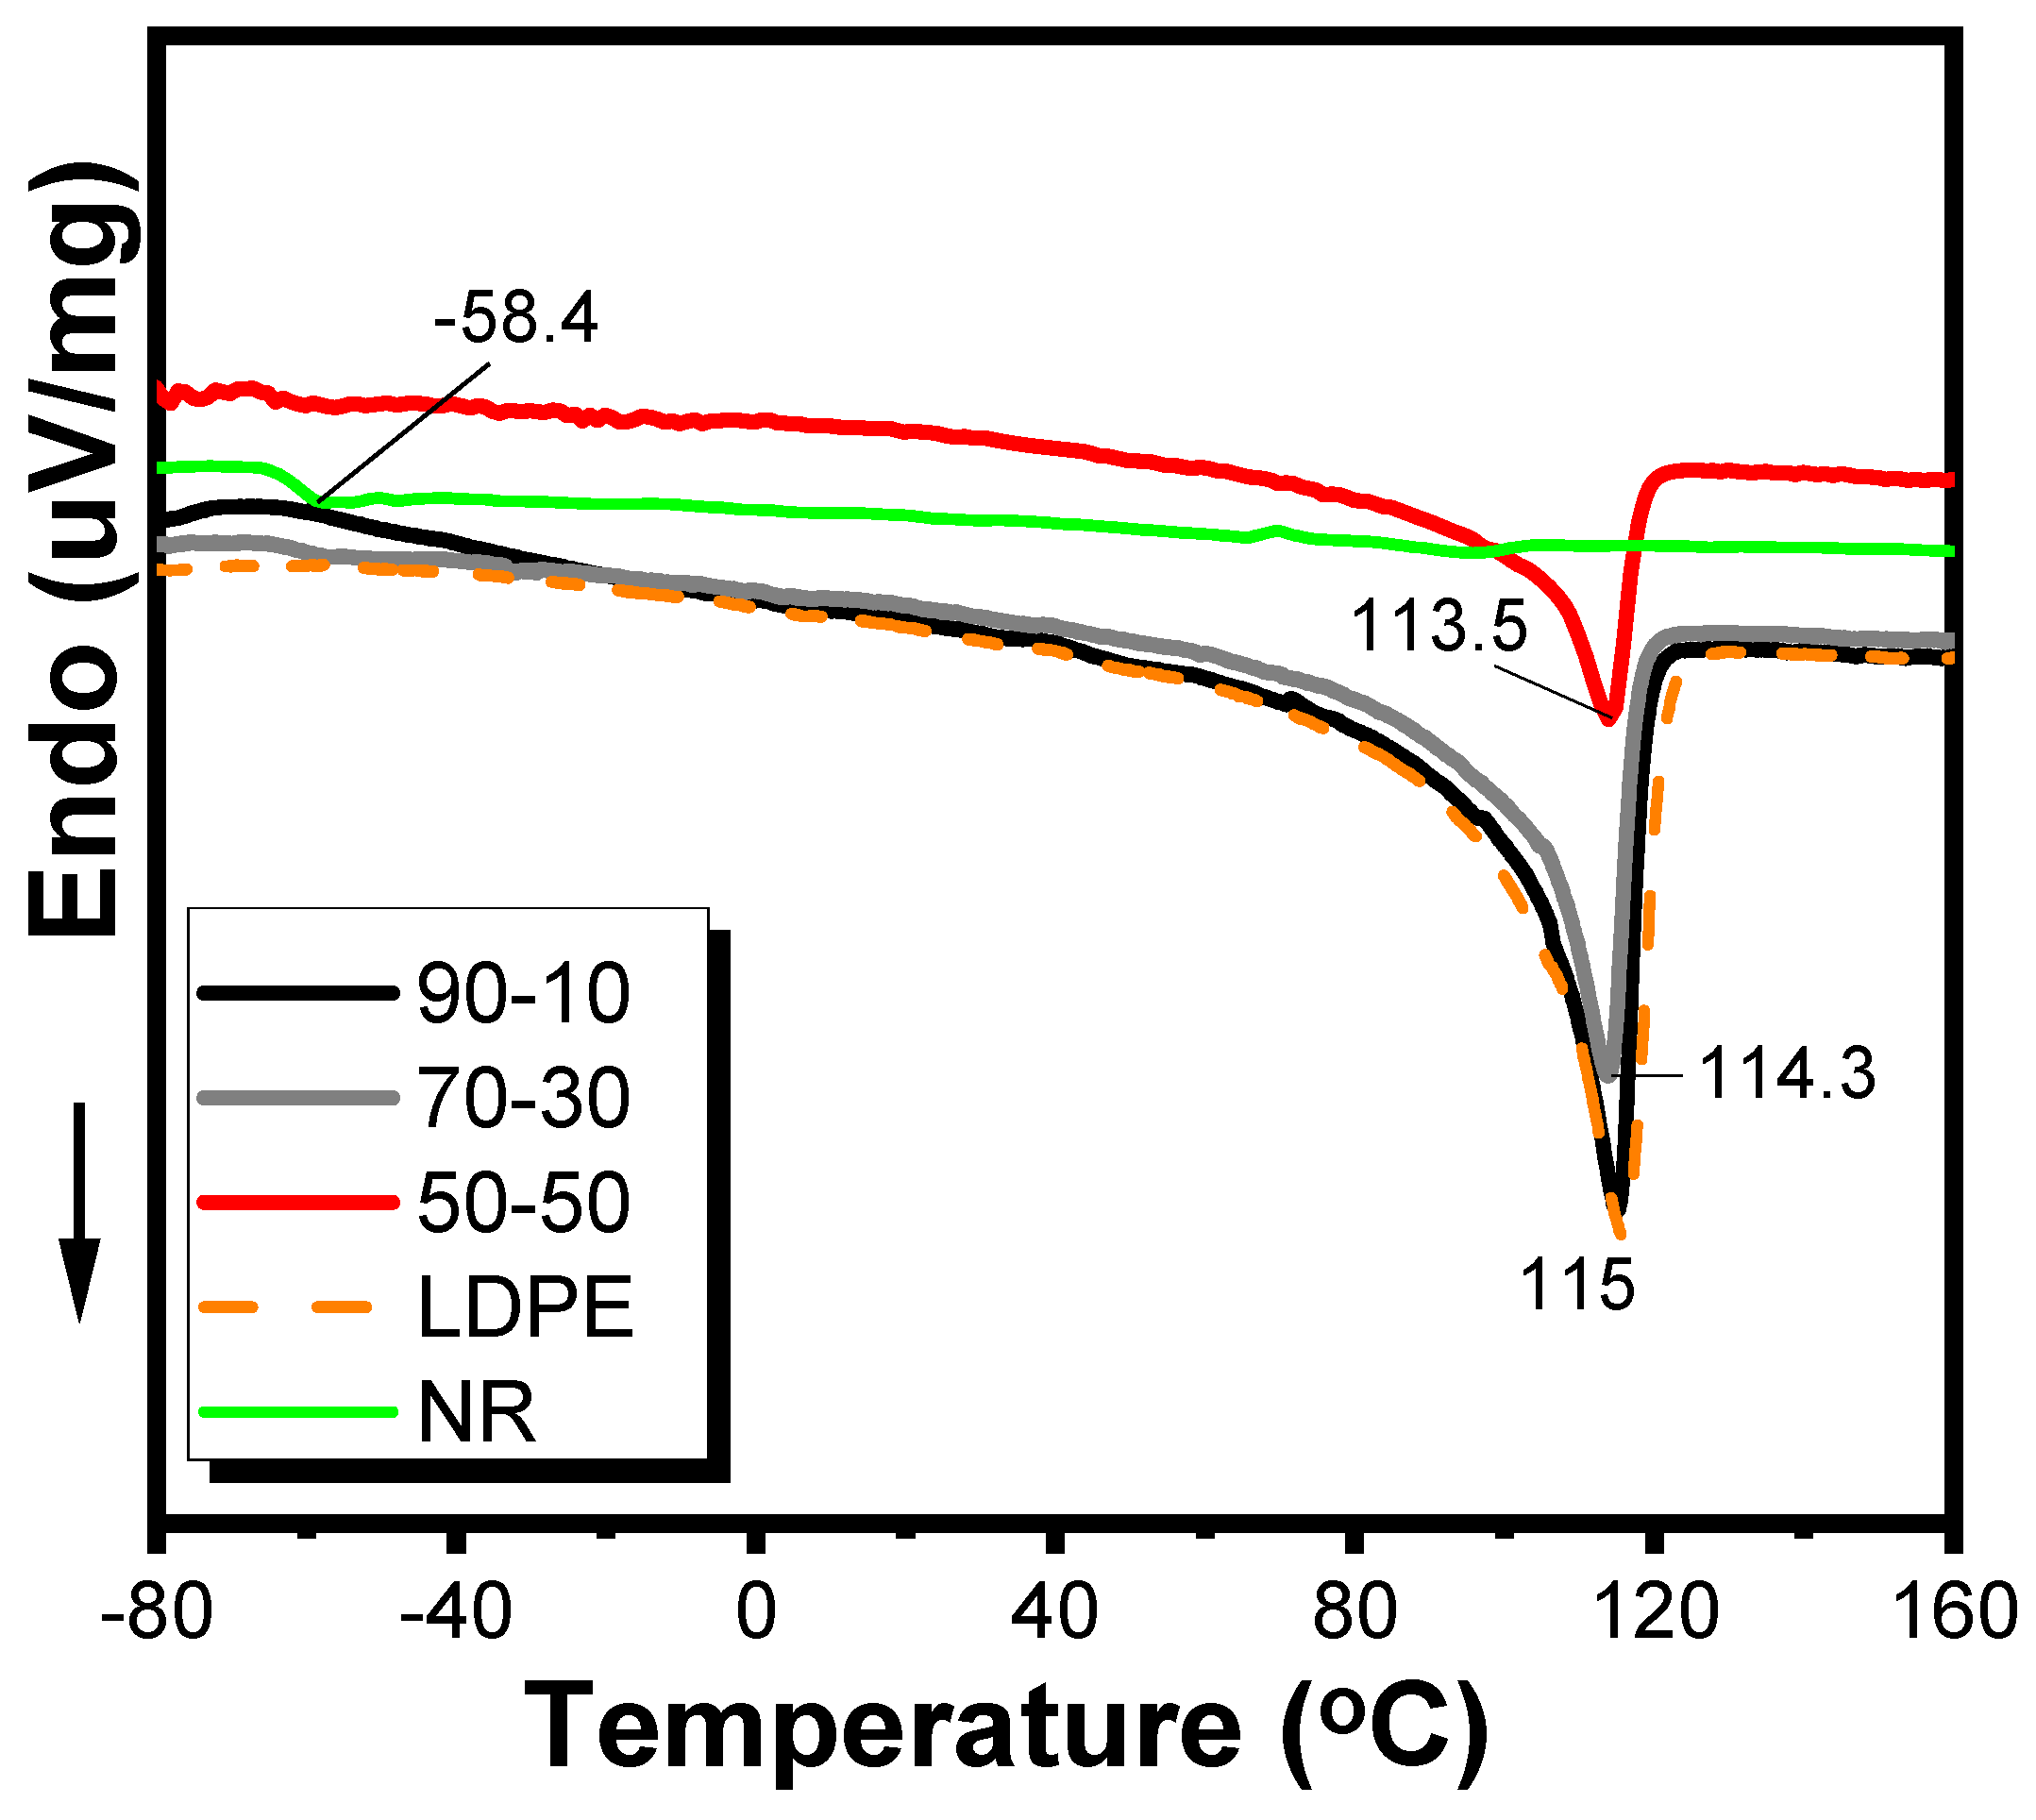
Figure 10.
DSC curves of the LDPE/masterbatch blends with curing agents. Source: Own work.
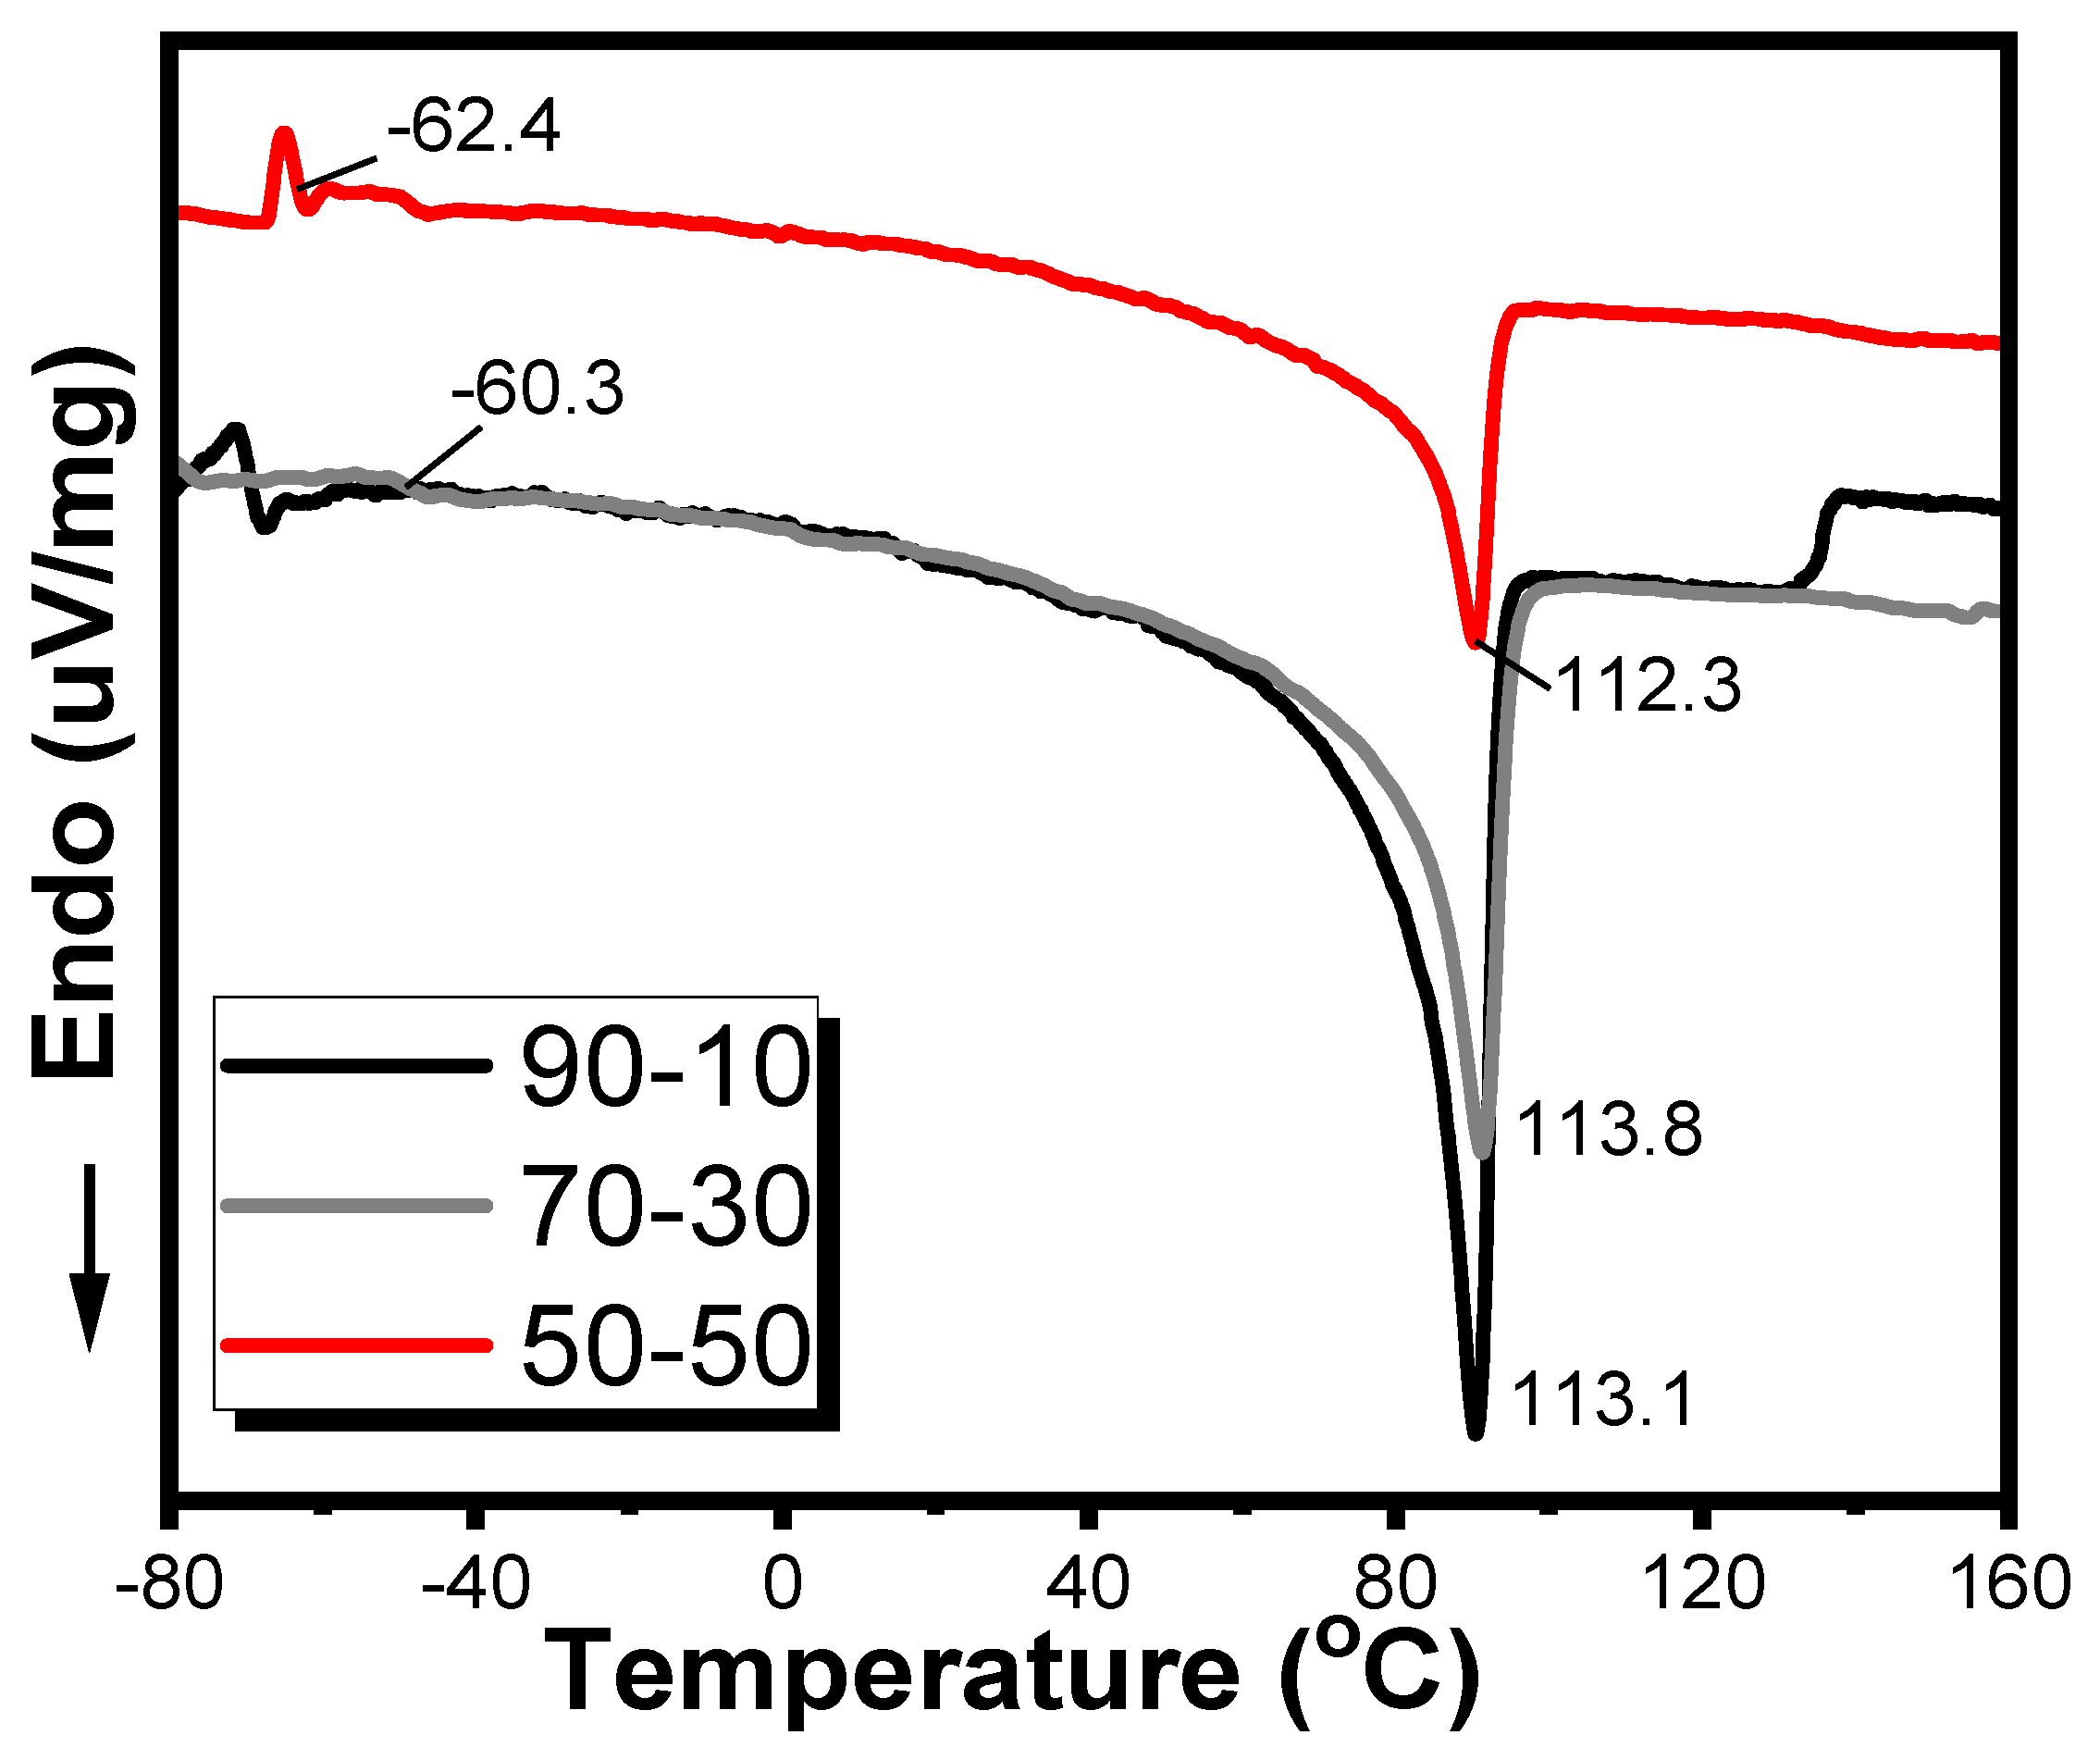
Figure 11.
FTIR spectra for the LDPE/NR blend with the vulcanization system. Source: Own work.
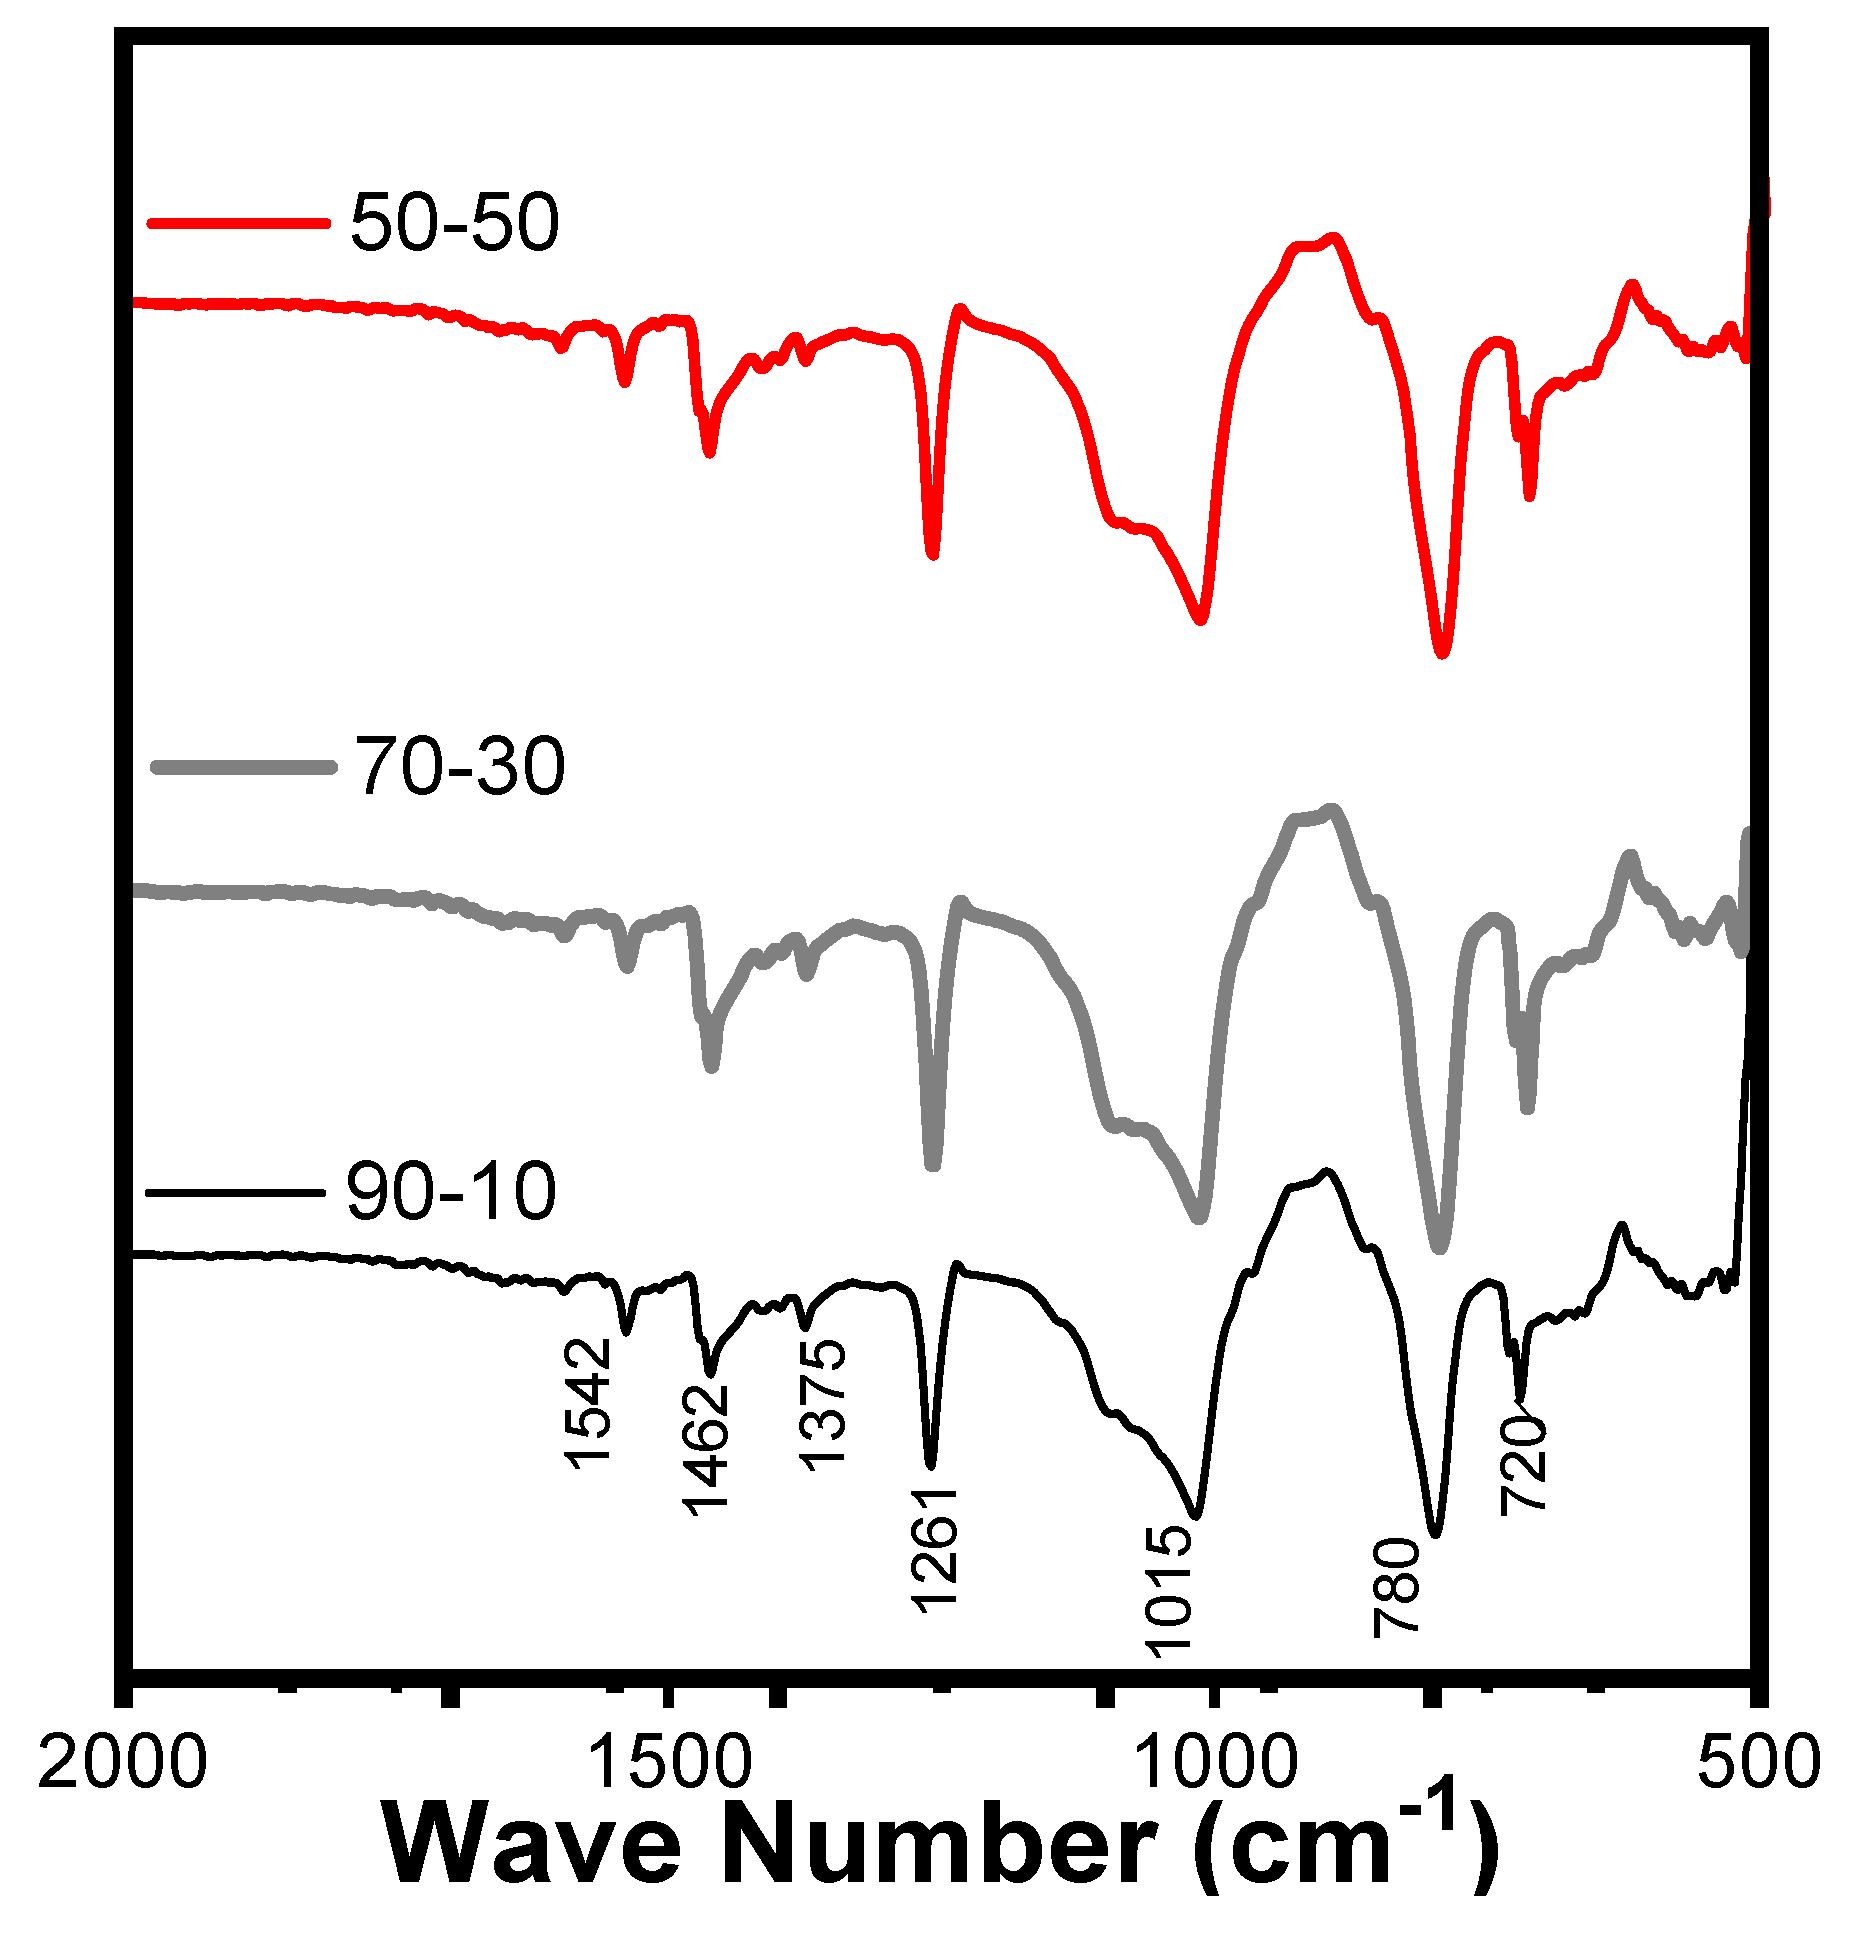
Figure 12.
FTIR spectra of the LDPE/masterbatch blend with the vulcanization system. Source: Own work.
Figure 12.
FTIR spectra of the LDPE/masterbatch blend with the vulcanization system. Source: Own work.
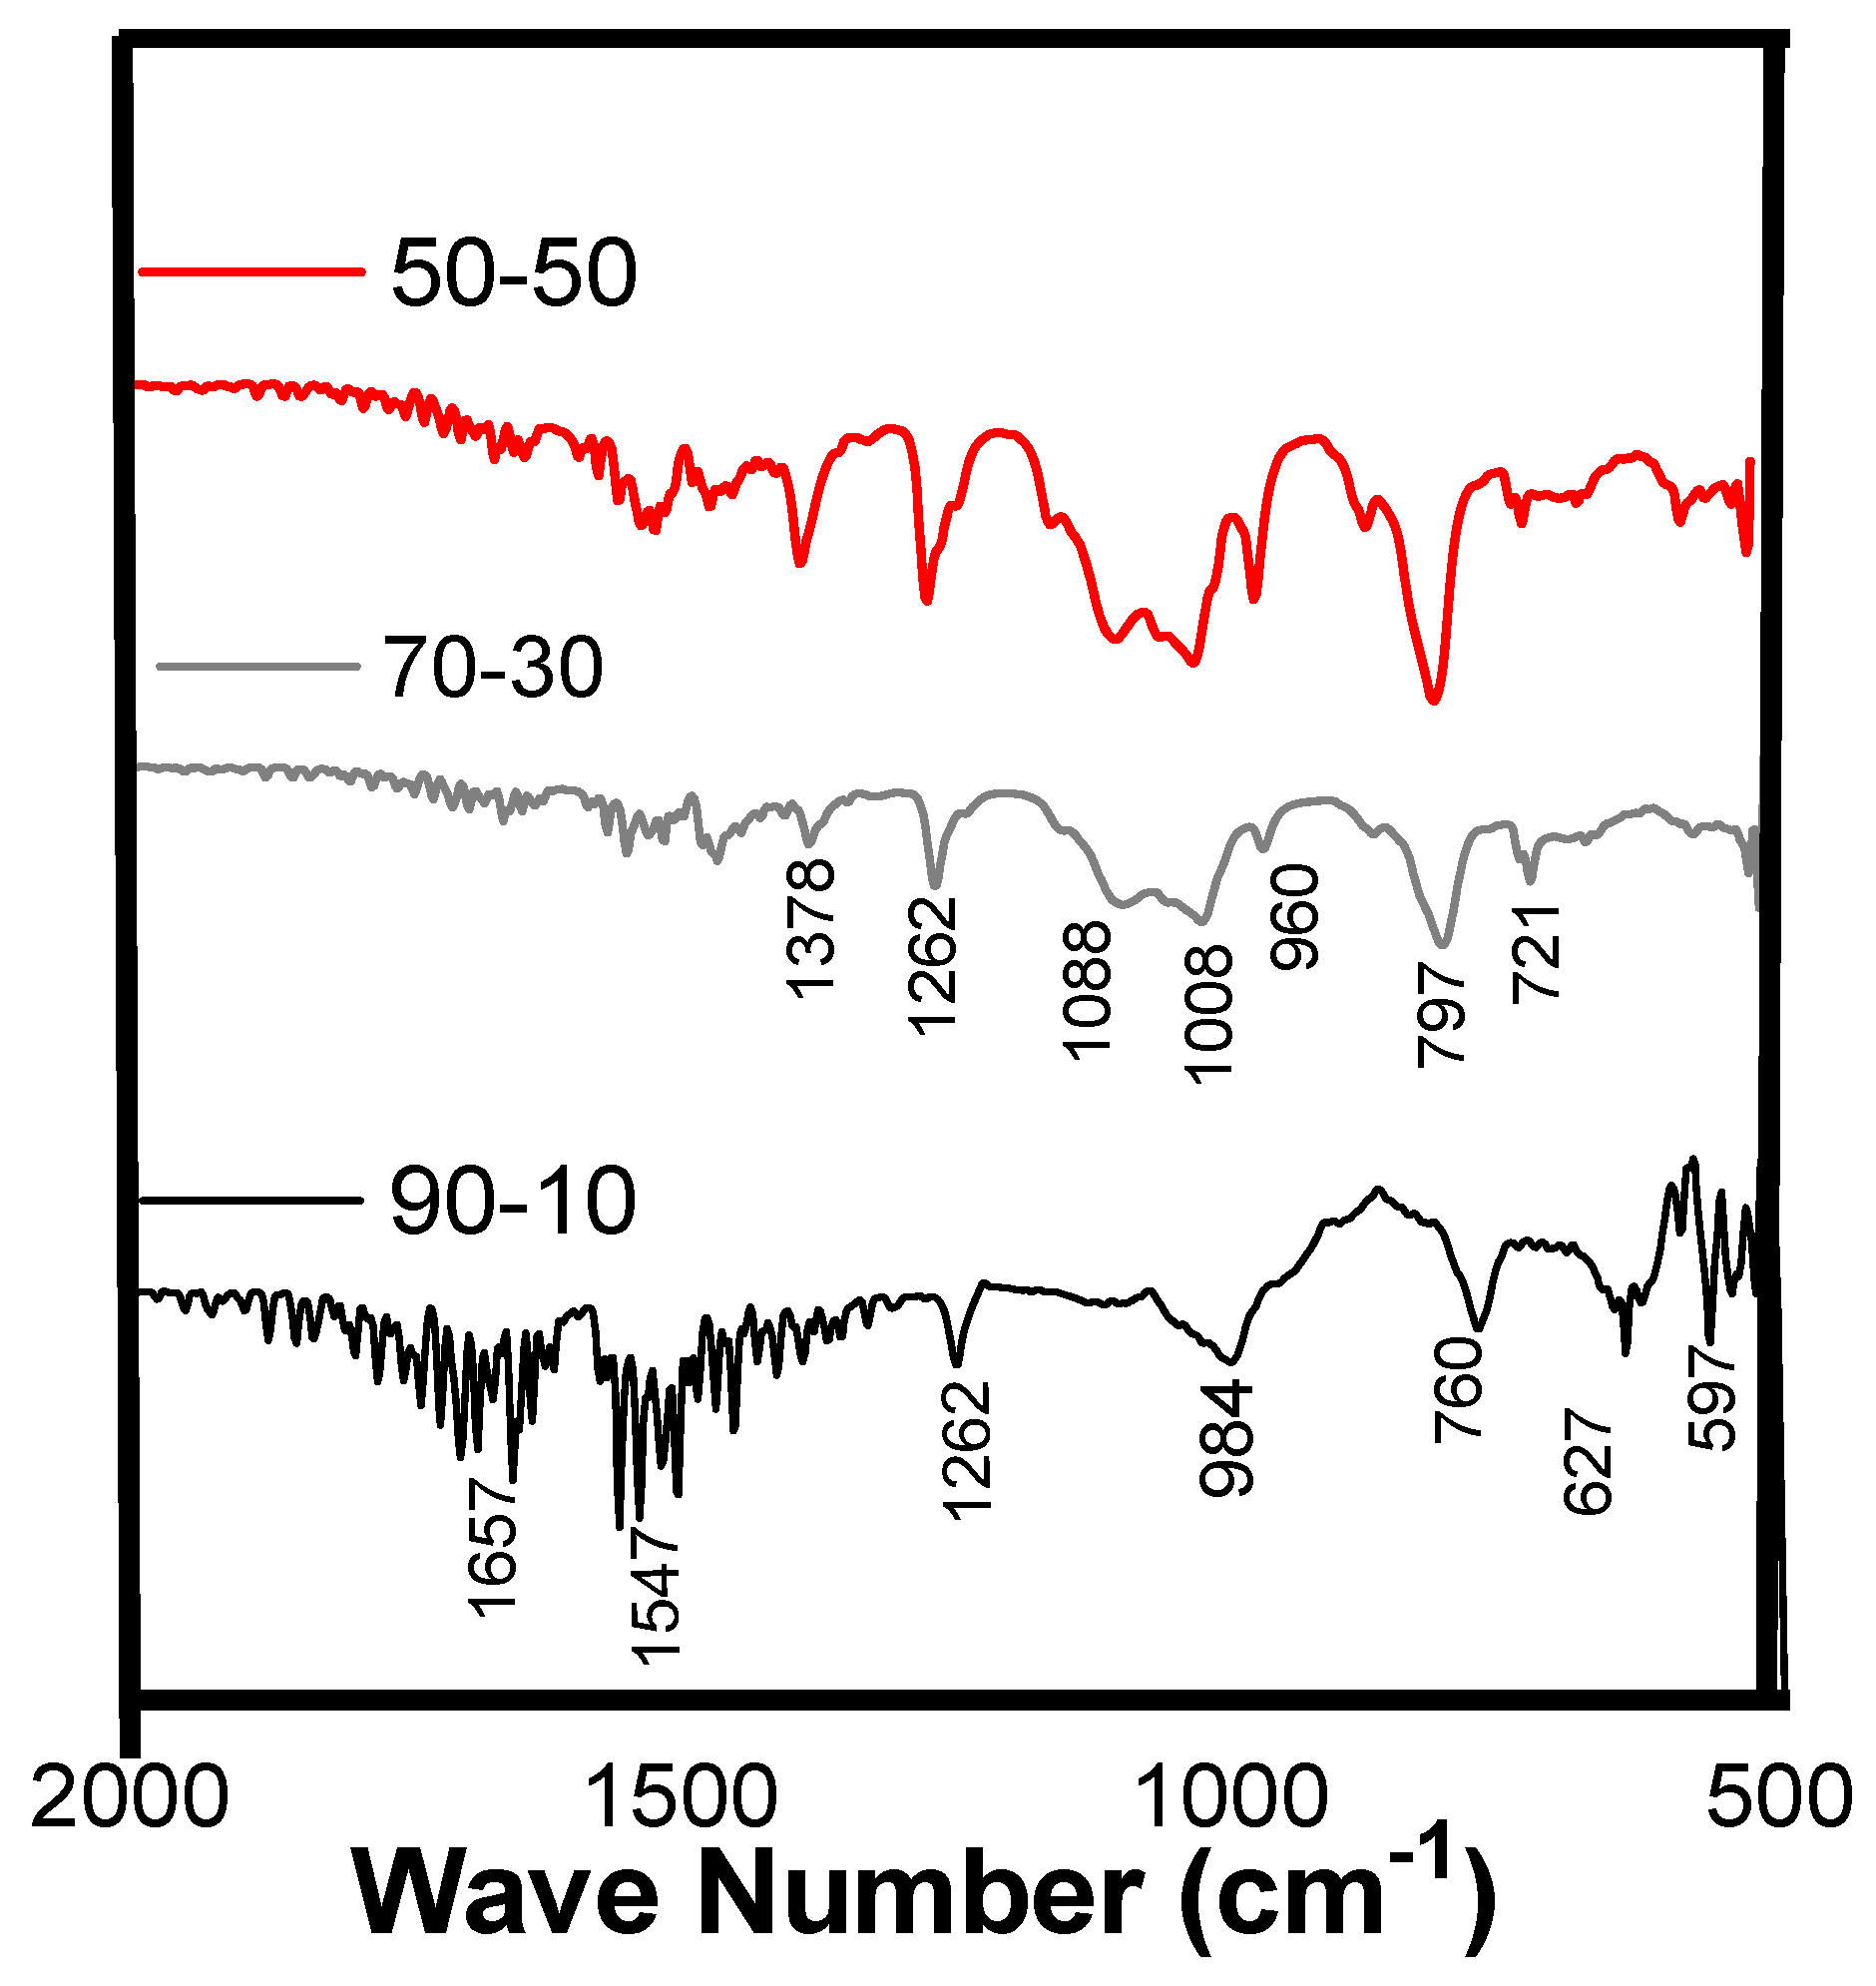
Figure 13.
SEM micrographs of fracture surfaces of vulcanized LDPE/NR blends (90/10, 70/30, and 50/50 %m). Source: Own work.
Figure 13.
SEM micrographs of fracture surfaces of vulcanized LDPE/NR blends (90/10, 70/30, and 50/50 %m). Source: Own work.
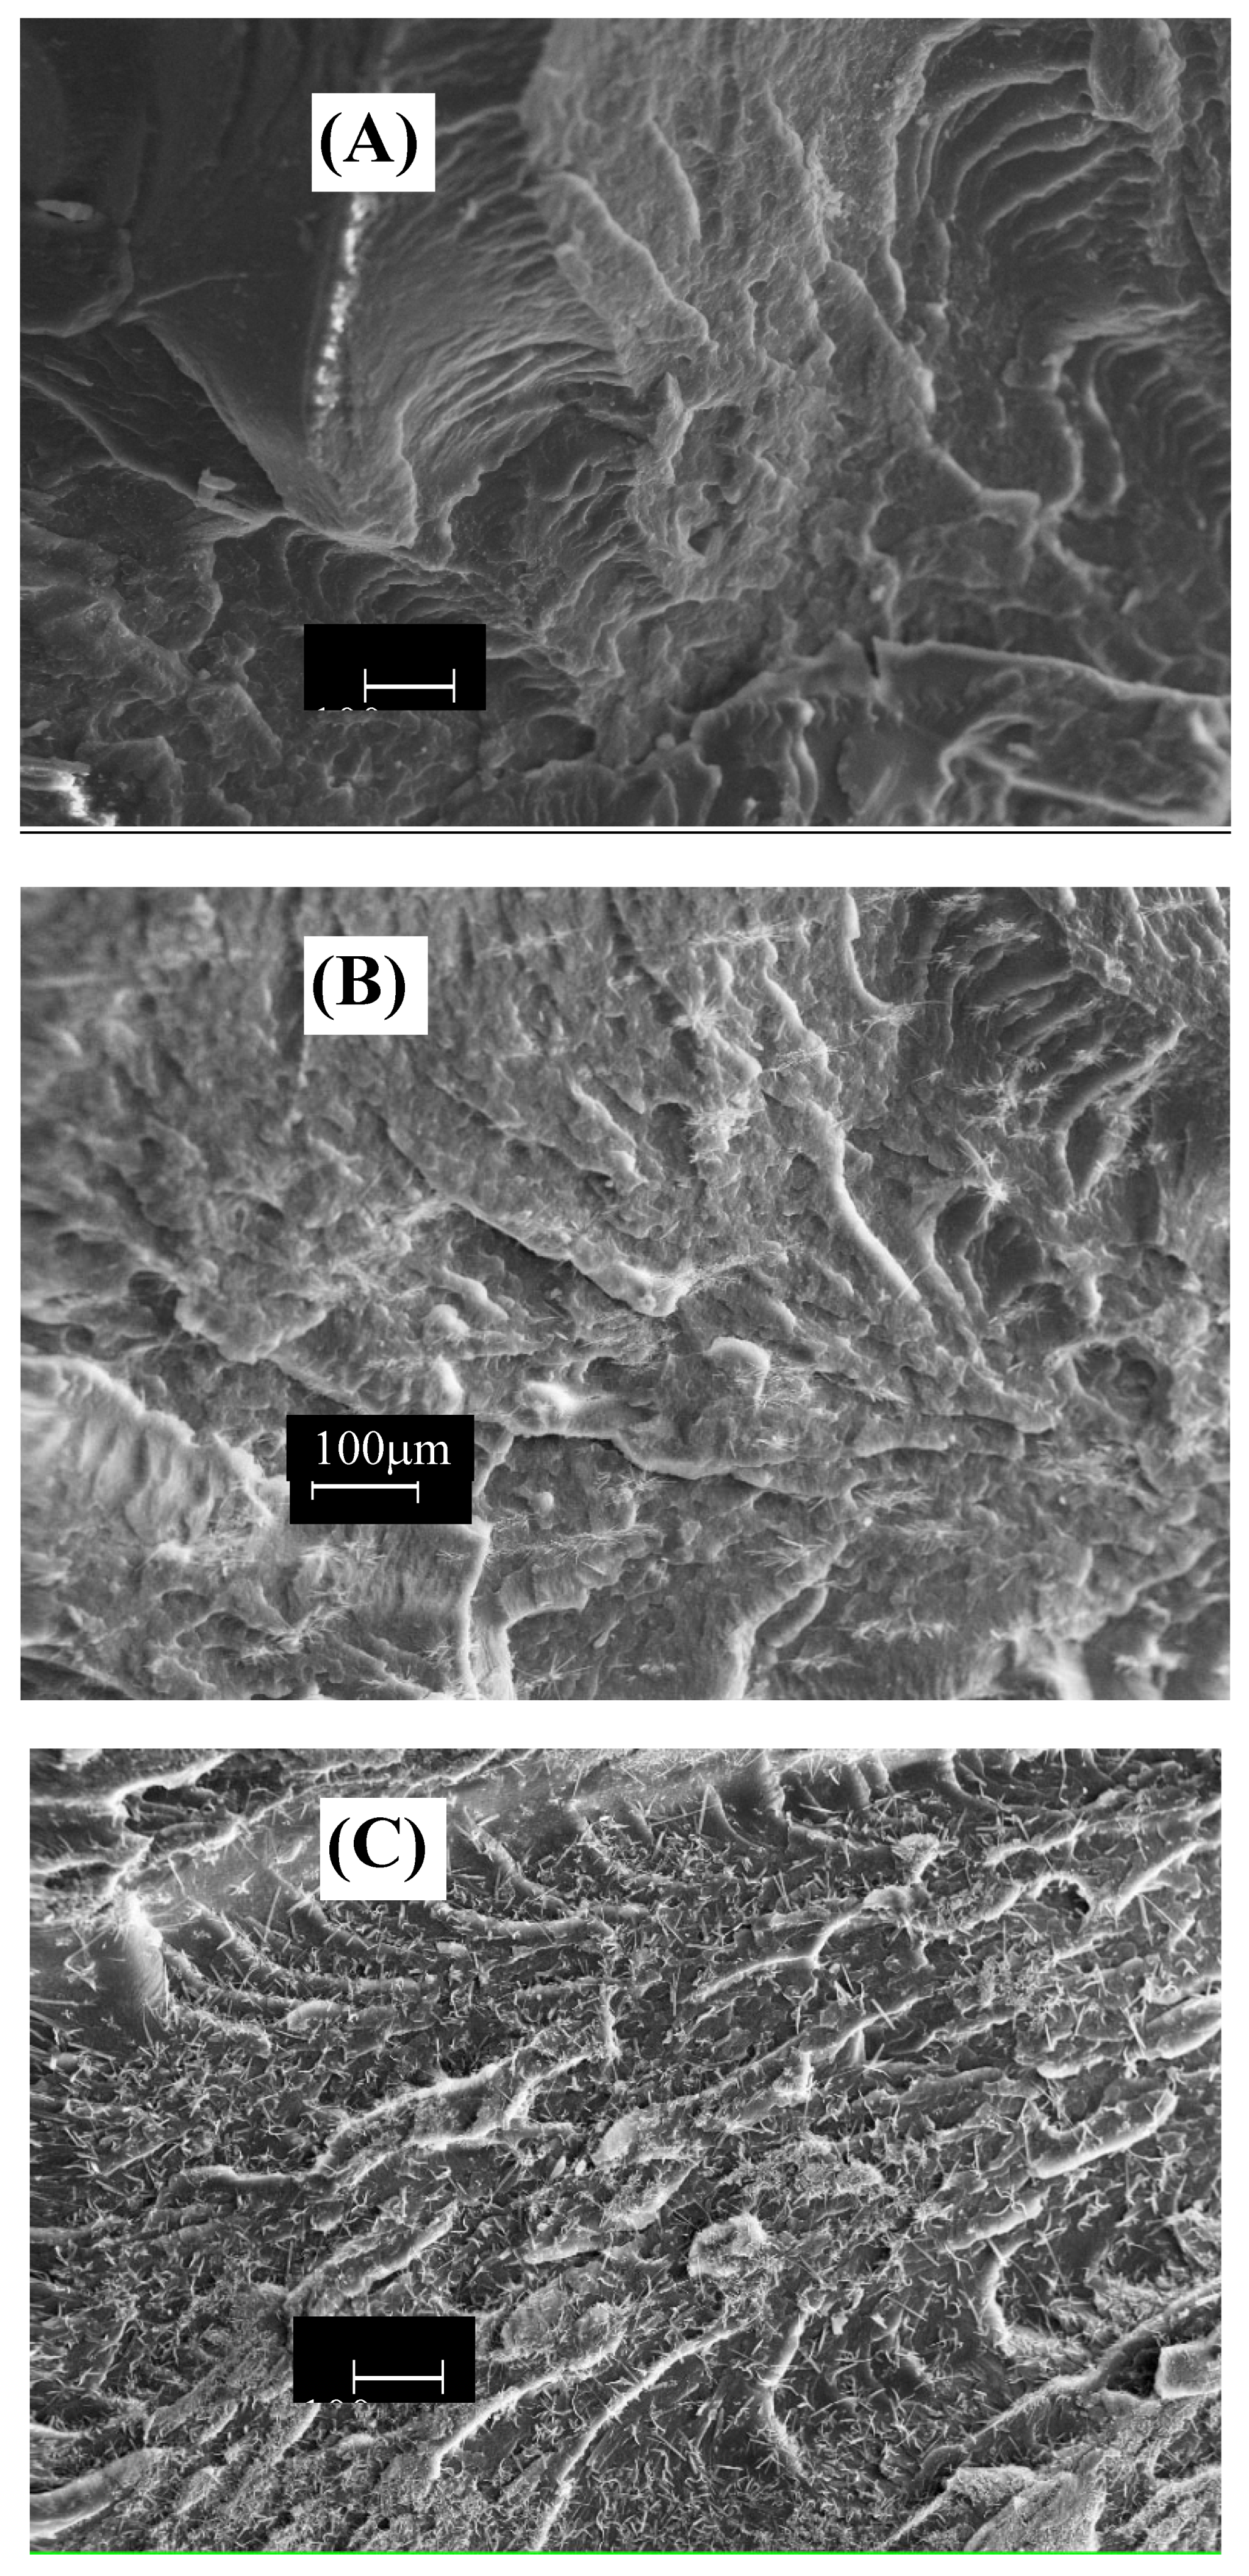
Figure 14.
SEM micrographs of fracture surfaces of vulcanized LDPE/masterbatch blends (90/10, 70/30, and 50/50 %m). Source: Own work.
Figure 14.
SEM micrographs of fracture surfaces of vulcanized LDPE/masterbatch blends (90/10, 70/30, and 50/50 %m). Source: Own work.
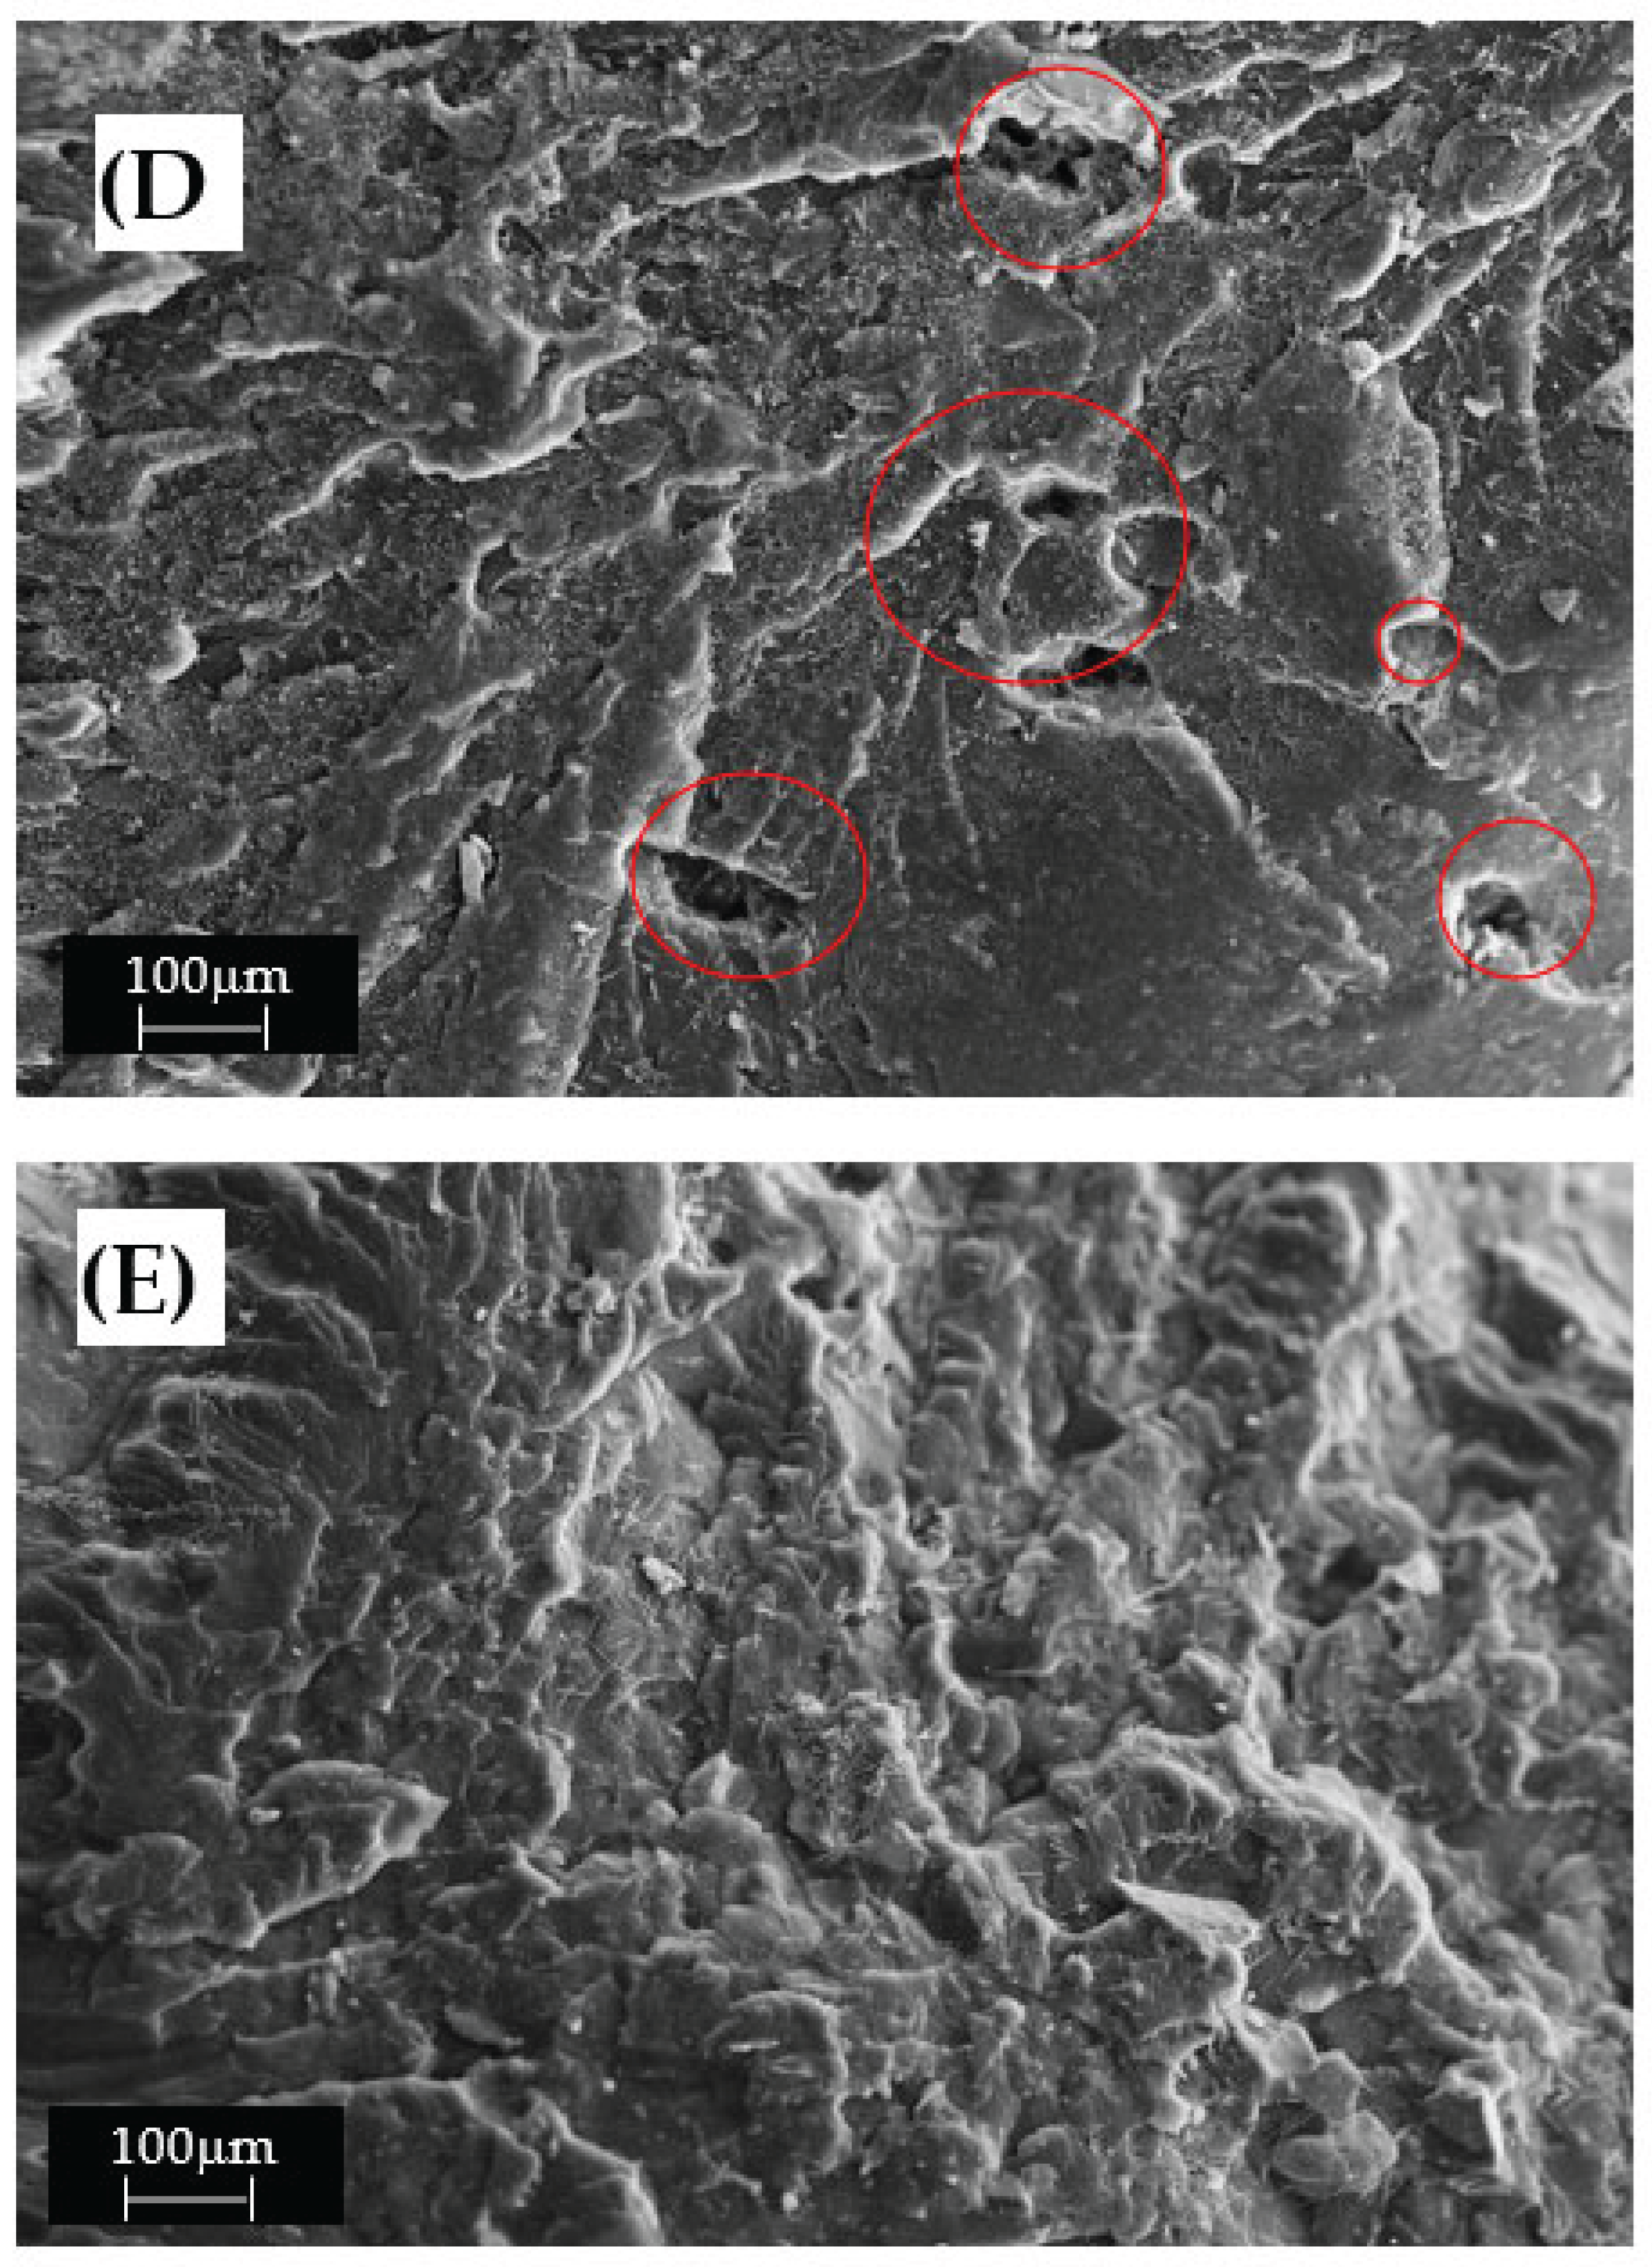
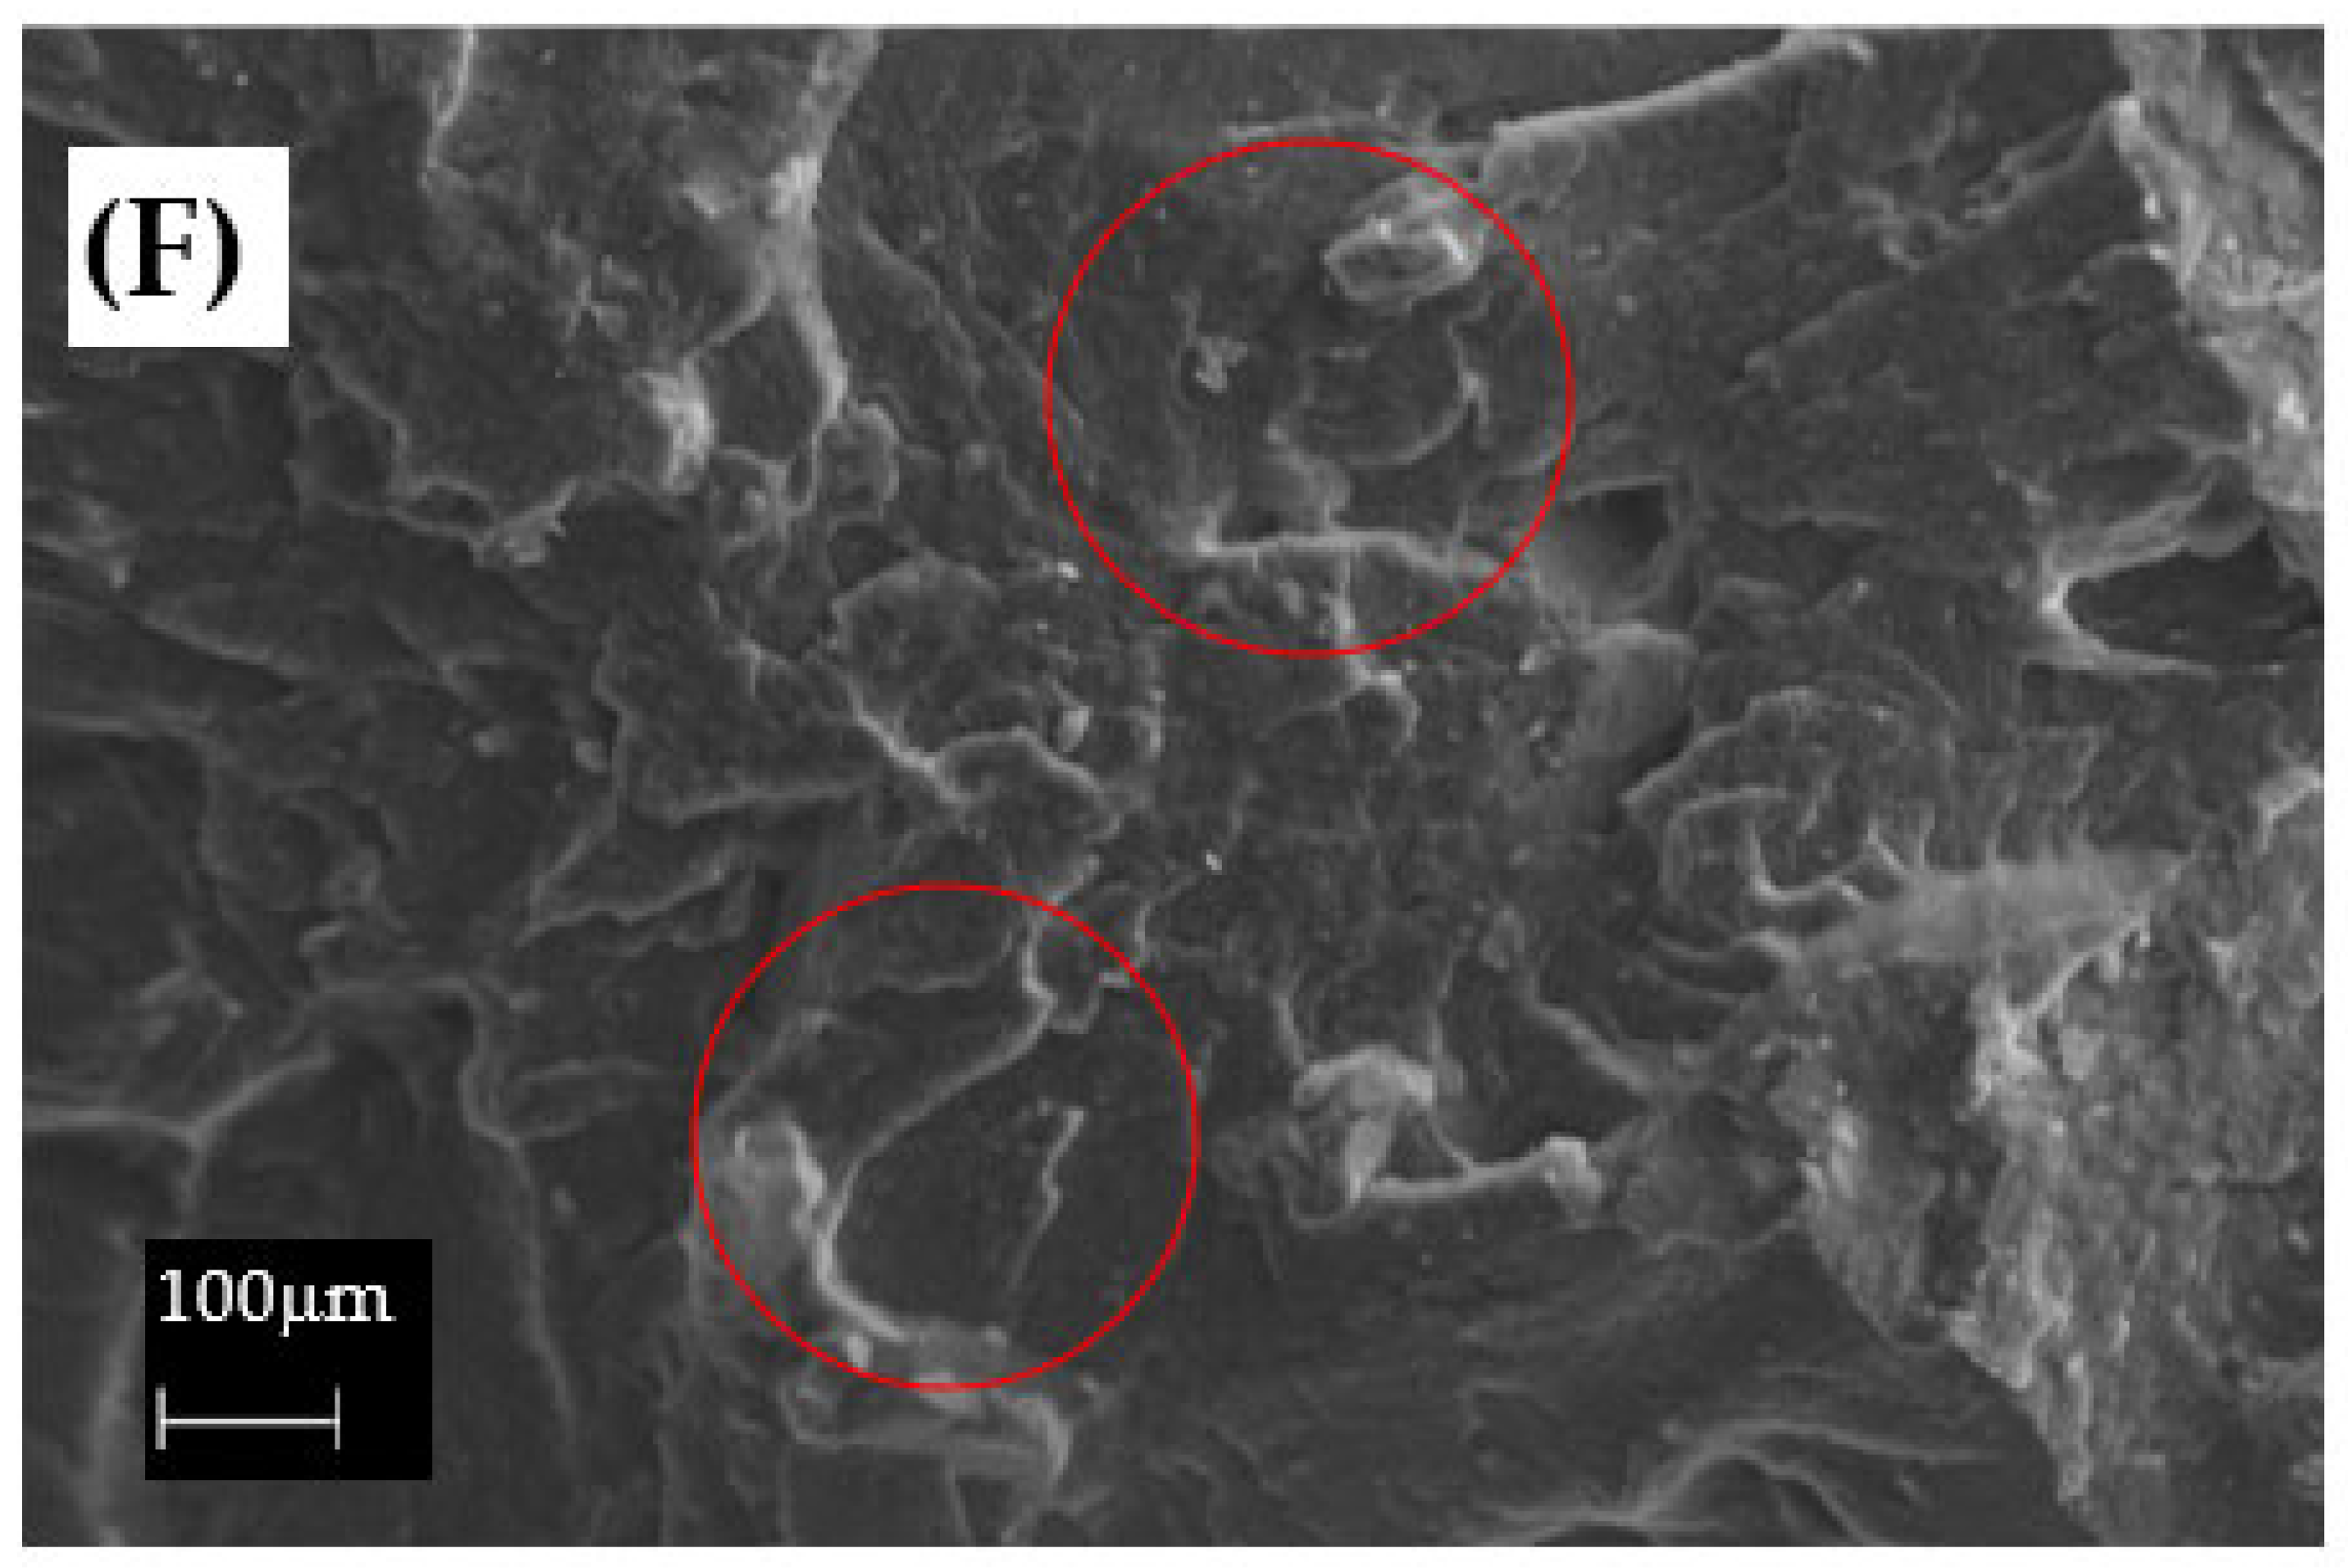
Figure 15.
Elastic deformation comparison of the blends with** and without* vulcanizing agents. Source: Own work.
Figure 15.
Elastic deformation comparison of the blends with** and without* vulcanizing agents. Source: Own work.
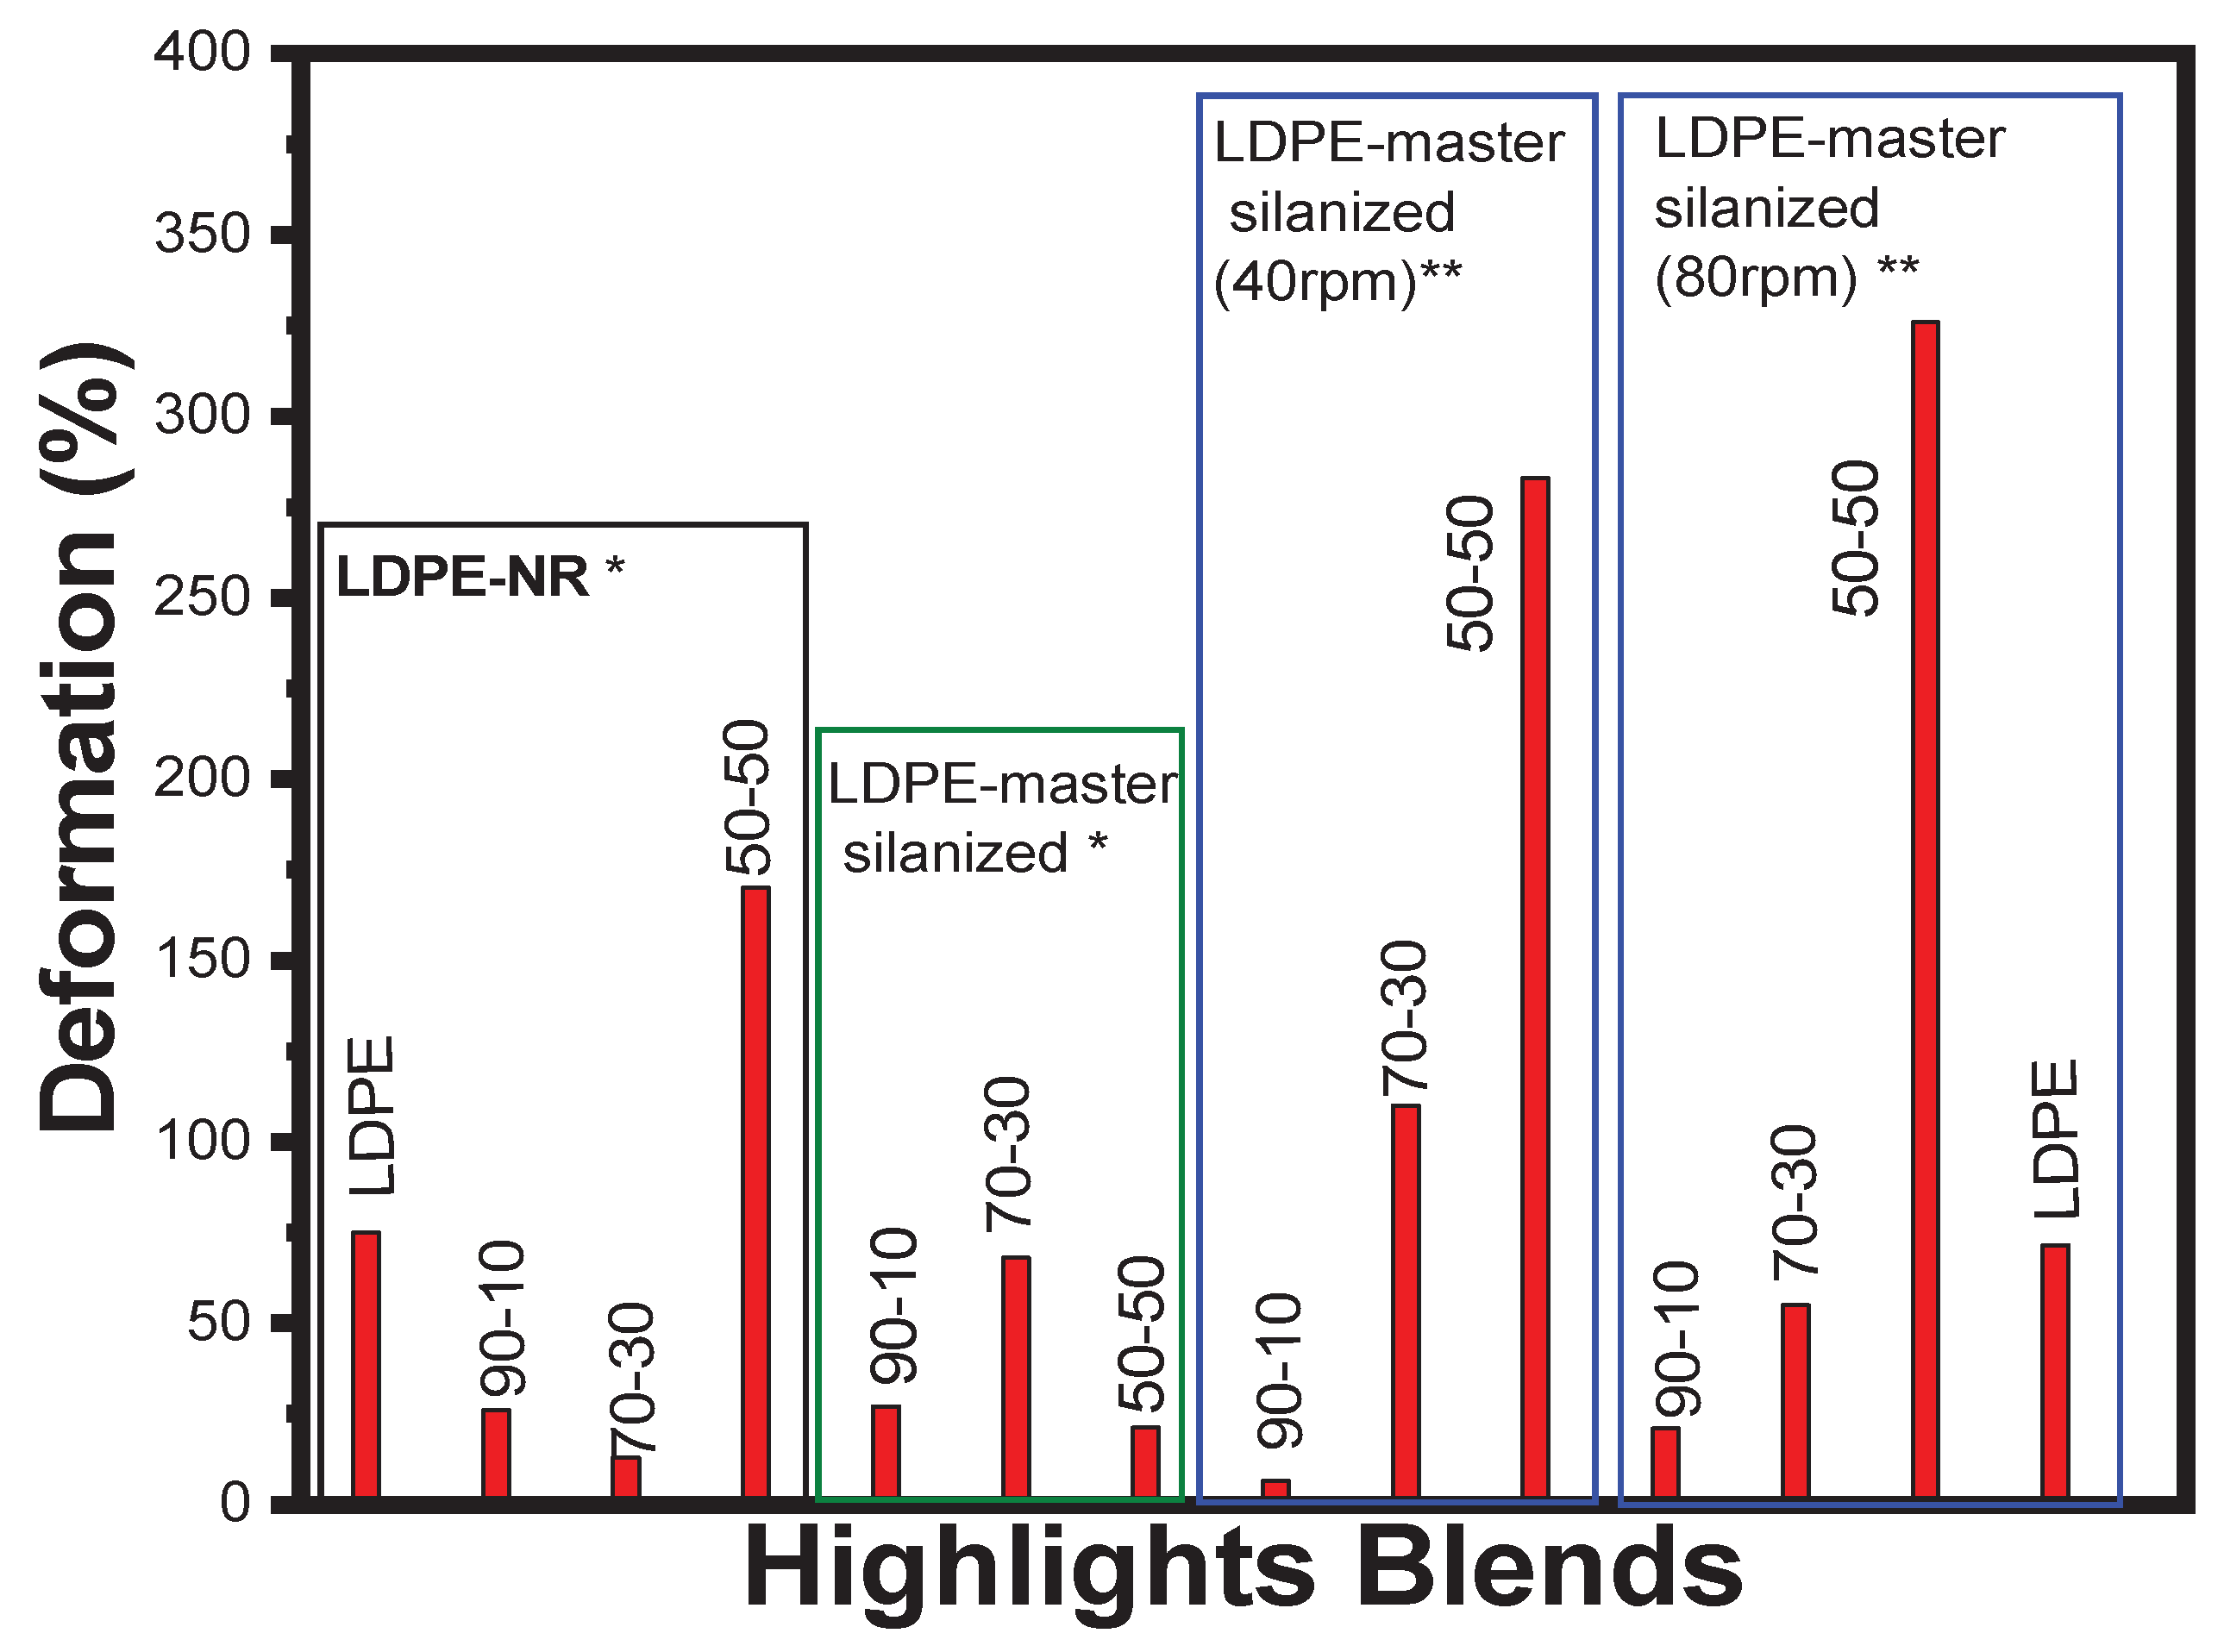
Figure 16.
Tensile strength comparison of the blends with and without vulcanizing agents. Source: Own work.
Figure 16.
Tensile strength comparison of the blends with and without vulcanizing agents. Source: Own work.
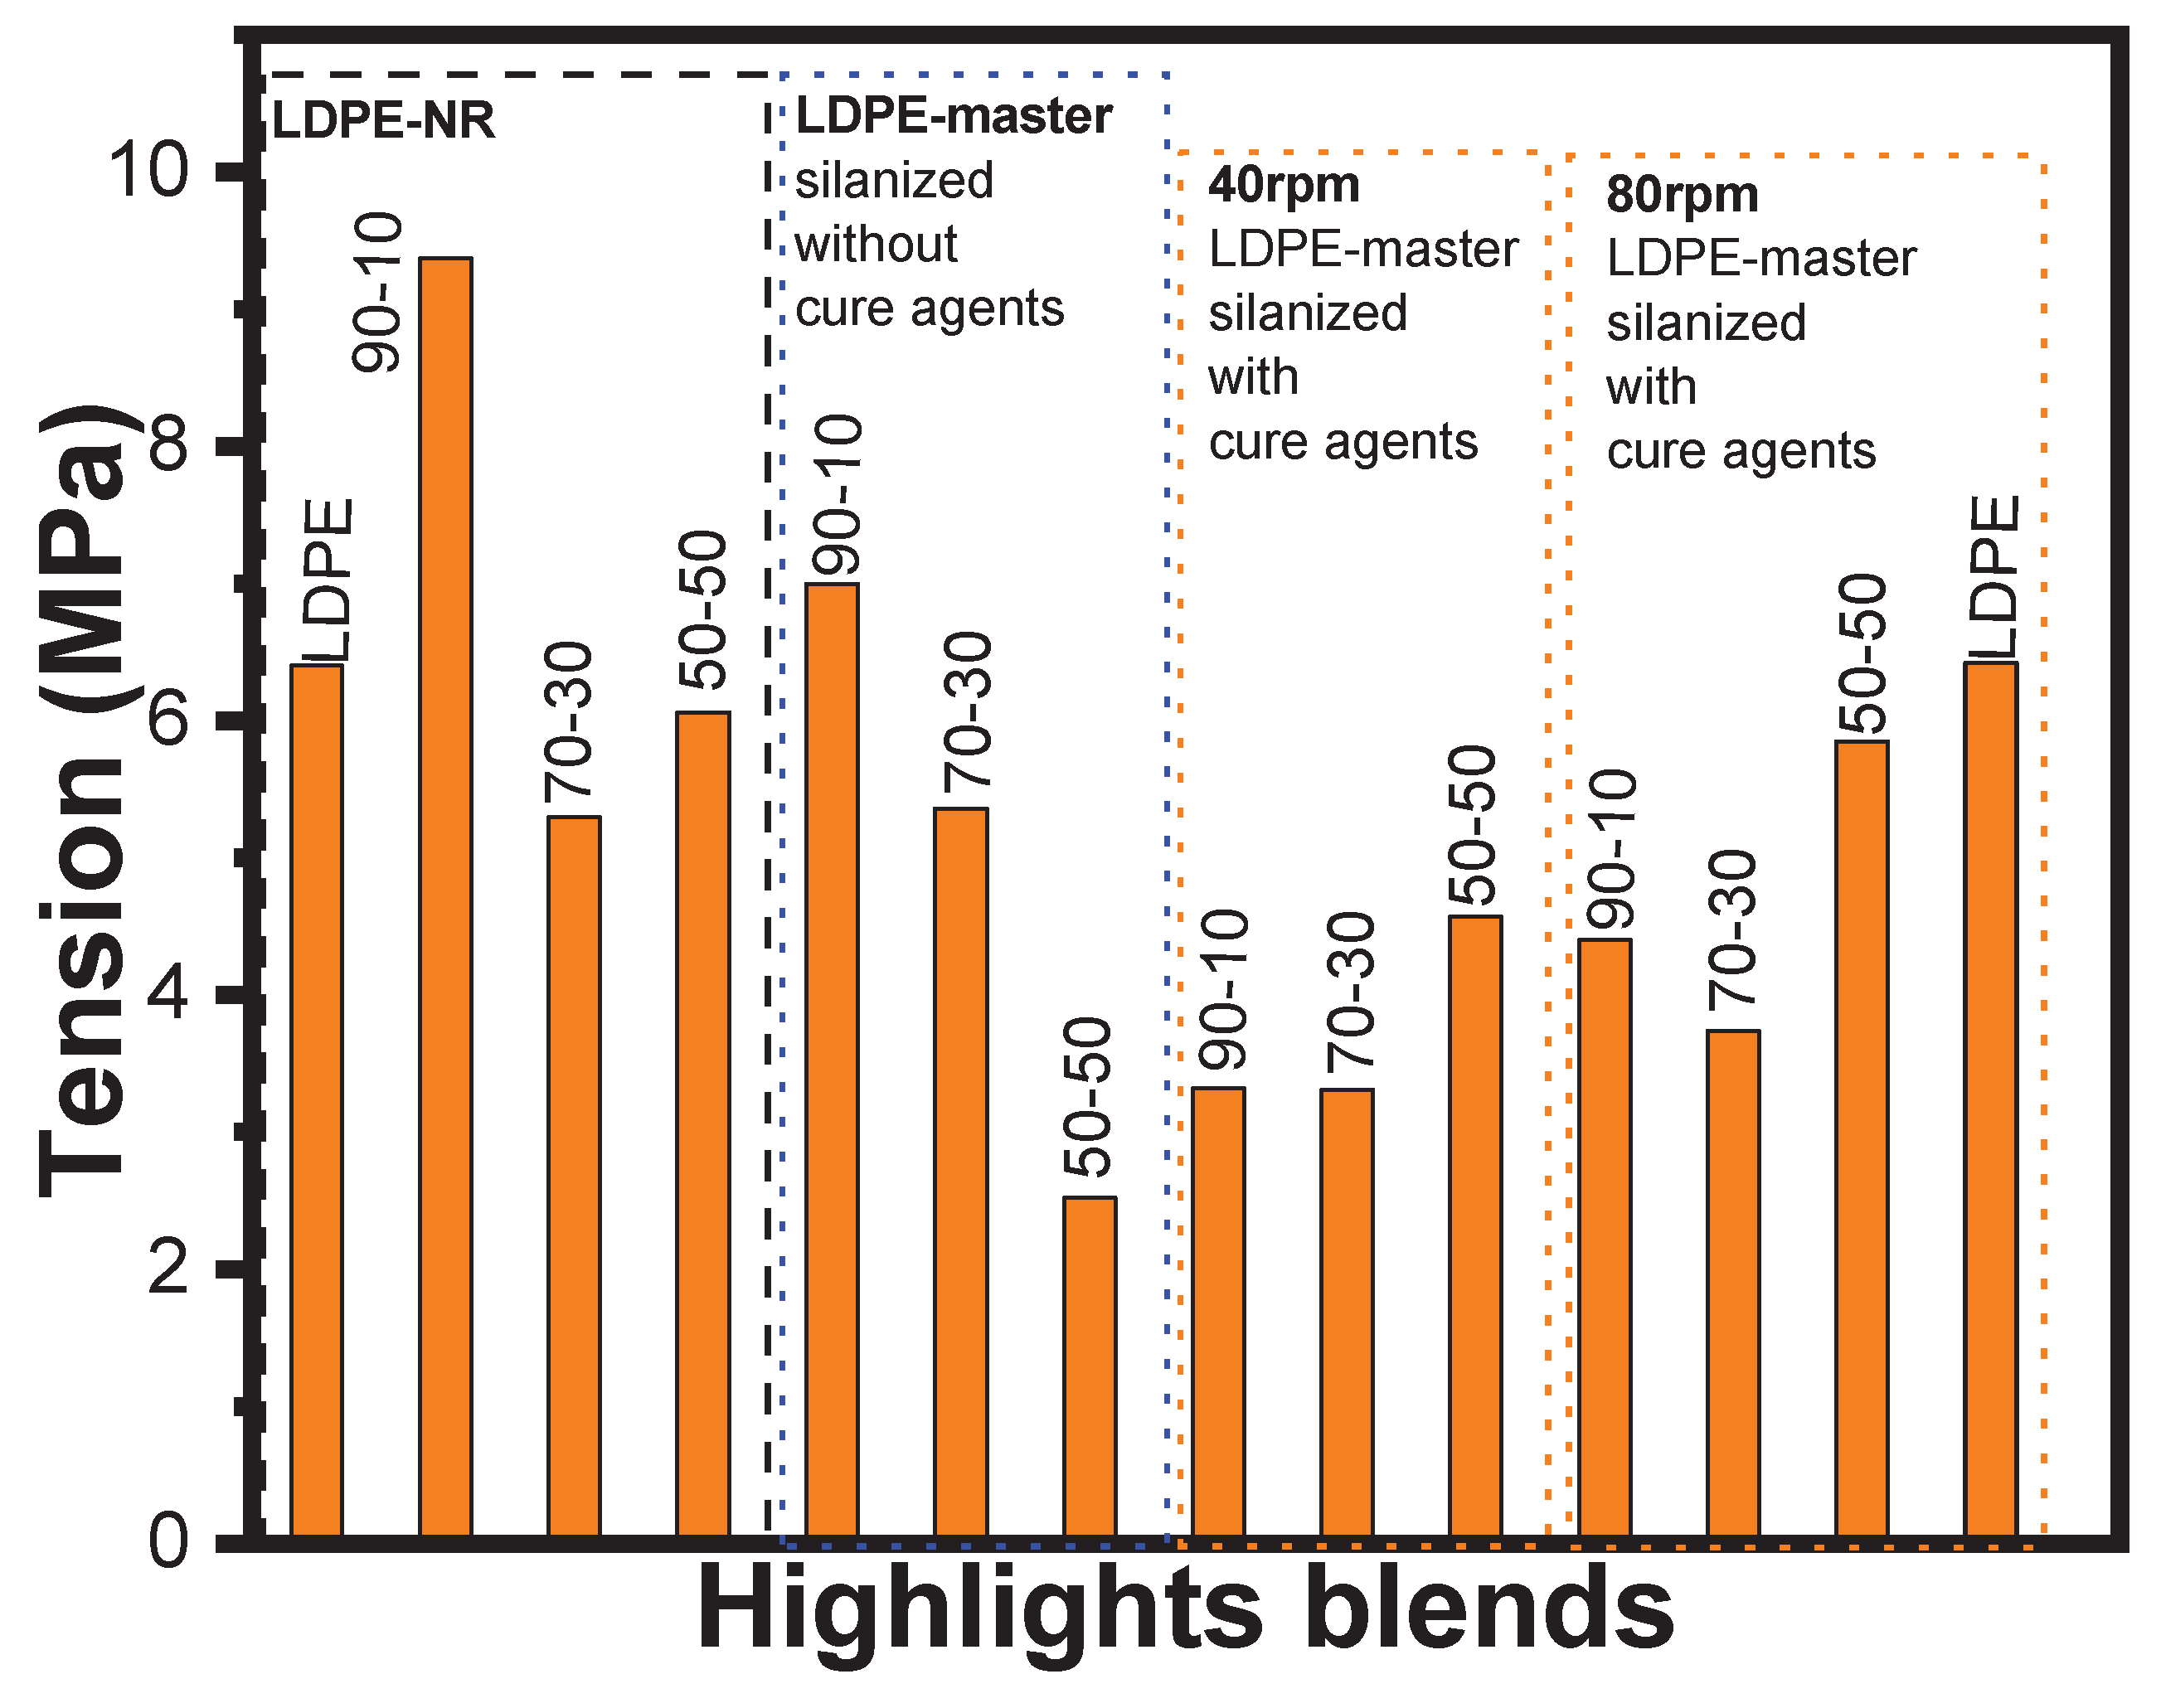
Figure 18.
Comparison of the storage modulus behavior of the blends at 25°C. Source: Own work.
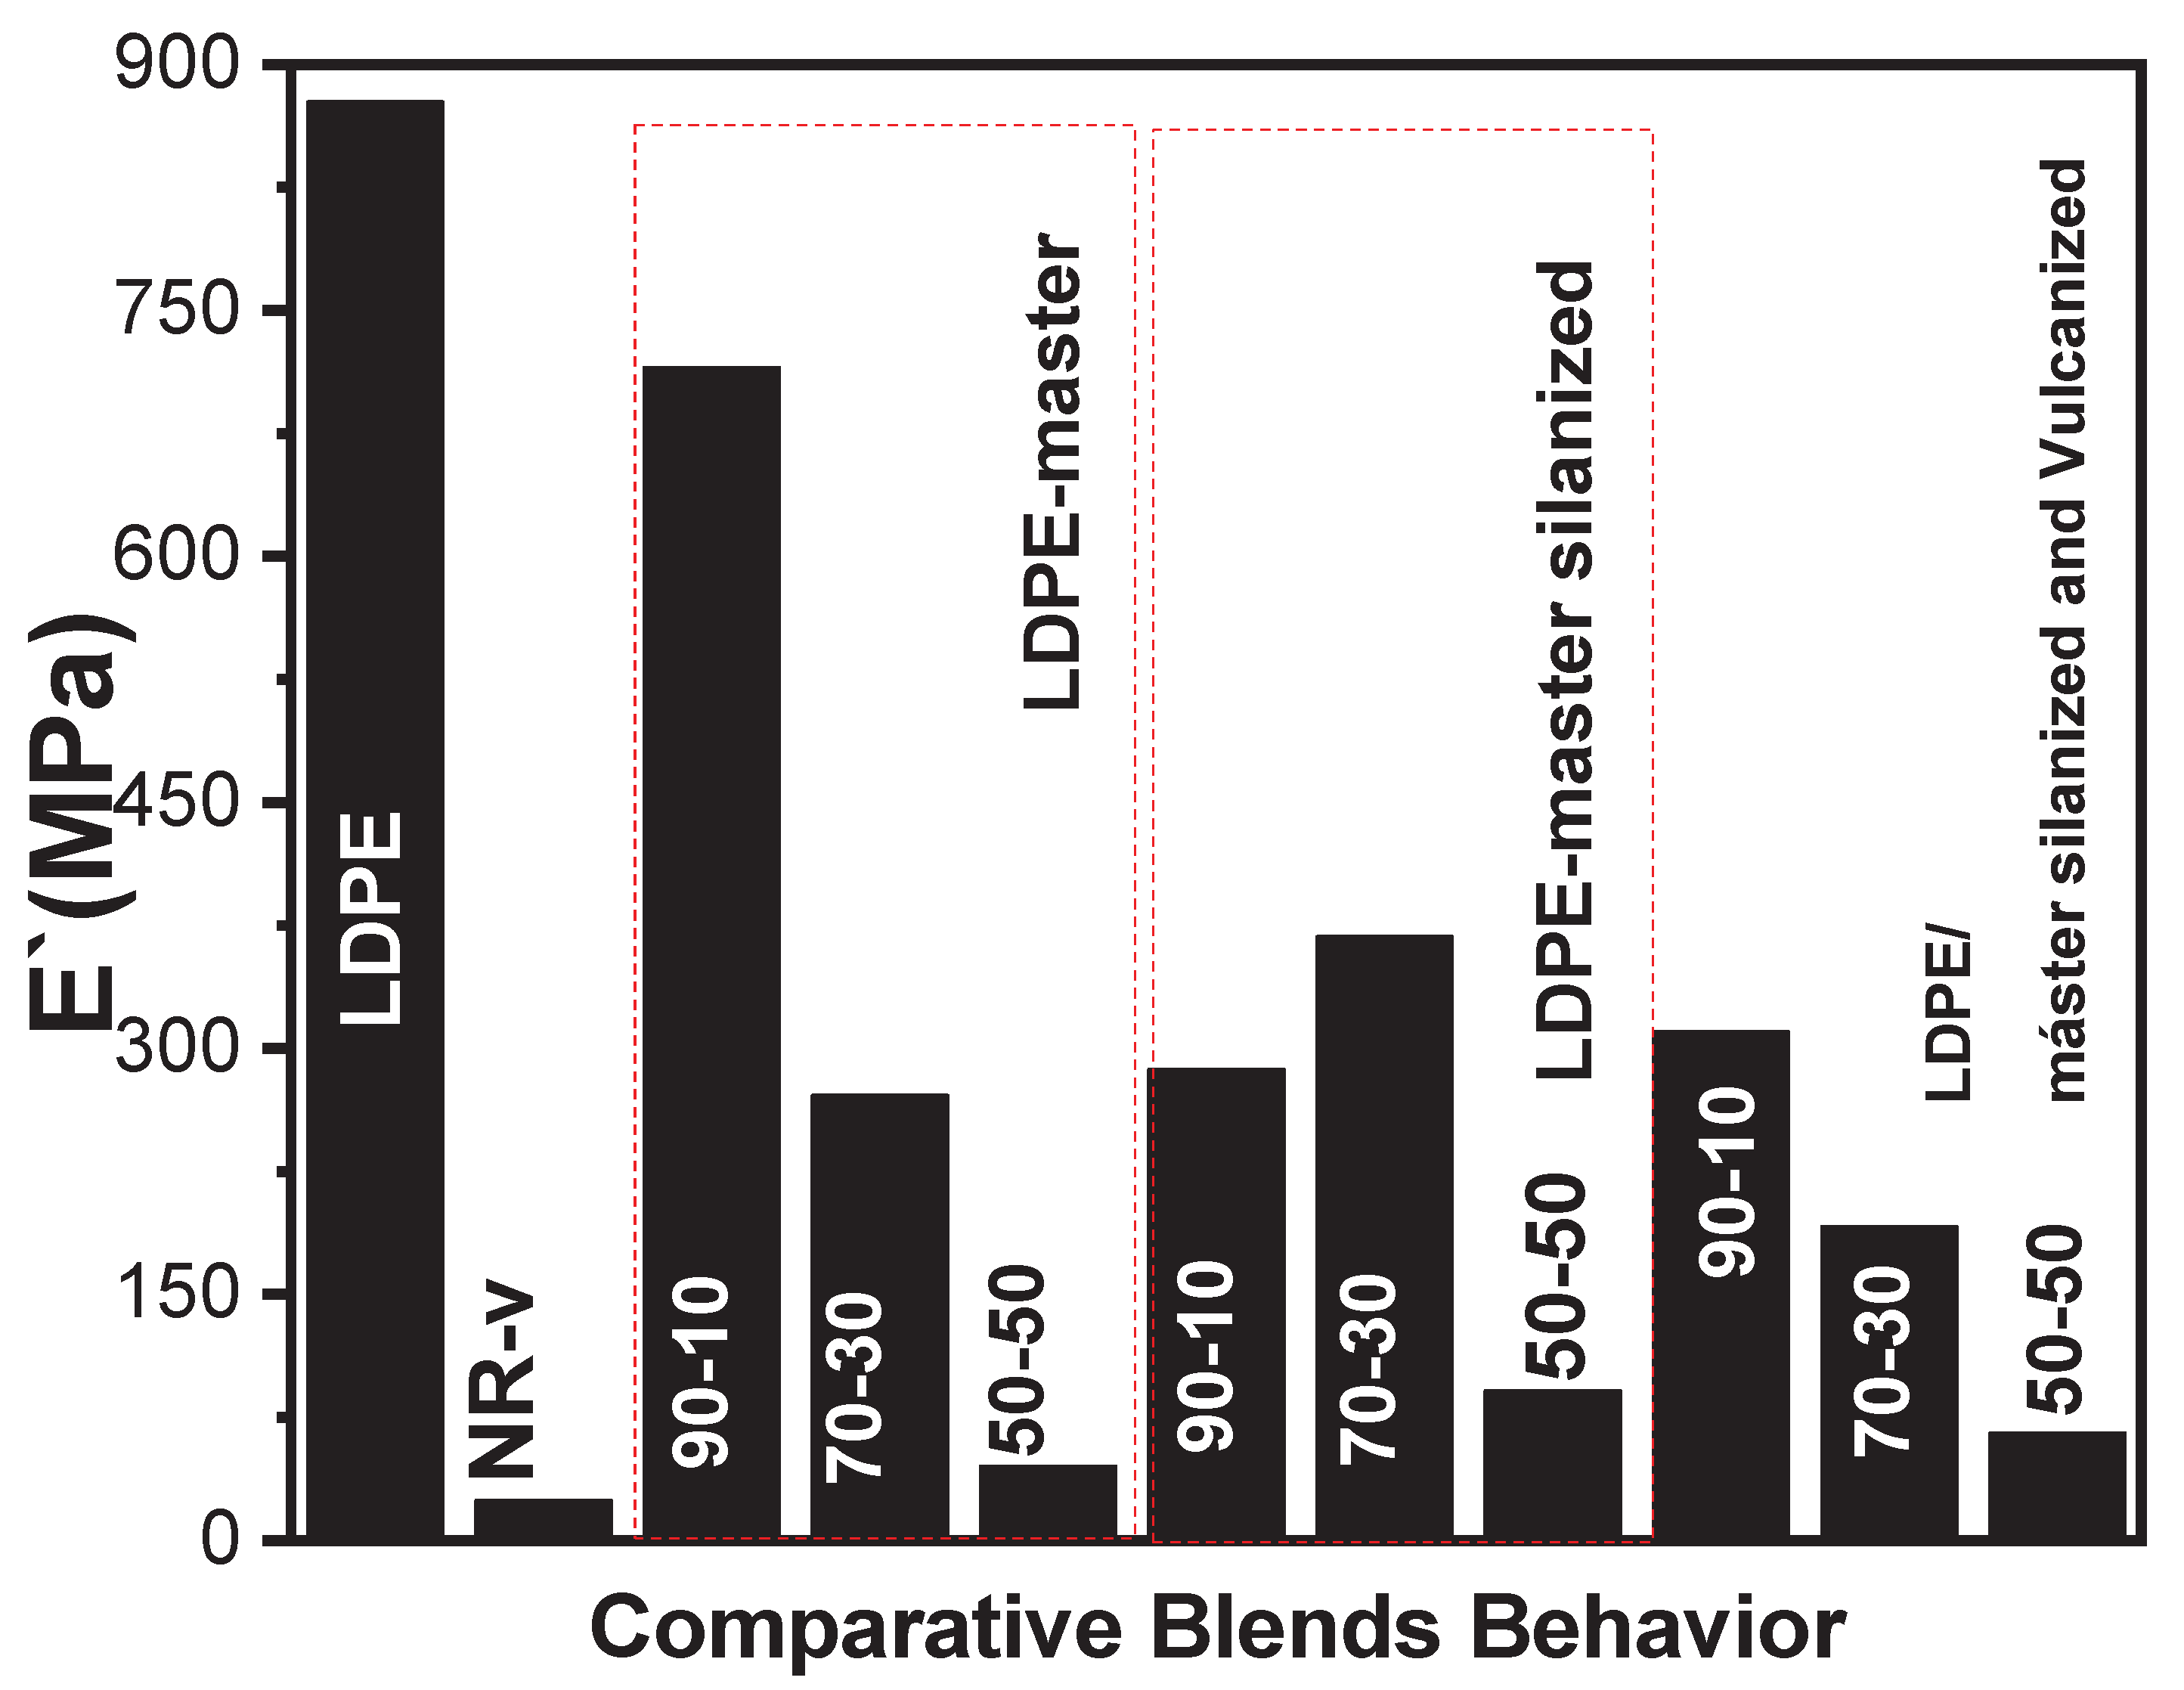
Figure 19.
Comparison of the Tan δ peak height of the blends. Source: Own work.
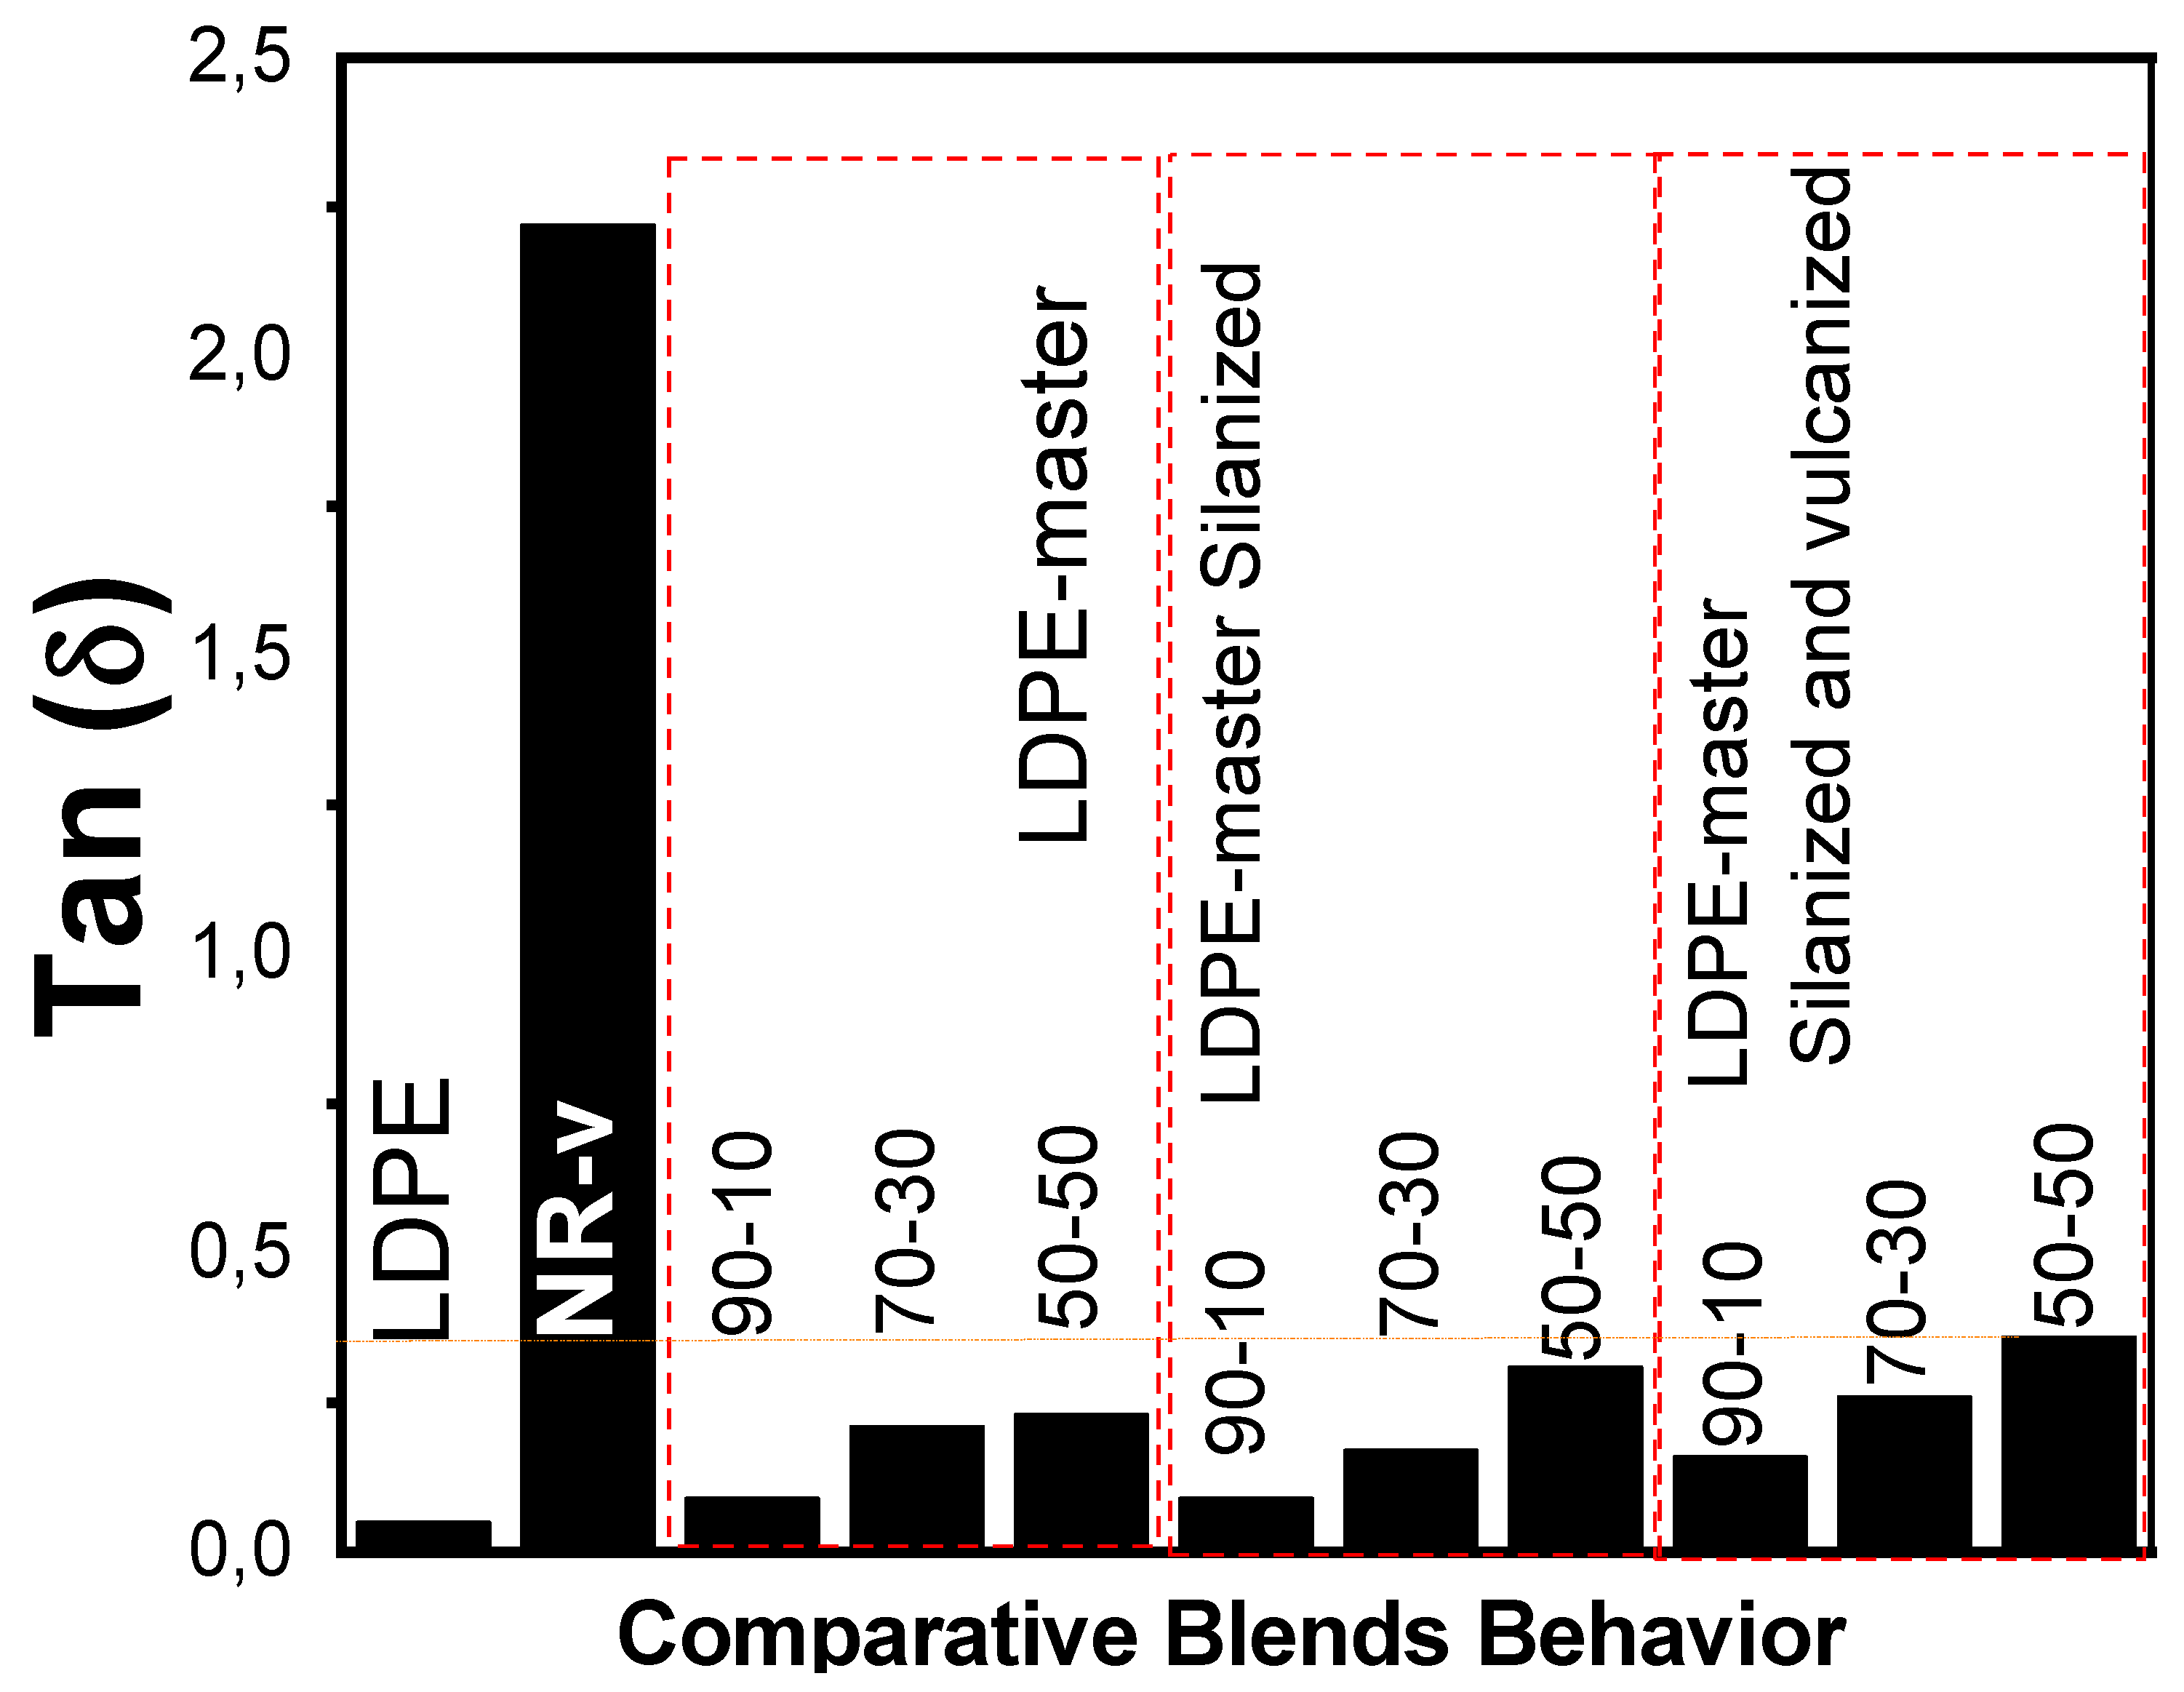

Table 1.
Composite formulation (phr).
| Material | phr |
|---|---|
| NR | 100.0 |
| Silanized SCBA treated with TESPT | 25 |
| ZnO | 3 |
| Stearic acid | 2 |
| *CBS | 1 |
| **TMTD | 2 |
*N-ciclohexil-2-benzotiazole-2-sulfenamide; **Tetramethylthiuram disulfide.
Table 2.
Haake Rheology Behavior.
| Sample | Rheometer speed (rpm) | Composition (%) | Torque LDPE(Nm) | Torque NR/Masterbatch (Nm) | Final torque (Nm) | Time to torque stabilization (Minutes) |
|---|---|---|---|---|---|---|
| Measurement time (min) | 1 | 2.5 | 5 | |||
| Pure LDPE/NR with curing agents | 40 | 90/10 | 15.2 | 13.4 | 8.4 | 3.4 |
| 70/30 | 9.5 | 13.4 | 7.4 | 3.4 | ||
| 50/50 | 5.2 | 11.5 | 4.4 | 2.9 | ||
| LDPE/masterbatch withcuring agents | 40 | 90/10 | 14.4 | 10.8 | 10.2 | 2.6 |
| 70/30 | 12.9 | 14.4 | 10.2 | 3.1 | ||
| 50/50 | 3.5 | 10.9 | 7.3 | 3.5 | ||
| NR | 40 | -------- | 14.7 | ------------ | 6.1 | 1.0 |
| LDPE | --------- | 21.6 | ------------ | 8.81 | 1.6 | |
| LDPE/masterbatch blend with no curing agents | 90/10 | 10.2 | 8.8 | 12.8 | 3.7 | |
| 70/30 | 9.2 | 8.7 | 9.4 | 1.9 | ||
| 50/50 | 8.5 | 8.6 | 9.4 | 1.3 | ||
| LDPE/masterbatchblendwith curing agents | 80 | 90/10 | 17.5 | 14.8 | 11.2 | 3.5 |
| 70/30 | 11.2 | 13.8 | 10.2 | 4.8 | ||
| 50/50 | 7.5 | 13.2 | 7.5 | 4.5 |
Table 3.
Stress–Strain Behavior.
| Mixing speed (rpm) | Sample |
Composition (% mass) |
Stress (MPa) | Strain (%) |
|---|---|---|---|---|
| 40 | LDPE | 100 | 6.40 | 75 |
| LDPE/NR-v | 50/50 | 6.06 | 170 | |
| LDPE/NR-v | 70/30 | 5.30 | 13 | |
| LDPE/NR-v | 90/10 | 9.37 | 26 | |
| LDPE/masterbatch-v | 50/50 | 4.57 | 283 | |
| LDPE/masterbatch-v | 70/30 | 3.31 | 110 | |
| LDPE/masterbatch-v | 90/10 | 3.32 | 6,7 | |
| 80 | LDPE | 100 | 6.42 | 71.5 |
| LDPE/masterbatch | 50/50 | 5.85 | 326 | |
| LDPE/masterbatch | 70/30 | 3.74 | 55 | |
| LDPE/masterbatch-v | 50/50 | 4.40 | 21 |
*v= Blended with vulcanizing agents.
Table 4.
Hardness comparison of the blends.
| Haake rheometer (rpm) | Sample |
% |
1 | 2 | 3 | 4 |
5 |
Mean (± SD) |
|---|---|---|---|---|---|---|---|---|
| 40 | NR | 100 | 36 | 34 | 32 | 38 | 32 | 34.4 (±1.5) |
| LDPE | 100 | 88 | 92 | 90 | 90 | 92 | 90.4 (±0.5) | |
| LDPE/NR | 70/30 | 92 | 90 | 88 | 92 | 92 | 90.8 (±0.3) | |
| LDPE/masterbatch-v | 50/50 | 76 | 76 |
74 |
76 | 80 | 76.4(±1.2) | |
| LDPE/masterbatch-v | 70/30 | 94 | 86 | 90 | 92 | 90 | 90.4 (±0.9) | |
| LDPE/masterbatch-v | 90/10 | 94 | 88 | 94 | 90 | 94 | 92.0 (±0.7) | |
|
80 |
LDPE/masterbatch-v | 90/10 | 94 | 90 | 80 | 94 | 92 | 90 (±1.1) |
| LDPE/masterbatch-v | 70/30 | 88 | 92 | 94 | 94 | 94 | 92.4 (±0.8) | |
| LDPE/masterbatch-v | 50/50 | 80 | 80 | 80 | 74 | 74 | 77.6(±0.3) |
*v= Blended with vulcanizing agents.
Disclaimer/Publisher’s Note: The statements, opinions and data contained in all publications are solely those of the individual author(s) and contributor(s) and not of MDPI and/or the editor(s). MDPI and/or the editor(s) disclaim responsibility for any injury to people or property resulting from any ideas, methods, instructions or products referred to in the content. |
© 2025 by the authors. Licensee MDPI, Basel, Switzerland. This article is an open access article distributed under the terms and conditions of the Creative Commons Attribution (CC BY) license (https://creativecommons.org/licenses/by/4.0/).
Copyright: This open access article is published under a Creative Commons CC BY 4.0 license, which permit the free download, distribution, and reuse, provided that the author and preprint are cited in any reuse.


