
Submitted:
27 June 2025
Posted:
01 July 2025
You are already at the latest version
Abstract
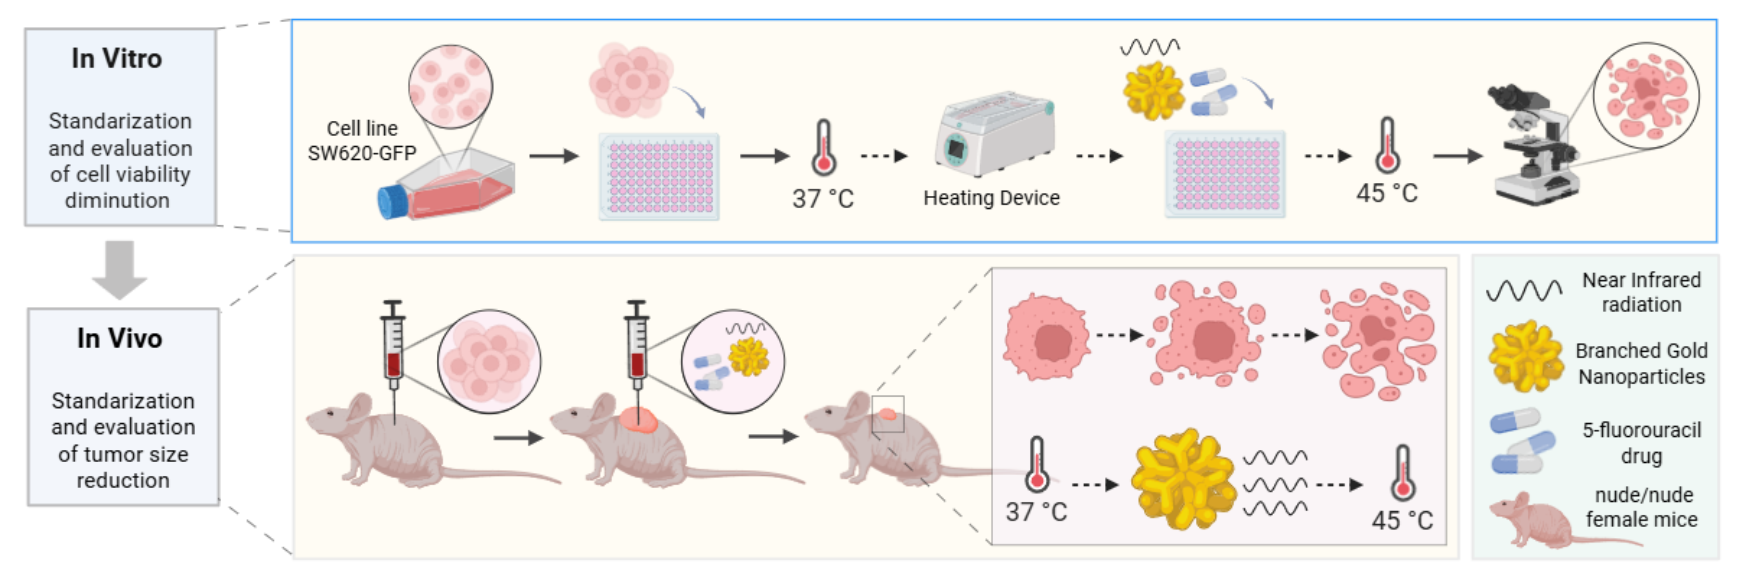
This study evaluated the antitumor efficacy of combined chemo photothermal therapy with 5-fluorouracil (5-FU) and branched gold nanoshells (BGNSs) in a colorectal cancer model. BGNSs were synthesized via a seed-mediated method and characterized via electron microscopy and UV‒vis spectroscopy, revealing an average diameter of 126.3 nm and a plasmon resonance peak at 800 nm, which are suitable for near-infrared (NIR) photothermal applications. In vitro assays using SW620-GFP colon cancer cells demonstrated a ≥90% reduction in cell viability after 24 hours of combined treatment with 5-FU and BGNS under NIR irradiation. In vivo, xenograft-bearing nude mice received weekly intratumoral administrations of the combined therapy for four weeks. The tumor volume was significantly lower in the combination group than in the control and mono-therapy groups, with nearly complete tumor regression observed. Thermographic imaging con-firmed that localized hyperthermia reached 45°C at the tumor site. These findings suggest a strong synergistic effect between 5-FU- and BGNS-mediated hyperthermia, suggesting a promising strategy for enhancing therapeutic outcomes in patients with colorectal cancer while potentially minimizing systemic toxicity. This study highlights the potential of integrating nanotechnology and conventional chemotherapy for more effective and targeted cancer treatment.
Keywords:
Hyperthermia
; Gold Nanoparticles
; Xenograft Model Antitumor Assays
1. Introduction
Cancer remains one of the leading causes of mortality and morbidity worldwide [1]. The heterogeneity of the disease and the frequently observed resistance to currently available treatments highlight the importance of developing new therapies with enhanced efficacy and fewer side effects [2], [3]. In this context, the application of nanomaterials for the treatment and diagnosis of cancer has emerged as a promising alternative [4]. The biomedical use of nanomaterials relies on their capacity to function as carriers of bioactive agents, as well as their ability to act as therapeutic and diagnostic devices.
Gold nanoparticles, particularly gold nanoshells, have been extensively studied as theragnostic elements because of their remarkable optical properties and biocompatibility [5]. Upon irradiation with light, gold nanoshells can convert incident photonic energy into heat, increasing the local temperature of the surrounding medium and inducing damage to malignant tumors. This effect, known as plasmonic photothermal therapy (PTT), has been employed in preclinical studies to achieve highly localized therapy in a spatiotemporally controlled manner [6].
Gold nanoshells are anisotropic structures consisting of a dielectric core surrounded by a thin layer of gold. The precise control of their external radius and shell thickness allows fine-tuning of their localized surface plasmon resonance (LSPR), thereby maximizing light-to-heat conversion at specific wavelengths [7]. Moreover, positioning the plasmon peak wavelength within the near-infrared (NIR) region of the electromagnetic spectrum is particularly desirable, as biological tissues exhibit their lowest extinction coefficients in this spectral range, enabling deeper light penetration [8].
On the other hand, synergy between chemotherapy and hyperthermia has been observed in both preclinical and clinical studies. This approach is based on the ability of elevated temperatures to increase drug penetration, increase cellular uptake, and potentiate the cytotoxic effects of chemotherapeutic agents [9]. Hyperthermia has been shown to induce changes in the tumor vasculature, improving drug delivery while also promoting apoptosis and inhibiting DNA repair mechanisms, thereby sensitizing cancer cells to chemotherapy [10]. Specifically, the combination of 5-fluorouracil (5-FU) and hyperthermic therapy has been evaluated in gastric cancer cells and demonstrated improved induction of apoptosis [11]. In addition, hyperthermic intraperitoneal chemotherapy with a combination of mitomycin, 5-FU and oxaliplatin markedly inhibited the growth of colorectal cancer cells under hyperthermic conditions in vitro and appeared to be safe and feasible for patients at high risk of colorectal peritoneal metastasis [12]. However, the simultaneous application of chemotherapeutic drugs with plasmonic photothermal therapy (PTT) remains largely unexplored. Given the precise and localized heating capabilities of gold nanoshells, their integration with chemotherapeutic agents could provide a promising strategy to enhance treatment efficacy while minimizing systemic toxicity.
In this work, we synthesized branched gold nanoshells (BGNSs) via a seed-mediated growth method. The nanoshells showed an LSPR peak located at 800 nm, making them highly photoresponsive to laser stimulation and providing them with optimal hyperthermic therapeutic properties. The BGNSs were characterized, and their cytotoxicity against a fluorescent colon cancer cell line was determined. Furthermore, the antitumor effect of BGNSs intratumorally coadministered with 5-FU was evaluated in a xenograft colon cancer murine model. The results revealed enhanced tumor growth inhibition in the combined chemotherapy group than in the individual treatment groups. These findings suggest that combination therapy may be a promising strategy to improve treatment outcomes for this type of cancer.
2. Materials and methods
2.1. Synthesis of BGNSs
The BGNS synthesis methodology is based on the methods of Topete et al. (2014) [13]. The first step involves the preparation of a mixture of chitosan-modified PLGA nanoparticles and gold seeds, and the products of the mixture are PLGA-gold seed precursors. The second step includes the formation of the shell and its pegylation: PLGA-gold seed precursors are mixed with an Au+1 growth solution; later, these precursors are combined with PEG, and the resulting product is BGNSs.
2.2. Physical and chemical characterization of the BGNSs
The hydrodynamic size and zeta potential of the BGNSs were characterized via dynamic light scattering with a Zetasizer ZS90 analyzer from Malvern Panalytical: 100 µL of BGNSs put into polystyrene cells was measured at a 90° angle for 10 series of 60 seconds in triplicate. BGNS size and morphology were analyzed by scanning transmission electron microscopy (STEM) with an FE-SEM JSM-7800F (JEOL, Japan) microscope equipped with a STEM detector at 30 kV (Deben, UK Ltd.) and via transmission electron microscopy (TEM) with a Phillips CM-12 microscope at 120 kV. Optic extinction was measured with a UV‒vis V-730 (Jasco, Japan) spectrophotometer.
2.3. Cell culture
The cell line used in this work was the SW620-GFP colon cancer cell line (AntiCancer Inc., USA). It was first isolated from the large intestine of a 51-year-old white male patient with Dukes C (stage III) colorectal cancer. The cells were maintained in RPMI 1640 medium supplemented with 10% fetal bovine serum (FBS) and 1% penicillin‒streptomycin. The culture conditions were 37°C in an atmosphere of 5% CO2 and 95% relative humidity (RH).
2.4. In vitro cytotoxicity assays of chemotherapy
5-FU with the commercial name "Carebin" was used at a concentration of 250 mg/10 ml in solution from the pharmaceutical company PiSA (batch L175039) and was stored at room temperature in the dark. A 1 mM stock solution of 5-FU was prepared in RPMI-1640 medium, which was then used to create different concentrations.
To determine the cytotoxic effect of 5-FU, an MTT cell viability assay was performed in 96-well plates. A total of 2x10⁴ cells were seeded well and incubated overnight. After monolayer formation, the cells were treated with different concentrations of 5-FU: 12.5, 25, 50, 100, 150, 200, 250, 300, 350, and 400 μM. Cell viability was measured after 24 hours of exposure to the chemotherapeutic agent. Next, the RPMI-1640 medium was removed, and the cells were washed with PBS. Then, 100 μl of RPMI-1640 and 10 μl of 5 mg/ml MTT solution (Sigma‒Aldrich, St. Louis, MO, USA) were added, and the cells were incubated for 3 hours at 37°C. After the MTT solution was removed, the remaining crystals in the wells were solubilized. The absorbance was determined at a wavelength of 570 nm. To determine the concentration of 5-FU necessary to achieve 50% cytotoxic activity, the half-maximal inhibitory concentration (IC50) was measured. Each experiment was repeated at least three times in triplicate.
2.5. In vitro assays of hyperthermia
To evaluate hyperthermia, it was necessary to verify that the BGNS increased the temperature when irradiated. For this purpose, an initial 1:1 dilution was prepared by mixing 100 μl of BGNS with 100 μl of RPMI-1640 medium and a control of 200 μl of deionized water in 48-well plates. These solutions were irradiated for five minutes at 2 watts (W) and 800 nm, after which the temperature was subsequently measured.
After verifying that the BGNSs fulfilled their function, different dilutions and incubation times were tested. For this purpose, 8x10⁴ cells per well were seeded in 48-well plates, which were incubated for 24 hours. After the formation of the monolayer, different dilutions of BGNSs were added (1:5 – (1.46x10¹⁵ NPs/mL), 1:10 – (7.30x10¹⁴ NPs/mL), and 1:20 – (3.65x10¹⁴ NPs/mL)). The cells were subsequently incubated for a) twenty-four and b) three hours before being irradiated at 2 W and 800 nm for six minutes. Finally, the MTT assay was performed to evaluate cell viability.
After the optimal incubation time was determined, the amount of BGNS used in the treatment was standardized. In the previous experiment, 1:5, 1:10, and 1:20 dilutions were used, and it was observed that dilutions higher than 1:10 might not yield the expected results. Therefore, in this experiment, only dilutions between 1:5 (1.46x10¹⁵ NPs/mL) and 1:10 (7.30x10¹⁴ NPs/mL) were used. Once again, 8x10⁴ cells per well were placed in 48-well plates and allowed to grow until monolayer formation, and the corresponding dilutions were added. The cells were incubated for an additional 3 h, followed by irradiation at 2 W and 800 nm for six minutes before the MTT assay was performed. For both experiments, the initial and final temperatures (before irradiation and after irradiation, to verify that the initial and final temperatures reached 43°C) were measured.
2.6. Chemophotothermal in vitro assays
In a 48-well plate, 8x10⁵ cells per well were seeded and incubated until monolayer formation. Negative and positive controls were added, as were individual controls for 5-FU, BGNS, and irradiation. Additionally, controls for irradiated BGNS and the full treatment were included, which consisted of a 1:10 dilution (7.30x10¹⁴ NPs/mL) of BGNS incubated for 3 h, followed by irradiation at 2 W, 800 nm for ten minutes, and 75.94 μM 5-FU. The treatment mixture was incubated for 24 and 48 h before the MTT assay was performed.
2.7. Chemophotothermal in vivo assays
Immunodeficient nude murine models of the Nu/Nu strain, 8-week-old females, were obtained from Bioterio Morelos and kept at the Research vivarium the Center for Research and Assistance in Technology and Design of the State of Jalisco (CIATEJ). The experiments were conducted in accordance with the guidelines set by the Guide for the Care and Use of Laboratory Animals and the rules established by the CICUAL of CIATEJ under the approved project number (2023-008A).
The SW620-GFP cells inoculated into the murine models were cultured in RPMI-1640 medium. Upon reaching approximately 85–90% confluence, trypsinization was performed (a technique commonly used to dissociate adherent cells from culture flasks). After dissociation, the cells were mixed with Matrigel (Sigma–Aldrich) at a 50:50 ratio, resulting in a total volume of approximately 120 μl in a microtube. This mixture was collected via a 1 ml insulin syringe with a 29G gauge needle that was 13 mm long. Once the inoculum was prepared, the model mice were anesthetized, and the cells were administered subcutaneously once on each flank. The experiment began by inoculating 5x10⁶ cells per inoculation, and the appearance and development of the tumors were monitored daily. After one week, the tumors grew enough to begin treatment (approximately 2 mm3). The tumor growth was not uniform.
The mice (n=10) were divided into five groups with four tumors per group: the control group, 5-FU group, NIR group, BGNS + NIR group, and 5-FU + BGNS + NIR group. Treatments were administered once a week for more than four weeks. The conditions established in the in vitro assays were applied to the in vivo NIR groups at 2 W at 800 nm for ten minutes. According to the literature, the administration of 10–125 mg/kg 5-FU is considered the optimal amount for treatment. Using this as a reference, calculations were made on the basis of the concentration of 5-FU used (250 mg/10 ml) and the mean weight of the murine models (22 g), yielding an approximate result of 107 μl (2.6 mg) of the chemotherapeutic agent mixed with PBS.
After the treatments were applied, the murine models were monitored via a small animal imaging system, the 'UVP iBox Explorer2 from Analytik-Jena, which allows noninvasive detection of fluorescent and bioluminescent indicators, enabling tumor development to be observed. Tumors were measured with a caliper, while the murine models were weighed with a scale before being examined via UVP iBox equipment. Observations with the UVP iBox were performed every four days, where before being placed in the equipment, the models were measured, weighed, and received the corresponding treatment. The tumor volume was calculated via the following equation: V = 0.5 × L × W² [14], where V is the tumor volume, L is the length of the tumor, and W is the weight of the tumor. Before the tumors exceeded 1.5 cm, the model mice were sacrificed, and the tumors were extracted [15].
3. Results
3.1. Characterization of BGNSs
PLGA NPs, used as cores for the subsequent growth of BGNS, were synthesized using a nanoprecipitation method. The resulting NPs had a hydrodynamic diameter of 126.3 ± 7.0 nm and a Z-potential of −12.1 ± 1.7 mV, which was provided by the carboxylic groups of the biodegradable copolymer's glycolic and lactic acid repeating units. Subsequently, the surface charge of the PLGA NPs was shifted towards a positive value (+18.5 ± 1.2 mV) after the adsorption of cationic oligochitosan. The coating with the oligosaccharide also led to a hydrodynamic size increase. This surface charge inversion enabled the electrostatic adsorption of 5 nm citrate-stabilized gold seeds, which served as nucleation sites for the subsequent growth of the anisotropic gold layer. To achieve this, PLGA-seed precursors were mixed with a K-gold solution and ascorbic acid, which acted as a reducing agent. The sequence of synthetic steps is schematized in Figure 1a. Finally, BGNS were surface-coated with PEG to increase the colloidal stability of the gold nanostructures. The analysis of the size of PEGylated BGNS revealed an average hydrodynamic diameter of 194.5 nm, as shown in Table 1 and Figure 1b.
The optical extinction of the BGNS, obtained using a UV-vis spectrophotometer V-730, showed a pronounced LSPR peak centered at ~800 nm, indicating strong absorption in the NIR region, suitable for in vivo photothermal applications (Figure 1c).
The morphology of bare PLGA NPs was spherical as observed in TEM images (Figure 2a). The surface coating of the polymeric cores with the polycationic oligochitosan and the adsorption the negatively charged citrate-stabilized gold seeds was visualized by TEM (Figure 2b). Morphological analysis of the BGNS by STEM revealed an anisotropic topography with distinctive branches and protrusions (Figure 2c).
The optical extinction results of the BGNSs obtained via a V-730 UV‒vis spectrophotometer showed a maximum surface plasmon resonance centered at approximately 800 nm (Figure 2).
3.2. In vitro cytotoxicity of chemotherapy and hyperthermia
The cytotoxicity assay using 5-FU in SW620-GFP colon cancer cells demonstrated a dose- and time-dependent reduction in cell viability. At 30 µM, cell viability was reduced to 72.28% after 24 hours and 40.36% after 48 hours. At 50 µM, the viability decreased to 64.36% (24 h) and 32.20% (48 h), whereas at 70 µM, the reduction was more pronounced, reaching 46.81% at 24 h and 26.80% at 48 h (Figure 3). These results confirm the cytotoxic potential of 5-FU and support the selection of 70 µM as an effective concentration for subsequent combination therapy assays.
To evaluate the photothermal effect of BGNS, SW620-GFP colon cancer cells were incubated with different BGNS dilutions (1:5, 1:10, and 1:20) and subsequently irradiated with near-infrared (NIR) light at 800 nm and 2 W for six minutes. Cell viability was assessed via the MTT assay. The results clearly revealed an inverse relationship between the BGNS concentration and cell viability: the 1:5 dilution resulted in the highest cytotoxicity (11.88% viability), followed by the 1:10 (43.37%) and 1:20 (67.93%) dilutions (Figure 4ab). On the basis of these findings, the 1:10 dilution (corresponding to 3.33 µg AuNPs/mL) was selected as the optimal concentration for subsequent in vitro combination therapy experiments.
To evaluate the efficacy of combined chemo-photothermal therapy, SW620-GFP colon cancer cells were exposed to various treatment conditions, including negative control (untreated cells), positive control (0.1 N hydrochloric acid in isopropanol), 5-FU alone at 70 µM, near-infrared (NIR) irradiation alone, BGNS with NIR, and the full combination of 5-FU + BGNS + NIR. The MTT assay revealed that the negative control maintained high cell viability, while the positive control induced complete cytotoxicity. Treatment with 5-FU alone reduced viability to 26.80% after 48 hours. NIR irradiation alone had minimal effect, whereas BGNS + NIR reduced viability to 43.37%. Notably, the combined treatment of 5-FU + BGNS + NIR resulted in a dramatic reduction in cell viability to 1.41%, demonstrating a strong synergistic effect between chemotherapy and photothermal therapy, Figure 5.
3.3. In vivo chemophotothermal treatment
3.3.1. Standardization
To determine the optimal conditions for in vivo chemo-photothermal therapy, preliminary standardization experiments were conducted using SW620-GFP xenograft-bearing mice. Initial tests began with the administration of 30 µL of 5-FU; however, no observable changes in tumor size were detected after four days. Consequently, the dose was increased fivefold and subsequently tenfold, yet the tumor response remained minimal. These findings highlight the need to optimize both the drug concentration and the nanoparticle dosage.
In parallel, BGNSs were tested at various concentrations to evaluate their photothermal efficacy in vivo. The first trial used 15 µL of BGNS, which was progressively increased by factors of 5, 10, 50, and 100. These adjustments were made to determine the minimum effective dose capable of inducing a measurable hyperthermic response under NIR irradiation. The results confirmed that an insufficient nanoparticle concentration failed to generate the desired thermal effect, reinforcing the importance of dose optimization.
To assess the spatial and therapeutic effects of different treatment combinations, each mouse was inoculated with three or four tumors in distinct anatomical locations. The treatments were as follows: (1) 5-FU alone, (2) BGNS + NIR, (3) 5-FU + BGNS + NIR, and (4) the untreated control. For the third mouse, the position of each treatment was rotated to minimize anatomical bias. The SW620-GFP cell line was selected for its fluorescent properties, which enabled noninvasive tumor monitoring via the UVP iBox imaging system, as previously validated in the literature [16].
Each treatment was administered intratumorally, beginning with BGNS, followed by 5-FU, and concluded with NIR irradiation (800 nm, 2 W, 10 minutes). This sequence was designed to ensure optimal nanoparticle distribution and thermal activation. The standardization phase confirmed that both the concentration and order of administration are critical for achieving reproducible and effective tumor reduction in vivo.
3.3.2. Control group
The control group was inoculated, and tumor growth was monitored over a period of four weeks. The mice in this group were handled and anesthetized every seven days, and their weight and tumor size were recorded. No therapeutic intervention was applied. Tumor growth was not uniform across individuals. The mice were euthanized before the tumors reached a size of 1.5 cm (Figure 6). The average tumor volume increased progressively: on day 7 (4.8 mm³), day 14 (39.33 mm³), day 21 (314 mm³), and day 28 (1010 mm³). Using the day 7 measurement as a reference point, the tumor size on day 28 represented an approximately 210-fold increase.
3.3.3. Treatment group: 5-FU
A dose of 25 mg/kg 5-FU (Carebin, PiSA) was administered intratumorally every seven days up to 30 days of follow-up, according to the methodology reported by Sang et al., 2020. For this purpose, equipment was used to evaporate the vehicle liquid of the drug by centrifugation, and upon obtaining the salt in pellet form, it was dissolved in 150 µl of RPMI medium. Compared with that in the control group, tumor mass growth was constant but not uncontrolled (Figure 7). The average tumor size increased over the following days: day 7 (4.75 mm³), day 14 (48 mm³), day 21 (78.25 mm³), and day 28 (142.5 mm³). Taking the measurement on day 7 as the baseline since it was the first recorded, we can infer that the growth on day 28 was 30 times greater.
3.3.4. Treatment group: NIR
Treatment was administered every seven days up to 30 days of follow-up. The mice were anesthetized and subjected to NIR at an 800 nm wavelength at 2 W for a period of 10 minutes at a distance of 1 cm between the laser and the tumor (Figure 8). No significant temperature increase was recorded in the irradiated area, as the presence of BGNS is necessary to increase the temperature to 45°C. However, the growth was not as accelerated as that in the control group. The average tumor size increased over the following days: day 7 (15.75 mm³), day 14 (100.5 mm³), day 21 (180.5 mm³), and day 28 (472 mm³). Taking the measurement on day 7 as the baseline since it was the first recorded, we can infer that the growth on day 28 was 29.96 times greater.
3.3.5. Treatment group: NIR+BGNS
Treatment was administered every seven days up to 30 days of follow-up. The hyperthermia groups were administered 7.30x10¹⁴ BGNS/ml with NIR at 800 nm at 2 W for a period of 10 minutes at a distance of 1 cm between the laser and the tumor until the temperature increased to 45°C (Figure 9). A thermographic camera was used for real-time photographic documentation of the temperature increase. Additionally, the weight of each mouse was monitored via an analytical balance, and the change in tumor size was measured with a Vernier caliper (Figure 10). The average tumor size increased over the following days: day 7 (7.5 mm³), day 14 (0.72 mm³), day 21 (99.17 mm³), and day 28 (303 mm³). Taking the measurement on day 7 as the baseline since it was the first recorded, we can infer that the growth on day 28 was 40.4 times greater.
3.3.6. Treatment group: 5-FU+NIR+BGNS
Treatment was administered every seven days up to 30 days of follow-up. This hyperthermia plus chemotherapy group was administered a solution containing 7.30x10¹⁴ BGNS/ml and 25 mg/kg 5-FU (Carebin, PiSA) in 150 µl of RPMI medium intratumorally, with NIR application at 800 nm at 2 W for a period of 10 minutes at a distance of 1 cm between the laser and the tumor until the temperature increased to 45°C (Figure 11). A thermographic camera was used for real-time photographic documentation of the temperature increase. Additionally, the weight of each mouse was monitored via an analytical balance, and the change in tumor size was measured with a Vernier caliper (Figure 12). The average tumor size increased over the following days: day 7 (7.8 mm³), day 14 (1.125 mm³), day 21 (0.8 mm³), and day 28 (0.4 mm³). Taking the measurement on day 7 as the baseline since it was the first recorded, we can infer that the growth on day 28 was 19.5 times lower.
3.3.6. Comparison of the treatment and control groups
The averages of the measurements shown in the previous graphs for each group were compared in a time graph where the changes in tumor sizes of each group can be observed on days 7, 14, 21 and 28 of the in vivo experimental model. The control group showed uncontrolled tumor growth, reaching a maximum size of 1010 mm³; the NIR group had the next largest tumor size value of 472 mm³; the NIR + BGNS group showed a reduction in size after treatment; however, the tumors grew again, reaching a tumor size of 303 mm³; the 5-FU chemotherapeutic group had constant but measured growth, maintaining its size at 142.5 mm³; the complete treatment group with 5-FU + NIR + BGNS showed a significant reduction in tumor size through the administration of the treatment, with the lowest size value among all the groups of 0.4 mm³ (Figure 13 and Figure 14).
4. Discussion
The development of novel therapeutic strategies for colon cancer is of paramount importance, and this study explores a promising combination of chemotherapy and hyperthermia mediated by branched gold nanoparticles. The characterization of the BGNSs demonstrated crucial physicochemical properties for their biomedical application. The increase in hydrodynamic diameter and inversion of the zeta potential upon chitosan functionalization are consistent with previous studies highlighting the ability of this polysaccharide to increase the colloidal stability and biocompatibility of nanoparticles, which are essential factors for their in vivo administration and interaction with biological systems [18]. A distinctive aspect of this work lies in the synthesis of the BGNS, an original technology developed by our research team, stemming from the inventiveness of this group of investigators. The anisotropic morphology observed in the BGNS could confer additional advantages in cell‒nanoparticle interactions, potentially facilitating internalization and the release of therapeutic cargo more efficiently in tumor cells, as suggested by research with other nonspherical nanoparticles. The surface plasmon resonance peak in the near-infrared (NIR) region, centered at approximately 800 nm, is particularly relevant for photothermal therapy, as this spectral window allows for greater light penetration through biological tissues, minimizing absorption by endogenous components such as hemoglobin and water and thereby optimizing localized heat generation in the tumor.
In vitro cytotoxicity assays revealed the effectiveness of cisplatin and 5-FU in reducing the viability of SW620-GFP cells, with a correlation between dose and exposure time, which aligns with their known mechanism of action as chemotherapeutic agents. Notably, the combination of both drugs exhibited a synergistic effect, underscoring the potential of polytherapy strategies to overcome drug resistance and improve treatment efficacy in colon cancer [17]. The ability of the BGNSs to induce cytotoxicity upon irradiation with NIR light, as well as their basal cytotoxic effect independent of light, suggests a dual therapeutic mechanism of action. The localized hyperthermia generated by the BGNSs upon irradiation can irreversibly damage tumor cells, while the presence of the nanoparticles per se could interfere with essential cellular processes. The synergy observed when combining BGNS-mediated hyperthermia with chemotherapy (specifically 5-FU in the in vivo model) could be attributed to an increase in drug internalization by heat-sensitized cells or the inhibition of cellular repair mechanisms induced by thermal damage.
The results obtained in the in vivo murine model demonstrated the superiority of the combined treatment of 5-FU- and BGNS-mediated hyperthermia with NIR irradiation in reducing subcutaneous tumor growth over individual treatments. This observation is consistent with the growing evidence in the literature supporting the combination of photothermal therapy with chemotherapeutic agents to achieve greater antitumor efficacy [19]. Hyperthermia can increase vascular permeability in tumors, facilitating the delivery of chemotherapeutic drugs to cancer cells, and can also inhibit drug resistance mechanisms. The selectivity of nanoparticle-mediated hyperthermia, which involves primarily targeting irradiated tumor tissue, has the potential to minimize the systemic side effects associated with traditional chemotherapy. The creation and application of original technologies, both in the synthesis of nanoparticles by our team underscores the capacity for scientific and technological innovation generated by Mexican researchers in the field of oncological nanomedicine.
Although the results are encouraging, it is essential to recognize the limitations of this study. The murine xenograft model, while widely used in preclinical cancer research, does not fully recapitulate the complexity of the human tumor microenvironment, particularly with respect to immune system interactions and intratumoral heterogeneity. Consequently, the translation of these findings to clinical settings will require validation in more sophisticated preclinical models and, ultimately, in human clinical trials. Future studies should aim to uncover the molecular mechanisms responsible for the observed synergy between chemotherapy and BGNS-mediated hyperthermia. Additionally, optimizing nanoparticle delivery and irradiation parameters is critical for enhancing therapeutic efficacy while minimizing potential side effects. Investigating the integration of this therapeutic approach with other treatment modalities may also offer a promising avenue for improving outcomes in colon cancer therapy.
5. Conclusions
The median lethal doses of the chemotherapeutic agents cisplatin and 5-fluorouracil were determined in the SW620-GFP cell line. Furthermore, the optimal conditions for temperature, exposure time, and concentration of branched gold nanoparticles for hyperthermia treatment were defined in an in vitro model of colon cancer. The successful establishment of an in vivo murine model of subcutaneous colon cancer xenografts allowed for the evaluation of the posttreatment therapeutic effect of chemotherapy and hyperthermia, which revealed a significant reduction in tumor mass size when the tumors were treated with the chemotherapeutic 5-fluorouracil and branched gold nanoparticles irradiated with near-infrared light. This finding suggests the promising synergistic potential of this combined therapy, where hyperthermia mediated by branched gold nanoparticles could enhance the efficacy of 5-fluorouracil in reducing the tumor burden in an in vivo model. The determination of the in vitro median lethal doses and the optimization of hyperthermia conditions establish a foundation for future preclinical investigations.
The implications of these results are significant for the field of colon cancer treatment, opening avenues for adjuvant strategies that could improve therapeutic outcomes with a potential reduction in systemic side effects. While the murine model presents limitations, the findings warrant further research to elucidate the underlying mechanisms, evaluate long-term toxicity, and explore its feasibility as an innovative strategy against this disease. Future studies should focus on more complex models and investigate different administration regimens and therapeutic combinations to advance toward potential clinical translation.
Author Contributions
Conceptualization, Rodolfo Hernández-Gutiérrez; Funding acquisition, Rodolfo Hernández-Gutiérrez; Methodology, Sarah Ochoa-Hugo, Karla Valdivia-Aviña, Mario Cano-González and Antonio Topete-Camacho; Project administration, Rodolfo Hernández-Gutiérrez; Resources, Mario Cano-González and Antonio Topete-Camacho; Supervision, Yanet Karina Gutiérrez-Mercado, Alejandro Canales-Aguirre and Rodolfo Hernández-Gutiérrez; Writing – original draft, Sarah Ochoa-Hugo and Karla Valdivia-Aviña; Writing – review & editing, Verónica Chaparro-Huerta , Adriana Aguilar-Lemarroy, Luis Jave-Suárez and Andrea Molina-Pineda
Funding
This research was funded by CONACYTFORDECYT-PRONACES/568483/2020.
Institutional Review Board Statement
The animal study protocol was approved by the Comité Interno para el Cuidado y Uso de Animales de Laboratorio of Centro de Investigación y Asistencia en Tecnología y Diseno del Estado de Jalisco A.C., #2023-008A on 31 May 2023.
Data availability statement
The data supporting the findings of this study are not publicly available due to ethical and privacy restrictions but may be made available from the corresponding author upon reasonable request.
Acknowledgments
The authors wish to thank the Mexican institution CONACYT for providing scholarships for undergraduate and graduate students and for their financial support. Sarah Eliuth Ochoa-Hugo (891162), Karla Valdivia-Aviña (1169625) Andrea Molina-Pineda (813683).
Conflicts of interest
The authors declare that they have no conflicts of interest. The funders had no role in the design of the study; in the collection, analyses, or interpretation of data; in the writing of the manuscript; or in the decision to publish the results. Disclaimer/Publisher’s Note: The statements, opinions and data contained in all publications are solely those of the individual author(s) and contributor(s) and not of the MDPI and/or the editor(s). The MDPI and/or the editor(s) disclose responsibility for any injury to people or property resulting from any ideas, methods, instructions or products referred to in the content.
References
- F. Baidoun et al., “Colorectal Cancer Epidemiology: Recent Trends and Impact on Outcomes,” Curr Drug Targets, vol. 22, no. 9, pp. 998–1009, Nov. 2020. [CrossRef]
- A.E. Shin, F. G. Giancotti, and A. K. Rustgi, “Metastatic colorectal cancer: mechanisms and emerging therapeutics,” Trends Pharmacol Sci, vol. 44, no. 4, pp. 222–236, Apr. 2023. [CrossRef]
- L. H. Biller and D. Schrag, “Diagnosis and treatment of metastatic colorectal cancer: A review,” JAMA - Journal of the American Medical Association, vol. 325, no. 7, pp. 669–685, Feb. 2021. [CrossRef]
- S. Zhang, H. Zhang, P. Song, D. Wang, and Y. Wang, “Colorectal cancer therapy mediated by nanomedicines,” Chemical Communications, vol. 59, no. 30, pp. 4423–4435, Mar. 2023. [CrossRef]
- S. E. Ochoa-Hugo, Y. K. Gutiérrez-Mercado, A. A. Canales-Aguirre, and R. Hernández-Gutiérrez, “[Hyperthermia on colorectal cancer: gold nanoshells-mediated photothermal therapy],” Rev Med Inst Mex Seguro Soc, vol. 62, no. 4, pp. 1–8, Jul. 2024. [CrossRef]
- O.R. Farzam et al., “Nanoparticles for imaging-guided photothermal therapy of colorectal cancer,” Heliyon, vol. 9, no. 11, Nov. 2023. [CrossRef]
- H. Li, M. H. Chan, Y. C. Chang, and M. Hsiao, “Gold Nanoparticles as a Biosensor for Cancer Biomarker Determination,” Molecules, vol. 28, no. 1, Jan. 2023. [CrossRef]
- H. Kurokawa, A. Taninaka, T. Yoshitomi, H. Shigekawa, and H. Matsui, “Near-Infrared Light Irradiation of Porphyrin-Modified Gold Nanoparticles Promotes Cancer-Cell-Specific Cytotoxicity,” Molecules, vol. 27, no. 4, Feb. 2022. [CrossRef]
- I.Kaur et al., “Combination of Chemotherapy and Mild Hyperthermia Using Targeted Nanoparticles: A Potential Treatment Modality for Breast Cancer,” Pharmaceutics, vol. 15, no. 5, May 2023. [CrossRef]
- T. F. Tsai et al., “Hyperthermia reduces cancer cell invasion and combats chemoresistance and immune evasion in human bladder cancer,” Int J Oncol, vol. 65, no. 6, Dec. 2024. [CrossRef]
- T. Zhou et al., “Photothermally responsive theranostic nanocomposites for near-infrared light triggered drug release and enhanced synergism of photothermo-chemotherapy for gastric cancer,” Bioeng Transl Med, vol. 8, no. 1, Jan. 2023. [CrossRef]
- T. Shimizu et al., “Hyperthermic intraperitoneal chemotherapy using a combination of mitomycin C,5-fluorouracil, and oxaliplatin in patients at high risk of colorectal peritoneal metastasis: A Phase I clinical study,” European Journal of Surgical Oncology, vol. 40, no. 5, pp. 521–528, May 2014. [CrossRef]
- A. Topete et al., “Simple control of surface topography of gold nanoshells by a surfactant-less seeded-growth method,” ACS Appl Mater Interfaces, vol. 6, no. 14, pp. 11142–11157, Jul. 2014. [CrossRef]
- K. Ai et al., “Inhibition of Tumoral VISTA to Overcome TKI Resistance via Downregulation of the AKT/mTOR and JAK2/STAT5 Pathways in Chronic Myeloid Leukemia,” Biomol Ther (Seoul), vol. 32, no. 5, p. 582, Sep. 2024. [CrossRef]
- S. J. Yang, H. T. Huang, C. H. Huang, J. A. Pai, C. H. Wang, and M. J. Shieh, “The synergistic effect of chemo-photothermal therapies in SN-38-loaded gold-nanoshell-based colorectal cancer treatment,” Nanomedicine, vol. 17, no. 1, pp. 23–40, Jan. 2022. [CrossRef]
- S. Rosales et al., “The Fluorescent Cell Line SW620-GFP Is a Valuable Model to Monitor Magnetic Hyperthermia,” Bioengineering, vol. 11, no. 7, Jul. 2024. [CrossRef]
- Eng, T. Yoshino, E. Ruíz-García, N. Mostafa, C.G. Cann, B. O'Brian, A. Benny, R.O. Perez, C. Cremolini, Colorectal cancer, Lancet 2024, 404, 294-310.
- Yu S, Xu X, Feng J, Liu M, Hu K. Chitosan and chitosan coating nanoparticles for the treatment of brain disease. Int J Pharm. 2019 Apr 5;560:282-293. [CrossRef]
- M.S. Hossain, H. Karuniawati, A.A. Jairoun, Z. Urbi, J. Ooi, A. John, Y.C. Lim, K.M.K. Kibria, A.K.M. Mohiuddin, L.C. Ming, K.W. Goh, M.A. Hadi, Colorectal Cancer: A Review of Carcinogenesis, Global Epidemiology, Current Challenges, Risk Factors, Preventive and Treatment Strategies, Cancers (Basel) 2022, 14.
Figure 1.
Synthesis and physicochemical characterization of BGNS. (a) Schematics of the seeded-growth synthesis of BGNS. (b) Intensity averaged size distribution of PLGA, PLGA-oligochitosan, PLGA-seed NPs, and BGNS. (c) UV-vis absorption spectrum of BGNS with LSPR peak at ~800 nm.
Figure 1.
Synthesis and physicochemical characterization of BGNS. (a) Schematics of the seeded-growth synthesis of BGNS. (b) Intensity averaged size distribution of PLGA, PLGA-oligochitosan, PLGA-seed NPs, and BGNS. (c) UV-vis absorption spectrum of BGNS with LSPR peak at ~800 nm.
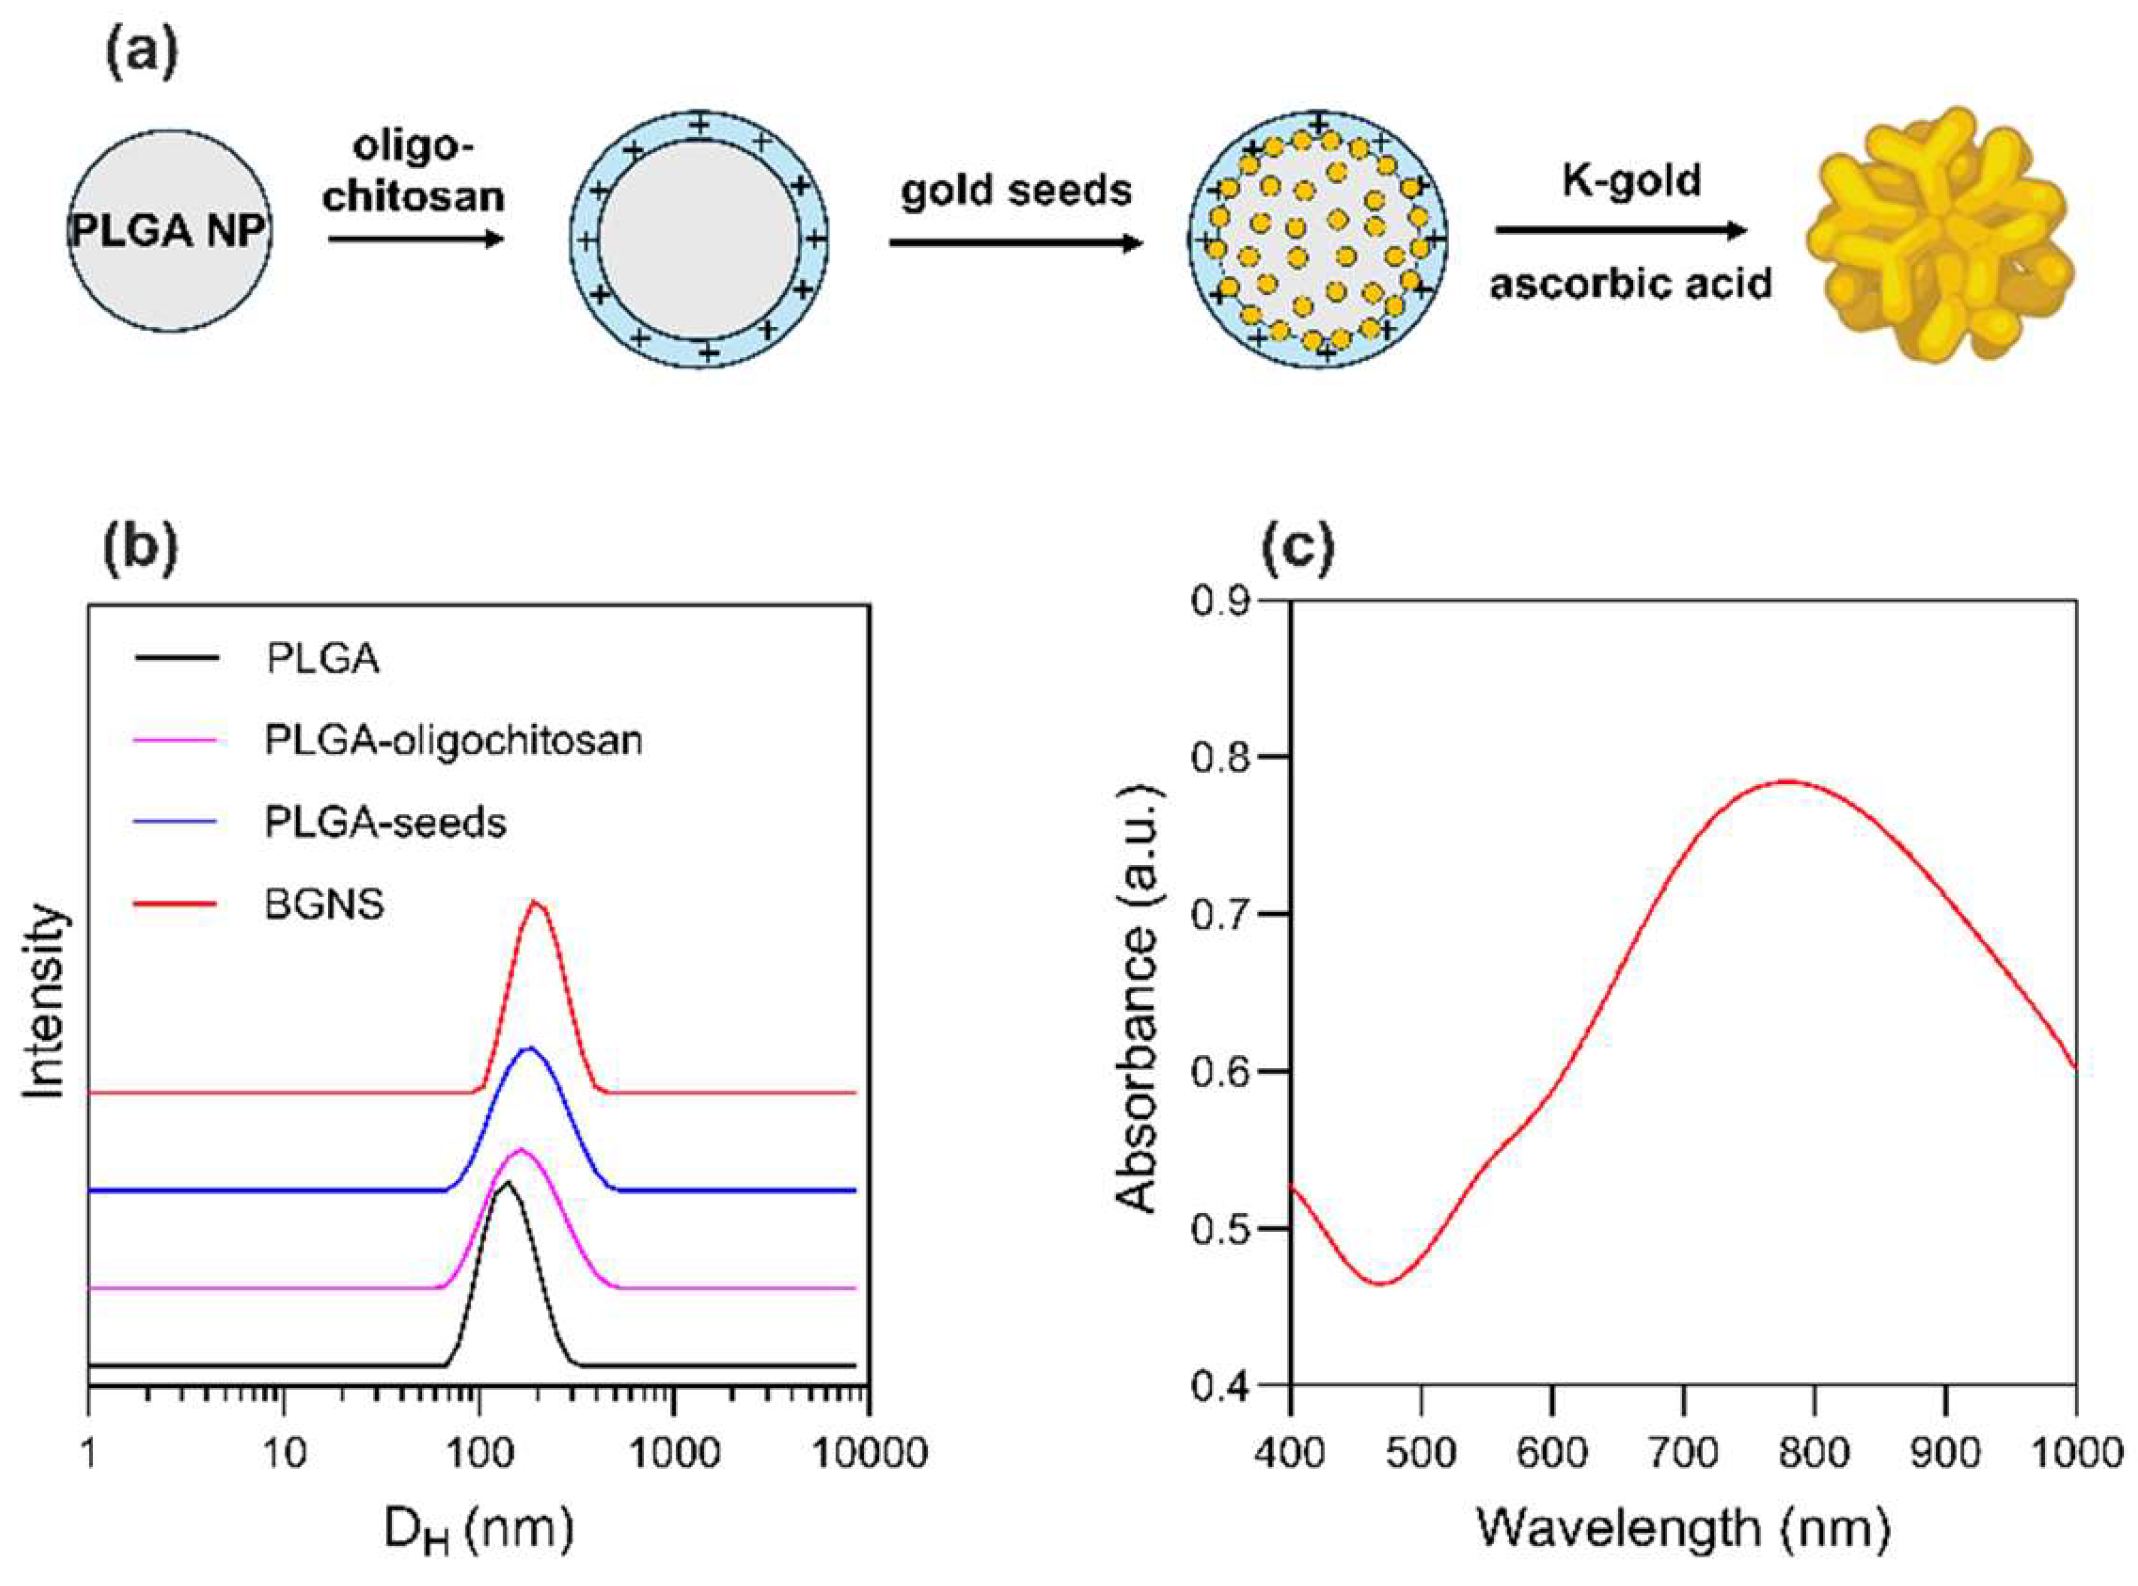
Figure 2.
Representative electron microscopy images illustrating the synthesis and morphological characterization of the BGNS. (a) TEM image of PLGA NPs displaying a quasi-spherical morphology. (b) TEM image of PLGA-seed precursors, showing the electrostatic adsorption of negatively charged gold seeds onto the positively charged surface of oligochitosan-modified PLGA NPs. (c) STEM image of BGNS, revealing an anisotropic surface topology with distinctive branches and protrusions.
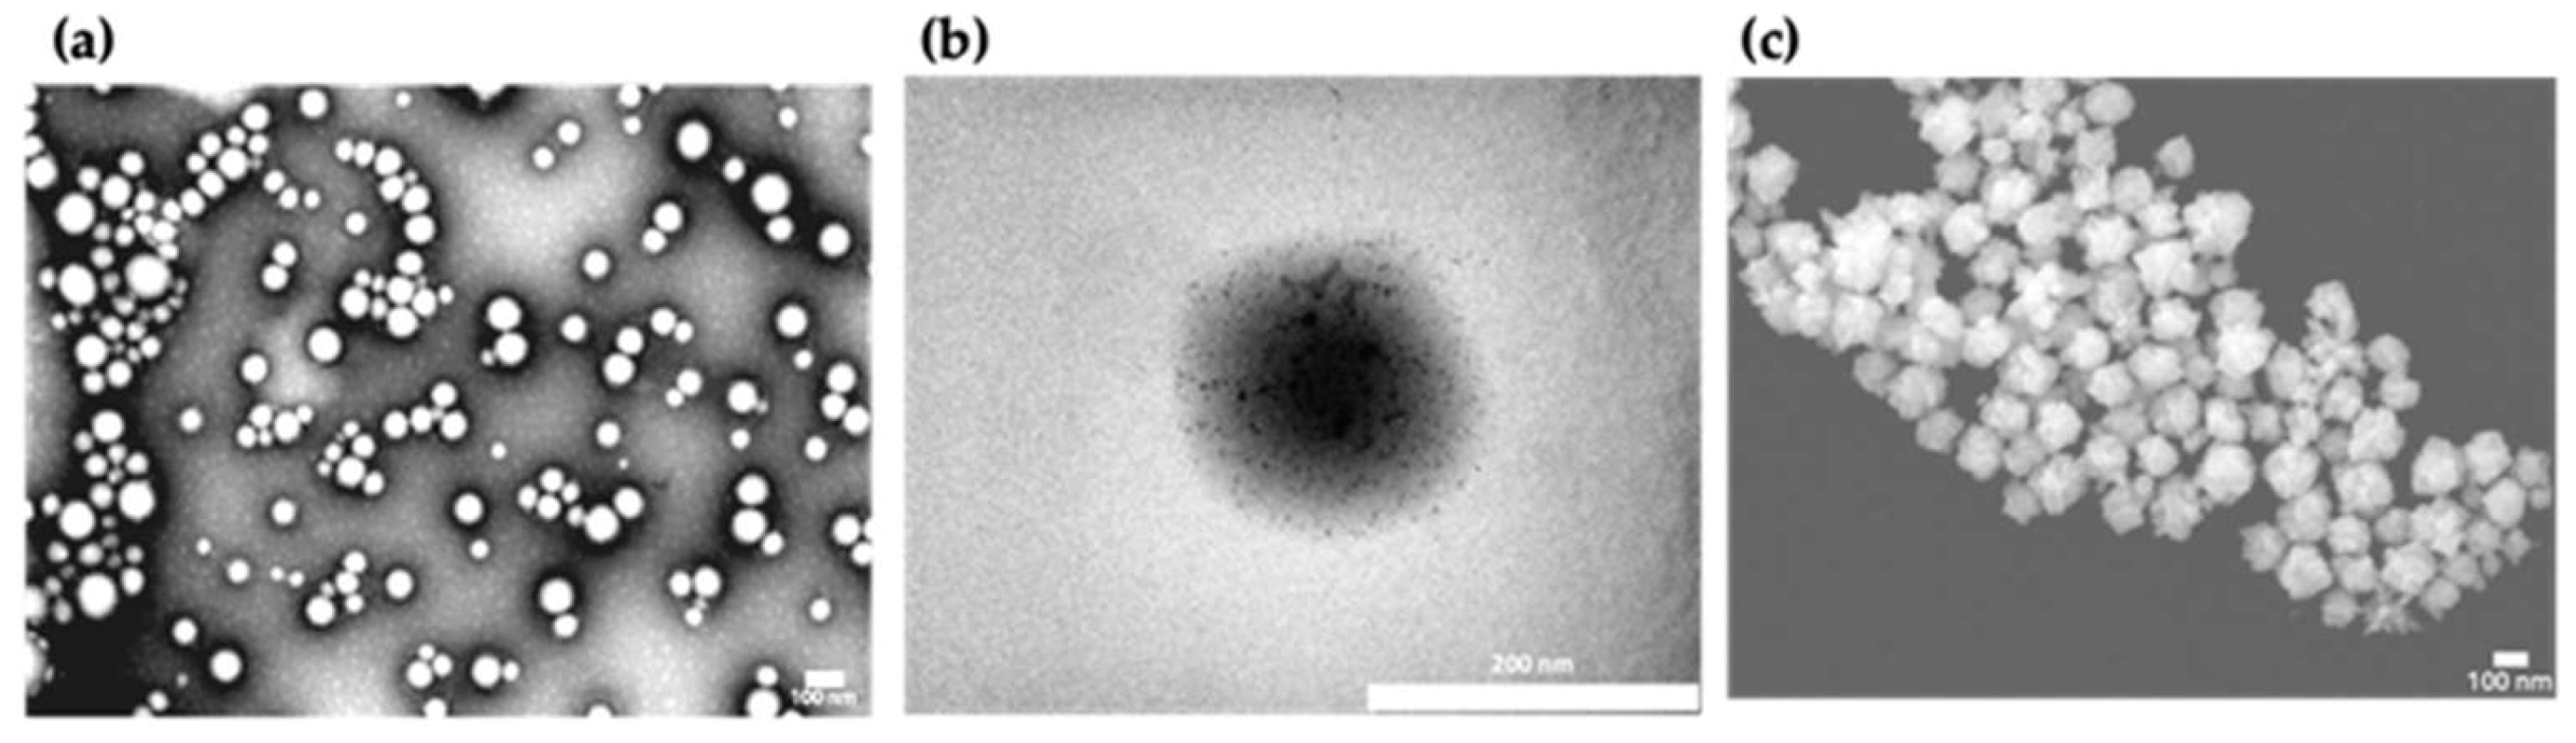
Figure 3.
Cytotoxicity of 5-FU in SW620-GFP colon cancer cells. Cell viability percentages after 24 of exposure to 5-FU at concentrations of 30 µM, 50 µM, and 70 µM. A clear dose- and time-dependent decrease in viability was observed, with the most significant reduction at 70 µM. Negative control: untreated cells; positive control: 0.1 N hydrochloric acid in isopropanol. The data represents the means of three independent experiments performed in triplicate.
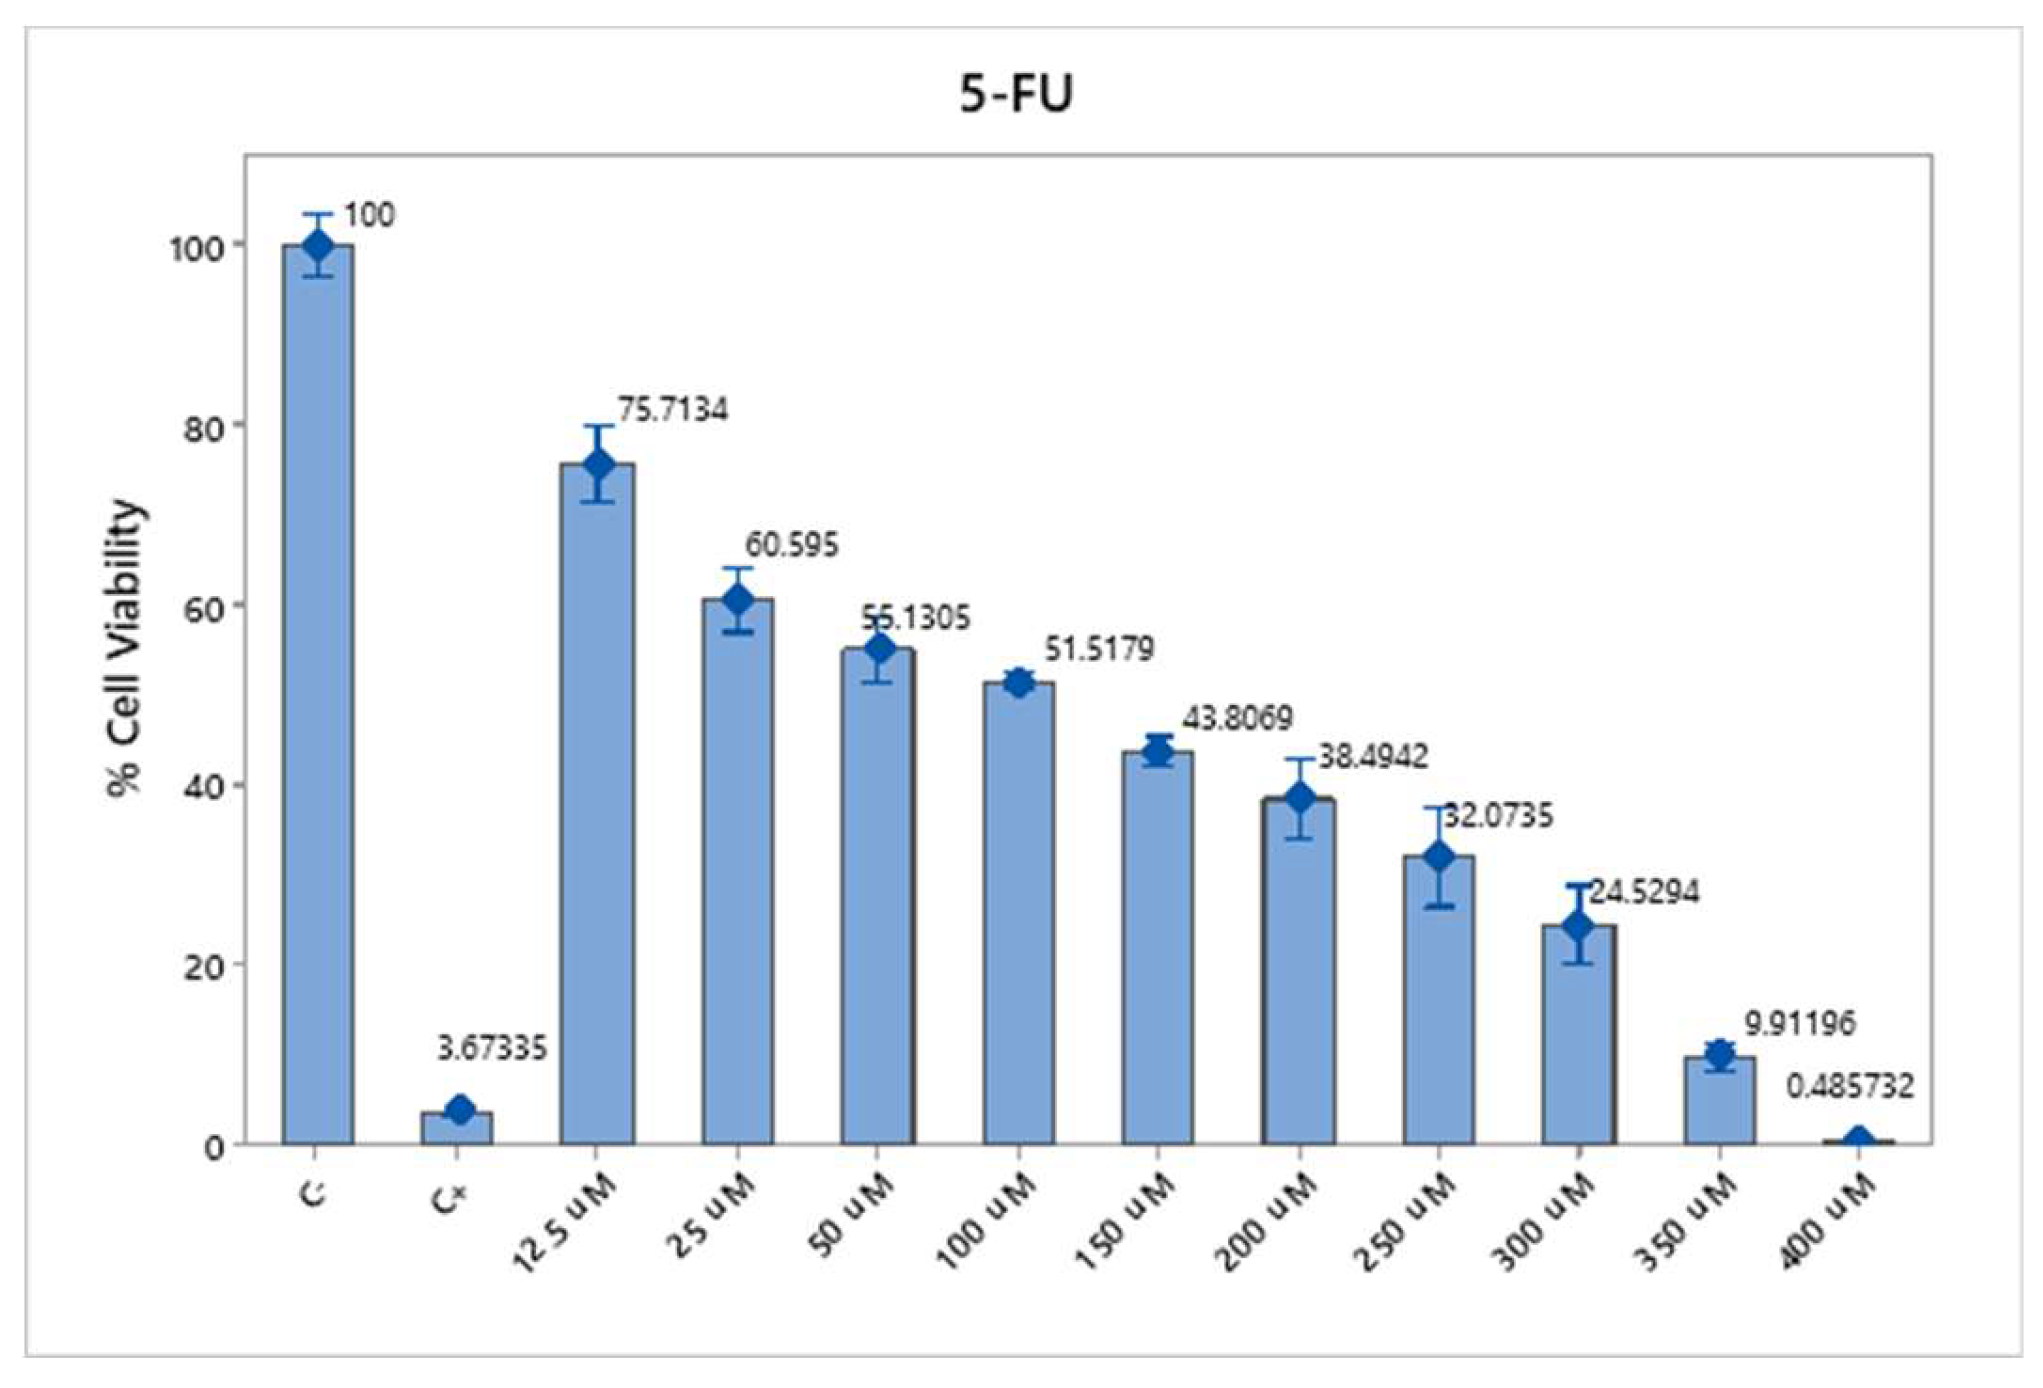
Figure 4.
In vitro cytotoxicity of BGNS under near-infrared (NIR) irradiation. (a) SW620-GFP colon cancer cells were treated with BGNS at dilutions of 1:5, 1:10, and 1:20, followed by NIR laser exposure (800 nm, 2 W, 6 minutes). Cell viability was assessed using the MTT assay. (b) A dose-dependent decrease in viability was observed, with the 1:5 dilution showing the highest cytotoxic effect. Data represents the mean ± standard deviation of three independent experiments performed in triplicate.
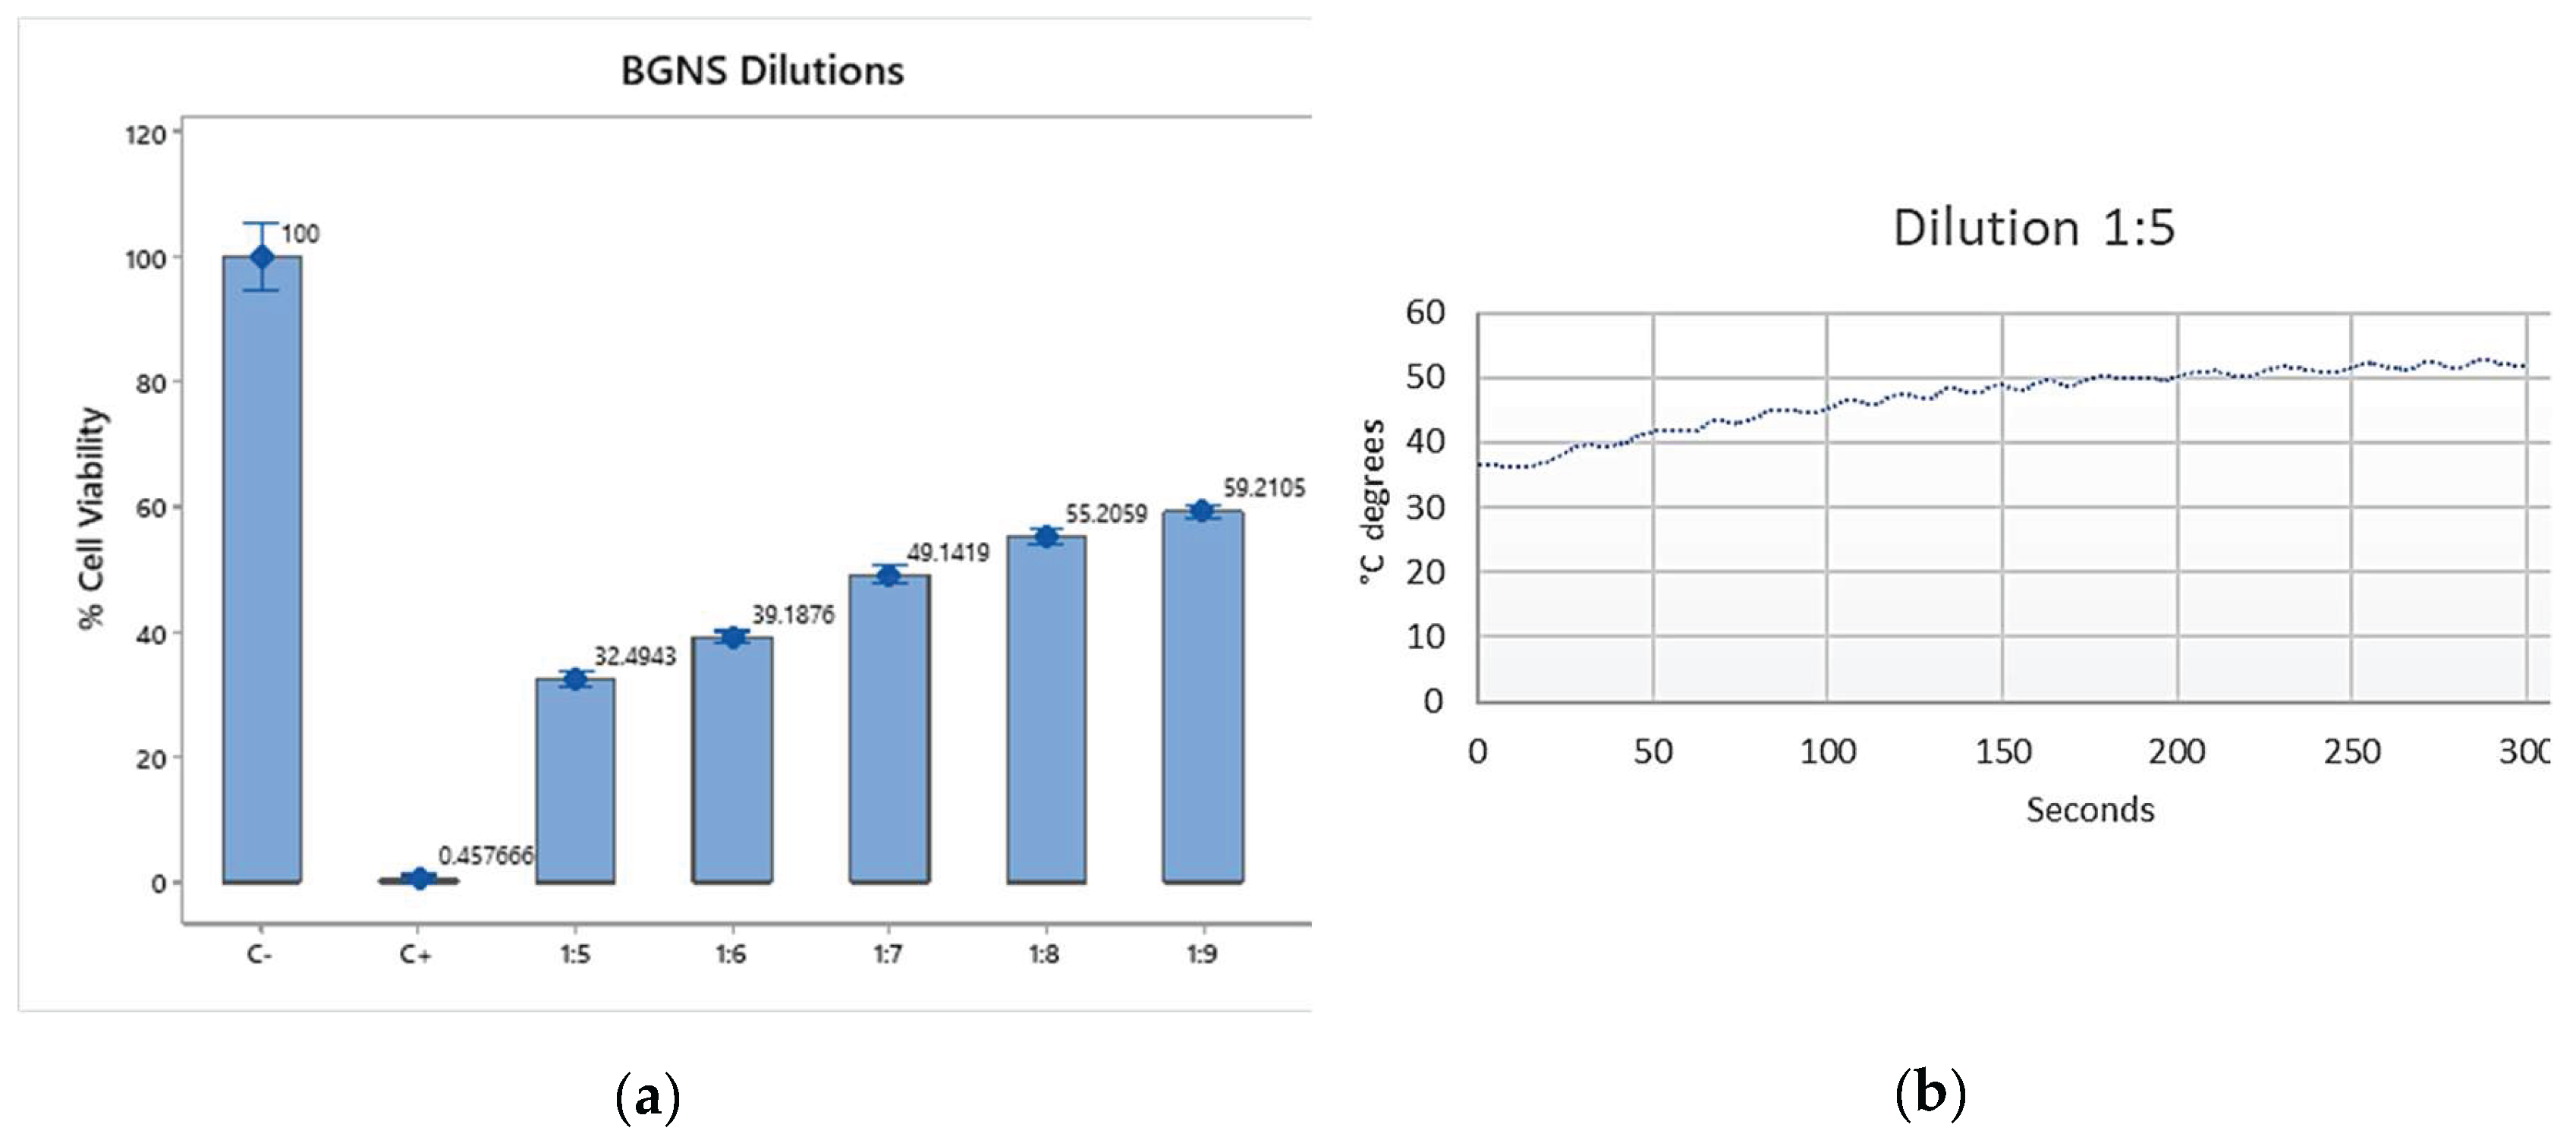
Figure 5.
Bar graph comparing the viability of SW620-GFP colon cancer cells under six different treatment conditions after 48 hours. The figure illustrates the differential cytotoxic effects of each group, highlighting the minimal impact of NIR alone, the moderate reduction caused by 5-FU and BGNS + NIR, and the pronounced synergistic effect of the combined 5-FU + BGNS + NIR treatment. The error bars represent the standard deviations from triplicate experiments.
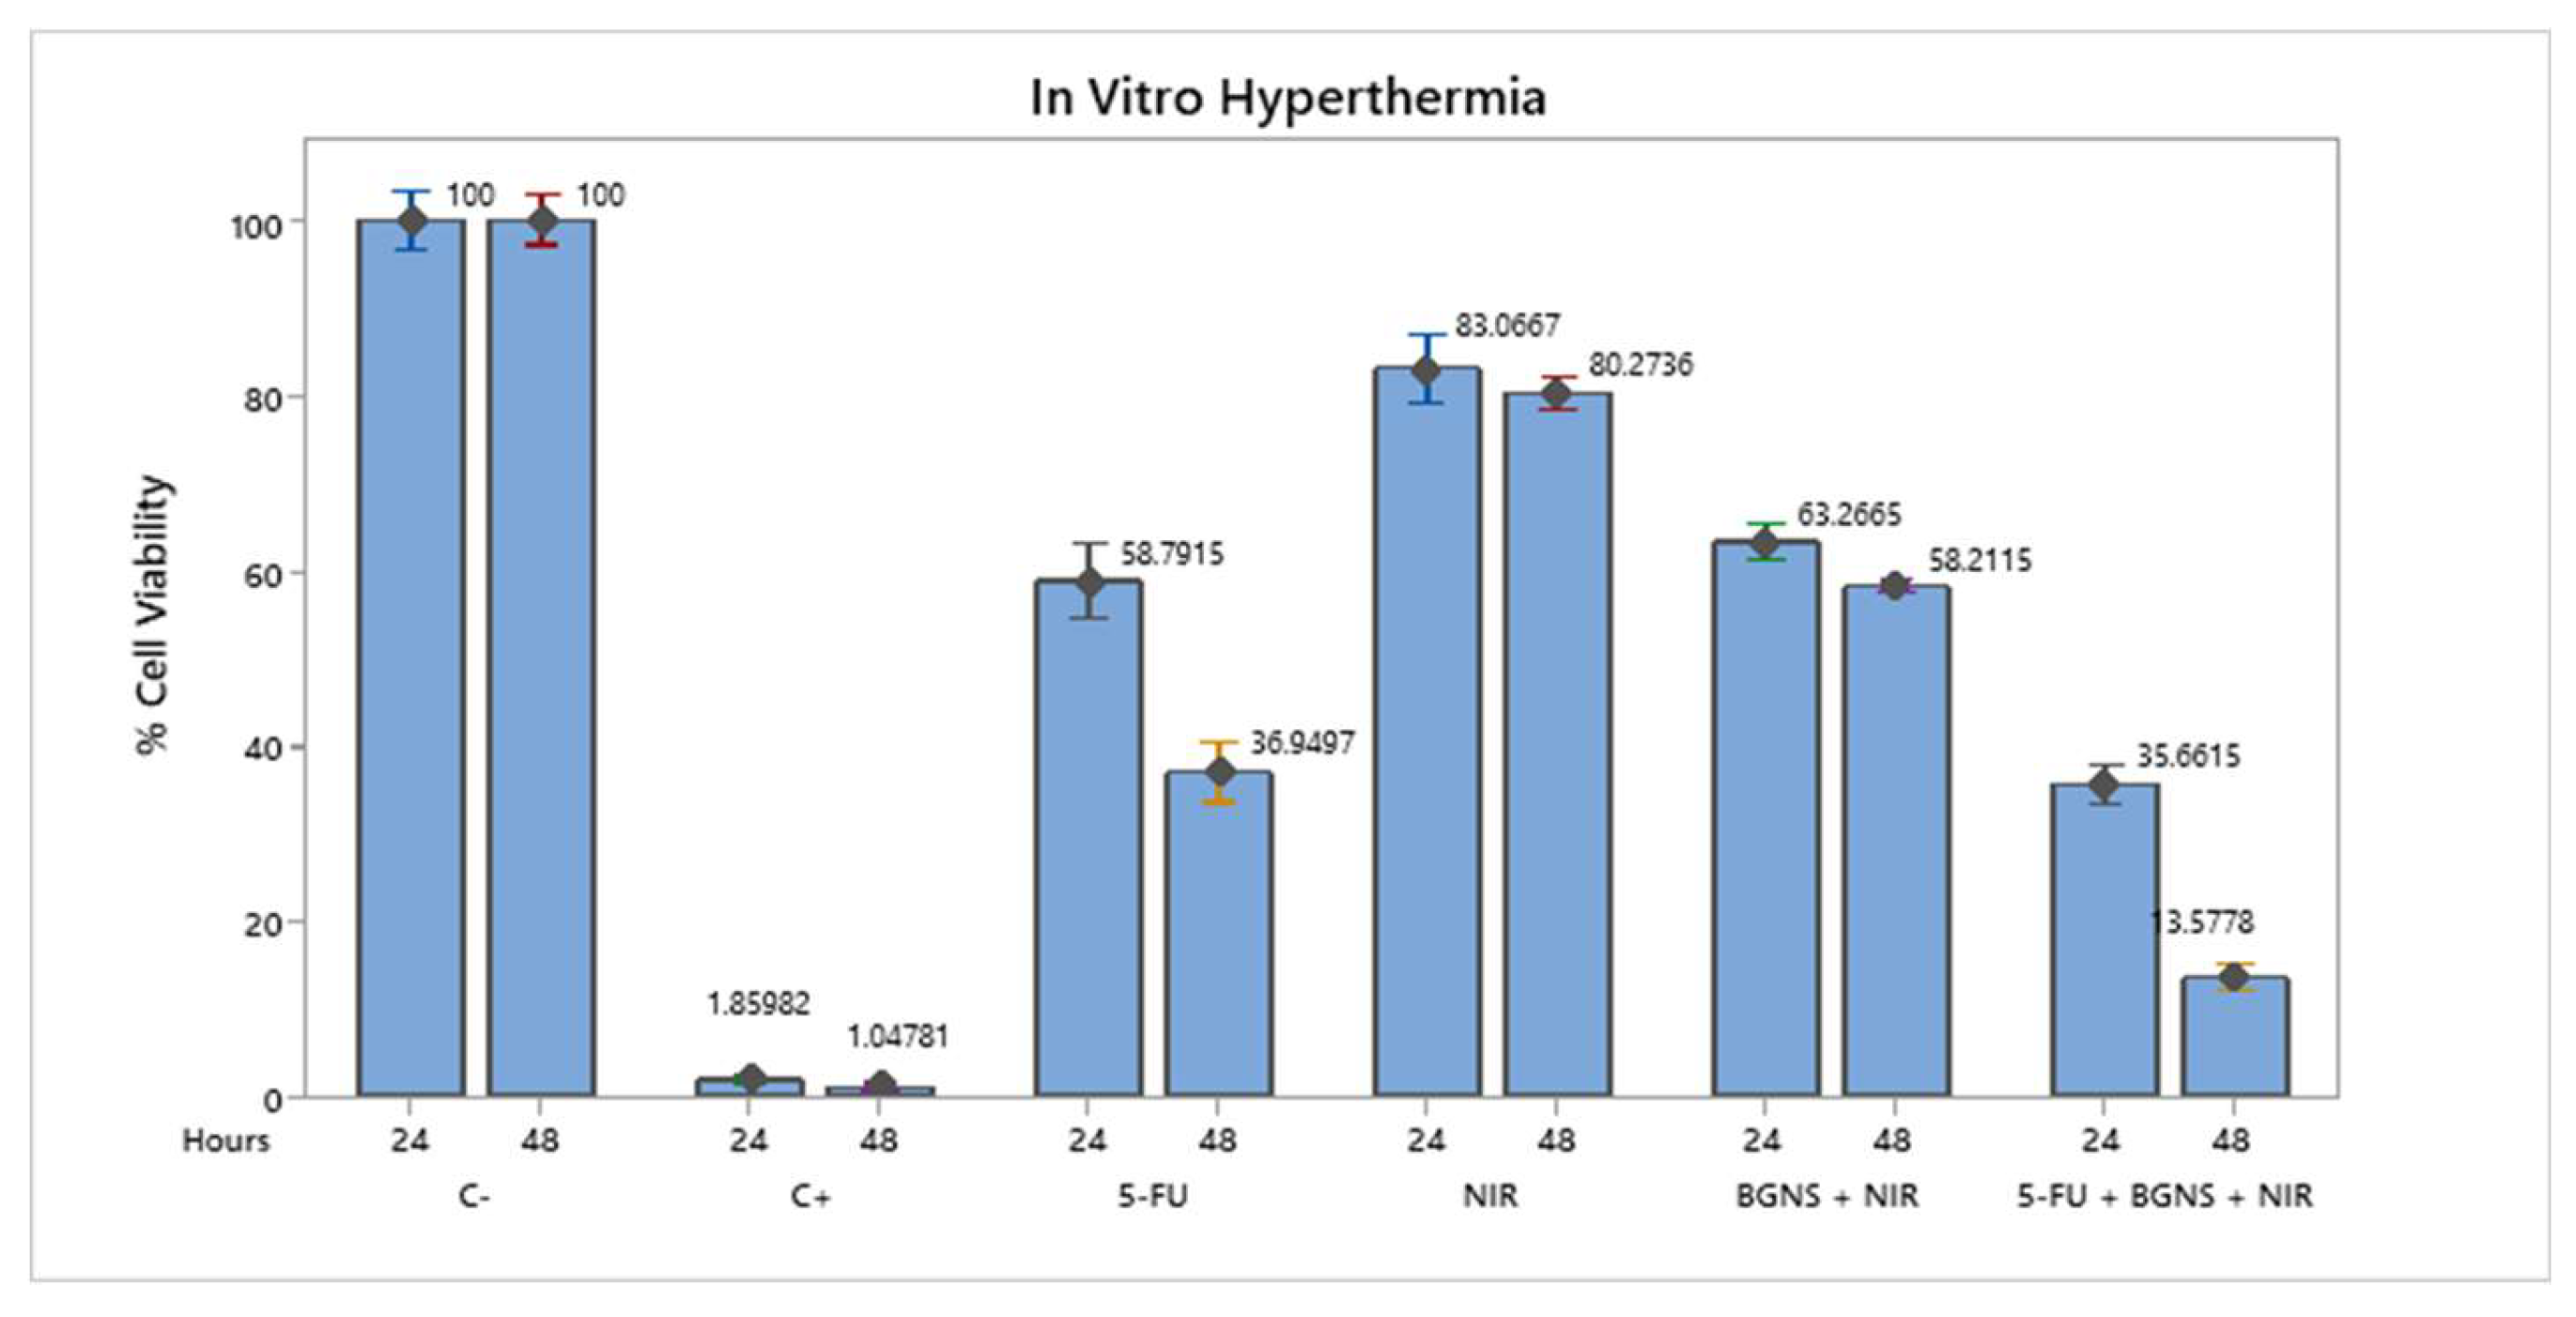
Figure 6.
Tumor growth progression in the control group over a 28-day period. The graph displays individual tumor measurements (gray dots) and the group mean (blue dots) at each time point. A consistent and exponential increase in tumor size was observed, reaching an average of 1010 mm³ by day 28. Data dispersion is shown using a 95% confidence interval based on Student’s t distribution. This group served as a baseline for evaluating treatment efficacy.
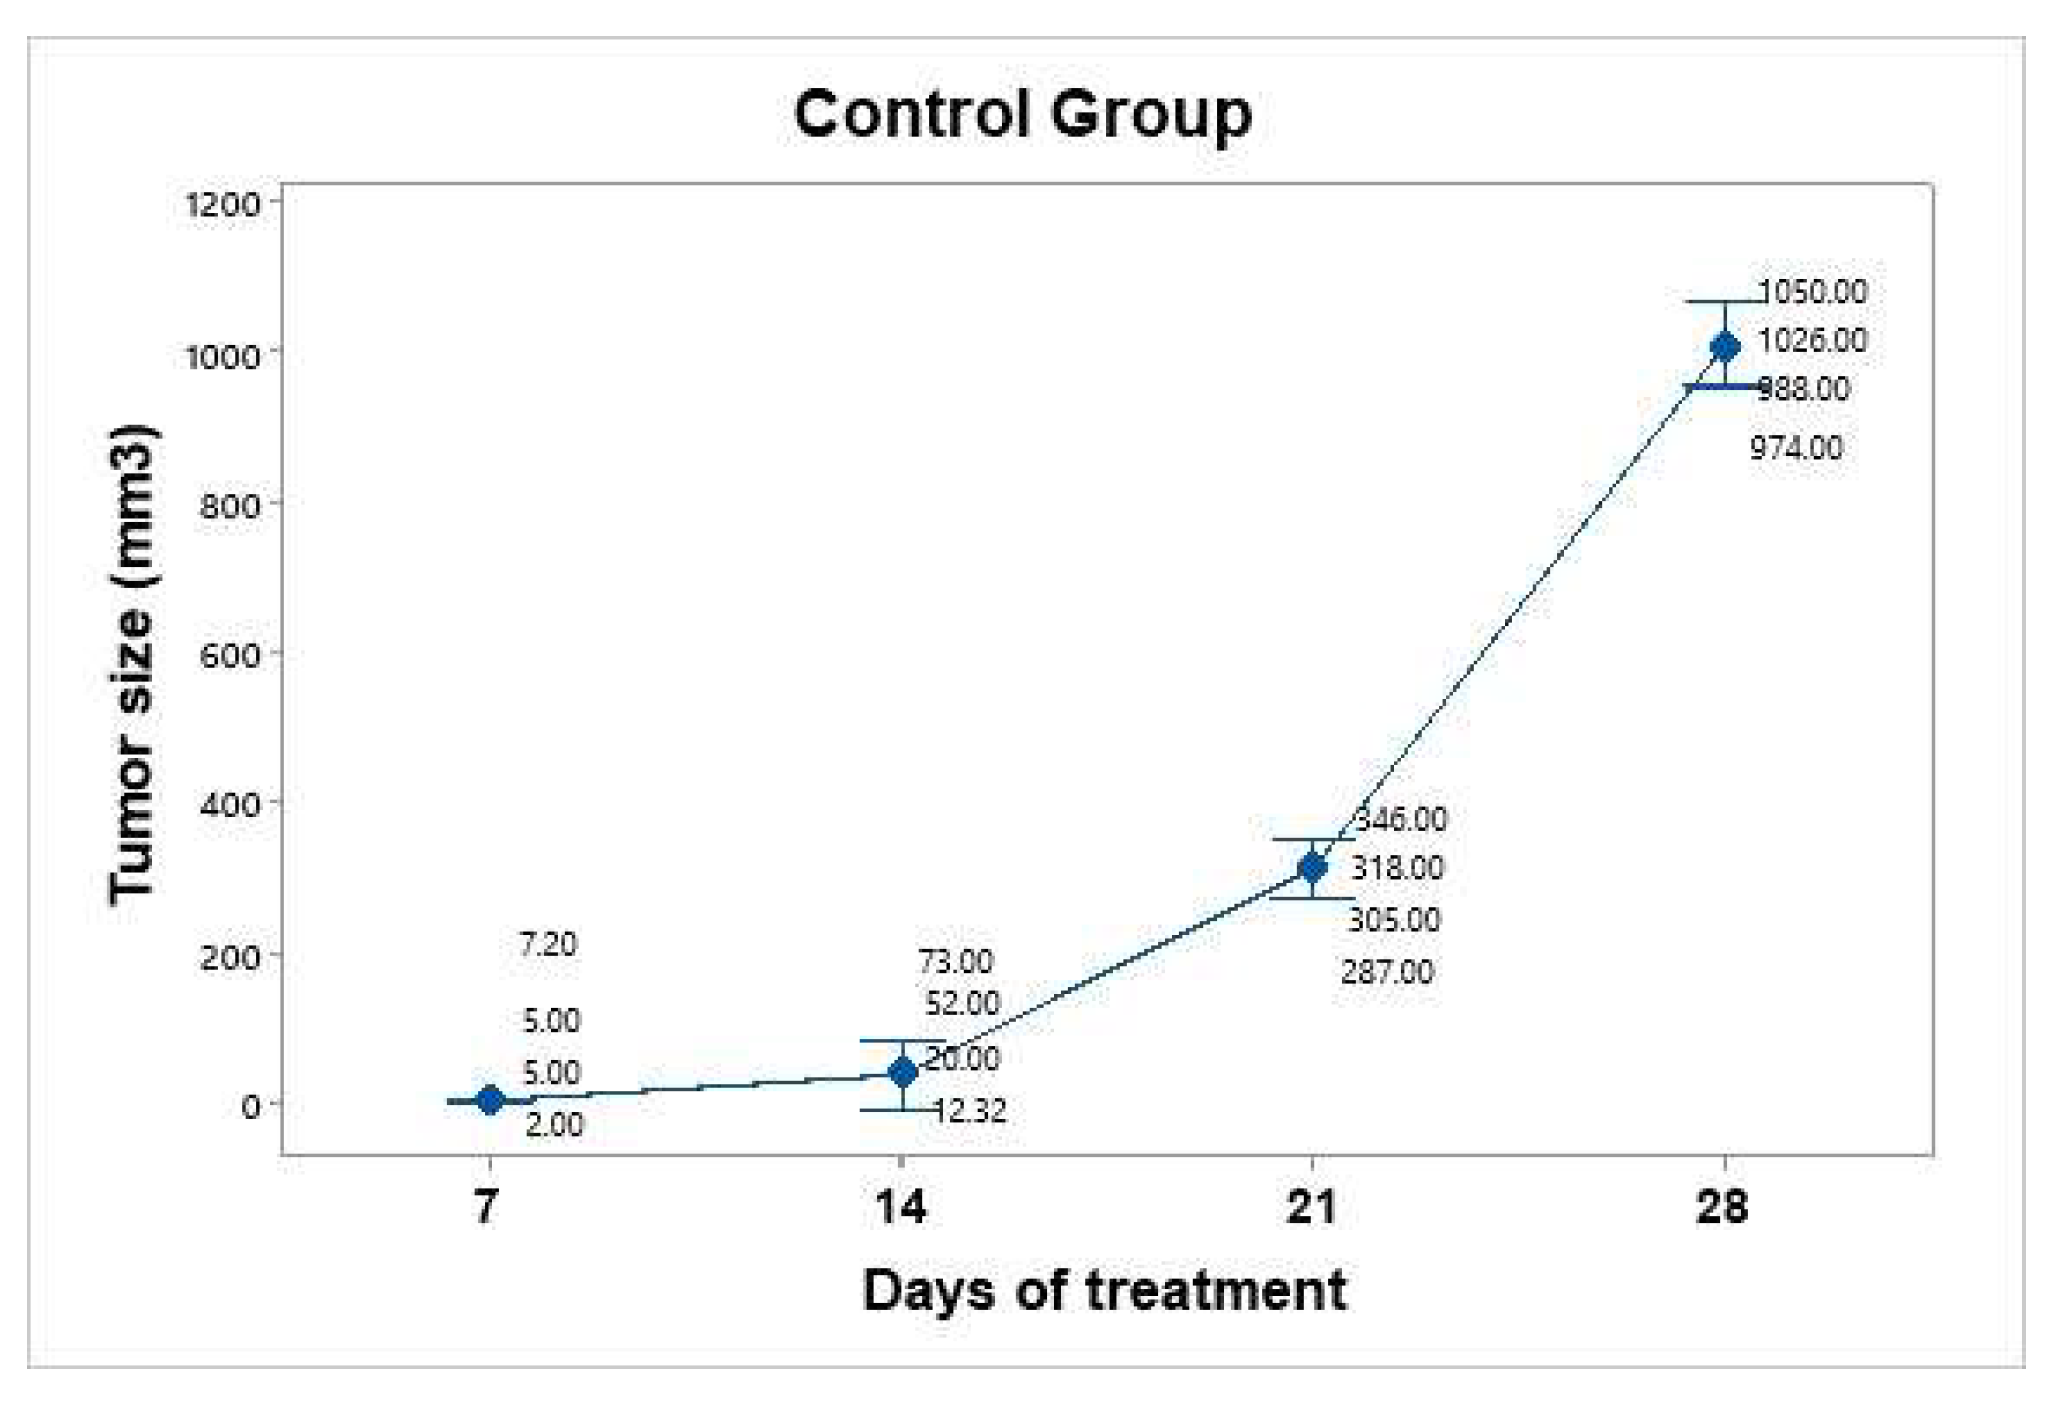
Figure 7.
Tumor volume progression in the 5-FU treatment group over 28 days. The graph shows individual tumor measurements (gray dots) and the group mean (blue dots) at each time point. Compared with that in the control group, tumor growth was slower and more controlled, reaching an average of 142.5 mm³ by day 28. Data are presented with a 95% confidence interval via Student’s t distribution.
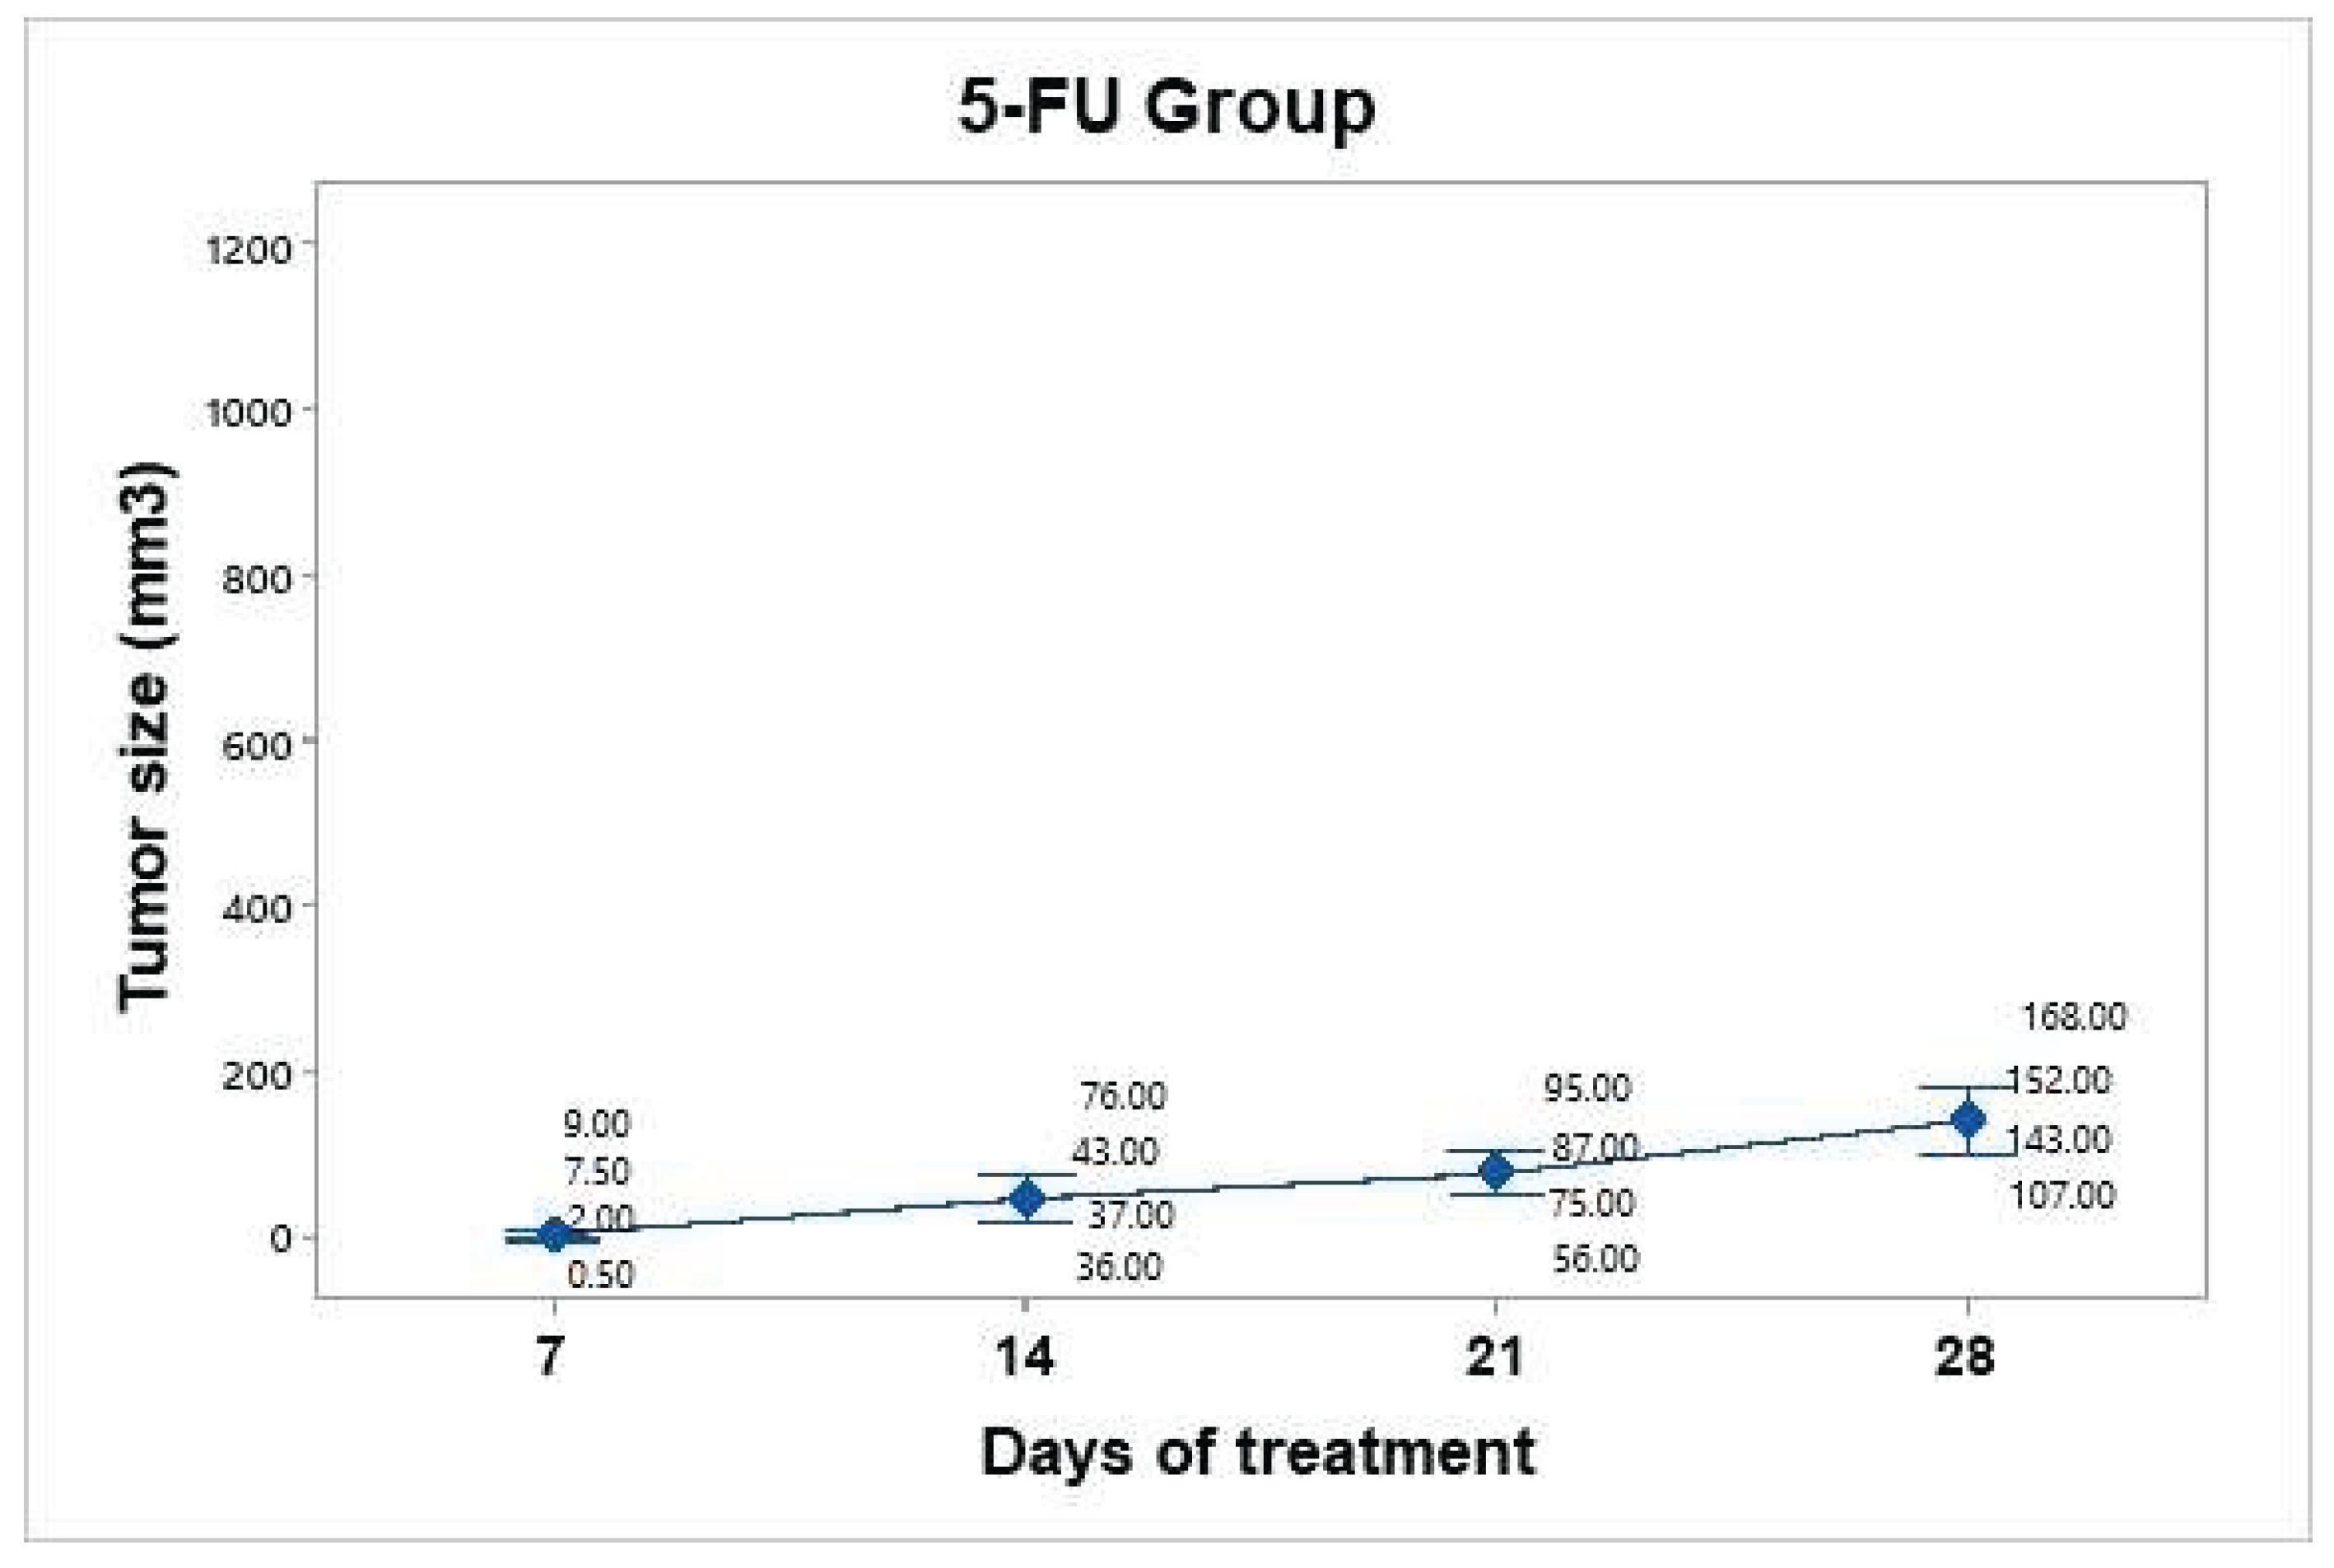
Figure 8.
Tumor volume progression in the near-infrared (NIR) irradiation group over 28 days. Although tumor growth was slower than that in the untreated control group, it remained substantial, reaching an average of 472 mm³ by day 28. Individual tumor measurements (gray dots) and group means (blue dots) are shown with 95% confidence intervals (CIs) based on Student’s t distribution.
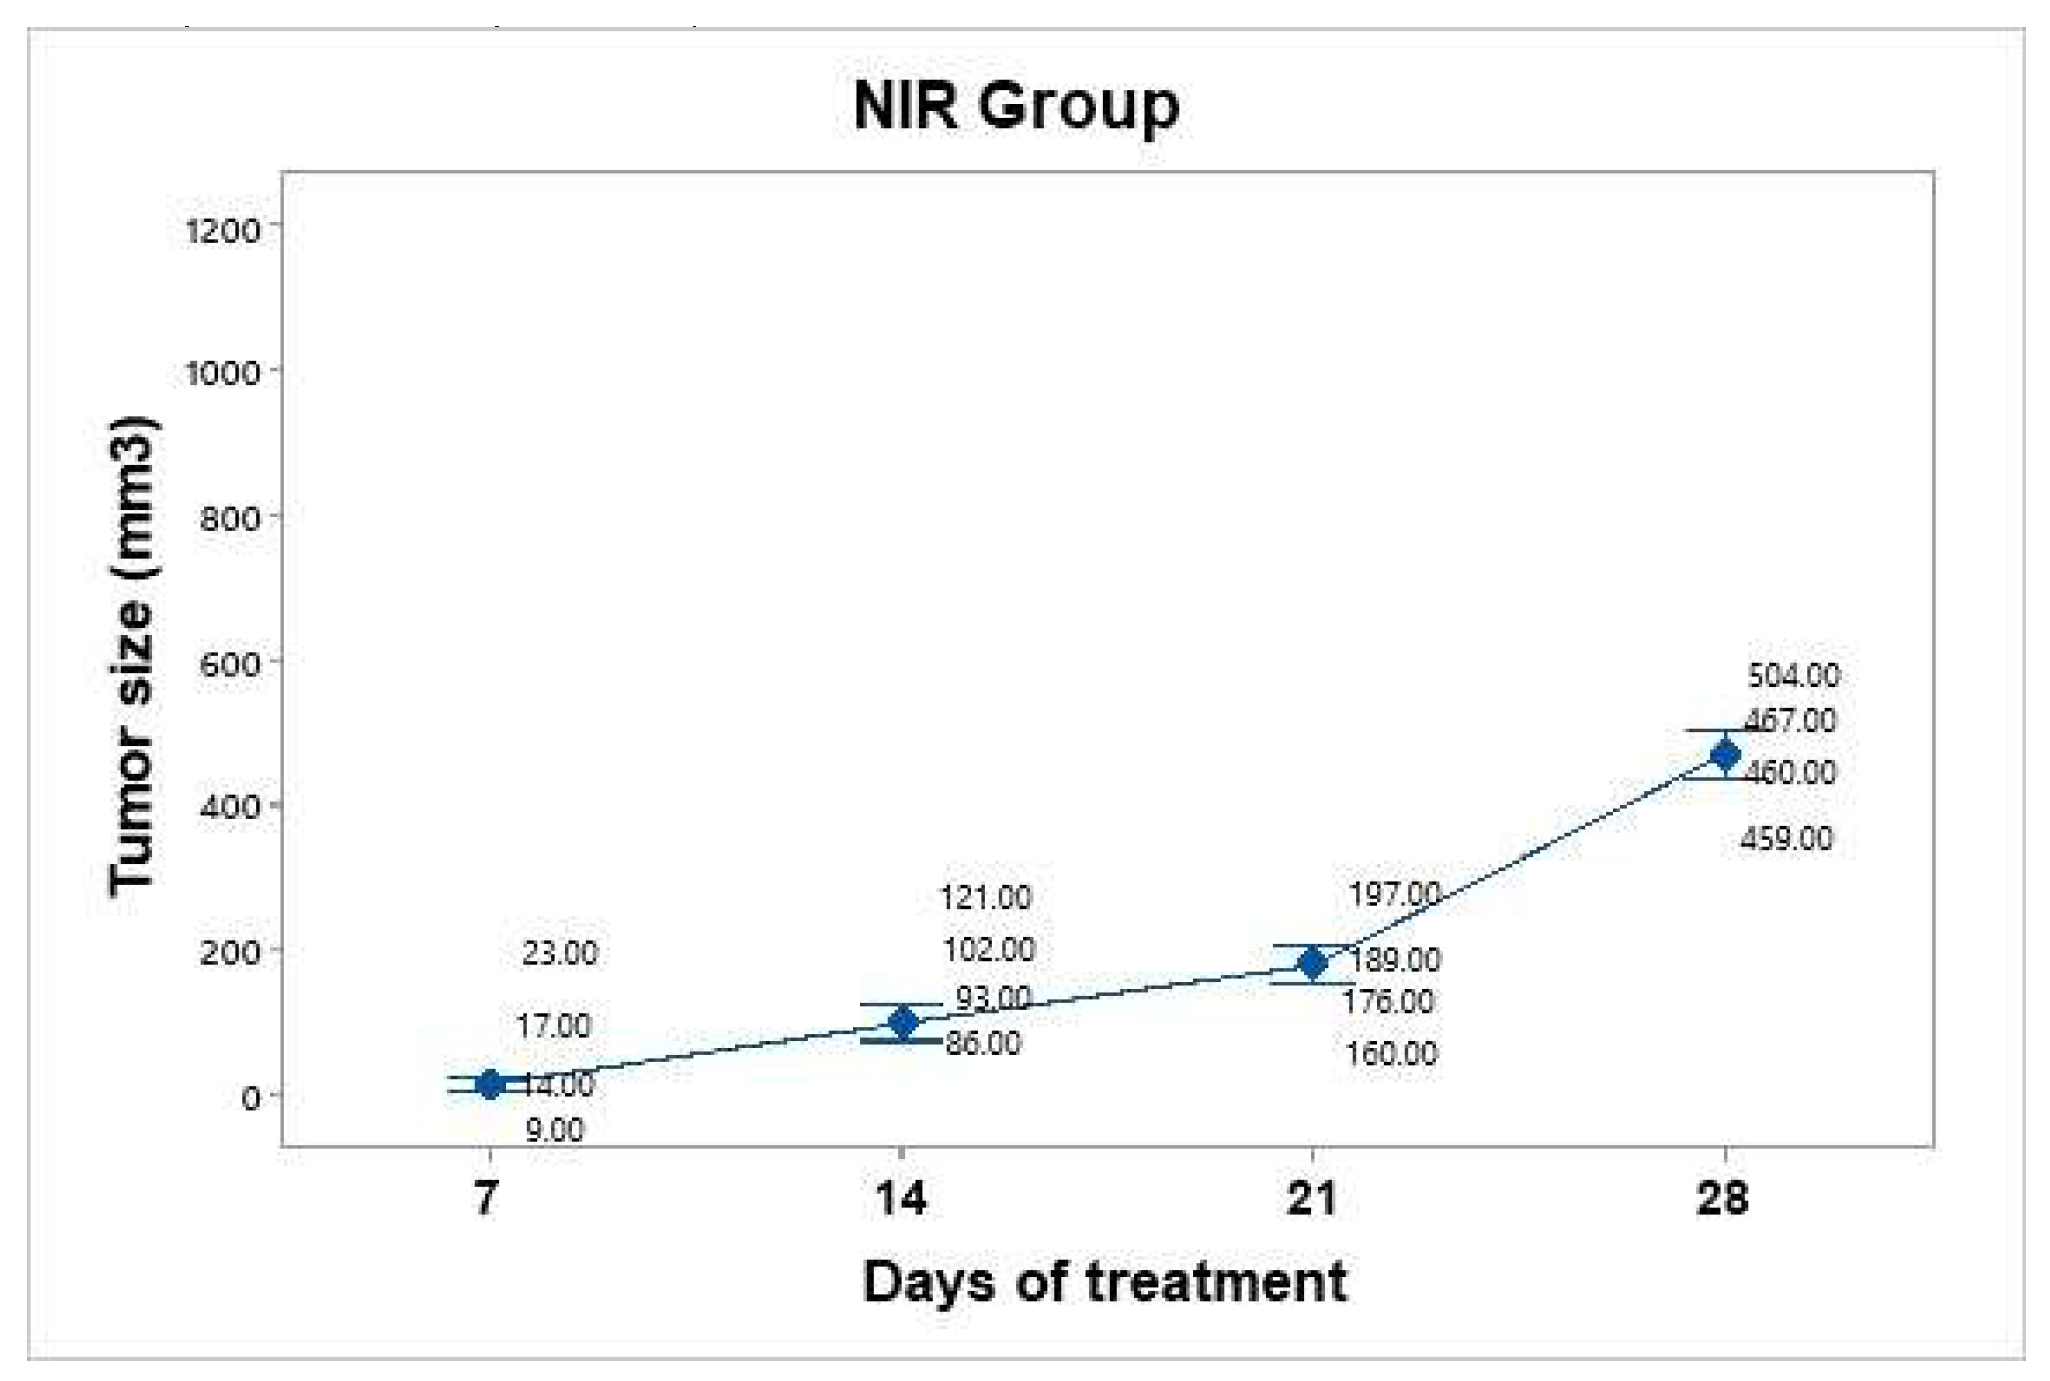
Figure 9.
Thermographic analysis of the temperature distribution during NIR irradiation in the BGNS + NIR treatment group. (a) The baseline image prior to irradiation shows a uniform temperature distribution of approximately 36.7°C across the tumor and surrounding tissue. (b) Mid-irradiation image revealing localized heating at the tumor site, with a visible thermal gradient indicating effective photothermal conversion by BGNSs. (c) Final image after 10 minutes of NIR exposure showing that the peak temperature at the tumor core reached 44.5°C, confirming the successful induction of hyperthermia while maintaining the surrounding tissue within safe thermal limits. These images validated the spatial precision and thermal efficacy of the BGNS-mediated PTT.
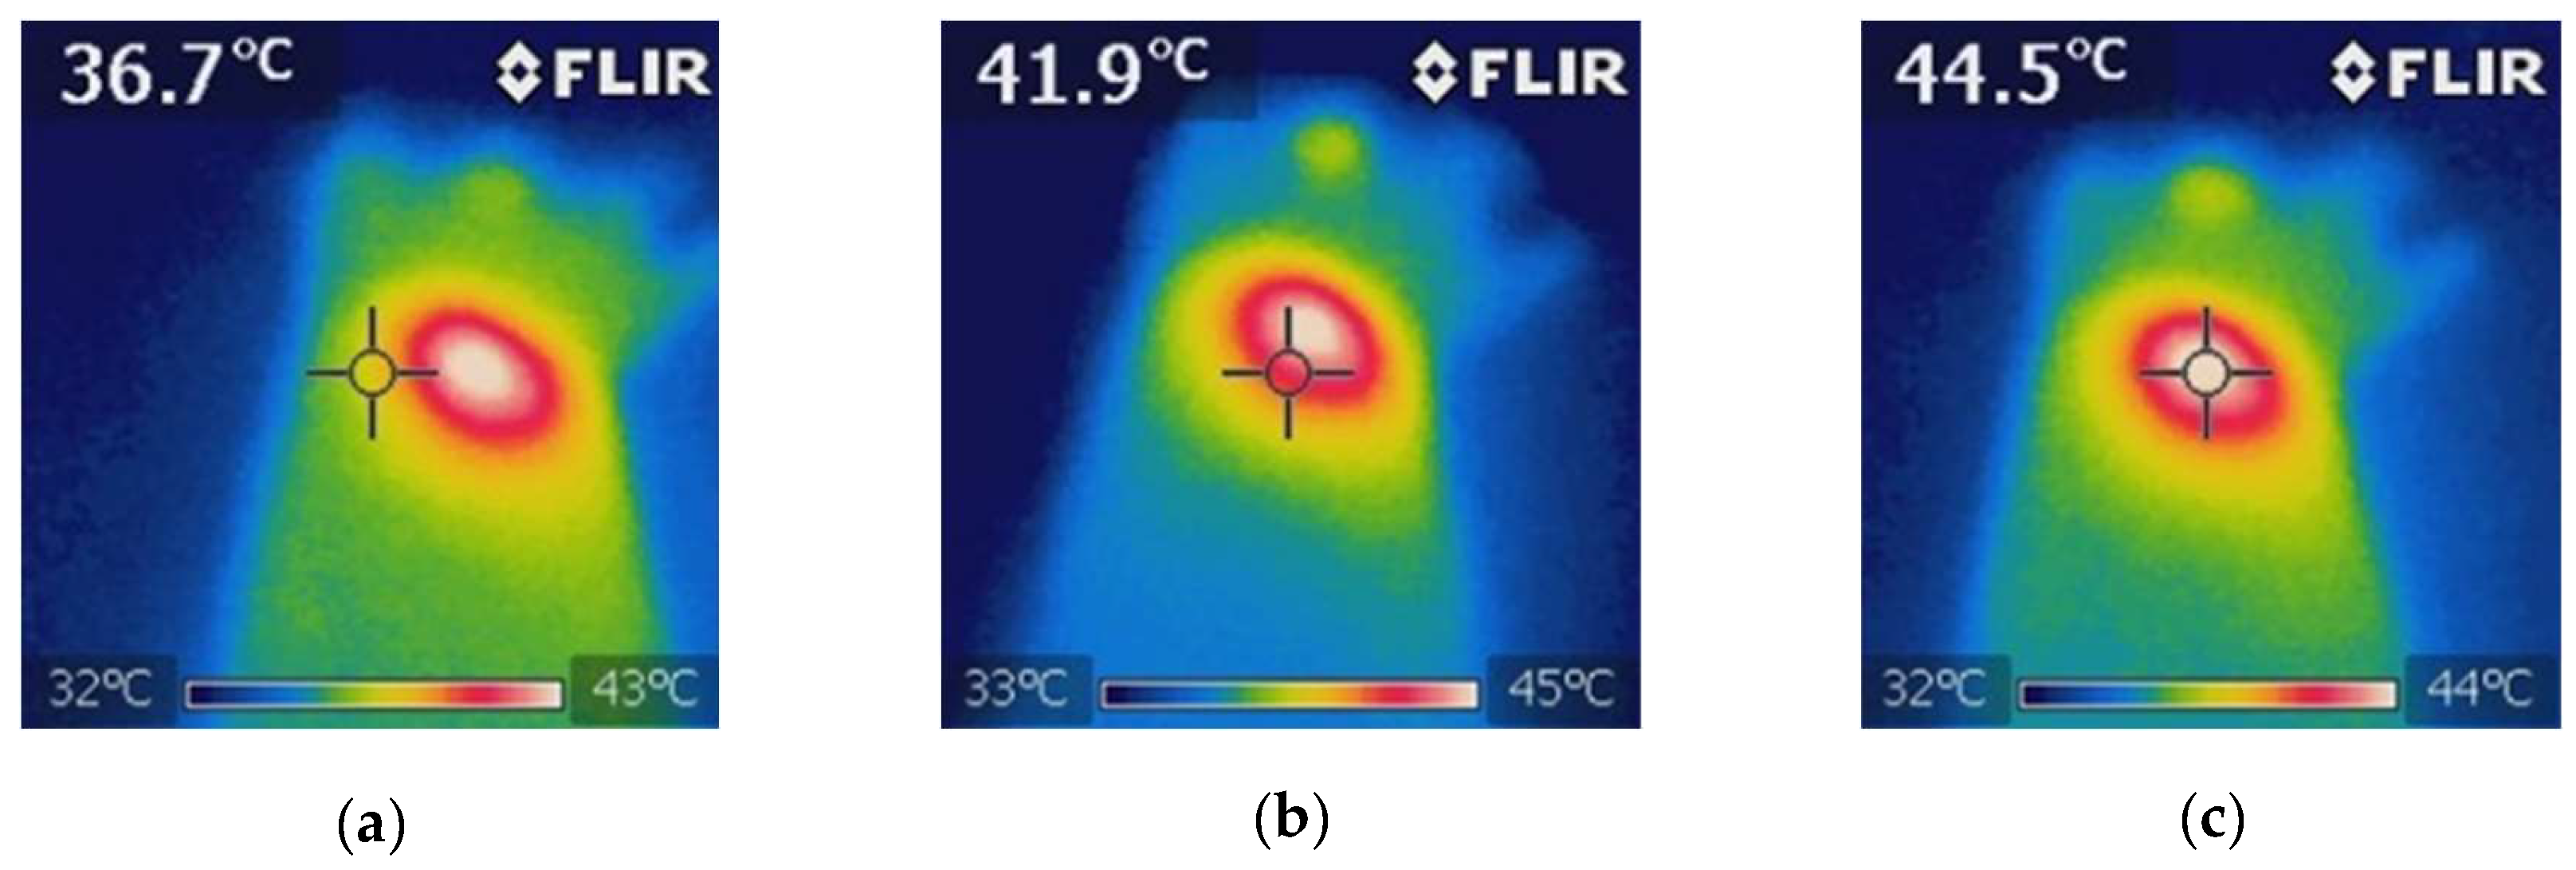
Figure 10.
Tumor volume progression in the group treated with BGNS + NIR over 28 days. Although an initial reduction in tumor size was observed, regrowth occurred in subsequent weeks, reaching an average of 303 mm³ by day 28. Individual tumor measurements (gray dots) and group means (blue dots) are shown with 95% confidence intervals (CIs) based on Student’s t distribution.
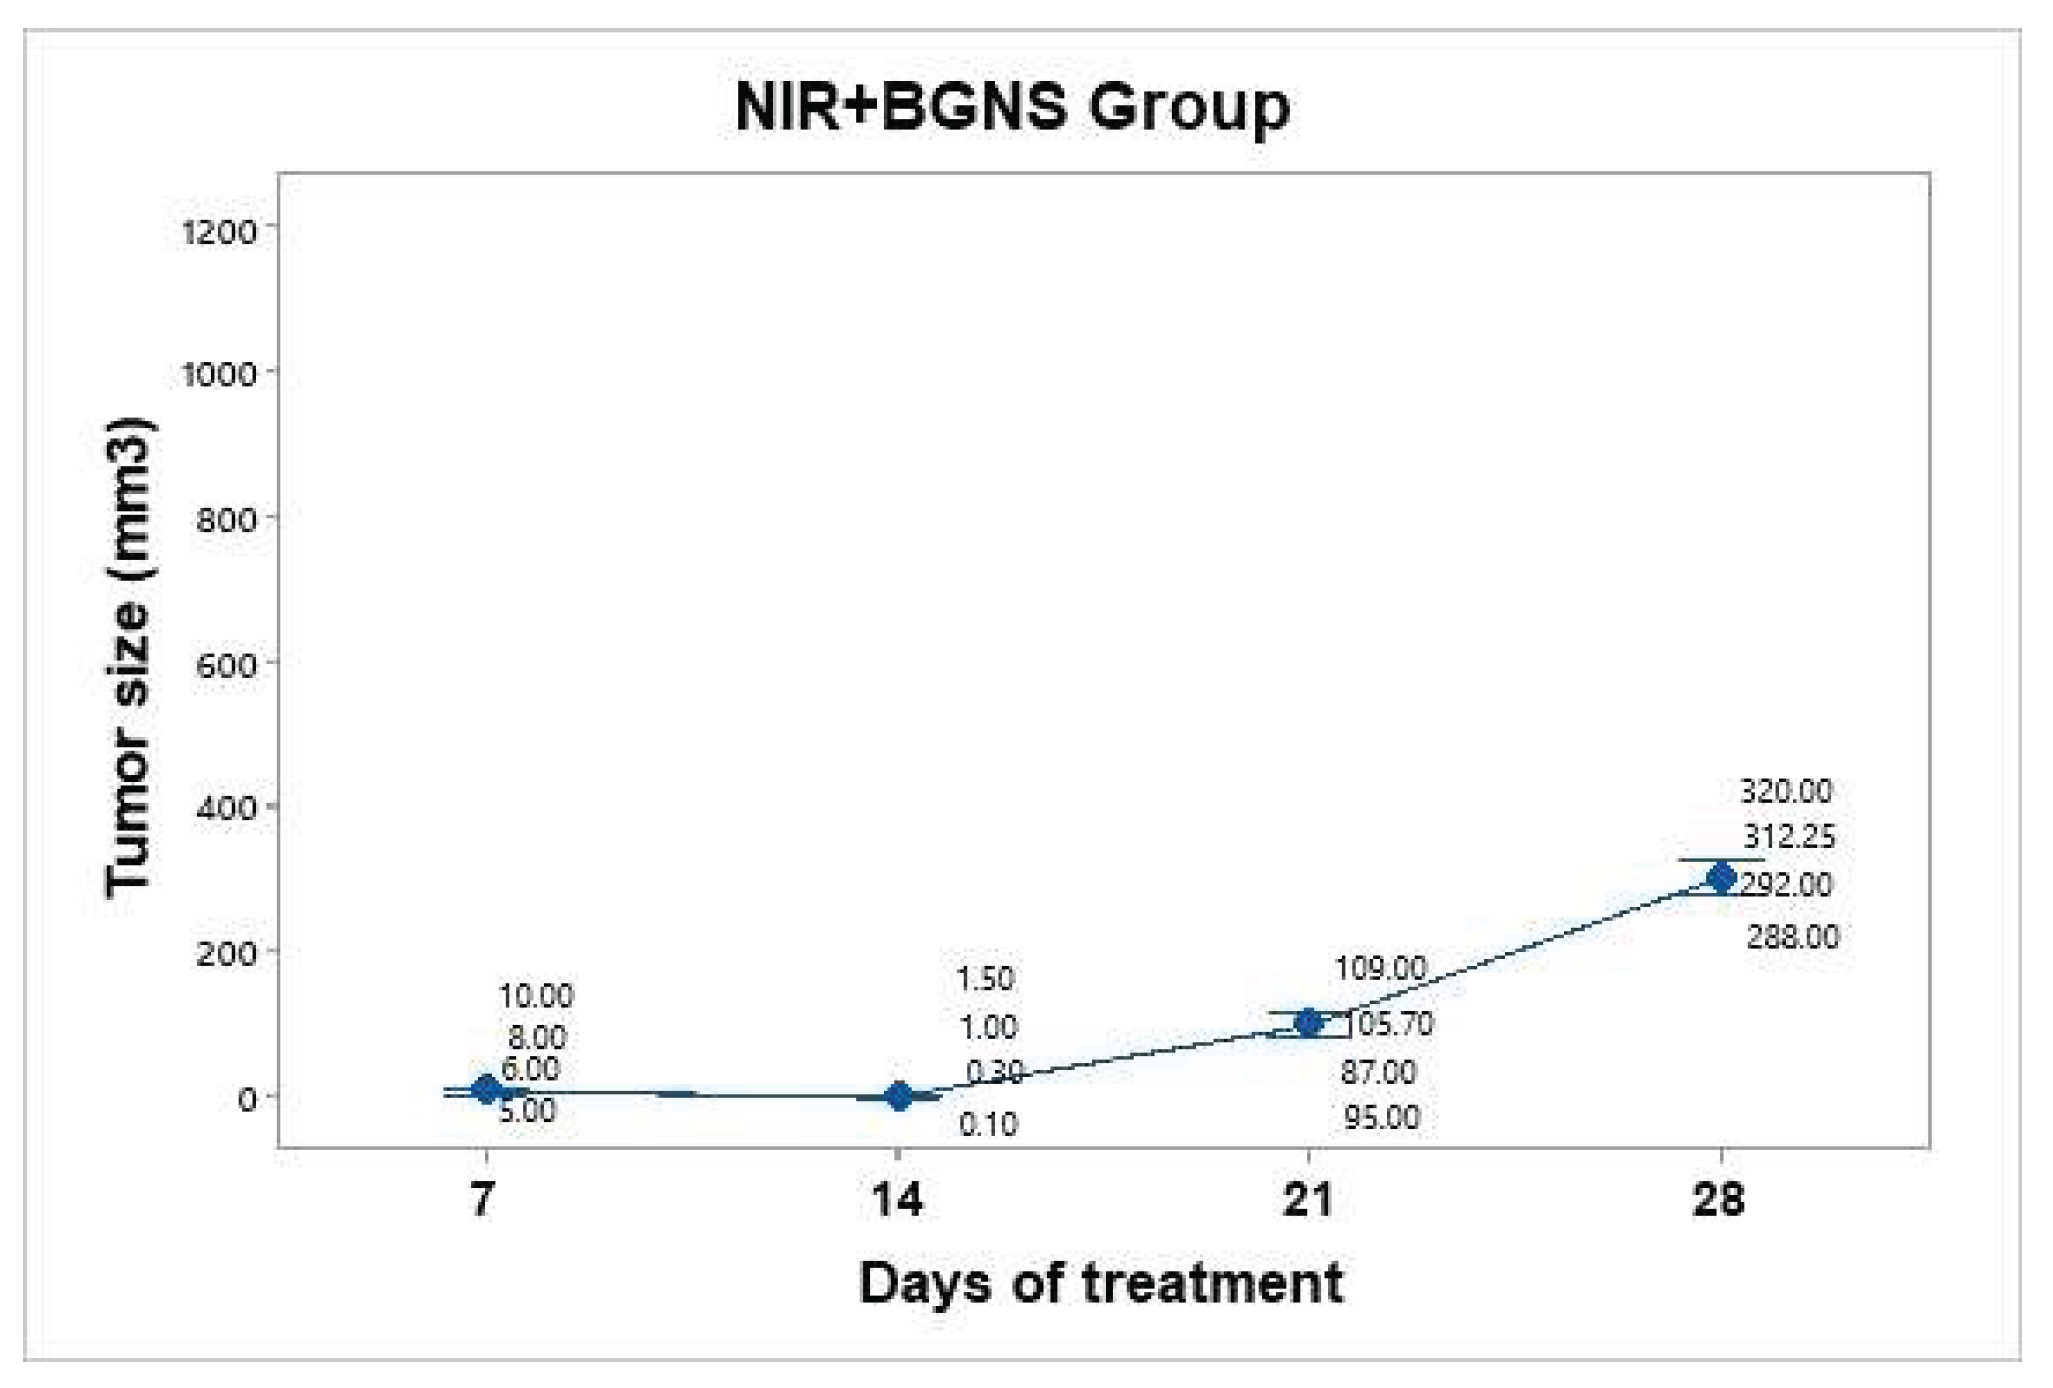
Figure 11.
Thermographic images showing the temperature distribution during NIR irradiation in the 5-FU + BGNS + NIR treatment group. (a) Initial thermal image before irradiation, showing a uniform temperature of approximately 37.6°C across the tumor and surrounding tissue. (b) Midpoint of irradiation, where a localized increase in temperature begins to appear at the tumor site, indicating the activation of BGNSs under NIR light. (c) Final image after 10 minutes of irradiation, showing a peak temperature of 45°C at the tumor core, confirming effective and targeted photothermal conversion. These images demonstrate the spatial precision and thermal efficiency of the combined chemo-photothermal treatment.
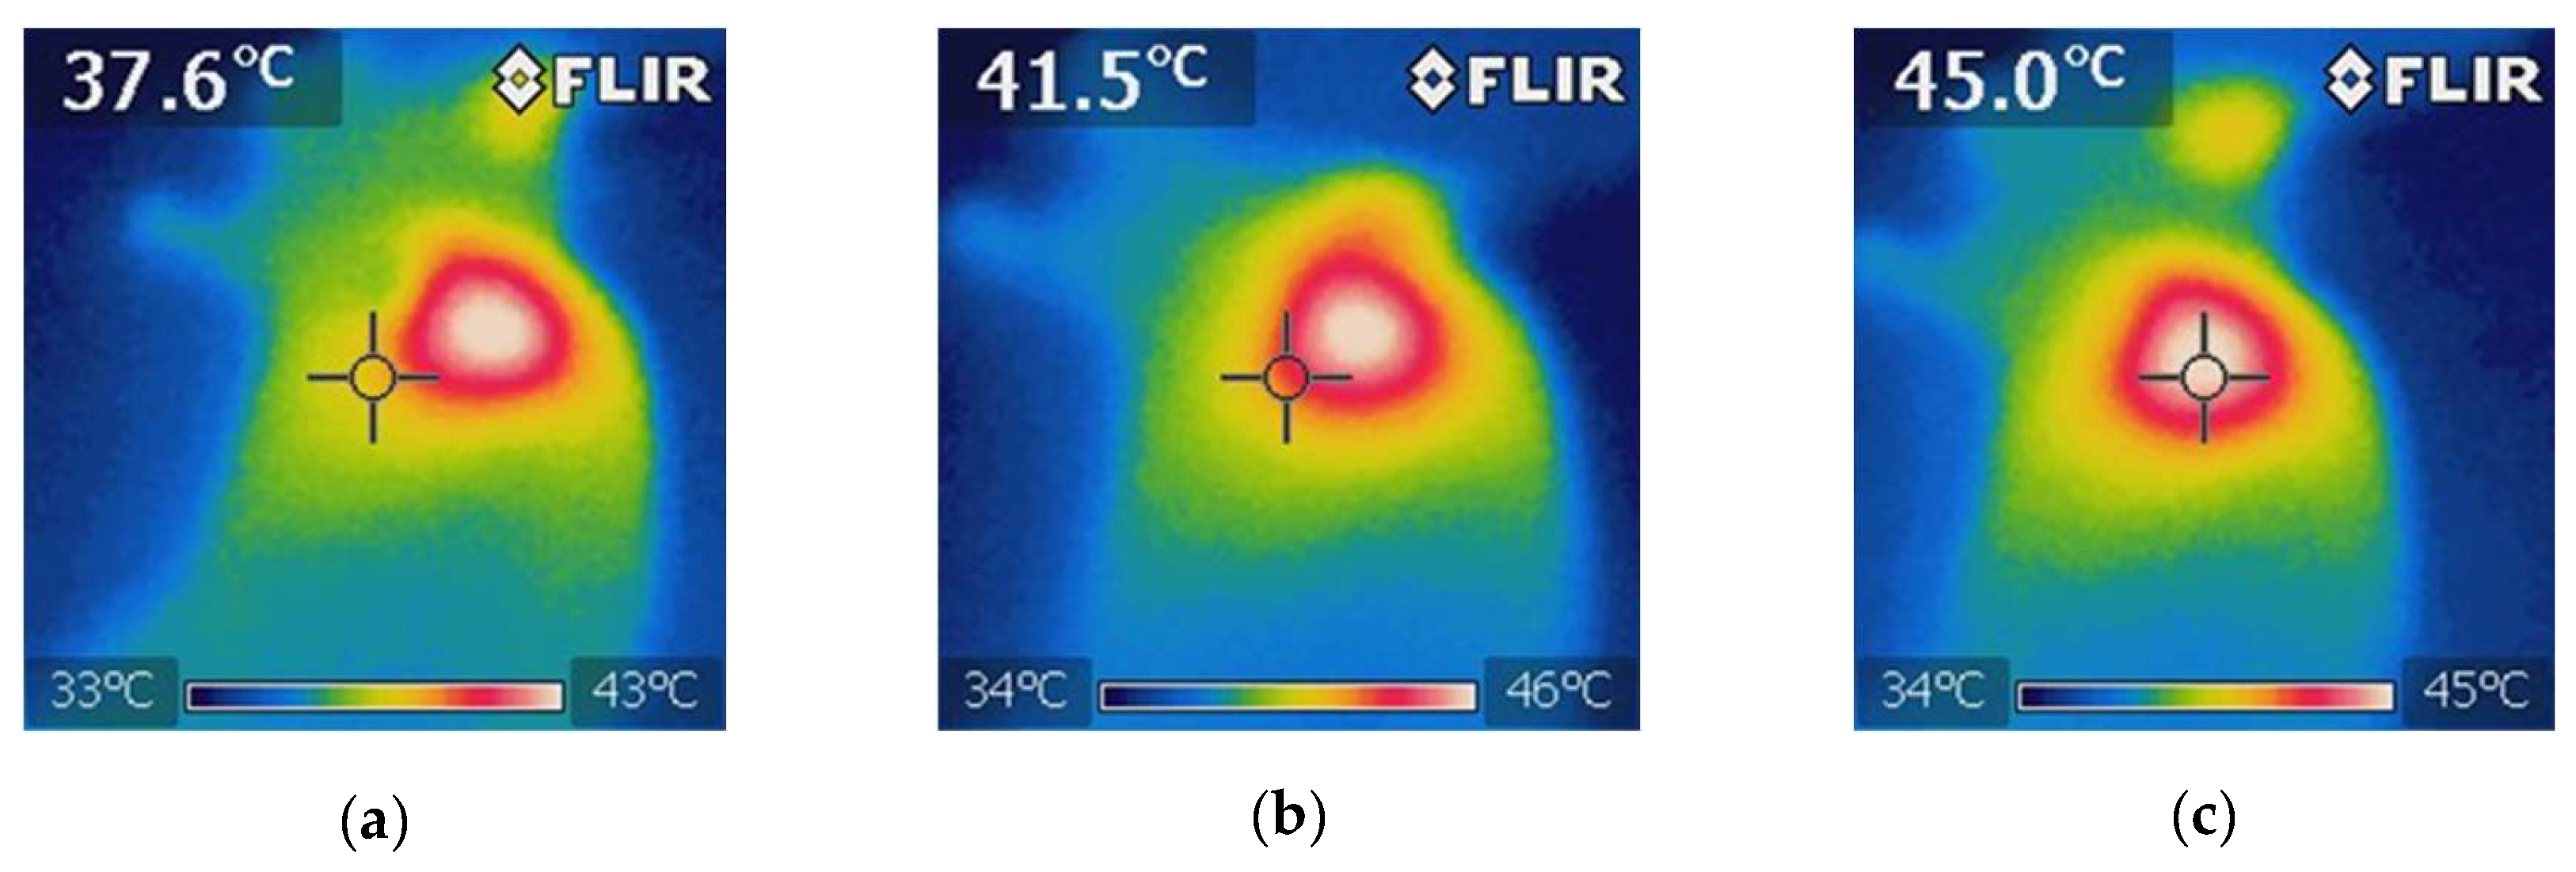
Figure 12.
Tumor volume progression in the group treated with combined chemo-photothermal therapy (5-FU + BGNS + NIR) over 28 days. A marked and sustained reduction in tumor size was observed, with an average volume of 0.4 mm³ by day 28. Individual tumor measurements (gray dots) and group means (blue dots) are shown with 95% confidence intervals (CIs) based on Student’s t distribution. This group exhibited the most significant therapeutic response among all the treatments.
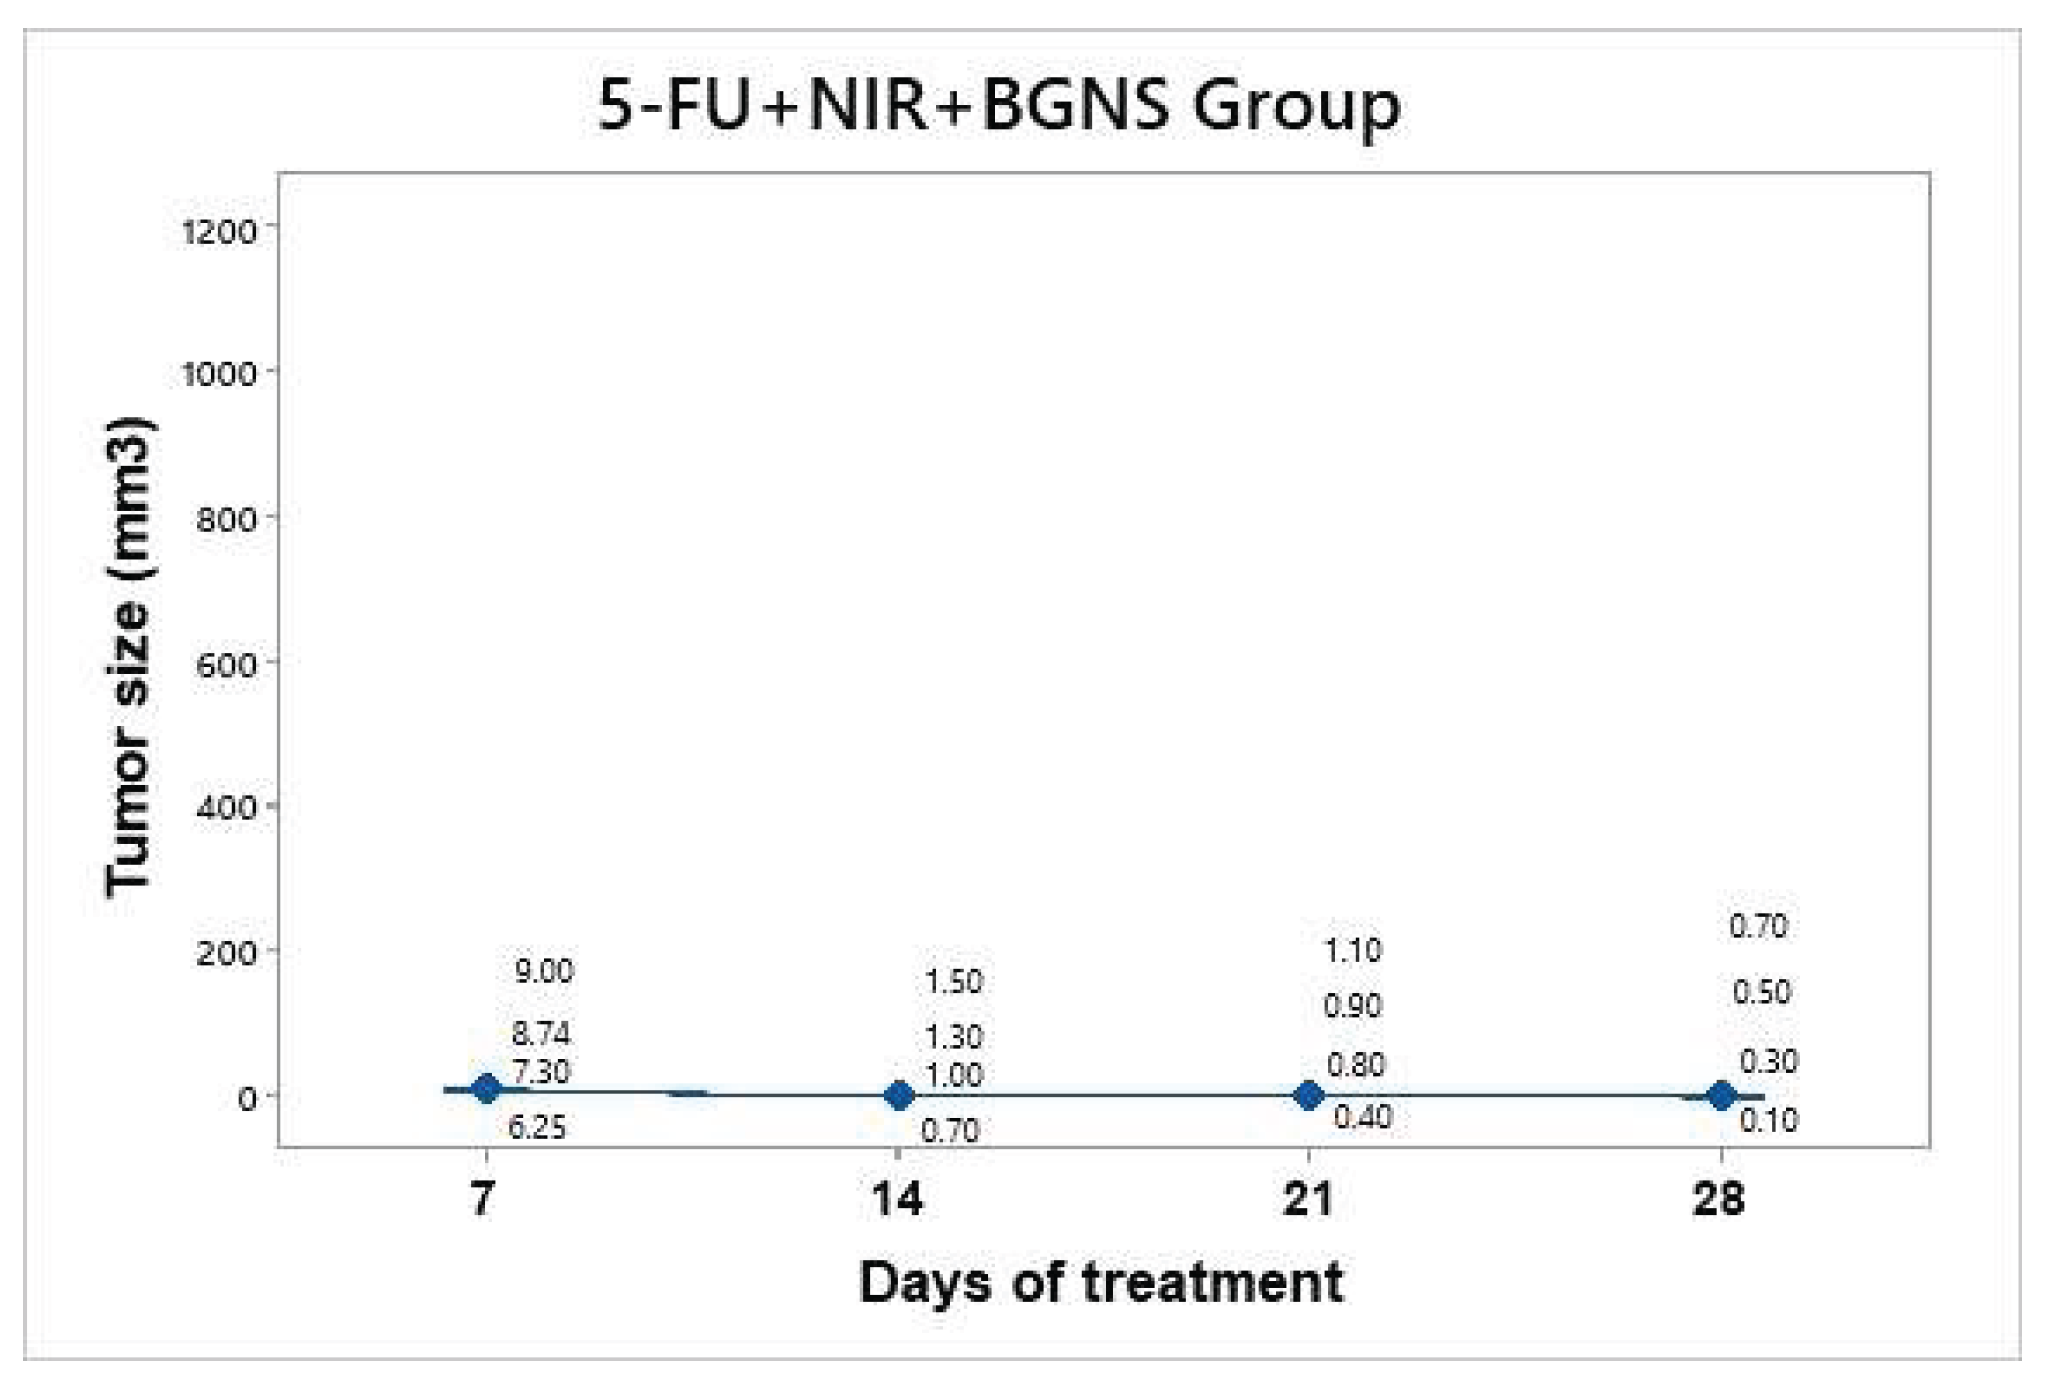
Figure 13.
Comparison of tumor volume progression across all treatment groups over 28 days. The control group exhibited exponential tumor growth, reaching an average of 1010 mm³. The NIR-only group presented moderate growth (472 mm³), whereas the BGNS + NIR group initially presented a reduced tumor size but later presented regrowth (303 mm³). The 5-FU group maintained a steady growth curve, with a final average of 142 mm³. In contrast, in the combined treatment group, 5-FU + BGNS + NIR had the most significant therapeutic effect, with the tumor volume reduced to 0.4 mm³. The data points represent individual tumor measurements, and the means are shown with 95% confidence intervals. This figure highlights the superior efficacy of combined chemo-photothermal therapy.
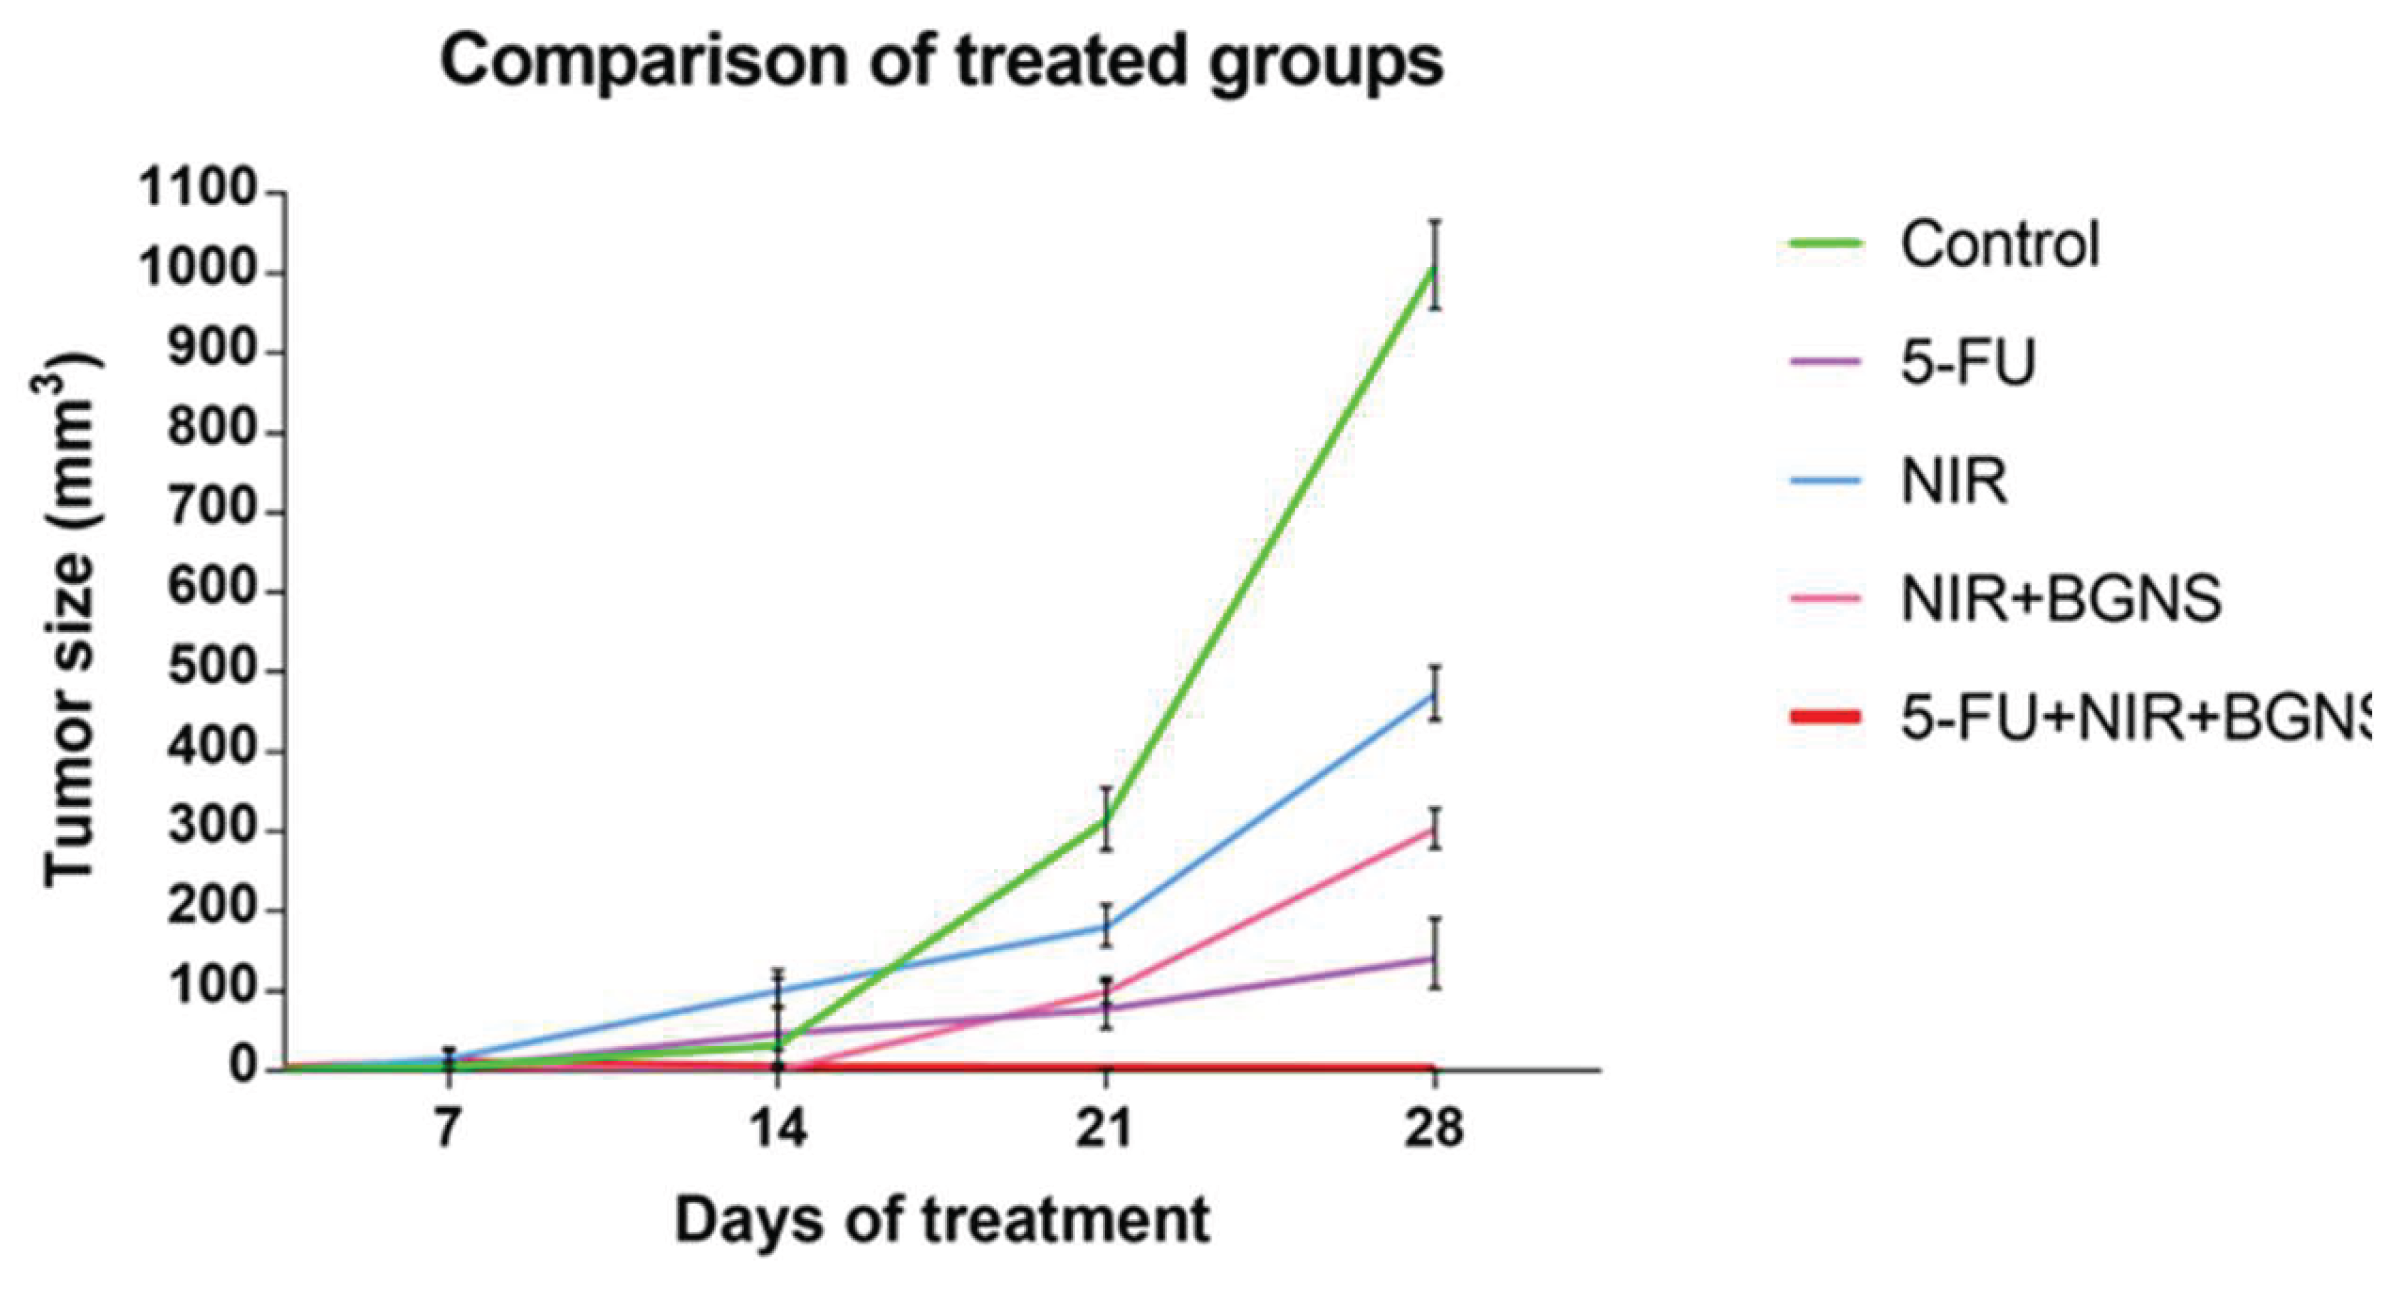
Figure 14.
Visual comparison of tumor size between the control group and the complete treatment group (5-FU + BGNS + NIR) at days 7, 14, 21, and 28. The images revealed progressive and uncontrolled tumor growth in the control group, whereas there was marked tumor regression and near-complete disappearance in the combined therapy group. These representative images support quantitative data and highlight the therapeutic efficacy of the chemo-photothermal approach.
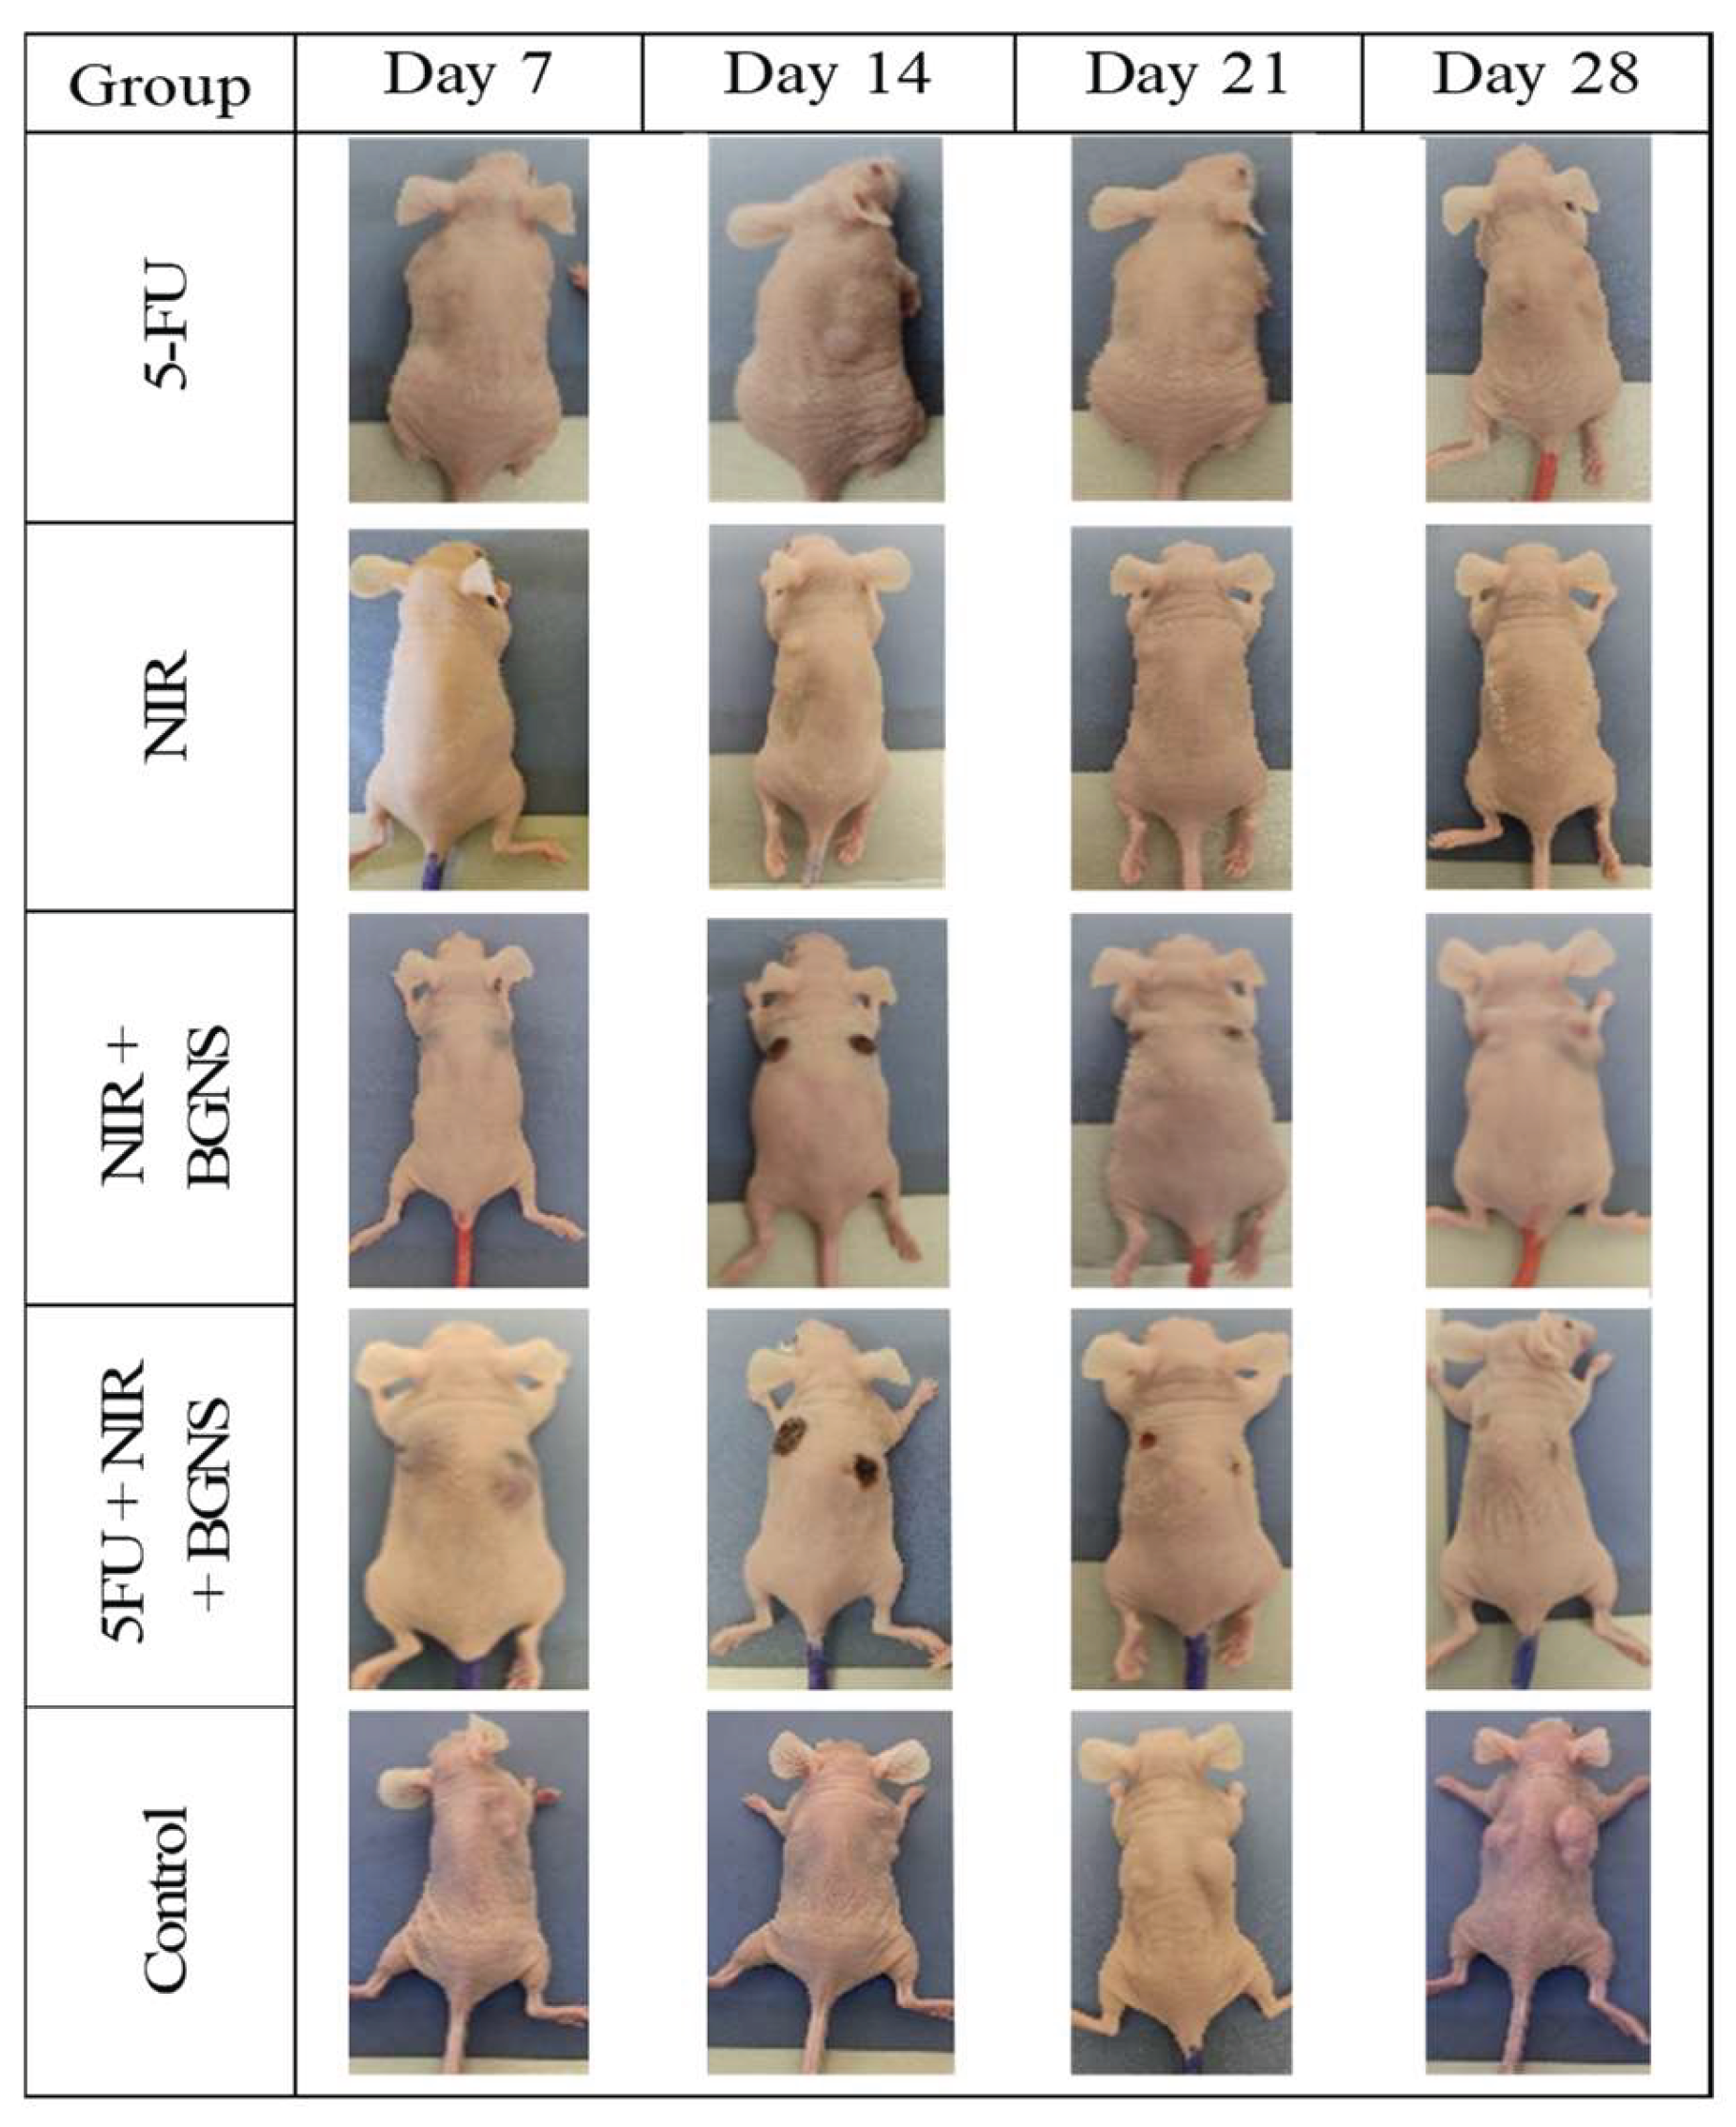

Table 1.
Hydrodynamic diameter and Z-potential of PLGA precursors and pegylated BGNS. The results are reported as mean ± standard deviation.
Table 1.
Hydrodynamic diameter and Z-potential of PLGA precursors and pegylated BGNS. The results are reported as mean ± standard deviation.
| Sample | Hydrodynamic diameter (nm)1 | Z-potential (mV)1 |
|---|---|---|
| PLGA NPs | 126.3 ± 7.0 | -12.1 ± 1.7 |
| PLGA-oligochitosan | 160.3 ± 2.5 | +18.5 ± 1.2 |
| PLGA-seeds | 165.9 ± 3.7 | +13.4 ± 1.3 |
| BGNS | 194.5 ± 1.5 | -12.1 ± 0.5 |
1 Mean ± SD.
Disclaimer/Publisher’s Note: The statements, opinions and data contained in all publications are solely those of the individual author(s) and contributor(s) and not of MDPI and/or the editor(s). MDPI and/or the editor(s) disclaim responsibility for any injury to people or property resulting from any ideas, methods, instructions or products referred to in the content. |
© 2025 by the authors. Licensee MDPI, Basel, Switzerland. This article is an open access article distributed under the terms and conditions of the Creative Commons Attribution (CC BY) license (http://creativecommons.org/licenses/by/4.0/).
Copyright: This open access article is published under a Creative Commons CC BY 4.0 license, which permit the free download, distribution, and reuse, provided that the author and preprint are cited in any reuse.


