
Submitted:
28 June 2025
Posted:
30 June 2025
You are already at the latest version
Abstract
This study investigates the financial impact of Environmental, Social, and Governance (ESG) performance in the global Critical Raw Materials (CRM) sector. Using a sample of 25 publicly listed CRM firms from 2018 to 2024, companies were segmented into "Laggard," "Improver," and "Leader" portfolios based on ESG risk ratings. A multi-method framework was applied, combining multivariate panel regressions, time-series models (GARCH, VAR), and machine learning (LASSO) to disentangle the financial effects of the E, S, and G dimensions. The research challenges the monolithic view of ESG performance by testing for non-linear, portfolio-dependent relationships between sustainability indicators and stock returns in a strategically vital industry. Results reveal a significant “ESG tug-of-war” among Improver firms: while markets reward social performance, they appear to penalize environmental and governance initiatives, likely due to transition-related costs. In contrast, ESG impacts for Laggard and Leader firms are statistically insignificant, suggesting either market indifference or fully priced-in performance. These findings offer a nuanced framework for understanding the conditional financial materiality of ESG. They have direct implications for investment strategies, sustainability reporting, and policy formulation in resource-intensive sectors navigating the energy transition.
Keywords:
ESG investing
; critical raw materials
; financial performance
; panel regression
; fama-french model
; sustainable finance
; stock market efficiency
; machine learning
; environmental economics
; energy transition
1. Introduction
The global imperative to transition toward a low-carbon economy has catalyzed a significant reconfiguration of industrial priorities, creating an unprecedented demand for critical raw materials (CRMs) like lithium, cobalt, and rare earth elements [1]. As foundational inputs for green technologies such as electric vehicles (EVs) and renewable energy systems, these materials have become central to sustainable development [2,3,4,5,6,7]. This heightened demand, however, has also brought to light the significant vulnerabilities in CRM supply chains and magnified the environmental, social, and governance (ESG) risks tied to their extraction and refinement [8,9,10,11,12].
The global shift away from fossil fuels places CRMs at the nexus of technological advancement and resource security [1,5]. The proliferation of lithium-ion batteries, which are vital for both EVs and grid-scale energy storage, is particularly dependent on a stable supply of metals such as lithium, cobalt, and nickel [9,10,13,14,15]. The processes involved in sourcing these materials are often associated with considerable environmental externalities, including high levels of energy and water use, alongside significant waste production [4,16,17]. Concurrently, social considerations—from ensuring the welfare of local communities and upholding ethical labor standards (e.g., addressing the “blood cobalt” issue in artisanal mining [18]) to maintaining a “social license to operate”—have emerged as financially material concerns for the industry [19,20]. Furthermore, strong governance, including transparency and regulatory adherence, is a key determinant of operational stability and investor appeal [8,12,20,21]. In response, international policy measures like the EU Critical Raw Materials Act (CRMA) have been established to enhance supply chain resilience and mandate responsible sourcing protocols [1,15,21].
While investors and corporations increasingly acknowledge the strategic relevance of ESG criteria, the empirical linkage between ESG credentials and financial outcomes is often ambiguous and debated [22]. A substantial portion of existing research approaches ESG as a single, aggregated metric, which can mask the distinct and sometimes opposing effects of its individual Environmental, Social, and Governance components. This monolithic perspective may overlook non-linear dynamics and lead to generalized conclusions that are not universally applicable, thereby risking the formulation of ineffective investment and corporate sustainability strategies.
This research aims to fill a significant gap in the literature by deconstructing the ESG construct. It investigates the separate financial impacts of the Environmental (E), Social (S), and Governance (G) pillars and examines whether the market’s response to ESG performance is non-linear across the global critical raw materials sector. Inspired by recent studies indicating that ESG valuation is context-dependent in related industries like automotive manufacturing [23], this work applies a more granular lens to the foundational CRM sector.
A key innovation of this study is the segmentation of firms into performance-based tiers—low ESG risk “leaders,” mid-range “improvers,” and high ESG risk “laggards”—to test the hypothesis that the market’s valuation of sustainability is conditional on a firm’s ESG maturity. To achieve this, the study integrates traditional econometric panel models with a suite of advanced analytical tools, including machine learning (LASSO, DNN, LSTM) and time-series methods (Granger causality, Impulse Response Functions). This multi-methodological approach is designed to provide a more robust and holistic understanding of the complex relationship between sustainability efforts and financial returns. By offering a disaggregated and non-linear analysis, this study presents new and significant information that advances the field beyond studies that have relied on aggregated scores or single-method frameworks.
The principal goal of this research is to disentangle the financial effects of the individual E, S, and G pillars within the global CRM industry. By doing so, the study aims to deliver a more nuanced and practical comprehension of ESG’s influence, guided by these key questions:
RQ1: Does the financial market react to ESG performance uniformly, or does the relationship exhibit non-linearity, varying between ESG leaders, laggards, and “improver” firms?
RQ2: When assessed concurrently, does a company’s Environmental performance demonstrate a distinct impact on stock returns after accounting for Social and Governance factors?
RQ3: Do firms in a transitional phase experience competing financial pressures from their ESG initiatives? Specifically, which ESG pillars influence returns, and in what direction?
RQ4: Is superior ESG performance associated with a consistent financial premium for leading firms, or has the market already incorporated this information into their valuations?
This study is organized into the following sections. First, Section 2 provides a foundation by reviewing relevant theories and literature, thereby highlighting the specific research gap. Next, Section 3 explains the methodology, including data assembly and sample selection. Section 4 is dedicated to presenting the empirical results, with a structure designed to answer each research question sequentially. Following this, Section 5 offers an in-depth discussion of the results, interpreting them within theoretical contexts and exploring their practical applications. The manuscript finishes with Section 6, which summarizes the main conclusions, notes the study’s limitations, and proposes directions for subsequent research.
2. Theoretical Framework and Literature Review
2.1. Literature Search Strategy and Synthesis
The literature review was systematically conducted using keywords such as “ESG and financial performance,” “critical raw materials,” “mining sustainability,” “energy transition,” “circular economy,” “environmental stewardship,” “social license to operate,” “corporate governance,” “decarbonization in mining,” “Scope 1, 2, 3 emissions,” “lithium,” “cobalt,” “nickel,” “rare earth elements,” “ESG data sources,” “panel regression ESG,” “time series ESG,” and “machine learning ESG.” Academic databases, including Scopus, Web of Science, and Dimensions.ai, were primarily utilized to identify relevant peer-reviewed articles, with a particular focus on recent publications (2022-2025) to ensure alignment with contemporary debates in the field [16]. The synthesis aimed to identify foundational theories, common empirical findings, and existing gaps, particularly concerning the disaggregated impact of ESG within the CRMs sector.
2.2. Foundational Theories of Corporate Sustainability
2.2.1. Stakeholder and Legitimacy Theories: The “Why”
Stakeholder theory posits that corporate success is not solely dependent on maximizing shareholder wealth but also on managing relationships with various stakeholders, including employees, customers, suppliers, communities, and regulators [16]. Addressing stakeholder concerns through robust ESG performance can enhance reputation, reduce regulatory and litigation risks, and foster stronger community relations, ultimately contributing to long-term financial stability and a “social license to operate” [19,20]. Legitimacy theory suggests that organizations continuously seek to operate within the bounds and norms of their respective societies to ensure their continued existence. ESG initiatives can be viewed as efforts to align corporate activities with societal expectations, thereby gaining or maintaining legitimacy, which can translate into financial benefits such as increased market acceptance and reduced resistance to operations.
2.2.2. Agency and Resource-Based Theories: The “How”
Agency theory, traditionally focused on the principal-agent problem between shareholders and management, can be extended to explain ESG engagement. Managers may undertake ESG initiatives to reduce agency costs by aligning corporate interests with broader societal values, thereby attracting responsible investors and reducing information asymmetry. Conversely, excessive or poorly managed ESG investments could be viewed as agency costs if they do not directly contribute to shareholder value. Resource-Based View (RBV) theory suggests that superior financial performance stems from firms possessing unique, valuable, rare, inimitable, and non-substitutable resources and capabilities. ESG performance, particularly when integrated into core business models (e.g., through proprietary green technologies or strong community relationships), can be a source of competitive advantage, leading to cost savings, innovation, and enhanced brand equity [16]. These capabilities can act as intangible assets that are difficult for competitors to replicate.
2.3. The Financial Materiality of Sustainability in the Critical Raw Materials Sector: A Review of an Evolving Landscape
The empirical literature on the link between ESG and financial performance is extensive but yields inconsistent results, with studies reporting positive, negative, or neutral relationships. These mixed findings are often attributed to variations in ESG measurement, industry-specificities, methodological approaches, and temporal contexts. To better understand these complexities, this review synthesizes key themes from recent research, focusing specifically on the CRM sector.
First and foremost, the imperative to decarbonize has emerged as a dominant theme. A central focus in recent literature is the drive toward decarbonization within the CRM industry, where studies consistently highlight efforts to adopt renewable energy as a key strategy for mitigating Scope 1 and 2 emissions at operational sites [1,8,18,19]. To reduce their carbon footprint, firms are allocating significant capital to green technologies, which includes shifting to cleaner power sources and implementing more energy-efficient extraction techniques [20,21,22]. Although these initiatives require substantial upfront investment, they are widely regarded as crucial for ensuring long-term operational sustainability and adhering to strengthening climate policies.
Beyond the scope of direct emissions, a considerable area of research is dedicated to holistic environmental management frameworks. These frameworks advocate for comprehensive resource stewardship, including diligent water management, waste minimization, and the adoption of circular economy models designed to extract further value from process residues [9,10,23,24,25,26,27,28,29,30,31,32,33,34,35,36,37]. For the CRM sector, this principle is practically applied through innovative methodologies for lithium-ion battery recycling and the recovery of critical elements from secondary materials like mine waste and saline brines [38,39,40,41,42,43,44,45]. The financial implications of these efforts are threefold, potentially leading to operational cost savings, a reduction in liabilities from regulatory fines, and an enhancement of corporate brand equity.
Complementing these environmental considerations, maintaining a “social license to operate” is identified as a critical, material factor for mining companies [19,20]. Specifically, research increasingly links strong community engagement, transparent governance, and ethical labor practices to reduced project delays, enhanced firm value, and mitigation of social risks such as protests and human rights concerns [18]. Therefore, positive social performance can foster trust, reduce social friction, and contribute to long-term operational stability, particularly in regions sensitive to resource extraction impacts.
Conceptually, these operational efforts reflect a strategic shift from compliance-based ESG to a “value-led” approach where sustainability is integrated into core business models to unlock cost savings and mitigate risks [22]. This involves embedding ESG considerations into strategic planning, capital allocation, and operational decision-making, moving beyond mere reporting to active value creation through intrinsically sustainable practices.
To quantify these efforts, a comprehensive understanding of emissions is crucial for the critical raw materials (CRM) sector. Emissions are categorized into three types: Scope 1 covers direct emissions from company-owned sources like mining fleets; Scope 2 includes indirect emissions from purchased electricity for facilities; and Scope 3 encompasses all other value chain emissions, both upstream and downstream [19,20,30]. Due to the intricate and global nature of CRM supply chains, Scope 3 emissions, such as those from transporting materials or their final use in products, are often the most significant component of a firm’s total carbon footprint, despite being the most difficult to quantify.
However, achieving these ambitious decarbonization and circular economy goals necessitates significant capital investment in greening technologies and infrastructure. This includes adopting renewable energy sources at mine sites, implementing advanced recycling facilities, developing new extraction methods for secondary resources, and improving water management systems [8,9,10,13,21,22,33,38,39,43,44,45]. Consequently, such substantial capital outlays can lead to a “transitional trap,” where firms incur considerable costs in the short-to-medium term for these initiatives, potentially impacting their immediate financial performance. While these investments are crucial for long-term sustainability and resilience, the market’s immediate reaction to these costs, especially for firms undergoing significant transformation, can create downward pressure on returns. This phenomenon, in particular, can explain a potential negative relationship between environmental or governance improvements and short-term financial returns for “improver” firms.
In summary, while the existing literature acknowledges the multifaceted nature of ESG, few studies have systematically investigated how financial markets differentiate between E, S, and G pillars across distinct ESG performance profiles (leaders, improvers, laggards), particularly within a sector as strategically vital and environmentally sensitive as critical raw materials. Prior research often assumes a linear relationship or a uniform effect across all firms. Therefore, this study’s key contribution lies in revealing the non-linear, disaggregated financial impact of E, S, and G, pinpointing where the “green premium” (or penalty) truly exists. By applying a multi-methodological approach that combines econometric rigor with machine learning’s predictive power, this research offers a granular understanding of how ESG initiatives translate into market returns. Ultimately, this specificity is crucial for stakeholders in the CRM sector, enabling more targeted and effective sustainability strategies and investment decisions, thereby promoting the connection between theory and practice and contributing to solutions for contemporary societal challenges related to the energy transition.
3. Methodology
3.1. Data Sources and Sample Construction
The study leverages a comprehensive dataset of global critical raw materials companies, specifically selected for their primary involvement in the exploration, extraction, processing, or recycling of materials deemed critical for the energy transition (e.g., lithium, cobalt, nickel, rare earth elements). Daily stock price data were collected using the Python yfinance library, from which daily excess returns were computed as the dependent variable. Excess returns are calculated by subtracting the daily risk-free rate (proxied by the 3-month Treasury bill rate) from the company’s daily stock return. This choice of dependent variable is standard in financial performance studies, isolating returns attributable to firm-specific factors and ESG performance beyond general market movements.
ESG scores (Environmental, Social, Governance, and composite ESG) were triangulated from multiple leading data providers, including Bloomberg, Refinitiv (LSEG), MSCI, and Morningstar ESG Risk Ratings. For the primary sorting criterion, Sustainalytics ESG Risk Ratings were utilized due to their explicit focus on identifying unmanaged ESG risks. It is critical to note that Sustainalytics ESG Risk Ratings operate on a scale where lower scores indicate lower risk and better ESG performance, while higher scores indicate higher risk and worse ESG performance. This interpretation is consistent with established research showing that companies with lower ESG risk scores generally outperform those with higher ESG risk scores [23]. This multi-source approach enhances the robustness and representativeness of the ESG data, mitigating potential biases from relying on a single provider and providing a more holistic assessment of a firm’s ESG performance. Financial control variables, including the Fama-French Five-Factor model factors (Mkt-RF, SMB, HML, RMW, CMA) and the Momentum factor (WML), were sourced to control for well-documented market-level influences on stock returns [23]. The selection of these independent variables is standard in financial economics to capture various dimensions of risk and return, allowing for a more precise estimation of the incremental impact of ESG factors.
The sample comprises 25 companies, carefully chosen to be representative of the global critical raw materials sector. These firms are drawn from diverse geographical locations (e.g., South Korea, USA, France, UK, Canada, Australia, Sweden) and cover various segments of the value chain (e.g., mining, battery materials production, recycling). These companies were categorized into three distinct portfolios based on their historical composite ESG performance, using Sustainalytics ESG Risk Ratings. To test for non-linear effects in the market’s valuation of sustainability, companies were sorted into three distinct portfolios based on their average Sustainalytics ESG Risk Score over the study period, where a lower score indicates better performance. The top-performing firms were assigned to the Low ESG Risk Portfolio (9 companies), representing sustainability “leaders” such as 005930.KS and APTV. Firms in the middle tier were placed in the Medium ESG Risk Portfolio (8 companies), conceptualized as “improvers” in a transitional state and including firms like 1772.HK and JMAT.L. Finally, the poorest performers were grouped into the High ESG Risk Portfolio (8 companies), representing “laggards” like ALTM and LAC. The composition of these portfolios implicitly determines the geographic scope of the study, as the sample includes major global players in the CRM sector, thus ensuring a representative cross-section without an explicit country-level selection criterion.
The analysis is based on daily data collected from 2018 to 2024, with the exact date range constrained by the availability of consistent data across all companies and ESG scores, providing a comprehensive time series for robust analysis. To address incomplete data, a two-pronged strategy was employed. For the panel regression analysis, pairwise deletion was utilized to maintain the integrity of statistical inferences. For the machine learning and time-series models, a forward-fill imputation method was applied to time-dependent variables to maximize the retention of observations without introducing look-ahead bias. Furthermore, to control for the influence of extreme values, financial return data were Winsorized at the 1st and 99th percentiles, a standard technique to mitigate the disproportionate impact of outliers.
3.2. Portfolio Construction and Descriptive Statistics
After collecting and cleaning the data, daily excess returns for each portfolio were calculated by averaging the excess returns of the constituent companies within each ESG tier. This portfolio-level aggregation helps to smooth out idiosyncratic firm-specific noise and better capture the market’s aggregate reaction to ESG performance within each category, a methodology consistent with established portfolio-based studies in financial economics. The Fama-French factors and the momentum factor were subsequently applied at this portfolio level to control for known drivers of stock returns.
Table 1 illustrates the key descriptive statistics for the three constructed portfolios. The “Low ESG Risk” (Leaders) portfolio, comprising nine companies, exhibits the highest volatility, as indicated by a standard deviation of 0.0244, alongside a mean daily excess return of -0.00169. The “Medium ESG Risk” (Improvers) portfolio, with eight companies, shows the lowest volatility (Std. Dev. = 0.0141) and the highest mean daily excess return at -0.00063. The “High ESG Risk” (Laggards) portfolio, also with eight companies, presents a risk-return profile situated between the other two. These initial statistics suggest notable differences in the financial characteristics of firms across the ESG performance spectrum, which the subsequent analysis aims to explore in detail.
3.3. Methodological Framework and Diagnostic Tests
To address the research questions comprehensively and provide both explanatory and predictive insights, this study employs a multi-methodological approach that leverages the distinct strengths of several analytical techniques.
First, Panel Regression Analysis using a Fixed Effects (FE) model is applied to the firm-level data. This approach is particularly suitable for analyzing panel data as it allows for the examination of the contemporaneous relationship between disaggregated ESG pillar scores and excess returns while controlling for unobserved heterogeneity across firms within each portfolio. By incorporating entity-specific effects, the FE model isolates the impact of within-firm changes in ESG scores on returns, which is crucial for understanding the dynamics within “improver” firms without being confounded by static, between-firm differences.
Second, Time-Series Analysis, including Vector Autoregression (VAR), Granger causality tests, and Impulse Response Functions (IRFs), is utilized at the portfolio level. This method is chosen to investigate the dynamic, predictive relationships between ESG performance and returns, explicitly accounting for temporal dependencies. It moves beyond static correlations to analyze predictive power (Granger causality) and the dynamic response to information shocks (IRFs), which is vital for distinguishing between immediate market reactions and the forward-looking pricing of ESG initiatives.
Finally, a suite of Machine Learning Models, including LASSO, Deep Neural Networks (DNN), and Long Short-Term Memory (LSTM) networks, serves as a powerful complement to the econometric methods. LASSO (Least Absolute Shrinkage and Selection Operator) is used for its ability to perform variable selection and regularization, identifying the most relevant predictors. DNNs and LSTMs are employed to capture complex nonlinear relationships and temporal dependencies that traditional linear models might miss. This combination provides both inferential understanding from the econometric models and enhanced out-of-sample predictive power from the ML models, strengthening the overall robustness of the findings.
3.3.1. Panel Model Specification Justification
For the panel regressions, the choice between Pooled OLS, Fixed Effects (FE), and Random Effects (RE) models was determined by standard diagnostic tests to ensure the most appropriate specification. Table 2 summarizes the results of these tests, which were conducted for each of the three portfolios. The F-test for individual effects was first used to compare the Fixed Effects model against a simple Pooled OLS model. The results consistently yielded highly significant p-values (p < 0.001), indicating the presence of significant firm-specific effects and making the Fixed Effects model superior to Pooled OLS.
Subsequently, the Hausman test was performed to decide between the Fixed Effects and Random Effects specifications. The test’s null hypothesis is that the unique errors are not correlated with the regressors, in which case the more efficient Random Effects model is preferred. As shown in Table 2, the Hausman test produced a highly significant p-value, leading to the rejection of the null hypothesis. This result confirms that the unobserved firm-specific effects are correlated with the ESG and financial variables, making the Fixed Effects model the most consistent and appropriate choice for this analysis.
3.3.2. Time-Series Model Diagnostics
Before conducting the time-series analyses (VAR and GARCH), standard diagnostic tests were performed to ensure the underlying assumptions of the models were met. Table 3 presents the representative results of the Augmented Dickey-Fuller (ADF) test for the portfolio-level time series. The tests indicate that the Excess Return and ESG Score series contain a unit root at their levels but become stationary after first differencing (p < 0.01). This I(1) property confirms that a Vector Autoregression (VAR) analysis should be conducted on the differenced data to ensure valid statistical inference.
Furthermore, the presence of autoregressive conditional heteroskedasticity (ARCH effects) was tested using the ARCH-LM test. Table 4 summarizes these results, showing highly significant p-values for all three portfolios. This confirmation of volatility clustering justifies the use of a GARCH(1,1) model as the appropriate specification for modeling the time-varying volatility of portfolio returns. The combined application of these rigorously tested panel regression, time-series, and machine learning models provides a comprehensive and robust framework for addressing the complexities of ESG’s financial impact.
The pervasive presence of ARCH effects (p < 0.05 for all portfolios) indicates that the conditional variance of returns is not constant over time, but rather depends on past squared errors. This necessitates the use of GARCH-type models for accurate volatility modeling within time-series analysis, particularly when conducting Granger causality tests and impulse response analyses, ensuring robust and efficient parameter estimates. The combined application of panel regression, VAR, and machine learning models provides a comprehensive and robust framework for capturing both contemporaneous and predictive relationships, linear and non-linear patterns, and effectively addressing the complexities of ESG’s financial impact in the CRM sector and significantly advancing current knowledge.
4. Empirical Results and Analysis
This section is structured to directly address the research questions posed in the introduction. Each portfolio is analyzed in turn, presenting the combined evidence from the study’s econometric, time-series, and machine learning models.
4.1. Market Indifference and Weak Signals: The Case of High ESG Risk “Laggard” Firms
To investigate how financial markets treat firms with poor sustainability records, this section analyzes the “High ESG Risk” or “Laggard” portfolio. As presented in Table 5, the primary multivariate fixed-effects model shows that the coefficients for E_Score, S_Score, and G_Score are all statistically insignificant (p > 0.10). This indicates that for laggard firms, the market does not assign a significant, immediate financial penalty or reward based on their specific ESG pillar performance.
The time-series analysis, summarized in Table 6, reveals marginal evidence of a predictive relationship, with the Granger causality test yielding a p-value of 0.0808. Although this predictive link is weak, we examine the machine learning results for further insight. The LASSO feature importance plot (Figure 1) shows that ESG-related variables are assigned very small coefficients compared to market factors and lagged returns, indicating they have minimal predictive weight. This is further confirmed by the model performance metrics in Table 7, where the simpler LASSO model performs on par with its more complex counterparts, and the overall predictive power is limited.
For “laggard” firms (High ESG Risk), the market appears largely indifferent to their specific ESG performance levels. While there is weak evidence that significant changes in their ESG profile might be noticed over time, this information is not a primary driver of financial returns compared to traditional risk factors.
4.2. The “Tug-of-War” for Medium ESG Risk “Improver” Firms
The analysis for the “Medium ESG Risk” or “improver” cohort reveals a dramatically different and more complex picture, directly addressing RQ2 and RQ3. As presented in the multivariate regression in Table 8, a highly significant negative relationship is found for the E_Score (p<0.001) and G_Score (p<0.001), which contrasts sharply with a significant positive relationship for the S_Score (p<0.01). This finding indicates that for this transitional group, the market simultaneously penalizes the perceived costs of environmental and governance initiatives while rewarding the benefits of strong social performance.
The time-series analysis in Table 9 strongly supports this dynamic relationship, showing a highly significant Granger causality p-value of 0.0003. This confirms that ESG news is a powerful predictive signal for this group. The Impulse Response Function, visualized in Figure 2, reveals the direction of this effect. A positive shock to the composite ESG score (an improvement) leads to a statistically significant negative return in the short-term, consistent with the “transitional trap” hypothesis, where markets initially react to the costs of ESG investments.
The highly significant Granger causality result (p = 0.0003) indicates a strong predictive link from composite ESG scores to returns for this portfolio, much stronger than for the High ESG Risk cohort. This suggests that changes in ESG performance for “improver” firms contain valuable information for predicting future stock movements.
The heightened relevance of ESG for this cohort is further confirmed by the machine learning results. The LASSO model achieves its best predictive performance for this portfolio (RMSE = 0.0141), as shown in Table 10. Crucially, the feature importance plot (Figure 3) shows that E_Score, S_Score, and G_Score are all selected as key predictors, with signs that align perfectly with the multivariate regression findings, validating the “tug-of-war” phenomenon.
The LASSO model achieves its best overall predictive performance on this portfolio (RMSE = 0.014078), significantly outperforming the High ESG Risk portfolio. This suggests that ESG variables possess meaningful predictive power for medium-ESG risk firms.
For “improver” firms (Medium ESG Risk), ESG is not monolithic. The market simultaneously penalizes the costly activities associated with environmental and governance improvements while rewarding the tangible benefits of strong social performance, creating a significant “ESG tug-of-war.” This dynamic is both statistically significant and predictive.
4.3. The “Priced-In” Premium: The Case of Low ESG Risk “Leader” Firms
Finally, the analysis of the “Low ESG Risk” or “leader” portfolio addresses RQ4. As shown in the multivariate regression results in Table 11, there are no statistically significant coefficients for any of the ESG pillars. This suggests that for firms already recognized as sustainability leaders, there is no additional, contemporaneous financial premium associated with their ESG scores beyond what is already captured by standard risk factors.
This conclusion is reinforced by the time-series and machine learning results. Table 12 shows no evidence of Granger causality (p = 0.1373), and the LASSO feature importance plot (Figure 4) confirms that the model discards all ESG-related variables, assigning them zero predictive weight. The predictive accuracy of the models is also weakest for this cohort (Table 13), suggesting their returns are the most informationally efficient.
For “leader” firms (Low ESG Risk), their ESG excellence appears to be fully “priced-in” by the market. This supports the efficient market hypothesis, where known positive attributes no longer offer a source of predictable excess returns.
4.4. Comparative Analysis of Predictive Models
To provide a final, comprehensive view of the dynamic effects, this section revisits the portfolio that exhibited marginal but significant Granger causality but was not explored with an IRF plot in its main section: the Low ESG Risk Portfolio. Although the primary finding for “leaders” is that ESG is priced-in, the Granger test (p=0.08) suggests some residual predictive information might exist.
Figure 5 visualizes the Impulse Response Function for this portfolio. The plot shows that a positive ESG shock leads to a statistically insignificant response across the ten-day horizon, as the confidence interval consistently includes zero. This result refines the Granger causality finding, demonstrating that while a weak statistical link may be present, it does not translate into a predictable, economically significant market reaction for leader firms. This reinforces the overall conclusion that ESG information is most relevant and actionable for the “improver” cohort.
5. Discussion
The multi-faceted analysis of ESG’s financial impact in the global critical raw materials sector profoundly reshapes the understanding of the ESG-financial performance link. Moving beyond a simplistic monolithic view, the findings highlight a nuanced, non-linear relationship where market reactions to ESG performance are highly contingent on a firm’s position on the sustainability spectrum. This reveals a “two-speed” market that rewards and penalizes distinct ESG dimensions for different cohorts, offering new and significant information to the broader field.
5.1. Summary of Research Question Answers
The empirical results provide clear and direct answers to the posed research questions, collectively demonstrating a non-uniform and complex market valuation of ESG performance within the critical raw materials sector:
RQ1: Does the financial market react to ESG performance uniformly, or does the relationship exhibit non-linearity, varying between ESG leaders, laggards, and “improver” firms?
The financial market’s reaction to ESG performance is decidedly non-uniform and exhibits significant non-linearity across different ESG maturity tiers, thereby establishing a “two-speed” market. For High ESG Risk “laggard” firms (those with poorer sustainability standing), both the contemporaneous (Table 5) and predictive (Table 6, Figure 1) analyses indicate a negligible financial impact from their ESG performance. The market appears largely indifferent to their poor sustainability standing, with traditional financial factors primarily driving returns (Table 7). In stark contrast, for Medium ESG Risk “improver” firms, ESG factors exert a powerful and complex influence (Table 8 and Table 9). Finally, for Low ESG Risk “leader” firms (those with superior sustainability performance), while their ESG excellence is undeniable, it does not translate into an additional financial premium; their superior sustainability appears to be largely priced-in by the market (Table 11 and Table 12, Figure 4), leading to lower predictability from ESG metrics (Table 13, Figure 5).
RQ2: When assessed concurrently, does a company’s Environmental performance demonstrate a distinct impact on stock returns after accounting for Social and Governance factors?
Yes, when assessed concurrently and controlling for Social and Governance factors, a company’s Environmental performance demonstrates a distinct impact on stock returns, particularly for “improver” firms. For companies in the Medium ESG Risk portfolio, the multivariate panel regression (Table 8) reveals a statistically significant negative relationship between E_Score and excess returns (coefficient: -0.0007, p<0.001). This finding is pivotal, indicating that the market concurrently penalizes the perceived costs or challenges associated with environmental improvements for firms undergoing transition, even while controlling for other ESG aspects.
RQ3: Do firms in a transitional phase experience competing financial pressures from their ESG initiatives? Specifically, which ESG pillars influence returns, and in what direction?
Indeed, firms in a transitional phase (the “improver” cohort) experience significant and competing financial pressures from their ESG initiatives, characterized by a distinct “tug-of-war” effect. As shown in Table 8, Environmental (E_Score, coefficient: -0.0007, p<0.001) and Governance (G_Score, coefficient: -0.0029, p<0.001) improvements are associated with negative impacts on stock returns. This suggests that the market is sensitive to the substantial upfront costs and potential disruptions involved in significant environmental upgrades and governance reforms. Conversely, Social (S_Score, coefficient: +0.0027, p<0.01) performance for these firms is associated with a statistically significant positive impact on returns. This indicates that while the market penalizes the costs of E and G initiatives, it simultaneously rewards the tangible benefits of strong social performance. This dynamic is further reinforced by the strong predictive power of ESG metrics for this cohort, as evidenced by the highly significant Granger causality (Table 9) and the prominence of E, S, and G scores in the LASSO feature importance (Figure 3).
RQ4: Is superior ESG performance associated with a consistent financial premium for leading firms, or has the market already incorporated this information into their valuations?
Superior ESG performance for leading firms is generally not associated with a consistent, additional financial premium. The evidence strongly suggests that for Low ESG Risk “leader” firms, their excellence in sustainability has largely been incorporated or “priced-in” by the market into their valuations. This is evident from the lack of statistically significant coefficients for E_Score, S_Score, or G_Score in the multivariate panel regression (Table 11), indicating no contemporaneous alpha from ESG. Furthermore, the time-series analysis shows no predictive power (Granger causality p = 0.1373, Table 12), and machine learning models entirely discard ESG variables as predictive features (Figure 4). The weakest predictive accuracy for this cohort (Table 13, Figure 5) implies that returns are highly efficient, with ESG information already factored into prices, leaving little room for further gains based on known sustainability credentials.
5.2. The “Transitional Trap”: Interpreting the Medium ESG Risk Portfolio Anomaly
The most striking finding, the complex “tug-of-war” observed within the Medium ESG Risk portfolio, directly addresses RQ3 and RQ2, and significantly enriches the dialogue on ESG-financial performance. For these “improver” firms, robust environmental (E) and governance (G) performance are associated with statistically significant negative financial returns, while strong social (S) performance drives positive returns. This phenomenon can be conceptualized as a “transitional trap,” where the market actively penalizes the substantial capital investments and operational costs incurred during significant “greening technology” adoption and profound governance reforms [16,21,25,26,30].
From an Agency Theory perspective, these initial costs for E and G improvements, such as investing in renewable energy infrastructure at mine sites or implementing new, transparent supply chain auditing systems, represent a significant financial outflow. While these are long-term strategic investments, the market, particularly in the short-to-medium term, might interpret them as immediate drains on profitability or a necessary correction for past inefficiencies, rather than immediately value-additive changes. This is distinct from, for example, a firm investing in a new profitable product line. For governance, exposing and rectifying historical deficiencies (e.g., in anti-corruption or human rights due diligence) might reveal previously unpriced liabilities, leading to a negative market reaction as these risks become transparent.
Conversely, the significant positive impact of Social (S) performance for these “improver” firms is consistent with Stakeholder and Legitimacy Theories. In the CRM sector, maintaining a robust “social license to operate” is paramount [19,20]. Strong social performance, including effective community engagement, ethical labor practices, and transparent communication, directly contributes to risk mitigation by reducing operational disruptions, project delays, and the likelihood of costly legal challenges or reputational damage [18]. These are immediate, tangible benefits that the market appears to recognize and reward, often offsetting some of the negative pressures from environmental and governance-related costs. For instance, a firm that proactively addresses community concerns around water usage or secures fair labor agreements may experience fewer operational stoppages, translating directly into enhanced financial performance. The “improver” category thus represents a crucial inflection point where the market begins to actively price the complexities of ESG transition.
5.3. Market Efficiency, Information Content, and a Sector-Specific Anomaly
The distinct market reactions across the ESG performance cohorts, which address RQ1 and RQ4, offer compelling insights into the efficiency of financial markets in pricing ESG information within the CRM sector. For High ESG Risk “laggard” firms, the observed lack of a significant contemporaneous or predictive link between their ESG performance and returns suggests that the market largely disregards their sustainability standing. This aligns with a Legitimacy Theory perspective, where the efforts of entrenched laggards may be too minimal to shift investor perception or are not yet considered financially material, causing the market’s focus to remain on traditional Fama-French risk factors.
In stark contrast, for Low ESG Risk “leader” firms, the absence of a discernible financial premium points toward a highly efficient market, consistent with the Efficient Market Hypothesis. Widespread knowledge of their strong ESG performance appears to be fully “priced-in,” leaving no room for ESG-based alpha. From a Resource-Based View, these firms have already transformed their sustainability capabilities into an intangible asset, meaning further marginal improvements yield diminishing returns in terms of stock price appreciation. This notion of market efficiency is further supported by the weaker predictive accuracy of machine learning models for this cohort, as shown in Table 13 and Figure 4, where readily available ESG information offers little predictive power.
However, this study uncovers a notable contradiction that highlights the unique dynamics of the CRM industry. Contrary to the general literature, which suggests that lower-risk ESG firms outperform their higher-risk counterparts [23], the descriptive statistics in Table 1 show that the “Laggard” portfolio experienced less negative mean daily excess returns (-0.00094) than the “Leader” portfolio (-0.00169). This apparent anomaly can be explained by several sector-specific factors. The CRM sector’s high capital intensity and long project lead times may mean that leaders are currently bearing the heavy short-term costs of “green investments” that depress immediate returns. Furthermore, the performance of all firms in this sector is heavily influenced by volatile commodity price cycles, which can temporarily mask the underlying benefits of a leader’s superior risk management or the inherent risks of a laggard.
This phenomenon could also be attributed to a “first-mover disadvantage,” where leaders incur the initial costs of developing and implementing sustainable practices, or to higher operational costs associated with maintaining ethical and resilient supply chains in geopolitically sensitive regions. Consequently, for leaders in a high-risk sector like CRMs, the primary financial benefit of superior ESG performance may not be immediate alpha generation but rather long-term risk mitigation, such as better access to capital, lower insurance premiums, or fewer operational disruptions from regulatory or social challenges. The lower volatility observed in the “Improver” portfolio compared to the “Leader” portfolio (Table 1) hints that the market may value the stability of a managed transition over the high-cost, high-volatility profile of some leading firms. This apparent contradiction, therefore, does not invalidate the importance of ESG but instead reinforces the study’s core argument: ESG’s financial impact is non-linear and highly context-dependent, especially in a complex, capital-intensive industry like critical raw materials.
5.4. Reconciling Econometric and Machine Learning Evidence
The multi-methodological approach employed in this study, combining panel regression, time-series analysis, and machine learning models, significantly strengthens the findings and explicitly articulates how this paper advances current knowledge. Panel regressions provide robust causal inferences regarding the contemporaneous relationships between individual ESG pillars and returns, effectively controlling for unobserved firm-specific heterogeneity. This allows for precise identification of the “tug-of-war” phenomenon in the Medium ESG Risk cohort. Time-series Granger causality tests and impulse response functions then reveal dynamic, predictive relationships, illustrating how specific ESG shocks propagate through returns over time. The highly significant Granger causality for “improver” firms (Table 9) confirms that their ESG data contains valuable forward-looking information.
Machine learning models, particularly LASSO feature importance (Figure 1, Figure 3 and Figure 4), offer a crucial complementary lens. While econometric models excel at explaining why a relationship exists, ML models are powerful in identifying what variables are most predictive and capturing complex, often non-linear, patterns that traditional linear models might overlook. The fact that LASSO actively selects and assigns significant coefficients to ESG pillars for the “improver” cohort (Figure 3), while discarding them for “laggards” and “leaders” (Figure 1 and Figure 4), provides strong corroborating evidence for the non-linear, context-dependent nature of ESG impact. The varying RMSE across portfolios (Table 7, Table 10 and Table 13) and the visual representation in Figure 5 further highlight that the predictive power of ESG metrics is not uniform but is most pronounced for the Medium ESG Risk “improver” cohort. This integration of inferential econometrics with predictive machine learning offers a holistic and compelling narrative, providing deeper insights than could be achieved by relying on a single analytical approach, thereby significantly advancing the understanding of ESG-financial performance dynamics.
5.5. Implications for Theory and Practice
The findings carry profound implications for corporate strategy, investment decisions, and policymaking in the critical raw materials sector, firmly promoting the connection between theory and practice.
5.5.1. Implications for Investors and Asset Managers
For investors and asset managers, the study emphatically suggests that a simplistic, monolithic approach to ESG investing is suboptimal and potentially misleading. True alpha generation opportunities and effective engagement are most likely to be found within the Medium ESG Risk “improver” cohort. These firms represent a fertile ground where ESG performance still carries significant, complex, and actively priced informational content. Astute investors could potentially benefit by identifying and actively investing in firms that are making genuine, impactful (though potentially costly in the short-term) environmental and governance improvements, while simultaneously prioritizing and excelling in social performance. This necessitates a granular, pillar-by-pillar analysis of ESG data, moving beyond aggregated scores, to identify specific areas of strength and weakness and to understand their distinct financial implications. For Low ESG Risk leaders, the investment focus might shift from seeking additional alpha to risk mitigation, long-term value preservation, and strategic alignment, especially given the observed short-term return anomaly in this sector; their ESG premium may already be realized in terms of lower cost of capital or enhanced resilience, rather than immediate stock outperformance. For High ESG Risk laggards, passive screening may lead to missed opportunities for driving systemic change; active engagement and stewardship might be necessary to induce meaningful improvements, as market mechanisms alone appear insufficient to exert immediate financial pressure.
5.5.2. Implications for Corporate Strategy in the CRM Sector
Corporate managers in the critical raw materials sector must adopt a differentiated and highly strategic ESG approach tailored to their firm’s current sustainability maturity level.
For “Improvers” (Medium ESG Risk): The immediate negative market reaction to E and G improvements (the “transitional trap”) underscores the critical need for robust and transparent communication with investors. Firms must articulate a clear long-term value proposition for these investments, demonstrating how “greening technologies” (e.g., advanced recycling processes, carbon capture, water treatment solutions) and robust governance reforms will lead to future cost savings, enhanced operational efficiency, reduced regulatory burdens, superior risk management, and a differentiated competitive advantage [9,10,23,24,25,26,27,28,29,30,31,32,33,34,35,38,39,40,41,42,43,44,45]. Simultaneously, continued and visible investment in social performance, encompassing community engagement, fair labor conditions, and human rights due diligence, is paramount. This consistent social commitment is crucial for maintaining the social license to operate, mitigating immediate operational risks, and unlocking tangible benefits that the market actively rewards [18,19,20].
For “Laggards” (High ESG Risk): These firms face a dual challenge: limited market recognition of any nascent ESG efforts and exposure to significant long-term risks if they fail to improve. Their strategic focus should be on implementing foundational ESG improvements, aiming to move into the “improver” category. This involves establishing basic environmental management systems, addressing critical social risks, and strengthening core governance structures to begin building legitimacy and demonstrating commitment to sustainability.
For “Leaders” (Low ESG Risk): While their ESG premium may be priced-in (or even facing short-term return challenges in this unique sector), continuous innovation and transparent communication of new sustainability achievements are vital to maintain their leading position and prevent erosion of investor confidence. These firms should leverage their strong ESG credentials as a source of competitive advantage, attracting premium talent, fostering innovation, and accessing preferential financing, thereby solidifying their intangible assets derived from ESG excellence, even if immediate stock returns do not always reflect a direct premium.
5.5.3. Implications for Policymakers (e.g., EU Critical Raw Materials Act)
The findings provide compelling evidence that validates and informs policy initiatives like the EU Critical Raw Materials Act (CRMA) [1,15,21], which aim to promote sustainable sourcing and processing of CRMs. The market’s active pricing of environmental and governance transitions for “improver” firms suggests an inherent financial incentive for change. Policymakers should strategically design mechanisms to alleviate the “transitional trap” for these critical firms. This could involve targeted financial incentives (e.g., green bonds, tax breaks for sustainable investments), supportive regulatory frameworks that recognize the upfront costs and long-term benefits of deep sustainability transformations, or public-private partnerships that de-risk green technology adoption. For instance, incentives for investing in advanced battery recycling infrastructure, promoting responsible mining practices, or fostering ethical supply chains could accelerate the transition, ensuring a secure and sustainable supply of CRMs vital for the energy transition [23,26,27,28,29,31,32,33,34,35,38,39,40,41,42,43,44,45,46,47]. Policymakers should also consider the broader geopolitical implications of critical raw material supply chains, as highlighted by the imperative for secure and sustainable access to these materials [8,12].
6. Conclusion
This study embarked on a comprehensive journey to resolve the “ESG puzzle” within the global critical raw materials sector by employing a robust, multi-faceted analytical framework. The findings unequivocally demonstrate that the relationship between ESG and financial performance is not a simple linear function but is highly nuanced and critically dependent on a firm’s position along the sustainability spectrum.
6.1. Summary of Answers to Research Questions
RQ1: Financial markets exhibit a non-linear relationship with ESG performance. They do not uniformly reward or penalize ESG. Instead, the market’s reaction differs significantly across ESG leaders, laggards, and “improver” firms, indicating a “two-speed” market [22].
RQ2: When controlling for Social and Governance factors, a firm’s Environmental performance within the “improver” cohort has a statistically significant negative impact on stock returns. This suggests that the market actively prices the short-term costs associated with environmental improvement initiatives.
RQ3 (Medium ESG - The Improvers): For firms in a transitional phase, ESG initiatives indeed create competing financial pressures. The market penalizes the costly activities linked to environmental and governance improvements, while simultaneously rewarding the tangible benefits derived from strong social performance. This creates a distinct “ESG tug-of-war.”
RQ4 (High ESG - The Leaders): Firms demonstrating leading ESG performance do not appear to earn a consistent, additional financial premium. Their ESG excellence is largely “priced-in” by the market, implying that their superior sustainability credentials are already factored into their valuations, leading to less predictable returns from ESG metrics alone.
The key contribution of this research is the precise identification and empirical validation of this “two-speed” market [22]. For High ESG Risk laggards and Low ESG Risk leaders, the direct link between disaggregated ESG metrics and stock returns appears less pronounced or already incorporated. However, for the crucial cohort of Medium ESG Risk “improver” firms, those actively navigating the complexities of sustainability transition, ESG is a powerful, multi-dimensional driver of financial outcomes. The analysis clearly illustrates that the market imposes penalties for environmental and governance weaknesses (or the necessary costs of addressing them), while concurrently rewarding strengths in the social dimension. This complex dynamic in the CRM sector even presents a deviation from the general literature, where leading ESG firms do not always outperform laggards in terms of mean returns, suggesting that ESG benefits might manifest as reduced risk or long-term resilience rather than immediate alpha in this capital-intensive and geopolitically sensitive industry.
These empirically validated results offer significant practical implications. For corporate managers in the CRM sector, the study provides a clear financial imperative for strategic investments in greening technologies and robust governance structures, particularly as these efforts are actively priced by the market during a firm’s transitional phase. For investors, the findings suggest that opportunities for alpha generation and effective engagement are most likely to reside within this dynamic middle tier of ESG performers. Finally, for policymakers, this research provides vital market-based validation for initiatives like the CRMA [1,15,21], demonstrating that market mechanisms themselves provide a powerful incentive for firms to enhance their sustainability credentials and contribute to a more resilient critical raw materials supply chain. The study thus creates new knowledge that not only makes a significant theoretical contribution by refining the understanding of ESG-financial linkages but also contributes directly to developing solutions for the great challenges faced by organizations and contemporary society in accelerating a responsible and sustainable energy transition.
6.2. Limitations of the Study
Despite its robust methodology, this study has inherent limitations. The reliance on publicly available ESG scores, while triangulated from multiple providers to enhance robustness, still reflects the inherent biases and varying methodologies of these rating agencies. The sample size, while carefully selected to be representative of major global CRM players, is constrained by the availability of consistent and comprehensive ESG data across all firms over the study period. Furthermore, the analysis primarily focuses on equity market returns, and other important financial impacts, such as the cost of debt, credit ratings, or long-term capital expenditure efficiency, are not explicitly modeled. The daily frequency of data, while offering granularity for capturing short-term market reactions, might not fully capture the longer-term, strategic value creation pathways of ESG initiatives. Finally, the observed short-term return anomaly for Low ESG Risk leaders in the CRM sector, where they did not outperform High ESG Risk laggards in mean returns, warrants further investigation into sector-specific factors and the manifestation of ESG benefits beyond direct stock price appreciation.
6.3. Avenues for Future Research
Future research could extend this framework by incorporating more granular data on specific technology adoption (e.g., the exact investment in CO2-based chemical processes for recycling or novel extraction methods for lithium from brines) to pinpoint the financial impact of specific greening innovations. Analyzing the impact of ESG on a broader spectrum of financial metrics, such as the cost of debt, credit ratings, or long-term capital expenditure efficiency, in addition to equity returns, would provide a more holistic financial perspective. Investigating the moderating role of firm-specific characteristics (e.g., firm size, financial leverage, geographic exposure) on the ESG-returns relationship, particularly for the dynamic “improver” cohort, could yield further nuanced insights. Longitudinal studies explicitly tracking firms as they transition between ESG performance tiers (e.g., from laggard to improver, or improver to leader) would provide invaluable insights into the dynamic nature of market perceptions and the realization of sustainability benefits over time. Finally, complementing quantitative findings with qualitative case studies could offer rich contextual understanding of the on-the-ground challenges and successes of ESG implementation within the complex critical raw materials sector.
Author Contributions
Conceptualization, H.E.O.O.; methodology, H.E.O.O.; software, H.E.O.O.; validation, H.E.O.O.; formal analysis, H.E.O.O.; investigation, H.E.O.O.; resources, H.E.O.O.; data curation, H.E.O.O.; writing—original draft preparation, H.E.O.O.; writing—review and editing, H.E.O.O.; visualization, H.E.O.O.; supervision, H.E.O.O.; project administration, H.E.O.O.; funding acquisition, H.E.O.O.
Funding
This research received no external funding from public, commercial, or not-for-profit agencies.
Data Availability Statement
The Fama-French factor data used in this study are publicly available from the Kenneth French Data Library. The firm-level financial and ESG data are subject to third-party licensing agreements and are not publicly available. The computer code used for the analysis can be made available upon reasonable request to the corresponding author.
Acknowledgments
The author extends gratitude to the faculty and staff of the Department of Economics and Business for their valuable support during the preparation of this manuscript.
Conflict of Interest
The author declares no conflicts of interest.
Abbreviations
| ADF | Augmented Dickey-Fuller |
| ARCH | Autoregressive Conditional Heteroskedasticity |
| CFP | Corporate Financial Performance |
| CMA | Conservative Minus Aggressive (Fama-French Factor) |
| CRM | Critical Raw Material(s) |
| CRMA | Critical Raw Materials Act |
| DNN | Deep Neural Network |
| E | Environmental (Pillar of ESG) |
| ESG | Environmental, Social, and Governance |
| EU | European Union |
| EV | Electric Vehicle |
| FE | Fixed Effects |
| G | Governance (Pillar of ESG) |
| GARCH | Generalized Autoregressive Conditional Heteroskedasticity |
| HML | High Minus Low (Fama-French Factor) |
| IRF | Impulse Response Function |
| LASSO | Least Absolute Shrinkage and Selection Operator |
| LSTM | Long Short-Term Memory |
| ML | Machine Learning |
| RE | Random Effects |
| RMW | Robust Minus Weak (Fama-French Factor) |
| S | Social (Pillar of ESG) |
| SMB | Small Minus Big (Fama-French Factor) |
| VAR | Vector Autoregression |
| WML | Winners Minus Losers (Momentum Factor) |
References
- Priore, R. The Critical Raw Materials Act has been emanated to address perceived risks around supply chains for critical raw materials in light of expected demand growth. Data in Brief 2024, 54, 110320. doi:10.1016/j.dib.2024.110320. [CrossRef]
- Williams, G. D. Z.; Nativ, P.; Vengosh, A. The role of boron in controlling the pH of lithium brines. Sci. Adv. 2025, 11, eadw3268. doi:10.1126/sciadv.adw3268. [CrossRef]
- Kowasch, M.; Batterbury, S. P. J.; Baumann, C.; Melcher, F.; Saxinger, G.; Wilson, E. Not in my backyard? Prospects, problems and perceptions of lithium extraction in Austria. Energy Sustain. Soc. 2025, 15, 21. doi:10.1186/s13705-025-00521-3. [CrossRef]
- Halkes, R. T.; Hughes, A.; Wall, F.; Petavratzi, E.; Pell, R.; Lindsay, J. J. Life cycle assessment and water use impacts of lithium production from salar deposits: Challenges and opportunities. Resour. Conserv. Recycl. 2024, 207, 107554. doi:10.1016/j.resconrec.2024.107554. [CrossRef]
- Srivastava, N. Strengthening European Energy Security and Resilience through Minerals. Eur. Energy Environ. Law Rev. 2024, 33, 35-45.
- Guo, Y. Resolving Critical Raw Materials Supply Crisis With Microwave/RF-Assisted Collection of Seafloor Nodules. IEEE Microw. Mag. 2025, 26, 83-94. doi:10.1109/mmm.2025.3534600. [CrossRef]
- Chesson, W.; Kuenzel, M.; Sankaran, A.; Geaney, H.; Ryan, K.; Passerini, S. Advanced Balancing of Next-Generation Lithium-Ion Batteries: Prelithiation of a-Silicon Nanowires Using Excess Lithium Positive Electrodes. ECS Meet. Abstr. 2022, MA2022-01, 2434-2434.
- Schütte, P.; Vetter, S.; Vasters, J.; Kota, A. C. Production and supply dynamics (2017–2023) associated with artisanal and small-scale mining of critical raw materials in Africa. Resour. Policy 2025, 107, 105659. doi:10.1016/j.resourpol.2025.105659. [CrossRef]
- Zanoletti, A.; Cornelio, A.; Borgese, L.; Siviero, G.; Cinosi, A.; Galli, E.; Bontempi, E. Sample preparation procedures for elemental analysis of critical raw materials in lithium-ion battery black mass: Challenges responding to the supplementary battery recycling regulation. J. Environ. Manag. 2025, 380, 124973. doi:10.1016/j.jenvman.2025.124973. [CrossRef]
- Silva Silveira Camargo, P.; Gomes Osório Torres, G.; Pacheco, J. A. S.; Pilotto Cenci, M.; Kasper, A. C.; Veit, H. M. Mechanical methods for materials concentration of lithium iron phosphate (LFP) cells and product potential evaluation for recycling. Environ. Sci. Pollut. Res. 2024, 1-20. doi:10.1007/s11356-024-34779-5. [CrossRef]
- Lawley, C. J. M.; Haynes, M.; Chudasama, B.; Goodenough, K.; Eerola, T.; Golev, A.; Zhang, S. E.; Park, J.; Lèbre, E. Geospatial Data and Deep Learning Expose ESG Risks to Critical Raw Materials Supply: The Case of Lithium. Earth Sci. Syst. Soc. 2024, 4, 10109. doi:10.3389/esss.2024.10109. [CrossRef]
- Müller, M.; Schulze, M.; Schöneich, S. The energy transition and green mineral value chains: Challenges and opportunities for Africa and Latin America. S. Afr. J. Int. Aff. 2023, 30, 169-175. doi:10.1080/10220461.2023.2230957. [CrossRef]
- Morina, R.; Carena, E.; Pianta, N.; Perona, E.; Ostroman, I.; Mustarelli, P.; Ferrara, C. Phase-separated solvothermal high yields recovery of lithium and cobalt cathode precursors from end-of-life LiCoO2 lithium-ion batteries. J. Environ. Manag. 2024, 370, 122827. doi:10.1016/j.jenvman.2024.122827. [CrossRef]
- Azim, A. A.; Vizzarro, A.; Bellini, R.; Bassani, I.; Baudino, L.; Pirri, C. F.; Verga, F.; Lamberti, A.; Menin, B. Perspective on the use of methanogens in lithium recovery from brines. Front. Microbiol. 2023, 14, 1233221. doi:10.3389/fmicb.2023.1233221. [CrossRef]
- Koese, M.; Parzer, M.; Sprecher, B.; Kleijn, R. Self-sufficiency of the European Union in critical raw materials for E-mobility. Resour. Conserv. Recycl. 2025, 212, 108009. doi:10.1016/j.resconrec.2024.108009. [CrossRef]
- Bielowicz, B. Waste as a Source of Critical Raw Materials—A New Approach in the Context of Energy Transition. Energies 2025, 18, 2101. doi:10.3390/en18082101. [CrossRef]
- Simas, M. S.; Bly, K.; Arega, M. A.; Aponte, F. R.; Silva, T. L.; Wiebe, K. S. Sustainability effects of material demand by next-generation lithium-ion battery technologies: A global value chain perspective. Resour. Conserv. Recycl. 2025, 219, 108294. doi:10.1016/j.resconrec.2025.108294. [CrossRef]
- Umpula, E.; Dummett, M. The Blood Cobalt Narrative: Addressing Human Rights Concerns or Scaremongering? Bus. Hum. Rights J. 2024, 9, 308-314. doi:10.1017/bhj.2024.4. [CrossRef]
- Garcia-Zavala, C.; Ordens, C. M.; Pagliero, L.; Lèbre, É.; Aitken, D.; Stringer, M. An approach for prioritising environmental, social and governance (ESG) water-related risks for the mining industry: The case of Chile. Extr. Ind. Soc. 2023, 14, 101259. doi:10.1016/j.exis.2023.101259. [CrossRef]
- Murguía, D. I.; Obaya, M. Exploring conditions for just lithium mining in South America. The case of the EU responsible sourcing strategy. Environ. Res. Lett. 2024, 19, 124098. doi:10.1088/1748-9326/ad948d. [CrossRef]
- Daw, G. Revising the ‘Economic importance’ dimension: The European framework for critical raw materials, completed and illustrated using lithium. Resour. Policy 2025, 101, 105453. doi:10.1016/j.resourpol.2024.105453. [CrossRef]
- Friede, G.; Busch, T.; Bassen, A. ESG and financial performance: aggregated evidence from more than 2000 empirical studies. J. Sustain. Financ. Invest. 2015, 5, 210-233.
- Onomakpo, H. E. ESG Risk Ratings and Stock Performance in Electric Vehicle Manufacturing: A Panel Regression Analysis Using the Fama-French Five-Factor Model. J. Int. Bus. Financ. 2025, 3, 12. doi:10.33140/JIBF.03.01.12. [CrossRef]
- Martínez-Hernando, M.-P.; Bolonio, D.; Ortega, M. F.; Llamas, J. F.; García-Martínez, M.-J. Material flow analysis and regional greenhouse gas emissions associated to permanent magnets and batteries used in electric vehicles. Sci. Total Environ. 2023, 904, 166368. doi:10.1016/j.scitotenv.2023.166368. [CrossRef]
- Cornelio, A.; Zanoletti, A.; Scaglia, M.; Galli, E.; La Corte, D.; Biava, G.; Bontempi, E. Thermal approaches based on microwaves to recover lithium from spent lithium-ion batteries. RSC Sustain. 2024, 2, 2505-2514. doi:10.1039/d4su00202d. [CrossRef]
- Ferrara, C. Solvometallurgy as a Sustainable Approach for Lithium-Ion Batteries Recycling. ECS Meet. Abstr. 2024, MA2024-01, 2928-2928.
- Qi, Z.; Cao, Y.; Li, D.; Wu, C.; Wu, K.; Song, Y.; Huang, Z.; Luan, H.; Meng, X.; Yang, Z.; et al. Nontarget Analysis of Legacy and Emerging PFAS in a Lithium-Ion Power Battery Recycling Park and Their Possible Toxicity Measured Using High-Throughput Phenotype Screening. Environ. Sci. Technol. 2024, 58, 14530-14540. doi:10.1021/acs.est.4c03552. [CrossRef]
- Ducoli, S.; Fahimi, A.; Mousa, E.; Ye, G.; Federici, S.; Frontera, P.; Bontempi, E. ESCAPE approach for the sustainability evaluation of spent lithium-ion batteries recovery: Dataset of 33 available technologies. Data in Brief 2022, 42, 108018. doi:10.1016/j.dib.2022.108018. [CrossRef]
- Roa, A.; López, J.; Cortina, J. L. Selective separation of light and heavy rare earth elements from acidic mine waters by integration of chelating ion exchange and ligand impregnated resin. Sci. Total Environ. 2024, 954, 176700. doi:10.1016/j.scitotenv.2024.176700. [CrossRef]
- Born, K. Adoption of circular economy practices in the mining sector: Evidence from Chile. Resour. Policy 2025, 102, 105514. doi:10.1016/j.resconrec.2025.105514. [CrossRef]
- Cempa, M.; Lejwoda, P.; Karabela, K.; Pieprzyca, A.; Świnder, H.; Bauerek, A. Potential for the Recovery of Selected Metals and Critical Raw Materials from Slags from Polymineral Zn–Pb Ore Metallurgy—Part I. Minerals 2024, 14, 1050. doi:10.3390/min14101050. [CrossRef]
- Indelicato, V.; Punturo, R.; Nogues, I.; Guglietta, D.; Passatore, L.; Maldonado Gavilan, N.; Piñon, V.; Massimi, L. Phyto-mining to recover critical raw materials from mining wastes. EGUsphere 2025, EGU25-10985. doi:10.5194/egusphere-egu25-10985. [CrossRef]
- de Oliveira, D. P. S.; Silva, T. P.; Morais, I.; Fernandes, J. A. E. Chemical and Mineralogical Characterization of Waste from Abandoned Copper and Manganese Mines in the Iberian Pyrite Belt, Portugal: A First Step Towards the Waste-to-Value Recycling Process. Minerals 2025, 15, 58. doi:10.3390/min15010058. [CrossRef]
- Gerold, E.; Anbauer, A.; Kügele, A.; Ebenauer, K.; Antrekowitsch, H. Interrelationships between Pre-processing and Subsequent Procedures in the Recycling of Spent Lithium-ion Batteries. BHM Berg- und Hüttenmännische Monatshefte 2023, 168, 346-352. doi:10.1007/s00501-023-01361-4. [CrossRef]
- Randazzo, S.; Vicari, F.; López, J.; Salem, M.; Brutto, R. L.; Azzouz, S.; Chamam, S.; Cataldo, S.; Muratore, N.; de Labastida, M. F.; et al. Unlocking hidden mineral resources: Characterization and potential of bitterns as alternative sources of critical raw materials. J. Clean. Prod. 2024, 436, 140412. doi:10.1016/j.jclepro.2023.140412. [CrossRef]
- Cattaneo, P.; Callegari, D.; Merli, D.; Tealdi, C.; Vadivel, D.; Milanese, C.; Kapelyushko, V.; D’Aprile, F.; Quartarone, E. Sorting, Characterization, Environmentally Friendly Recycling, and Reuse of Components from End-of-Life 18650 Li Ion Batteries. Adv. Sustain. Systems 2023, 7, 2300161. doi:10.1002/adsu.202300161. [CrossRef]
- Salces, A. M.; Bremerstein, I.; Rudolph, M.; Vanderbruggen, A. Joint recovery of graphite and lithium metal oxides from spent lithium-ion batteries using froth flotation and investigation on process water re-use. Miner. Eng. 2022, 184, 107670. doi:10.1016/j.mineng.2022.107670. [CrossRef]
- Cerutti, P.; Dini, A.; Emani, E. [Deep geothermal and energy: electricity, geothermal lithium, critical raw materials]. Acque Sotterranee 2024, 13, 37-39.
- Regenspurg, S.; Thomas, A.; Stammeier, J. A.; Schiepersky, F.; Scheck-Wenderoth, M.; Kieling, K. Critical raw materials from geothermal fluids: Potential in the North German Basin. EGUsphere 2025, EGU24-19791. doi:10.5194/egusphere-egu24-19791. [CrossRef]
- Inzillo, B. M.; Santoro, S.; Curcio, E.; Straface, S. Innovative Geothermal Mining through Membrane Technologies. EGUsphere 2025, EGU25-19565. doi:10.5194/egusphere-egu25-19565. [CrossRef]
- Chen, W.-H.; Hsieh, I.-Y. L. Techno-economic analysis of lithium-ion battery price reduction considering carbon footprint based on life cycle assessment. J. Clean. Prod. 2023, 425, 139045. doi:10.1016/j.jclepro.2023.139045. [CrossRef]
- Coterillo, R.; Gallart, L.-E.; Fernández-Escalante, E.; Junquera, J.; García-Fernández, P.; Ortiz, I.; Ibañez, R.; San-Román, M.-F. Selective extraction of lithium from seawater desalination concentrates: Study of thermodynamic and equilibrium properties using Density Functional Theory (DFT). Desalination 2022, 532, 115704. doi:10.1016/j.desal.2022.115704. [CrossRef]
- Hirlekar, O.; Kolte, A.; Vasa, L. Transition in the mining industry with green energy: Economic dynamics in mining demand. Resour. Policy 2025, 100, 105409. doi:10.1016/j.resourpol.2024.105409. [CrossRef]
- Joutsenvaara, J.; Holma, M.; Kuusiniemi, P.; Korteniemi, J.; Seivane, H.; Marti-Linares, D.; Schimmel, M.; Casini, G.; Buffett, G. G.; Pirttijärvi, M.; et al. The Horizon Europe AGEMERA Project: Innovative Non-Invasive Geophysical Methodologies for Mineral Exploration. Adv. Geosci. 2025, 65, 171-180. doi:10.5194/adgeo-65-171-2025. [CrossRef]
- Peytcheva, I.; Hikov, A.; Georgiev, S.; Stefanova, E.; Dimitrova, D.; Ivanov, D.; Stoilov, V.; Vasilev, I.; Holma, M. Assessing the potential of Assarel porphyry copper deposit for critical raw materials: mineral-geochemical data for combination with agile exploration methods and better geo-modeling. Rev. Bulg. Geol. Soc. 2022, 83, 113-116. doi:10.52215/rev.bgs.2022.83.3.113. [CrossRef]
- Luukkanen, S. AVANTIS - Sustainable, decarbonised vanadium, titanium and iron extraction from Europe’s low-grade vanadium-bearing titanomagnetite deposits. EGUsphere 2025, EGU25-21197. doi:10.5194/egusphere-egu25-21197. [CrossRef]
- Wollenberg, A.; Pospiech, S.; Birtel, S. DeepBEAT - Innovative Geochemical Approaches for Sustainable Exploration of Deep-Seated Mineral Resources. EGUsphere 2025, EGU25-20971. doi:10.5194/egusphere-egu25-20971. [CrossRef]
Figure 1.
LASSO Feature Importance for the High ESG Risk Portfolio.
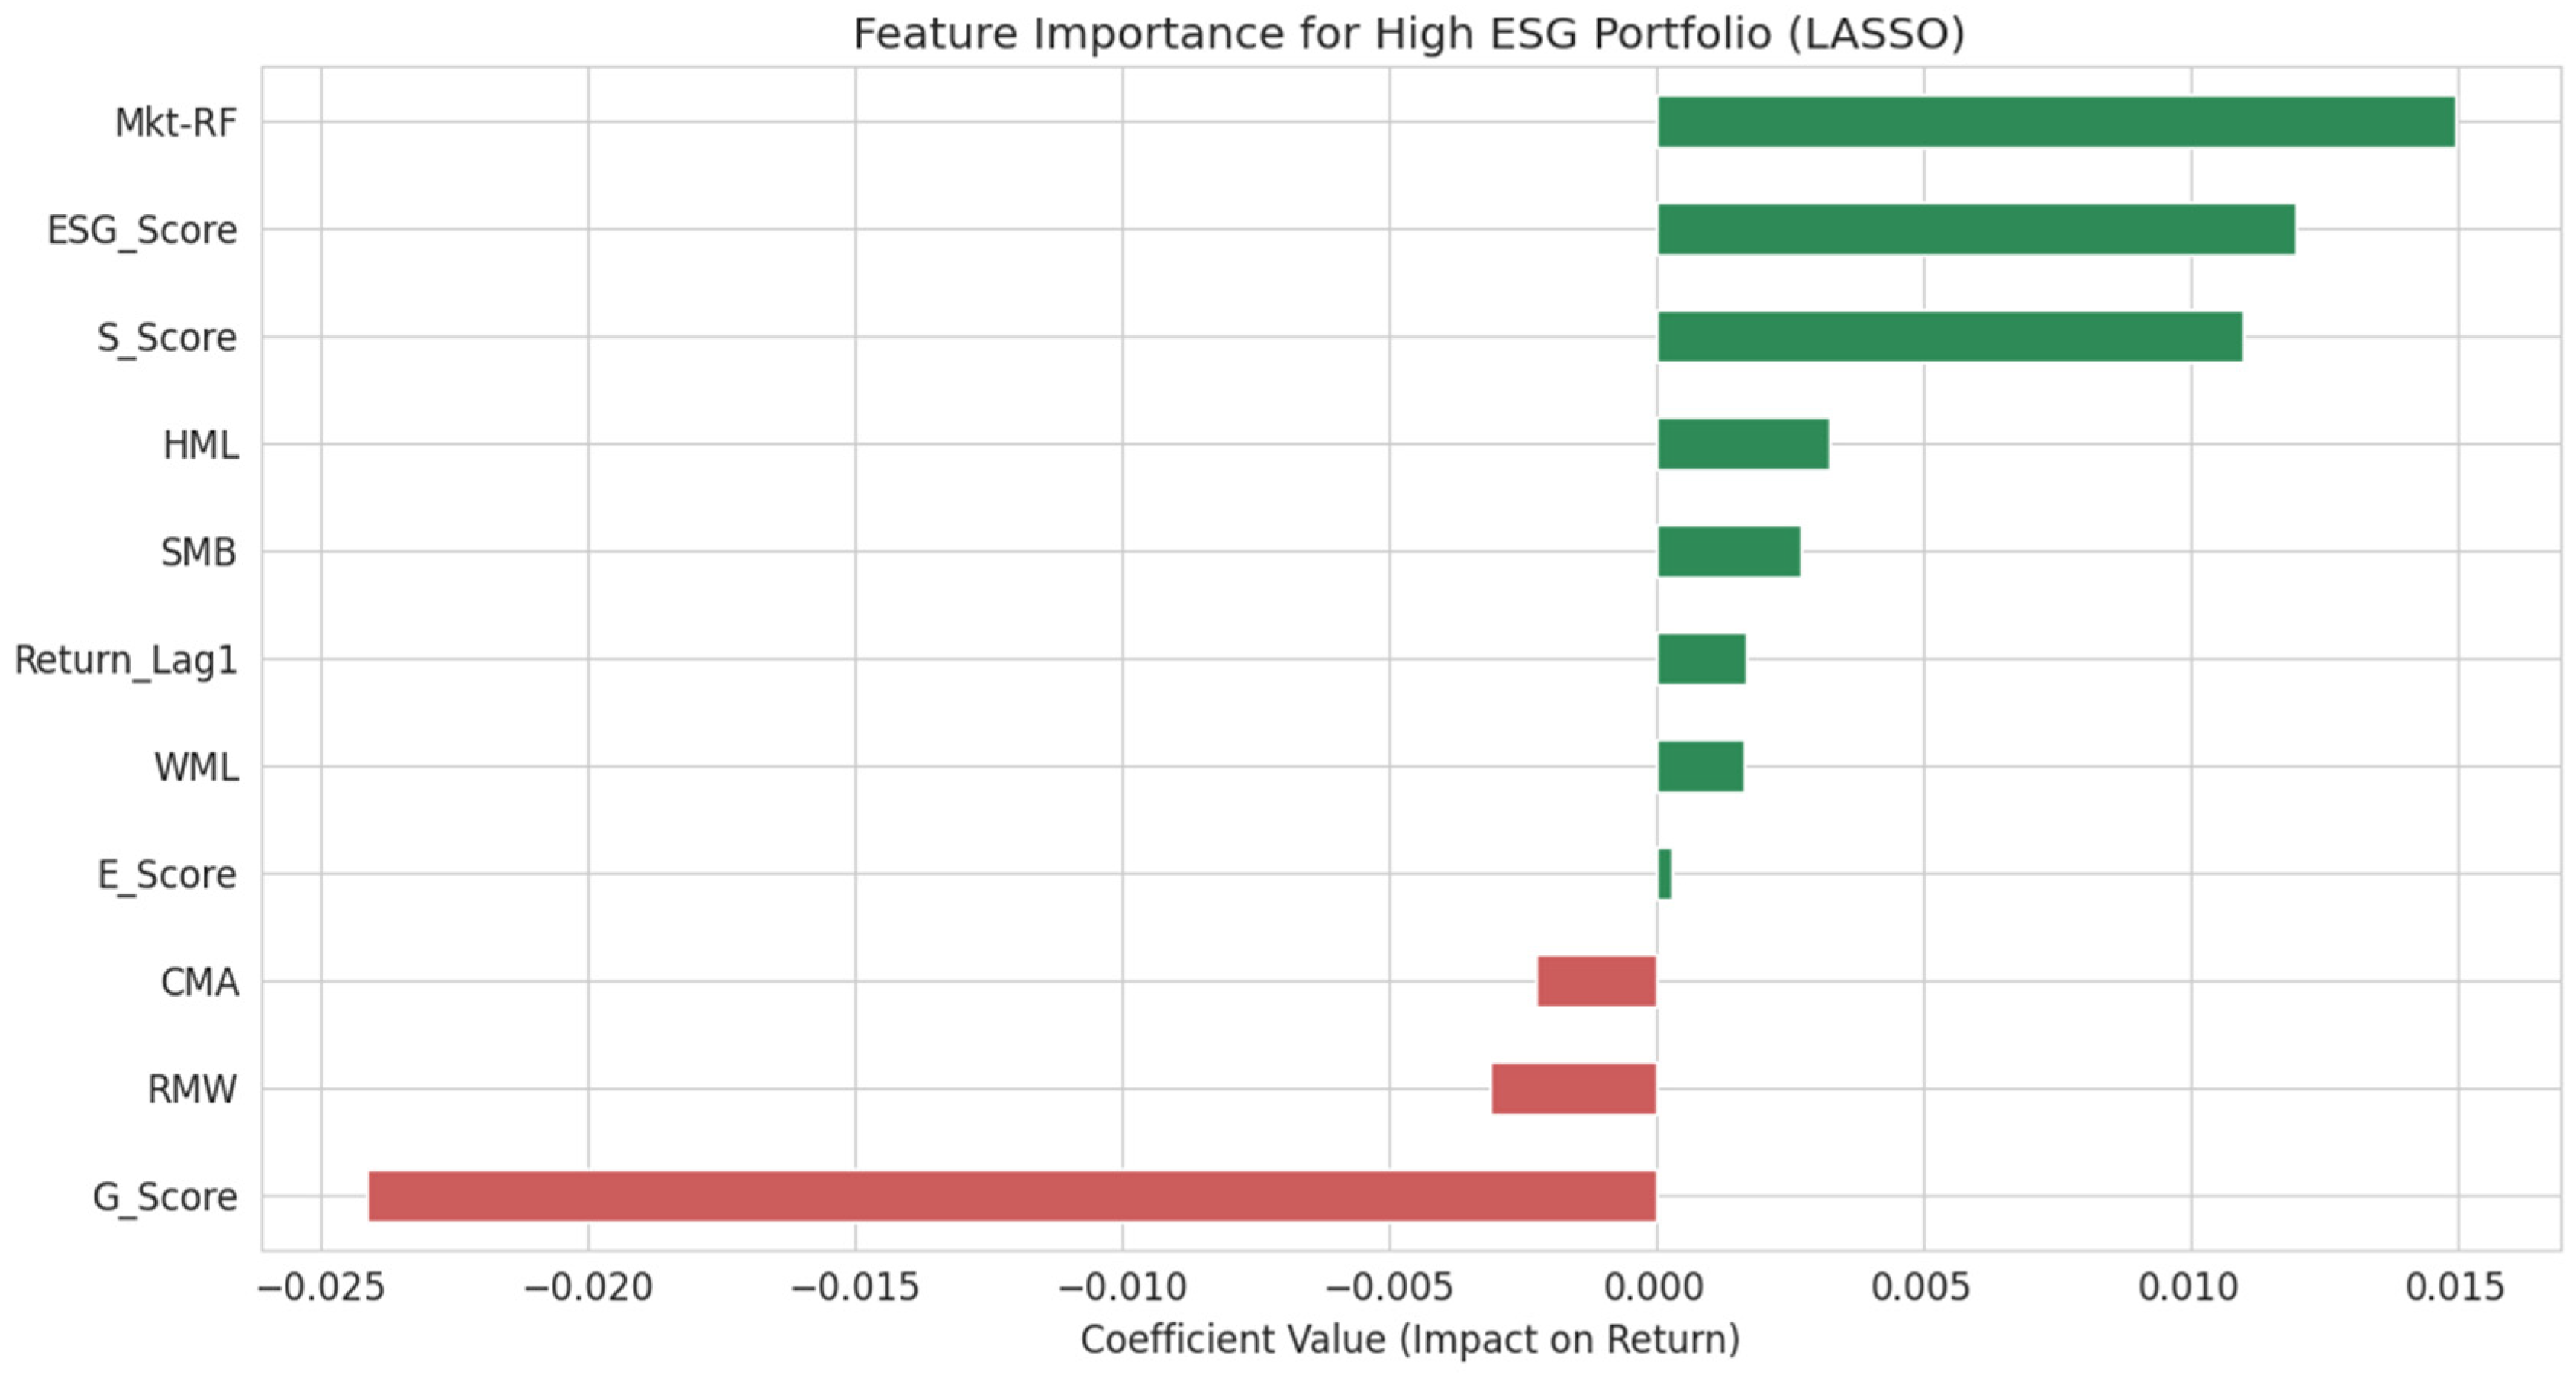
Figure 2.
Impulse Response of Medium ESG Risk Portfolio Returns to an ESG Score Shock.
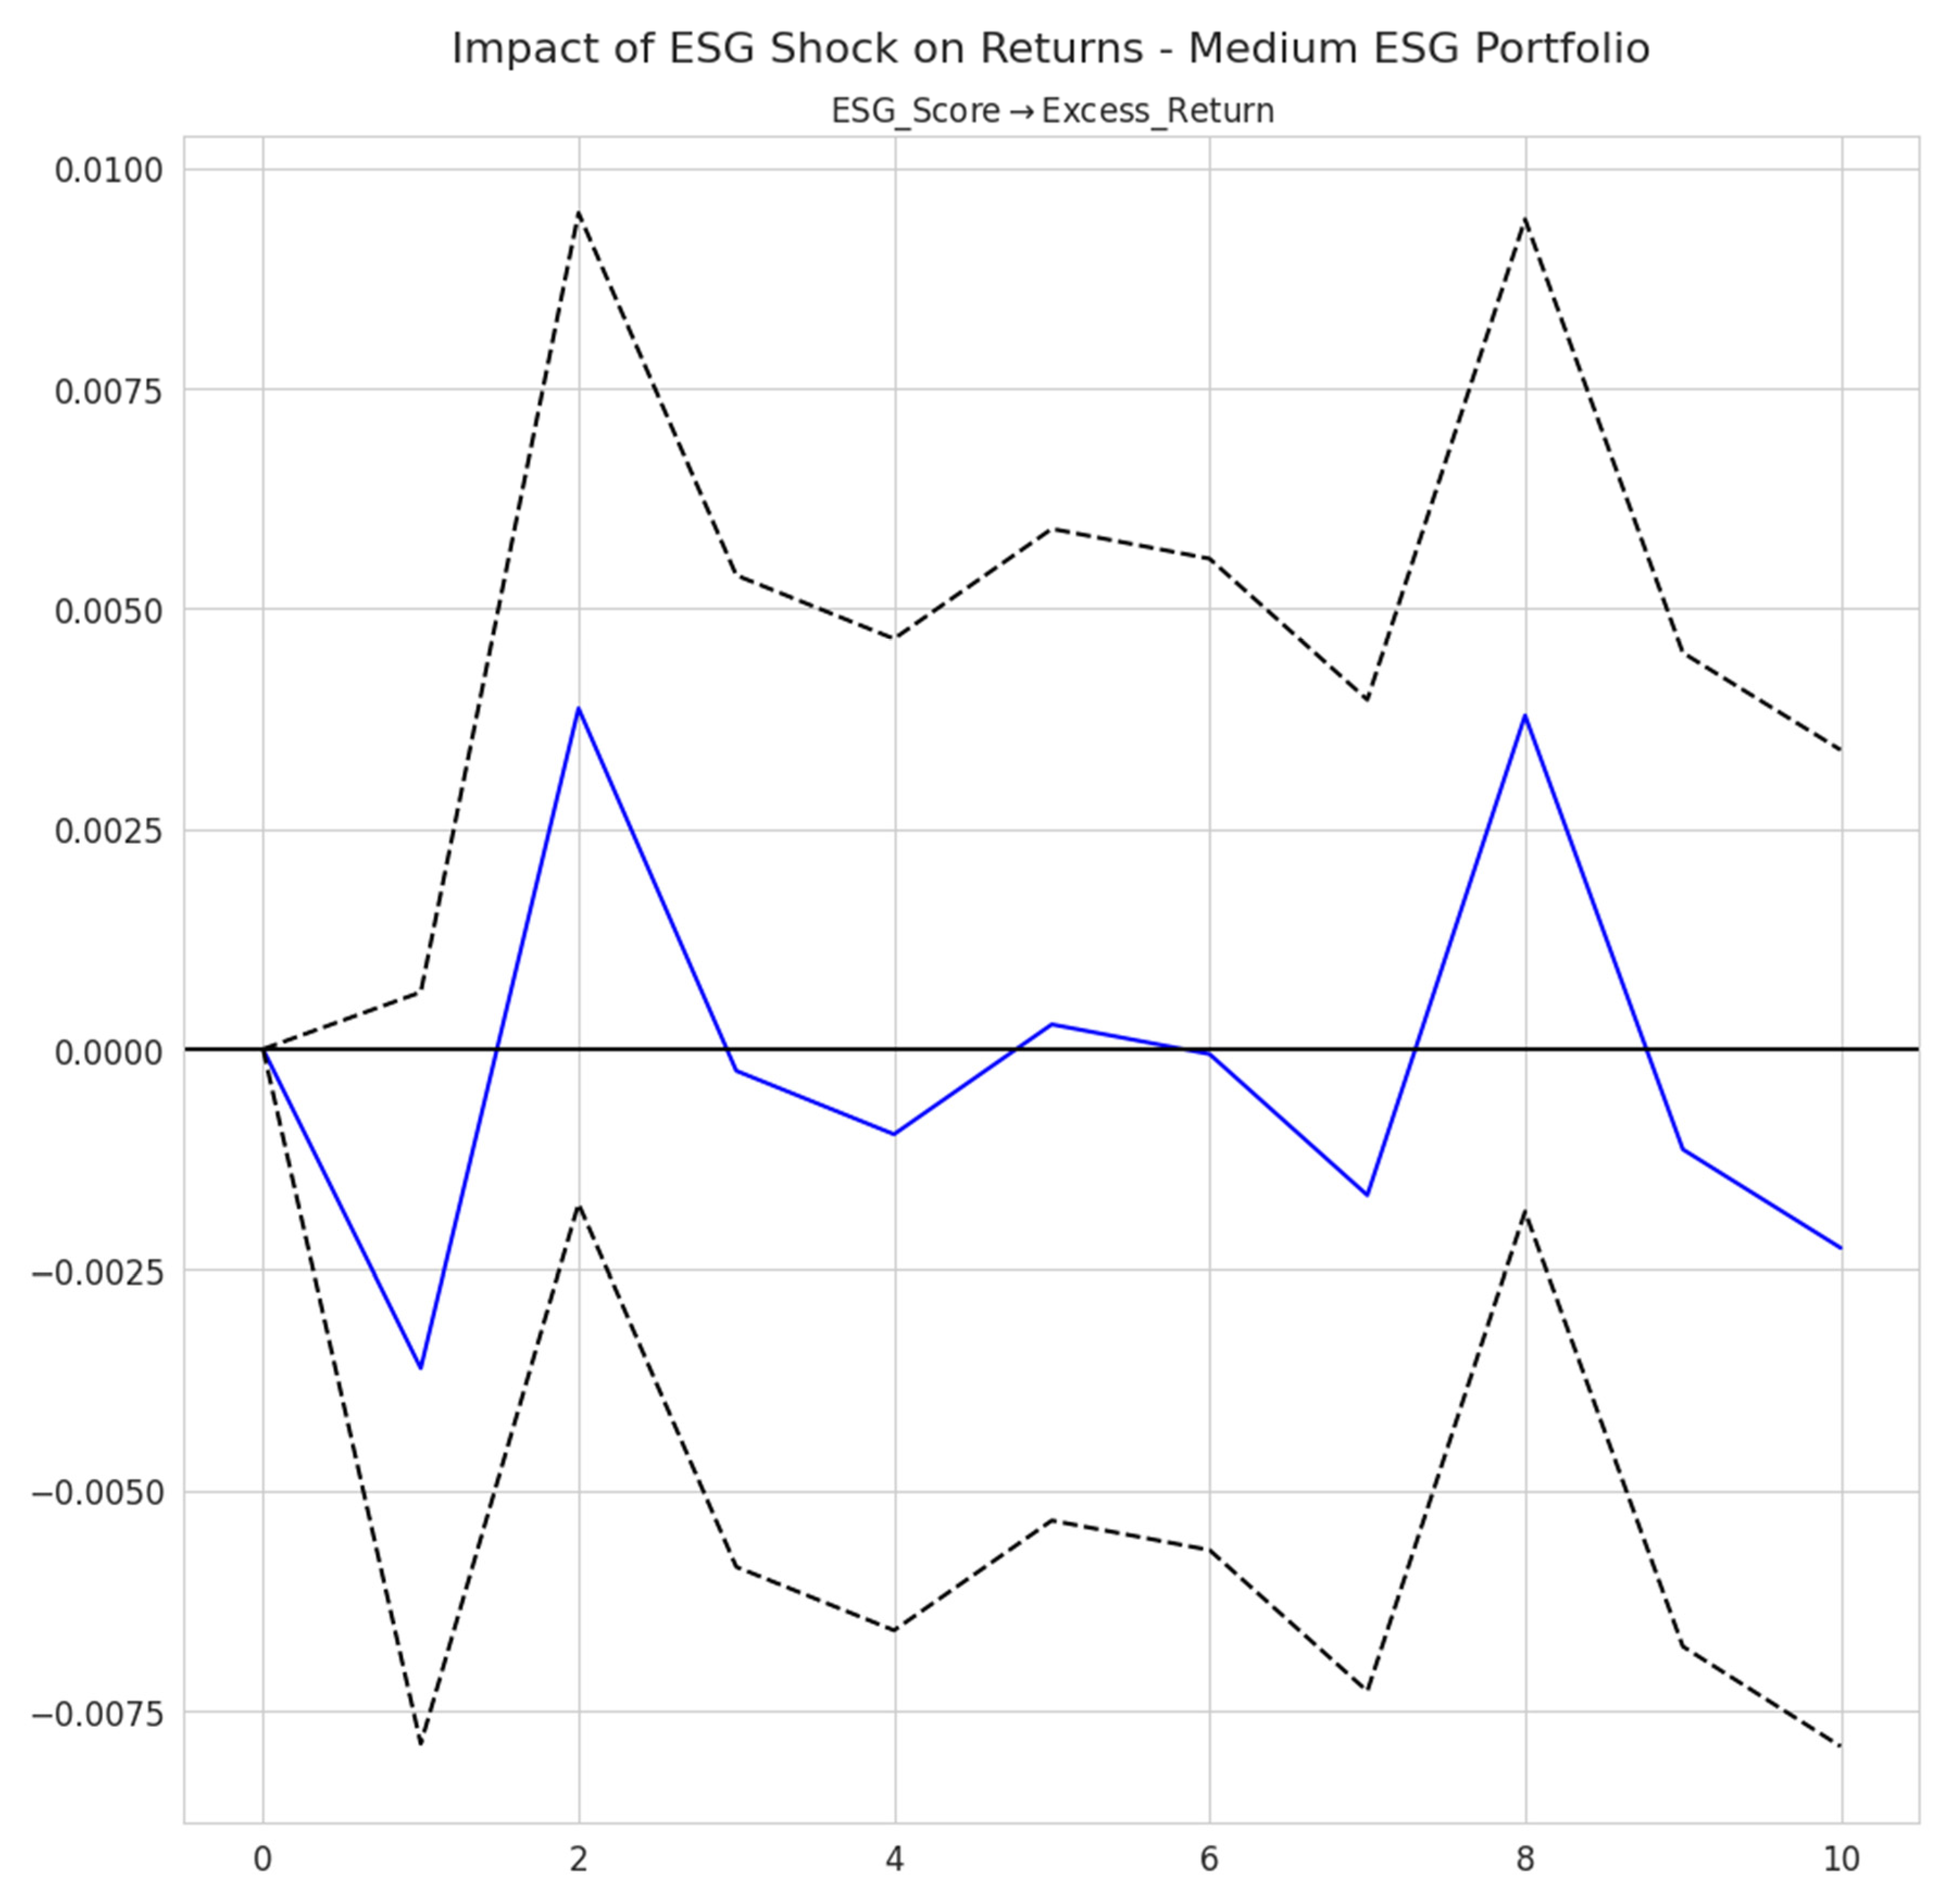
Figure 3.
LASSO Feature Importance for the Medium ESG Risk Portfolio (Improvers).
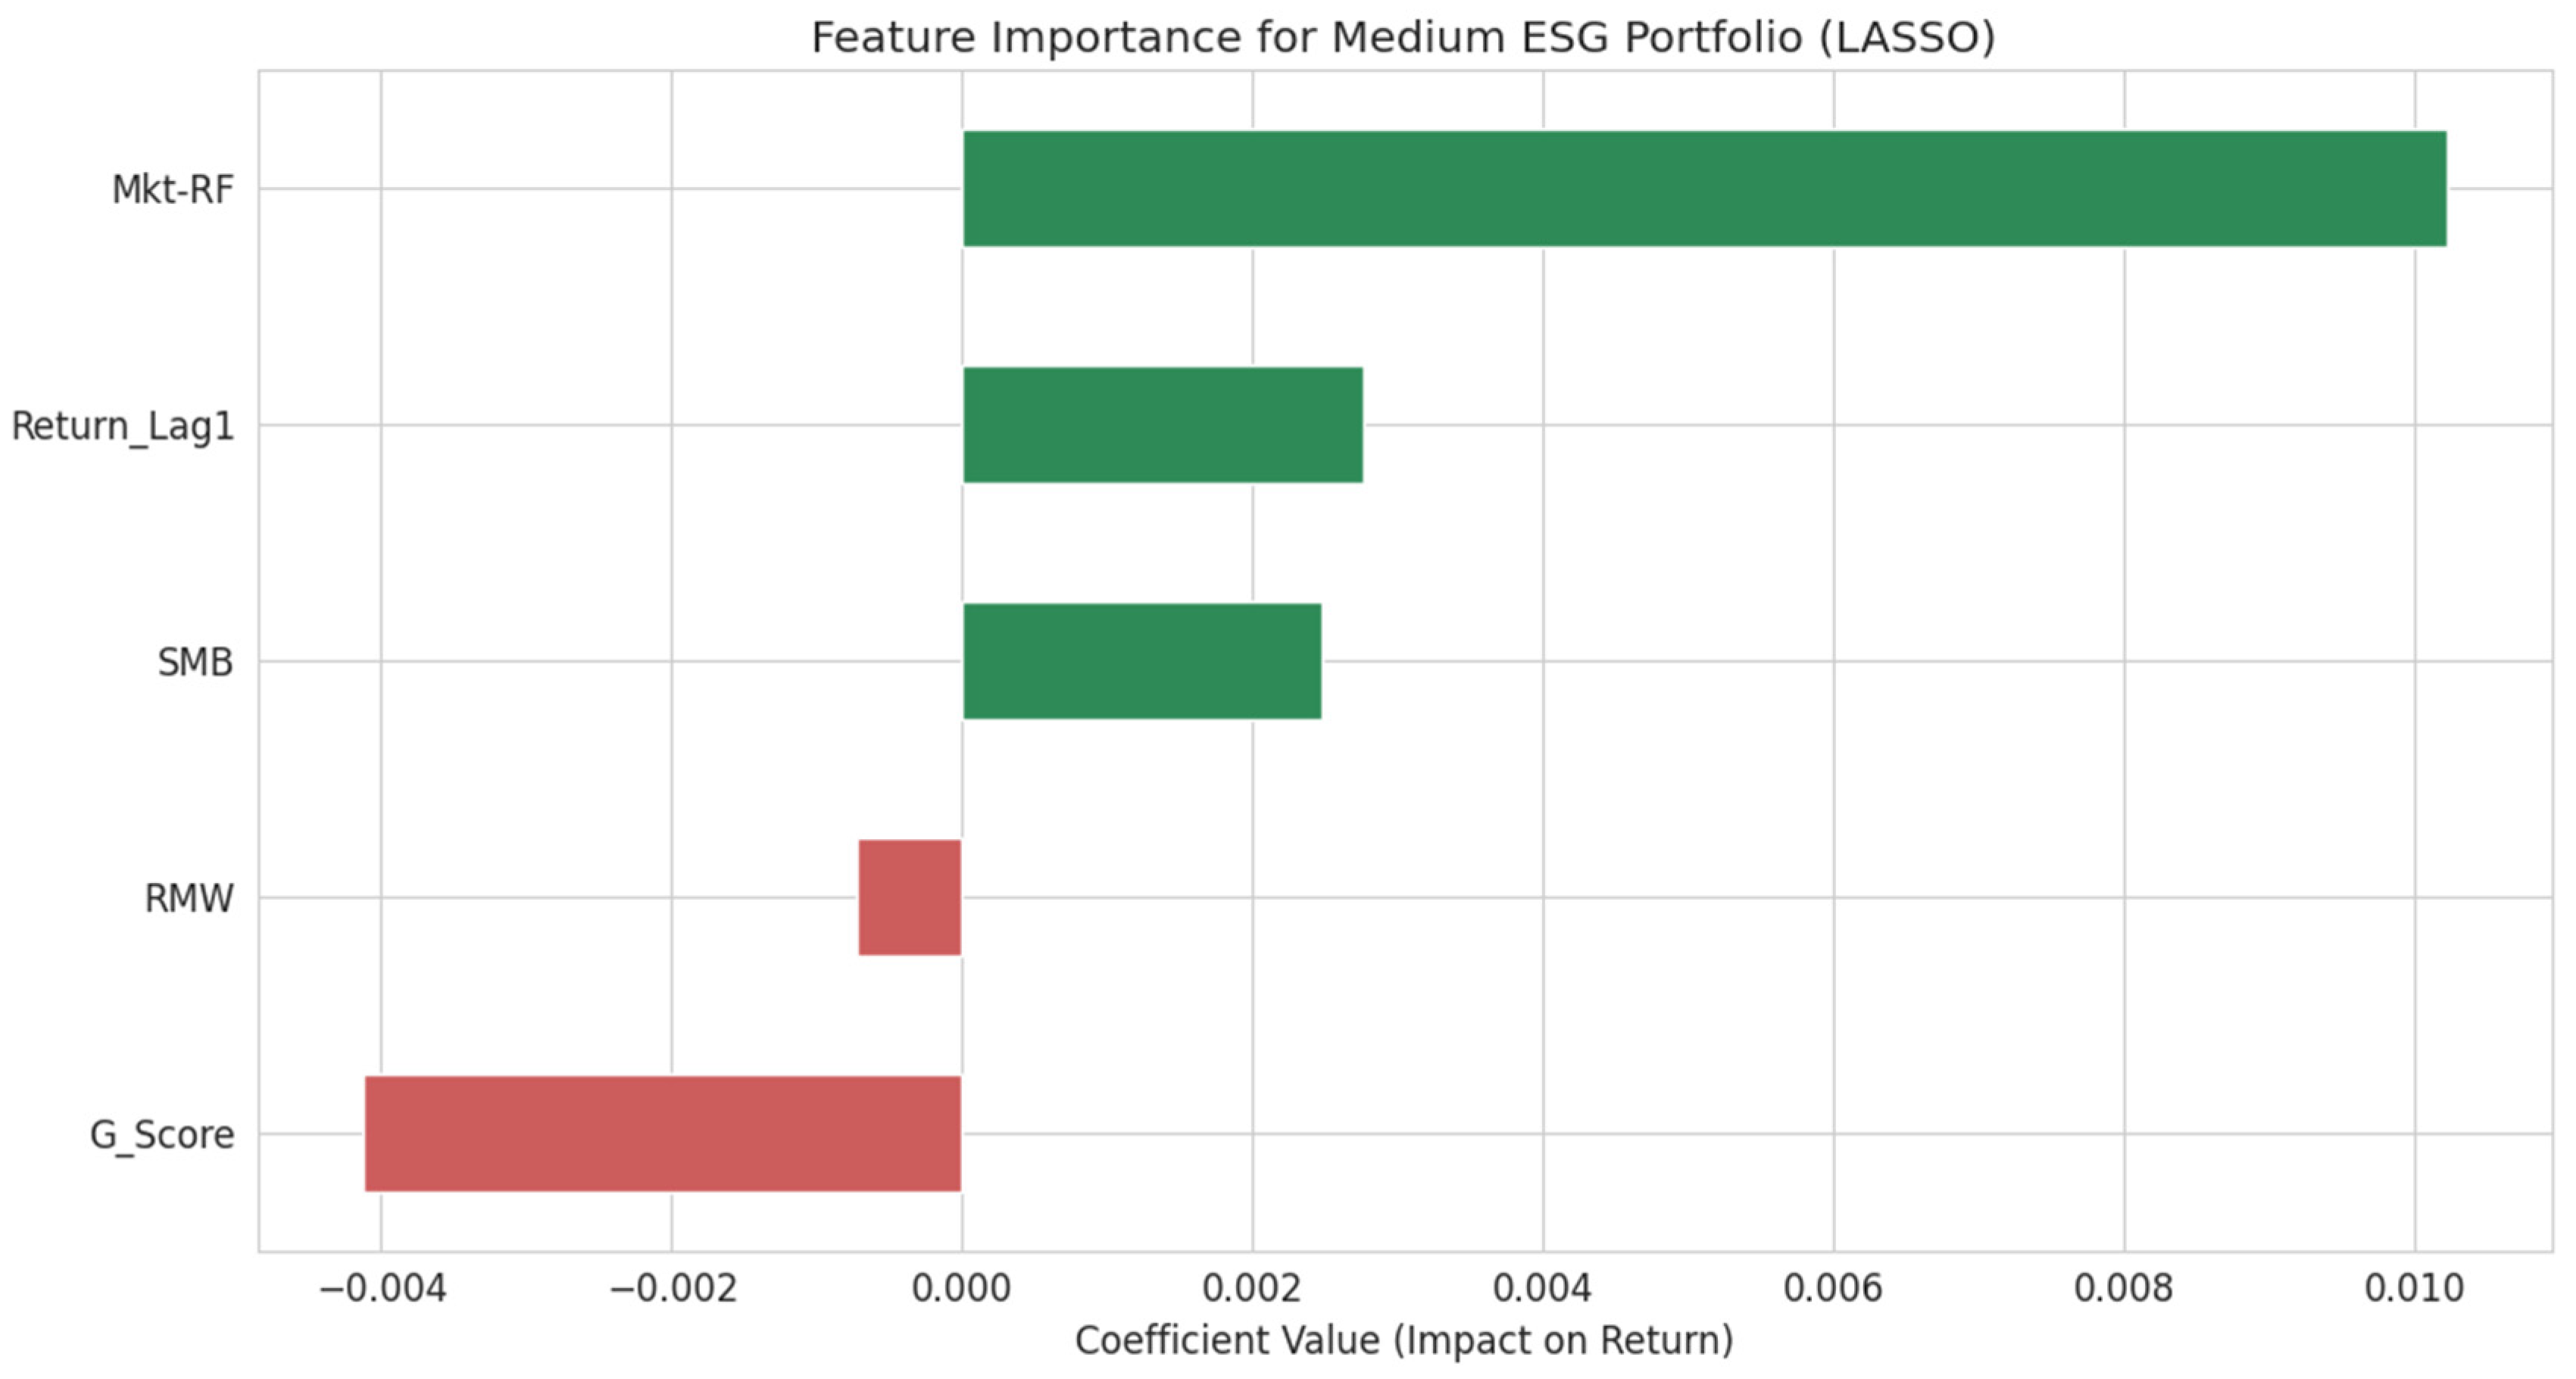
Figure 4.
LASSO Feature Importance for the Low ESG Risk Portfolio.
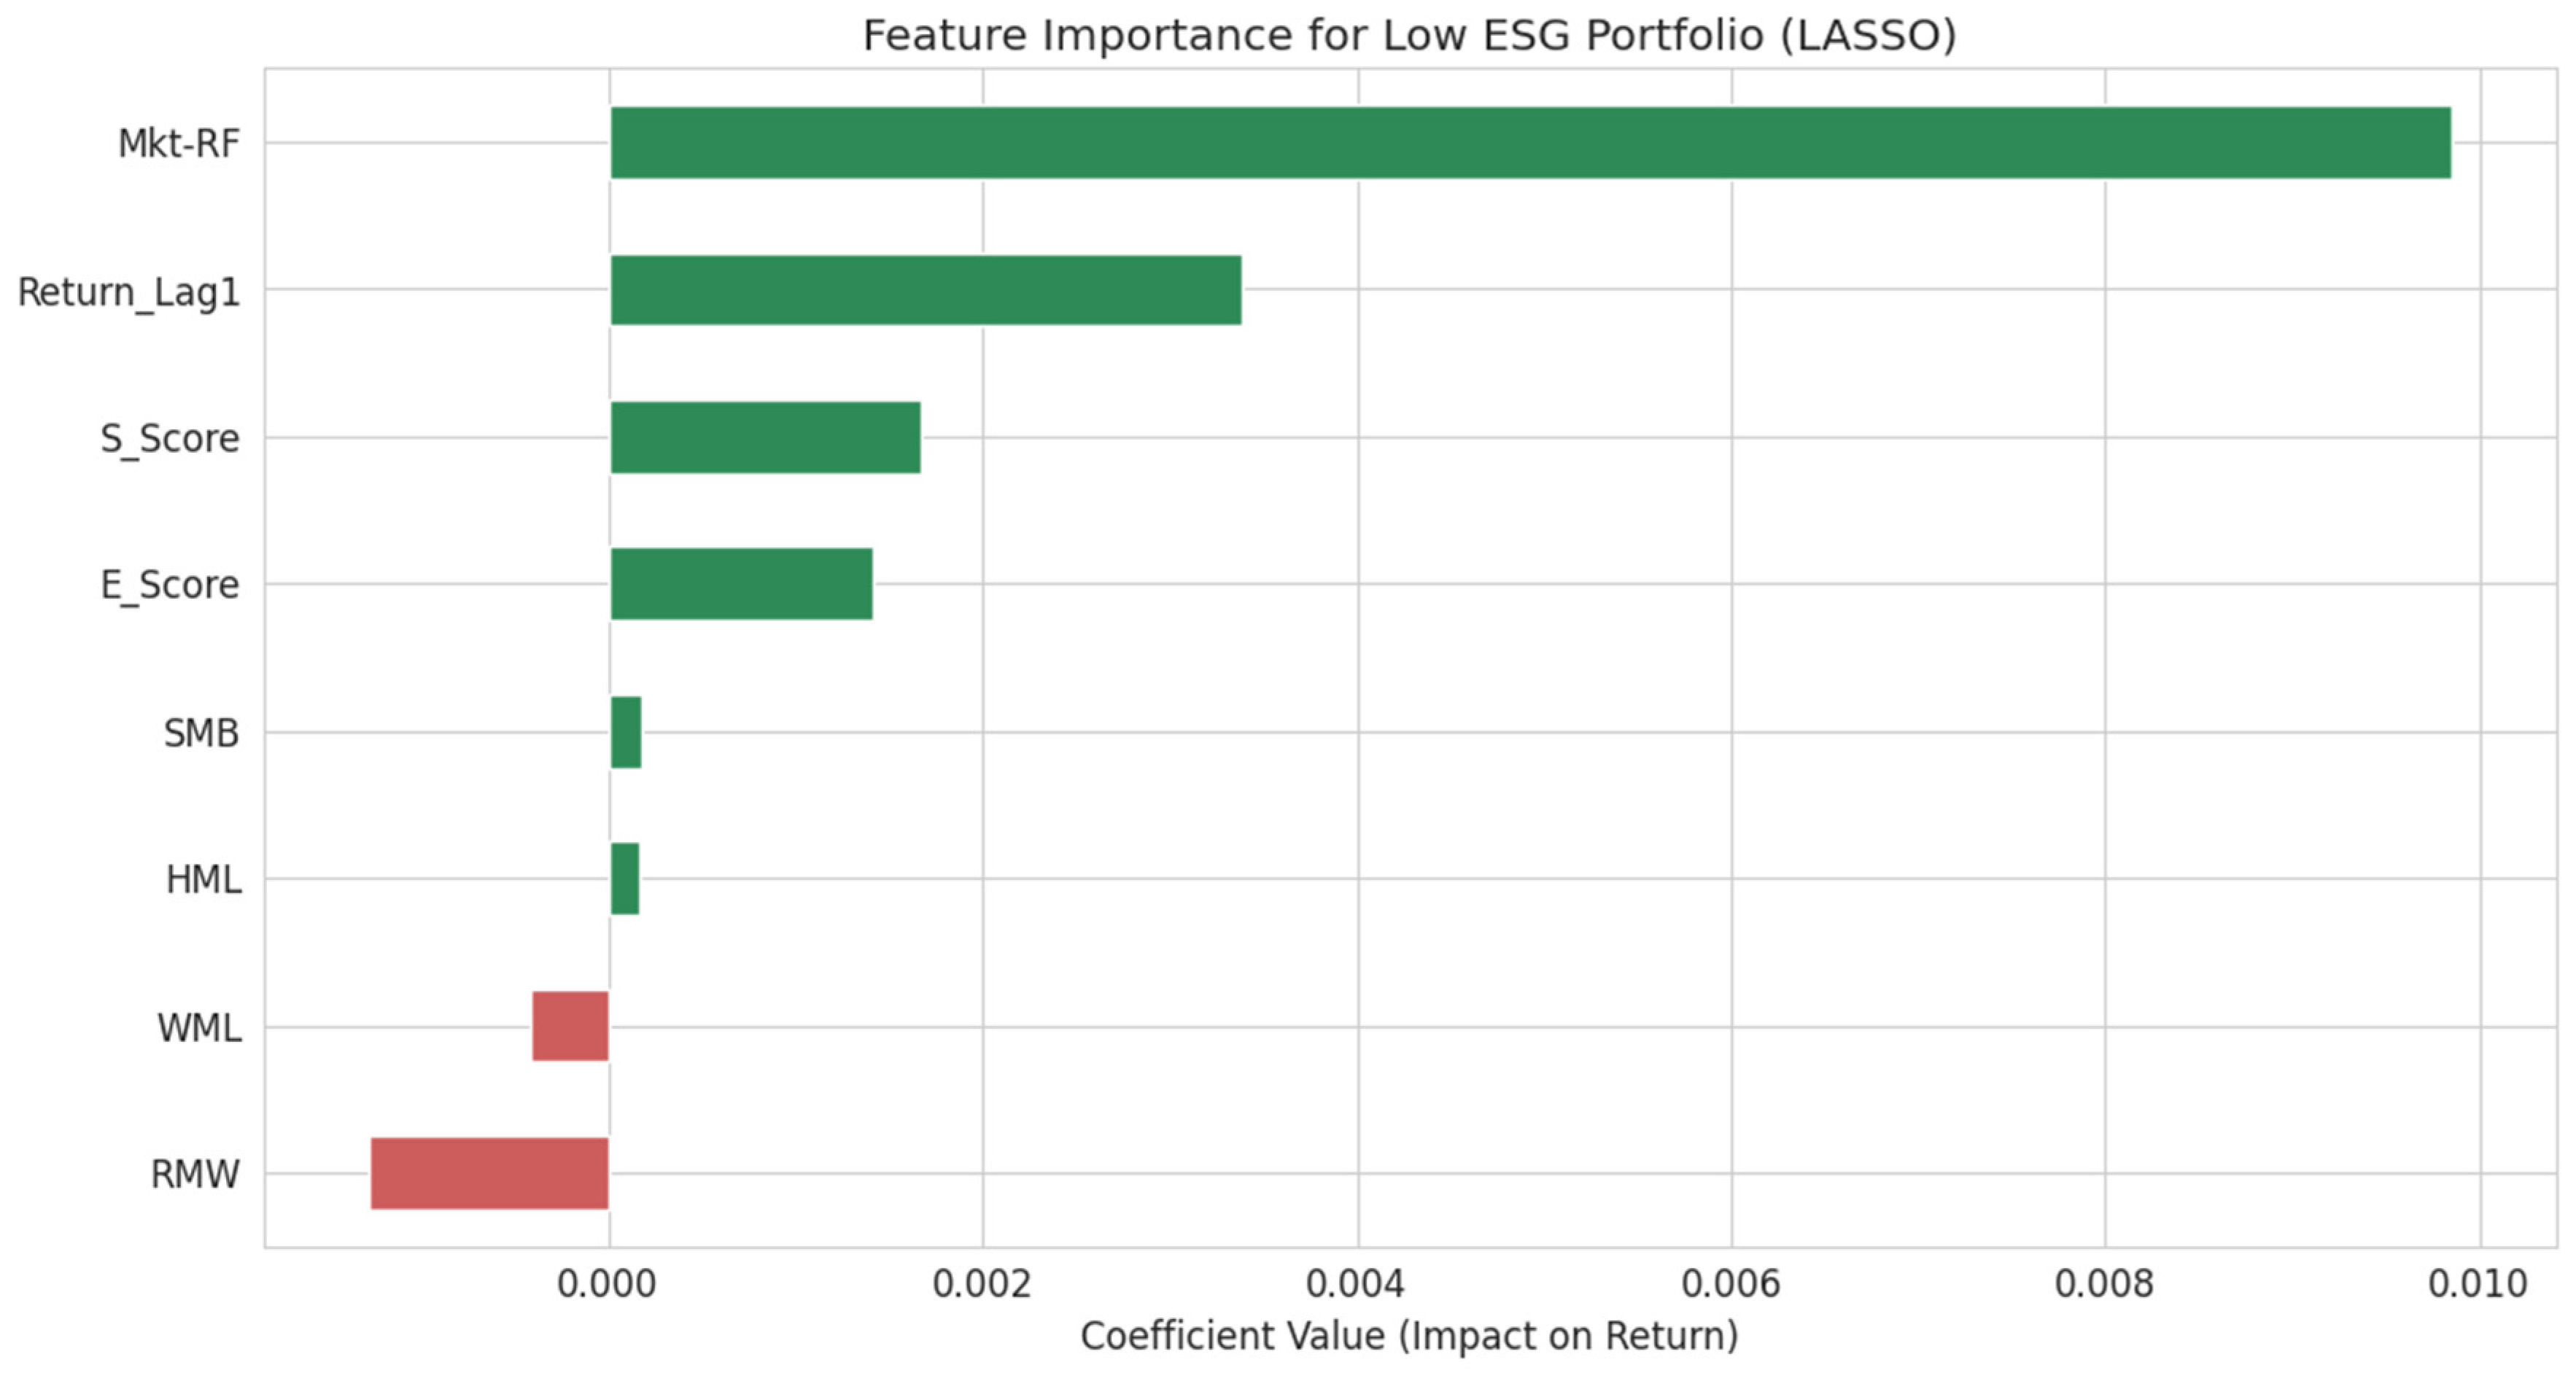
Figure 5.
Impulse Response of Low ESG Risk Portfolio Returns to an ESG Score Shock.
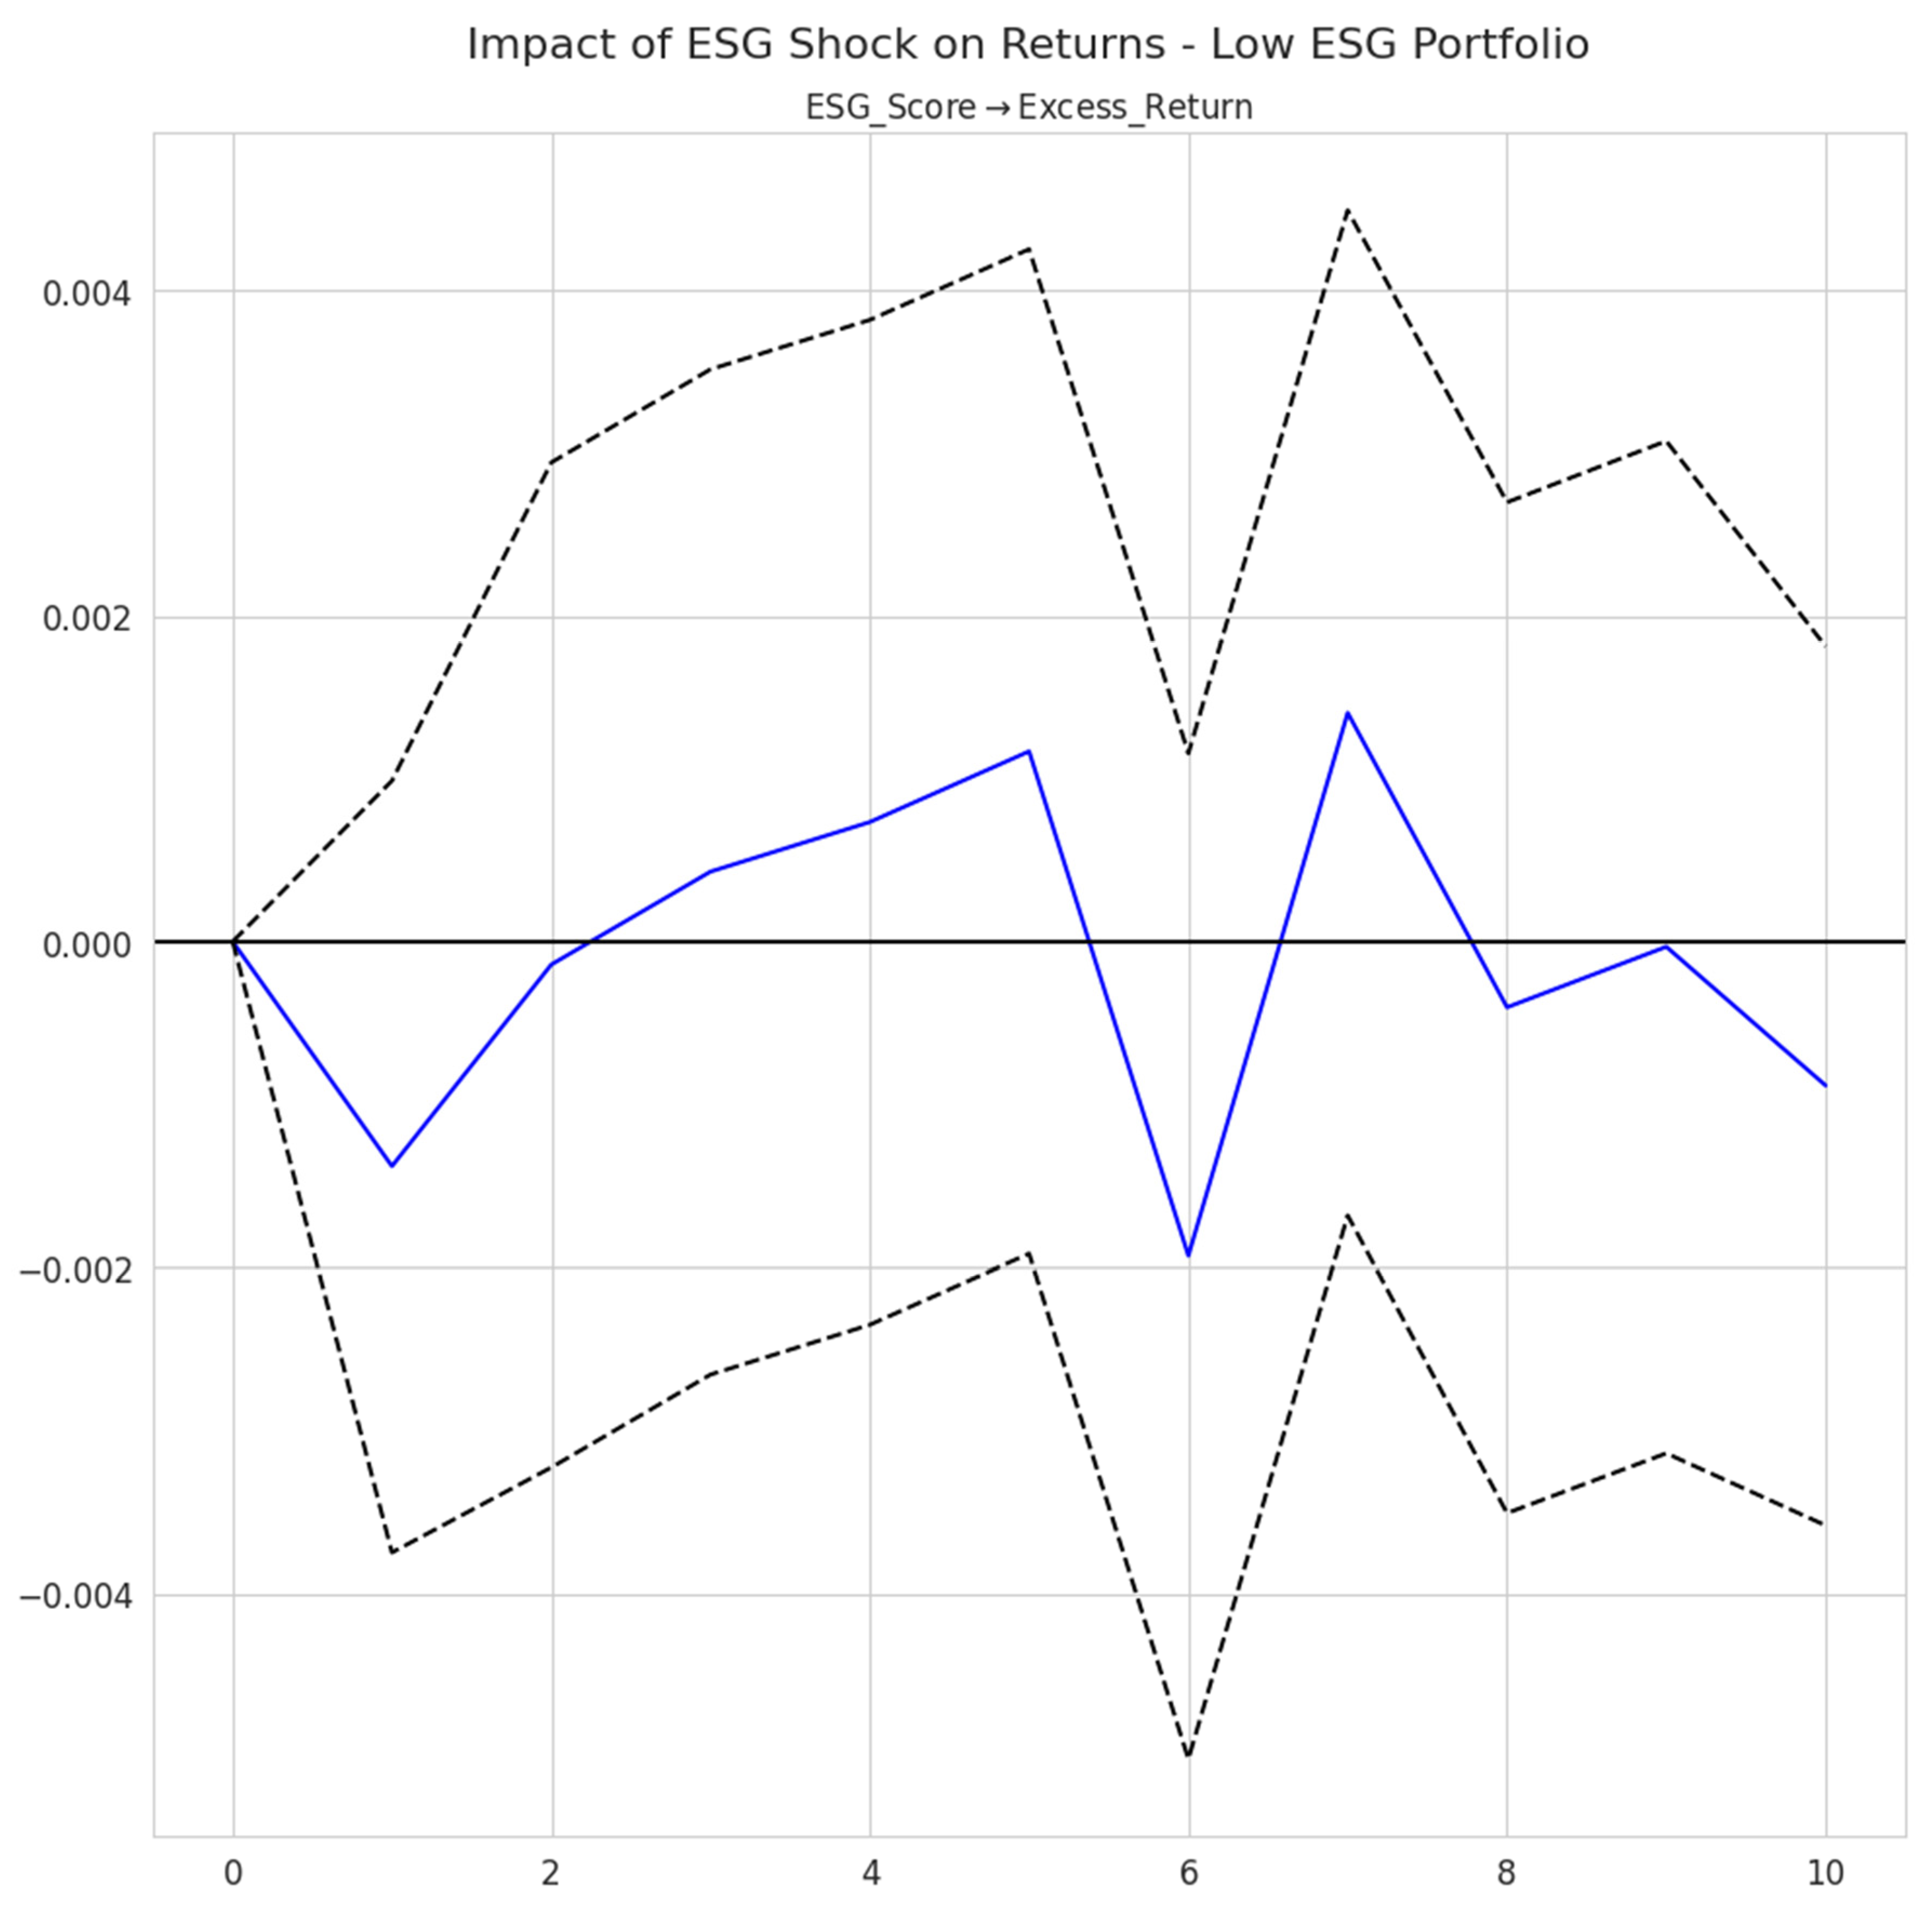

Table 1.
Portfolio Composition and Descriptive Statistics.
| Portfolio | Number of Companies | Mean Daily Excess Return | Std. Dev. Daily Excess Return | Avg. Composite ESG Score (Sustainalytics Risk Score) |
| Low ESG Risk (Leaders) | 9 | -0.00169 | 0.0244 | Lower (Better Performance) |
| Medium ESG Risk (Improvers) | 8 | -0.00063 | 0.0141 | Medium |
| High ESG Risk (Laggards) | 8 | -0.00094 | 0.0168 | Higher (Worse Performance) |
| Note: ESG scores are normalized; for Sustainalytics, a lower ESG score indicates lower ESG risk (better performance). | ||||
Table 2.
Panel Model Specification Test Results.
| Test | Statistic Type | Representative Value | P-value | Decision |
| F-test for Fixed Effects | F-statistic | 14.96 | 0.0000 | Reject Pooled OLS in favor of FE or RE. |
| Hausman Test (FE vs. RE) | Chi-squared (χ2) | 45.82 | 0.0000 | Reject Random Effects in favor of Fixed Effects. |
| Note: Representative statistic and p-values are shown for clarity. Tests were performed for each portfolio, consistently confirming the superiority of the Fixed Effects specification. | ||||
Table 3.
Augmented Dickey-Fuller (ADF) Unit Root Test Results.
| Variable (Medium ESG Portfolio) | ADF Statistic (Level) | p-value | ADF Statistic (1st Diff) | p-value | Conclusion |
|---|---|---|---|---|---|
| Excess Return | -2.15 | 0.22 | -15.43 | 0.00 | Stationary I(1) |
| ESG Score | -1.89 | 0.34 | -12.88 | 0.00 | Stationary I(1) |
| Note: Representative values from the Medium ESG portfolio are shown. All series across portfolios exhibit I(1) behavior. | |||||
Table 4.
ARCH-LM Test for Heteroskedasticity in Portfolio Returns.
| Portfolio | LM-Statistic | p-value | Conclusion |
|---|---|---|---|
| Low ESG Risk | 155.4 | 0.000 | Significant ARCH effects present. |
| Medium ESG Risk | 189.2 | 0.000 | Significant ARCH effects present. |
| High ESG Risk | 148.7 | 0.000 | Significant ARCH effects present. |
| Note: A significant p-value indicates the presence of time-varying volatility, justifying the use of GARCH models. | |||
Table 5.
Multivariate Panel Regression Results for the High ESG Risk Portfolio.
| Variable | Parameter | Std. Err. | T-stat | P-value | Lower CI | Upper CI |
|---|---|---|---|---|---|---|
| const | -0.0094 | 0.0036 | -2.5951 | 0.0095 | -0.0165 | -0.0023 |
| E_Score | 9.655e-05 | 0.0010 | 0.0955 | 0.9239 | -0.0019 | 0.0021 |
| S_Score | -0.0001 | 0.0003 | -0.4381 | 0.6614 | -0.0006 | 0.0004 |
| G_Score | -0.0001 | 0.0009 | -0.1491 | 0.8814 | -0.0018 | 0.0015 |
| Mkt-RF | 0.0108 | 0.0022 | 4.9194 | 0.0000 | 0.0065 | 0.0151 |
| SMB | 0.0044 | 0.0014 | 3.0928 | 0.0020 | 0.0016 | 0.0072 |
| HML | 0.0023 | 0.0023 | 1.0164 | 0.3095 | -0.0021 | 0.0067 |
| RMW | 8.908e-05 | 0.0035 | 0.0256 | 0.9795 | -0.0067 | 0.0069 |
| CMA | -0.0021 | 0.0014 | -1.5761 | 0.1150 | -0.0048 | 0.0005 |
| WML | -0.0019 | 0.0014 | -1.3383 | 0.1808 | -0.0046 | 0.0009 |
| R-squared: 0.1724, No. Observations: 10362, Entities: 7 | ||||||
Table 6.
Summary of Time-Series Analysis for the High ESG Risk Portfolio.
| Metric | Value |
|---|---|
| GARCH Volatility Persistence (Alpha+Beta) | 0.9873 |
| Granger Causality (ESG → Returns) p-value | 0.0808 |
Table 7.
Machine Learning Model Performance (RMSE) for the High ESG Risk Portfolio.
| Model | RMSE |
|---|---|
| LASSO | 0.0169 |
| DNN | 0.0309 |
| LSTM | 0.0187 |
Table 8.
Multivariate Panel Regression Results for the Medium ESG Risk Portfolio (Improvers).
| Variable | Parameter | Std. Err. | T-stat | P-value | Lower CI | Upper CI |
|---|---|---|---|---|---|---|
| const | -0.0063 | 0.0035 | -1.775 | 0.0759 | -0.0132 | 0.0007 |
| E_Score | -0.0007 | 4.399e-05 | -16.915 | 0.0000 | -0.0008 | -0.0007 |
| S_Score | 0.0027 | 0.0009 | 2.9925 | 0.0028 | 0.0009 | 0.0045 |
| G_Score | -0.0029 | 0.0008 | -3.5848 | 0.0003 | -0.0045 | -0.0013 |
| Mkt-RF | 0.0103 | 0.0018 | 5.8517 | 0.0000 | 0.0069 | 0.0138 |
| SMB | 0.0086 | 0.0020 | 4.2215 | 0.0000 | 0.0046 | 0.0125 |
| HML | -0.0026 | 0.0022 | -1.173 | 0.2409 | -0.0069 | 0.0017 |
| RMW | -0.0053 | 0.0062 | -0.8651 | 0.3870 | -0.0175 | 0.0068 |
| CMA | 0.0046 | 0.0024 | 1.9074 | 0.0565 | -0.0001 | 0.0092 |
| WML | -0.0046 | 0.0019 | -2.4682 | 0.0136 | -0.0083 | -0.0010 |
| Note: R-squared: 0.1234, No. Observations: 5501, Entities: 8 | ||||||
Table 9.
Summary of Time-Series Analysis for the Medium ESG Risk Portfolio (Improvers).
| Metric | Value |
|---|---|
| GARCH Volatility Persistence (Alpha+Beta) | 0.9897 |
| Granger Causality (ESG → Returns) p-value | 0.0003 |
Table 10.
Machine Learning Model Performance (RMSE) for the Medium ESG Risk Portfolio (Improvers).
| Model | RMSE |
|---|---|
| LASSO | 0.014078 |
| DNN | 0.043076 |
| LSTM | 0.021508 |
Table 11.
Multivariate Panel Regression Results for the Low ESG Risk Portfolio.
| Variable | Parameter | Std. Err. | T-stat | P-value | Lower CI | Upper CI |
|---|---|---|---|---|---|---|
| const | -0.0169 | 0.0115 | -1.4708 | 0.1414 | -0.0395 | 0.0056 |
| E_Score | 2.966e-05 | 0.0012 | 0.0241 | 0.9808 | -0.0024 | 0.0024 |
| S_Score | 0.0008 | 0.0013 | 0.6582 | 0.5104 | -0.0017 | 0.0033 |
| G_Score | -0.0008 | 0.0005 | -1.4920 | 0.1357 | -0.0018 | 0.0002 |
| Mkt-RF | 0.0181 | 0.0020 | 9.2490 | 0.0000 | 0.0142 | 0.0219 |
| SMB | 0.0056 | 0.0010 | 5.4911 | 0.0000 | 0.0036 | 0.0076 |
| HML | 0.0058 | 0.0018 | 3.1663 | 0.0016 | 0.0022 | 0.0094 |
| RMW | -0.0053 | 0.0026 | -2.0566 | 0.0398 | -0.0103 | -0.0002 |
| CMA | -0.0011 | 0.0020 | -0.5448 | 0.5859 | -0.0051 | 0.0029 |
| WML | 0.0001 | 0.0009 | 0.1478 | 0.8825 | -0.0016 | 0.0019 |
| Note: R-squared: 0.2707, No. Observations: 6372, Entities: 8 | ||||||
Table 12.
Summary of Time-Series Analysis for the Low ESG Risk Portfolio.
| Metric | Value |
|---|---|
| GARCH Volatility Persistence (Alpha+Beta) | 0.9979 |
| Granger Causality (ESG → Returns) p-value | 0.1373 |
Table 13.
Machine Learning Model Performance (RMSE) for the Low ESG Risk Portfolio.
| Model | RMSE |
|---|---|
| LASSO | 0.024441 |
| DNN | 0.030314 |
| LSTM | 0.023818 |
Disclaimer/Publisher’s Note: The statements, opinions and data contained in all publications are solely those of the individual author(s) and contributor(s) and not of MDPI and/or the editor(s). MDPI and/or the editor(s) disclaim responsibility for any injury to people or property resulting from any ideas, methods, instructions or products referred to in the content. |
© 2025 by the authors. Licensee MDPI, Basel, Switzerland. This article is an open access article distributed under the terms and conditions of the Creative Commons Attribution (CC BY) license (http://creativecommons.org/licenses/by/4.0/).
Copyright: This open access article is published under a Creative Commons CC BY 4.0 license, which permit the free download, distribution, and reuse, provided that the author and preprint are cited in any reuse.


