
Submitted:
25 June 2025
Posted:
27 June 2025
You are already at the latest version
Abstract
Results from both the Dark Energy Spectrograph Instrument and the Dark Energy Survey collaborations are shown to be compatible with a dark energy driven by star formation. The Landauer energy of the information associated with stars, galaxies, galaxy groups, and galaxy clusters provides a dark energy dependent on source temperature, which is in turn related to source mass. Combining this relation with a survey of stellar mass density measurements yields a predicted Information Dark Energy with CPL parameters: ω0 = -0.76, ωa = -1.29, reaching a maximum in the redshift range, 0.2<z<0.6. These characteristics are similar to the dark energy results of the Dark Energy Spectrograph Instrument and the Dark Energy Survey. A comparison is also made between the stellar mass density history required to account for the dark energy measurements against the actual stellar mass density measurement survey. Both approaches are consistent with a phantom Information Dark Energy driven by star and structure formation. This work emphasizes a data driven approach, combining stellar mass density measurements with the recent dark energy results. Information Dark Energy has the potential to resolve many problems of cosmology and should therefore be considered as a candidate for the source of dark energy.
Keywords:
Landauer’s Principle
; Dark Energy
; Dark Energy Experiment
1. Introduction
Landauer’s principle [1,2] states that each bit of information in a system at temperature, T, has a minimum equivalent energy of kB T ln 2. We can put this small quantity into perspective by considering the present ~10 zetabytes held worldwide in the cloud/ AI/ data centres. The data storage and networking aspects of these centres already use ~2 % of the total electricity generated worldwide. However, if all the 10 zetabytes in world data centres were to be erased, the total Landauer energy released as heat at ~300K is miniscule by comparison, only ~200 Joules. This is just the amount used by one electric kettle in 1/10 second. Landauer’s principle has now been proven experimentally [3,4,5,6] and, linking information to thermodynamics, also provides an important solution to the problem of Maxwell’s demon [7].
Despite the little impact that Landauer information energy has on our every day lives, it does nevertheless represent a major source of energy within the universe. A “Foundational Principle” proposed by Anton Zeilinger [8] considers the attributes of all particles, at their most fundamental level, correspond to elemental systems. These are effectively simple 1bit, ‘yes’/’no’, results of experimental inquiry. In a simple universe without star formation, the Landauer equivalent energy of a Zeilinger elemental particle attribute has been shown [9] to be defined exactly the same as the characteristic energy of a cosmological constant [10]. Moreover, the Landauer equivalent energy has been shown to contribute a significant Information Dark Energy, IDE [11,12,13,14,15,16] to the universe. The total information energy carried by matter, or represented by matter, is at a similar level to the total mc2 equivalent energy of the 1053 kg baryons in the universe (Figure 7 of [16]). Strong contributions are made by stellar heated gas and the intra-cluster gas within galaxy clusters.
The key to identifying the physical source of dark energy is in determining the dark energy density variation over the history of the universe. The latest results of the Dark Energy Spectrograph Instrument, DESI, [17] and the Dark Energy Survey, DES, [18] provide evidence for a dynamic dark energy, evidence that excludes the previously assumed cosmological constant at a level >3 σ.
A previous IDE publication [16] only compared IDE against the initial data from DESI and DES, whereas the present work applies the updated final published DESI and DES results. Two versions of the relation between temperature and mass of astrophysical objects are applied; one from a survey of galaxy and galaxy cluster measurements, and one derived from the DESI and DES results, assuming the IDE source of dark energy. This work also extends the Stellar Mass Density (SMD) measurements to higher redshifts. We compare the IDE prediction from the SMD measurement survey against the DES and DESI results. We also compare the SMD variation required to explain the DES and DESI measured values against the survey of SMD measurements, assuming an IDE source of dark energy.
2. Information Dark Energy
2.1. Temperature Dependence
The Landauer equivalent energy of each bit in any system is solely dependent on the system’s temperature. We find that the temperatures, T, of several astrophysical structures ranging in mass, M, from 0.1 solar mass, M⊙, to >1015 M⊙ , each follow a similar relation. The results of a large survey of measured galaxy, galaxy group, and galaxy cluster temperatures [19] have been shown, on average, to closely follow the T α Mp relation over the range <1012 M⊙ to >1015 M⊙ , illustrated in Figure 1 B & Figure 1C, where p=0.606. In Figure 1 A we see that the temperature of stars, from 10-1 M⊙ to 3 x 101 M⊙ in the seven main sequence spectral classes also follow the same relation with the same power, p. Note that the previous work on IDE [16] simply considered the values p=0.5, and p=1.0. In this work we also extend the survey of stellar mass density, SMD(a), measurements [20,21,22,23,24,25,26,27,28,29,30,31,32,33,34,35,36,37,38,39,40,41,42,43,44,45,46,47] used previously to include measurements at universe scale sizes, a<0.2, [48,49] where a is related to redshift, z, by a=1/(1+z).
2.2. CPL ω0-ωa Parameters
The time variation of the dark energy density is proportional to a-3(1+ω) , where ω is the dark energy equation of state parameter. Any dynamic form of dark energy requires a time varying value of ω(a). In order to account for a dynamic dark energy most experimental measurements of dark energy have adopted the common CPL [50] parameters: ω(a)= ω0 + (1-a) ωa . As the most recent DES and DESI dark energy results are published in ω0 - ωa parameter space, it is convenient to predict the IDE source of dark energy also in terms of ω0 - ωa space.
2.3. Predicted IDE in ω0 – ωa Space
The Stellar Mass Density is a universe-wide average mass density that changed with time and thus a function of universe scale size: SMD(a). We expect that IDE(a), being proportional to temperature, to vary as IDE(a) ∝ SMD(a)p. At the same time a CPL approximation of IDE energy density variation describes IDE(a) α a-3(1+ ω0 + ( 1 – a ) ωa) . Each ω0 - ωa combination describes the curve of dark energy density as a function of scale size. Assuming an IDE source of dark energy, the p value transfers that to a SMD(a) curve whose measure of fit to all the measured SMD(a) values [20,21,22,23,24,25,26,27,28,29,30,31,32,33,34,35,36,37,38,39,40,41,42,43,44,45,46,47,48,49] is given by a R2 coefficient of determination. R2 is defined as R2=1-(RSS/TSS), where RSS is the residual sum of squares, and TSS is the total sum of squares.
There are four DESI and DES dark energy derived ω0 - ωa combinations listed in Table 1. DESI combines BAO and CMB with three different sets of supernova measurements, Union3, DESY5, and Pantheon plus, to provide three ω0 -ωa values [17]. The most constrained DES ω0 -ωa value is listed for a combination of Baryon Acoustic Oscillation, BAO, Supernovae, SN, and Cosmic Microwave Background, CMB, measurements [18].
In Figure 2. the value of R2 is plotted as a function of p for each of the four experimentally derived DESI and DES ω0 - ωa values. The grey line is the average R2 of the four values. Shown below are the values of p determined from the temperatures and masses of galaxies and clusters using X-ray and lensing measurements [19]. Figure 2. enabled us to select two data driven values of p to better illustrate the similarity of dark energy history to star formation history. The value p=0.606 was determined directly by actual mass and temperature measurements of galaxy and clusters [19]. The value p=0.461 is determined from the maximum R2 of the average of all four DES and DESI measurements, assuming IDE. Note that the value p=0.606 also coincides with the maximum of the single DES measurement, and the value p=0.461 coincides with the maximum of the DESI BAO+CMB+Union3 measurement.
For all combinations of ω0 and ωa values in steps of 0.01, over the wide range +0.9 to -3.0, we found the best fit to SMD(a) measurements (maximum R2 ) that are also listed in Table 1 for the two chosen values of p. Both of these ω0 - ωa values lie well within the range determined by DESI and DES. These maximum R2, best fit values are listed in Table 2, together with the R2 values for the four DES & DESI ω0 - ωa values. The DES R2 values at p=0.606 and the DESI/Union3 at p=0.641 are high at 0.947, close to the maximum of 0.953 of all ω0 - ωa space for fits to this survey of SMD(a) measurements.
In Figure 3 we further illustrate the similarity between star/structure formation and dark energy histories. For each of the two selected values of p we provide 2 plots. The right-hand plot shows the four DESI and DES 68% and 95% likelihood plots as a function of ω0 and ωa . Superimposed are the >0.90 and >0.94 R2 contours of IDE over all ω0–ωa space derived solely from the survey of measured SMD(a). The location of centre points of DESI and DES plots (listed in Table 1) are highlighted together with the point of maximum R2 of the IDE plot. The left-hand plots illustrate how well the curves corresponding to those highlighted ω0 - ωa values fit the survey of stellar mass density measurements.
3. Discussion
It is clear from Figure 3 (Left-hand plots) and from the R2 values in Table2 that the DES most constrained result and the DESI BAO+CMB+Union 3 result both make a good fit to the SMD(a) measurement survey with curves closely following the highest R2 red curve. Moreover, the range in ω0 – ωa space that fits SMD(a) measurements with R2 >0.94 makes a good fit to the DESI and DES dark energy measurements (Figure 3. Right-hand plots). This suggests that the dark energy history is directly related to the history of astrophysical structure temperature and formation, as we expect for an IDE source.
Figure 4 provides an interpretation of predicted IDE and DES & DESI measurements.
Both the IDE prediction and DESI/DES measurements are consistent with a dark energy that was phantom (increasing energy density) throughout the majority of universe history but is now starting to decrease after recently reaching a maximum. The IDE prediction and DESI/DES measurements are also both consistent with a maximum located in the range 0.2 < z < 0.6.
Figure 3 (right-hand side) illustrates a difference of IDE contours in ω0 - ωa space between the two selected values of p. Figure 4 (thick black line) further illustrates this by showing how the maximum R2 point moves over a wider range of p values.
While the use of CPL parameters has facilitated comparisons between different experiments, and between experiments and theory, there is no reason to expect that the actual dark energy can be fully described by any particular CPL ω0 - ωa combination. It is worth noting the following caveat regarding its use. The relevant curves in Figure 3. (left-hand side plots) emphasize how small the decrease is since the maximum. The curves considered in Figure 3. make a good fit to the majority of data, located beyond the maximum. But we note that much closer to z=0 these CPL curves mostly lie below the SMD data points. Furthermore, other surveys of SMD measurements do not show a distinct peak at low z [51,52,53]. As the star formation rate has fallen rapidly in recent times, SMD ceases to increase and has lead to a near-constant value at very low redshifts. If the same effect applies to the dark energy measurements, then the highest dark energy density to date might be occurring now at z=0. Then the perceived recent peak in dark energy density at 0.2<z<0.6 might be just an illusion created by the best CPL parameter fit being primarily determined by higher z data.
The expanding universe has lead to overall matter and radiation energy densities naturally falling as a-3 and a-4 respectively. In contrast, the stellar mass density and the dark energy density have both increased over time, in a way that is consistent with IDE being the dark energy source driven by star and structure formation. This work emphasizes simplicity, wielding Occam’s razor, and naturalness, relying on mostly proven physics, with a strong dependence on data. The potential of IDE to solve problems of cosmology has been covered before (see [16]) and is listed briefly again here for completeness and summarised in Table 3:
- Information/entropy estimates show that IDE can account for the value of the present dark energy density (see Figure 7 of [16]).
- As IDE fits the latest ω0 – ωa experiment data much better than Ʌ, then the Cosmological Constant problem could be resolved by assuming Ʌ=0, a more likely value [54].
- As the maximum star formation has only occurred recently (now?), this is the most likely time for intelligent beings to have evolved to live in the dark energy dominated epoch, effectively resolving the “Why now?” Cosmological Coincidence problem.
- As the information energy of matter is clumped in astrophysical structures at a similar energy density to matter, IDE may account for some dark matter attributed effects.
4. Summary
The approach taken here has been primarily driven by data and indicates a strong similarity between stellar mass density and dark energy histories. We have shown that IDE predicts a dark energy history that matches the dark energy measurements of DESI and DES with a clear overlap in ω0 – ωa space. Equally, the SDM(a) variation required for an IDE source of dark energy to provide the experimentally measured dark energy ω0 – ωa combinations matches the measured SDM(a) measurements. The fit between IDE prediction and the latest DES and DESI results, combined with IDE’s ability to resolve many dark side problems and tensions, suggests IDE should be considered a strong candidate for the source of observed dark energy.
Funding
This research received no external funding.
Institutional Review Board Statement
Not applicable.
Data Availability Statement
Data available in a publicly accessible repository.
Acknowledgments
This work was enabled by the award of Emeritus Professor of Space Science from the University of Sussex.
Conflicts of Interest
The author declares no conflicts of interest.
References
- Landauer, R. Irreversibility and heat generation in the computing process. IBM J. Research and Development 1961, 3, 183–191. [Google Scholar] [CrossRef]
- Landauer, R. Information is physical. Physics Today 1991, 44, 23–29. [Google Scholar] [CrossRef]
- Toyabe, S.; Sagawa, T.; Ueda, M.; Muneyuki, E.; Sano, M. Experimental demonstration of information-to-energy conversion and validation of the generalized Jarzynski equality. Nature Physics 2010, 6, 988–992. [Google Scholar] [CrossRef]
- Berut, A.; Arakelyan, A.; Petrosyan, A.; Ciliberto, A.; Dillenschneider, R.; Lutz, E. Experimental verification of Landauer’s principle linking information and thermodynamics. Nature 2012, 483, 187–189. [Google Scholar] [CrossRef] [PubMed]
- Jun, Y.; Gavrilov, M.; Bechhoefer, J. High-PrecisionTest of Landauer’s Principle in a Feedback Trap. Phys.Rev. Let. 2014, 113. 190601-1 to -5. [Google Scholar] [CrossRef]
- Yan, L.I.; et al. Single Atom Demonstration of the Quantum Landauer Principle, Phys. Rev. Let. 2018, 120, 210601. [Google Scholar] [CrossRef]
- Leff, H.S.; Rex, A.F. Maxwell’s Demon 2; Institute of Physics Publishing, 1990; ISBN 0-7503-0759-5. [Google Scholar]
- Zeilinger, A. A Foundational Principle of Quantum Mechanics. Foundations of Physics 1999, 29, 631–643. [Google Scholar] [CrossRef]
- Gough, M.P.; Carozzi, T.; Buckley, A.M. On the similarity of Information Energy to Dark Energy. Physics Essays 2006, 19, 446–450. [Google Scholar] [CrossRef]
- Peebles, P.J.E. Principles of Physical Cosmology. Princeton University Press: Princeton NJ, USA, 1993; ISBN 978-0691209814. [Google Scholar]
- Gough, M.P. Information Equation of State. Entropy 2008, 10, 150–159. [Google Scholar] [CrossRef]
- Gough, M.P. Holographic Dark Information Energy. Entropy 2011, 13, 924–935. [Google Scholar] [CrossRef]
- Gough, M.P. Holographic Dark Information Energy: Predicted Dark Energy Measurement. Entropy 2013, 15, 1133–1149. [Google Scholar] [CrossRef]
- Gough, M.P. A Dynamic Dark Information Energy Consistent with Planck Data. Entropy 2014, 16, 1902–1916. [Google Scholar] [CrossRef]
- Gough, M.P. Information Dark Energy can Resolve the Hubble Tension and is Falsifiable by Experiment. Entropy 2022, 24, 385–399. [Google Scholar] [CrossRef]
- Gough, M.P. Evidence for a dark energy driven by star formation: Information Dark Energy. Entropy 2025, 27, 110. [Google Scholar] [CrossRef] [PubMed]
- DESI Collaboration. DESI 2024 VI: cosmological constraints from the measurements of baryon acoustic oscillations. Journal of Cosmology and Astroparticle Physics, 2025/02/21. [CrossRef]
- DES CollaboArration. Dark Energy Survey: implications for cosmological expansion models from the final DES Baryon Acoustic Oscillation and Supernova data. arXiv:2503.06712v1.9th March 2025. [Google Scholar] [CrossRef]
- Babyk, I.V.; McNamara, B.R. The Halo Mass-Temperature Relation for Clusters, Groups, and Galaxies. Astrophysical Journal 2023, 946, 54. [Google Scholar] [CrossRef]
- Li, C.; White, S.D.M. The distribution of stellar mass in the low-redshift universe. Mon. Not. R. Astron. Soc. 2009, 398, 2177–2187. [Google Scholar] [CrossRef]
- Gallazzi, A.; Brinchmann, J.; Charlot, S.; White, S.D.M. A census of metals and baryons in stars in the local universe. Mon. Not. R. Astron. Soc. 2008, 383, 1439–1458. [Google Scholar] [CrossRef]
- Moustakas, J.; et al. PRIMUS: constraints on star formation quenching and Galaxy merging and the evolution of the stellar mass function from z=0-1. Astrophys. J. 2013, 767, 50. [Google Scholar] [CrossRef]
- Bielby, R.; et al. The WIRCam Deep Survey. I. Counts, colours, and mass functions derived from near-infrared imaging in the CFHTLS deep fields. Astron. Astrophys. 2012, 545, A23. [Google Scholar] [CrossRef]
- Perez-Gonzalez, P.G.; et al. The stellar mass assembly of galaxies from z=0-4: analysis of a sample selected in the rest-frame near infrared with Spitzer. Astrophys. J. 2008, 675, 234–261. [Google Scholar] [CrossRef]
- Ilbert, O.; et al. Mass assembly in quiescent and star-forming Galaxies since z >4 from UltraVISTA. Astron.Astrophys. 2013, 556, A55. [Google Scholar] [CrossRef]
- Muzzin, A.; et al. The evolution of the stellar mass functions of star-forming and quiescent galaxies to z=4 from the COSMOS/UltraVISTA survey. Astrophys. J. 2013, 777, 18. [Google Scholar] [CrossRef]
- Arnouts, S.; et al. The SWIRE-VVDS-CFHTLS surveys: Stellar Assembly over the last 10Gyr. Astron. Astrophys. 2007, 476, 137–150. [Google Scholar] [CrossRef]
- Pozzetti, L.; et al. zCOSMOS -10k bright spectroscopic sample. The bimodality in the galaxy stellar mass function. Astron. Astrophys. 2010, 523, A13. [Google Scholar] [CrossRef]
- Kajisawa, M.; et al. MOIRCS deep survey IV evolution of galaxy stellar mass function back to z 3. Astrophys. J. 2009, 702, 1393–1412. [Google Scholar] [CrossRef]
- Marchesini, D.; van Dokkum, P.G.; Forster Schreiber, N.M.; Franx, M.; Labbe, I.; Wuyts, S. The evolution of the stellar mass function of galaxies from z=4 and the first comprehensive analysis of its uncertainties. Astrophys. J. 2009, 701, 1765–1769. [Google Scholar] [CrossRef]
- Reddy, N.A.; et al. GOODS-HERSCHEL measurements of the dust attenuation of typical star forming galaxies at high redshift. Astrophys. J. 2012, 744, 154. [Google Scholar] [CrossRef]
- Caputi, K.J.; Cirasuolo, M.; Jdunlop, J.S.; McLure, R.J.; Farrah, D.; Almaini, O. The stellar mass function of the most massive Galaxies at 3<z<5 in the UKIDSS Ultra Deep Survey. Mon. Not. R. Astron. Soc. 2011, 413, 162–176. [Google Scholar] [CrossRef]
- Gonzalez, V.; Labbe, I.; Bouwens, R.J.; Illingworth, G.; Frank, M.; Kriek, M. Evolution of galaxy stellar mass functions, mass densities, and mass-to light ratios from z 7 to z 4. Astrophys. J. 2011, 735, L34. [Google Scholar] [CrossRef]
- Lee, K.S.; et al. How do star-forming galaxies at z>3 assemble their masses? Astrophys. J. 2012, 752, 66. [Google Scholar] [CrossRef]
- Cole, S.; et al. The 2dF galaxy redshift survey. Mon. Not. R. Astron. Soc. 2001, 326, 255–273. [Google Scholar] [CrossRef]
- Dickinson, M.; Papovich, C.; Ferguson, H.C.; Budavari, T. The evolution of the global stellar mass density a 0 < z < 3. Astrophys. J. 2003, 587, 25–40. [Google Scholar] [CrossRef]
- Rudnick, G.; et al. The rest-frame optical luminosity density, colour, and stellar mass density of the universe from z = 0 to z = 3. Astrophys. J. 2003, 599, 847–864. [Google Scholar] [CrossRef]
- Brinchmann, J.; Ellis, R.S. The ma.ss assembly and star formation characteristics of field galaxies of known morphology. Astrophys. J. 2000, 536, L77–L80. [Google Scholar] [CrossRef]
- Elsner, F.; Feulner, G.; Hopp, U. The impact of Spitzer infrared data on stellar mass estimates. Astron. Astrophys. 2008, 477, 503–512. [Google Scholar] [CrossRef]
- Drory, N.; Salvato, M.; Gabasch, A.; Bender, R.; Hopp, U.; Feuler, G.; Pannella, M. The stellar mass function of galxies to z 5. Astrophys. J. 2005, 619, L131–L134. [Google Scholar] [CrossRef]
- Drory, N.; Alvarez, M. The contribution of star formation and merging to stellar mass buildup in galaxies. Astrophys.J. 2008, 680, 41–53. [Google Scholar] [CrossRef]
- Fontana, A.; et al. The assembly of massive galaxies from near Infrared observations of Hubble deep-field south. Astrophys. J. 2003, 594, L9–L12. [Google Scholar] [CrossRef]
- Fontana, A.; et al. The galaxy mass function up to z=4 in the GOODS-MUSIC sample. Astron. Astrophys. 2006, 459, 745–757. [Google Scholar] [CrossRef]
- Cohen, J.G. CALTECH faint galaxy redshift survey. Astrophys. J. 2002, 567, 672–701. [Google Scholar] [CrossRef]
- Conselice, C.J.; Blackburne, J.A.; Papovich, C. The luminosity, stellar mass, and number density evolution of field galaxies. Astrophys. J. 2005, 620, 564–583. [Google Scholar] [CrossRef]
- Borch, A.; et al. The stellar masses of 25000 galaxies at 0.2. Astron. Astrophys. 2006, 453, 869–881. [Google Scholar] [CrossRef]
- Madau, P.; Dickinson, M. Cosmic Star Formation History. Ann. Rev. Astron. Astrophys. 2014, 52, 415–486. [Google Scholar] [CrossRef]
- Yabe, K.; Ohta, K.; Iwata, I.; Sawicki, M.; Tamura, N.; Akiyama, M.; Aoki, K. The stellar populations of Lyman break galaxies at z~5. Astrophys. J. 2009, 693, 507. [Google Scholar] [CrossRef]
- Labbe, I.; Oesch, P.A.; Bouwens, R.J.; Illingworth, G.D.; Magee, D.; Gonzalez, V.; Carollo, C.M.; Franx, M.; Trenti, M.; van Dokkkum, P.G.; et al. The spectral energy distributions of z = 8 galaxies from the IRAC ultra deep fields. Astrophys. J. 2013, 777, L19. [Google Scholar] [CrossRef]
- Chevallier, M.; Polarski, D. Accelerating universes with scaling dark matter. Int. J. Mod. Phys. 2001, D. 10, 213–224. [Google Scholar] [CrossRef]
- Wilkins S., M.; Trentham, N.; Hopkins A., M. The evolution of stellar mass and the implied star formation history. MNRAS 2008, 385, 687. [Google Scholar] [CrossRef]
- Driver, S.P.; et al. GAMA/G10-COSMOS/3D-HST: the 0 < z < 5 cosmic star formation history, stellar-mass, and dust-mass densities. MNRAS 2018, 475, 2891 (D18). [Google Scholar] [CrossRef]
- Koushan, S.; Driver, S.P.; et al. GAMA/DEVILS: constraining the cosmic star formation history from improved measurements of the 0.3–2.2 μ m extragalactic background light. MNRAS 2021, 503, 2033–2052. [Google Scholar] [CrossRef]
- Weinberg, S. The cosmological constant problem. Rev. Mod. Phys. 1989, 61, 1–23. [Google Scholar] [CrossRef]
- Benevento, G.; Hu, W.; Raven, M. Can late dark energy raise the Hubble constant? Phys. Rev. D 2020, 101, 103517-1-7. [Google Scholar] [CrossRef]
- Keeley, R.; Joudaki, S.; Kaplinghat, M.; Kirkby, D. Implications of a transition in the dark energy equation of state for the H0 and σ8 tensions. J. Cosmol. Astropart. Phys. 2019, 12, 035. [Google Scholar] [CrossRef]
- Peracaula, J.S.; Gomez-Valent, A.; De Cruz Perez, J.; Moreno-Pulido, C. Running vacuum against the H0 and σ8 tensions. Exploring the Frontiers of Physics 2021, 134, 19001. [Google Scholar] [CrossRef]
- McGaugh, S.S.; Lelli, F.; Schombert, J.M. The Radial Acceleration Relation in Rotationally Supported Galaxies. Phys. Rev. Lett. 2016, 117. 201101-1 to -6. [Google Scholar] [CrossRef]
- Lelli, F.; McGaugh, S.S.; Schombert, J.M.; Pawlowski, M.S. One Law to Rule them all: the Radial Acceleration relation of Galaxies. Astrophys. J. 2017, 836, 152. [Google Scholar] [CrossRef]
Figure 1.
The red lines correspond to temperature proportional to (mass)0.606 in all three plots: A, Main sequence star spectral classes; B & C, Galaxies, galaxy groups & galaxy clusters adapted from Figs 2 and 4 of [19].
Figure 1.
The red lines correspond to temperature proportional to (mass)0.606 in all three plots: A, Main sequence star spectral classes; B & C, Galaxies, galaxy groups & galaxy clusters adapted from Figs 2 and 4 of [19].
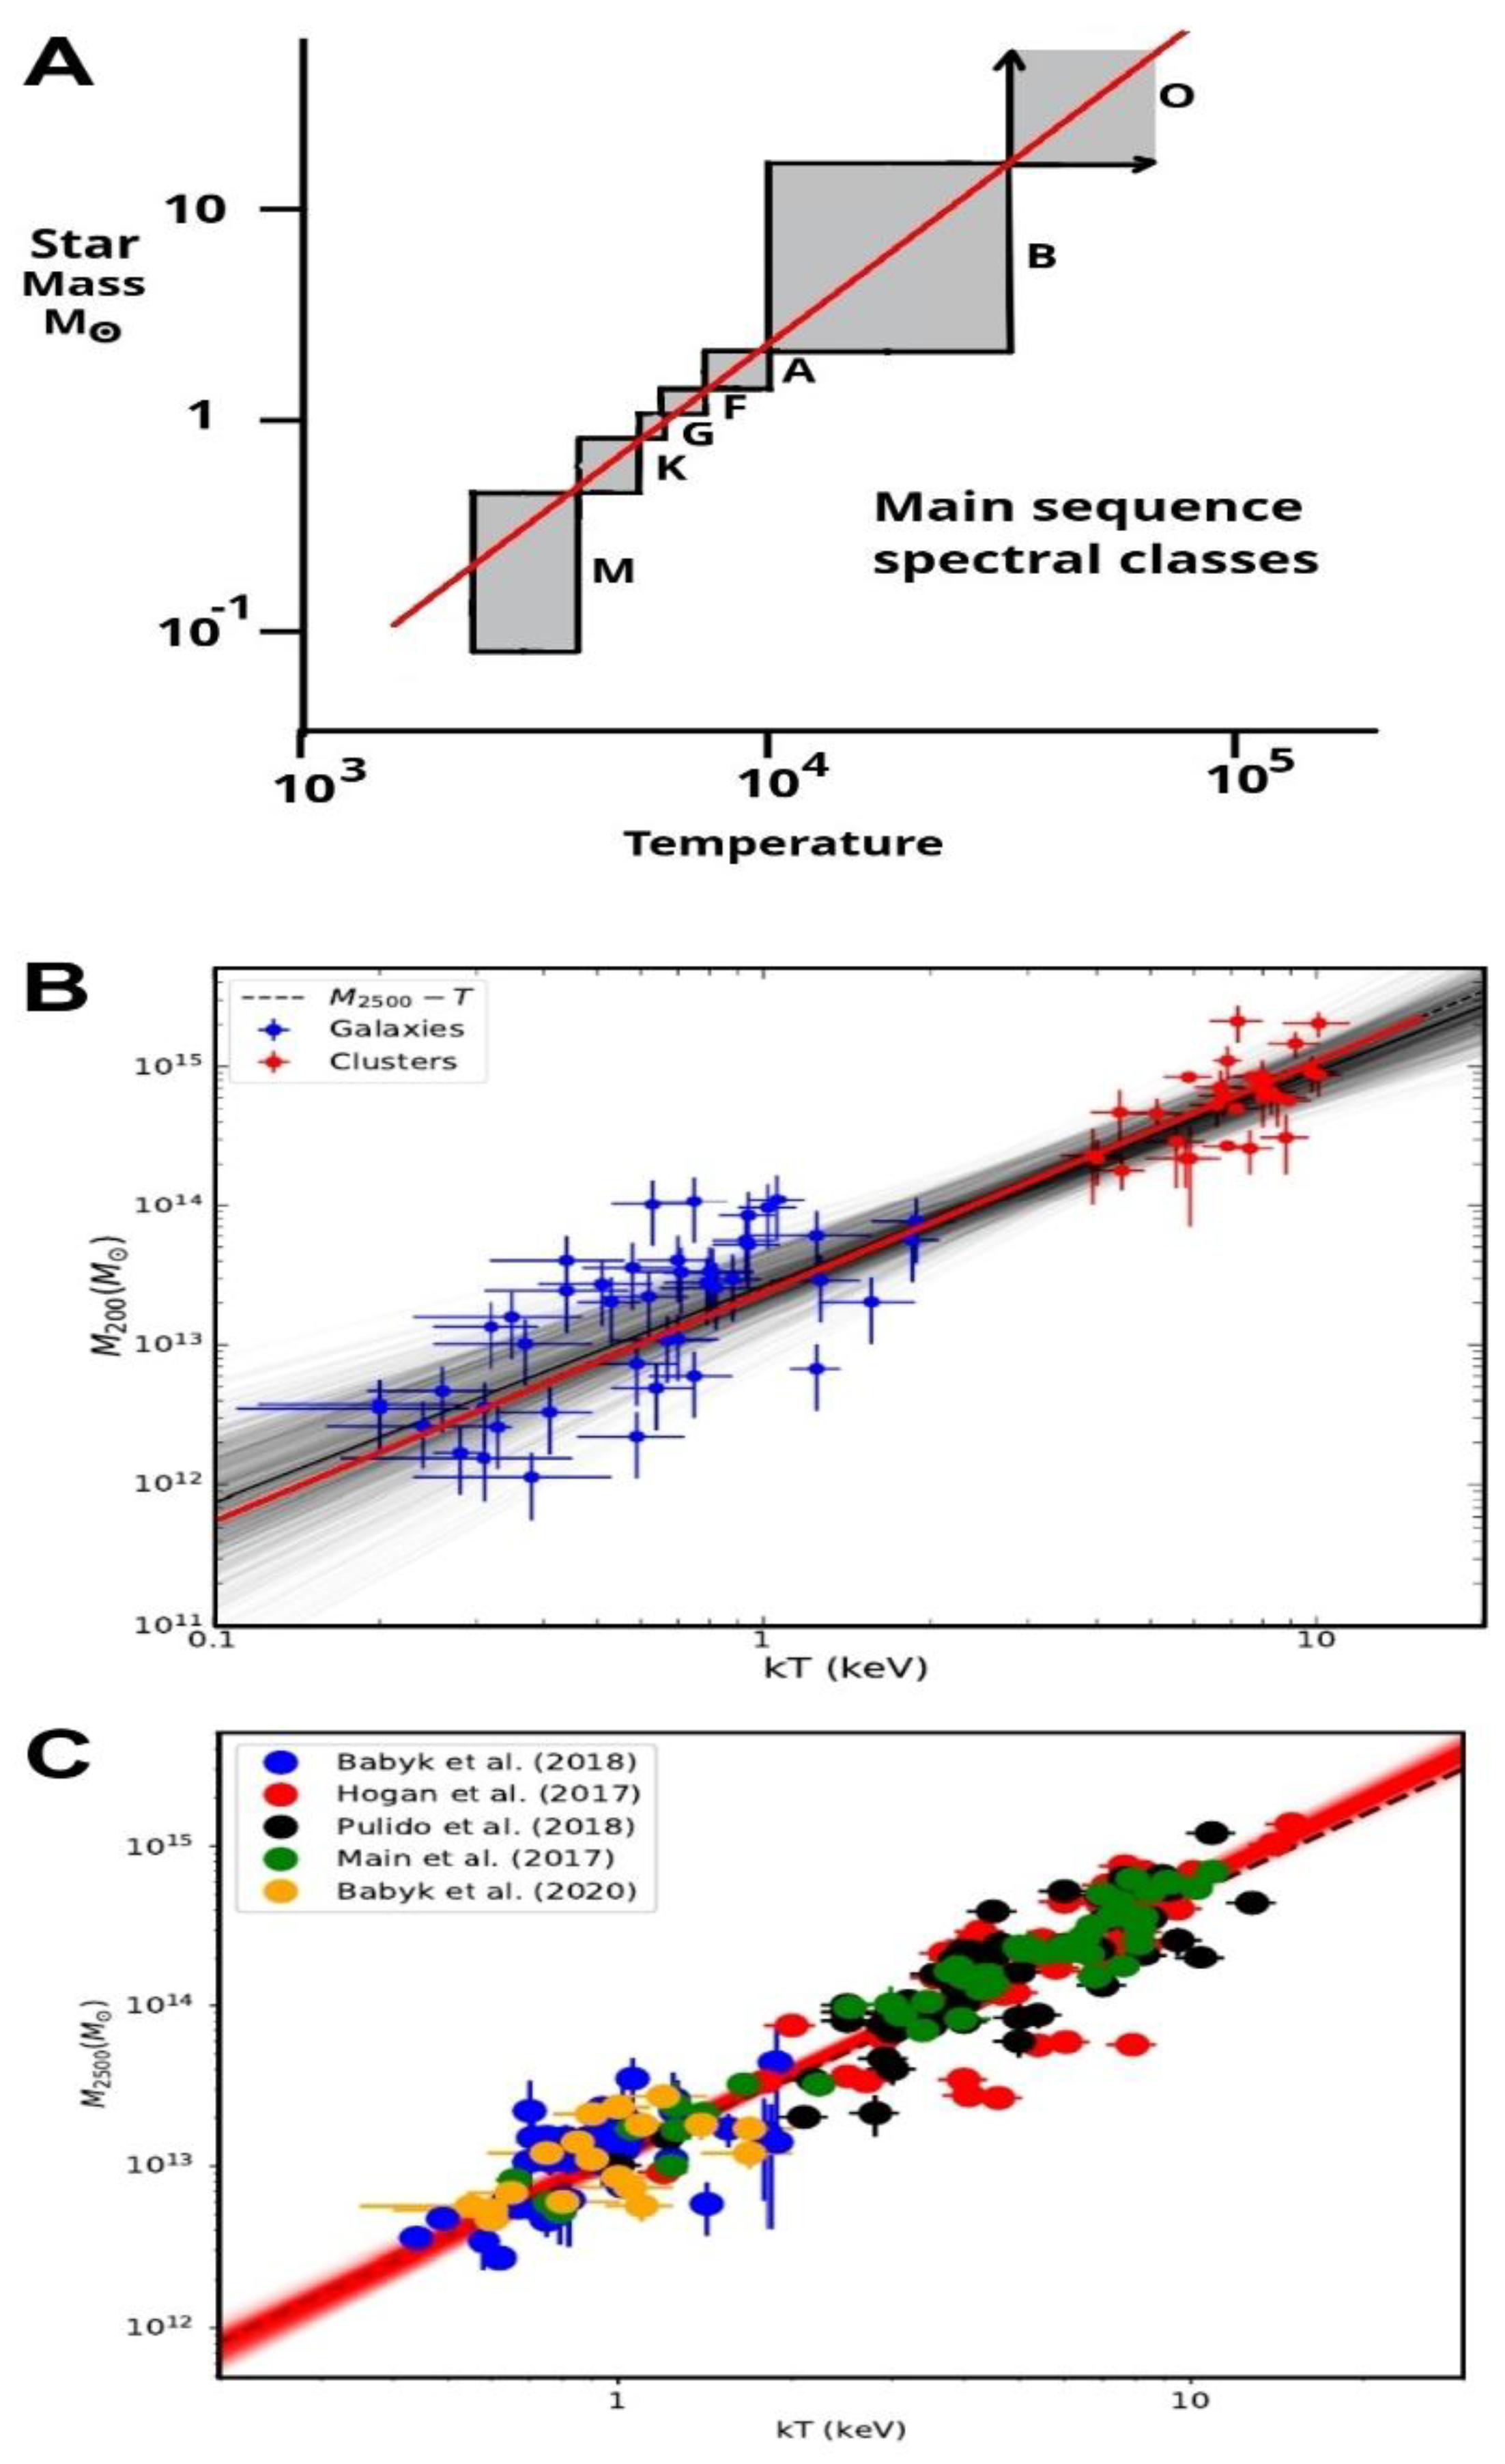
Figure 2.
Plot of the variation of the R2 coefficient of determination against p for each of the three DESI and one DES ω0 -ωa CPL values listed in Table 1. The grey curve is the average of all four. The measured p values for galaxies, groups and galaxy clusters shown below is taken from [19].
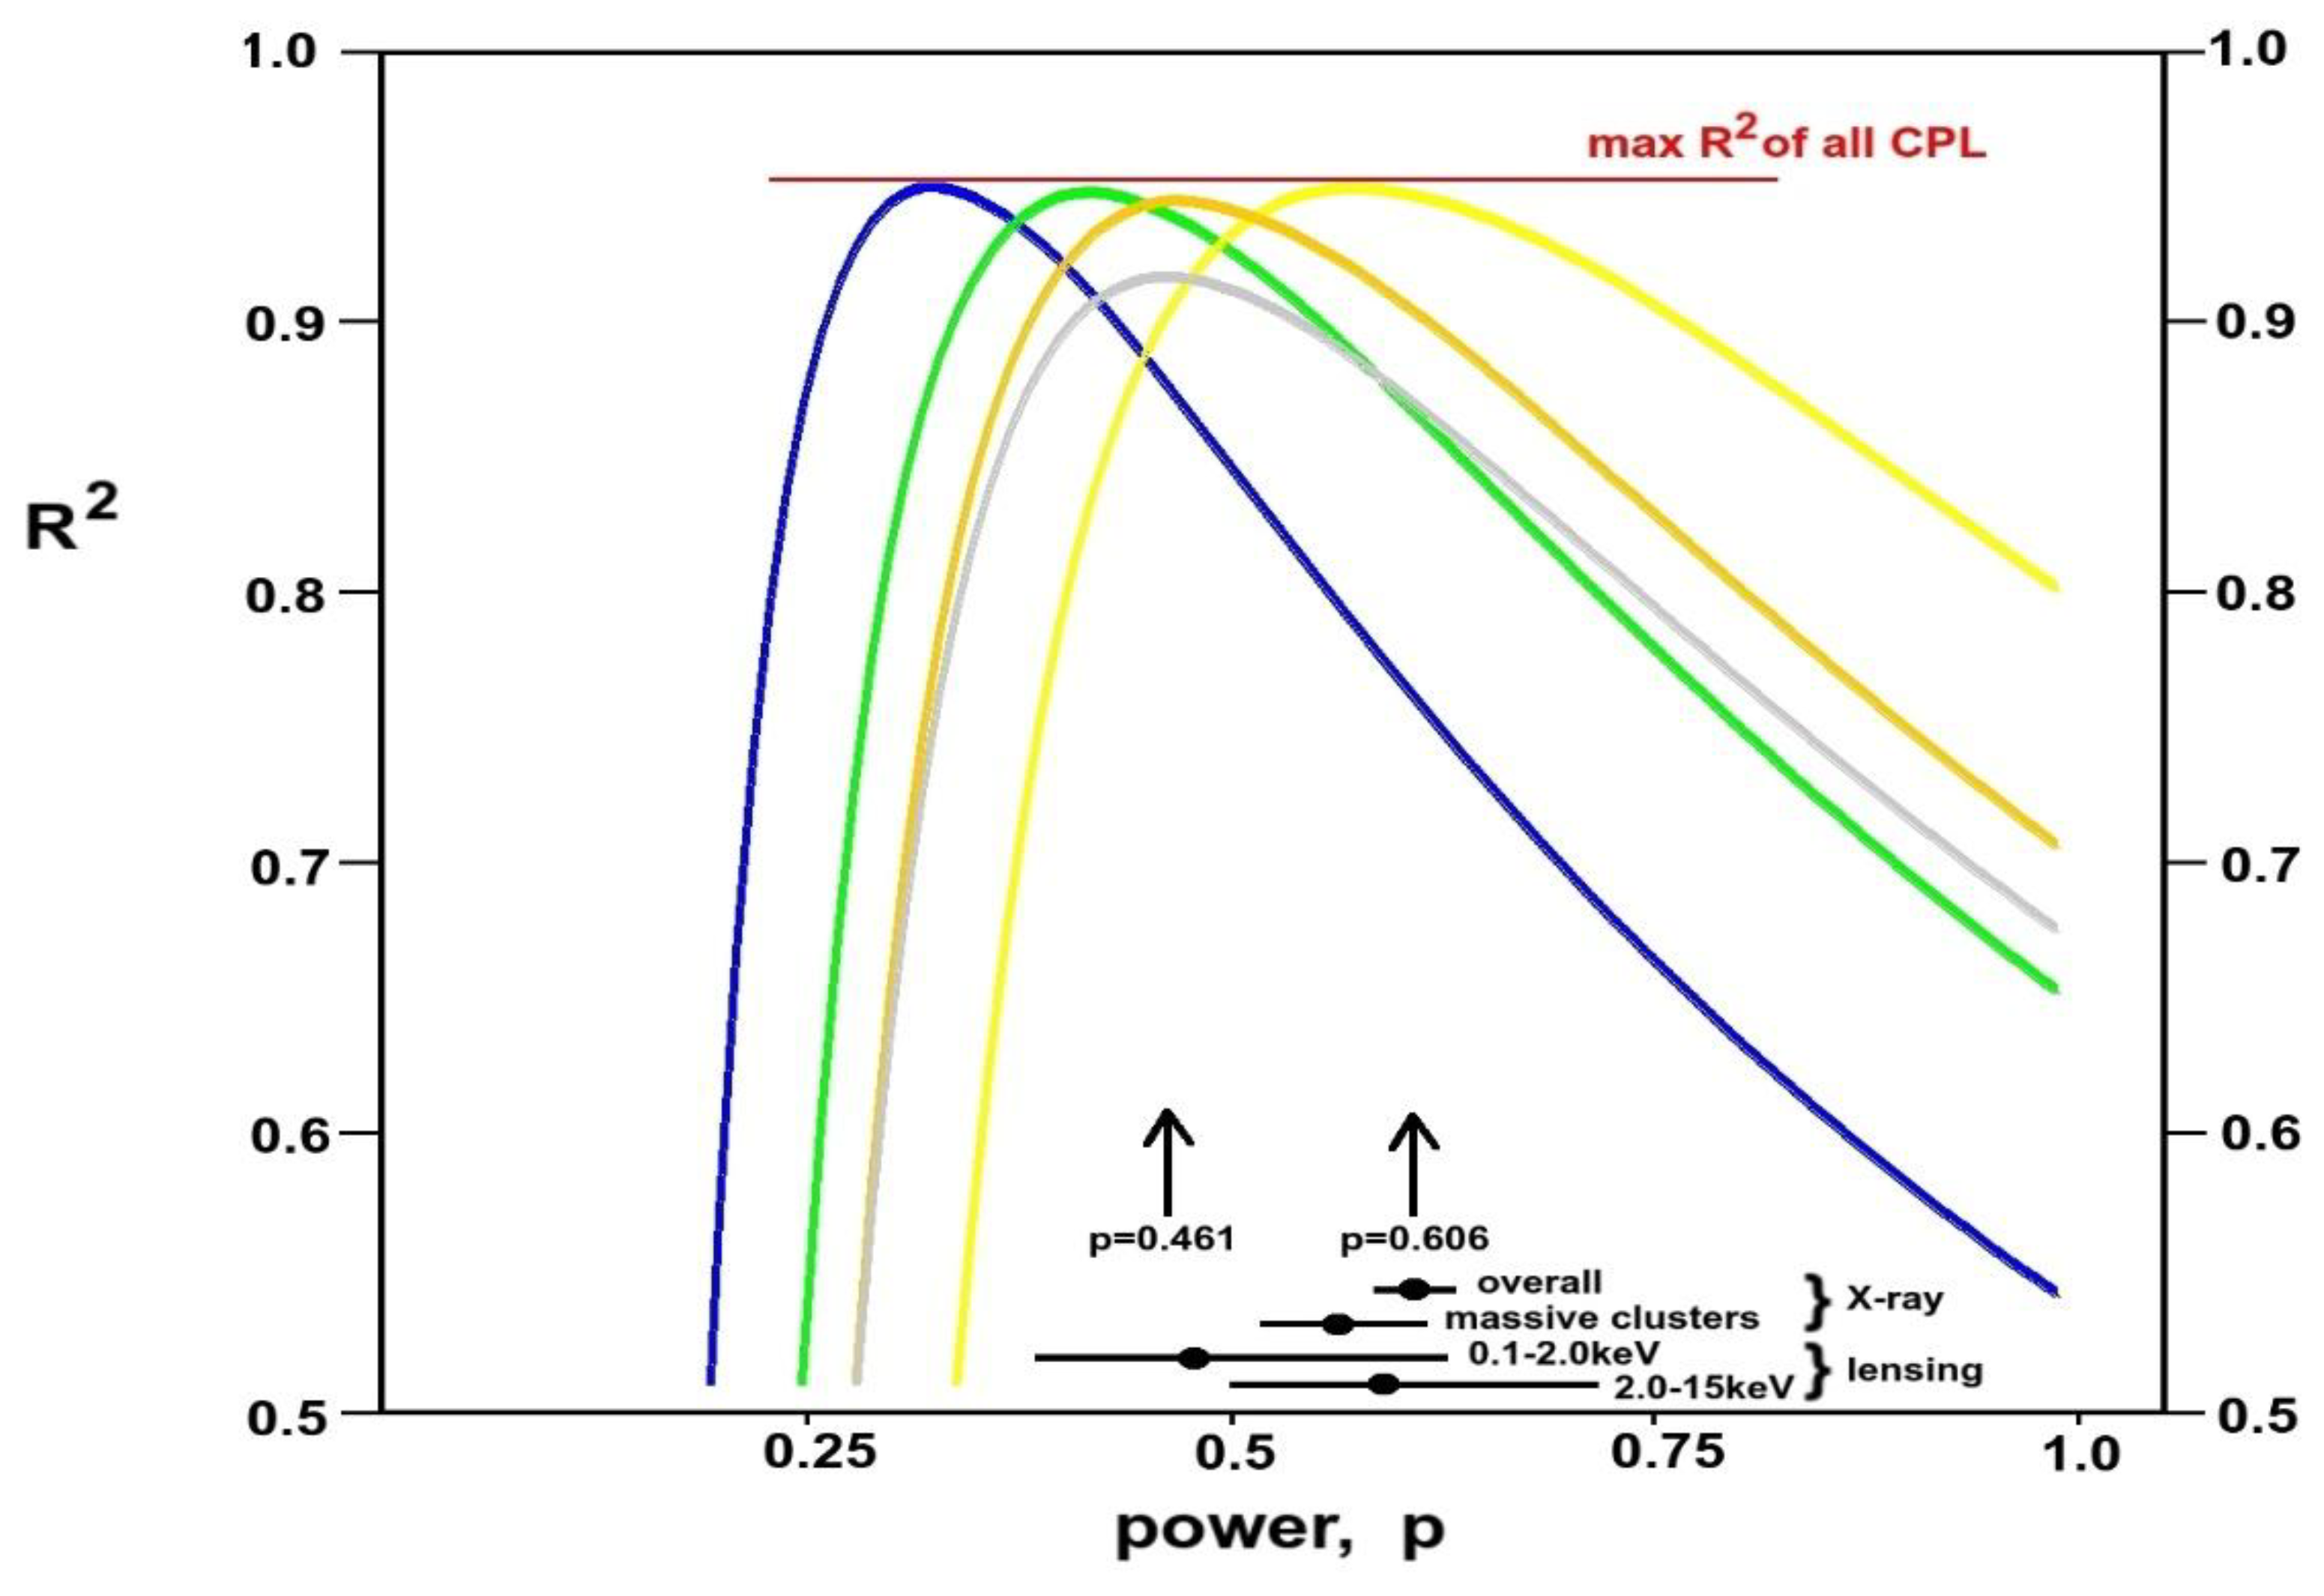
Figure 3.
Predicted IDE ω0 -ωa space contours for R2 > 0.90 and R2 > 0.94 are compared against the measured dark energy 68% and 95% likelihood contours of DESI and DES on the right-hand side. The coloured circles indicate the relevant ω0 - ωa peak locations, and used to define the relevant curves on the left-hand side for comparison against the survey of stellar mass density measurements [20,21,22,23,24,25,26,27,28,29,30,31,32,33,34,35,36,37,38,39,40,41,42,43,44,45,46,47,48,49]. Upper plots are for p=0.606 and lower plots are for p=0.461.
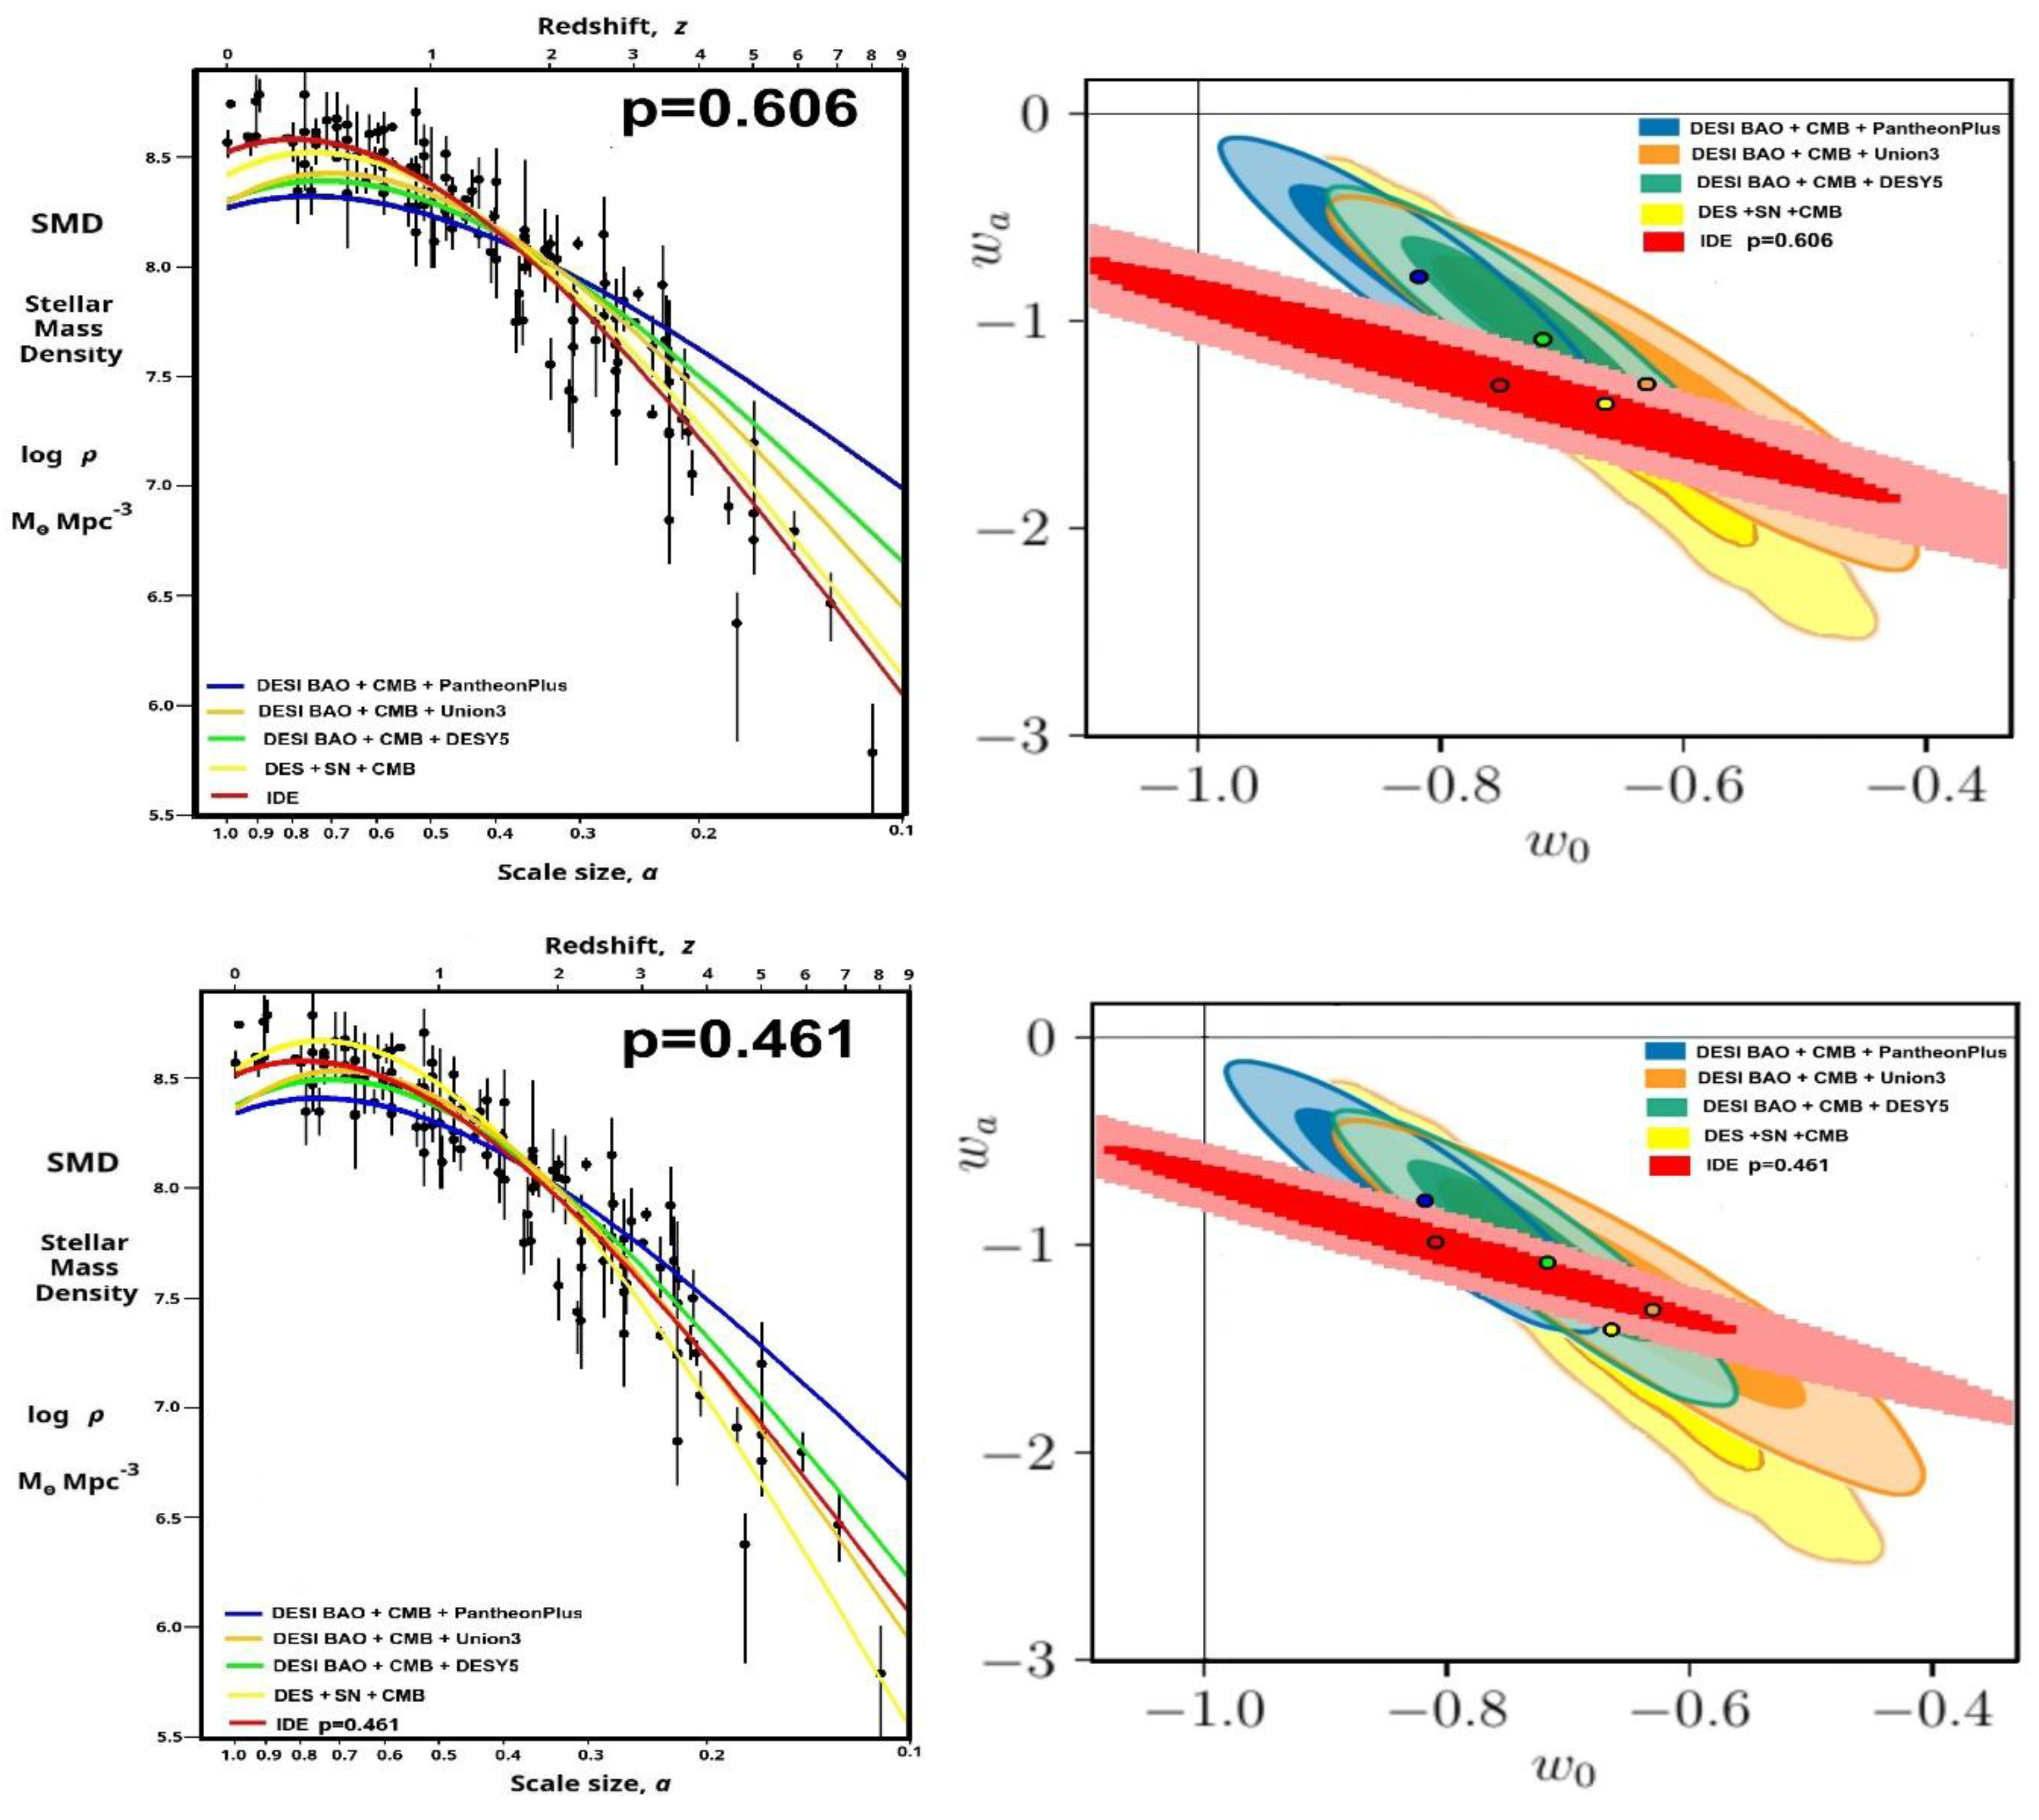
Figure 4.
Interpretation of the predicted IDE result with the dark energy measurements of DESI and DES as a phantom dark energy that reached a maximum in the range 0.2<z<0.6. The thick black line indicates how the IDE peak and contours move with different values of p.
Figure 4.
Interpretation of the predicted IDE result with the dark energy measurements of DESI and DES as a phantom dark energy that reached a maximum in the range 0.2<z<0.6. The thick black line indicates how the IDE peak and contours move with different values of p.
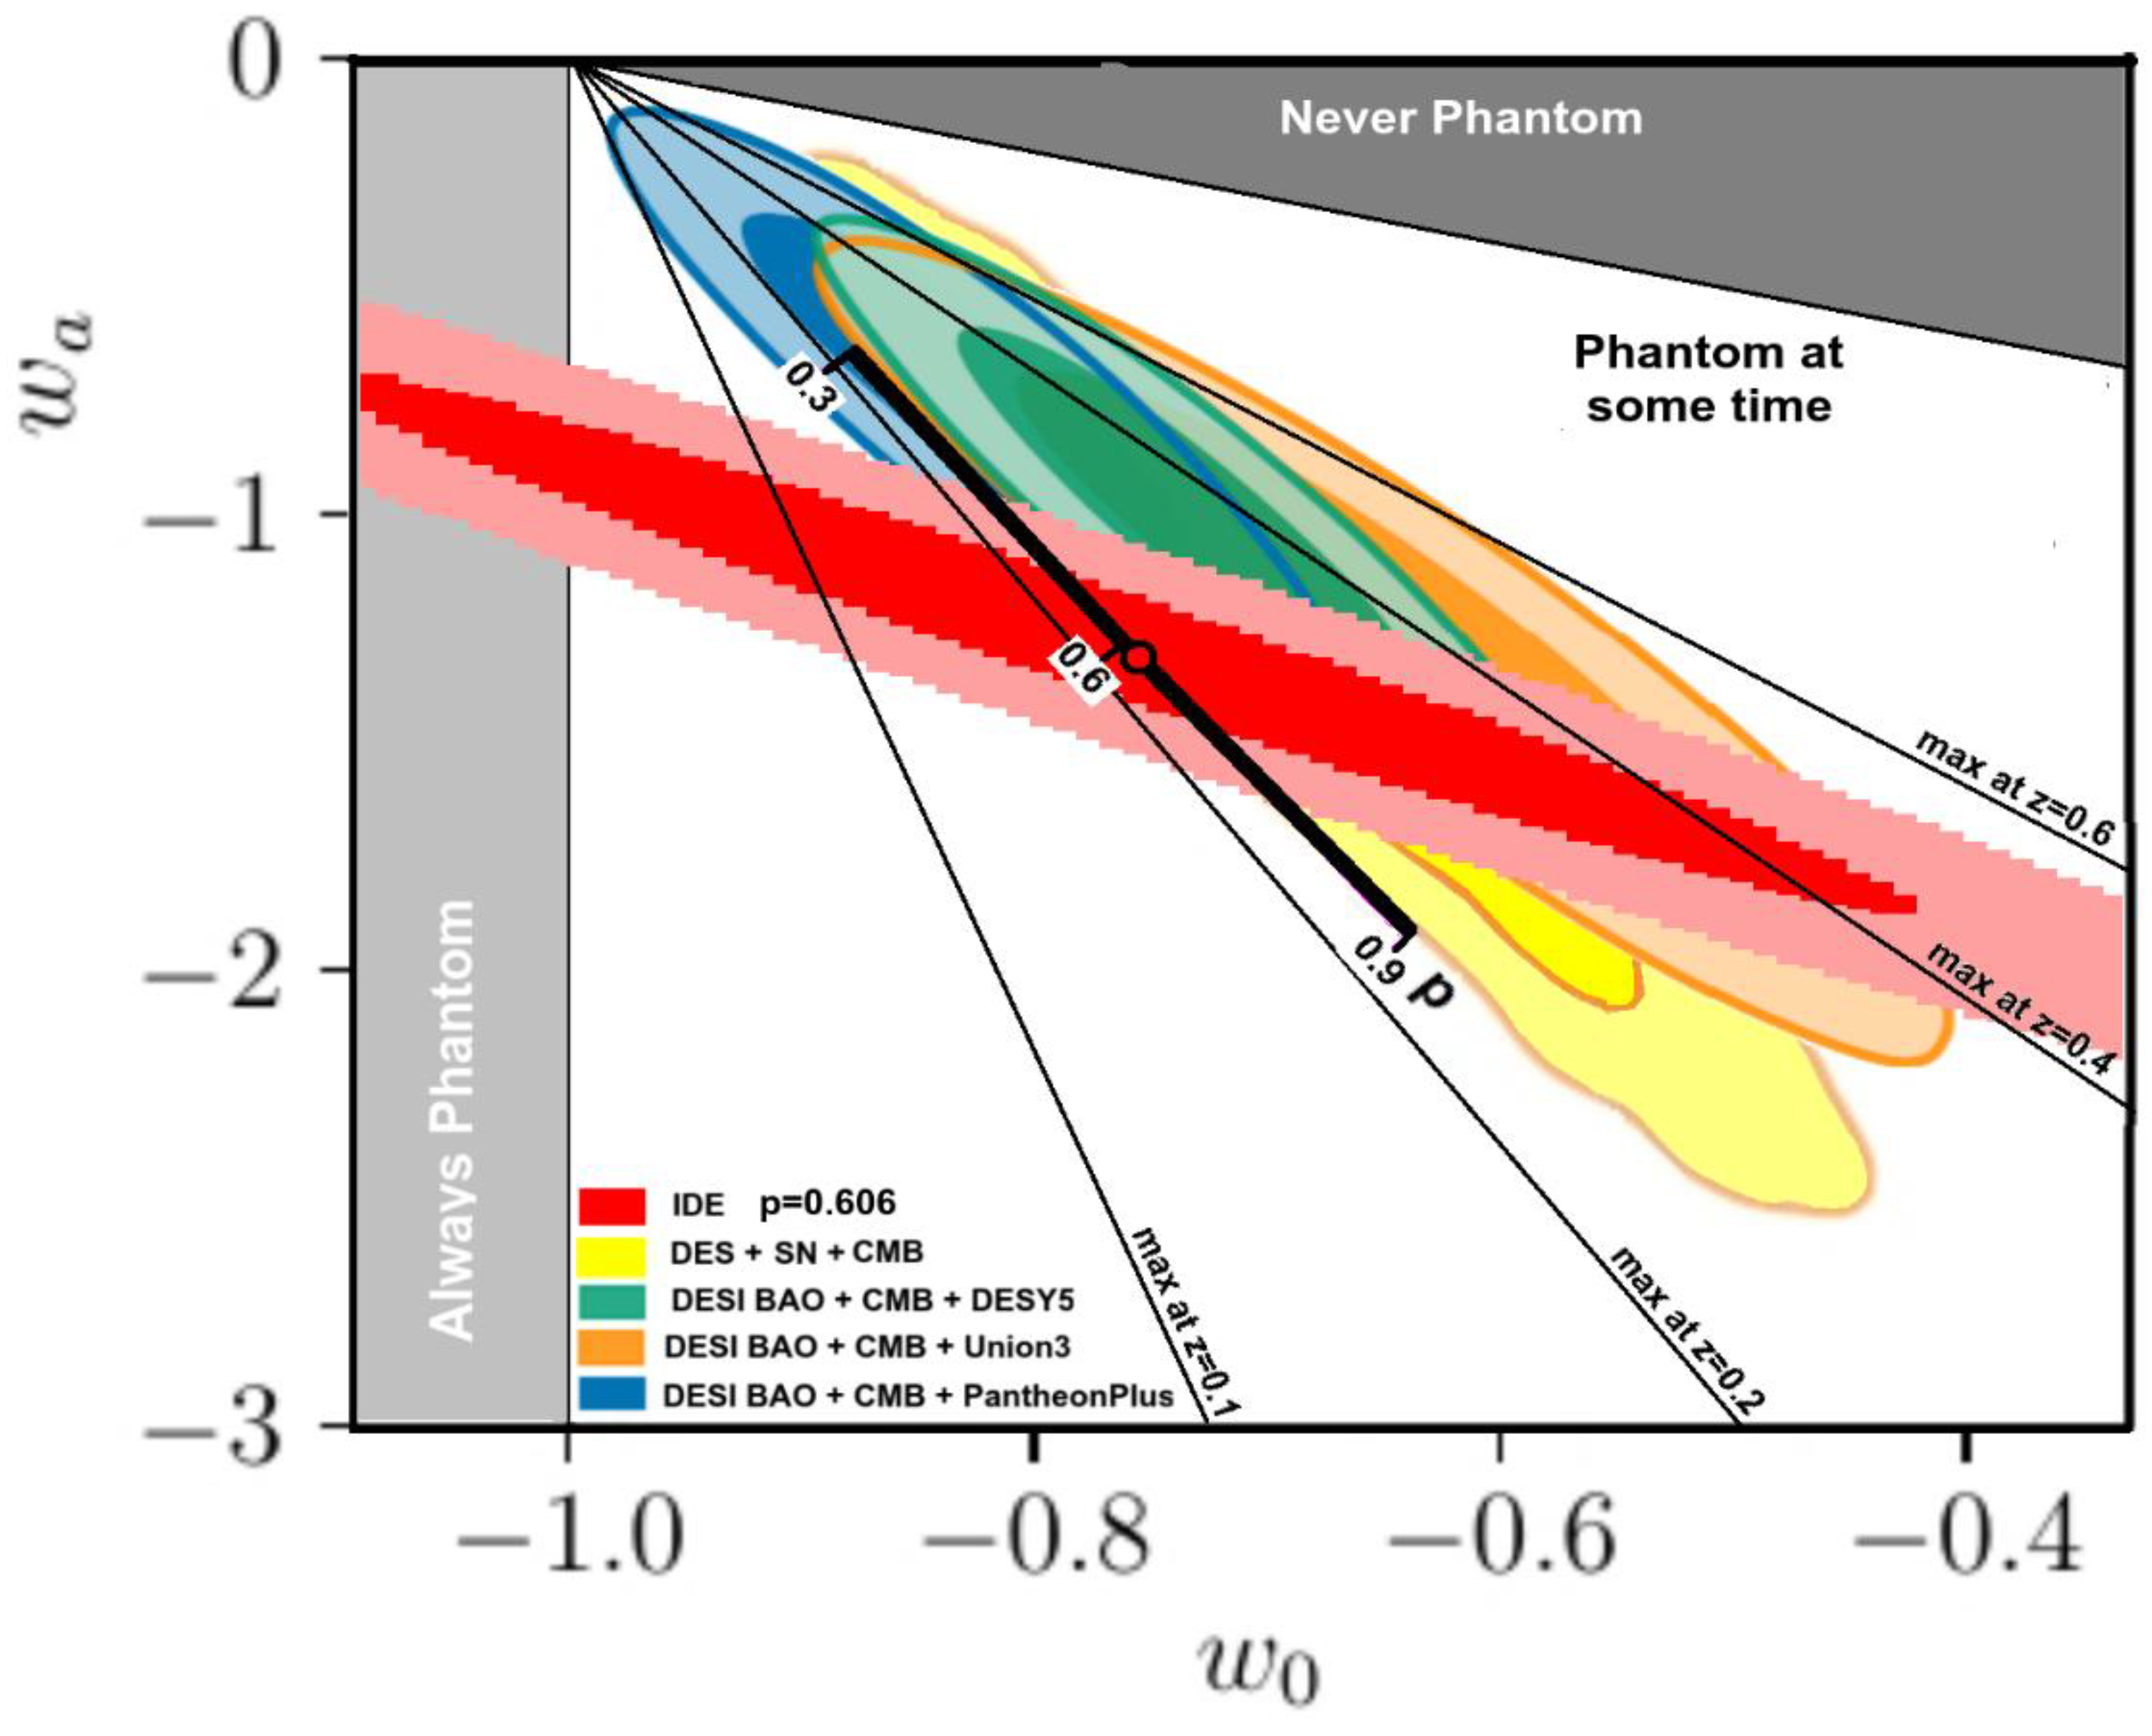

Table 1.
Published dark energy ω0 - ωa CPL values for DES and three DESI combinations of measurement types compared with the best CPL fit to SMD(a)p for the two p cases studied here. The assigned colours listed are used consistently in Figure 2, Figure 3 and Figure 4.
| ω0 | ωa | plot | |
| DES: BAO+SN+CMB | -0.67±0.10 | -1.37±0.50 | |
| DESI: BAO+CMB+Union3 | -0.64±0.10 | -1.27±0.37 | |
| DESI: BAO+CMB+DESY5 | -0.73±0.07 | -1.05±0.29 | |
| DESI: BAO+CMB+Pantheon plus | -0.83±0.06 | -0.75±0.27 | |
| Best CPL fit to SMD(a) with p=0.606 | -0.76 | -1.29 | |
| Best CPL fit to SMD(a) with p=0.461 | -0.81 | -0.99 |
Table 2.
Assuming an IDE source of dark energy and with temperature proportional to (mass)p , the coefficients of determination, R2, show how well the ω0 - ωa values of Table 1 fit the survey of SMD(a) measurements.
Table 2.
Assuming an IDE source of dark energy and with temperature proportional to (mass)p , the coefficients of determination, R2, show how well the ω0 - ωa values of Table 1 fit the survey of SMD(a) measurements.
| R2 | ||
| p=0.606 | p=0.461 | |
| IDE: best CPL fit ( highest R2 ) | 0.953 | 0.953 |
| DES: BAO+SN+CMB | 0.947 | 0.912 |
| DESI: BAO+CMB+Union3 | 0.904 | 0.947 |
| DESI: BAO+CMB+DESY5 | 0.866 | 0.94 |
| DESI: BAO+CMB+Pantheon plus | 0.76 | 0.874 |
Table 3.
Potential of IDE to resolve many problems of cosmology. Comparison of IDE against ɅCDM, scalar fields/ quintessence, & MOND.
Table 3.
Potential of IDE to resolve many problems of cosmology. Comparison of IDE against ɅCDM, scalar fields/ quintessence, & MOND.
| Required dark side property | IDE | ɅCDM | Scalar fields/ Quintessence |
MOND | |
|---|---|---|---|---|---|
| 1 | Account for present dark energy density |
YES, order of magnitude, ~1070 J | NO, not by many orders |
Only by much fine tuning |
---- |
| 2 | Consistent with ω0 – ωa experiment data |
YES, good agreement |
NO, >3σ disagreement | Not specific -1<ω<+1 |
---- |
| 3 | Resolve Cosmological constant problem |
YES, Ʌ → 0 |
NO | Only by much fine tuning |
---- |
| 4 | Resolve Cosmological coincidence problem |
YES, naturally |
NO | Only by much fine tuning |
---- |
| 5 | Resolve H0 and σ8 tensions |
YES, probably |
NO | NO | ---- |
| 6 | Account for size of dark matter attributed effects |
YES, order of magnitude | NO, DM not detected yet | ---- | YES, sometimes |
| 7 | Account for location of DM attributed effects |
YES, coincident with baryons |
NO, not coincident |
---- | YES, coincident with baryons |
Disclaimer/Publisher’s Note: The statements, opinions and data contained in all publications are solely those of the individual author(s) and contributor(s) and not of MDPI and/or the editor(s). MDPI and/or the editor(s) disclaim responsibility for any injury to people or property resulting from any ideas, methods, instructions or products referred to in the content. |
© 2025 by the authors. Licensee MDPI, Basel, Switzerland. This article is an open access article distributed under the terms and conditions of the Creative Commons Attribution (CC BY) license (http://creativecommons.org/licenses/by/4.0/).
Copyright: This open access article is published under a Creative Commons CC BY 4.0 license, which permit the free download, distribution, and reuse, provided that the author and preprint are cited in any reuse.


