Submitted:
24 June 2025
Posted:
25 June 2025
You are already at the latest version
Abstract
The polar environment belongs to the most extreme environments of our world. However, even in the cold deserts of Antarctica life thrives, often in the form of biocrusts (biological soil crusts), complex communities consisting of hundreds of organisms. The reaction to abiotic stress of members of these communities is often inferred from laboratory experiments of isolated species and single factors, without taking into consideration any mitigation effects by the communities or complex habitats. In this study we tried to infer the stress situation of the filamentous green alga Klebsormidium in Antarctic biocrusts in-situ using metatranscriptomic data. Klebsormidium is found ubiquitous in biocrusts and well-studied with respect to abiotic factors allowing comparison of lab experiments with the in-situ situation. In this study we identified Klebsormidium flaccidum to be present in biocrusts from Livingston Island (Antarctica). Metatranscriptomic data of the biocrust were used to investigate the presence of cold and desiccation stress in situ. To this end, we identified consistently expressed and stress-regulated genes in published stress transcriptomes of Klebsormidium that could serve as markers for environmental stress levels. These "marker genes" were used to construct marker gene indices to assess stress states in biocrusts by comparing transcript expression ratios under different conditions, a novel framework for assessing microbial community responses to environmental stressors. However, many potential marker genes behaved quite differently in the laboratory and in the natural environment. In the end, rather than relying on indices based on individual marker genes, comparing the expression level of whole stressor-regulated gene sets proved to be a more reliable approach to examining stress in situ. This study highlights the potential of marker genes for broader ecological and environmental monitoring using metatranscriptomics data.
Keywords:
Antarctica
; Klebsormidium
; Desiccation stress
; Cold stress
; Metatranscriptomics
; Marker genes
1. Introduction
Antarctica represents one of the most extreme environments on Earth, characterized by persistent cold, strong winds, high levels of UV radiation, and seasonal desiccation [1]. Despite these extreme conditions, the continent’s ice-free areas, confined to coastal margins [2], support unique ecosystems that are crucial for understanding biological adaptations to harsh environments [1]. The organisms inhabiting these zones have adapted to extreme conditions, including low temperatures (mean temperatures ranging from -10°C to -60°C), high solar radiation, and limited nutrients. Terrestrial microbiota in Antarctica face challenges such as desiccation and osmotic stress, yet they have developed strategies to thrive in these conditions. The availability of liquid water is a pivotal factor in the growth and development of terrestrial microbiota, which is only available during the short austral summer [3]. Diverse microbial communities are found in various habitats, including soils, biocrusts, rocks, mats, and sediments. Nevertheless, the composition of these communities varies greatly between different localities, even over short distances [4,5].
Biocrusts are defined as assemblies of organisms that colonize the soil [6,7]. In comparison with underlying soils, biocrusts have higher abundance and diversity of microorganisms. These microorganisms are crucial for carbon and nutrient cycling in Antarctica, where only two vascular plant species are present [6]. Bacterial communities in Antarctic soils and biocrusts are predominantly comprised of Actinobacteria, Acidobacteria, Bacteroidetes, and many other less abundant phyla [5,8,9,10]
The genus Klebsormidium, a member of the Streptophyta, has been found in a variety of habitats worldwide [11] and frequently occurs in polar biocrusts [12,13,14]. Klebsormidium is a filamentous alga that produces exopolysaccharides, which contribute to soil stabilization and microbial interactions within the biocrusts [15,16]. Polar strains of Klebsormidium have been extensively studied for their stress tolerance mechanisms (e.g.[14,17,18,19]). As poikilohydric organisms, these algae can survive extreme dehydration, relying on desiccation tolerance mechanisms that allow for rapid recovery upon rehydration [20].
The extreme environment of Antarctica subjects its inhabitants to multiple abiotic stresses, including sub-zero temperatures, desiccation, high salinity, and intense UV radiation. Numerous laboratory experiments have demonstrated that Klebsormidium has evolved a range of protective strategies such as accumulation of cryoprotectants and the upregulation of antioxidant defences mechanisms [14,15,16,17,19,21,22,23,24,25]. However, the specific stress responses of Klebsormidium species within Antarctic biocrusts under natural habitats remain underexplored. Gaining a better understanding of how these microorganisms endure the multifaceted stresses of their environment in-situ will provide valuable insights into the resilience, ecological roles and functional dynamics of Antarctic biocrusts.
The objective of this study was to address the knowledge gap between laboratory experiments and the in-situ conditions by evaluating the stress situation of Klebsormidium strains in Antarctic biocrusts. To achieve this, stress-related marker genes suitable for assessing the physiological state of Klebsormidium strains in their natural environment were identified. Expression levels of these genes in in-situ samples were compared with those from laboratory-based stress experiments [19] to determine transcripts that are constantly expressed, upregulated, or downregulated in response to stress. By analysing the expression patterns for these genes, the proportions of regulated to constantly expressed genes could be calculated, providing insights into the stress status of Klebsormidium within its natural habitat.
2. Materials and Methods
2.1. Site Description and Sampling
Sampling sites were located on Livingston island, Antarctica. The mean air and soil (at 5 cm depth) temperatures throughout the year are approximately -2.7°C and -1.3°C, respectively [26]. Three sites were selected at Byers peninsula (Table 1, Figure 1). At each site, five field replicates were collected and stored at +4° C. For metatranscriptomic analysis, additional samples were immediately placed into 2 ml tube containing LifeGuard® Soil Preservation Solution (QIAGEN, Germany) to maintain RNA integrity and kept at -20°C until RNA extraction. Environmental parameters of the Camp at the time of sampling were recorded by the Agencia Estatal de Meteorologia (Spain) for the Byers Field station (Table1).
2.2. Isolation and Cultivation of Klebsormidium from Livingston Island
To provide experimental evidence for the presence of Klebsormidium strains within the collected biocrusts, microalgae were isolated from the enrichment cultures. Single colonies were transferred to the Petri dishes with Bold´s basal medium triple nitrogen concentration (3N-BBM) and added vitamins. The cultures were kept at 20 °C under 30 mol photons m-2 s-1 (Osram Lumilux Cool White lamps L36W/840) with a light/dark regime of 16/8 h.
2.3. RNA Isolation and Sequencing
To perform the RNA extraction, the frozen cryotubes containing the biocrust samples were gradually thawed and centrifuged at 2,500 × g for 5 min, and the soil preservation solution was removed. Total RNA was then extracted from each sample using the RNA Soil Mini Kit (MACHEREY-NAGEL, Germany) according to the manufacturer’s instructions. Metatranscriptomic sequencing with poly (A) enrichment (PE150) was conducted at the Cologne Center for Genomics (CCG, Germany) using the Illumina MiSeq platform. Due to technical constraints, only three and four replicates from sites 1 and 3, respectively, were submitted for sequencing. The resulting sequences were deposited in the Sequence Read Archive (SRA) under the project PRJNA1263187.
2.4. Bioinformatic Analyses
Bioinformatic analysis was performed using the OmicsBox software (v. 3.0.30) with standard settings if not indicated otherwise [27] . The quality filtering of the obtained files was performed with Trimmomatic [28] and rRNAs were separated from the dataset using SortMeRNA [29]. The remaining reads were assembled de novo using Trinity [30] integrated into OmicsBox, with separate assemblies conducted for each site. Transcript quantification was performed using RSEM [31] with the Bowtie2 aligner [32]. Klebsormidium transcripts within the metatranscriptome assemblies were identified using Local BLASTN (e-value 1.0E-50) in OmicsBox against a custom database of available Klebsormidium sequences (draft genome of K. nitens GCA_000708835.1 [33], and the transcriptomes of K. flaccidum and K. dissectum (BioProject ID PRJNA500592 [19], newly assembled as described below).
2.5. Identification of Klebsormidium Species Using Bioinformatic Analysis
To identify the Klebsormidium species present in the biocrust samples, 18S rRNA sequences were extracted from the metatranscriptomic dataset and assigned with Silva database (version 138.2) and assembled de novo using the RNA-Seq De Novo Assembly option in OmicsBox. The assembled rRNA were then subjected to a BLASTN search against the NCBI database (NR2024-7-11) limiting the search to Viridiplantae, to identify the Klebsormidium species.
2.6. Re-Analysis of RNA-Seq Data from a Stress Experiment Involving K. flaccidum and K. dissectum
The two stress transcriptomes of K. flaccidum and K. dissectum [19] were downloaded from NCBI (BioProject ID PRJNA500592). K. flaccidum (strain A1-1a; [34]) was originally isolated from an Antarctic biocrust on Ardley Island, South Shetland Islands, while K. dissectum (strain EiE-15a; [35]) was isolated from a biocrust in Svalbard, Norway. De-novo assemblies were performed separately for K. flaccidum and K. dissectum reads, as described above. To assess the completeness of the assembled transcriptomes, a BUSCO analysis, using the Viridiplantae dataset, implemented in Omicsbox was carried out [36]. Coding regions were predicted using TransDecoder [37,38]. Functional annotation of the sequences was conducted using Local Blast searches against the K. nitens genome [33]. To further improve the annotation of the transcriptomes Diamond BLAST using the NCBI Non-redundant (NR) Database (version 2024-01-09) followed by InterProScan [39] and eggnog mapper [40] in the Omicsbox background were used.
2.7. Gene Marker Indices
To identify transcripts for marker indices the workflow in Figure 2 was followed. Klebsormidium transcripts were identified in metatranscriptomes using local BLASTN searches against the Klebsormidium database (see above 2.4). Transcripts with 98% sequence identity or more to K. flaccidum or K. dissectum transcripts were retained for further analysis. The read abundance for each transcript was recorded, and the Klebsormidium origin of the transcript verified through BLASTx search against the NCBI NR-2024-1-9 database restricted to Viridiplantae.
The identified Klebsormidium transcripts were manually compared with the stress transcriptomes of K. flaccidum and K. dissectum and grouped according to their regulation in the stress transcriptomes (regulated vs. non-regulated). A marker gene index (GMI) was constructed for each pair of regulated and non-regulated transcripts to quantify the effect of stress on gene expression. The GMI was calculated as a percentage of the maximal effect according to the following equation:
GMIi = (Xi - Ximin) / (Ximax - Ximin) × 100,
Xi is the ratio of the number of reads (fpkm) of a stress-regulated transcript to the number of reads of a non-regulated transcript in the biocrust.
Ximin is the ratio of the number of reads (fpkm) of stress-regulated transcripts to the number of non-regulated transcripts in the control experiment.
Ximax is the ratio of the number of reads (fpkm) of a stress-regulated transcript to a non-regulated transcript in the experimental treatment.
Each i represents a specific pair of regulated and non-regulated transcripts.
2.8. Statistical Tests of Marker Gene Sets
To compare expression patterns of marker gene sets across different samples and conditions, the Similarity Profile (SIMPROF) test was performed in R using the clustsig and vegan packages. Transcript counts were first normalized to the total number of Klebsomidium reads in the data set to calculate relative abundances and a Bray–Curtis dissimilarity matrix was created. Hierarchical clustering was then performed using the Ward.D2 method. Two different data sets were used for this analysis. Data set 1 included only transcripts used for ratio calculation. These transcripts are regulated only either by cold or desiccation stress. Data set 2 includes all regulated transcripts identified from BLAST-positive contigs including those which are regulated by both cold and desiccation stress.
3. Results
3.1. Identification of Klebsormidium Flaccidum in Biocrusts from Livingston Island.
Strains morphologically resembling Klebsormidium were successfully isolated from biocrusts collected at sites 1 and 3 (Figure 3). Analysis of the rRNA from the metatranscriptomic datasets for sites 1 and 3 confirmed the presence of a Klebsormidium flaccidum at sites 1 and 3.
3.2. Identification of Desiccation and Cold Regulated Transcripts in K. dissectum and K. flaccidum.
To identify genes that are suitable for use as gene marker indices (GMIs), the stress transcriptomes published by Rippin et al. [19] were re-analysed. To eliminate discrepancies arising from differing workflows or settings, a complete re-analysis was performed using a consistent pipeline for both the previously published stress transcriptomes and the newly generated metatranscriptomes. The results of this re-analysis are summarised below.
The de novo assembled transcriptomes of K. flaccidum and K. dissectum contained 120,574 and 96,581 transcripts, respectively. Summary data of the assemblies, including BUSCO analysis and open reading frames (ORF) detection, are presented in Suppl. Table 1. In brief, both assemblies contained approximately 80% complete ORFs and covered more than 95% of the genome according to BUSCO analysis. A high duplication rate was observed in both K. flaccidum (82%) and K. dissectum (88%), which contributed to the high number of transcripts. The assemblies were annotated as described in Material and Methods yielded 71,658 and 73,763 annotated transcripts for K. flaccidum and K. dissectum, respectively. Pairwise differential gene expression analysis (fold change > 2, p < 0.05, FDR < 0.05) identified a large number of transcripts responsive to both cold and desiccation stress in both Klebsormidium species (Table 2). These transcripts represent potential marker genes suitable for the calculation of GMIs.
3.3. Metatranscriptomes for In Situ Stress Analysis
The metatranscriptomes were assembled using the same pipeline that had previously been applied to the stress transcriptomes (Table 3). The number of assembled transcripts was higher at site 1 than at site 3. Although a substantial number of transcripts showed similarity to Klebsormidium sequences, only a small fraction exhibited sequence identity greater than 98%. A subset of these high-similarity transcripts was selected for further analysis.
The selected transcripts were then categorized as either regulated or constantly expressed genes. Approximately one-third of the genes regulated by one stressor were also influenced by the other. For example, at site 1, 22 transcripts were regulated by cold stress, 22 by desiccation stress and 11 were regulated by both factors. Based on the presence of K. flaccidum in the biocrusts, as indicated by sequence similarity, the differential gene expression catalogue for K. flaccidum was used for comparison. Transcripts differentially expressed in response to cold or desiccation in laboratory experiments were identified at all sampling sites through comparison with K. flaccidum stress transcriptomes (Table 4). Both site 1 and site 3 exhibited a similar number of regulated and constantly expressed transcripts in response to these stressors. A complete list of selected transcripts and their functional annotations is presented in Suppl. Table 2. Only transcripts specifically regulated by a single stressor in the laboratory experiments were included in the calculation of GMIs.
3.4. Evaluation of In Situ Stress State in Biocrusts Using GMI
To evaluate the suitability of GMIs as indicators of abiotic stress, GMIs were calculated for all combinations of regulated and constantly expressed transcripts from sites 1 and 3, as listed in Supplementary Table 2. Specifically, 143 combinations were analysed for cold stress at site 1, 130 for cold stress at site 3, and 96 for desiccation stress at both sites. Prior to GMI calculation, transcript counts were normalised to the total number of reads within each dataset.
Analysis of the obtained GMI values revealed that a substantial proportion extended beyond the expected 0–100% range, indicating that transcript expression levels may have fallen below the observed laboratory control conditions or exceeded the laboratory stress conditions (Figure 4). The GMI values demonstrated a high variability, indicating complex regulatory patterns among transcripts and reflecting diverse stress states. Furthermore, over 50% of the GMIs exhibited either a more pronounced marker gene response or values similar to those observed in laboratory stress experiments. In contrast, nearly 40% of the GMIs were lower than, or comparable to, laboratory control levels. Excluding GMIs that fell outside the laboratory experiment range did not provide a definitive interpretation. For instance, of the 143 combinations analysed for cold stress at site 1, only 40 produced GMIs within the expected range, with an average effect size of 53.5%. However, the high standard deviation (36.5%) indicates a wide spectrum of stress intensities, ranging from minimal to severe, comparable to those observed in the cold stress experiment. To assess the reliability of individual transcripts as stress indicators, their frequency of occurrence in GMIs within the expected range (Figure 4) was examined. However, no clear pattern was observed that would support the exclusion of specific transcripts from further analyses, indicating that individual marker genes are not reliable indicators when used in isolation. Consequently, the analysis focused on the overall expression patterns of the Klebsormidium transcripts.
3.5. Comparison of Overall Gene Expression Profiles to Assess the Stress State of Biocrusts
Hierarchical clustering of gene expression profiles revealed a clear separation between cold control and cold stress samples in the laboratory datasets, with minimal variation among replicates (Figure 5). In contrast, field samples from sites 1 and 3 exhibited greater variability. Within the cold stress dataset, field replicates grouped together with the cold stress laboratory samples. Notably, one replicate from both sites exhibited expression patterns almost identical to those observed under cold treatment in the dataset containing transcripts regulated exclusively by cold stress. In the broader dataset (see material and methods for the difference between both data sets), which encompasses all regulated Klebsormidium genes, field samples were still grouped with cold-stressed samples, albeit at a greater distance. These results strongly suggest that Klebsormidium flaccidum in the biocrust of Livingston Island experienced cold stress at the time of sampling.
The pattern differed in the case of desiccation stress (Figure 6). In dataset 1, field samples from Site 1 clustered together with the hydrated samples from the laboratory experiment. For Site 3, half of the field samples grouped together with the hydrated or desiccated samples from the laboratory experiment. In contrast, in the larger dataset 2, which includes all regulated transcripts likely derived from Klebsormidium, field replicates from both sites formed a separate cluster, distinct from laboratory experiments. Overall, the analysis indicates a greater variability among field replicates with respect to desiccation response (Figure 6B). Furthermore, the inclusion of genes regulated by both cold and desiccation stress dilutes the desiccation-specific signal, potentially obscuring clear clustering with laboratory treatments.
4. Discussion
The presence of Klebsormidium in Antarctic biocrusts was confirmed through a combination of methods, including isolation of algal strains, 18S rRNA analysis, and BLAST-based transcriptome analysis. This comprehensive approach enabled the identification of K. flaccidum.
4.1. Identification of Marker Genes
The objective of this study was to identify potential marker genes with stable and regulated expression across all experimental stress conditions in all Klebsormidium species commonly used in laboratory stress experiments. To ensure the reliability of candidate transcripts, expression patterns were examined across all experiments, aiming to detect genes with constantly regulated expression. This approach aligns with standard practices in the field of comparative transcriptomics, where analyses initially include multiple species or strains to increase the robustness of data interpretation before narrowing the focus to a specific target organism. This methodology facilitates the identification of conserved and species-specific stress response pathways [42,43]. However, this approach yielded only approximately 20 genes, which were not detected in the metatranscriptomic datasets. Consequently, the analysis was refined to focus on individual stressors and the K. flaccidum dataset, with the objective of expanding the number of stress-related transcripts included in the analysis. This targeted approach resulted in the identification of several potential marker genes in the metatranscriptomic data set.
Gene marker indices (GMIs) represent a novel approach for quantifying environmental stress, providing a framework to assess organismal stress responses and enabling direct comparisons between controlled laboratory conditions and natural environments. Normalization of gene expression to constantly expressed reference genes (commonly referred as housekeeping gene normalization) is a standard practice in transcriptomic studies [44]. This normalization ensures that any observed changes in expression reflect genuine biological responses rather than technical artefacts. Building upon this established methodology, GMIs incorporate normalised expression values into ratio-based metrics, providing an innovative means for evaluating relative stress levels across both experimental and field settings. Despite the absence of directly comparable studies, due to the novelty of the method, related approaches have successfully linked gene expression profiles to environmental stress. For example, stress-responsive microbial genes in biocrusts have demonstrated consistent expression patterns across laboratory and field conditions, highlighting the potential of molecular indicators in ecological monitoring [45].
The tested GMIs exhibited a wide range, from indicating no stress to strong stress, suggesting that many of the proteins regulated under laboratory stress conditions might be subjected either to more complex regulation in situ, or not be involved in stress response under natural conditions. This finding might suggest that metatranscriptomic data may not accurately reflect abiotic environmental conditions. However, further analysis of global transcript expression levels, focusing on transcripts previously identified in stress experiments, revealed a clear correlation with environmental parameters, particularly with cold stress. This correlation is most evident in the context of low temperatures. For example, at the time of sampling, the biocrust were exposed to soil temperatures below 5°C. In both datasets and across both investigated sites, transcript expression patterns closely mirrored environmental conditions. In the larger dataset, the observed weakening of clustering, might reflect the simultaneous regulation of transcripts by multiple environmental factors, which we observed quite often for cold and desiccations stress. Regulation by multiple stressors could result in a dilution of the signal associated with individual stressors. However, in the context of desiccation stress, a different pattern was observed. In the smaller dataset, only weak association was recorded with the hydrated control, while in the larger dataset, comprising transcripts responsive to both desiccation and temperature, experimental conditions demonstrated greater similarity to each other. Two explanations might be proposed to explain this pattern. Firstly, although the biocrusts appeared dry at the time of sampling, the air humidity was high (Table 1), suggesting that the surface biofilm might have absorbed dew and was, therefore, hydrated. If this scenario is true, the expression pattern for data set 1 accurately indicates the hydrated state. Variability among replicates could be attributed to the different proportions of the upper biofilm that were included during RNA extraction. Secondly, previous studies have shown that cold acclimation in Klebsormidium can reduce sensitivity to desiccation [19]. Thus, the expression patterns observed in field samples might be significantly influenced by cold stress, resulting in an increased number of transcripts different expression pattern to the lab desiccation experiment.
Despite the potential of metatranscriptomic data for in-situ stress evaluation, its application remains in the early stages and requires further methodological development. One key limitation is the need for comprehensive transcriptomic reference datasets to establish reliable baselines for both control and stress condition. In addition to temperature and desiccation, other important environmental factors, such as light intensity (PAR, UV) and nutrients availability, which must also be considered in order to fully capture the complexity of natural stress responses. Moreover, the natural variability of environments and the interactions between multiple simultaneous stressors may complicate data interpretation. Future research should thus aim on the automation of the selection marker gene and the analysis of expression pattern using machine learning algorithms, thus enhancing reproducibility and scalability.
In conclusion, marker-based metatranscriptome analysis is a powerful tool for the assessment of environmental stress, effectively bridging the gap between controlled laboratory experiments and the complex responses of microbial community in natural environments. The findings of this study highlight the potential of this method for ecological monitoring, conservation applications, and the broader understanding of microbial adaptation to extreme environments.
Supplementary Materials
The following supporting information can be downloaded at the website of this paper posted on Preprints.org. (Supplementary Table 1. Characteristics of the novel assembled stress transcriptomes of K. flaccidum and K. dissectum; Supplementary Table 2. List of annotated transcripts used for GMIs from site 1 and site 3.)
Author contributions
DP: laboratory experiments, formal analysis, investigation, methodology, validation, visualisation, writing-original draft. E.P.: conceptualisation, methodology, writing-review and editing;; B.B.: conceptualisation, data analysis, funding acquisition, project administration, supervision, writing-reviewand editing. All authors have read and agreed to the published version of the manuscript.
Funding
This research was supported by the DFG (grant Be1779/23-1) within the DFG priority program SPP1158 “Antarctic Research”.
Data Availability Statement
The reads for the metatranscriptomic data set have been submitted to the SRA archive at NCBI under PRJNA1263187.
Acknowledgments
The authors would like to thank K. Dumack and C. Martinez-Rendon for collecting the biocrust samples on Livingston Island, as well as I. Mas-Martinez for isolating the RNA from these samples.
Conflicts of Interest
The authors declare no conflicts of interest.
References
- Convey, P.; Bowman, V.; Chown, S.L.; Francis, J.; Fraser, C.; Smellie, J.L. Ice bound Antarctica: Biotic consequences of the shift from a temperate to a polar climate. In Mountains, Climate and Biodiversity; Hoorn, C., Perrigo, A., Antonelli, A., Eds.; John Wiley & Sons: Hoboken, NJ, USA, 2018; pp. 355–373.
- Cowan, D.A.; Tow, L.A. Endangered Antarctic environments. Annu. Rev. Microbiol. 2004, 58, 649–690. [CrossRef]
- Cary, S.C.; McDonald, I.R.; Barrett, J.E.; Cowan, D.A. On the rocks: the microbiology of Antarctic Dry Valley soils. Nat. Rev. Microbiol. 2010, 8, 129–138. [CrossRef]
- Almela, P.; Justel, A.; Quesada, A. Heterogeneity of microbial communities in soils from the Antarctic Peninsula Region. Front. Microbiol. 2021, 12, 628792. [CrossRef]
- Pushkareva, E.; Elster, J.; Kudoh, S.; Imura, S.; Becker, B. Microbial community composition of terrestrial habitats in East Antarctica with a focus on microphototrophs. Front. Microbiol. 2024, 14, 1323148. [CrossRef]
- Belnap, J.; Büdel, B.; Lange, O.L. Biological soil crusts: Characteristics and distribution. In Biological Soil Crusts: Structure, Function, and Management; Belnap, J., Lange, O.L., Eds.; Springer-Verlag: Berlin, Germany, 2001; pp. 3–30. [CrossRef]
- Pointing, S.B.; Belnap, J. Microbial colonization and controls in dryland systems. Nat. Rev. Microbiol. 2012, 10, 551–562. [CrossRef]
- Bajerski, F.; Wagner, D. Bacterial succession in Antarctic soils of two glacier forefields on Larsemann Hills, East Antarctica. FEMS Microbiol. Ecol. 2013, 85, 128–142. [CrossRef]
- Darby, B.J.; Neher, D.A. Microfauna within biological soil crusts. In Biological Soil Crusts: An Organizing Principle in Drylands, 2nd ed.; Belnap, J., Weber, B., Büdel, B., Eds.; Springer: Cham, Switzerland, 2016; pp. 139–157. [CrossRef]
- Zhang, E.; Thibaut, L.M.; Terauds, A.; Raven, M.; Tanaka, M.M.; van Dorst, J.; Wong, S.Y.; Crane, S.; Ferrari, B.C. Lifting the veil on arid-to-hyperarid Antarctic soil microbiomes: a tale of two oases. Microbiome 2020, 8, 37. [CrossRef]
- Škaloud, P.; Rindi, F. Ecological differentiation of cryptic species within an asexual protist morphospecies: A case study of filamentous green alga Klebsormidium (Streptophyta). J. Eukaryot. Microbiol. 2013, 60, 350–362. [CrossRef]
- Borchhardt, N.; Baum, C.; Mikhailyuk, T.; Karsten, U. Biological soil crusts of Arctic Svalbard—water availability as a potential controlling factor for microalgal biodiversity. Front. Microbiol. 2017, 8, 1485. [CrossRef]
- Pushkareva, E.; Johansen, J.R.; Elster, J. A review of the ecology, ecophysiology and biodiversity of microalgae in Arctic soil crusts. Polar Biol. 2016, 39, 2227–2240. [CrossRef]
- Ryšánek, D.; Elster, J.; Kováčik, L.; Škaloud, P. Diversity and dispersal capacities of a terrestrial algal genus Klebsormidium (Streptophyta) in polar regions. FEMS Microbiol. Ecol. 2016, 92, fiw039. [CrossRef]
- Holzinger, A.; Lütz, C.; Karsten, U. Desiccation stress causes structural and ultrastructural alterations in the aeroterrestrial green alga Klebsormidium crenulatum (Klebsormidiophyceae, Streptophyta) isolated from an alpine soil crust. J. Phycol. 2011, 47, 591–602. [CrossRef]
- Karsten, U.; Lütz, C.; Holzinger, A. Ecophysiological performance of the aeroterrestrial green alga Klebsormidium crenulatum (Charophyceae, Streptophyta) isolated from an alpine soil crust with an emphasis on desiccation stress. J. Phycol. 2010, 46, 1187–1197. [CrossRef]
- Elster, J.; Degma, P.; Kováčik, Ľ.; Valentová, L.; Šramková, K.; Pereira, A.B. Freezing and desiccation injury resistance in the filamentous green alga Klebsormidium from the Antarctic, Arctic and Slovakia. Biologia (Bratislava) 2008, 63, 843–851. [CrossRef]
- Míguez, F.; Holzinger, A.; Fernández-Marín, B.; García-Plazaola, J.I.; Karsten, U.; Gustavs, L. Ecophysiological changes and spore formation: two strategies in response to low-temperature and high-light stress in Klebsormidium cf. flaccidum (Klebsormidiophyceae, Streptophyta). J. Phycol. 2020, 56, 649–661. [CrossRef]
- Rippin, M.; Borchhardt, N.; Karsten, U.; Becker, B. Cold acclimation improves the desiccation stress resilience of polar strains of Klebsormidium (Streptophyta). Front. Microbiol. 2019, 10, 1730. [CrossRef]
- Alpert, P. Constraints of tolerance: why are desiccation-tolerant organisms so small or rare? J. Exp. Biol. 2006, 209, 1575–1584. [CrossRef]
- Blaas, K.; Holzinger, A. F-actin reorganization upon de- and rehydration in the aeroterrestrial green alga Klebsormidium crenulatum. Micron 2017, 98, 34–38. [CrossRef]
- Herburger, K.; Holzinger, A. Localization and quantification of callose in the streptophyte green algae Zygnema and Klebsormidium: Correlation with desiccation tolerance. Plant Cell Physiol. 2015, 56, 2259–2270. [CrossRef]
- Holzinger, A.; Kaplan, F.; Blaas, K.; Zechmann, B.; Komsic-Buchmann, K.; Becker, B. Transcriptomics of desiccation tolerance in the streptophyte green alga Klebsormidium reveal a land plant-like defense reaction. PLoS ONE 2014, 9, e110630. [CrossRef]
- Holzinger, A.; Becker, B. Desiccation tolerance in the streptophyte green alga Klebsormidium: The role of phytohormones. Commun. Integr. Biol. 2015, 8, e1059978. [CrossRef]
- Nagao, M.; Matsui, K.; Uemura, M. Klebsormidium flaccidum, a charophycean green alga, exhibits cold acclimation that is closely associated with compatible solute accumulation and ultrastructural changes. Plant Cell Environ. 2008, 31, 872–885. [CrossRef]
- Hrbáček, F.; Oliva, M.; Láska, K.; Ruiz-Fernández, J.; de Pablo, M. Á.; Vieira, G.; Ramos, M.; Nývlt, D. Active layer thermal regime in two climatically contrasted sites of the Antarctic Peninsula region. Cuad. Investig. Geográfica 2016, 42Hrbáček, F.; Oliva, M.; Láska, Kd. Investig. Geográfica 2016, 42.
- BioBam Bioinformatics. OmicsBox – Bioinformatics made easy; 2019. Available online: https://www.biobam.com/omicsbox/ (accessed on 24 June 2025).
- Bolger, A. M.; Lohse, M.; Usadel, B. Trimmomatic: a flexible trimmer for Illumina sequence data. Bioinformatics 2014, 30, 2114–2120. [CrossRef]
- Kopylova, E.; Noé, L.; Touzet, H. SortMeRNA: fast and accurate filtering of ribosomal RNAs in metatranscriptomic data. Bioinformatics 2012, 28, 3211–3217. [CrossRef]
- Grabherr, M. G.; Haas, B. J.; Yassour, M.; Levin, J. Z.; Thompson, D. A.; Amit, I.; Adiconis, X.; Fan, L.; Raychowdhury, R.; Zeng, Q.; Chen, Z.; Mauceli, E.; Hacohen, N.; Gnirke, A.; Rhind, N.; di Palma, F.; Birren, B. W.; Nusbaum, C.; Lindblad-Toh, K.; Friedman, N.; Regev, A. Full-length transcriptome assembly from RNA-Seq data without a reference genome. Nat. Biotechnol. 2011, 29, 644–652. [CrossRef]
- Li, B.; Dewey, C. N. RSEM: accurate transcript quantification from RNA-Seq data with or without a reference genome. BMC Bioinformatics 2011, 12, 323. [CrossRef]
- Langmead, B.; Salzberg, S. L. Fast gapped-read alignment with Bowtie 2. Nat. Methods 2012, 9, 357–359. [CrossRef]
- Hori, K.; Maruyama, F.; Fujisawa, T.; Togashi, T.; Yamamoto, N.; Seo, M.; Umetsu, J.; Higashi, K.; Shibata, D.; Kamiya, Y.; Sato, N.; Nakamura, Y.; Tabata, S.; Ida, S.; Kurokawa, K.; Ohta, H. Klebsormidium flaccidum genome reveals primary factors for plant terrestrial adaptation. Nat. Commun. 2014, 5, 3978. [CrossRef]
- Borchhardt, N.; Schiefelbein, U.; Abarca, N.; Boy, J.; Mikhailyuk, T.; Sipman, H. J. M.; Karsten, U. Diversity of algae and lichens in biological soil crusts of Ardley and King George islands, Antarctica. Antarct. Sci. 2017, 29, 229–237. [CrossRef]
- Borchhardt, N.; Baum, C.; Mikhailyuk, T.; Karsten, U. Biological soil crusts of Arctic Svalbard—water availability as potential controlling factor for microalgal biodiversity. Front. Microbiol. 2017, 8, 1485. [CrossRef]
- Simão, F. A.; Waterhouse, R. M.; Ioannidis, P.; Kriventseva, E. V.; Zdobnov, E. M. BUSCO: assessing genome assembly and annotation completeness with single-copy orthologs. Bioinformatics 2015, 31, 3210–3212. [CrossRef]
- Haas, B. J.; Papanicolaou, A.; Yassour, M.; Grabherr, M.; Blood, P. D.; Bowden, J.; Couger, M. B.; Eccles, D.; Li, B.; Lieber, M.; MacManes, M. D.; Ott, M.; Orvis, J.; Pochet, N.; Strozzi, F.; Weeks, N.; Westerman, R.; William, T.; Dewey, C. N.; Henschel, R.; LeDuc, R. D.; Friedman, N.; Regev, A. De novo transcript sequence reconstruction from RNA-seq using the Trinity platform for reference generation and analysis. Nat. Protoc. 2013, 8, 1494–1512. [CrossRef]
- Haas, B. J.; Papanicolaou, A. TransDecoder 5.5.0. Available online: https://github.com/TransDecoder/TransDecoder/wiki (accessed on 24 June 2025).
- Jones, P.; Binns, D.; Chang, H.-Y.; Fraser, M.; Li, W.; McAnulla, C.; McWilliam, H.; Maslen, J.; Mitchell, A.; Nuka, G.; Pesseat, S.; Quinn, A. F.; Sangrador-Vegas, A.; Scheremetjew, M.; Yong, S.-Y.; Lopez, R.; Hunter, S. InterProScan 5: genome-scale protein function classification. Bioinformatics 2014, 30, 1236–1240. [CrossRef]
- Huerta-Cepas, J.; Szklarczyk, D.; Heller, D.; Hernández-Plaza, A.; Forslund, S. K.; Cook, H.; Mende, D. R.; Letunic, I.; Rattei, T.; von Mering, C.; Bork, P. eggNOG 5.0: a hierarchical, functionally and phylogenetically annotated orthology resource based on 5090 organisms and 2502 viruses. Nucleic Acids Res. 2019, 47(D1), D309–D314. [CrossRef]
- Robinson, M. D.; McCarthy, D. J.; Smyth, G. K. edgeR: a Bioconductor package for differential expression analysis of digital gene expression data. Bioinformatics 2010, 26, 139–140. [CrossRef]
- Mustroph, A.; Lee, S. C.; Oosumi, T.; Zanetti, M. E.; Yang, H.; Ma, K.; Yaghoubi-Masihi, A.; Fukao, T.; Bailey-Serres, J. Cross-Kingdom Comparison of Transcriptomic Adjustments to Low-Oxygen Stress Highlights Conserved and Plant-Specific Responses. Plant Physiol. 2010, 152, 1484–1500. [CrossRef]
- Short, A. W.; Sebastian, J. S. V.; Huang, J.; Wang, G.; Dassanayake, M.; Finnegan, P. M.; Parker, J. D.; Cao, K.-F.; Wee, A. K. S. Comparative transcriptomics of the chilling stress response in two Asian mangrove species, Bruguiera gymnorhiza and Rhizophora apiculata. Tree Physiol. 2024, 44(3), tpae019. [CrossRef]
- Lovén, J.; Orlando, D. A.; Sigova, A. A.; Lin, C. Y.; Rahl, P. B.; Burge, C. B.; Levens, D. L.; Lee, T. I.; Young, R. A. Revisiting global gene expression analysis. Cell 2012, 151(3), 476–482. [CrossRef]
- Rajeev, L.; da Rocha, U. N.; Klitgord, N.; Luning, E. G.; Fortney, J.; Axen, S. D.; Shih, P. M.; Bouskill, N. J.; Bowen, B. P.; Kerfeld, C. A.; Garcia-Pichel, F.; Brodie, E. L.; Northen, T. R.; Mukhopadhyay, A. Dynamic cyanobacterial response to hydration and dehydration in a desert biological soil crust. ISME J. 2013, 7(11), 2178–2191. [CrossRef]
Figure 1.
The sampling sites in Antarctica. Images show the three sampling sites in Antarctica, where BSC samples were collected for analysis.
Figure 1.
The sampling sites in Antarctica. Images show the three sampling sites in Antarctica, where BSC samples were collected for analysis.
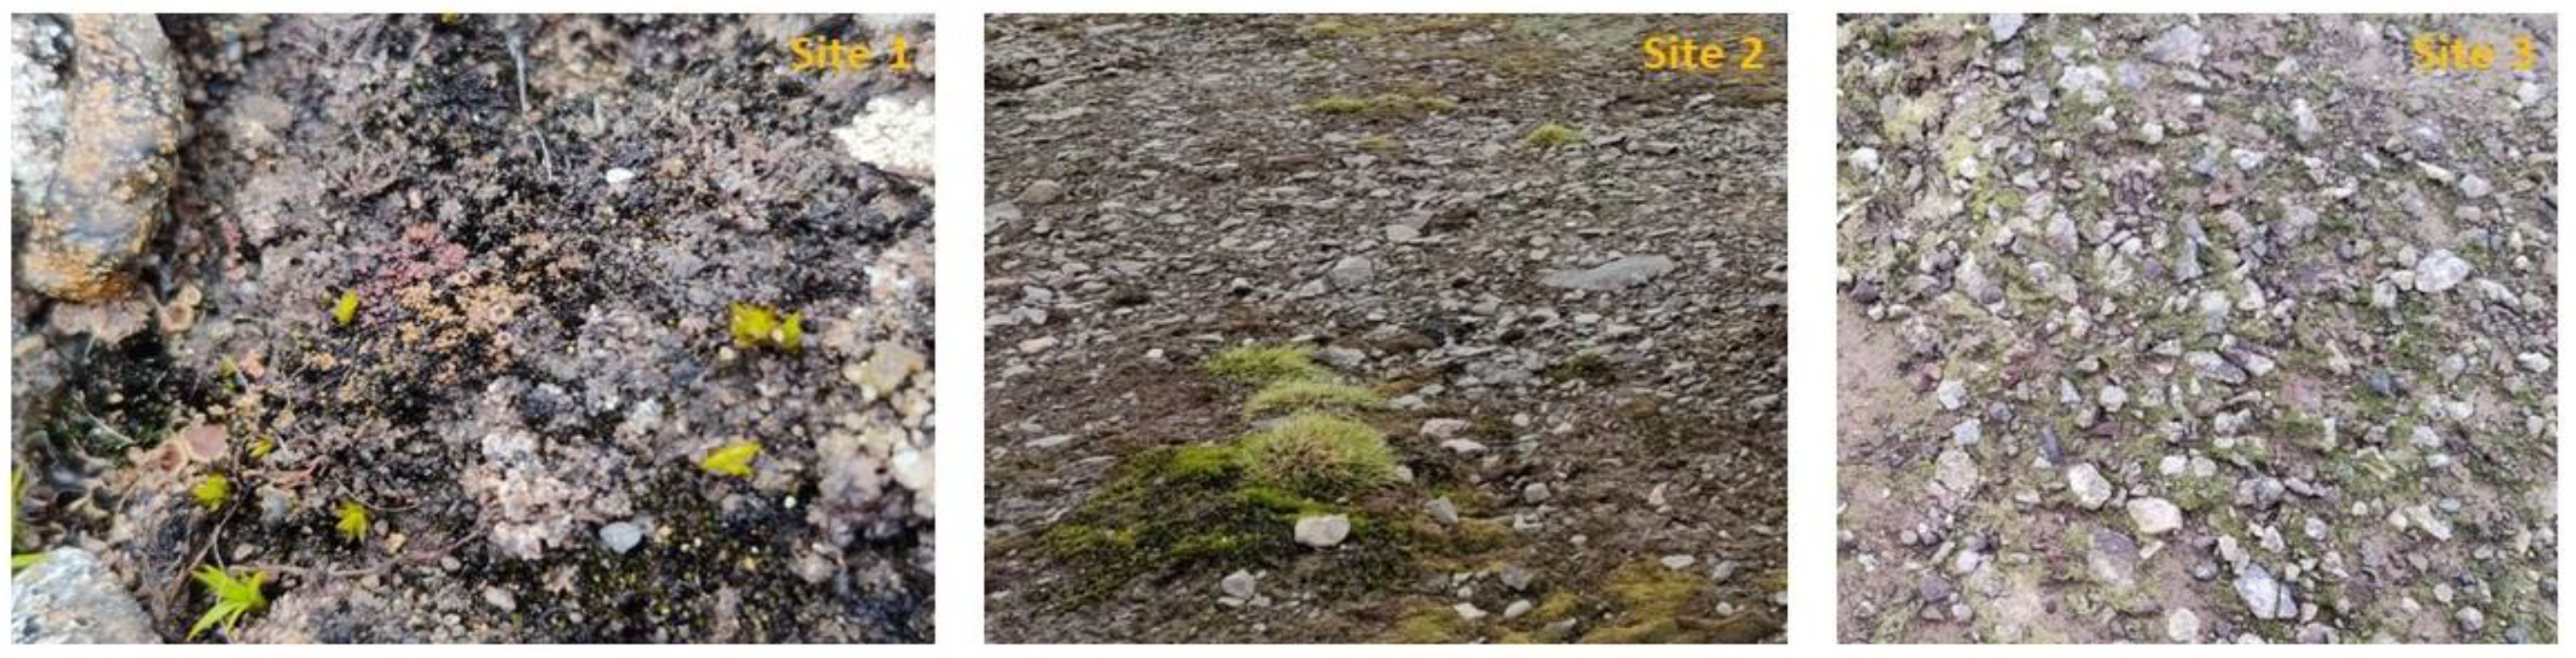
Figure 2.
Bioinformatic workflow for detecting in situ stress responses of Klebsormidium in biocrust metatranscriptomes.
Figure 2.
Bioinformatic workflow for detecting in situ stress responses of Klebsormidium in biocrust metatranscriptomes.
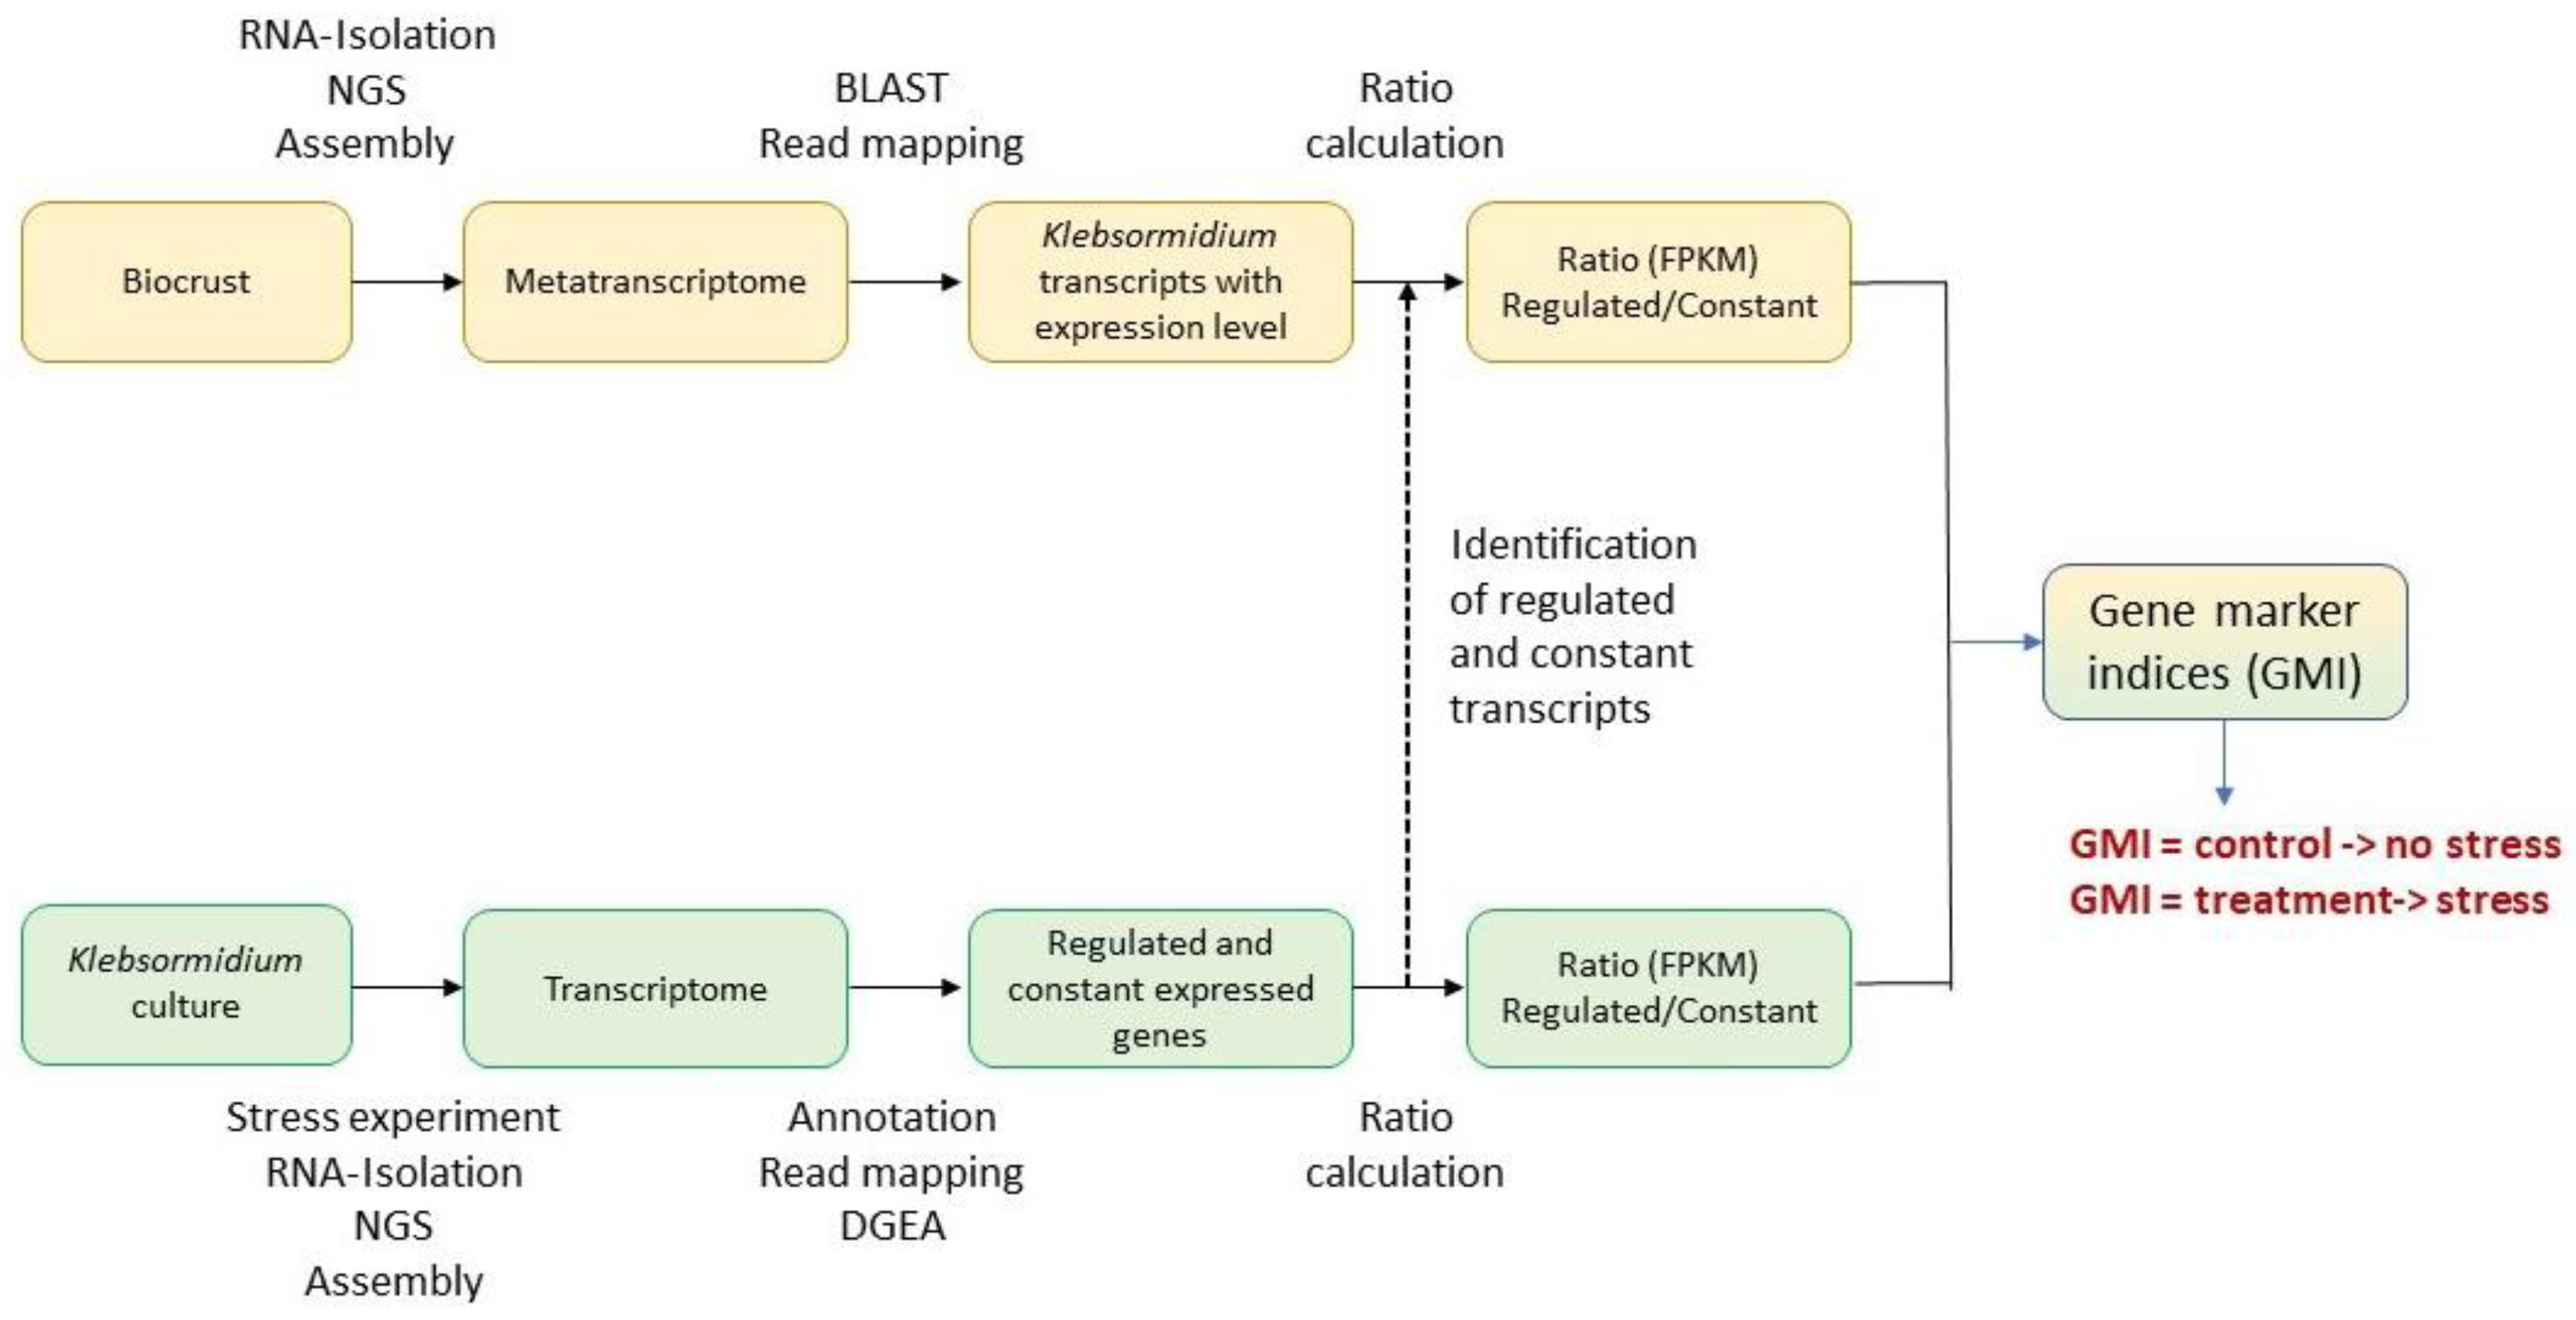
Figure 3.
Klebsormidium flaccidum strains isolated from sites 1 (A) and 3 (B). Scale bar = 10 µm.
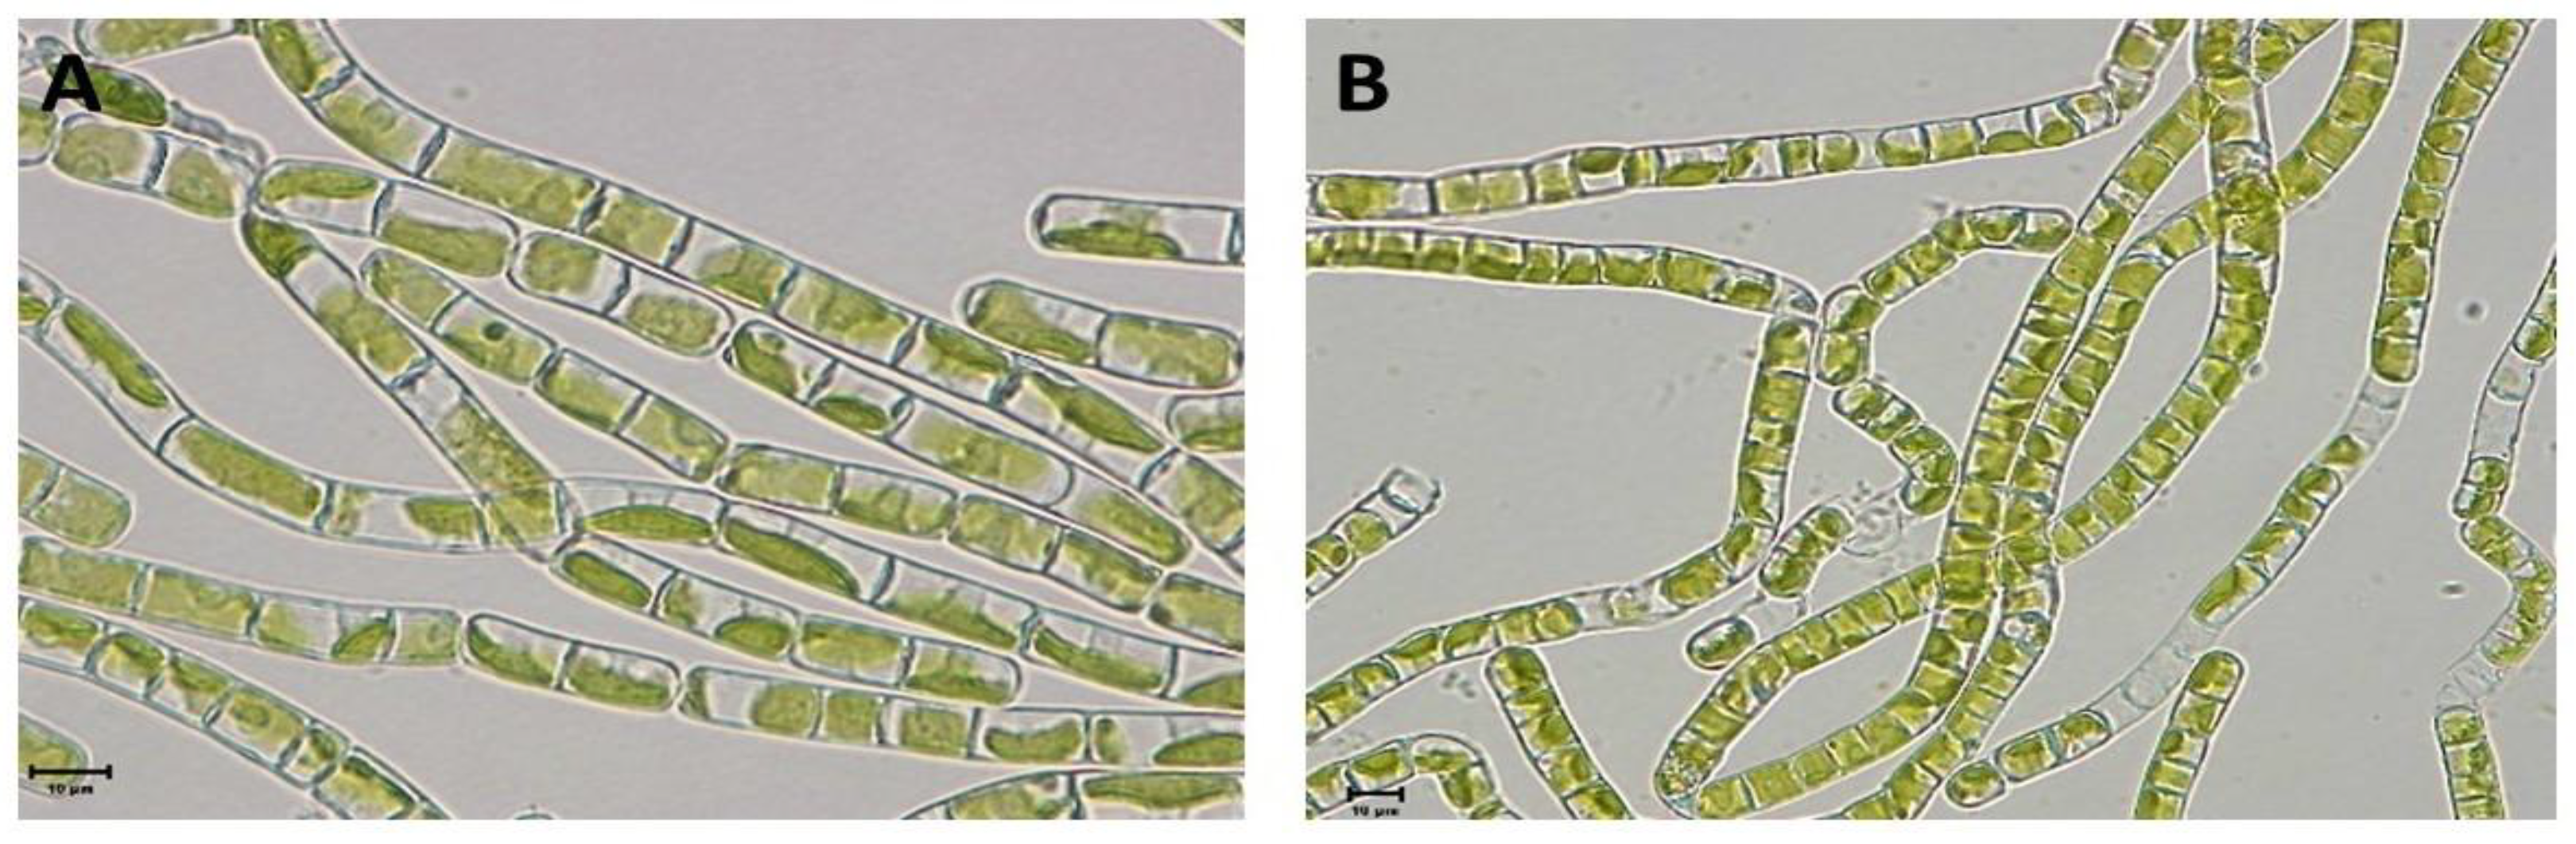
Figure 4.
GMI distribution from field metatranscriptomic data in comparison to laboratory stress and control conditions: (A) cold stress and (B) desiccation stress.
Figure 4.
GMI distribution from field metatranscriptomic data in comparison to laboratory stress and control conditions: (A) cold stress and (B) desiccation stress.
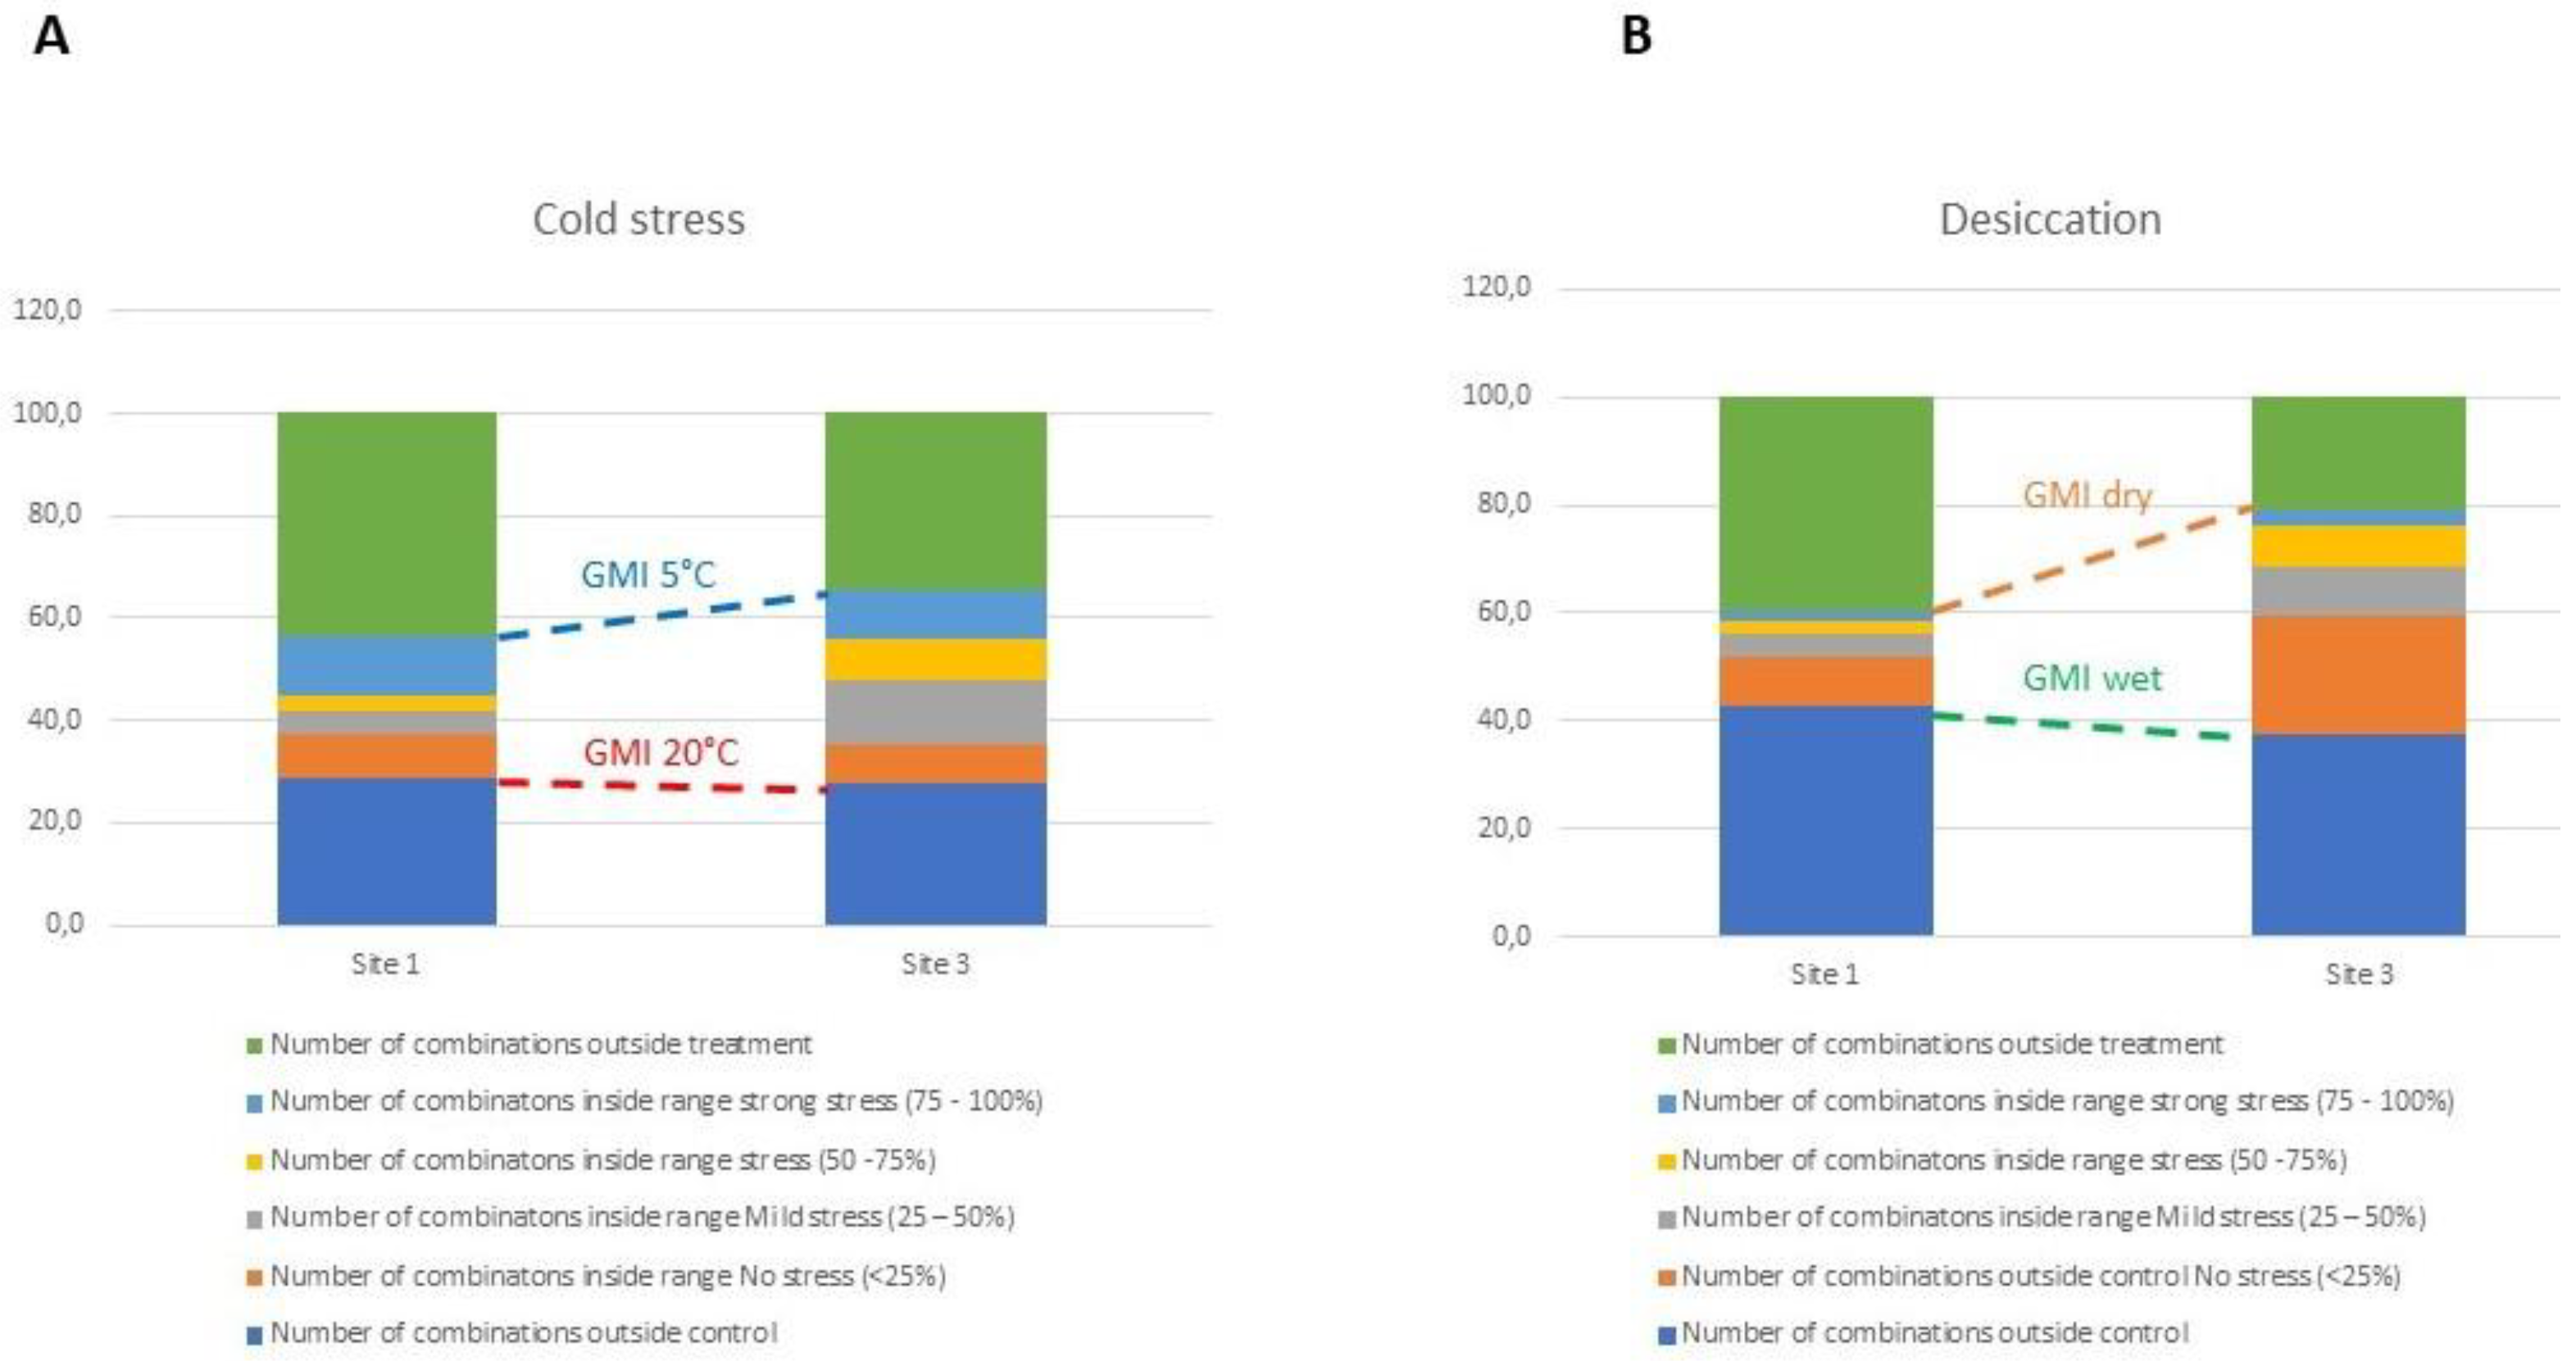
Figure 5.
Similarity of transcript expression patterns between laboratory cold treatment of K. flaccidum and biocrusts samples from sites 1 and 3. (A, B) Dendrograms based on regulated transcripts used for GMI calculation. (C, D) Dendrograms based on all regulated transcripts identified as likely derived from Klebsormidium. Purple dots indicate statistically significant clusters based on SIMPROF analysis using Bray-Curtis dissimilarity. The p-values corresponding to the merging of significant clusters are indicated near the respective branches in the dendrograms.
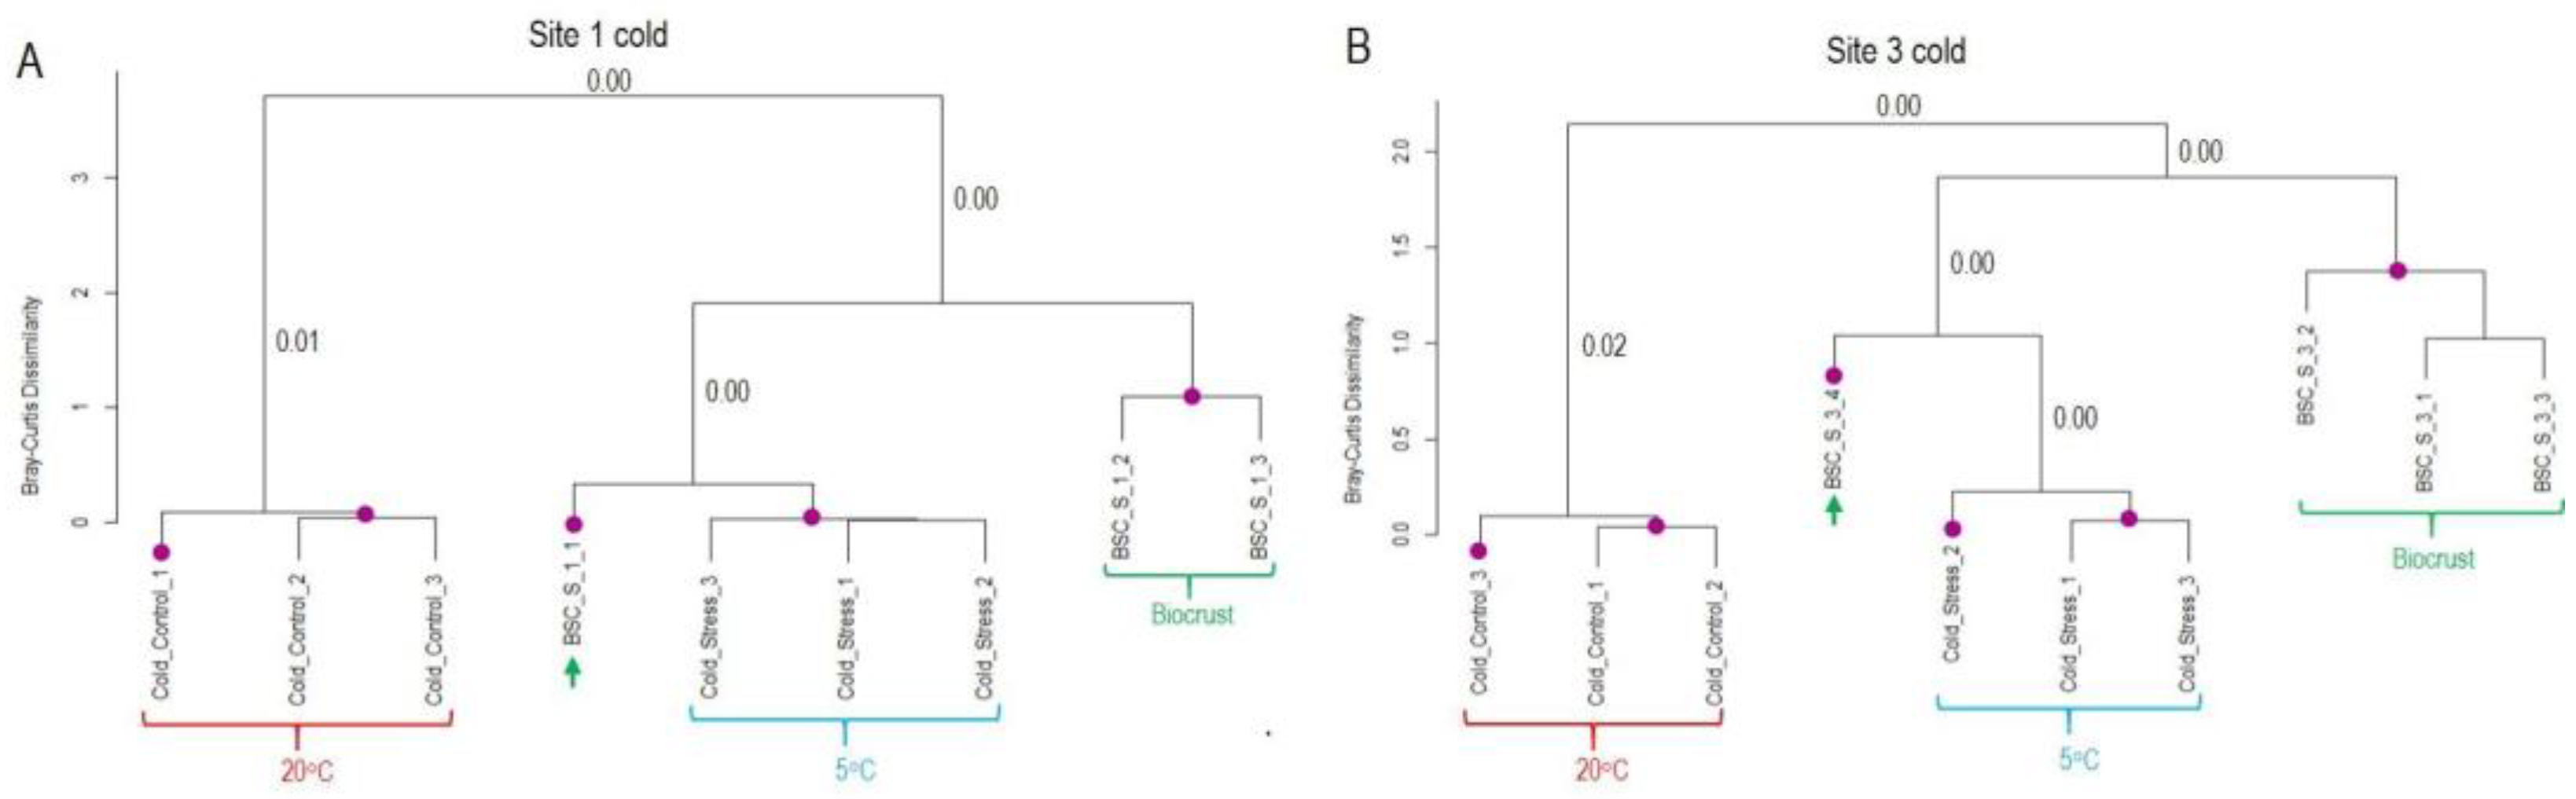
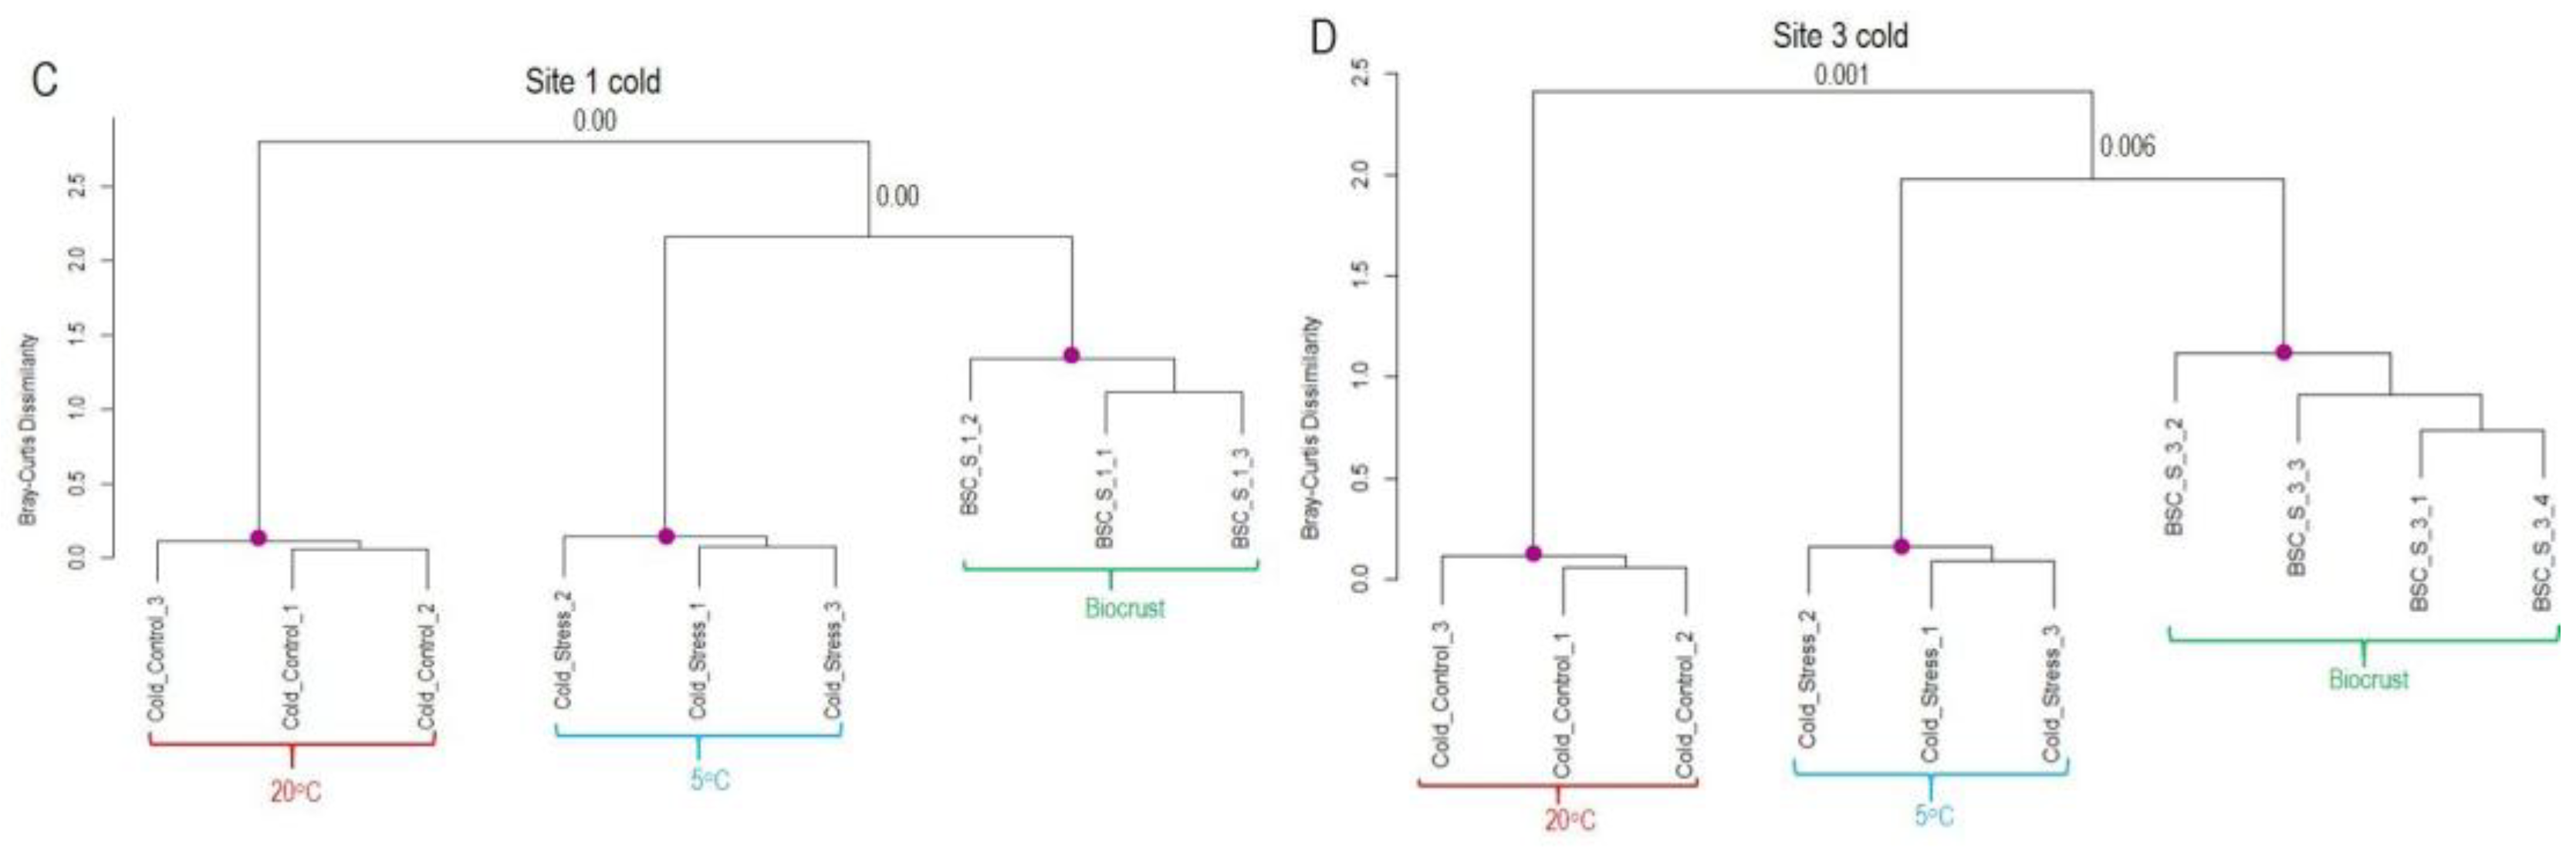
Figure 6.
Similarity of transcript expression patterns between laboratory desiccation treatment of K. flaccidum and biocrusts samples from sites 1 and 3 from Livingston Island. (A, B) Dendrograms based on regulated transcripts used for GMI calculation. (C, D) Dendrograms based on all regulated transcripts identified as likely derived from Klebsormidium. The purple dots indicate statistically significant clusters based on SIMPROF analysis using Bray-Curtis dissimilarity. The p-values corresponding to the merging of significant clusters are indicated near the respective branches in the dendrograms.
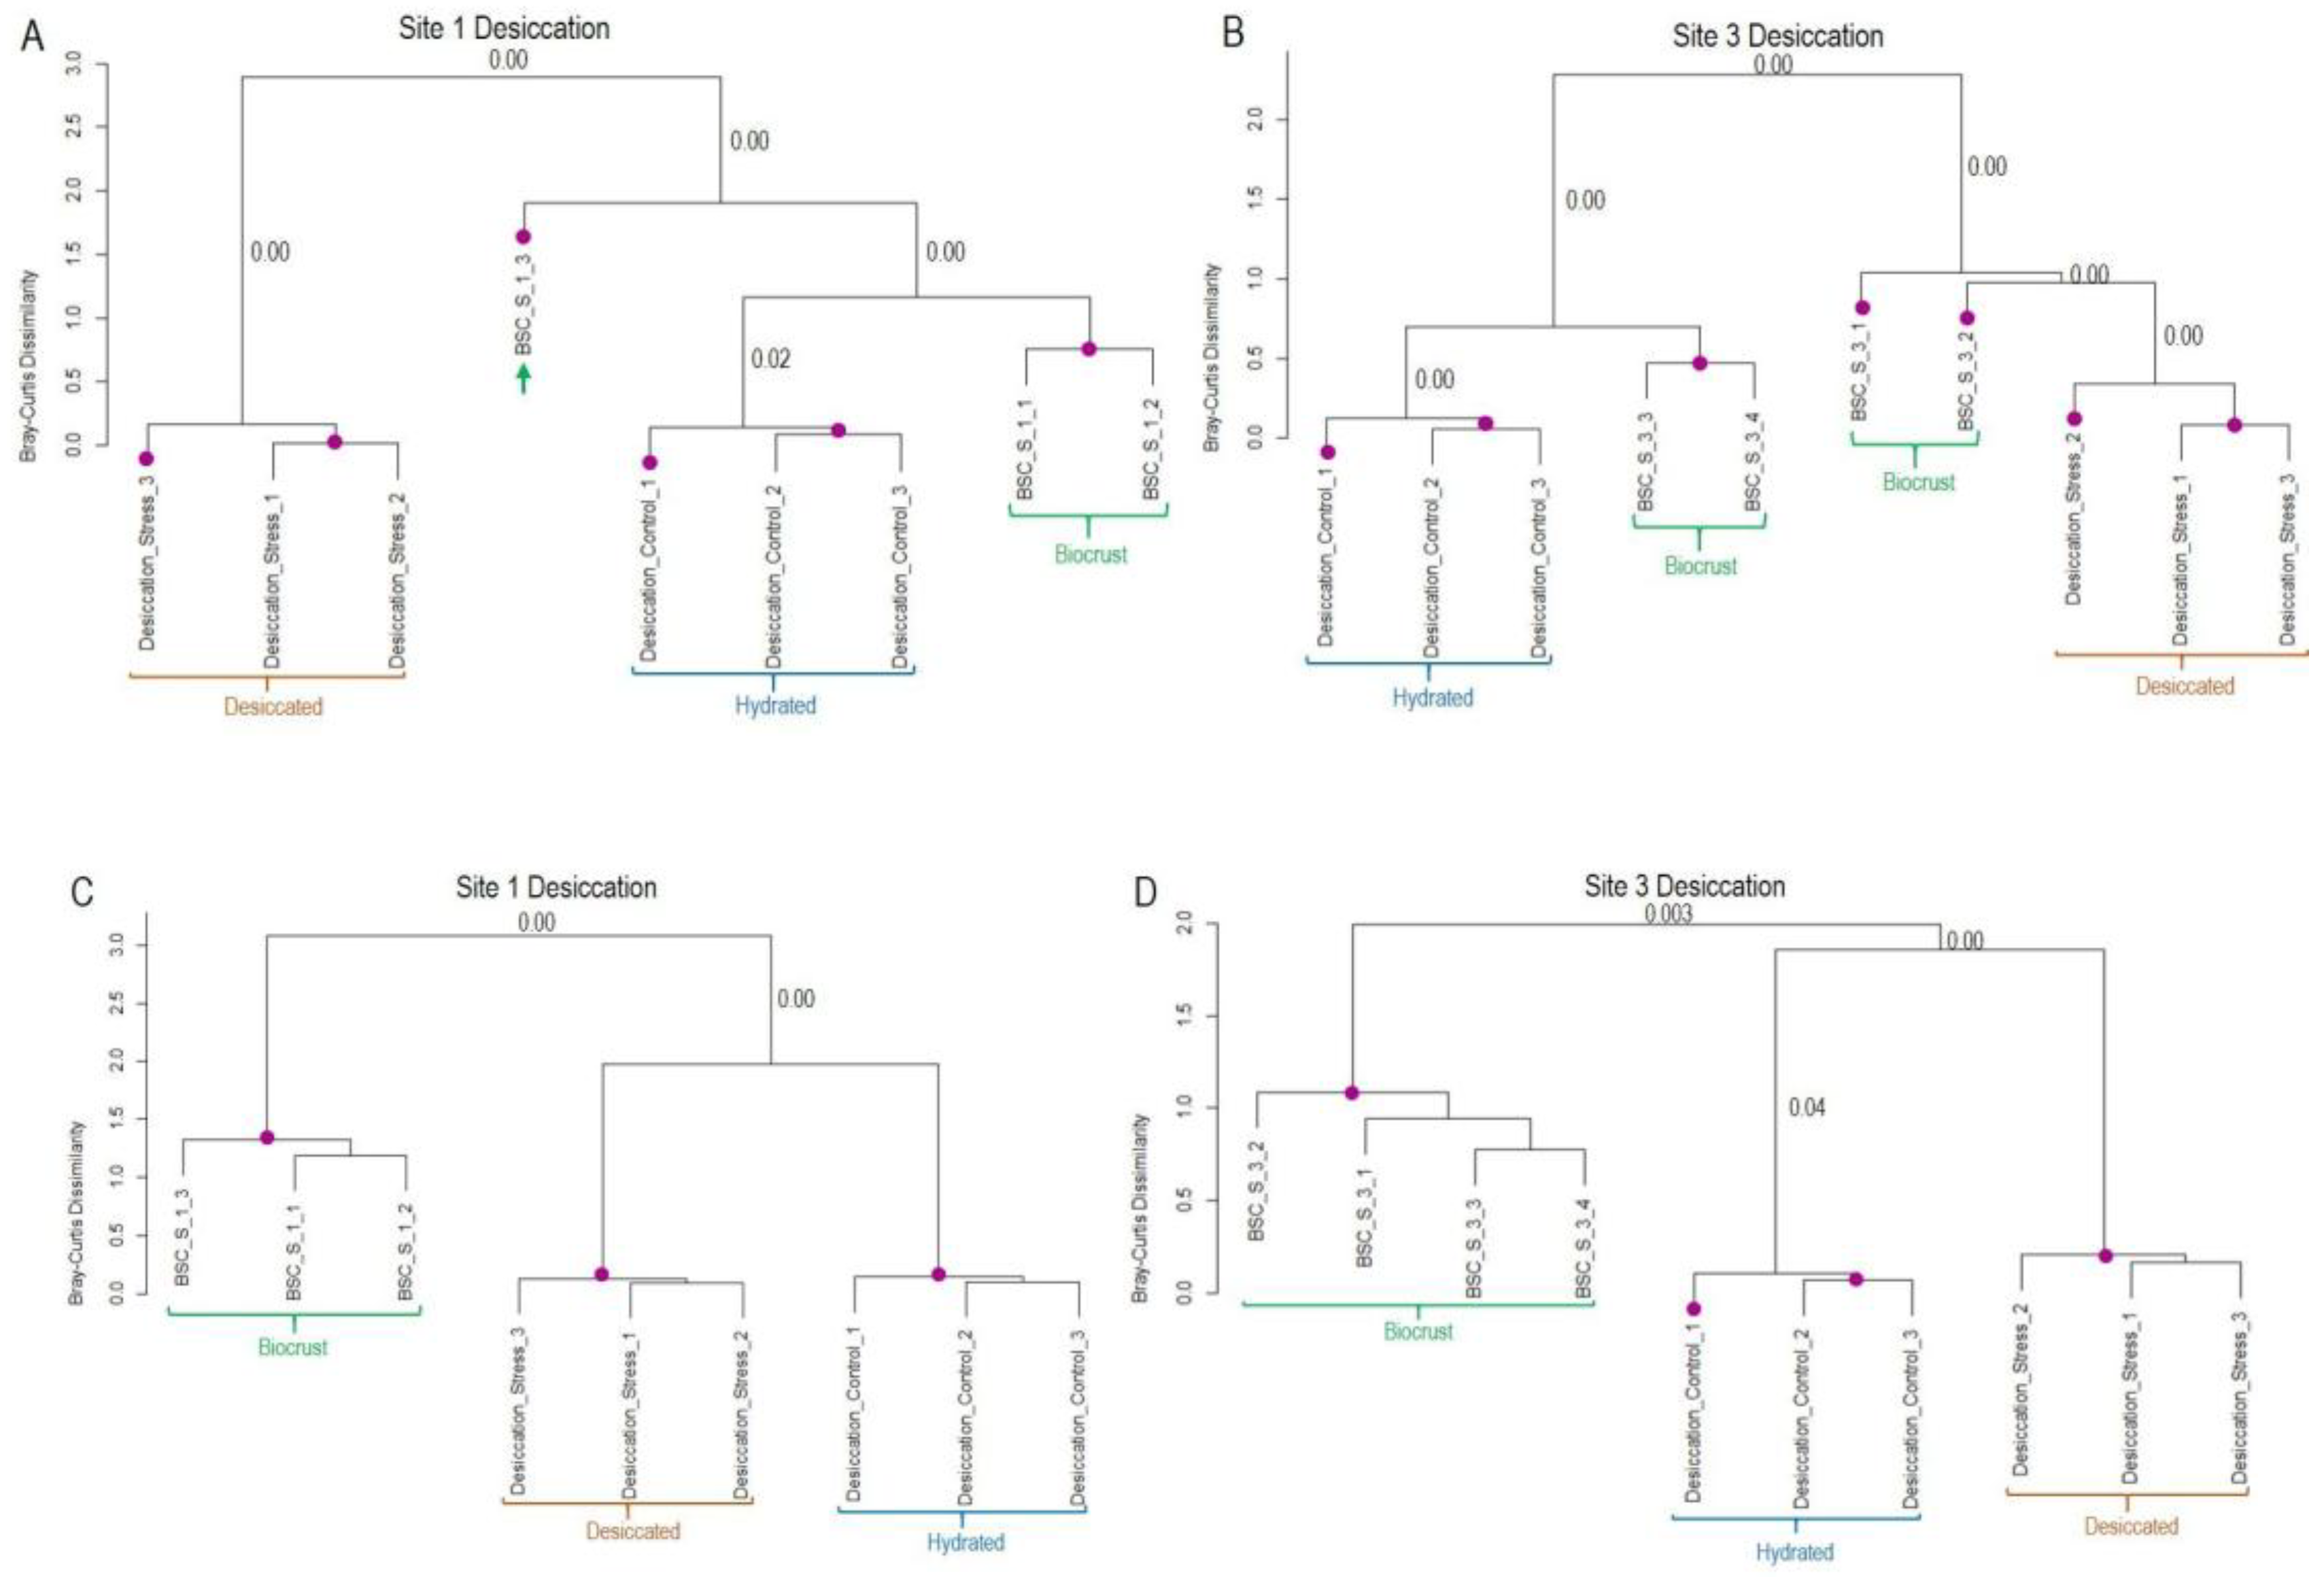

Table 1.
Description of the sampling sites.
| Site 1 | Site 2 | Site 3 | |
|---|---|---|---|
| Location | 62°39'39.4847"S, 61°5'46.9031" W | 62°39'55.785"S, 61°6'02.052" W | 62°39'50.5"S, 61°06'01.6" W |
| Sampling date | 09.01.2023 | 09.01.2023 | 11.01.2023 |
| Sampling time | 15:55:00 | 17:07:00 | 18:50:00 |
| Characteristics | Biocrust dominated by lichens and moss$$$ | Algae dominated biocrust. 100-150 m away from petrel nests and dead seals | Algae dominated biocrust. 30 m away from last tent in the camp, mild human disturbance |
| Soil temperature | 4.6° C | 3.8° C | 2.8° C |
| Air temperature | 2.3° C | 2.2° C | 2.0° C |
| Relative humidity | 99.9 % | 100 % | 99.8 % |
Table 2.
Number of transcripts regulated in laboratory stress experiments in K. flaccidum and K. dissectum.
Table 2.
Number of transcripts regulated in laboratory stress experiments in K. flaccidum and K. dissectum.
| Stress | No. of transcripts regulated in K. flaccidum | No. of transcripts regulated in K. dissectum | ||
|---|---|---|---|---|
| Up-regulated | Down-regulated | up-regulated | down-regulated | |
| Cold stress | 8,576 | 12,725 | 8,004 | 7,556 |
| Desiccation | 4,435 | 5,034 | 1,897 | 3,957 |
Table 3.
Summary of the de novo metatranscriptome assemblies for site 1 and site 3.
| Site 1 | Site 3 | ||
|---|---|---|---|
| Raw reads | Bases before processing | 7,825,615,239 | 11,906,629,319 |
| De novo metatranscriptome assembly | No. Transcripts | 679,102 | 300,904 |
| No. Genes | 534,509 | 227,696 | |
| N50 [bases] | 491 | 736 | |
| Hit with Klebsormidium Blast library | 46,341 | 23,618 | |
| Blast analysis | similarity >98%, e-value < 1E-66 | 123 | 81 |
| Manual selection | Selected transcripts used for GMIs | 35 | 31 |
Table 4.
Klebsormidium transcripts identified in Antarctic metatranscriptomes and their corresponding expression profiles in the stress transcriptome of K. flaccidum.
Table 4.
Klebsormidium transcripts identified in Antarctic metatranscriptomes and their corresponding expression profiles in the stress transcriptome of K. flaccidum.
| Expression profile in K. flaccidum stress transcriptome | Site 1 | Site 3 | |
|---|---|---|---|
| Effect of cold | Constantly expressed transcripts | 13 | 13 |
| Regulated transcripts | 11 | 10 | |
| Effect of desiccation | Constantly expressed transcripts | 12 | 12 |
| Regulated transcripts | 8 | 8 |
Disclaimer/Publisher’s Note: The statements, opinions and data contained in all publications are solely those of the individual author(s) and contributor(s) and not of MDPI and/or the editor(s). MDPI and/or the editor(s) disclaim responsibility for any injury to people or property resulting from any ideas, methods, instructions or products referred to in the content. |
© 2025 by the authors. Licensee MDPI, Basel, Switzerland. This article is an open access article distributed under the terms and conditions of the Creative Commons Attribution (CC BY) license (http://creativecommons.org/licenses/by/4.0/).
Copyright: This open access article is published under a Creative Commons CC BY 4.0 license, which permit the free download, distribution, and reuse, provided that the author and preprint are cited in any reuse.


