
Submitted:
11 May 2023
Posted:
12 May 2023
You are already at the latest version
Abstract
Our understanding of the long-term consequences of chronic ionising radiation for living organisms remains scarce. Modern molecular biology techniques are helpful tools for researching pollutant effects on biota. To reveal the molecular phenotype of plants growing under chronic radiation exposure, we sampled Vicia cracca L. plants in the Chernobyl Exclusion Zone and in areas with normal radiation backgrounds. We performed a detailed analysis of soil and gene expression patterns, and made coordinated multi-omics analyses of plant samples, including transcriptomics, proteomics, and metabolomics. Chronic exposure to ionising radiation induced complex and multidirectional changes, including significant alterations in the metabolism and gene expression patterns of irradiated plants. We revealed profound changes in carbon metabolism, nitrogen reallocation, and photosynthesis. These plants were characterised by increased DNA damage, redox imbalance, and stress response reactions. The upregulation of histones, chaperones, peroxidases, and secondary metabolism were noted.
Keywords:
Fabaceae
; transcriptomics
; proteomics
; metabolomics
; low doses
; abiotic stress
1. Introduction
Radioactive contamination of the environment can have detrimental effects on living organisms, including plants. As sessile organisms, plants must cope with radioactive contamination through complex response pathways and metabolic adjustments. The effects of ionising radiation on plants can vary depending on the dose and duration of exposure and the characteristics of a plant species [1,2,3,4]. At low doses, radiation can stimulate plant growth and enhance photosynthesis, while at higher doses, it can lead to DNA damage, chromosomal aberrations, and mutations, ultimately affecting plant growth and reproduction [1]. Plants can undergo epigenetic changes in response to ionising radiation, leading to alterations in gene expression and phenotype [2,3]. The study of the biological responses of plants to chronic radiation exposure in radioactively contaminated areas is important for understanding the fundamental mechanisms of plant radiobiological responses and developing effective strategies to remediate radioactively contaminated sites.
The relevance of plant research in radioactively contaminated areas is twofold. First, plants can be used as bioindicators of radioactive contamination in the environment [5]. The morphological and physiological changes in plants exposed to ionising radiation can be used to monitor the extent of contamination and assess the effectiveness of remediation strategies. Second, plants can be used in phytoremediation, a process in which plants remove, stabilise, or detoxify radioactive elements from the soil or water [6,7,8]. Phytoremediation has several advantages over traditional remediation methods, such as being cost-effective, sustainable, and environmentally friendly [9]. However, the success of phytoremediation depends on several factors, including the plant species used, the level and type of contamination, and the local environmental conditions [9].
The genus Vicia belongs to the Leguminosae family, commonly known as vetches, and includes several plant species of agricultural importance. The genus comprises nitrogen-fixing plants with great potential for human and animal nutrition [10]. As green manure, Vicia can improve soil structure and plant nutrition [10] and mitigate climate change consequences as a substitute for synthetic fertilisers [11]. It harbours a large community of rhizospheric microorganisms, which can help to increase phytoremediation efficiency and make a remarkable difference in the ecological restoration of polluted soils due to Vicia dual role as cover crops and phytoremediator plants [12]. In recent years, several studies have focused on the use of Vicia species for phytoremediation: V. sativa for phenols [13], Cd [14,15], and polychlorinated biphenyl [16]; V. faba for Cd [17,18], Pu [17] [18], oil [19], and Sr [20]; V. villosa for As [21]; and V. cracca as a heavy metal accumulator for Cu, Fe, Zn, and Pb [22].
V. cracca is a hardy, fast-growing plant common in the Chernobyl Exclusion Zone (CEZ). In areas contaminated by uranium mill tailings and radium production wastes, these plants showed a significant increase in chromosome aberrations and a decreased survival rate of sprouts [23], outlining this species as a sensitive indicator of radiation exposure. Therefore, understanding the biological responses of V. cracca to ionising radiation is essential for its role as a bioindicator and for the possible use of the Vicia genus for phytoremediation purposes.
In recent years, multi-omics approaches have emerged as powerful tools for studying the responses of plants to environmental stresses, including pollution [24]. These approaches integrate data from different "omics" levels, such as genomics, transcriptomics, proteomics, and metabolomics, in order to comprehensively understand the biological processes and molecular mechanisms of plant responses to pollution. In the context of natural areas, multi-omics approaches can be used to study the responses of plants to a variety of pollutants [24,25,26]. This approach helps identify key molecular pathways and biomarkers that can be used to monitor and mitigate the effects of pollution on plants and the environment.
The current article presents an integrated multi-omics analysis of V. cracca plants inhabiting radioactively contaminated areas in the CEZ. This approach can provide a complete picture of the molecular changes in plants experiencing chronic low-dose radiation exposure and help identify key molecular pathways and potential biomarkers. Studies on V. cracca using the multi-omics approach can therefore contribute to a better understanding of the biological responses of plants to ionising radiation and the development of effective strategies for phytoremediation of radioactively contaminated areas.
2. Results
2.1. Environmental conditions in experimental plots
Vicia cracca leaves were sampled in the Polesye State Radiation-Ecological Reserve (Republic of Belarus) at four plots with different levels of radioactive contamination in June 2021. V. cracca leaves were sampled at Lomysh (Lom, L) and Babchin (Bab, B) as reference plots outside the CEZ and at two radioactively contaminated plots, Kulazhin (Kul, K) and Masany (Mas, M) (Figure 1).
The experimental plots had significantly different levels of radionuclide contamination (Table 1, Table S1). The contaminated plot Masany was characterised by a high ambient dose rate of 3.2 μSv x h-1. At the same time, the highest specific activity of 137Cs (36 990 Bq × kg−1) was observed in the plot Kulazhin. Specific activities of 90Sr were similar at both contaminated plots, approximately 1 500 Bq × kg−1 (Table 1, Table S1). Soil properties at the experimental plots were slightly different (Table 2): soils samples at all plots were slightly acidic, with low humus content (1–5%) and low variation in the content of important minerals, being typical for soils of this region. Contents of heavy metals in soils did not exceed permitted levels (Table S1).
Additionally, in three plots out of four, we received data on annual absorbed dose rates from thermoluminescent dosimeters. Annual absorbed dose rates were calculated as mGy x year-1, reflected external γ-radiation exposure, and comprised 1.13 mGy for Babchin, 51.57 mGy for Kulazhin, and 27.51 mGy for Masany for 365 days.
2.2. Analysis of expression of selective genes in V. cracca populations
As a first approach, we performed targeted gene expression analysis of some genes of interest revealed in our previous studies on other plant species [25,26,27]. The products of these genes participate in redox processes, signal transduction, and photosynthesis. Several genes encoding chaperones and histones were included to test the earlier observations of the possible role of these molecules in responses to chronic radiation [25,26,27]. Interestingly, the studied genes were mostly upregulated at two contaminated plots compared to both controls (Figure 2). This observation includes NADPH-oxidase RBOH-F (Figure 2A), ascorbate peroxidase APX1 (Figure 2B), chlorophyll-binding protein CAB1 (Figure 2C), transcription factor HY5 (Figure 2D), histone H2B (Figure 2I), and chloroplast chaperonin CPN60А (Figure 2G). However, another chloroplast chaperonin CPN20 was downregulated at both contaminated plots (Figure 2G). The differential expression of V. cracca genes is shown in Figure 2. These results match patterns found earlier in other plant species in the Chernobyl exclusion zone [25,26,27]. While these gene functions seem to characterize a chronic ionizing radiation response profile, the specific role of each of these genes on the adaptive responses to chronic radiation remains to be investigated.
2.3. Whole-transcriptome analysis of V. cracca populations
In order to estimate the whole mRNA transcriptional profile of V. cracca populations in conditions of chronic radiation exposure, we performed RNA sequencing of leaf samples. V. cracca transcriptome was assembled de novo. After functional annotation, we revealed DEGs in samples from each radioactively contaminated plot compared to each control and performed the Gene Ontology analysis to functionally describe transcriptomic changes under chronic radiation exposure. Comparison of samples from K and M radioactively contaminated plots with each reference plot (B and L) revealed 4446 for M x B comparison, 4011 for K x B, 5426 for K x L, 5672 for K x B, and finally 4033 for L x B. To exclude natural heterogeneity and possible confounding effects, we used only those genes which met the following conditions for further analysis: (1) had unidirectional differential expression compared to both controls and (2) were not differentially expressed between the two controls themselves. Among them were 457 downregulated DEGs and 371 upregulated DEGs (Table S2, Figure 3).
GO terms for DEGs shared for both radioactively contaminated plots compared to both controls are provided in Table 3. Upregulated DEGs were associated with nucleosomes and protein dimerization, and downregulated DEGs were mainly photosynthesis-related.
For in-depth analysis, we identified the 25 most downregulated and 25 most upregulated DEGs (Table 4). Among the downregulated ones, there is an evident suppression of photosynthesis-related elements, specifically, the Calvin cycle, chlorophyll biogenesis, thiamine biosynthesis, and translation process. The induction of peroxidases, protein catabolism machinery, phytohormonal relays, and cell cycle-involved proteins is noted for upregulated genes. However, some elements of photosynthesis were found to be upregulated, which suggests an overall fine-tuning of the photosynthesis rate.
2.4. Non-targeted proteomic analysis of V. cracca populations
To reveal changes in the protein profile of irradiated samples, we performed a non-targeted proteomic analysis. One hundred and six proteins were successfully identified in the V. cracca samples (Table S3). Proteins whose abundance changed at least two-fold in at least one of the radiation x control comparisons are highlighted in Figure 4. Interestingly, among them are proteins related to photosynthesis, ribosome assembly, and several cytochromes. Some proteins were identified only in control samples (cytochrome f A0A0F6NLU, NAD(P)H-quinone oxidoreductase A0A0F6NLR2), while another cytochrome f A0A7T4XAP1 was revealed only in samples from radioactively contaminated plots.
In order to describe the possible functional interconnection between the identified proteins, we performed an analysis with the STRING tool (Figure 5), using as an input homologous proteins of Medicago truncatula. The hubs of translational responses reflect the interconnection of photosynthetic responses and ribosomal proteins, suggesting profound changes in energy metabolism and translation. These results overlap with the transcriptomic data, further supporting the notion that a strategy for coping with chronic ionizing radiation exposure involves the modulation of photosynthesis rate, possibly for adjusting toxic ROS levels which are produced during energetic processes involving electron transport chains, but also due to the water radiolysis [2, 25, 26, 28].
2.5. Non-targeted metabolomic analysis of V. cracca populations
To specifically describe plant molecular phenotype and to reveal the results of interactions of transcriptome and proteome, we performed non-targeted GC-MS analysis of metabolites in V. cracca leaves. The obtained metabolic profiles included around 750 compounds, of which 70% were identified. We filtered the metabolites with close QC values for all replicates for further analysis. Thus, 139 metabolites were selected for further statistical analysis, and their concentrations are presented in Table S4. The normalised data were used for the PCA analysis. The scores plot (Figure S1) shows five principal components (PC1-PC5) explaining 74.2% of variations from the sixteen samples of V. cracca. According to PC1, which explains 24.1% of the variance, the metabolite profiles of samples from control plots were grouped separately from samples of contaminated plots, which overlapped. Supervised PLS-DA analysis (Figure 6) showed that samples from radioactively contaminated plots K and M were separated from control samples and each other by Component 1 (Figure 6A). The reliability of the PLS-DA model was confirmed by R2 (0.926) and Q2 (0.754) values obtained as a result of cross-validation. According to VIP scores, the greatest contribution to the separation was O-methyl-inositol, inositol-3-phosphate, and pinitol (Figure 6B).
To visualise the metabolomic changes in control and chronically irradiated V. cracca plants, the top 50 metabolites were analysed using Heatmap and hierarchical cluster analysis. An obvious separation was observed between control and chronically irradiated plants, where four subclasses corresponded to four studied plots (Figure 6C).
One-way ANOVA with Fisher’s HSD at the 5 % confidence level was used to identify metabolites with different concentrations on radioactively contaminated plots. Data from 2 control plots, L and B, were combined and used as one group. As a result, 20 metabolites were identified in V. cracca, which were affected by chronic radiation exposure (Table 5).
A total of 139 metabolites was used for volcano plot analysis to understand how metabolites change at each experimental plot relative to the control (Figure 7). Specifically, K had 10 significantly downregulated metabolites and 19 upregulated compared to control L+B (Figure 7A), while M had 11 downregulated metabolites and 15 upregulated (Figure 7B) with biological and statistical cut-offs for fold change |FC| > 2 and p-value of < 0.05. Metabolites related to the citrate cycle, galactose metabolism, and glyoxylate and dicarboxylate metabolisms such as galactinol, raffinose, isomaltose, aconitate, and citrate were downregulated at both contaminated plots K and M compared to the control.
Kyoto Encyclopedia of Genes and Genomes (KEGG) identification numbers were used for pathway analyses of significantly changed metabolites (Table 5) in MetaboAnalyst 5.0 against the Arabidopsis thaliana library as a reference. Metabolic pathways altered considerably by chronic radiation exposure were revealed (Figure 7C), which included galactose metabolism (impact value: 0.27, FDR = 0.002), tyrosine metabolism (impact value: 0.22, FDR = 0.007), and citrate cycle (TCA cycle) (impact value: 0.15, FDR = 0.01) (Figure 7C).
2.6. Multi-omics data integration
The PaintOmics4 tool was used to identify pathways enriched or underrepresented in contaminated plots on different functional levels for a holistic view of the data. Among them were general pathways of carbon (Figure S2) and fatty acid catabolism (Figure S3), as well as N-glycan biosynthesis (Figure S4). The multi-omics analysis confirmed changes in the citrate cycle, where fumarate, 2-oxoglutarate, and malonate accumulation was observed, and citrate concentrations decreased (Figure 8), and in pyruvate metabolism (Figure 9), where accumulation of pyruvate was noted accompanied by downregulation of glycolysis in general (Figure 9, Figure S2). Profound changes in photosynthesis accompanied the changes in energy metabolism (Figure 10). Among more specific pathways, we observed upregulation of the glyoxylate cycle (Figure S5), downregulation of biotin metabolism (Figure S6), and upregulation of certain branches of propanoate metabolism, which led to the β-alanine synthesis (Figure S7). Structural modifications of ribosomes were also evident (Figure S8), accompanied by significant changes in RNA polymerase subunits (Figure S9). Altogether, the results suggest that the modulation of energy production is indeed a central aspect of plants growing under chronic radiation exposure.
3. Discussion
3.1. Carbon metabolism and photosynthesis.
Cells of V. cracca exposed to chronic ionising radiation are changing their carbon cycle metabolism, including the upregulation of pyruvate (Figure 7, 9) and fumarate (Figure 7, 8) biosynthetic processes, which points to energetic and plastic rearrangements. It can be connected with asparagine synthase decreased protein abundance (Figure 4), as asparagine synthesis-deficient A. thaliana mutants showed an accumulation of alanine, GABA, pyruvate, and fumarate, indicating an alanine formation from pyruvate through the GABA shunt to consume excess ammonium in the absence of asparagine synthesis [30]. Indeed, alanine, aspartate, and glutamate metabolism are also enriched in our data (Figure 7). On the other hand, the decreased citrate concentrations (Figure 7) coupled with the upregulation of transcripts involved in its biosynthesis (Figure 8) points to several bypass possibilities of TCA due to redox changes in the cell. Organic acids represent the stored pools of fixed carbon. When the redox level in the cell increases, the TCA cycle in mitochondria is transformed into a partial cycle supplying citrate for the synthesis of 2-oxoglutarate and glutamate (citrate valve). At the same time, malate is accumulated and participates in the redox balance in different cell compartments (via the malate valve) [31,32]. Indeed, multi-omics analysis revealed higher 2-oxoglutarate concentrations and malate accumulation (Figure 8), which may support the activation of citrate and malate valves. The upregulation of the glyoxylate cycle intermediates, such as D-glycerate and glycolate (Figure S5), also suggests that the cells are trying to bypass some steps of the TCA cycle to generate key metabolic intermediates. It could be a response to the decreased availability of other metabolic intermediates, such as citrate [31].
Fatty acids are major components of cell membranes, and changes in their biosynthesis could alter the fluidity and permeability of the membranes. The downregulation of pathways leading to fatty acid biosynthesis (Figure S3) suggests that the cells may be reducing their production of fatty acids in response to chronic radiation exposure. The downregulation of fatty acid biosynthesis pathways may have implications for the overall lipid metabolism and membrane composition of plant cells [51]. The decrease in the production of propanoyl-CoA from 2-oxobutanoate (Figure S7) also confirms lipid metabolism downregulation in irradiated plants. The increase in the production of malonate semialdehyde from 3-hydroxy-propionyl-CoA (Figure S7) suggests that the cells may be relying more heavily on the degradation of odd-chain fatty acids or amino acids for energy production [33].
Reallocation of carbon can be seen as profound changes in galactose metabolism (Figure 7), indicated by the decrease of raffinose family oligosaccharides (RFOs) concentrations. RFOs are involved in antioxidant, membrane-stabilising, and signalling pathways [34]. However, the reduction of galactinol and raffinose concentrations may rather be associated with their alleged role in providing carbon skeletons to lipid synthesis or thylakoid membrane biogenesis [35]. Further depletion of some carbohydrates was also confirmed by the downregulation of various N-glycans (Figure S4), which are involved in N-glycosylation and participate in multiple processes, including development, protein folding, photosynthesis, and phytohormone homeostasis [36]. N-glycans and raffinose family oligosaccharides interact with lectins in response to pathogens to initiate defence reactions [37]. It is plausible to suggest that the downregulation of raffinose and N-glycan metabolism may be partially attributed to the attempt to avoid overreaction to continuous damage of cell wall structure by ionising radiation, which can be perceived as a pathogen attack and promote defence responses.
Changes in carbon availability can be related to decreased capacities of carbon assimilation. The chloroplasts of plants are particularly sensitive to ionising radiation due to the susceptibility of their light-absorbing pigments and genetic material to the negative effects of reactive oxygen species (ROS) [3839,40]. Several photosynthesis-related genes were downregulated (Table 4). The changes in the antenna complex LHCII and photosystems I and II (Figure 10) were observed, suggesting that the photosynthetic machinery may undergo alterations in response to chronic radiation exposure. Downregulated DEGs included ISPE_SOLLC, PUR5_VIGUN, PGL1B_ARATH, FTSI1_ARATH, CHLM_ARATH, and PGKH_WHEAT (Table 4), which are associated with chloroplast development and chlorophyll biosynthesis [41,42,43,44,45]. A decreased expression can be either associated with redox damage of the electron transport chain or developmental changes under chronic irradiation conditions. The reduced synthesis of cytochrome b6/f (Figure 4, 10B) and changes in electron transport chain components suggest a decrease in the efficiency of photosynthesis. The changes in Fd, FNP, and PC (Figure 10B) also imply electron transport chain dynamics alterations, which may impact the overall ATP production. The upregulation of ATPase components may indicate an increase in the cellular demand for ATP (Figure 10B), possibly due to the decreased efficiency of other energy-generating pathways like glycolysis, which is evidently downregulated (Figure 9). However, in the targeted gene expression analysis, we observed the upregulation of CAB1 homologue (Figure 2), which is associated with chlorophyll accumulation and stability of chloroplast membranes [46]. Expression of transcription factor HY5, which regulates, particularly, CAB1 expression [47] and is a key factor of chlorophyll accumulation, was increased in all contaminated plots (Figure 2). Induction of these genes is aligned with our previous results [25, 27] and points to the important role of HY5 in responses to chronic radiation and to the possible disruption of circadian rhytmes of irradiated plants [47,48,49].
Overall, these changes in energy metabolism suggest that the cells undergo significant alterations in response to chronic radiation exposure, possibly redirecting metabolic intermediates of the TCA cycle for the synthesis of protective compounds and relying more on fatty and amino acid catabolism for energy production than plants from the reference plots.
3.2. Chronic radiation stress response: DNA damage and changes in the redox status.
Chronic radiation exposure is a mutagenic factor capable of inducing DNA single- and double-strand breaks. Our previous research, however, revealed a very subtle DNA repair machinery response in plants growing under chronic radiation, such as Pinus sylvestris [25] and Capsella bursa-pastoris [26]. Deep sequencing of V. cracca transcriptome revealed upregulated DEGs involved in DNA repair and cell cycle control (Table 4). Among them are topoisomerase 3-alpha TOP3A_ARATH, involved in homologous recombination, and cyclin CCNB1_MEDSA. However, the canonical DNA damage response elements (such as ATR, ATM, and SOG1 [2]) were not identified, which may point to the involvement of identified DEGs in replication maintenance rather than in radiation-caused strand break repair. Nevertheless, if chronic radiation exposure affects DNA replication efficiency remains to be investigated. Upregulation of histones (Figure 2, Table 4, Table S2) and nucleosomal processes (Table 3) may confirm our previous hypothesis of the role of DNA packaging in coping with chronic DNA damage rather than keeping energy-demanding systems of DNA damage recognition constantly upregulated [25, 26]. Homologous recombination is a part of the response to DNA double-strand breaks [2], but other components of DNA damage response signalling [50] were not deregulated in our data (Table S2). Furthermore, a potential inducer of apoptosis CEP1_ARATH [51] was strongly upregulated (Table 4). Therefore, the data point to at least moderate DNA damage in plants from radioactively contaminated plots.
Chronic damage of macromolecules implies the need to protect DNA and protein integrity and conformation. Based on our previous findings of the involvement of histones and chaperones in responses to chronic radiation exposure [25,26], we performed targeted expression analyses of several chaperones (Figure 2). The upregulation of chloroplast chaperonin CPN60А homologue may be connected to decreased RuBisCO abundance (Figure 4). Rubisco deactivation may be a protective strategy under stress conditions, while CPN60A, which is involved in carboxylation, participates in photosynthesis maintenance under stress conditions, being upregulated, particularly under heat stress [52]. However, the CPN20 homologue encoding another chloroplast chaperonin was significantly downregulated in both radioactively contaminated plots (Figure 2). CPN20 negatively regulates certain branches of ABA signalling [53,54]; therefore, its downregulation may be connected to CPN20 signalling function rather than protein folding.
Finally, the redox imbalance in V. cracca is confirmed not only by TCA bypassing and photosynthesis reduction. The upregulation of peroxidases (Table 4, Figure 2) suggests increased ROS concentrations. Downregulation of biotin metabolism (Figure S6) may lead to biotin deficiency, which, in turn, is associated with H2O2 accumulation [55]. In turn, biotin deficiency can contribute to observed changes in carbon metabolism since biotin is a cofactor for some carboxylases, decarboxylases and transcarboxylases participating in fatty acid and carbohydrate metabolism [56]. Under radiation-induced ROS imbalance, accumulating secondary metabolites with antioxidant properties [1] is a promising coping strategy for chronic oxidative stress.
3.3. Secondary metabolites.
Indeed, several DEGs involved in the biosynthesis of phenolic compounds, which are important antioxidants, were induced in response to ionising radiation (Table S2), including PALY_MEDSA (Table 4), phenylalanine ammonia-lyase. This enzyme catalyses the first synthesis step of various phenylpropanoid compounds [57] and is often induced by ionising radiation [58,59,60]. The upregulation of the HY5 transcription factor gene (Figure 2) can also induce anthocyanin biosynthesis [47]. Meanwhile, the downregulation of genes involved in terpenoid biosynthesis, such as ISPE_SOLLC and CHLP_ARATH (Table 4), potentially indicates a compensatory role in the biosynthesis of other metabolites. In V. cracca from contaminated plots, increased concentrations of metabolites involved in tyrosine metabolism were observed (Figure 7). Tyrosine is a precursor of metabolites that perform antioxidant functions (tocopherols, rosmarinic acid), electron transfer in the electron transport chain (plastoquinone and ubiquinone), and plant protection against pathogens (alkaloids and glycosides) [61].
Nitrogen reallocation is essential for nitrogen-containing secondary metabolites biosyntheses such as alkaloids, cyanogenic glycosides, glucosinolates, and nonprotein amino acids [62]. Besides general changes in amino acid metabolic pathways, we observed a significant increase in the allantoin concentration in the contaminated plot Masany (Table 5) with the highest ambient dose rate and activities of 137Cs and 90Sr in soil. Allantoin is an intermediate product of the purine catabolic pathway, which acts in nitrogen metabolism and transport in plants [63] and accumulates in plants during environmental challenges increasing stress tolerance [64]. In chronically irradiated V. cracca plants, an increase in the concentrations of nicotinate and its derivative trigonelline was revealed (Figure 7), which may be associated with oxidative damage to cells and perturbations in cellular energy metabolism [65]. Several other secondary metabolites had a higher concentration on radioactively contaminated plots (Figure 7), including compounds with antioxidant and protective properties, such as pinitol [66], trigonelline [67], β-amyrin [68], hydrangeifolin [69], and piceid [70]. Therefore, at least partially, certain general metabolic pathways can be suppressed due to carbon and nitrogen reallocation for protective compound synthesis under chronic irradiation.
3.4. Protein catabolism and RNA processing.
The changes in ribosomal protein synthesis (Figure S8) suggest a complex response to chronic ionising radiation, with some ribosomal proteins being upregulated and others being downregulated. Such differential regulation patterns can be related to tissue-specific responses [71] or be an example of multidirectional ribosomal protein responses, as was shown for other stressors [72,73]. For instance, ribosomal proteins of large ribosomal subunits are highly responsive to stress and signalling molecules, indicating that they may have roles in stress responses besides housekeeping function [72]. Extraribosomal functions of some ribosomal plant proteins include microRNA biogenesis, anti-virus defence, and plant immunity, which may be associated with the widespread duplication of ribosomal protein genes in plants [74].
The changes in RNA polymerase biosynthesis are also multidirectional (Figure S9). Eukaryotic RNA polymerase II components are mostly upregulated (Figure S9), while this enzyme complex is responsible for the transcription of protein-coding genes, long non-coding RNAs, and small RNAs [75]. The downregulation of RNA polymerases I and III components (Figure S9) may suggest a decrease in the transcription of rRNA and tRNA genes [75]. The processing of rRNA is deregulated on the transcriptional level (Table 4). Overall, the changes in ribosomal protein synthesis and RNA polymerases suggest that the cells undergo significant alterations in their gene expression and translational patterns in response to chronic radiation exposure.
Plant growth and development are directly linked to ribosome synthesis and protein translation. Still, the precise molecular mechanisms and signals that connect cellular and environmental conditions with rRNA synthesis and ribosome assembly remain to be uncovered [76]. Yet, the ribosomal responses of V. cracca to chronic irradiation may be of particular interest since, lately, ribosomal proteins have been suggested as a valuable resource for manipulating the stress tolerance of crops [72].
4. Materials and Methods
4.1. Experimental plots and soil sampling.
Sampling was conducted at the Polesye State Radiation-Ecological Reserve (Republic of Belarus) at four plots with different levels of radioactive contamination in June 2021. V. cracca leaves were sampled at Lomysh (Lom, L) and Babchin (Bab, B) as reference plots outside the CEZ and at two radioactively contaminated plots, Kulazhin (Kul, K) and Masany (Mas, M) (Figure 1).
At each experimental plot, the ambient dose rate was determined using a dosimeter-radiometer MKS-02SA1 (SNIIP, Russia) at a 1 m from the surface, and α- and β-particle flux densities (min−1 × cm−2) were determined 0.2 cm above the ground. Soil samples at each plot were collected by the envelope method from a rectangular area (1 × 2 m) inside the plot at a depth of up to 15 cm, and then the soil was mixed into a pooled sample. The activity concentrations of 137Cs in the soil samples were measured with a γ-spectrometer CANBERRA (USA). We used the radiochemical method to determine 90Sr specific activity in soil sampling. To estimate the annual absorbed dose of external γ-radiation at each experimental plot, we installed a thermoluminescent dosimeter DTL-02 (NPP Doza, Russia). The dosimeters were covered from weather exposure by a section of plastic tube installed over them, and laid on the ground inside the perimeter of a sample plot.
At each plot, soil properties and levels of heavy metal contamination were assessed, including pH, hydrolytic activity, cation exchange capacity, K, P, Ca, Mg, Na, and humus content in accordance with the ISO standard for soil quality [77]. Total concentrations of heavy metals (Cd, Cu, Co, Ni, Cr, Mn, Pb, Zn, As, and Mo) in the soil samples were measured using a plasma optical emission spectrometer (ICP-OES, Australia) in accordance with the ISO 11047 standard following treatments with a mixture of HNO3, HCl, and HF [78].
4.2. Plant sampling.
V. cracca was sampled at the four plots by collecting pools of leaves from 5 to 7 plants (approximately 0.5 g total). Sampled plants visually belonged to the same developmental stages. The samples were immediately frozen in liquid nitrogen until analyses. For quantitative real-time PCR (qRT-PCR) gene expression analysis, we used 4 samples per plot. For transcriptome, proteome, and metabolome analyses, leaves V. cracca were sampled from the same plants for all three analyses to ensure correlation among all omics levels. For the transcriptomic analysis, we used 3 samples per plot. For proteomic analysis, we used 4 samples for each contaminated plot and 3 for each reference plot. For metabolomic analysis, 4 samples for each reference and radioactively contaminated plots were used. Sampling was performed around noon for all experimental plots (Table S1). The samples were collected under similar environmental conditions, and no rain occurred during the sampling period.
4.3. Gene expression by qRT-PCR.
Based on our previous research using other plant species growing in the CEZ [25,26,27] and data from other authors on plant responses to chronic radiation exposure [79,80], we selected several genes to study specific transcriptional responses of V. cracca to chronic irradiation (Table 6). The products of these genes are associated with the antioxidant system, signal transduction, and photosynthesis processes. The expression of genes encoding aquaporins was also studied, as these proteins maintain the redox balance of cytosol and hydrogen peroxide transport [81]. To test the hypothesis of the essential role of chaperones and histones in adaptive response to chronic irradiation, firstly raised in Pinus sylvestris L. [25] and Capsella bursa-pastoris L. [26], we included in the analysis several genes encoding chaperones and histones for V. cracca. CYP2 and ELF1A [82] were used as reference genes.
For primer design, cDNA sequences of A. thaliana were aligned against Fabaceae sequences using the NCBI BLAST tool. 5-10 sequences of homologous genes with the highest score were selected for each target gene. The sequences were processed in Сlustal Omega 1.2.2, revealing the conserved regions. Next, primers to the selected regions were constructed using Primer BLAST. The specificity of primer pairs was tested using qRT-PCR and 2% agarose gel separation. Primer sequences are provided in Table S5.
Total RNA from V. cracca leaves was isolated using GeneJET Plant RNA Purification Mini Kit (Thermo Fisher Scientific, USA). RNA concentration and quality were measured using NanoDrop OneC (Thermo Fisher Scientific, USA). 1 μg of total RNA was treated with DNase I (Thermo Fisher Scientific, USA). MMLV RT kit (Evrogen, Russia) was used to synthesise the first strand of cDNA. The resulting cDNA was diluted 1:10 in nuclease-free water and used as a template for the qRT-PCR.
qRT-PCR was performed using a DT-96 PCR machine (DNA-Technology, Russia) under the following thermal cycling conditions: initial cycle at 50 °C for 2 min, initial denaturation for 2 min at 95 °C, followed by 50 annealing/elongation cycles (95 °C for 15 s, 60 °C for 60 s). The volume of the reaction mixture for one reaction was 20 µl, which included 4 µl of the cDNA template, 2 µl of a 10 µM mixture of forward and reverse primers, 4 µl of the qRT-PCR mix-HS SYBR reaction mixture (Evrogen, Russia), 10 µl of nuclease-free water. To calculate changes in gene expression (RQ), we used the ∆∆Сt model [83]. A significant change in gene expression was considered a twofold increase or decrease in expression compared to both controls.
4.4. RNA sequencing and transcriptomic analysis.
Total RNA was isolated using the GeneJET RNA Purification Kit (Thermo Fisher Scientific, USA) with polyvinylpyrrolidone addition. The quality and purity of isolated RNA were assessed using NanoDrop OneC (Thermo Fisher Scientific, USA) and horizontal gel electrophoresis. cDNA synthesis, library preparation, and sequencing were provided by "Evrogen" (Moscow, Russia). Using TruSeq mRNA Stranded reagent kit (Illumina, USA), poly(A+)-fraction enrichment and random primer cDNA synthesis were performed in 12 RNA samples. The resulting cDNA was used to prepare libraries compatible with Illumina sequencing technology. The quality of the obtained libraries was checked using Fragment Analyzer (Agilent, USA). Quantitative analysis was performed using the qRT-PCR method. After quality control, the pool of cDNA libraries was sequenced using Illumina NovaSeq 6000 (150 bp, pair-ended). FASTQ files were obtained using bcl2fastq v2.20 Conversion Software (Illumina, USA). The format for recording the quality data string was Phred 33. As a result, 1 090 239 068 raw reads were obtained.
The transcriptome data analysis was performed following suggestions previously described in [84]. Quality assessment was performed using FastQC v.0.11.9 and MultiQC v.1.10 software. Trimmomatic v.0.40 software was used for trimming using the following parameters: ILLUMINACLIP:TruSeq3-PE.fa:2:30:10; HEADCROP:11; LEADING:3; TRAILING:3; MAXINFO:130:1; MINLEN:50. The trimmed reads were deposited in Sequence Read Archive under accession number PRJNA958217, and used for de novo transcriptome assembly using Trinity v.2.9.1 at the Galaxy public server https://usegalaxy.eu [85]. In silico normalisation of paired and unpaired reads was performed, and unpaired readings were attached to the "left" paired read. Contigs smaller than 200 bp were filtered from further analysis. Assembly completeness was tested in BUSCO v2 [86]. The fabales_odb10 data set corresponding to representatives of the Fabaceae family was used for evaluation. The result showed 89.4% similarity of the assembly with the group of orthologues and a high percentage of duplications (84.0%), which may indicate the possible tetraploidy of the samples since V. cracca is known to possess either diploid or autotetraploid cytotypes [87,88]. The alignment of paired reads to the assembled transcriptome showed a satisfactory result (above 60%). Open reading frames were predicted for the assembled contigs in TransDecoder v.5.5.0. The search for protein (blastp) and translation (blastx) motifs were performed on sequences obtained from the Swiss-Prot database. Protein domains were identified in HMMER v2.2 [89] and Pfam [90]. Predictions of signal peptides, rRNA transcripts, and transmembrane regions were performed in SignalP v4.1 [91], RNAMMER v1.2 [92], and TmHMM v2.0, respectively. Functional annotation was carried out in Trinotate v.3.2.2 [93]. and InterProScan 5.59_91.0 [94]. As a result, gene annotation of contigs and terms of gene ontology (GO) were obtained.
The quantification algorithm kallisto v.0.46 [95] and DESeq2 statistics package [96] were used to quantify gene expression. Comparisons were made between contaminated and control plots and two control plots (Babchin-Lomysh) to assess heterogeneity (Figure S10). Genes with log2FC ≥ |2| and adjusted p-value ≥ 0.05 (Benjamini-Hochberg method) were considered as differentially expressed. DAVID Bioinformatics tool [97] was used to identify significant GO terms. Venn diagrams were created using the web tool http://bioinformatics.psb.ugent.be/webtools/Venn.
4.5. Protein isolation and proteomic analysis.
For protein isolation, at each control plot, we used 3 replicates and 4 replicates for each radioactively contaminated plot. Two buffers were used to isolate and purify protein from V. cracca leaves: (1) extraction buffer (EB): 0.2 M TRIS-HCl, pH 9.0; 0.2 M KCl; 0.025 M EGTA, pH 8.0; 0.035 M MgCl2; 1% (V/V) PTE; 1% (V/V) detergent blend (Brij-35, Tween 20, Triton X-100, Igepal CA 630); 0.005M DTT; 1x cocktail of protease inhibitors; (2) lysis buffer (LB): 4% SDS; 100 mM Tris/HCl, pH 7.4; 1x cocktail of protease inhibitors. 100 mg of tissue per sample was ground in liquid nitrogen and dissolved in 750 μL of buffer EB on ice for 20 minutes, pipetting until complete dissolution of plant tissue aggregates. The suspension was centrifuged at maximum speed for 10 minutes at 4 °C. The supernatant was collected and stored on ice. The precipitate was redissolved in 500 μL of LB, incubated for 3 minutes at 95 °C, and then sonicated for 5 minutes to destroy the membranes. After centrifugation, the supernatants were combined, and 10% TCA in acetone pre-cooled to ‒20 °C was added to precipitate the proteins. This solution was incubated overnight at ‒20 °C and then centrifuged for 10 minutes. The protein precipitate was then washed twice with cold acetone and dried. Before the analysis, the protein pellet was stored at ‒80 °C.
Skolkovo Institute of Science and Technology provided proteomic analysis services. The precipitated protein was dissolved in 200 µL of sample dilution buffer, placed in an ultrasonic bath for 1 min, and centrifuged for 10 min at 14 000 g and 10 °C. The supernatant was transferred to clean, labelled vials. To estimate the amount of protein by the BSA method, the following mix was prepared: 5 µL of the supernatant obtained during lysis, 25 µL of water, 1 mL of the BSA reagent, and 20 µL of a 4% copper sulphate solution. To prepare a blank sample, 30 µL of water, 1 mL of the BSA reagent, and 20 µL of a 4% copper sulphate solution were mixed. Similarly, calibrant samples were prepared (solutions of BSA with a concentration of 1 µg/µL to 10 µg/µL) with BSA reagent. The samples were shaken and incubated for 20 min at 56 °C with stirring on a thermomixer. The samples were cooled to room temperature and analysed on a CLARIOstar reader (BMG Labtech, Germany). For further analysis, samples were diluted in 50 mM TEAB to a final protein concentration of 2 µg/µL.
For protein hydrolysis, 10 µL of samples were transferred into 200 µL tubes, corresponding to 20 µg of protein. 10 µL of protein recovery mixture was added to the samples, shaken, rapidly centrifuged, then incubated for 30 min at 80 °C and cooled to room temperature. 100 µL 50 мМ TEAB and 2 μL of trypsin solution (trypsin:protein ratio 1:100) were added into the samples and incubated for 4 hours at 42 °C. Next, another 2 μL of trypsin solution was added (trypsin:protein ratio 1:50), incubated for 18 hours (overnight) at 37 °C, and then cooled to room temperature. Formic acid (2 μL) was added, shaken, and cooled for 10 minutes in a refrigerator at 4 °C, then centrifuged for 10 min at 14 000 g and 10 °C. The supernatant was transferred into glass inserts for HPLC-MS analysis and evaporated in a vacuum concentrator, then redissolved in 10 μl of 0.1% formic acid in water. Then samples were analysed by high-performance liquid chromatography with tandem mass spectrometry (HPLC-MS/MS) using UltiMate 3000 RSLCnano system coupled with Q Exactive HF hybrid quadrupole-Orbitrap mass spectrometer (Thermo Scientific, USA). Samples were analysed in three technical replicates. 2 μL per sample was separated on an Acclaim Pepmap C18 column (Thermo Scientific, USA) in a gradient elution mode. The gradient was formed by mobile phase A (0.1% formic acid in deionised water) and mobile phase B: (80% acetonitrile, 0.1% formic acid in deionised water). The column was washed with 2% mobile phase B for 1 min at a flow rate of 700 nL/min, then 1 min at 500 nL/min and 3 min at 400 nL/min. Further separation was carried out at a flow rate of 400 nL/min: the concentration of mobile phase B was linearly increased to 5% in 3 min, then the concentration of phase B was linearly increased to 30% in 70 min, then the concentration of phase B was linearly increased to 99% in 2 min, after a 5-minute wash at 99% buffer B, the concentration of buffer B was linearly reduced to the initial 2% over 3 minutes, and the column was washed with 2% mobile phase B for 8 minutes. The total duration of the analysis was 95 min.
Mass spectrometric analysis was performed on a Q-Exactive HF mass spectrometer in positive ionisation mode using a NESI source (Thermo Scientific, USA). The following parameters were set: emitter voltage 2.1 kV, capillary temperature 240 °C. Panoramic scanning was carried out in the mass range from 390 m/z to 1200 m/z at a resolution of 60 000. In tandem scanning, the measurement was carried out in the mass range from 200 m/z to the upper limit, which is determined automatically based on the mass of the precursor, but not more than 2 000 m/z, at a resolution of 15 000. Precursor ions were isolated in a window of ± 1 Da. The maximum number of ions allowed for isolation in the MS/MS mode was no more than 10, the minimum intensity of the precursor ion for tandem analysis was set as 50 000 units, and the normalised collision energy was 29. For tandem scanning, only ions from z = 2+ to z = 4+ in charging conditions. The maximum accumulation time for precursor ions was 50 ms, and for fragment ions, 150 ms. All measured precursors were dynamically excluded from the tandem MS/MS analysis for 10 s.
Proteins were identified using the MaxQuant v.1.6.17.0 software and the Andromeda search algorithm. Proteins were identified using the UniProt database with species indication. The following search parameters were set: the cleaving enzyme trypsin, the accuracy of mass determination of m/z peptides in MS ± 5 ppm, the accuracy of mass determination in MS/MS spectra ± 0.01 Da, and the possibility of skipping two trypsin cleavage sites. Proteins were considered reliably identified if at least two peptides were found. Oxidation of methionine, acetylation of the N-terminus of the protein, and modification of cysteine with chloroacetamide were considered possible and mandatory modifications of the peptides, respectively. The False Discovery Rate value of no more than 1.0% was used to validate comparisons of Peptide-Spectrum Matches spectra and peptides. Label-free protein quantification was based on iBAQ. The data were filtered to remove possible contaminants, and unreliably identified proteins and only proteins that occurred in two technical repetitions of the MS analysis were retained. We used only proteins with log2FC ≥ |1| for further functional evaluation compared to the control samples.
4.6. Metabolite extraction and metabolomic analysis.
Metabolite extraction, derivatisation, and GC-MS analysis were performed at Institute Jean-Pierre Bourgin (INRAE), as previously described [98]. The freeze-dried samples of V. cracca leaves were ground using metal beads and resuspended in 1 mL of frozen (-20 °C) water:acetonitrile:isopropanol (2:3:3) solution, containing ribitol at 4 mg.mL-1 and extracted for 10 minutes at 4 °C by shaking at 1400 rpm in an Eppendorf thermomixer (Eppendorf, Germany). Insoluble material was removed by centrifugation at 20 000g for 5 minutes. 100 mL of supernatant were collected and dried for 4 hours in a Savant Speed-Vac (Thermo Fisher Scientific, USA) and stored at -80 °C. Three blank tubes underwent the same steps as the samples. Quality controls (QC) were prepared by pooling the same amount of each sample. They were injected at the beginning, the middle, and the end of the injection series to ensure the stability of the derivatisation. After drying for 1 hour after -80°C storage, 10 mL of 20 mg.mL-1 methoxyamine in pyridine was added to the samples. The reaction was performed for 90 minutes at 28 °C under continuous shaking in the Eppendorf thermomixer. Then 50 mL of N-methyl-N-trimethylsilyl-trifluoroacetamide was added, and the reaction continued for 30 minutes at 38 °C. After cooling down, 45 mL of the derivatised sample was transferred to an Agilent vial for injection.
Metabolites were analysed by GC-MS 4 hours after derivatisation. One μL of the derivatised sample was injected in the split and splitless modes in Agilent 7890A gas chromatograph coupled to Agilent 5975C mass spectrometer, column Rxi-5SilMS from Restek (30 m with 10 m Integra-Guard column; Bellefonte, PA). The oven temperature ramp was 70 °C for 7 minutes, then 10 °C/ min to 330 °C for 4 minutes (run-length 36.5 minutes). Helium constant flow was 0.7 mL/min in splitless mode and 1 mL/min in split mode. Temperatures were as follows: injector ¼ 250 °C; transfer line ¼ 300°C; source ¼ 250 °C, and quadripole ¼ 150 °C. Samples were randomised. An alkane mix (C10, C12, C15, C19, C22, C28, C32, and C36) was injected in the middle of the queue for external retention index calibration. Five scans per second were acquired.
Raw Agilent data files were converted to NetCDF format and analysed with AMDIS 32 [99]. A home AMDIS retention index/mass spectra library, built from the NIST, Golm, and Fiehn databases and standard compounds, was used for metabolite identification. Peak areas were determined more precisely using the Target-Lynx software (Waters, France) after converting the NetCDF file to MassLynx format. Metabolites were normalised to the ribitol internal standard and to dry weight. A subset of metabolites was quantified absolutely using a response coefficient in both injection modes to ensure the absence of saturation.
Statistical analysis was done with Metaboanalyst 5.0, a web-based metabolomic processing software, using multivariate and hierarchical clustering statistical approaches [100]. If a metabolite was not identified in one of the plots but was presented in others, the missing values were replaced by 1·10-15. In other cases, the remaining missing values were replaced by a limit of detection (1/5 of the minimum positive value of each variable). Before statistical analysis, all data were subjected to sample normalisation by median and auto-scaling. Principal component analysis (PCA) and partial least squares–discriminant analysis (PLS-DA) was done to determine the metabolomic variability within experimental plots. Metabolite change measurements were subjected to one-way ANOVA. Significant differences between individual means were determined using Fisher’s HSD (honestly significant difference) pairwise comparison test at the 5 % confidence level. To visualise the relationship among samples and among the top 50 metabolites, hierarchical clustering heatmaps with Euclidean distances as the similarity measure and Ward’s linkage as the clustering algorithm were conducted. Volcano plots were also generated for all detected metabolites, and the significant metabolites with p ≤ 0.05 and FC ≥ 2 were highlighted based on Student’s t-test. Significant metabolites were used for the pathway analysis, combining powerful pathway enrichment analysis results with pathway topology analysis to identify the most relevant pathways involved in the plant response to chronic radiation exposure. The Arabidopsis thaliana pathway library was used as a reference set.
4.7. Multi-omics data integration.
Multi-omics analysis was conducted with the web tool PaintOmics 4 [101] [101]. The closest to V. cracca model species in KEGG databases, Medicago truncatula L., was used as a proxy for multi-omics analysis. Galaxy public server (https://usegalaxy.eu/) [85] was used to perform blastp search of the differentially expressed V. cracca transcripts and proteins against the M. truncatula proteome (retrieved from Uniprot database, entry UP000002051). RStudio v.4.2.2 was used to prepare data for the multi-omics analysis. Background data on transcriptomics, proteomics, and metabolomics were provided for PaintOmics 4 software as log2FC in irradiated samples compared to controls (pairs K x B, K x L, M x B, and M x L). From metabolomic data, log2FC was provided only for those metabolites with KEGG ID. As relevant features for PaintOmics 4 tool, we used differentially expressed genes (DEGs) and differentially expressed proteins in both contaminated plots. As relevant metabolites, we chose those significantly different from the control for at least one experimental plot. After selecting and preparing datasets, the following parameters were used to run PaintOmics4: species: Medicago truncatula L.; databases: KEGG, MapMan, Reactome; clusters presented in data: generate automatically; metabolite class activity threshold: generate automatically.
5. Conclusions
Chronic exposure to ionising radiation induces complex and multidirectional changes in the Vicia cracca molecular phenotype. Plants exposed to chronic ionising radiation significantly altered their metabolism and gene expression patterns. At the level of carbon metabolism, the upregulation of glycolate, pyruvate, and fumarate biosynthesis pathways and the downregulation of citrate synthesis suggests that the cells are trying to bypass some steps of the TCA cycle to generate key metabolic intermediates. At the level of energy metabolism, the downregulation of glycolysis pathways, alterations in electron transport chain components, and changes in the photosynthetic machinery suggests a decrease in the cellular ability to generate ATP. The downregulation of fatty acid biosynthesis pathways and alterations in the glyoxylate cycle indicates a shift in the cellular metabolism away from fatty acid biosynthesis and towards using odd-chain fatty acids or amino acids as alternative energy sources. Profound changes in carbon metabolism may indicate the reallocation of carbon skeletons for secondary metabolite production to increase the antioxidant capacity of plants. Those effects were accompanied by suppression of ribosomal biogenesis and translation. Overall, the changes observed in carbon metabolism, energy metabolism, nitrogen metabolism, and gene expression suggest a complex biochemical response of Vicia cracca plants in the Chernobyl exclusion zone to chronic radiation exposure.
Moreover, chronically irradiated plants showed signs of redox imbalance and the activation of protective metabolic pathways. The upregulation of histones and few DNA repair machinery genes suggests that the plant relies on DNA packaging and homologous recombination to cope with chronic DNA damage. Yet, it is still unknown if the observed changes would be linked to strand break repair or DNA replication errors. The upregulation of peroxidases and genes involved in phenolic compound biosynthesis suggests increased ROS concentrations and a compensatory increase in antioxidant production. The nitrogen redirection towards the biosynthesis of secondary metabolites and profound changes in carbon metabolism indicate resource reallocation to cope with environmental conditions. The changes in ribosomal protein synthesis and RNA polymerases further suggest that the plant undergoes significant gene expression and translational pattern alterations.
Several molecules can be promising as radiation exposure biomarkers and for testing the resilience of Vicia plants to other stressors. Among them are chaperonin CPN60А, histones, including H2B and H4, transcription factor HY5, and chlorophyll-binding protein CAB1, as their genes show consistent upregulation for different plant species growing under chronic radiation exposure. Expression of the phenylalanine ammonia-lyase (PAL) gene and the abundance of its protein can be used to approximately assess the activation of secondary metabolites biosynthesis under chronic irradiation. Metabolites that seem responsive to chronic irradiation include the TCA components such as citrate, pyruvate, malonate, fumarate, and various inositol metabolites and RFOs. Especially interesting for future research is the involvement of sugar signalling in photosynthesis suppression under radiation exposure and the role of certain ribosomal proteins as a possible source for radiosensitivity manipulations. Future research could also explore the molecular mechanisms (probably epigenetic) underlying the observed changes in DNA repair machinery and histone expression.
In conclusion, the study of the transcriptomic responses of V. cracca to chronic radiation exposure highlights its ability to adapt to stressful environmental conditions through complex and multidirectional changes in gene expression and metabolism. Comparing responses of different plant species to chronic radiation exposure could reveal universal stress-tolerant mechanisms that could be manipulated to improve the resilience of crops. The findings of this study have implications for agricultural practices and ecosystem management strategies, as well as for the development of stress-tolerant crops.
Supplementary Materials
The following supporting information can be downloaded at the website of this paper posted on Preprints.org, Figure S1: Metabolome, scores; Figure S2: Carbon metabolism; Figure S3: Fatty acid biosynthesis; Figure S4: N-glycans biosynthesis; Figure S5: Glyoxylate and dicarboxylate metabolism; Figure S6: Biotin metabolism; Figure S7: Propanoate metabolism; Figure S8: Ribosome; Figure S9: RNA polymerase; Figure S10: Transcriptome, sample-to-sample distance; Table S1: Sampling and soil properties; Table S2: Differential gene expression; Table S3: Proteomic results; Table S4: Metabolomic results; Table S5: Primer sequences.
Author Contributions
Conceptualization, PV, SB, and EK; methodology, VV, PV, SB, ES, MP, GC, CM, GTD, MK, DG, LT, and EK; software, VV, PV, SB, ES, EK, and MP; validation, VV, GTD, and MP; formal analysis, VV, PV, SB, ES, GS, CM, GTD, and EK; investigation, VV, PV, SB, ES, MP, GC, CM, GTD, MK, DG, LT, and EK; resources, PV, MK, LT, DG, and EK; data curation, VV and MP; writing—original draft preparation, PV, VV, EK, SB, and ES; writing—review and editing, MP, GC, CM, GTD, MK, DG, and LT; visualization, VV, PV, SB, ES, and EK; supervision, PV and EK; project administration, PV and EK; funding acquisition, PV and EK All authors have read and agreed to the published version of the manuscript.
Funding
This research was funded by Russian Science Foundation, grant number 20-74-10004.
Data Availability Statement
the processed sequencing files are available at the Sequence Read Archive (BioProject PRJNA958217).
Acknowledgments
The authors thank Dr. Alexandre Firmino and Dr. Federico Martinez-Seidel for their suggestions on the protein isolation protocol. The authors also thank Dr. Viktor Zgoda and a proteomics platform from Skolkovo Institute of Science and Technology.
Conflicts of Interest
The authors declare no conflict of interest.
References
- Volkova, P.Yu.; Bondarenko, E.V.; Kazakova, E.A. Radiation Hormesis in Plants. Curr. Opin. Toxicol. 2022, 30, 100334. [Google Scholar] [CrossRef]
- Duarte, G.T.; Volkova, P.Y.; Fiengo Perez, F.; Horemans, N. Chronic Ionizing Radiation of Plants: An Evolutionary Factor from Direct Damage to Non-Target Effects. Plants. 2023, 12, 1178. [Google Scholar] [CrossRef] [PubMed]
- Gudkov, S.V.; Grinberg, M.A.; Sukhov, V.; Vodeneev, V. Effect of Ionizing Radiation on Physiological and Molecular Processes in Plants. J. Environ. Radioact. 2019, 202, 8–24. [Google Scholar] [CrossRef] [PubMed]
- De Micco, V.; Arena, C.; Pignalosa, D.; Durante, M. Effects of Sparsely and Densely Ionizing Radiation on Plants. Radiat. Environ. Biophys. 2011, 50, 1–19. [Google Scholar] [CrossRef] [PubMed]
- Lourenço, J.; Mendo, S.; Pereira, R. Radioactively Contaminated Areas: Bioindicator Species and Biomarkers of Effect in an Early Warning Scheme for a Preliminary Risk Assessment. J. Hazard. Mater. 2016, 317, 503–542. [Google Scholar] [CrossRef] [PubMed]
- Hoseini, P.S.; Poursafa, P.; Moattar, F.; Amin, M.M.; Rezaei, A.H. Ability of Phytoremediation for Absorption of Strontium and Cesium from Soils Using Cannabis Sativa. Int. J. Environ. Health Eng. 2012, 1, 17. [Google Scholar] [CrossRef]
- Soudek, P.; Valenová, Š.; Vavříková, Z.; Vaněk, T. 137Cs and 90Sr Uptake by Sunflower Cultivated under Hydroponic Conditions. J. Environ. Radioact. 2006, 88, 236–250. [Google Scholar] [CrossRef] [PubMed]
- Wang, G.; Wang, B.; Fan, W.; Deng, N. Enhanced Phytoremediation of Uranium-Contaminated Soils by Indian Mustard (Brassica Juncea L. ) Using Slow Release Citric Acid. Environ. Sci. Pollut. Res. 2021, 28, 61061–61071. [Google Scholar] [CrossRef]
- Yan, L.; Le, Q.V.; Sonne, C.; Yang, Y.; Yang, H.; Gu, H.; Ma, N.L.; Lam, S.S.; Peng, W. Phytoremediation of Radionuclides in Soil, Sediments and Water. J. Hazard. Mater. 2021, 407, 124771. [Google Scholar] [CrossRef]
- Bryant, J.A.; Hughes, S.G. Vicia. In Wild Crop Relatives: Genomic and Breeding Resources: Legume Crops and Forages; Kole, C., Ed.; Springer: Berlin, Heidelberg, 2011; pp. 273–289. ISBN 978-3-642-14387-8. [Google Scholar]
- Eckardt, N.A.; Ainsworth, E.A.; Bahuguna, R.N.; Broadley, M.R.; Busch, W.; Carpita, N.C.; Castrillo, G.; Chory, J.; DeHaan, L.R.; Duarte, C.M.; et al. Climate Change Challenges, Plant Science Solutions. Plant Cell. 2023, 35, 24–66. [Google Scholar] [CrossRef]
- Ibañez, S.; Medina, M.I.; Agostini, E. Vicia: A Green Bridge to Clean up Polluted Environments. Appl. Microbiol. Biotechnol. 2020, 104, 13–21. [Google Scholar] [CrossRef] [PubMed]
- Ibáñez, S.G.; Alderete, L.G.S.; Medina, M.I.; Agostini, E. Phytoremediation of Phenol Using Vicia Sativa L. Plants and Its Antioxidative Response. Environ. Sci. Pollut. Res. 2012, 19, 1555–1562. [Google Scholar] [CrossRef] [PubMed]
- Xia, Y.; Liu, J.; Wang, Y.; Zhang, X.; Shen, Z.; Hu, Z. Ectopic Expression of Vicia Sativa Caffeoyl-CoA O-Methyltransferase (VsCCoAOMT) Increases the Uptake and Tolerance of Cadmium in Arabidopsis. Environ. Exp. Bot. 2018, 145, 47–53. [Google Scholar] [CrossRef]
- Zhang, X.; Zhang, L.; Chen, L.; Lu, Y.; An, Y. Ectopic Expression γ-Glutamylcysteine Synthetase of Vicia Sativa Increased Cadmium Tolerance in Arabidopsis. Gene 2022, 823, 146358. [Google Scholar] [CrossRef] [PubMed]
- Halfadji, A.; Portet-Koltalo, F.; Touabet, A.; Le Derf, F.; Morin, C.; Merlet-Machour, N. Phytoremediation of PCB: Contaminated Algerian Soils Using Native Agronomics Plants. Environ. Geochem. Health. 2022, 44, 117–132. [Google Scholar] [CrossRef] [PubMed]
- Tang, L.; Hamid, Y.; Zehra, A.; Sahito, Z.A.; He, Z.; Hussain, B.; Gurajala, H.K.; Yang, X. Characterization of Fava Bean (Vicia Faba L. ) Genotypes for Phytoremediation of Cadmium and Lead Co-Contaminated Soils Coupled with Agro-Production. Ecotoxicol. Environ. Saf. 2019, 171, 190–198. [Google Scholar] [CrossRef]
- Tang, L.; Hamid, Y.; Zehra, A.; Sahito, Z.A.; He, Z.; Beri, W.T.; Khan, M.B.; Yang, X. Fava Bean Intercropping with Sedum Alfredii Inoculated with Endophytes Enhances Phytoremediation of Cadmium and Lead Co-Contaminated Field. Environ. Pollut. 2020, 265, 114861. [Google Scholar] [CrossRef]
- Radwan, S.S.; Dashti, N.; El-Nemr, I.M. Enhancing the Growth of Vicia Faba Plants by Microbial Inoculation to Improve Their Phytoremediation Potential for Oily Desert Areas. Int. J. Phytoremediation 2005, 7, 19–32. [Google Scholar] [CrossRef]
- Chen, X.; Zhong, N.; Luo, Y.; Ni, Y.; Liu, Z.; Wu, G.; Zheng, T.; Dang, Y.; Chen, H.; Li, W. Effects of Strontium on the Morphological and Photosynthetic Physiological Characteristics of Vicia Faba Seedlings. Int. J. Phytoremediation. 2022, 0, 1–11. [Google Scholar] [CrossRef]
- Ibañez, S.G.; Travaglia, C.N.; Medina, M.I.; Agostini, E. Vicia Villosa Roth: A Cover Crop to Phytoremediate Arsenic Polluted Environments. Environ. Sci. Pollut. Res. 2021, 28, 38604–38612. [Google Scholar] [CrossRef]
- Petukhov, A.S.; Kremleva, T.A.; Petukhova, G.A.; Khritokhin, N.A. Translocation of Heavy Metals in Herbs under Urban Anthropogenic Pollution Conditions. Environ. Process. 2020, 7, 1173–1196. [Google Scholar] [CrossRef]
- Evseeva, T.; Majstrenko, T.; Geras’kin, S.; Brown, J.E.; Belykh, E. Estimation of Ionizing Radiation Impact on Natural Vicia Cracca Populations Inhabiting Areas Contaminated with Uranium Mill Tailings and Radium Production Wastes. Sci. Total Environ. 2009, 407, 5335–5343. [Google Scholar] [CrossRef] [PubMed]
- Hua, Y.; Chen, J.; Zhou, T.; Zhang, T.; Shen, D.; Feng, Y.; Guan, P.; Huang, S.; Zhou, Z.; Huang, J.; et al. Multiomics Reveals an Essential Role of Long-Distance Translocation in Regulating Plant Cadmium Resistance and Grain Accumulation in Allohexaploid Wheat (Triticum Aestivum). J. Exp. Bot. 2022, 73, 7516–7537. [Google Scholar] [CrossRef] [PubMed]
- Duarte, G.T.; Volkova, P.Yu.; Geras’kin, S.A. The Response Profile to Chronic Radiation Exposure Based on the Transcriptome Analysis of Scots Pine from Chernobyl Affected Zone. Environ. Pollut. 2019, 250, 618–626. [Google Scholar] [CrossRef] [PubMed]
- Volkova, P.Yu.; Duarte, G.T.; Kazakova, E.A.; Makarenko, E.S.; Bitarishvili, S.V.; Bondarenko, V.S.; Perevolotskii, A.N.; Geras’kin, S.A.; Garbaruk, D.K.; Turchin, L.M. Radiosensitivity of Herbaceous Plants to Chronic Radiation Exposure: Field Study in the Chernobyl Exclusion Zone. Sci. Total Environ. 2021, 777, 146206. [Google Scholar] [CrossRef]
- Shesterikova, E.M.; Bondarenko, V.S.; Volkova, P.Yu. Differential Gene Expression in Chronically Irradiated Herbaceous Species from the Chernobyl Exclusion Zone. Int. J. Radiat. Biol. 2023, 99, 229–237. [Google Scholar] [CrossRef]
- Podlutskii, M.; Babina, D.; Podobed, M.; Bondarenko, E.; Bitarishvili, S.; Blinova, Y.; Shesterikova, E.; Prazyan, A.; Turchin, L.; Garbaruk, D.; et al. Arabidopsis Thaliana Accessions from the Chernobyl Exclusion Zone Show Decreased Sensitivity to Additional Acute Irradiation. Plants 2022, 11, 3142. [Google Scholar] [CrossRef]
- STRING V11: Protein-Protein Association Networks with Increased Coverage, Supporting Functional Discovery in Genome-Wide Experimental Datasets - PubMed. Available online: https://pubmed.ncbi.nlm.nih.gov/30476243/ (accessed on 12 April 2023).
- Gaufichon, L.; Masclaux-Daubresse, C.; Tcherkez, G.; Reisdorf-Cren, M.; Sakakibara, Y.; Hase, T.; Clément, G.; Avice, J.-C.; Grandjean, O.; Marmagne, A.; et al. Arabidopsis Thaliana ASN2 Encoding Asparagine Synthetase Is Involved in the Control of Nitrogen Assimilation and Export during Vegetative Growth. Plant Cell Environ. 2013, 36, 328–342. [Google Scholar] [CrossRef]
- Igamberdiev, A.U.; Eprintsev, A.T. Organic Acids: The Pools of Fixed Carbon Involved in Redox Regulation and Energy Balance in Higher Plants. Front. Plant Sci. 2016, 7. [Google Scholar] [CrossRef]
- Igamberdiev, A.U. Citrate Valve Integrates Mitochondria into Photosynthetic Metabolism. Mitochondrion. 2020, 52, 218–230. [Google Scholar] [CrossRef]
- Lucas, K.A.; Filley, J.R.; Erb, J.M.; Graybill, E.R.; Hawes, J.W. Peroxisomal Metabolism of Propionic Acid and Isobutyric Acid in Plants. J. Biol. Chem. 2007, 282, 24980–24989. [Google Scholar] [CrossRef] [PubMed]
- Elango, D.; Rajendran, K.; Van der Laan, L.; Sebastiar, S.; Raigne, J.; Thaiparambil, N.A.; El Haddad, N.; Raja, B.; Wang, W.; Ferela, A.; et al. Raffinose Family Oligosaccharides: Friend or Foe for Human and Plant Health? Front. Plant Sci. 2022, 13, 829118. [Google Scholar] [CrossRef] [PubMed]
- Sanyal, R.; Pradhan, B.; Jawed, D.M.; Tribhuvan, K.U.; Dahuja, A.; Kumar, M.; Kumar, N.; Mishra, G.P.; Ram, C.; Mahatma, M.K.; et al. Spatio-Temporal Expression Pattern of Raffinose Synthase Genes Determine the Levels of Raffinose Family Oligosaccharides in Peanut (Arachis Hypogaea L. ). Seed. Sci. Rep. 2023, 13, 795. [Google Scholar] [CrossRef] [PubMed]
- Strasser, R. Recent Developments in Deciphering the Biological Role of Plant Complex N-Glycans. Front. Plant Sci. 2022, 13. [Google Scholar] [CrossRef] [PubMed]
- Van Holle, S.; Van Damme, E.J.M. Signaling through Plant Lectins: Modulation of Plant Immunity and Beyond. Biochem. Soc. Trans. 2018, 46, 217–233. [Google Scholar] [CrossRef] [PubMed]
- Hong, M.J.; Kim, J.; Yoon, Y.H.; Kim, S.H.; Ahn, J.W.; Jeong, I.Y.; Kang, S.Y.; Seo, Y.W.; Kim, D.S. The Effects of Chronic Gamma Irradiation on Oxidative Stress Response and the Expression of Anthocyanin Biosynthesis-Related Genes in Wheat (Triticum Aestivum). Int J Radiat Biol. 12, 1218–1228. [CrossRef]
- Singh, B.; Ahuja, S.; Singhal, R.K.; Venu Babu, P. Effect of Gamma Radiation on Wheat Plant Growth Due to Impact on Gas Exchange Characteristics and Mineral Nutrient Uptake and Utilization. J. Radioanal. Nucl. Chem. 2013, 298, 249–257. [Google Scholar] [CrossRef]
- Vanhoudt, N.; Vandenhove, H.; Horemans, N.; Wannijn, J.; Van Hees, M.; Vangronsveld, J.; Cuypers, A. The Combined Effect of Uranium and Gamma Radiation on Biological Responses and Oxidative Stress Induced in Arabidopsis Thaliana. J. Environ. Radioact. 2010, 101, 923–930. [Google Scholar] [CrossRef]
- Hsieh, M.-H.; Chang, C.-Y.; Hsu, S.-J.; Chen, J.-J. Chloroplast Localization of Methylerythritol 4-Phosphate Pathway Enzymes and Regulation of Mitochondrial Genes in IspD and IspE Albino Mutants in Arabidopsis. Plant Mol. Biol. 2008, 66, 663–673. [Google Scholar] [CrossRef]
- Li, Y.; Yu, C.; Mo, R.; Zhu, Z.; Dong, Z.; Hu, X.; Deng, W.; Zhuang, C. Screening and Verification of Photosynthesis and Chloroplast-Related Genes in Mulberry by Comparative RNA-Seq and Virus-Induced Gene Silencing. Int. J. Mol. Sci. 2022, 23, 8620. [Google Scholar] [CrossRef]
- Mishra, L.S.; Funk, C. The FtsHi Enzymes of Arabidopsis Thaliana: Pseudo-Proteases with an Important Function. Int. J. Mol. Sci. 2021, 22, 5917. [Google Scholar] [CrossRef] [PubMed]
- He, X.; Long, F.; Li, Y.; Xu, Y.; Hu, L.; Yao, T.; Huang, Y.; Hu, D.; Yang, Y.; Fei, Y. Comparative Transcriptome Analysis Revealing the Potential Mechanism of Low-Temperature Stress in Machilus Microcarpa. Front. Plant Sci. 2022, 13, 900870. [Google Scholar] [CrossRef] [PubMed]
- Pontier, D.; Albrieux, C.; Joyard, J.; Lagrange, T.; Block, M. Knock-out of the Magnesium Protoporphyrin IX Methyltransferase Gene in Arabidopsis. Effects on Chloroplast Development and on Chloroplast-to-Nucleus Signaling. J. Biol. Chem. 2007, 282, 2297–2304. [Google Scholar] [CrossRef] [PubMed]
- Meng, L.; Fan, Z.; Zhang, Q.; Wang, C.; Gao, Y.; Deng, Y.; Zhu, B.; Zhu, H.; Chen, J.; Shan, W.; et al. BEL1-LIKE HOMEODOMAIN 11 Regulates Chloroplast Development and Chlorophyll Synthesis in Tomato Fruit. Plant J. 2018, 94, 1126–1140. [Google Scholar] [CrossRef]
- Gangappa, S. N.; Botto, J.F. The Multifaceted Roles of HY5 in Plant Growth and Development. Mol. Plant. 10, 1353–1365. [CrossRef] [PubMed]
- Laanen, P.; Cuypers, A.; Saenen, E.; Horemans, N. Flowering under Enhanced Ionising Radiation Conditions and Its Regulation through Epigenetic Mechanisms. Plant Physiol. Biochem. 2023, 196, 246–259. [Google Scholar] [CrossRef] [PubMed]
- Kim, J.-H.; Moon, Y.R.; Kim, J.-S.; Oh, M.-H.; Lee, J.-W.; Chung, B.Y. Transcriptomic Profile of Arabidopsis Rosette Leaves during the Reproductive Stage after Exposure to Ionizing Radiation. Radiat Res 2022, 168, 267–280. [Google Scholar] [CrossRef] [PubMed]
- Szurman-Zubrzycka, M.; Jędrzejek, P.; Szarejko, I. How Do Plants Cope with DNA Damage? A Concise Review on the DDR Pathway in Plants. Int. J. Mol. Sci. 2023, 24, 2404. [Google Scholar] [CrossRef]
- Han, J.; Li, H.; Yin, B.; Zhang, Y.; Liu, Y.; Cheng, Z.; Liu, D.; Lu, H. The Papain-like Cysteine Protease CEP1 Is Involved in Programmed Cell Death and Secondary Wall Thickening during Xylem Development in Arabidopsis. J. Exp. Bot. 2019, 70, 205–215. [Google Scholar] [CrossRef]
- Song, Y.; Chen, Q.; Ci, D.; Shao, X.; Zhang, D. Effects of High Temperature on Photosynthesis and Related Gene Expression in Poplar. BMC Plant Biol. 2014, 14, 111. [Google Scholar] [CrossRef]
- Liang, L.; Wang, Q.; Song, Z.; Wu, Y.; Liang, Q.; Wang, Q.; Yang, J.; Bi, Y.; Zhou, W.; Fan, L.-M. O-Fucosylation of CPN20 by SPINDLY Derepresses Abscisic Acid Signaling During Seed Germination and Seedling Development. Front. Plant Sci. 2021, 12, doiorg/103389/fpls2021724144. [Google Scholar] [CrossRef] [PubMed]
- Zhang, X.-F.; Jiang, T.; Wu, Z.; Du, S.-Y.; Yu, Y.-T.; Jiang, S.-C.; Lu, K.; Feng, X.-J.; Wang, X.-F.; Zhang, D.-P. Cochaperonin CPN20 Negatively Regulates Abscisic Acid Signaling in Arabidopsis. Plant Mol Biol. 2013, 83, 3, 205–218. [Google Scholar] [CrossRef]
- Li, J.; Brader, G.; Helenius, E.; Kariola, T.; Palva, E.T. Biotin Deficiency Causes Spontaneous Cell Death and Activation of Defense Signaling. Plant J. 2012, 70, 315–326. [Google Scholar] [CrossRef] [PubMed]
- Alban, C. Chapter 2 - Biotin (Vitamin B8) Synthesis in Plants. In Advances in Botanical Research; Rébeillé, F., Douce, R., Eds.; Biosynthesis of Vitamins in Plants Part B; Academic Press, 2011; Vol. 59, pp. 39–66.
- Jones, D.H. Phenylalanine Ammonia-Lyase: Regulation of Its Induction, and Its Role in Plant Development. Phytochemistry. 1984, 23, 1349–1359. [Google Scholar] [CrossRef]
- Benoît, M.A.; D’Aprano, G.; Lacroix, M. Effect of γ-Irradiation on Phenylalanine Ammonia-Lyase Activity, Total Phenolic Content, and Respiration of Mushrooms (Agaricus Bisporus). J. Agric. Food Chem. 2000, 48, 6312–6316. [Google Scholar] [CrossRef] [PubMed]
- Oufedjikh, H.; Mahrouz, M.; Amiot, M.J.; Lacroix, M. Effect of γ-Irradiation on Phenolic Compounds and Phenylalanine Ammonia-Lyase Activity during Storage in Relation to Peel Injury from Peel of Citrus Clementina Hort. Ex. Tanaka. J. Agric. Food Chem. 2000, 48, 559–565. [Google Scholar] [CrossRef] [PubMed]
- Hussain, P.R.; Wani, A.M.; Meena, R.S.; Dar, M.A. Gamma Irradiation Induced Enhancement of Phenylalanine Ammonia-Lyase (PAL) and Antioxidant Activity in Peach (Prunus Persica Bausch, Cv. Elberta). Radiat. Phys. Chem. 2010, 79, 982–989. [Google Scholar] [CrossRef]
- Xu, J.-J.; Fang, X.; Li, C.-Y.; Yang, L.; Chen, X.-Y. General and Specialized Tyrosine Metabolism Pathways in Plants. aBIOTECH. 2020, 1, 97–105. [Google Scholar] [CrossRef]
- Singh, S.K. Explorations of Plant’s Chemodiversity: Role of Nitrogen-Containing Secondary Metabolites in Plant Defense. In Molecular Aspects of Plant-Pathogen Interaction; Singh, A., Singh, I.K., Eds.; Springer: Singapore, 2018; pp. 309–332. [Google Scholar] [CrossRef]
- Baral, B.; Teixeira da Silva, J.A.; Izaguirre-Mayoral, M.L. Early Signaling, Synthesis, Transport and Metabolism of Ureides. J. Plant Physiol. 2016, 193, 97–109. [Google Scholar] [CrossRef]
- Kaur, H.; Chowrasia, S.; Gaur, V.S.; Monda, T.K. Allantoin: Emerging Role in Plant Abiotic Stress Tolerance. Plant Mol Biol Rep. 2021, 39, 648–661, doi.org/10.1007/s11105-021-01280-z.65. Berglund, T.; Wallström, A.; Nguyen, T.-V.; Laurell, C.; Ohlsson, A.B. Nicotinamide; Antioxidative and DNA Hypomethylation Effects in Plant Cells. Plant Physiol. Biochem. PPB 2017, 118, 551–560. [Google Scholar] [CrossRef]
- Sánchez-Hidalgo, M.; León-González, A.J.; Gálvez-Peralta, M.; González-Mauraza, N.H.; Martin-Cordero, C. D-Pinitol: A Cyclitol with Versatile Biological and Pharmacological Activities. Phytochem. Rev. 2021, 20, 211–224. [Google Scholar] [CrossRef]
- Ashihara, H. Trigonelline (N-Methylnicotinic Acid) Biosynthesis and Its Biological Role in Plants. Natural Product Communications. 2008, 3, 9, 1423–1428. [Google Scholar] [CrossRef]
- Sunil, C.; Irudayaraj, S.S.; Duraipandiyan, V.; Al-Dhabi, N.A.; Agastian, P.; Ignacimuthu, S. Antioxidant and Free Radical Scavenging Effects of β-Amyrin Isolated from S. Cochinchinensis Moore. Leaves. Ind. Crops Prod. 2014, 61, 510–516. [Google Scholar] [CrossRef]
- Hamerski, L.; Bomm, M.D.; Silva, D.H.S.; Young, M.C.M.; Furlan, M.; Eberlin, M.N.; Castro-Gamboa, I.; Cavalheiro, A.J.; da Silva Bolzani, V. Phenylpropanoid Glucosides from Leaves of Coussarea Hydrangeifolia (Rubiaceae). Phytochemistry 2005, 66, 1927–1932. [Google Scholar] [CrossRef] [PubMed]
- Fabris, S.; Momo, F.; Ravagnan, G.; Stevanato, R. Antioxidant Properties of Resveratrol and Piceid on Lipid Peroxidation in Micelles and Monolamellar Liposomes. Biophys. Chem. 2008, 135, 76–83. [Google Scholar] [CrossRef] [PubMed]
- Whittle, C.A.; Krochko, J.E. Transcript Profiling Provides Evidence of Functional Divergence and Expression Networks among Ribosomal Protein Gene Paralogs in Brassica Napus. Plant Cell 2009, 21, 2203–2219. [Google Scholar] [CrossRef]
- Moin, M.; Bakshi, A.; Saha, A.; Dutta, M.; Madhav, S.M.; Kirti, P.B. Rice Ribosomal Protein Large Subunit Genes and Their Spatio-Temporal and Stress Regulation. Front. Plant Sci. 2016, 7. [Google Scholar] [CrossRef]
- Wang, J.; Lan, P.; Gao, H.; Zheng, L.; Li, W.; Schmidt, W. Expression Changes of Ribosomal Proteins in Phosphate- and Iron-Deficient Arabidopsis Roots Predict Stress-Specific Alterations in Ribosome Composition. BMC Genomics. 2013, 14, 783. [Google Scholar] [CrossRef]
- Xiong, W.; Lan, T.; Mo, B. Extraribosomal Functions of Cytosolic Ribosomal Proteins in Plants. Front. Plant Sci. 2021, 12. [Google Scholar] [CrossRef]
- Haag, J.R.; Pikaard, C.S. Multisubunit RNA Polymerases IV and V: Purveyors of Non-Coding RNA for Plant Gene Silencing. Nat. Rev. Mol. Cell Biol. 2011, 12, 483–492. [Google Scholar] [CrossRef]
- Sáez-Vásquez, J.; Delseny, M. Ribosome Biogenesis in Plants: From Functional 45S Ribosomal DNA Organization to Ribosome Assembly Factors. Plant Cell 2019, 31, 1945–1967. [Google Scholar] [CrossRef] [PubMed]
- ISO/TC 190 - Soil Quality. Available online: https://www.iso.org/committee/54328.html (accessed on 7 April 2023).
- ISO 11047:1998. Soil quality — Determination of cadmium, chromium, cobalt, copper, lead, manganese, nickel and zinc — Flame and electrothermal atomic absorption spectrometric methods. Available online: https://www.iso.org/standard/24010.html (accessed on 7 April 2023).
- Laanen, P.; Saenen, E.; Mysara, M.; Van de Walle, J.; Van Hees, M.; Nauts, R.; Van Nieuwerburgh, F.; Voorspoels, S.; Jacobs, G.; Cuypers, A.; et al. Changes in DNA Methylation in Arabidopsis Thaliana Plants Exposed Over Multiple Generations to Gamma Radiation. Front. Plant Sci. 2021, 12. [Google Scholar] [CrossRef] [PubMed]
- Grinberg, M.A.; Gudkov, S.V.; Balalaeva, I.V.; Gromova, E.; Sinitsyna, Y.; Sukhov, V.; Vodeneev, V. Effect of Chronic β-Radiation on Long-Distance Electrical Signals in Wheat and Their Role in Adaptation to Heat Stress. Environ. Exp. Bot. 2021, 184, 104378. [Google Scholar] [CrossRef]
- Gautam, A.; Pandey, A.K. Aquaporins Responses under Challenging Environmental Conditions and Abiotic Stress Tolerance in Plants. Bot. Rev. 2021, 87, 467–495. [Google Scholar] [CrossRef]
- Gutierrez, N.; Giménez, M.J.; Palomino, C.; Avila, C.M. Assessment of Candidate Reference Genes for Expression Studies in Vicia Faba L. by Real-Time Quantitative PCR. Mol. Breed. 2011, 28, 13–24. [Google Scholar] [CrossRef]
- Pfaffl, M.W. A New Mathematical Model for Relative Quantification in Real-Time RT-PCR. Nucleic Acids Res. 2001, 29, e45. [Google Scholar] [CrossRef]
- Duarte, G.T.; Volkova, P.Yu.; Geras’kin, S.A. A Pipeline for Non-Model Organisms for de Novo Transcriptome Assembly, Annotation, and Gene Ontology Analysis Using Open Tools: Case Study with Scots Pine. Bio Protoc. 2021, 11, 3,e3912. [Google Scholar] [CrossRef]
- The Galaxy Community The Galaxy Platform for Accessible, Reproducible and Collaborative Biomedical Analyses: 2022 Update. Nucleic Acids Res. 2022, 50, W345–W351. [CrossRef]
- Seppey, M.; Manni, M.; Zdobnov, E.M. BUSCO: Assessing Genome Assembly and Annotation Completeness. Methods Mol. Biol. Clifton NJ. 2019, 1962, 227–245. [Google Scholar] [CrossRef]
- Eliášová, A.; Trávníček, P.; Mandák, B.; Münzbergová, Z. Autotetraploids of Vicia Cracca Show a Higher Allelic Richness in Natural Populations and a Higher Seed Set after Artificial Selfing than Diploids. Ann. Bot. 2014, 113, 159–170. [Google Scholar] [CrossRef]
- Eliášová, A.; Münzbergová, Z. Factors Influencing Distribution and Local Coexistence of Diploids and Tetraploids of Vicia Cracca: Inferences from a Common Garden Experiment. Journal of Plant Research. 2017, 130, 4. [Google Scholar] [CrossRef]
- Potter, S.C.; Luciani, A.; Eddy, S.R.; Park, Y.; Lopez, R.; Finn, R.D. HMMER Web Server: 2018 Update. Nucleic Acids Res. 2018, 46, W200–W204. [Google Scholar] [CrossRef] [PubMed]
- Mistry, J.; Chuguransky, S.; Williams, L.; Qureshi, M.; Salazar, G.A.; Sonnhammer, E.L.L.; Tosatto, S.C.E.; Paladin, L.; Raj, S.; Richardson, L.J.; et al. Pfam: The Protein Families Database in 2021. Nucleic Acids Res. 2021, 49, D412–D419. [Google Scholar] [CrossRef] [PubMed]
- Petersen, T.N.; Brunak, S.; von Heijne, G.; Nielsen, H. SignalP 4.0: Discriminating Signal Peptides from Transmembrane Regions. Nat. Methods. 2011, 8, 785–786. [Google Scholar] [CrossRef] [PubMed]
- Lagesen, K.; Hallin, P.; Rødland, E.A.; Staerfeldt, H.-H.; Rognes, T.; Ussery, D.W. RNAmmer: Consistent and Rapid Annotation of Ribosomal RNA Genes. Nucleic Acids Res. 2007, 35, 3100–3108. [Google Scholar] [CrossRef] [PubMed]
- Bryant, D.M.; Johnson, K.; DiTommaso, T.; Tickle, T.; Couger, M.B.; Payzin-Dogru, D.; Lee, T.J.; Leigh, N.D.; Kuo, T.-H.; Davis, F.G.; et al. A Tissue-Mapped Axolotl De Novo Transcriptome Enables Identification of Limb Regeneration Factors. Cell Rep. 2017, 18, 762–776. [Google Scholar] [CrossRef]
- Jones, P.; Binns, D.; Chang, H.-Y.; Fraser, M.; Li, W.; McAnulla, C.; McWilliam, H.; Maslen, J.; Mitchell, A.; Nuka, G.; et al. InterProScan 5: Genome-Scale Protein Function Classification. Bioinforma. Oxf. Engl. 2014, 30, 1236–1240. [Google Scholar] [CrossRef] [PubMed]
- Bray, N.L.; Pimentel, H.; Melsted, P.; Pachter, L. Near-Optimal Probabilistic RNA-Seq Quantification. Nat. Biotechnol. 2016, 34, 525–527. [Google Scholar] [CrossRef]
- Love, M.I.; Huber, W.; Anders, S. Moderated Estimation of Fold Change and Dispersion for RNA-Seq Data with DESeq2. Genome Biol. 2014, 15, 550. [Google Scholar] [CrossRef]
- Sherman, B.T.; Hao, M.; Qiu, J.; Jiao, X.; Baseler, M.W.; Lane, H.C.; Imamichi, T.; Chang, W. DAVID: A Web Server for Functional Enrichment Analysis and Functional Annotation of Gene Lists (2021 Update). Nucleic Acids Res. 2022, 50, W216–221. [Google Scholar] [CrossRef]
- Fiehn, O. Metabolite Profiling in Arabidopsis. Methods Mol. Biol. Clifton NJ 2006, 323, 439–447. [Google Scholar] [CrossRef]
- Stein, S.E. An Integrated Method for Spectrum Extraction and Compound Identification from Gas Chromatography/Mass Spectrometry Data. J. Am. Soc. Mass Spectrom. 1999, 10, 770–781. [Google Scholar] [CrossRef]
- Pang, Z.; Chong, J.; Zhou, G.; de Lima Morais, D.A.; Chang, L.; Barrette, M.; Gauthier, C.; Jacques, P.-É.; Li, S.; Xia, J. MetaboAnalyst 5.0: Narrowing the Gap between Raw Spectra and Functional Insights. Nucleic Acids Res. 2021, 49, W388–W396. [Google Scholar] [CrossRef] [PubMed]
- Liu, T.; Salguero, P.; Petek, M.; Martinez-Mira, C.; Balzano-Nogueira, L.; Ramšak, Ž.; McIntyre, L.; Gruden, K.; Tarazona, S.; Conesa, A. PaintOmics 4: New Tools for the Integrative Analysis of Multi-Omics Datasets Supported by Multiple Pathway Databases. Nucleic Acids Res. 2022, 50, W551–W559. [Google Scholar] [CrossRef]
Figure 1.
The location of experimental plots. ChNPP – Chernobyl NPP. B – reference plot Babchin. L – reference plot Lomysh. K – radioactively contaminated plot Kulazhin. M – radioactively contaminated plot Masany. Map was created using Maps.me service and modified in Microsoft PowerPoint 2021.
Figure 1.
The location of experimental plots. ChNPP – Chernobyl NPP. B – reference plot Babchin. L – reference plot Lomysh. K – radioactively contaminated plot Kulazhin. M – radioactively contaminated plot Masany. Map was created using Maps.me service and modified in Microsoft PowerPoint 2021.
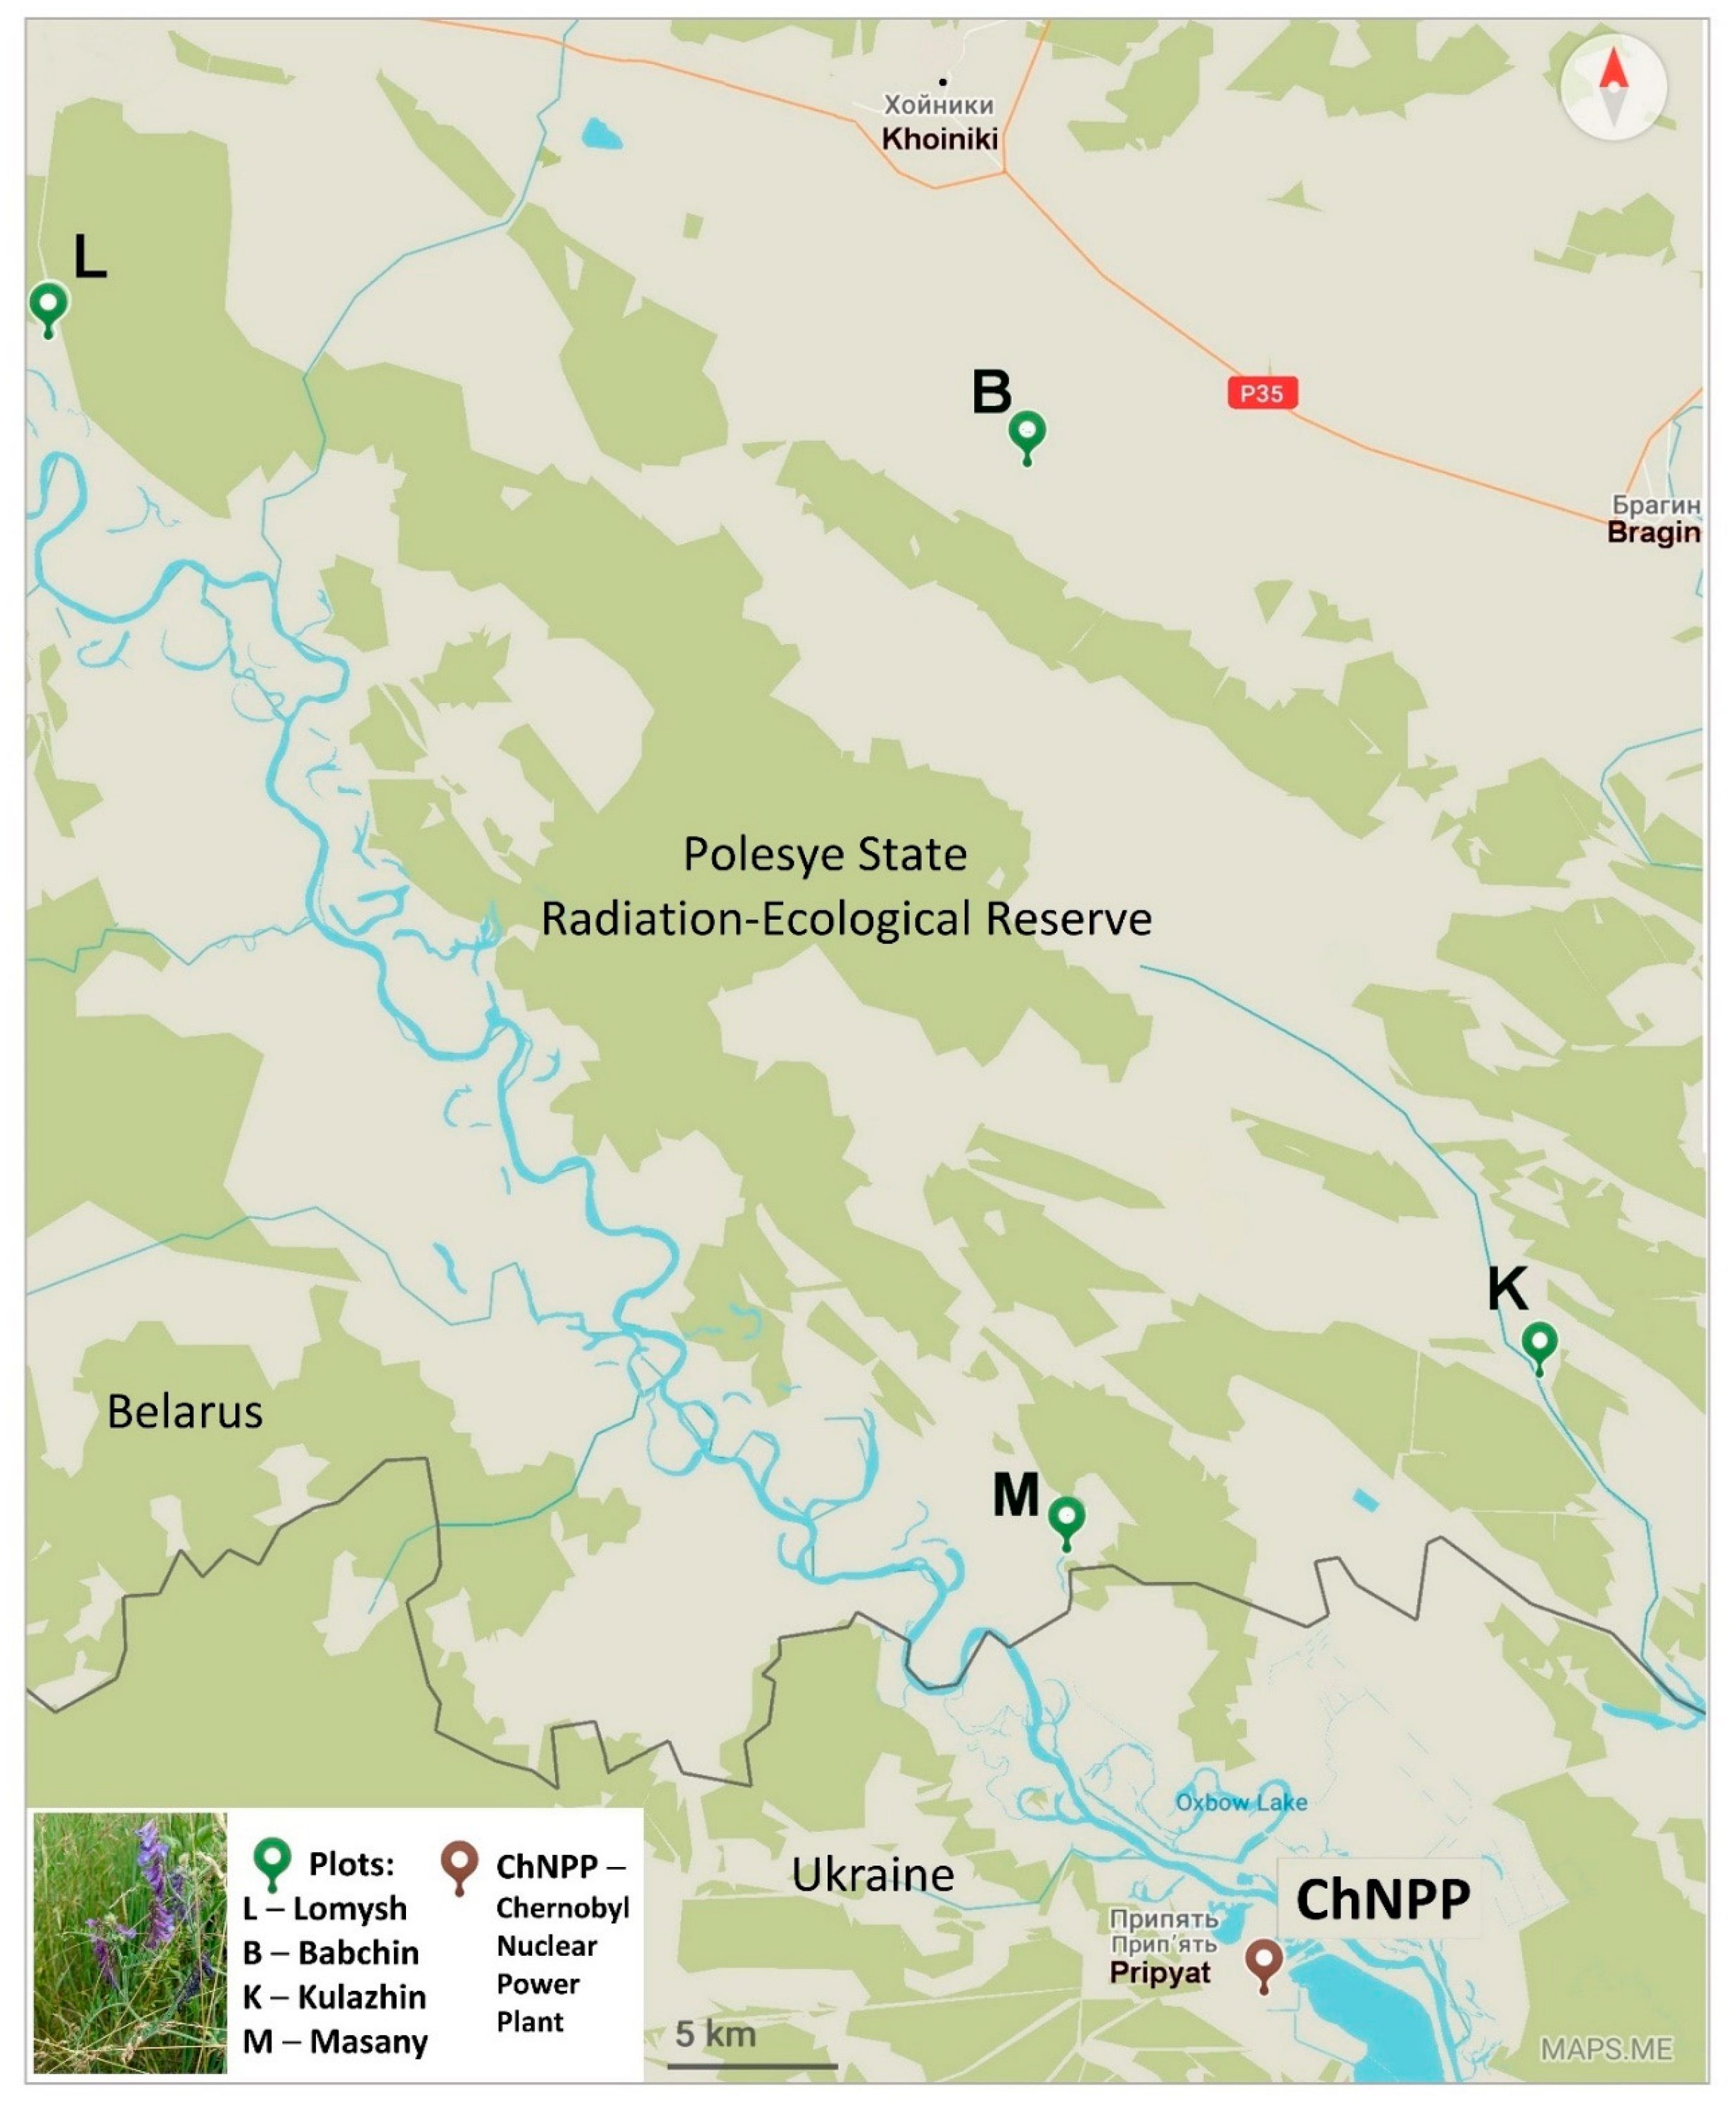
Figure 2.
Log2FC for expression of selected genes in chronically irradiated V. cracca populations (Kulazhin and Masany) compared to each control (Lomysh and Babchin). A ‒ NADPH-oxidase RBOH; B ‒ ascorbate peroxidase APX1; C ‒ chlorophyll-binding protein CAB1; D ‒ transcription factor HY5; E – aquaporine TIP1; F – aquaporine PIP1; G ‒ chloroplast chaperonin CPN60А; H ‒ chloroplast chaperonin CPN20; I ‒ histone H2B. * ‒ log2FC ≥ |1|; p-value ≤ 0.05, Mann-Whitney U-test. Photo: view of the Chernobyl exclusion zone from the fire tower.
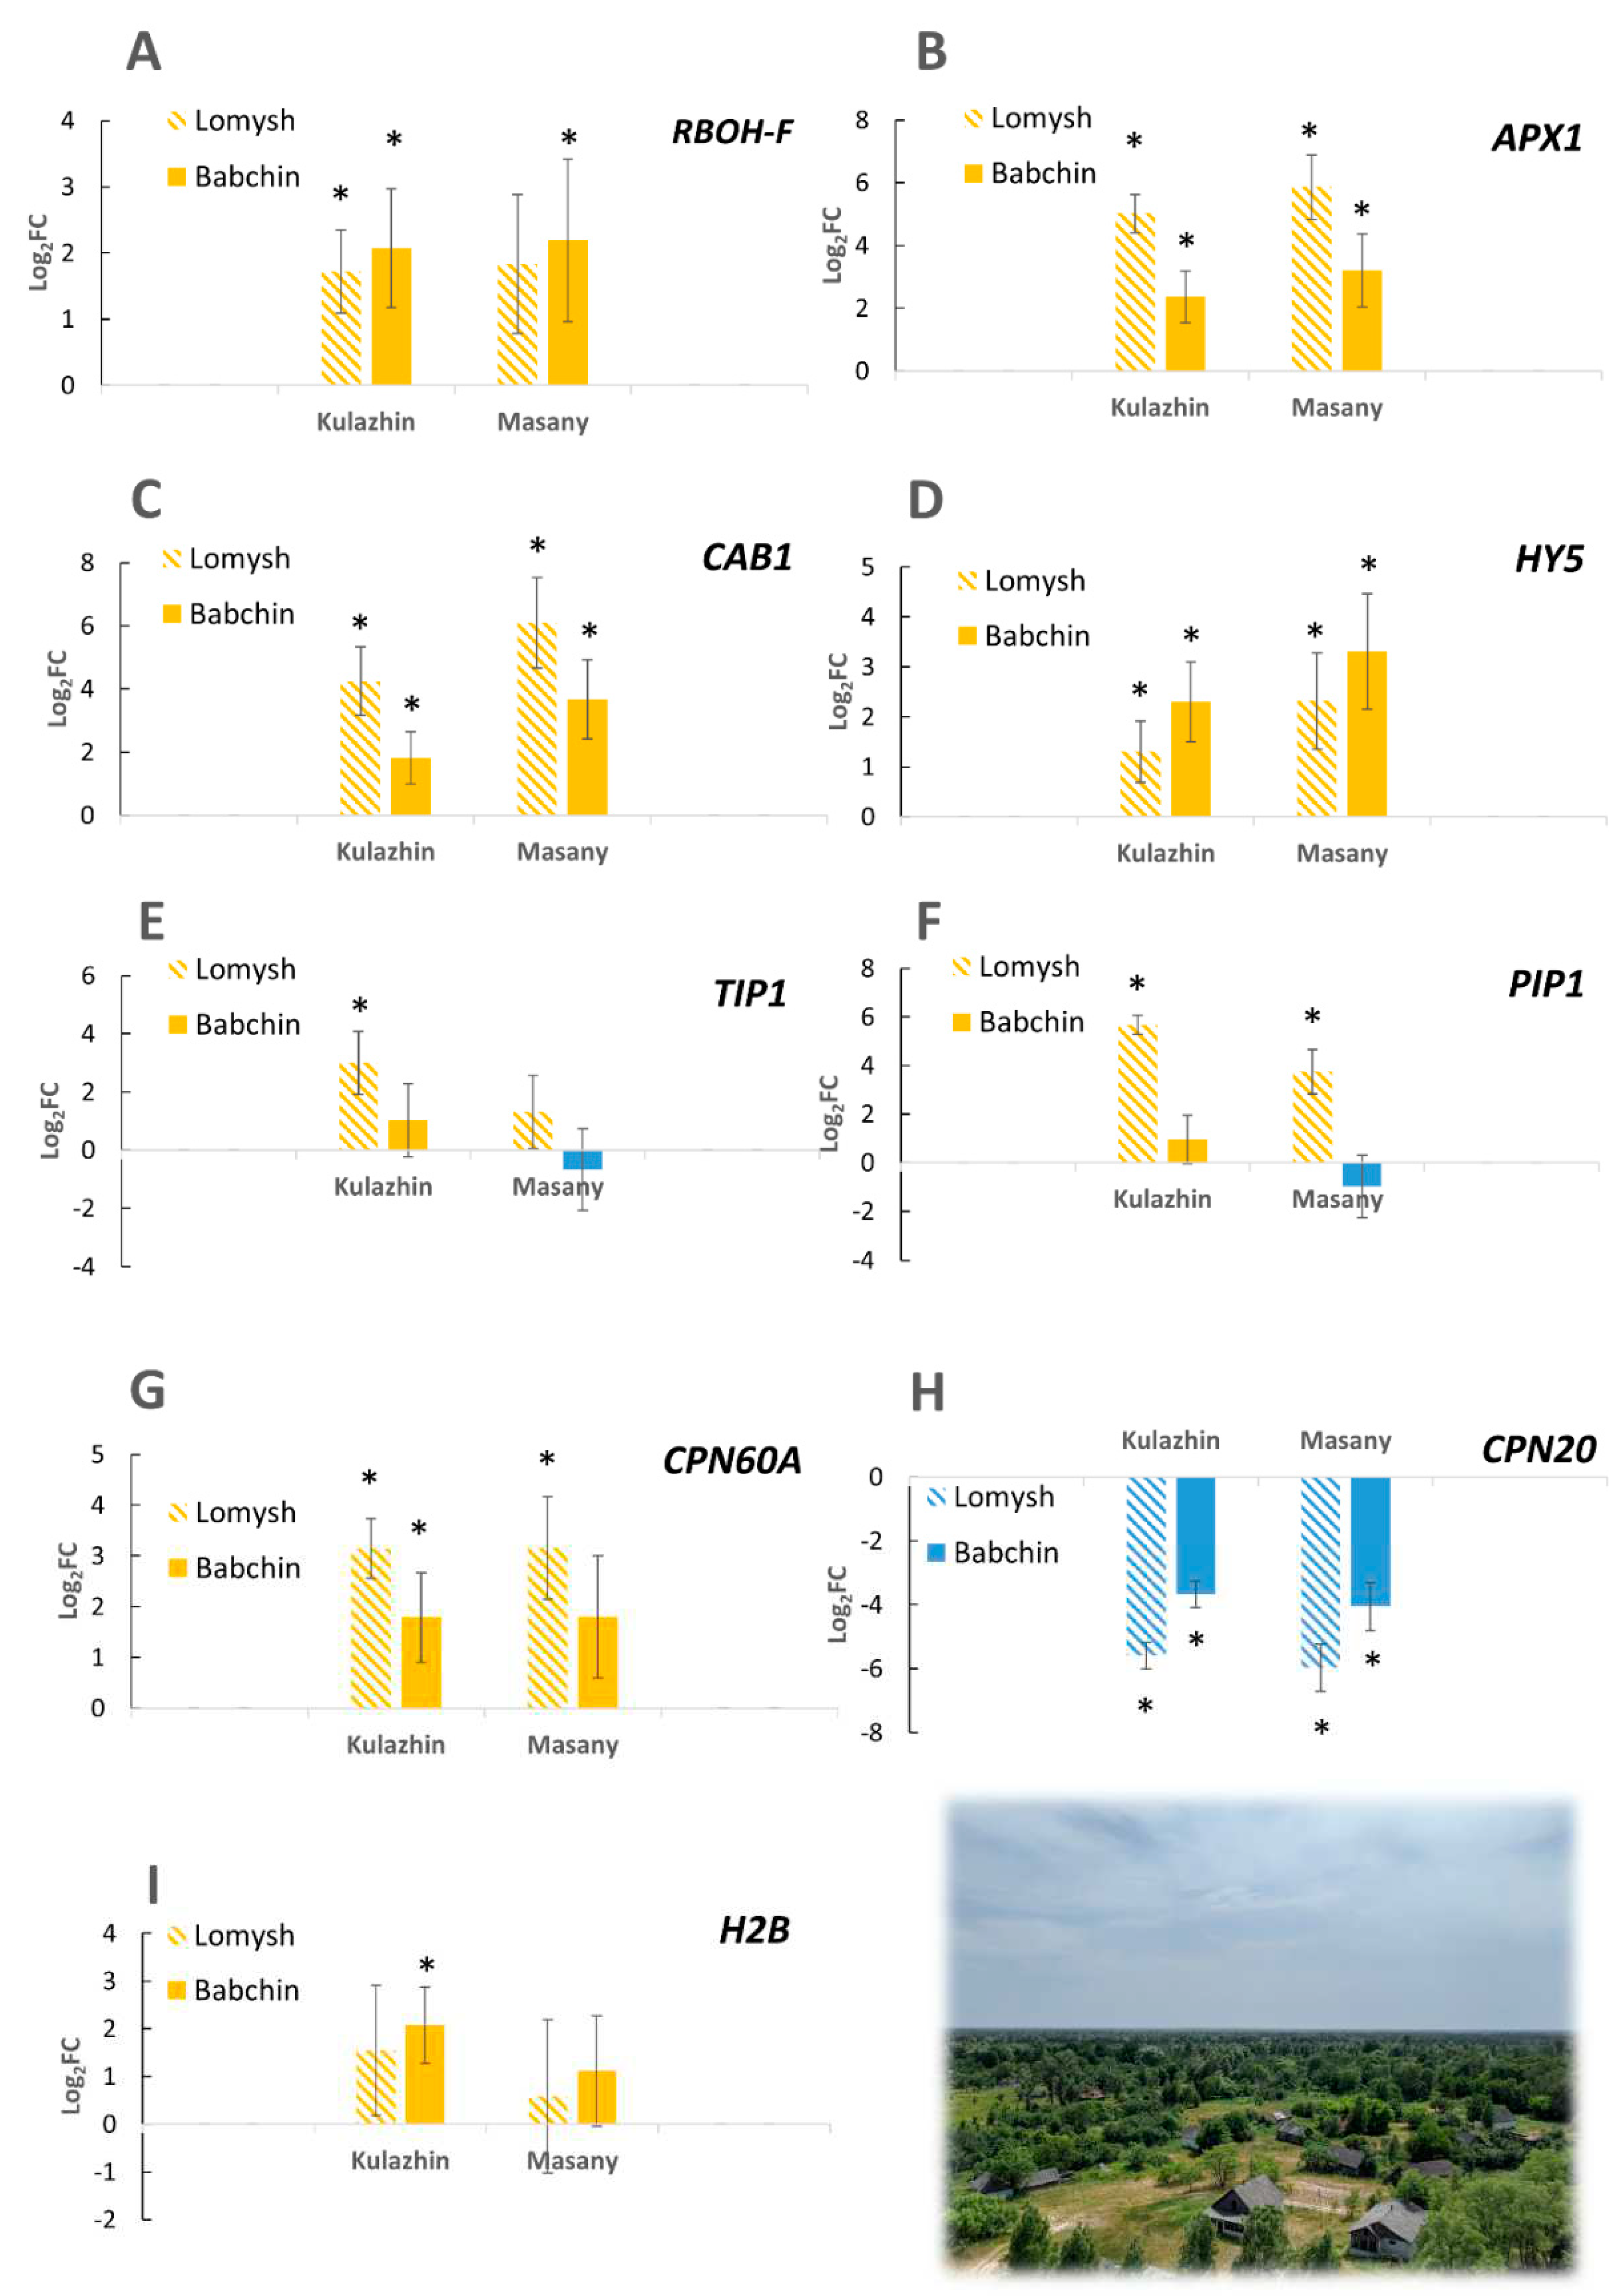
Figure 3.
Venn diagrams for DEGs among all experimental plots. A, C – downregulated, B, D – upregulated. C and D include L x B comparisons between reference plots.
Figure 3.
Venn diagrams for DEGs among all experimental plots. A, C – downregulated, B, D – upregulated. C and D include L x B comparisons between reference plots.
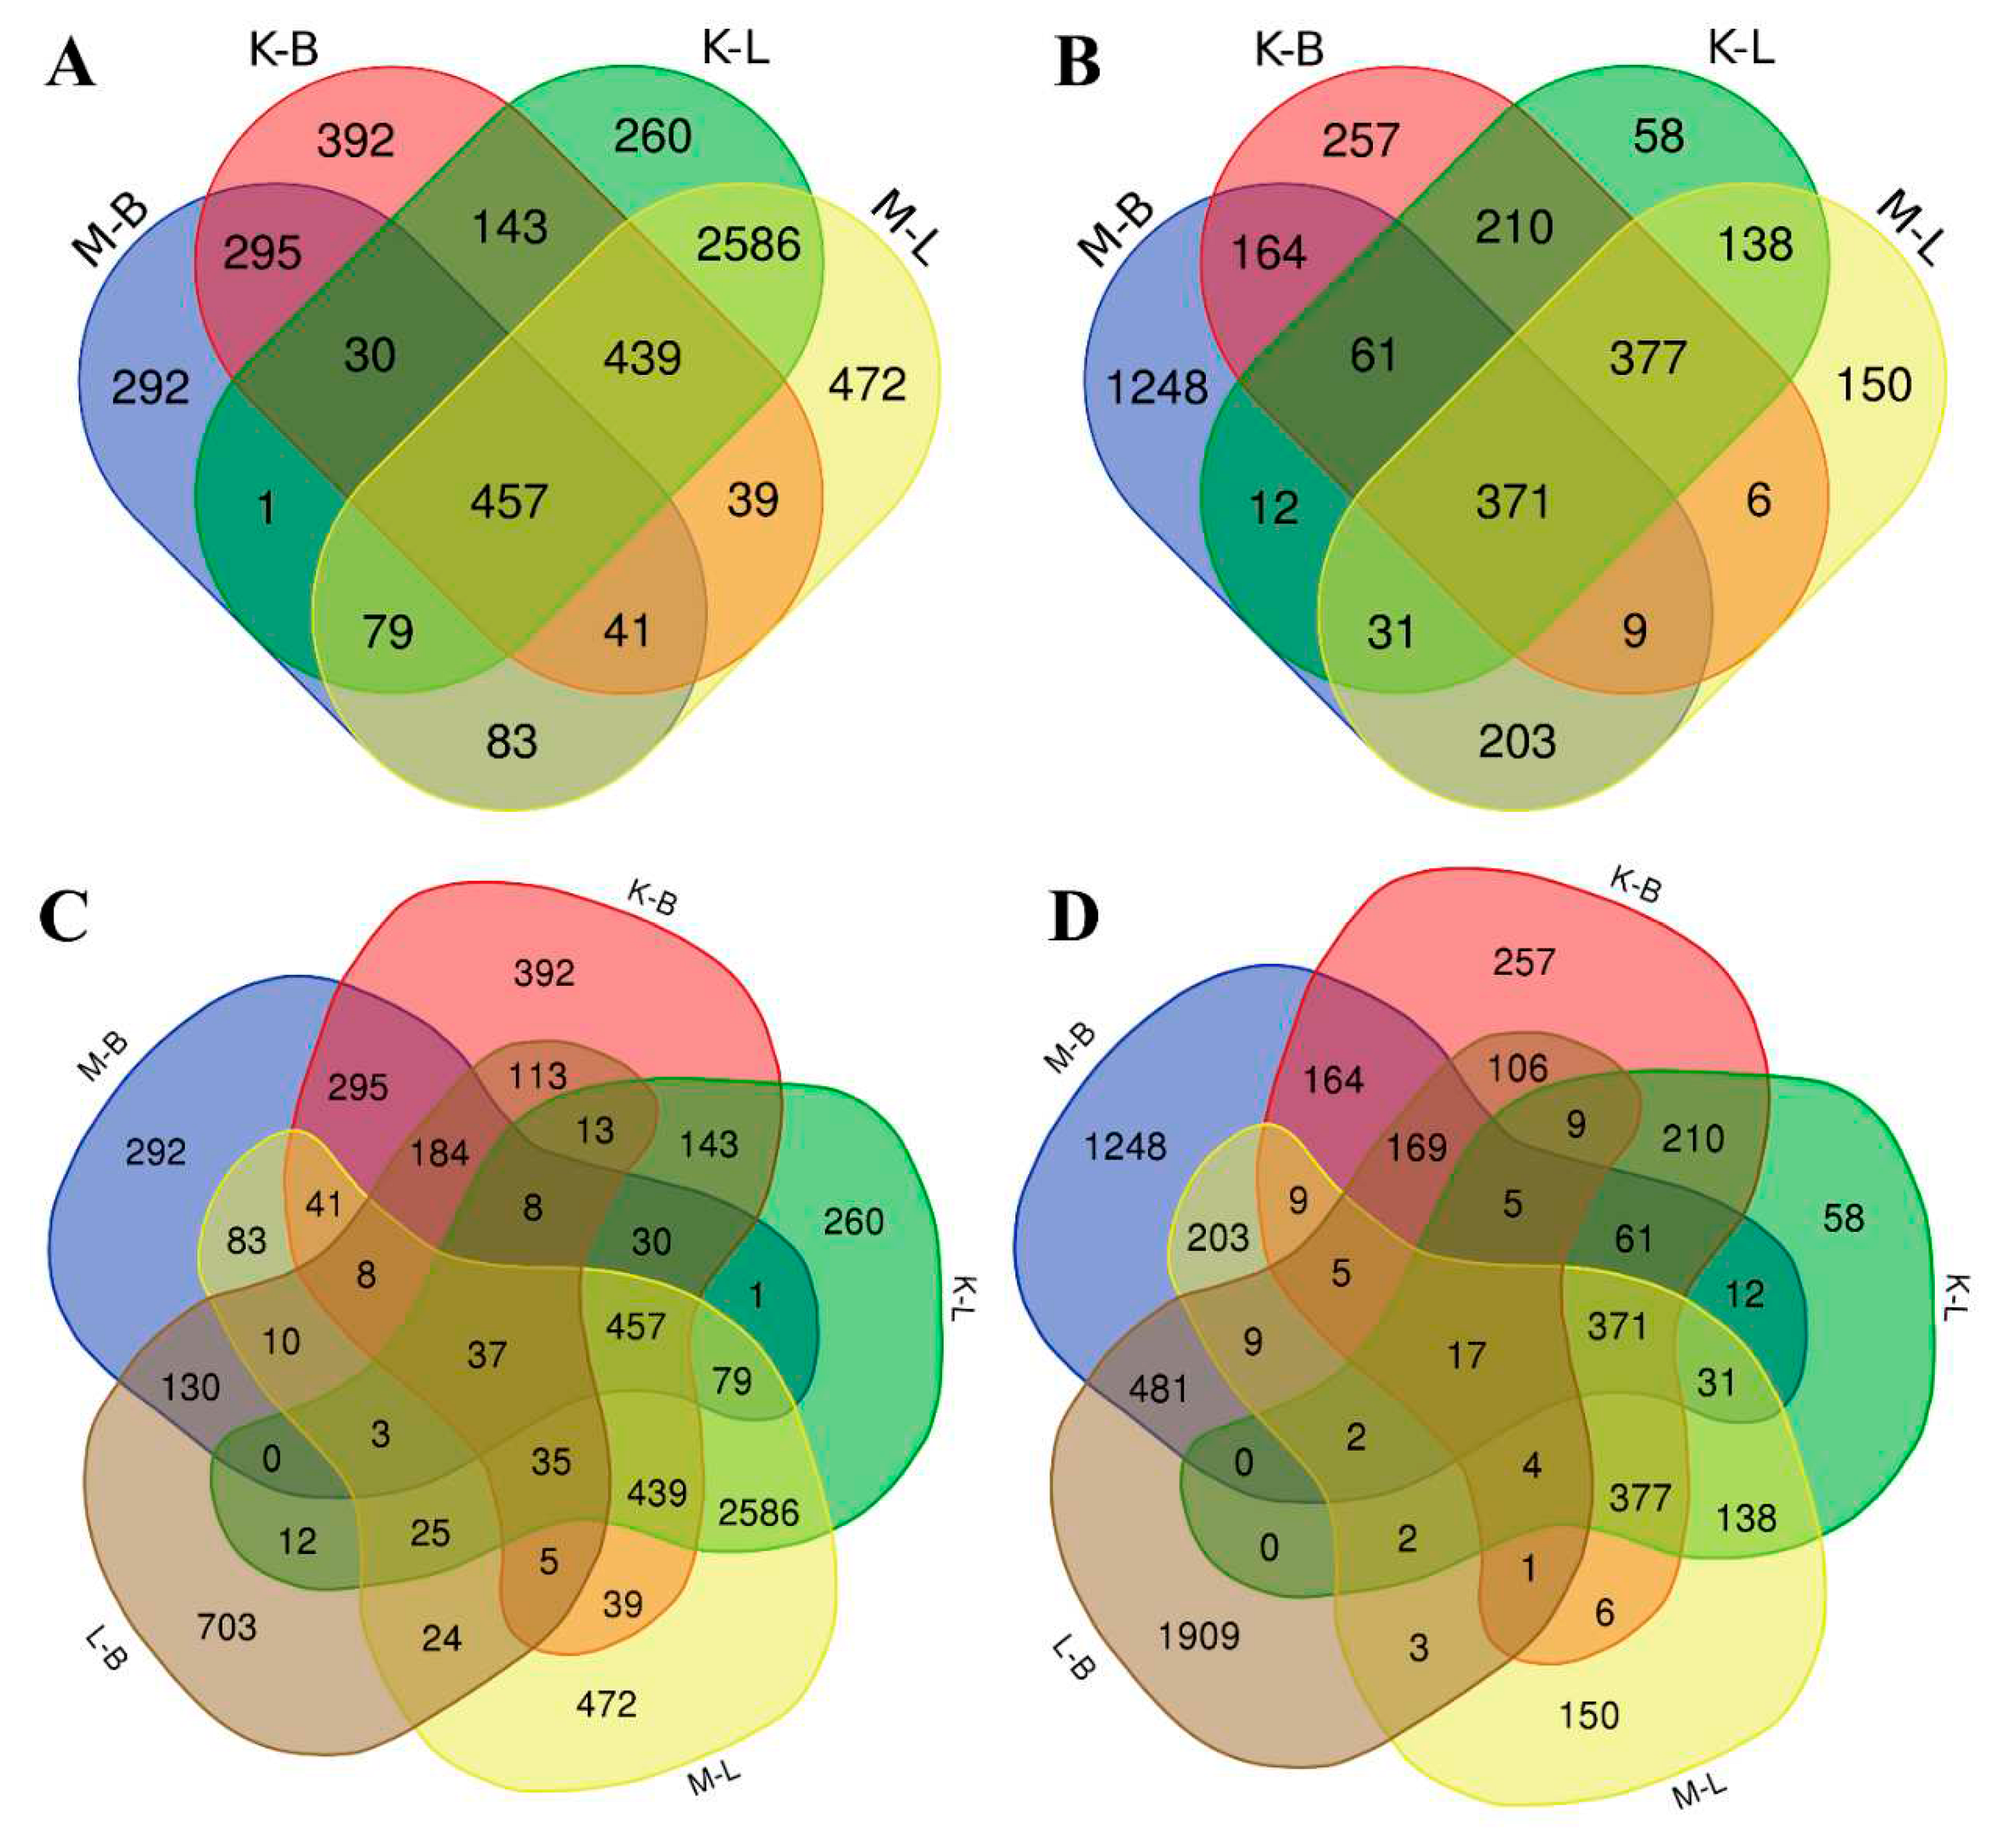
Figure 4.
Proteins with differential abundance log2FC ≥ |1| at least for one radiation-control comparison.
Figure 4.
Proteins with differential abundance log2FC ≥ |1| at least for one radiation-control comparison.
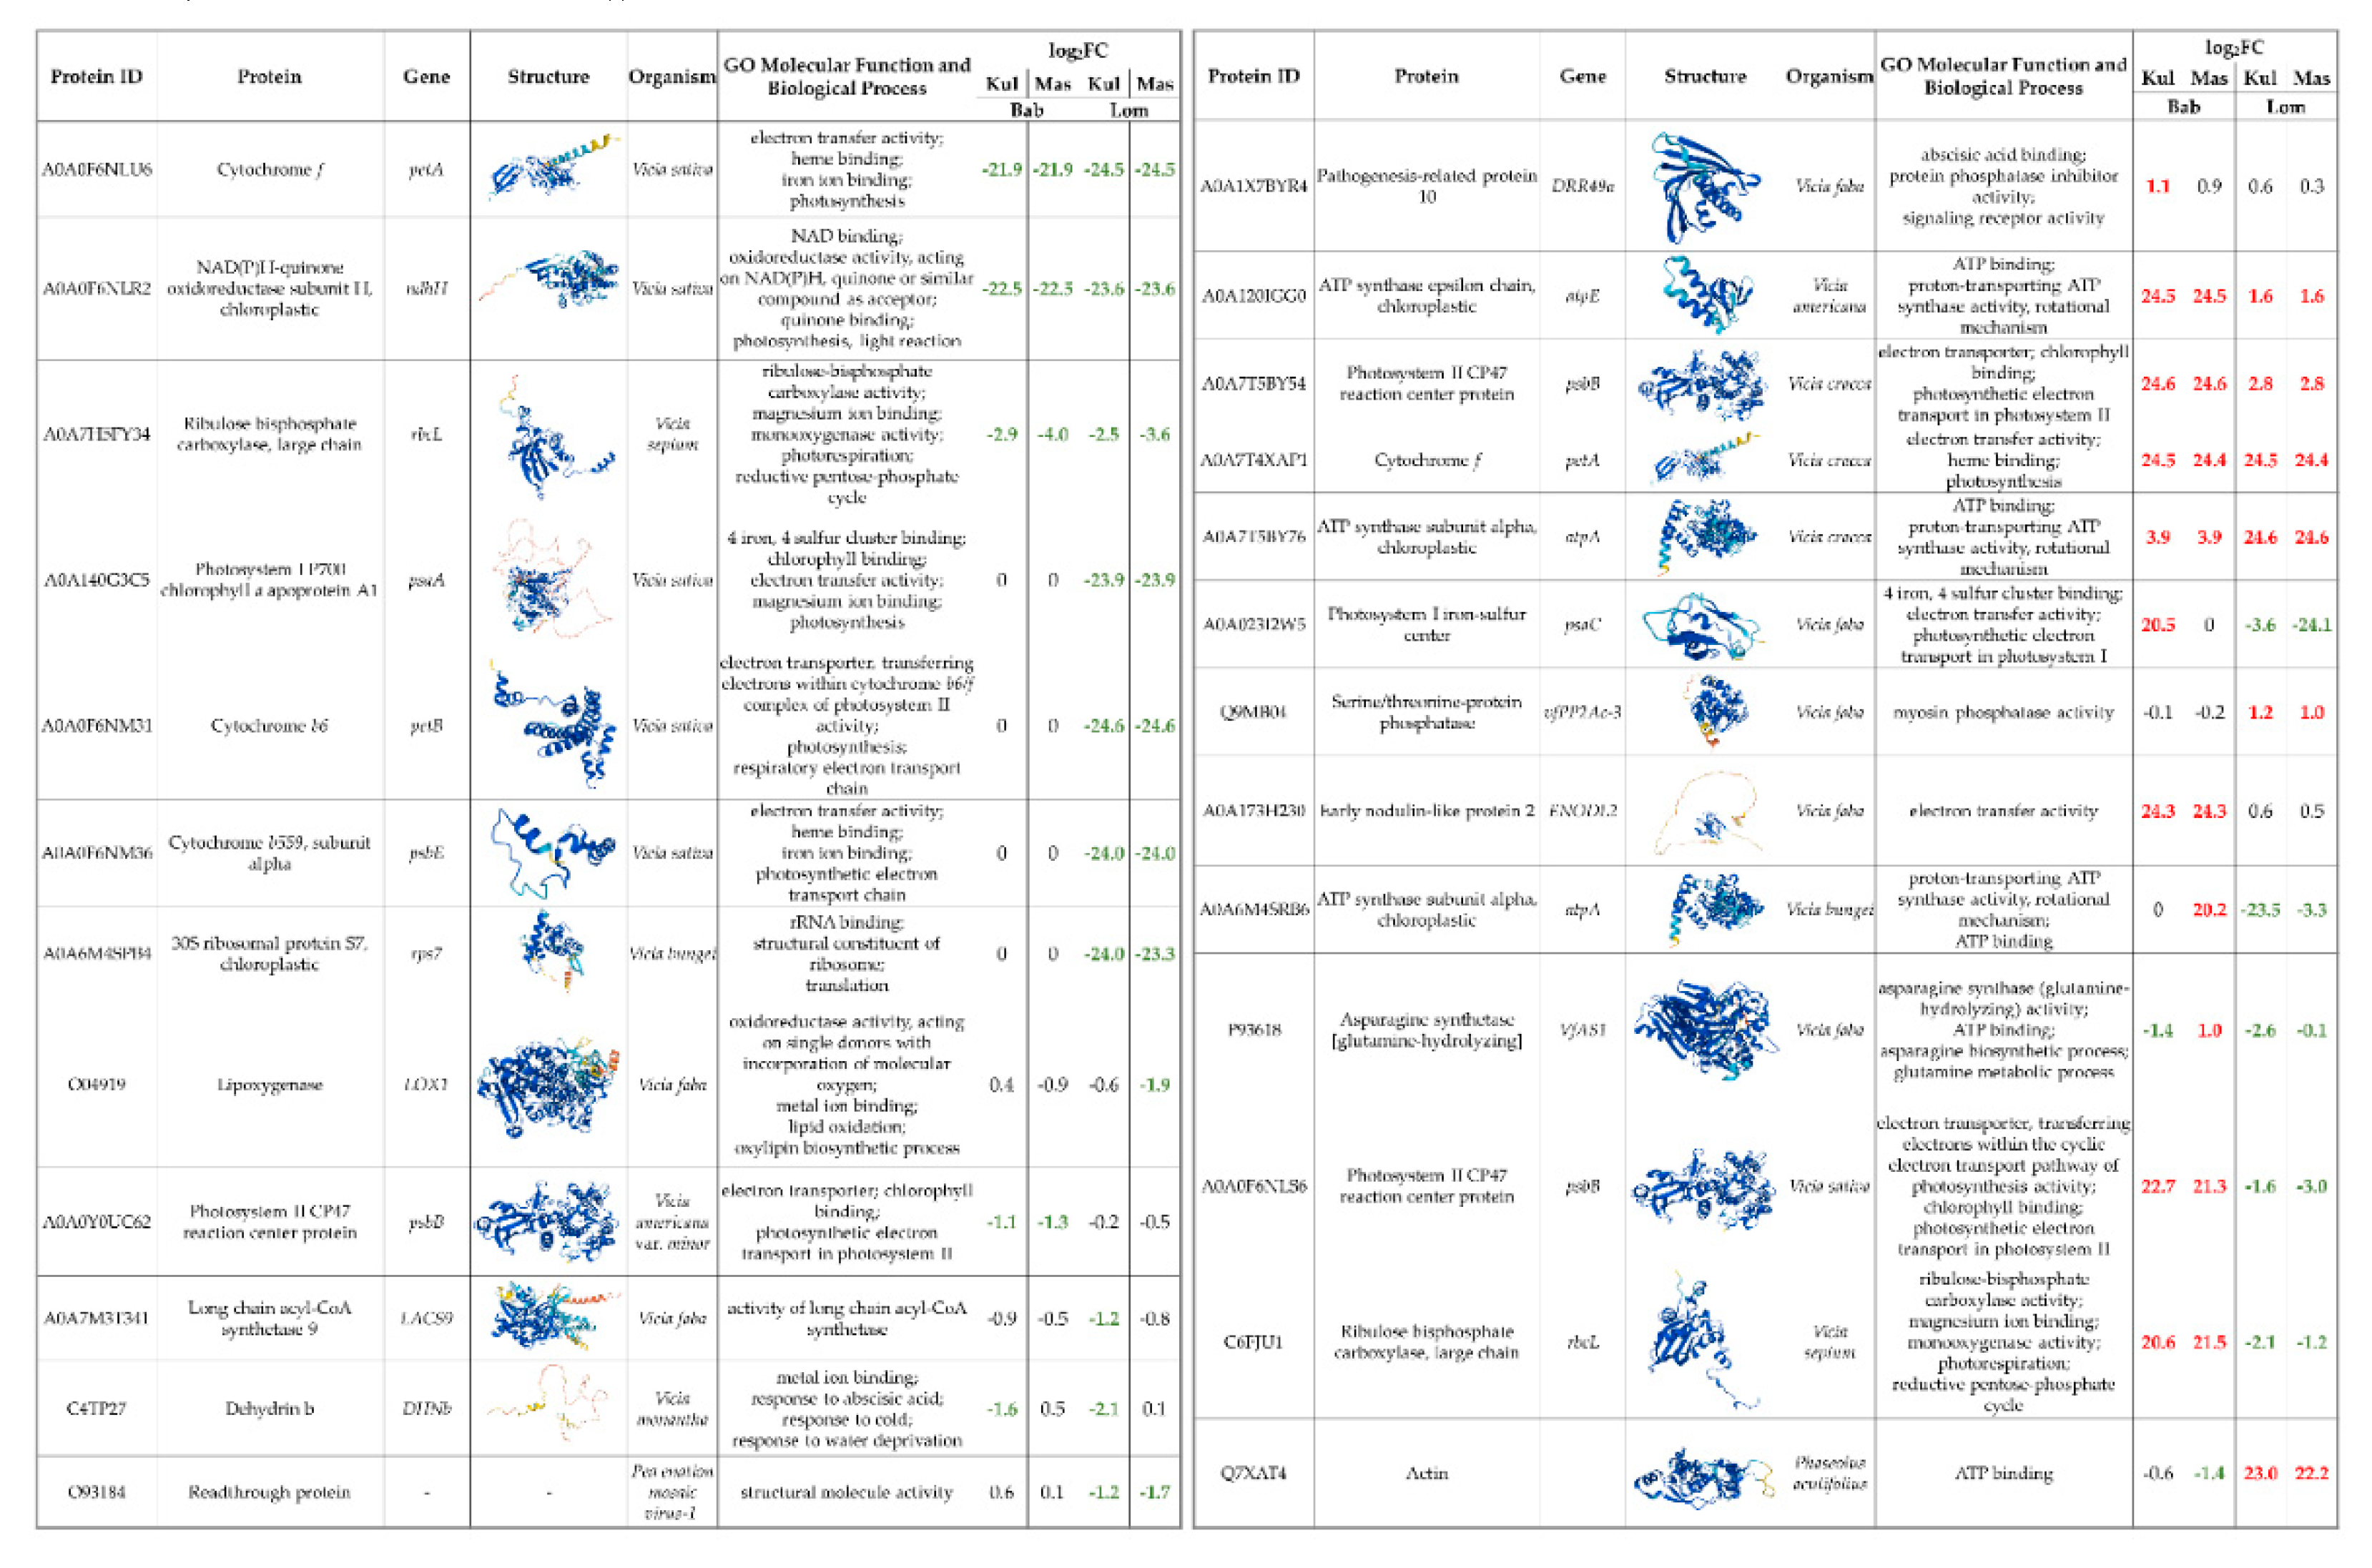
Figure 5.
STRING summary network [29] for proteins with significantly different abundance between contaminated and reference plots (homologous proteins of Medicago truncatula L.). Line thickness indicates the strength of data support (confidence). psaA ‒ photosystem I P700 chlorophyll a apoprotein; cemA ‒ apocytochrome f; ndhH ‒ NAD(P)-quinone oxidoreductase subunit I, chloroplastic; AES88244 ‒ribulose bisphosphate carboxylase large chain domain protein; Actin-97 ‒ actin; AES72204 ‒ asparagine synthetase; AES87795 ‒ large subunit ribosomal protein L16; rps7 ‒ ribosomal protein S7; petD ‒cytochrome b; AES69817 ‒ ribulose 1,5-bisphosphate carboxylase, large subunit; psaC ‒ 4Fe-4S ferredoxin; AES63405 ‒ F-type H+/Na+-transporting ATPase subunit alpha; atpE ‒ F-type H+/Na+-transporting ATPase subunit beta; petB H+/Na+‒ photosystem II chlorophyll a apoprotein; AES59115 ‒ plastocyanin-like domain protein; AES58557 ‒ ribosomal protein S3; AES58553 ‒ NADH-ubiquinone oxidoreductase; AES58516 ‒ NADH-ubiquinone oxidoreductase chain; AES58550 ‒ ATP synthase, subunit alpha; AES58514 ‒ ribosomal protein S12C.
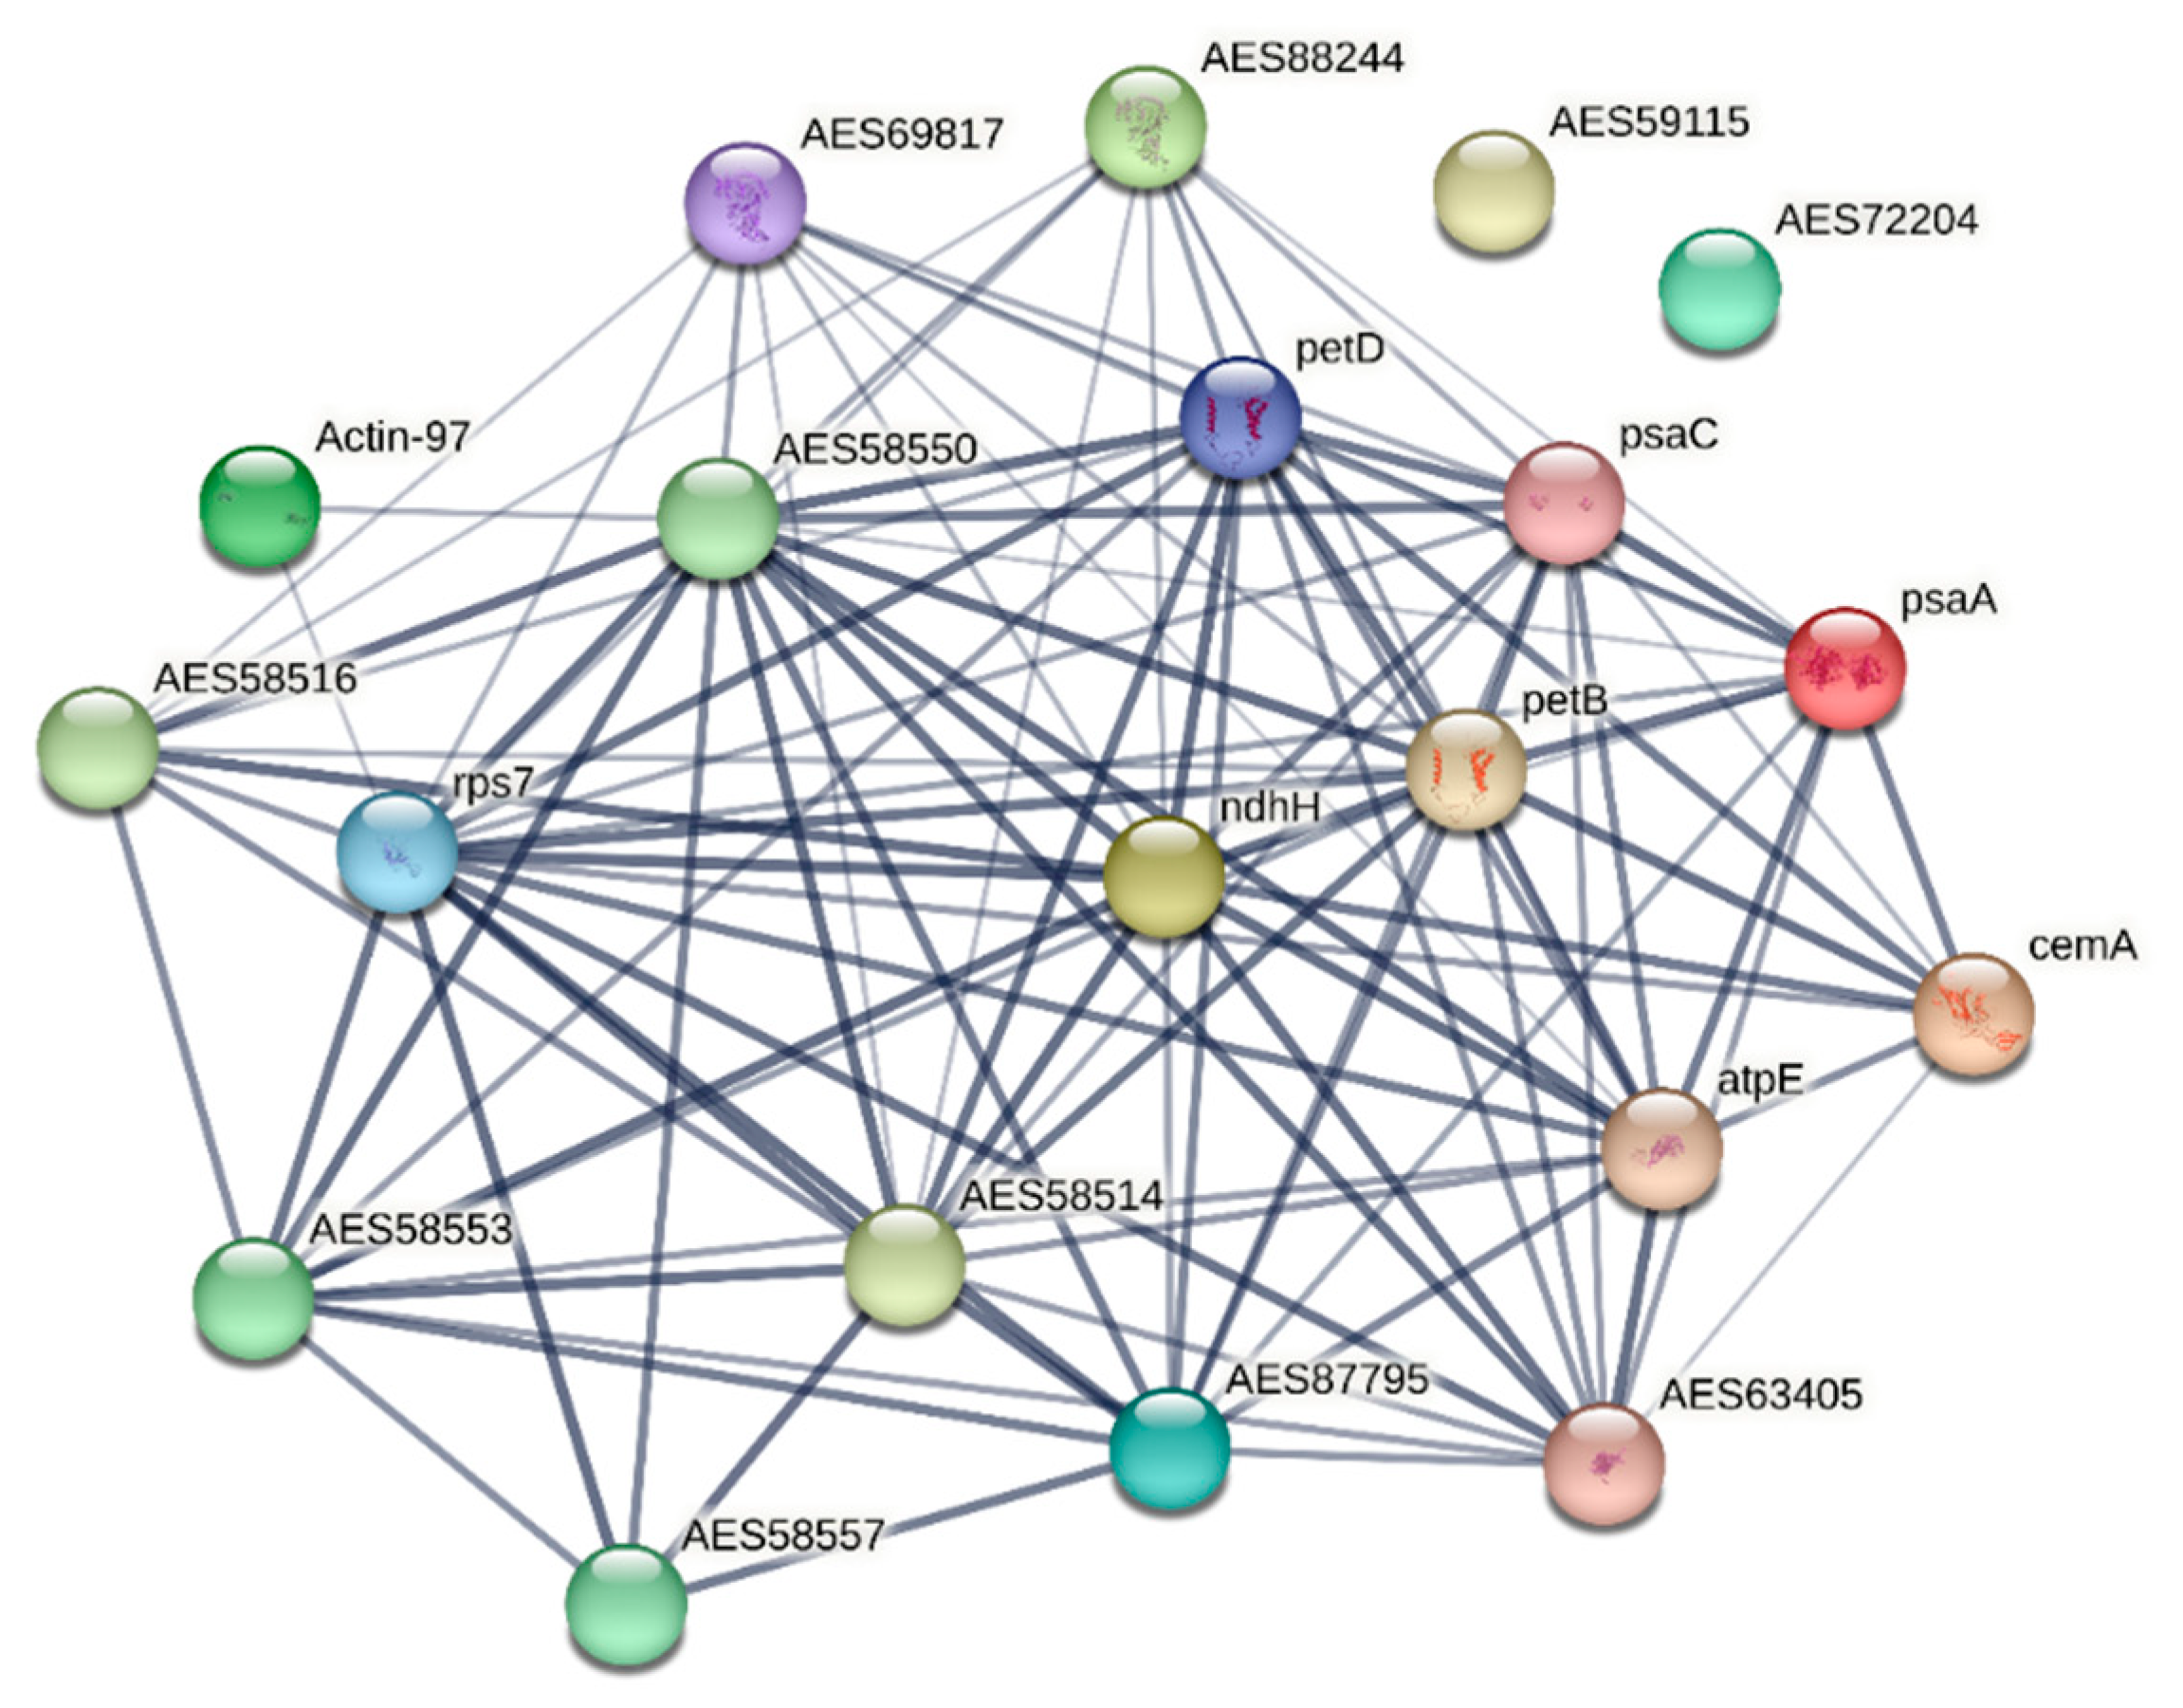
Figure 6.
A – Score plots of partial least squares discrimination analysis (PLS-DA). B – a variable important in the projection (VIP) scores of the top 20 metabolites contributing to the separation of component 1 for metabolomic data of V. cracca from control and radioactively contaminated plots. C – Heatmap and the hierarchical cluster analysis for the top 50 detected metabolites in V. cracca samples from four study plots. Analysis was performed on normalised data, Euclidean distances as the similarity measure, and Ward’s linkage as the clustering algorithm was used. Glucose-6-P ‒ glucose-6-phosphate; Fructose-6-P ‒ fructose-6-phosphate; GABA ‒ γ-aminobutyric acid; myo-Inositol-1-P ‒ myo-Inositol-1-phosphate; Inositol-3-P ‒ inositol-3-phosphate.
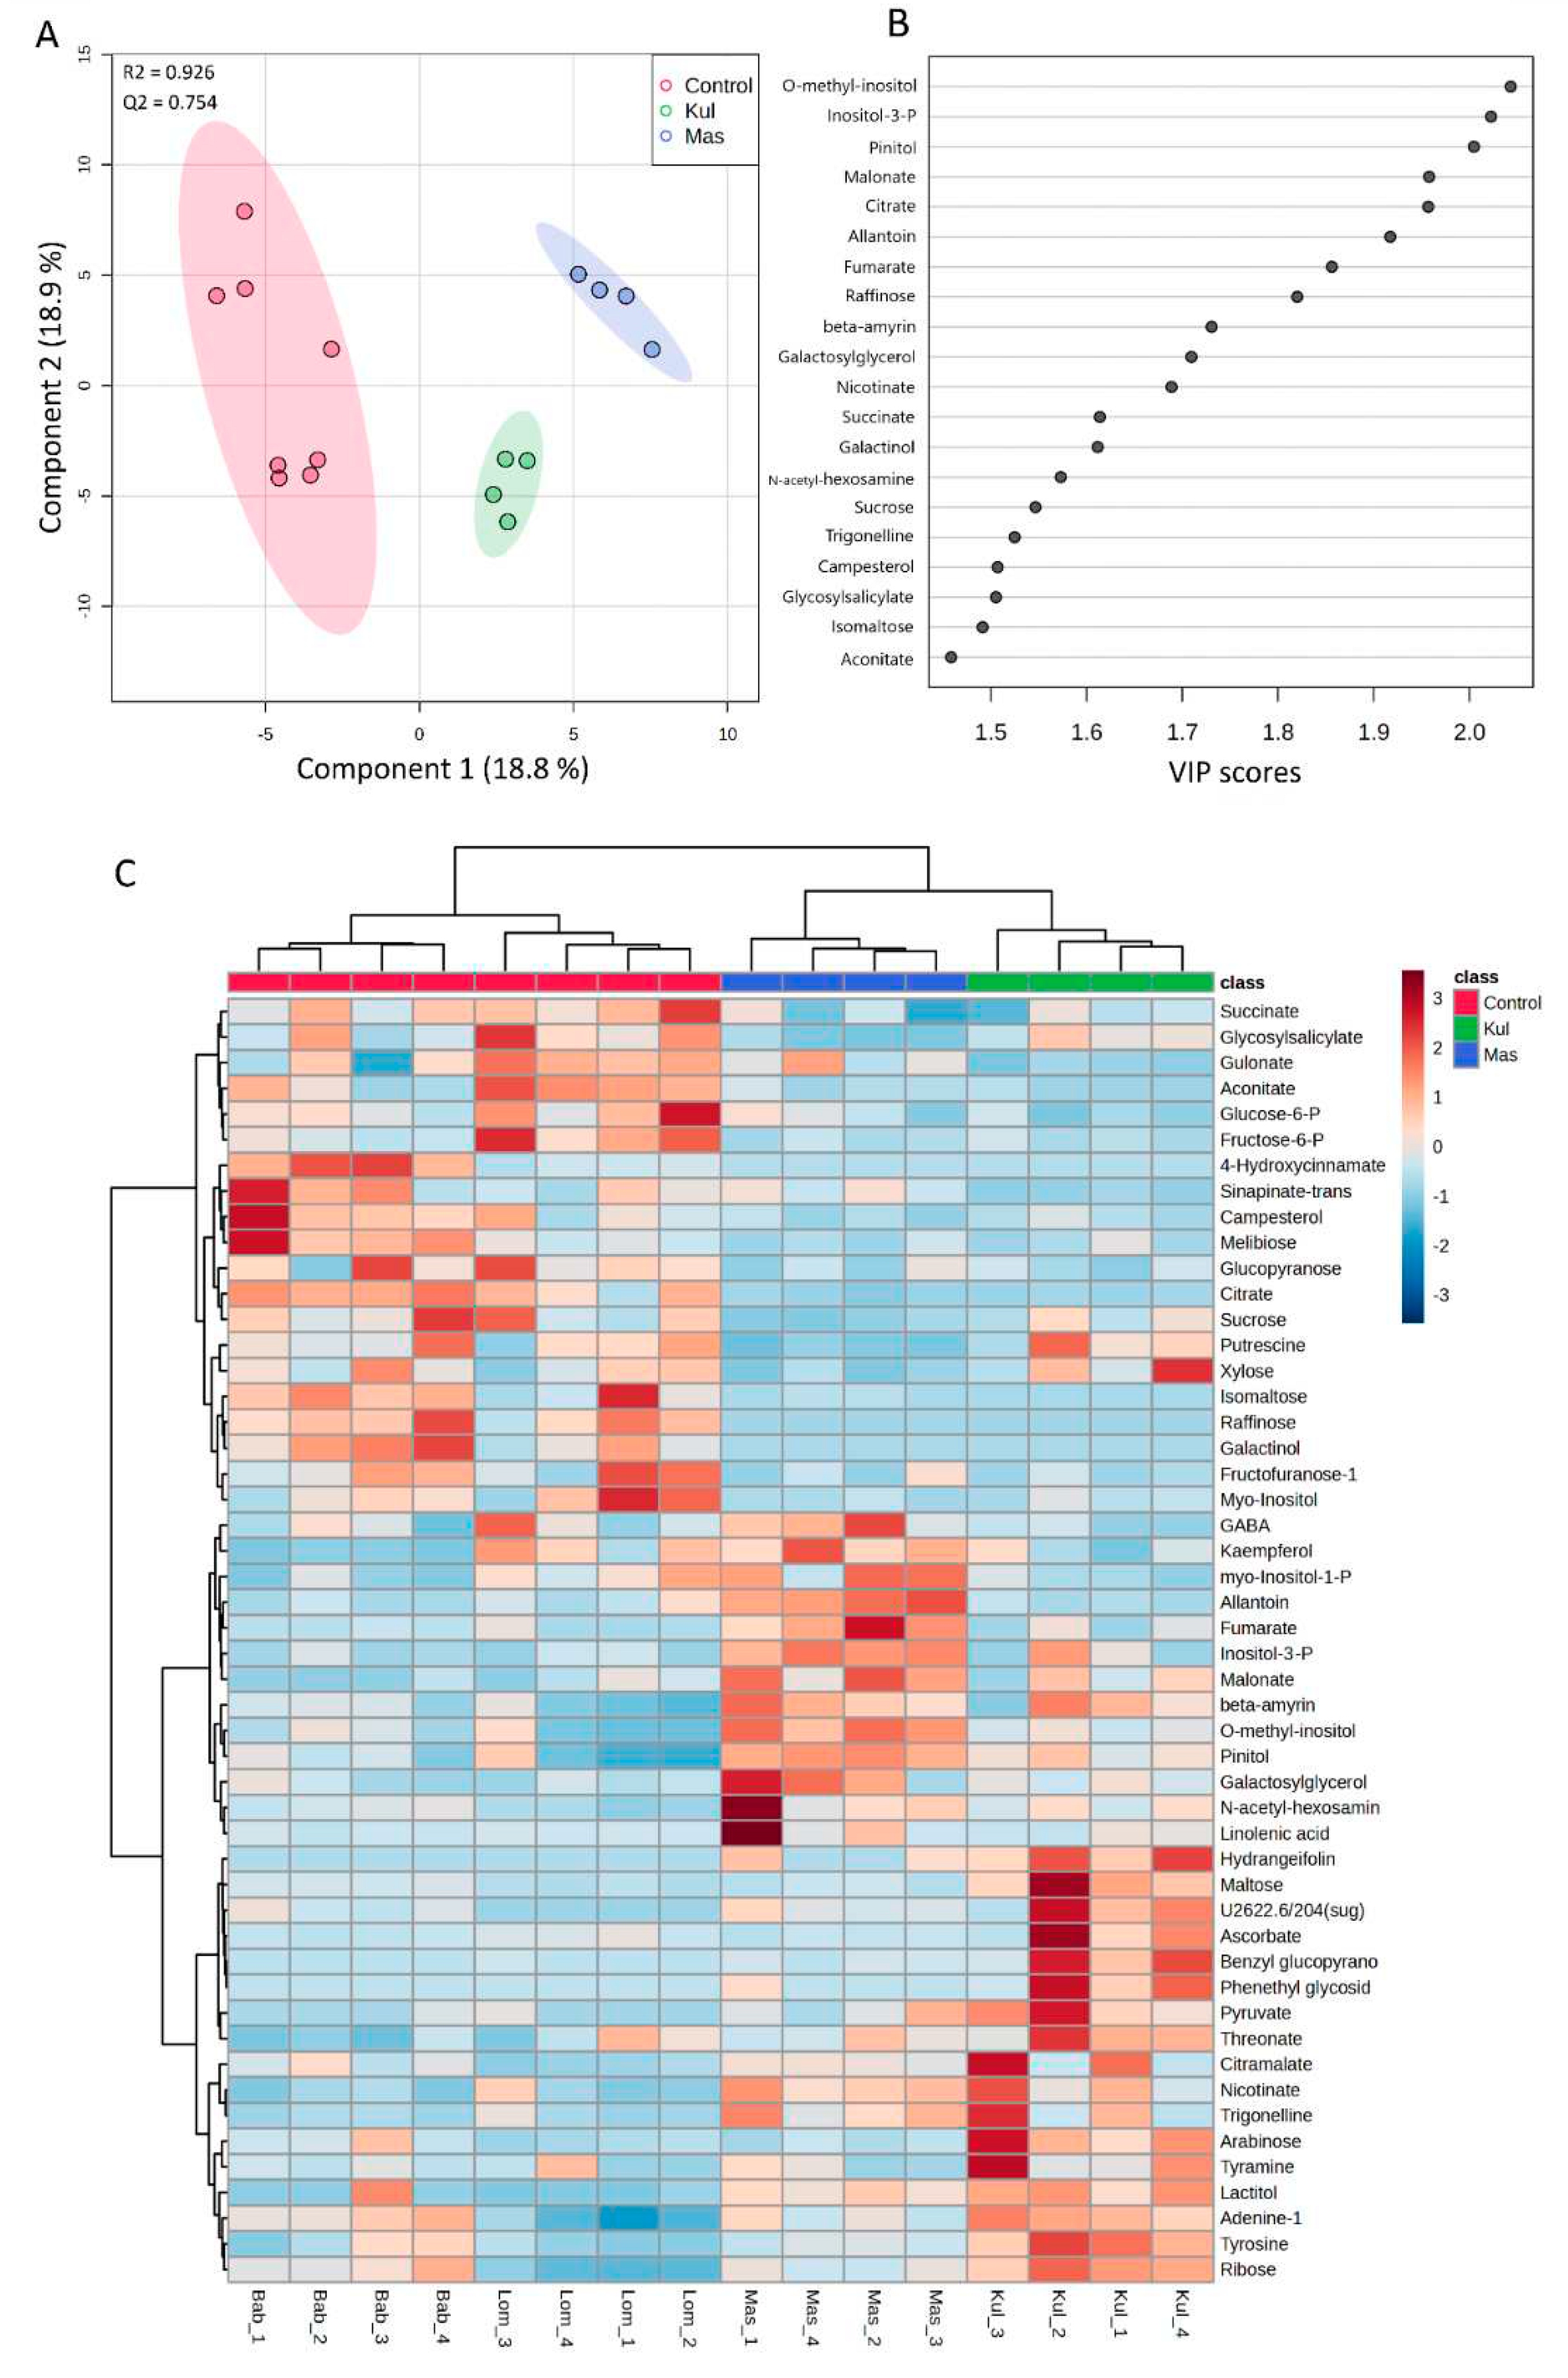
Figure 7.
A, B ‒ Volcano plot of the differentially abundant metabolites at Kulazhin (A) and Masany (B) compared to the control (L+B) with cut-offs for fold change |FC| > 2 and a p-value of < 0.05. Blue ‒ downregulated metabolites, grey – non-significant, red – upregulated metabolites. C Plots depict several metabolic pathway alterations induced by chronic radiation exposure on experimental plots. The x-axis represents the pathway impact value from pathway topological analysis, and the y-axis is the -log of the p-value obtained from pathway enrichment analysis. The most significantly changed pathways were characterised by a high -log(p) value and high impact value.
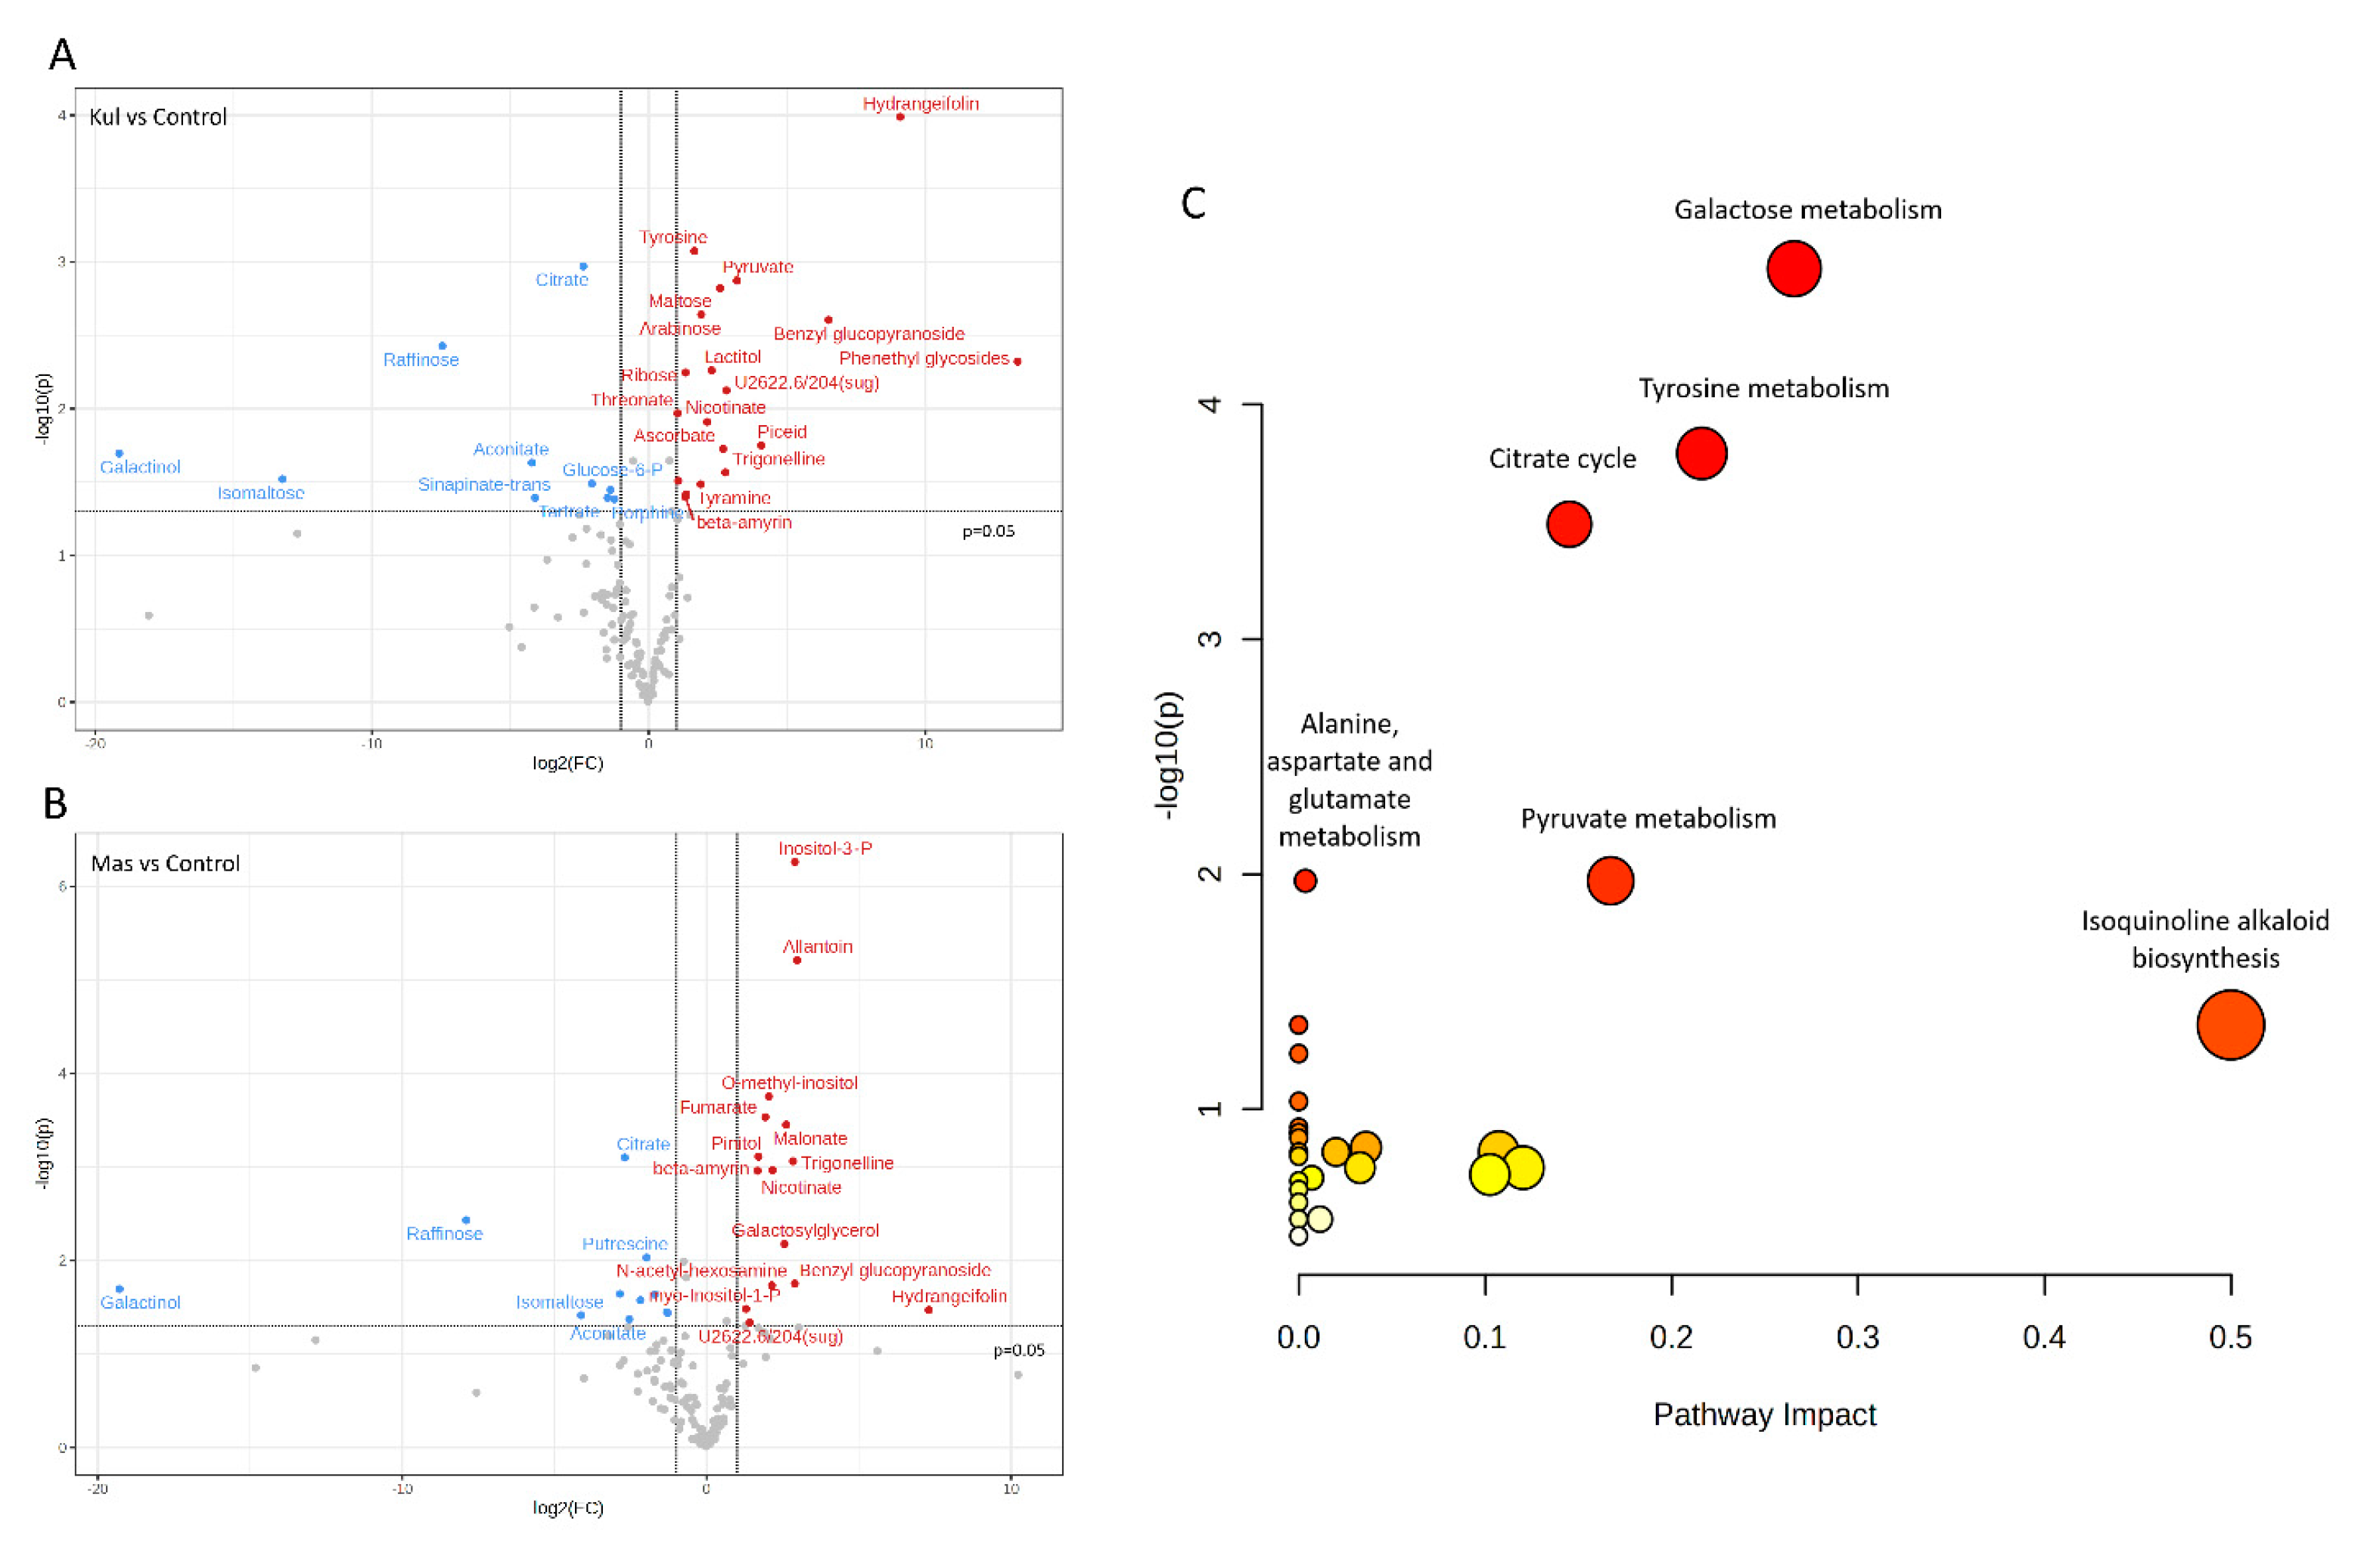
Figure 8.
Enrichment for TCA cycle pathway in input datasets. Each Uniprot entry is divided by four squares, each representing a log2FC for a comparison between contaminated and reference plots, from left to right: K x B, K x L, M x B, M x L. The top line of the Uniprot entry is transcriptomic input, bottom part – is proteomic. The blue colour of a square reflects downregulation and red – upregulation. If a biological feature is significant for any of the omics data layers, it is highlighted by a thicker border and a red mark at the top right corner. A single databox can represent one or more biological features, where only the entry of the most significant feature will be shown. In this case, one or more hidden features that share functions or contribute equally to the biological process is indicated by a green mark in the bottom right corner. The Figure is created with PaintOmics 4.
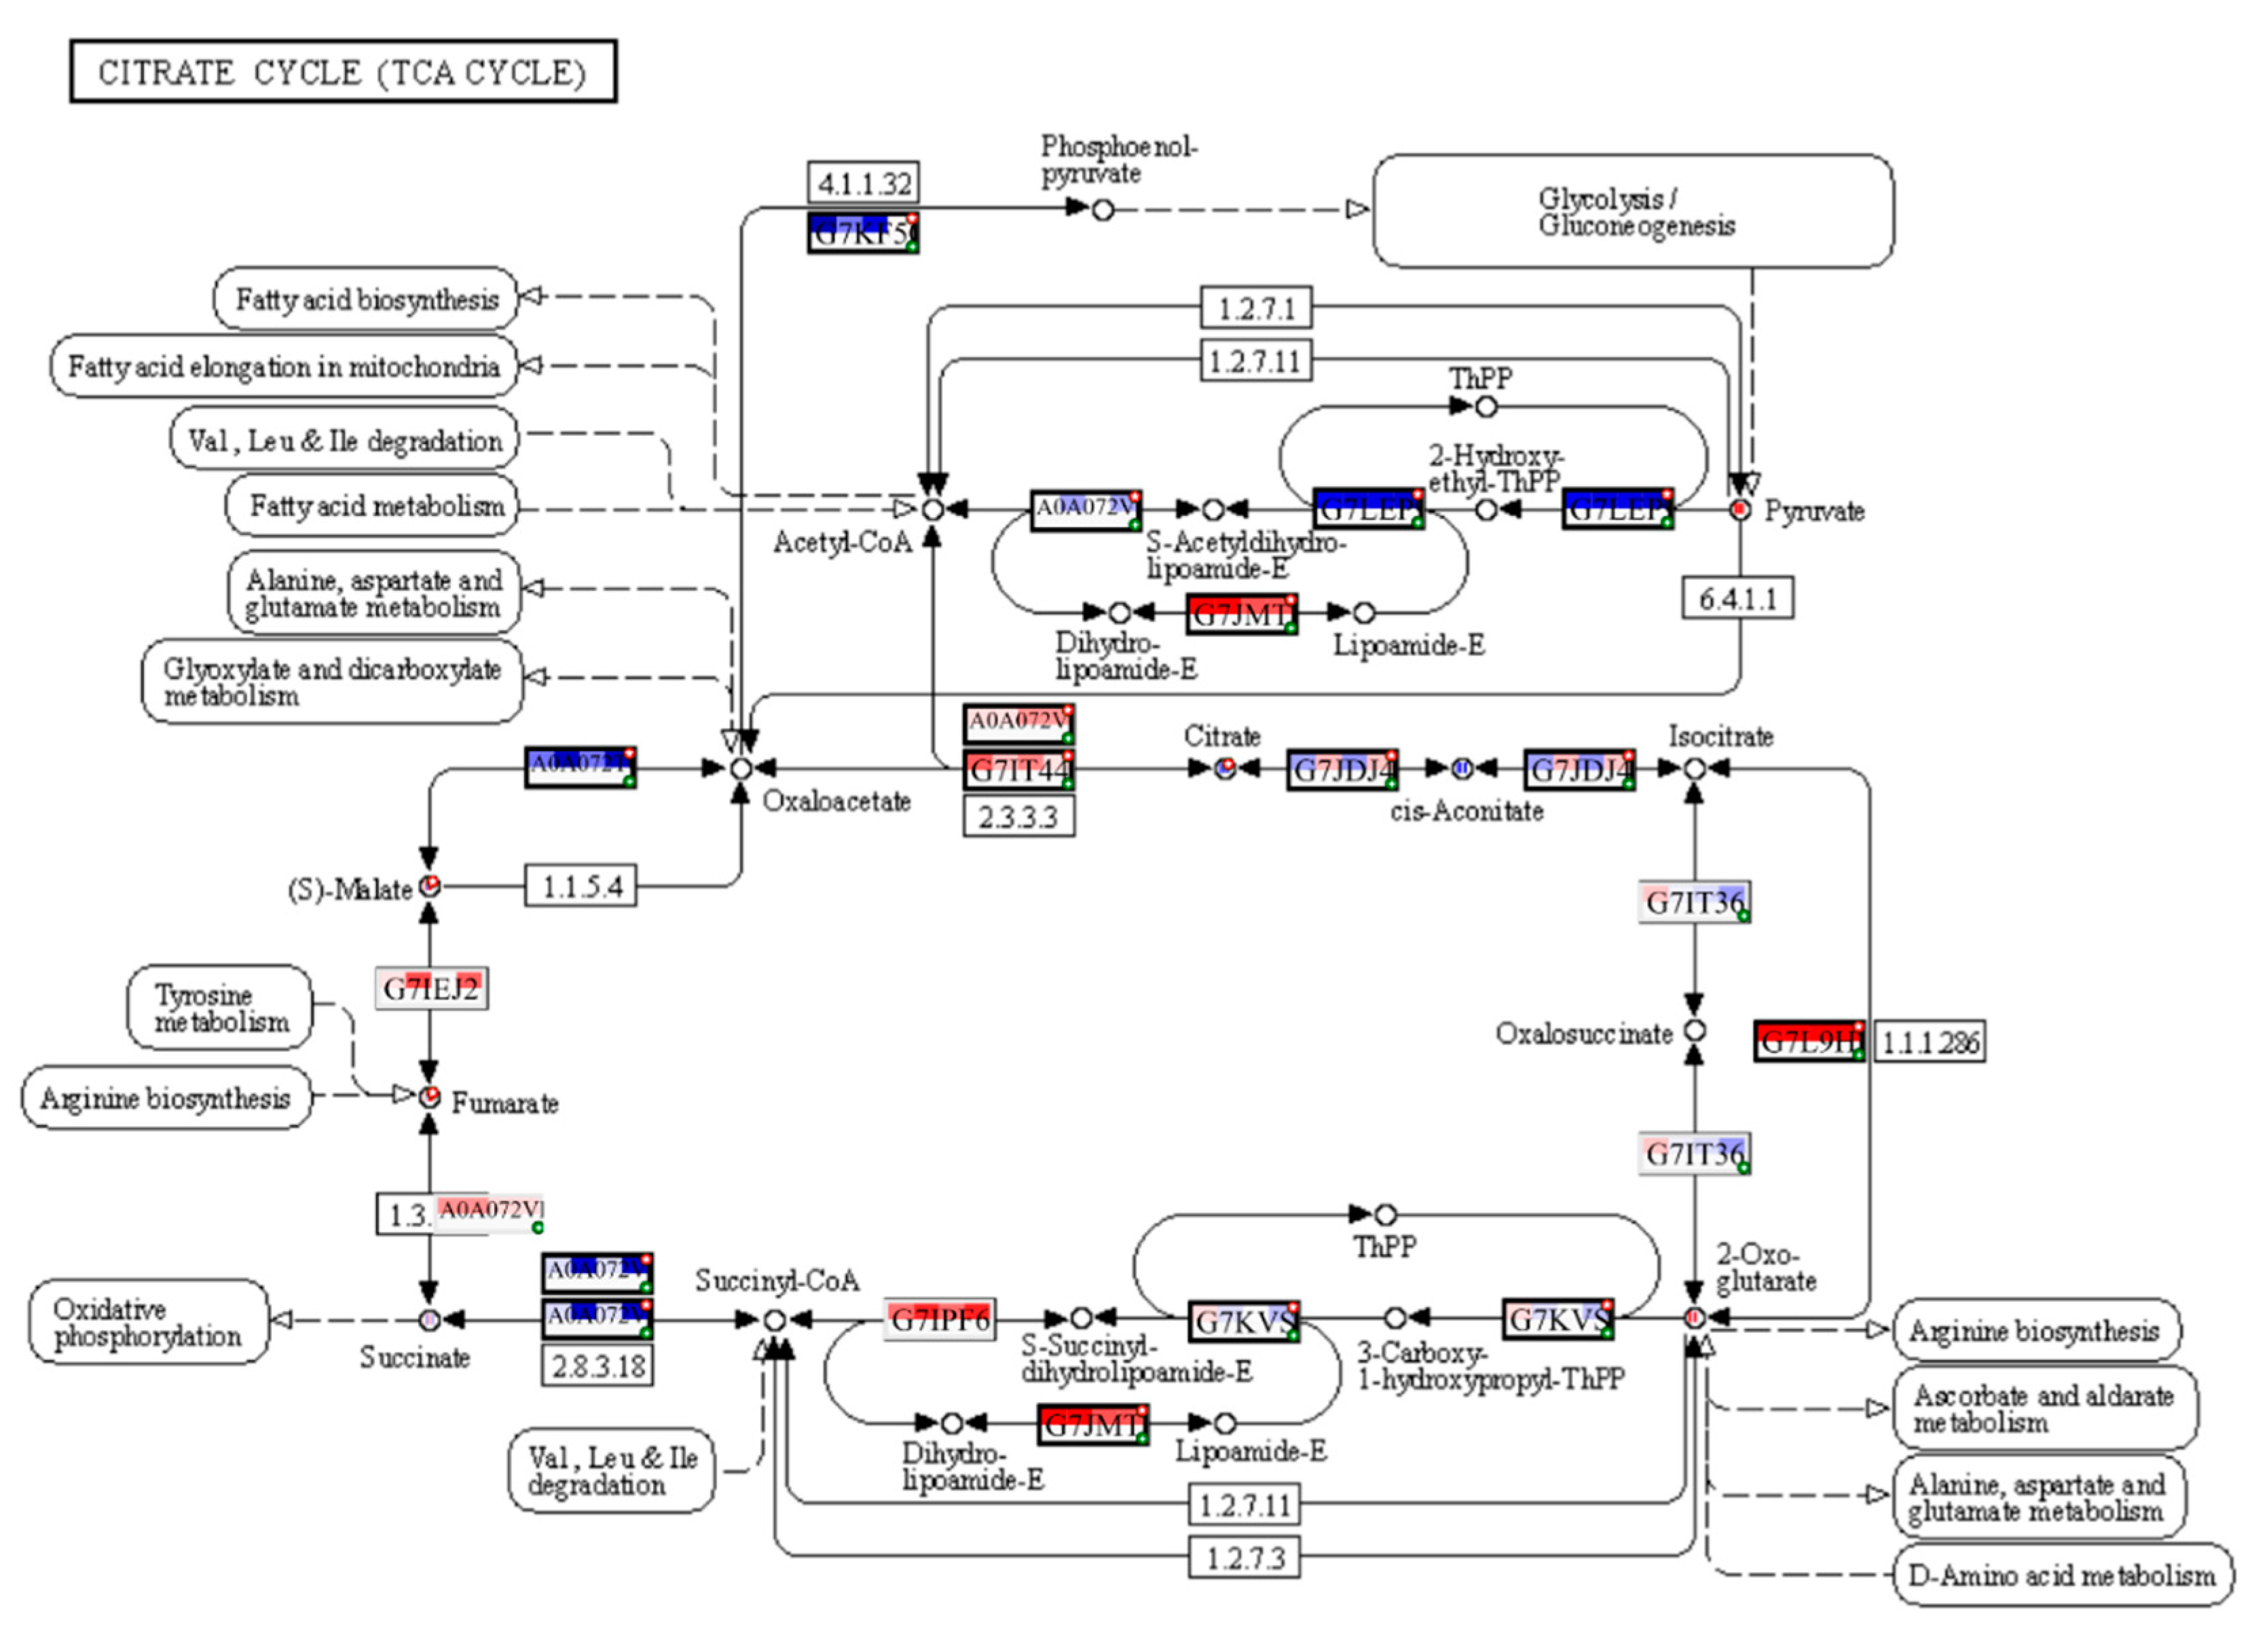
Figure 9.
Enrichment for pyruvate metabolism pathway in input datasets. Each Uniprot entry is divided by four squares, each representing a log2FC for a comparison between contaminated and reference plots, from left to right: K x B, K x L, M x B, M x L. The top line of the Uniprot entry is transcriptomic input, bottom part – is proteomic. The blue colour of a square reflects downregulation and red – upregulation. If a biological feature is significant for any of the omics data layers, it is highlighted by a thicker border and a red mark at the top right corner. A single databox can represent one or more biological features, where only the entry of the most significant feature will be shown. In this case, one or more hidden features that share functions or contribute equally to the biological process is indicated by a green mark in the bottom right corner. The Figure is created with PaintOmics 4.
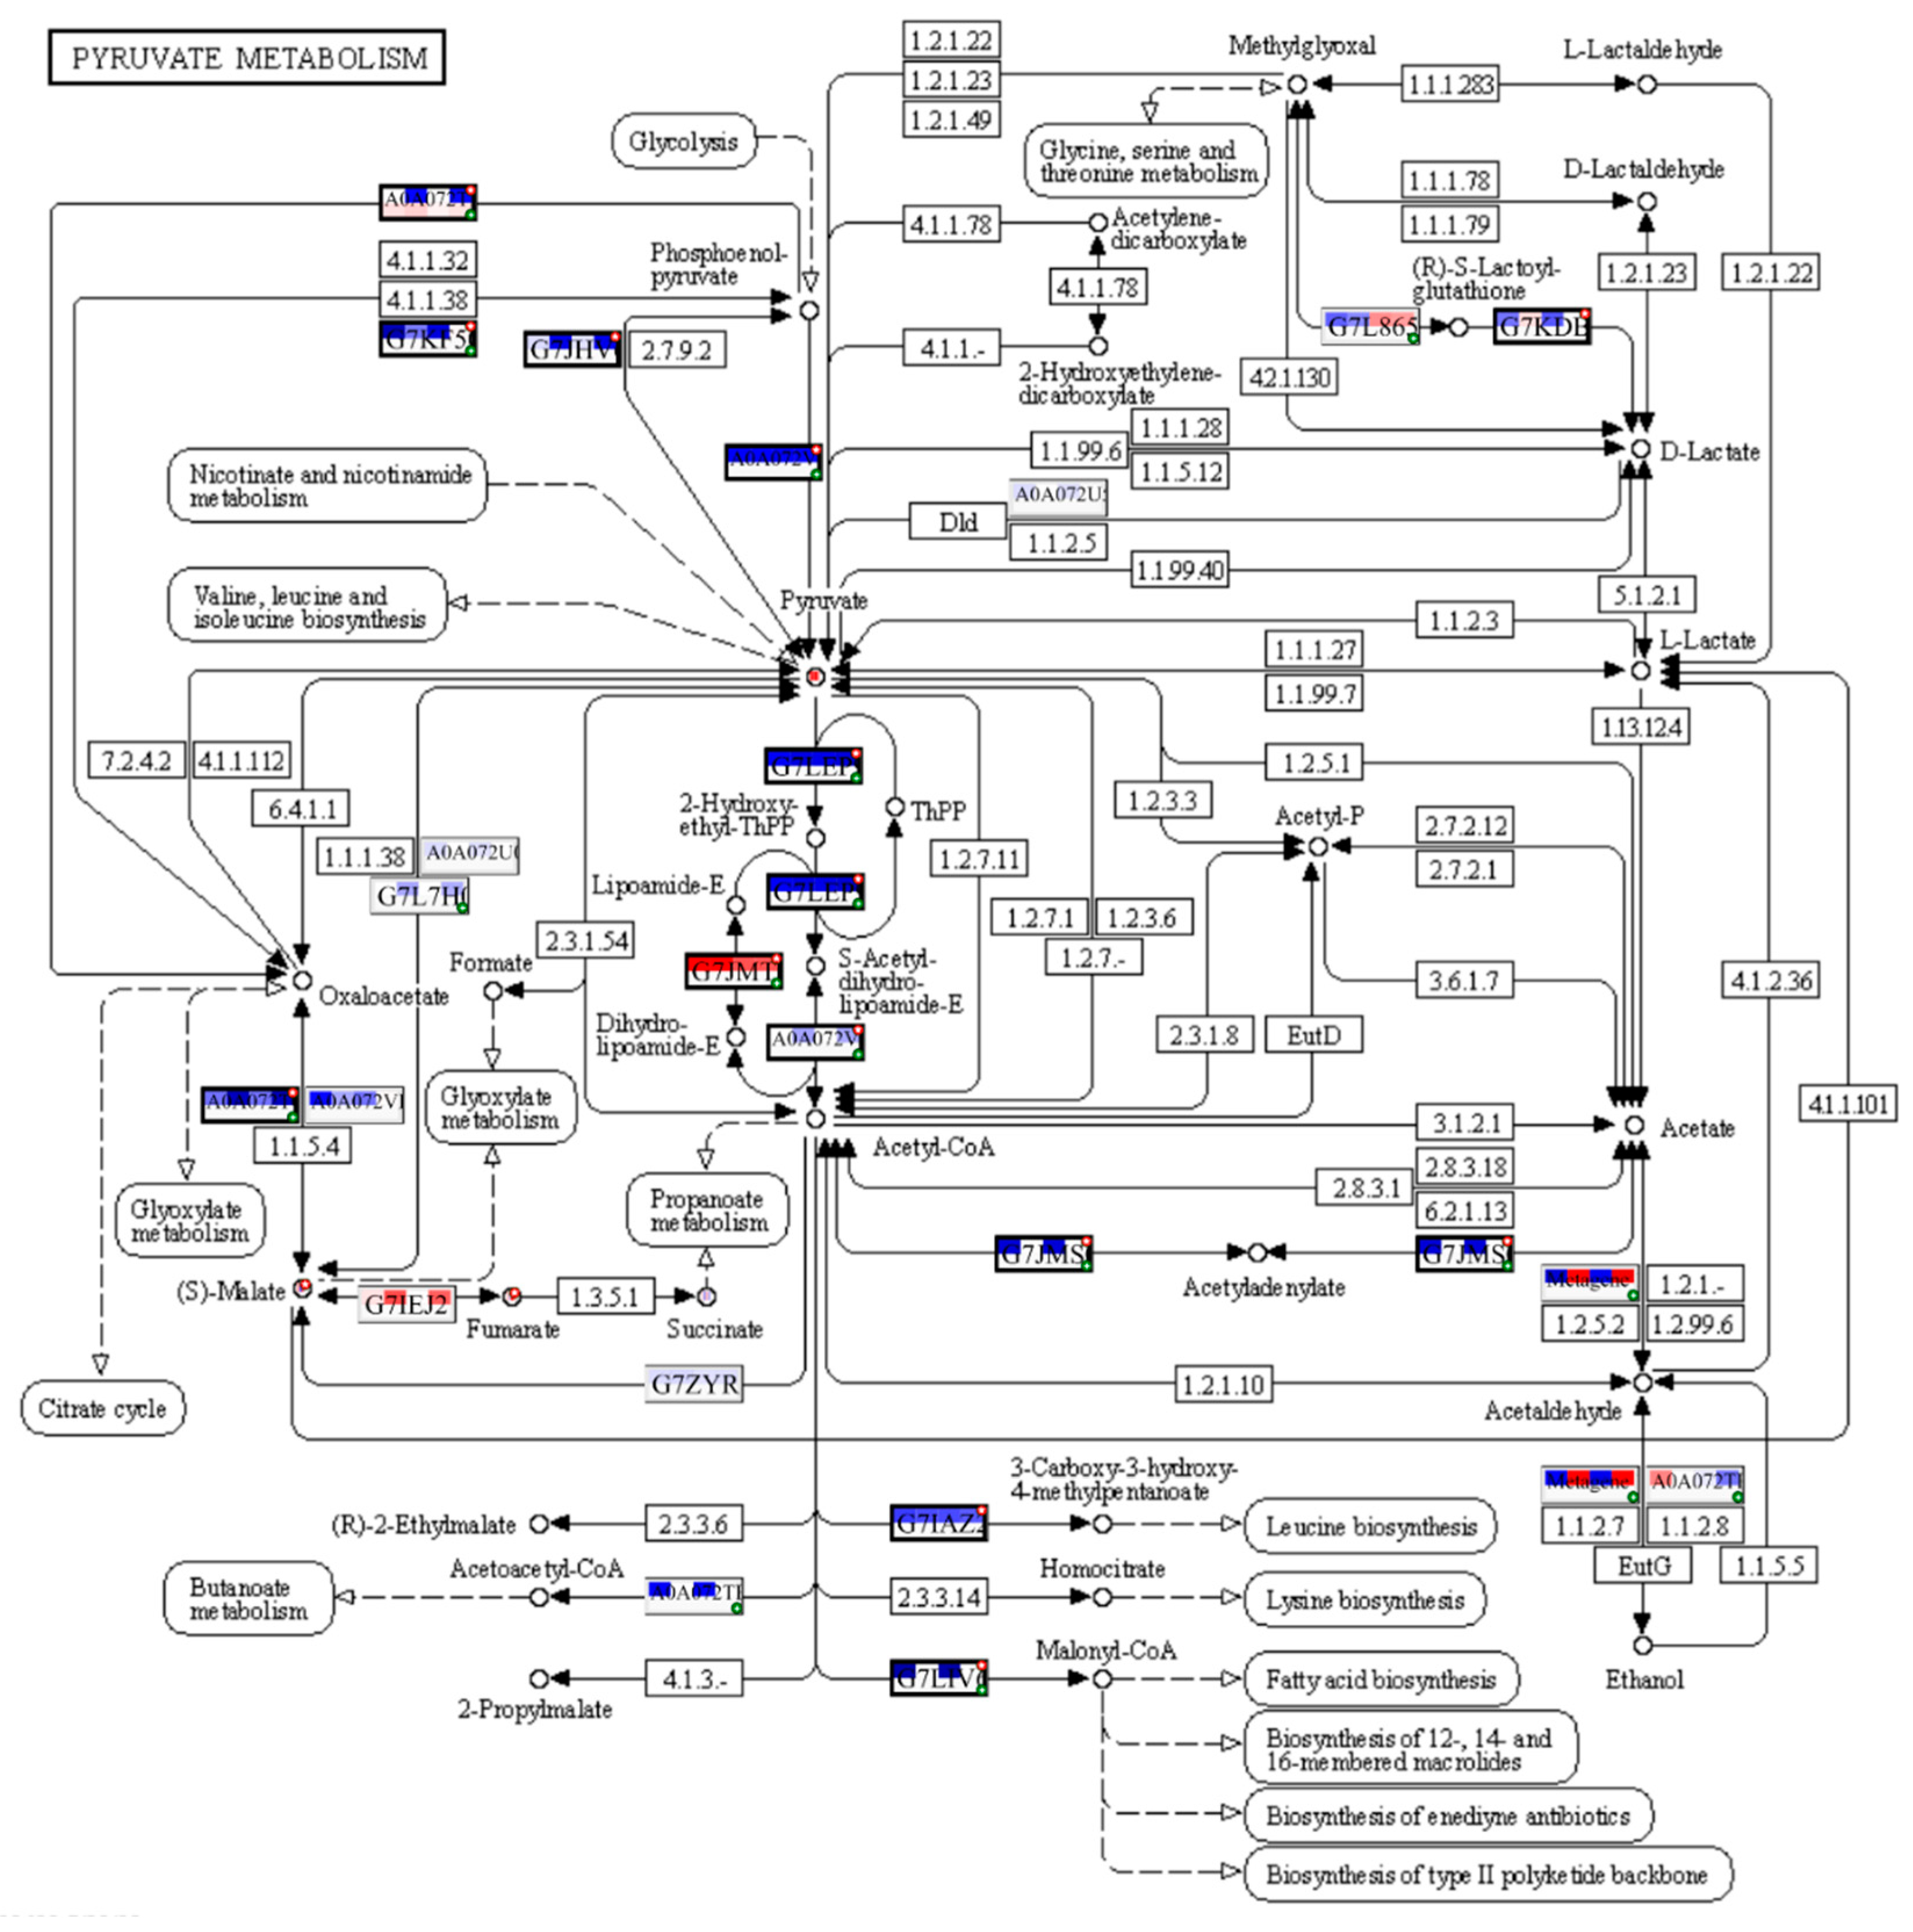
Figure 10.
Enrichment for photosynthetic processes in input datasets (A – antenna proteins; B – electron transport chain). Each Uniprot entry is divided by four squares, each representing a log2FC for a comparison between contaminated and reference plots, from left to right: K x B, K x L, M x B, M x L. The top line of the Uniprot entry is transcriptomic input, bottom part – is proteomic. The blue colour of a square reflects downregulation and red – upregulation. If a biological feature is significant for any of the omics data layers, it is highlighted by a thicker border and a red mark at the top right corner. A single databox can represent one or more biological features, where only the entry of the most significant feature will be shown. In this case, one or more hidden features that share functions or contribute equally to the biological process is indicated by a green mark in the bottom right corner. The Figure is created with PaintOmics 4.
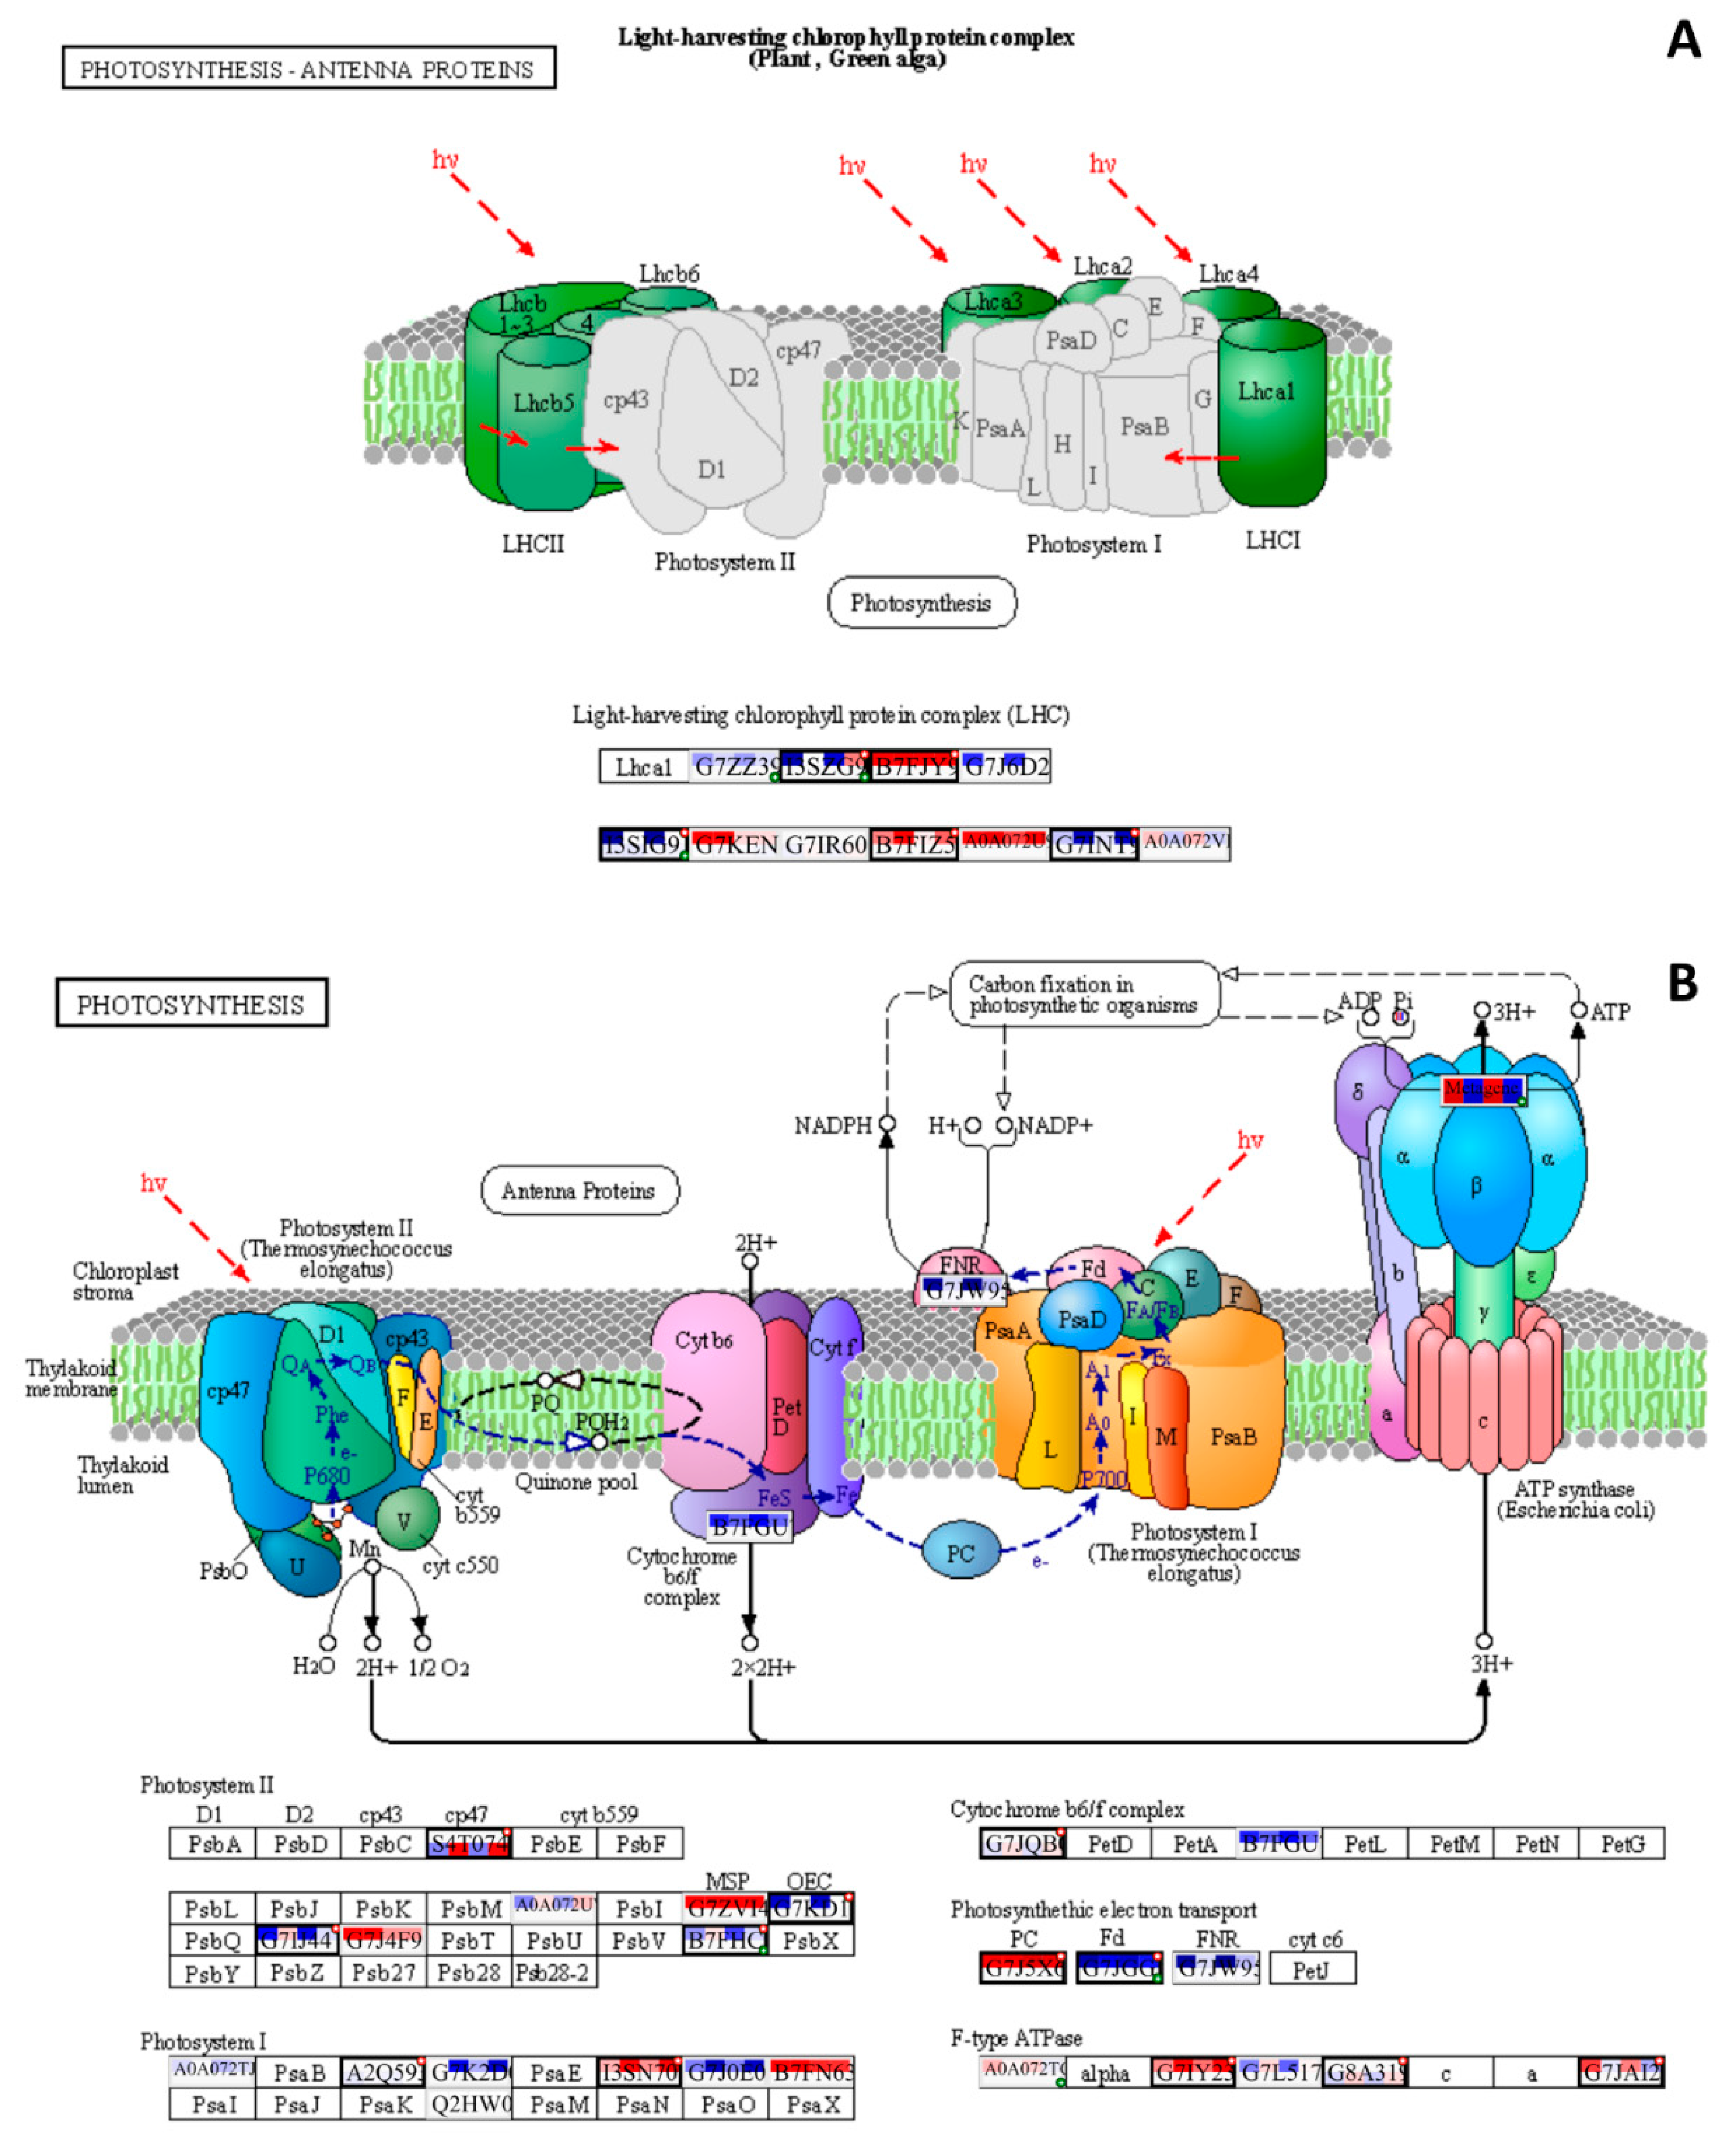

Table 1.
Radioactive contamination of experimental plots.
| Experimental plots | Plot type | GPS coordinates |
Ambient dose rate (γ) μSv x h-1 |
α-particles flux density min-1 x sm-2 |
β-particles flux density min-1 x sm-2 |
Specific activity of 137Cs in soil Bq × kg−1 | Specific activity of 90Sr in soil Bq × kg−1 |
|---|---|---|---|---|---|---|---|
| Babchin (Bab, B) |
Reference | N 51º47’29.43" E 30º00’03.86" |
0.33 | 0.4 | 4.7 | 126 ± 4.5 | 9.86 ± 1.6 |
| Lomysh (Lom, L) |
Reference | N 51º49’50.56" E 29º34’37.03" |
0.35 | 2.5 | 2.4 | 1027 ± 30 | 16.09 ± 2.6 |
| Kulazhin (Kul, K) |
Polluted | N 51º35’02.83" E 30º04’56.76" |
0.60 | 42.0 | 31.0 | 36990 ± 935 | 1396.6 ± 209.8 |
| Masany (Mas, M) |
Polluted | N 51º30’22.36" E 30º00’56.86" |
3.20 | 38.7 | 47.2 | 9587 ± 246 | 1598.5 ± 240.1 |
Table 2.
Soil properties of the experimental plots.
| Experimental plots | pH | HA | TEB | Humus | Av. P2O5 | Av. K2O | Av. Ca | Av. Mg | Av. Na |
|---|---|---|---|---|---|---|---|---|---|
| mg-eqv per 100 | % | mg/kg | mg-eqv per 100 g | ||||||
| Babchin (Bab, B) |
6.4 | 0.90 ± 0.01 | 6.1 ± 0.7 | 1.17 ± 0.01 | 210.7 ± 5.2 | 91.0 ± 1.0 | 3.41 ± 0.20 | 0.85 ± 0.02 | 0.61 ± 0.04 |
| Lomysh (Lom, L) |
5.5 | 1.58 ± 0.02 | 3.1 ± 0.1 | 1.78 ± 0.04 | 209.1 ± 5.2 | 38.7 ± 0.1 | 2.49 ± 0.08 | 0.53 ± 0.01 | 0.57 ± 0.02 |
| Kulazhin (Kul, K) |
4.6 | 7.04 ± 0.07 | 6.2 ± 0.4 | 5.28 ± 0.07 | 337.1 ± 6.4 | 47.5 ± 0.7 | 5.13 ± 0.01 | 2.09 ± 0.02 | 1.18 ± 0.14 |
| Masany (Mas, M) |
5.5 | 3.71 ± 0.08 | 7.6 ± 0.2 | 2.67 ± 0.02 | 943.2 ± 19.9 | 153.5 ± 2.6 | 5.06 ± 0.19 | 0.79 ± 0.01 | 0.64 ± 0.05 |
Note: HA—hydrolytic acidity; TEB—total exchangeable bases; Av.—available.
Table 3.
GO terms for shared DEGs from both radioactively contaminated plots compared to both controls.
Table 3.
GO terms for shared DEGs from both radioactively contaminated plots compared to both controls.
| Upregulated | Downregulated | ||
|---|---|---|---|
| GO:0000786 | nucleosome | GO:0009793 | embryo development ending in seed dormancy |
| GO:0003677 | DNA binding | GO:0009534 | chloroplast thylakoid |
| GO:0046982 | protein heterodimerisation activity | GO:0009506 | plasmodesma |
| GO:0009507 | chloroplast | ||
| GO:0009941 | chloroplast envelope | ||
| GO:0009570 | chloroplast stroma | ||
| GO:0009536 | plastid | ||
| GO:0009706 | chloroplast inner membrane | ||
| GO:0000325 | plant-type vacuole | ||
| GO:0003729 | mRNA binding | ||
Table 4.
Fifty most deregulated genes in both experimental plots.
| DOWNREGULATED GENES | ||||||
|---|---|---|---|---|---|---|
| Uniprot ID | Physiological process | Description | Log2FC | |||
| B | L | |||||
| M | K | M | K | |||
| TKTC_CRAPL | Photosynthesis, the Calvin cycle | Transketolase, chloroplastic | -11.6 | -9.8 | -10.4 | -10.4 |
| RBS_MEDSA | Ribulose bisphosphate carboxylase small subunit, chloroplastic | -11.5 | -11.7 | -9.8 | -9.7 | |
| KPPR_MESCR | Phosphoribulokinase, chloroplastic | -10.6 | -9.8 | -9.1 | -9.9 | |
| RCA1_LARTR | Ribulose bisphosphate carboxylase/oxygenase activase 1, chloroplastic | -10.1 | -9.2 | -10.1 | -9.0 | |
| GLGS2_VICFA | Glucose-1-phosphate adenylyltransferase small subunit 2, chloroplastic | -10.0 | -10.6 | -6.7 | -6.3 | |
| PGL1B_ARATH | Photosynthesis, light-dependent reactions | Ferredoxin-plastoquinone reductase | -10.6 | -10.7 | -9.1 | -9.2 |
| FTSI1_ARATH | Chlorophyll biosynthesis | FtsH extracellular protease family | -10.1 | -10.1 | -6.9 | -7.0 |
| CHLM_ARATH | Magnesium-protoporphyrin IX methyltransferase | -10.1 | -10.1 | -6.9 | -7.0 | |
| CHLP_ARATH | Pyridine nucleotide-disulfide oxidoreductase family protein | -10.8 | -10.8 | -7.4 | -7.6 | |
| THI4_CITSI | Thiamine biosynthesis | Thiamine thiazole synthase, chloroplastic-like | -11.0 | -10.9 | -8.1 | -8.3 |
| PUR5_VIGUN | Phosphoribosylformylglycinamidine cyclo-ligase, chloroplastic/mitochondrial | -10.7 | -10.6 | -7.0 | -7.1 | |
| SYWM_ARATH | Translation | Nucleotidylyl transferase superfamily protein | -10.6 | -10.5 | -7.3 | -7.4 |
| RS6_ASPOF | 40S ribosomal protein S6 | -10.1 | -10.3 | -8.4 | -8.6 | |
| IF5A_SENVE | Eukaryotic translation initiation factor 5A | -10.2 | -10.2 | -8.1 | -8.3 | |
| HSP11_PEA | Stress response | 18.1 kDa class I heat shock protein | -10.9 | -10.9 | -8.8 | -9.0 |
| STEP1_ARATH | Stress-enhanced protein 1 | -10.5 | -11.0 | -6.5 | -7.1 | |
| ROC5_NICSY | RNA processing | 33 kDa ribonucleoprotein, chloroplastic | -11.2 | -11.1 | -8.4 | -8.9 |
| STR9_ARATH | Sulphur metabolism | Rhodanese-like domain-containing protein 9, chloroplastic | -11.2 | -11.1 | -6.9 | -7.1 |
| ISPE_SOLLC | Secondary metabolism | 4-diphosphocytidyl-2-C-methyl-D-erythritol kinase, chloroplastic/chromoplastic | -10.9 | -8.0 | -9.0 | -6.5 |
| LRX4_ARATH | Cell wall | Leucine-rich repeat (LRR) family protein | -10.9 | -10.8 | -7.0 | -7.2 |
| SNAT2_ORYSJ | Melatonin biosynthesis | Serotonin N-acetyltransferase 2, chloroplastic-like | -10.7 | -8.6 | -7.1 | -6.9 |
| CP31A_ARATH | Telomere elongation | 31-kDa RNA binding protein | -10.7 | -11.6 | -9.3 | -9.6 |
| PGKH_WHEAT | Glycolysis | Phosphoglycerate kinase, chloroplastic-like | -10.3 | -10.2 | -8.6 | -8.8 |
| FT_ARATH | Flowering | Protein FLOWERING LOCUS T | -10.1 | -9.2 | -9.1 | -8.9 |
| CNIH4_ARATH | Vesicle-mediated transport | Cornichon family protein | -10.0 | -9.9 | -7.8 | -7.9 |
| CEP1_ARATH | Programmed cell death | Cysteine proteinases superfamily protein | 10.3 | 7.1 | 9.3 | 7.1 |
| PER72_ARATH | Antioxidant system | Peroxidase superfamily protein | 9.6 | 6.0 | 7.4 | 6.0 |
| PERE5_ARMRU | Peroxidase E5 | 9.1 | 6.4 | 8.2 | 6.5 | |
| LECS_VATGU | Defence response | Seed lectin | 9.4 | 7.7 | 8.7 | 7.7 |
| GUN4C_ARATH | Chlorophyll synthesis | Tetrapyrrole-binding protein, chloroplastic | 9.2 | 8.2 | 7.6 | 8.2 |
| ASPG_LUPAL | Protein catabolism | Isoaspartyl peptidase/L-asparaginase | 9.4 | 5.8 | 7.3 | 5.8 |
| UBP21_ARATH | Ubiquitin-specific protease 21 | 9.4 | 6.0 | 8.5 | 6.0 | |
| RS31_CANAL | Ubiquitin-ribosomal 40S subunit protein S31 fusion protein | 8.8 | 6.9 | 8.7 | 6.9 | |
| UFSP_ORYSJ | Probable Ufm1-specific protease | 8.7 | 5.2 | 5.4 | 5.2 | |
| FB330_ARATH | F-box protein | 10.1 | 8.6 | 9.1 | 8.6 | |
| TI10A_ORYSJ | Phytohormones | Protein TIFY 10a-like (jasmonate response) | 8.8 | 6.6 | 5.7 | 6.7 |
| AHP2_ARATH | Histidine-containing phosphotransmitter 2(cytokinin response) | 8.8 | 5.9 | 6.2 | 5.9 | |
| ILL1_ORYSI | IAA-amino acid hydrolase ILR1-like 1(auxin response) | 8.7 | 6.1 | 5.6 | 6.1 | |
| XRN2_ARATH | RNA processing | Exoribonuclease 2 | 9.6 | 6.8 | 7.2 | 6.8 |
| C3H54_ORYSJ | Zinc finger CCCH domain-containing protein 54-like | 8.7 | 7.8 | 8.7 | 7.8 | |
| PP182_ARATH | Pentatricopeptide repeat (PPR) superfamily protein | 8.6 | 6.6 | 6.4 | 6.6 | |
| GLSN_MEDSA | Nitrogen assimilation | Glutamate synthase [NADH], amyloplastic | 9.0 | 6.6 | 6.0 | 6.6 |
| LHCA2_ARATH | Chloroplast biogenesis | Photosystem I light-harvesting complex protein | 9.0 | 6.5 | 6.6 | 6.5 |
| IQD32_ARATH | Transport | IQ-domain 32 | 8.9 | 5.9 | 6.5 | 5.9 |
| PITC_DICDI | Phosphatidylinositol transfer protein 3 | 8.8 | 5.9 | 8.0 | 5.9 | |
| MED7A_ARATH | Transcription | Mediator complex, subunit Med7(AT5G03220) | 8.9 | 6.7 | 7.1 | 6.7 |
| H4_SOYBN | Histone | Histone H4 | 8.8 | 6.8 | 5.9 | 6.8 |
| PALY_MEDSA | Secondary metabolism | Phenylalanine ammonia-lyase | 8.8 | 7.2 | 9.6 | 7.3 |
| TOP3A_ARATH | Cell cycle | Topoisomerase 3-alpha | 9.5 | 6.6 | 7.2 | 6.6 |
| CCNB1_MEDSA | G2/mitotic-specific cyclin-1 | 8.6 | 8.2 | 8.8 | 8.2 | |
Table 5.
Metabolites with significantly different concentrations in samples from control (L+B) and contaminated plots (K, M).
Table 5.
Metabolites with significantly different concentrations in samples from control (L+B) and contaminated plots (K, M).
| Metabolite | F value (ANOVA) | FDR | Fisher’s LSD |
|---|---|---|---|
| Allantoin | 55.705 | 5.84 × 10⁻⁴ | Mas > Control; Mas > Kul |
| O-methyl-inositol | 21.045 | 4.05 × 10⁻² | Mas > Control; Mas > Kul |
| Citrate | 20.873 | 4.05 × 10⁻² | Control > Kul; Control > Mas |
| Inositol-3-phosphate | 18.018 | 5.72 × 10⁻² | Mas > Control; Mas > Kul |
| Fumarate | 17.492 | 5.72 × 10⁻² | Mas > Control; Mas > Kul |
| Hydrangeifolin | 16.433 | 6.39 × 10⁻² | Kul > Control; Kul > Mas |
| Tyrosine | 14.835 | 8.76 × 10⁻² | Kul > Control; Kul > Mas |
| Raffinose | 13.806 | 9.28 × 10⁻² | Control > Kul; Control > Mas |
| Maltose | 13.706 | 9.28 × 10⁻² | Kul > Control; Kul > Mas |
| Pinitol | 13.519 | 9.28 × 10⁻² | Kul > Control; Mas > Control; Mas > Kul |
| Arabinose | 12.781 | 1.07 × 10⁻¹ | Kul > Control; Kul > Mas |
| Malonate | 12.547 | 1.07 × 10⁻¹ | Mas > Control; Mas > Kul |
| Benzyl glucopyranoside | 11.172 | 0.016 | Kul > Control; Kul > Mas |
| Pyruvate | 9.4194 | 0.029 | Kul > Control; Kul > Mas |
| Nicotinate | 8.5022 | 0.039 | Kul > Control; Mas > Control |
| Lactitol | 8.4345 | 0.039 | Kul > Control; Mas > Control |
| Phenethyl glycosides | 8.2561 | 0.040 | Kul > Control; Kul > Mas |
| Ribose | 7.9636 | 0.043 | Kul > Control; Kul > Mas |
| Galactosylglycerol | 7.4886 | 0.049 | Mas > Control; Mas > Kul |
| Galactinol | 7.4159 | 0.049 | Control > Kul; Control > Mas |
Table 6.
Genes for qRT-PCR analysis.
| Gene (Arabidopsis thaliana) | AGI | Protein | Function |
|---|---|---|---|
| APX1 | AT1G07890 | Cytosolic ascorbate peroxidase APX1 | Antioxidant |
| CAB1 | AT1G29930 | Light harvesting complex subunit II (LHCII) | Photosynthesis |
| RBOH-F | AT1G64060 | Respiratory burst oxidase homologue F | Response to ABA and ROS |
| Hy-5 | AT5G11260 | Transcription factor HY5 | |
| PIP1 | AT3G61430 | Plasma membrane intrinsic protein 1 | Aquaporin |
| TIP1 | AT2G36830 | Tonoplast intrinsic protein 1 | |
| CPN60А | AT2G28000 | Chaperonin 60-α | Protein folding |
| CPN20 | AT5G20720 | Chloroplast chaperonin 20 | |
| H2B | AT5G22880 | Histone 2B | Nucleosome assembly |
Disclaimer/Publisher’s Note: The statements, opinions and data contained in all publications are solely those of the individual author(s) and contributor(s) and not of MDPI and/or the editor(s). MDPI and/or the editor(s) disclaim responsibility for any injury to people or property resulting from any ideas, methods, instructions or products referred to in the content. |
© 2023 by the authors. Licensee MDPI, Basel, Switzerland. This article is an open access article distributed under the terms and conditions of the Creative Commons Attribution (CC BY) license (https://creativecommons.org/licenses/by/4.0/).
Copyright: This open access article is published under a Creative Commons CC BY 4.0 license, which permit the free download, distribution, and reuse, provided that the author and preprint are cited in any reuse.


