Submitted:
25 June 2025
Posted:
26 June 2025
You are already at the latest version
Abstract
Lard imparts unique organoleptic properties that underpin its essential role in Chinese gastronomy; however, the specific lipid precursors contributing to its aroma remain unclear. This study explores the flavor formation mechanism of lard by comparing its texture and aroma at two preparation temperatures, 130 ℃ and 100 ℃. We identified a total of 256 and 253 lipids at these temperatures, respectively, with triacylglycerols (TG) and diacylglycerols (DG) being the predominant lipid species. HS-GC-IMS analy-sis detected 67 volatile compounds, predominantly aldehydes, acids, and alcohols. Subsequent Orthogonal Partial Least Squares-Discriminant Analysis (OPLS-DA) iden-tified 49 discriminatory lipids and 20 differential volatiles. Correlation analysis showed a positive relationship between aldehydes and unsaturated triglycerides in lard, with TG (16:1-16:1-18:0), TG (17:2-18:1-18:1), TG (16:1-17:1-18:1), and TG (18:1-18:1-20:1) identified as characteristic markers at both temperatures. Furthermore, there was a positive correlation between ketones and alcohols and phospholipids and sphingolipids containing unsaturated fatty acid chains. TGs and glycerophospholipids (GP), rich in polyunsaturated fatty acids, are likely key precursors driving the for-mation of distinct flavors during lard processing. This study elucidates the mechanistic interactions between lipids and volatile organic compounds, providing a framework for optimizing lard processing protocols and flavor modulation.
Keywords:
lard
; lipid
; volatile compounds
Abstract
Lard imparts unique organoleptic properties that underpin its essential role in Chinese gastronomy; however, the specific lipid precursors contributing to its aroma remain unclear. This study explores the flavor formation mechanism of lard by comparing its texture and aroma at two preparation temperatures, 130 ℃ and 100 ℃. We identified a total of 256 and 253 lipids at these temperatures, respectively, with triacylglycerols (TG) and diacylglycerols (DG) being the predominant lipid species. HS-GC-IMS analysis detected 67 volatile compounds, predominantly aldehydes, acids, and alcohols. Subsequent Orthogonal Partial Least Squares-Discriminant Analysis (OPLS-DA) identified 49 discriminatory lipids and 20 differential volatiles. Correlation analysis showed a positive relationship between aldehydes and unsaturated triglycerides in lard, with TG (16:1-16:1-18:0), TG (17:2-18:1-18:1), TG (16:1-17:1-18:1), and TG (18:1-18:1-20:1) identified as characteristic markers at both temperatures. Furthermore, there was a positive correlation between ketones and alcohols and phospholipids and sphingolipids containing unsaturated fatty acid chains. TGs and glycerophospholipids (GP), rich in polyunsaturated fatty acids, are likely key precursors driving the formation of distinct flavors during lard processing. This study elucidates the mechanistic interactions between lipids and volatile organic compounds, providing a framework for optimizing lard processing protocols and flavor modulation.
1. Introduction
Lard, a conventional cooking fat, contains abundant essential fatty acids, including arachidonic acid, as well as various fat-soluble vitamins vital for human health. It has a low content of trans fatty acids and a relatively high melting point (28–48℃) [1]. Its unique flavor and wide plasticity range [2] make it a preferred ingredient in the food industry, especially in baked goods such as crackers and bread, as well as in shortening production [3,4,5].
Lard’s physicochemical characteristics and compositional integrity are critically determined by the extraction methodology employed. Traditional extraction techniques include dry and wet rendering. Dry rendering, carried out at 115–140℃ without water, facilitates easier separation and extrusion of lard residues, producing a darker product with more intense flavor compounds [6]. In contrast, wet rendering involves processing with water at around 100℃, resulting in a milder, more neutral flavor due to gentler conditions. Although newer methods such as enzymatic and ultrasound-assisted extraction have been developed [7], dry and wet rendering remain the dominant techniques in lard production. These methods yield lard with distinct flavor profiles and physicochemical characteristics, which influence consumer preferences and market competitiveness. Dry-rendered lard, known for its strong flavor, is widely used in Chinese cuisine, while wet-rendered lard—with its subtler taste—is better suited for products requiring less pronounced flavor, such as shortenings and pastries. Wang et al. reported that dry-rendered lard had a higher acid value than wet-rendered lard, although differences in raw materials and processing methods were also noted [8].
Food flavor profiling routinely employs hyphenated techniques including electronic nose, GC-MS, and GC-O-MS technology for compound identification and sensory correlation [9]. Lipid composition governs aromatic compound formation, with specific fatty acid profiles dictating volatile generation pathways. Gas chromatography-ion mobility spectrometry (GC-IMS) has recently become popular for analyzing and monitoring volatile flavor compounds in food thanks to its advantages: no sample pretreatment required, high sensitivity, rapid detection, excellent separation efficiency, and visualized results [10,11,12]. Thermal processing of lard induces hydrogen abstraction from unsaturated fatty acid alkyl chains, triggering oxidation pathways that yield hydroperoxides as primary reaction products [13]. These hydroperoxides undergo spontaneous decomposition, generating organic compounds such as ketones, aldehydes, carboxylic acids, alcohols, esters, and hydrocarbons [14]. Xu et al. [15] identified unsaturated aldehydes as the main volatile compounds produced during lard oxidation. Key flavor components in heat-treated lard include hexanal, (E)-2-heptenal, pentanal, and nonanal [16,17,18].
Lard is primarily composed of glycerides, and its lipid precursors can generate volatile flavor compounds through Maillard reactions and lipid oxidation. Fatty acid saturation indices and concentration profiles govern volatile compound formation [19]. Lipidomic has been widely applied in food science for the identification and comprehensive analysis of lipids [20,21], enabling deeper insights into the roles and potential mechanisms of lipid molecules in biological processes [22]. Previous studies have identified triglycerides such as TG (16:0-18:1-18:1), TG (16:0-16:1-18:1), and TG (16:0-18:1-18:2) as important precursors in flavor formation in beef [23], and potentially in the aroma of roasted pork as well [24]. However, comparative studies on lipid composition between dry- and wet-rendered lard are limited, and research on how lipid composition changes relate to flavor compound formation remains scarce. In this research, lipid composition and volatile substances in lard were characterized using ultra-performance liquid chromatography combined with quadrupole time-of-flight mass spectrometry (UPLC-Q-TOF-MS) and headspace gas chromatography-ion mobility spectrometry (HS-GC-IMS). By multivariate statistical analysis, we systematically investigated the differences in volatile components and identified key differential compounds, providing a novel methodological framework for evaluating lard quality and flavor.
2. Materials and Methods
2.1. Materials and reagents
Abdominal adipose tissue from Great Yorkshire pigs, sourced from Henan Province, was collected and stored at −20 ℃. 1,2-Dichlorobenzene (99%, used as an internal standard) and a series of n-alkanes (C6–C25, for retention index calibration) were purchased from Sigma-Aldrich (St. Louis, MO, USA). Ether, potassium hydroxide, isopropanol, potassium iodide, chloroform, acetic acid, phenolphthalein, and sodium thiosulfate were obtained from Shanghai Aladdin Biochemical Technology Co., Ltd. (Shanghai, China).
2.2. Preparation of lards
Different lard rendering technology:
For the dry rendering method, adipose tissue was minced into 1 cm³ pieces and simmered (130 ± 5 ℃, 20 min) on an induction heating platform with continual manual agitation. The rendered fat was then cooled to 55 ℃, and the liquid portion was collected and stored at −20 ℃.
For the wet rendering method, adipose tissue was sectioned into 2-cm³ cubes, thermally processed in water (1:1 mass ratio) at 100 °C under atmospheric pressure, with subsequent fat isolation via solid-residue filtration through medical gauze. Each method was performed in triplicate to ensure reproducibility.
2.3. Determination of peroxide value (PV), acid value (AV)) and Water Content
Based on safety control considerations during lard rendering, the PV, AV and water content of the lards were conducted according to the method [25].
2.4. HS-GC-IMS analysis of lard
Accurately transfer 2.0 ± 0.1 g of the sample into a 20-mL headspace vial. Add 10 μL of a 100 ppm 2-methyl-3-heptanone internal standard solution as a spike. Prior to performing triplicate GC injections, equilibrate the vial at 60°C for 20 minutes to ensure uniform distribution of volatile components.
The sample was then put through an incubation process at a temperature of 60°C for 20 minutes. The system received an injection of 500 μL during this step, and the injection was performed in non-split mode. During incubation, the shaking speed was kept at 500 rpm and the injection needle was maintained at a constant temperature of 85 °C. The column was maintained at a constant temperature of 60 °C during the chromatographic analysis, and high-purity nitrogen gas (≥ 99.999%) was used as the carrier gas. The flow rate programmer was as follows: initially held at 2.0 ml/min for 2 min; increased linearly to 10.0 ml/min over 8 min; increased further linearly to 100.0 ml/min over the next 10 min; and finally held at 100.0 ml/min for the final 10 min. The total runtime of the chromatographic analysis was 30 minutes, with an inlet temperature of 80 °C.
Ionization was achieved using a tritium (³H) source. The migration tube measured 53 mm in length and operated at an electric field strength of 500 V/cm. The tube was kept at a temperature of 45 °C and a flow rate of 75.0 mL/min of high-purity nitrogen (≥99.999%) was used as the drift gas in positive ion mode. Retention indices were calculated based on retention time and identified using the GC retention index database (NIST 2014) integrated into Vocal software, in combination with IMS migration time for compound comparison. Target compounds were analyzed using the Gallery Plot, and Dynamic PCA plug-ins within the Vocal data processing suite.
2.5. Sensory evaluation method of lard
A sensory evaluation panel comprising five female and five male members from the Shanghai Institute of Technology assessed the aroma characteristics of lard prepared using different rendering methods. Aroma attributes—including deep-fat frying, fatty, roasted, earthy, and fecal notes-were described and scored according to the methodology outlined in [17]. All evaluations were conducted in a standardized sensory evaluation laboratory.
Following randomization via 3-digit codes, lard samples in amber-sealed vials underwent 30-min headspace equilibration at 50°C. Quantitative Descriptive Analysis (QDA) was performed: panelists scored aroma attributes (10-point intensity scale) through sequential monadic presentation. Inter-replicate validation was conducted.
2.6. Electronic nose evaluation method for lard
Weigh out precisely 5 g of lard into a 20 mL headspace vial, following placement on the e-nose sampling tray, analysis commenced under controlled operational conditions: headspace incubation 60 °for 20 minutes, oscillation speed of 500 r/min, total signal acquisition time of 110 seconds, and signal frequency of 0.01 seconds. Dry air was used as the carrier gas, with an injection volume of 5.0 mL at a rate of 125 µL/s and a flow rate of 1 µL/min. The response values from 18 sensors, which reflect the aromatic characteristics of the sample, are detailed in Table S1.
2.7. Determination of lipid composition for lard
Vortex 20 mg lard with 200 μL H₂O and 480 μL MTBE/MeOH (5:1, v/v) for 2 min in a glass tube. Vortex for 30 seconds, sonicate in an ice water bath for 10 minutes, then incubate at –40 °C for 1 hour. Centrifuge at 3000 rpm and 4 °C for 15 minutes. Vacuum-dry 300 μL of the supernatant at low temperature, then reconstitute the dried sample in 4 mL of resuspension buffer (DCM:MeOH: H₂O = 60:30:4.5, v/v/v). Vortex the sample in ice water for 30 seconds and sonicate for 10 min. The centrifuge should be run again at a temperature of 4 °C and a rotational speed of 12,000 rpm, then transfer the supernatant to a new glass vial for LC/MS analysis. Prepare a quality control sample by combining aliquots of the supernatant from each sample and mixing thoroughly.
Lipid profiling was conducted using an Orbitrap Explores 120 mass spectrometer (Thermon Fisher Scientific) coupled to a Vanquish ultra-high-performance liquid chromatography (UHPLC) system from the same manufacturer. Chromatographic separation was achieved on a Phenomenex Kinetics C18 column (2.1 × 100 mm, 2.6 μm particle size). The mobile phase consisted of solvent A: 10 mM ammonium format in a water/acetonitrile mixture (6:4, v/v), and solvent B: 10 mM ammonium format in isopropanol/acetonitrile (9:1, v/v). Electrospray ionization (ESI) settings included a sheath gas flow rate of 30 arbitrary units, auxiliary gas at 10 units, a capillary temperature of 320 °C, and a spray voltage of ±3.8 kV in positive mode and –3.4 kV in negative mode. The full scan MS was operated at a resolution of 60,000, whereas the MS/MS resolution was set at 15,000. Stepped normalized collision energy (NCE) values of 15%, 30%, and 45% were applied during the analysis.
2.8. Statistical Analysis
The mean and standard deviation of the results from the two samples tested three times were calculated. Data were analyzed using SPSS 2022 (p<0.05). Origin 2022 and MetaboAnalyst 6.0 facilitated multivariate analyses, specifically OPLS-DA modeling and (Variable Importance in Projection) VIP metric calculation. Pearson correlation coefficients quantified lipid-aroma compound relationships. Use Hiplot to generate heat maps and related maps (https://hiplot.com.cn).
3. Results and Discussion
3.1. Critical quality parameters of lard: Acid value, peroxide value and water content
The preparation of lard is highly dependent on processing temperature. According to oil and fat standards, to ensure oil quality, specific limits are set for AV, PV, and moisture content: AV must be ≤ 2.5 mg/g, PV ≤ 0.2 g/100 g, and moisture ≤ 0.2%. As shown in Table 1, the lard samples analyzed meet these requirements. The AV reflects the free fatty acid content, which mainly results from the hydrolytic or oxidative breakdown of triglycerides in fats and oils. The PV measures the primary oxidation products and serves as a key indicator of the initial oxidation state; a higher PV indicates more extensive oxidation [26]. Significant differences (p < 0.05) in both AV and PV were observed in lard processed at 130 ℃ compared to 110 ℃. This is attributed to the increased reactivity of polyunsaturated fatty acids at elevated temperatures, where free radicals induce hydroperoxide formation, thus raising the peroxide value [27]. Additionally, higher temperatures accelerate triglyceride hydrolysis, leading to increased free fatty acids and, consequently, a higher AV [28]. These findings are consistent with Guo’s study on tallow extraction [29] and Liu’s research on pomegranate seed oil extraction [30].
3.2. HS-GC-IMS analysis of lard
3.2.1. HS-GC-IMS spectrum analysis
To compare the volatile components of lard processed under different conditions, a two-dimensional topographic plot with a blue background was generated using HS-GC-IMS (Figure 1). A red vertical line at 1.0 on the horizontal axis indicates the reactive ion peak (RIP, normalized). Each spot near the RIP corresponds to a volatile compound, with the presence, absence, and color intensity of these spots reflecting the degree of accumulation or degradation. The color gradient from white to red corresponds to increasing concentration. The plot shows that most volatile compounds have retention times between 200 and 900 seconds and drift times ranging from 1.0 to 1.6. Some compounds appear similar in lard processed at both 130 ℃ and 110 ℃. Differences in signal intensities at these temperatures likely result from thermal degradation and oxidation reactions occurring during processing.
3.2.2. HS-GC-IMS fingerprint spectrum
The visual fingerprint of volatile compounds provides an intuitive and quantitative comparison of differences between samples. As demonstrated in Figure 2, each row of the figure corresponds to a sample, with each column representing a volatile component signal peak. Color block size and brightness directly correspond to peak intensity values, with chromatic progression from saturated dark to light hues indicating decreasing volatile concentrations. Figure 2 presents 67 different compounds detected using various processing methods, comprising 64 known and 3 unidentified compounds. Among these, 34 compounds were solely observed as monomers, while 15 existed in both monomeric and dimeric forms. Despite similar overall profiles, the volatile compound levels varied between the two samples. Specifically, the wet-rendered lard (WL), prepared at 100 ℃, showed higher signal intensities for five substances compared to the dry-rendered lard (DL) prepared at 130 ℃. Conversely, DL had higher levels of 54 compounds, including 2 acids, 17 aldehydes, 12 alcohols, 9 ketones, and 4 others. Notably, total signals for aldehydes and alcohols—key contributors to flavor and aroma—were more pronounced in lard prepared at 130 ℃ than at 100 ℃.
3.2.3. Qualitative and Quantitative Analysis of HS-GC-IMS
HS-GC-IMS profiling of lard flavor compounds at differential temperatures (110°C, 130°C) centered on retention time and ion drift time parameters. As shown in Table 2, 67 volatile organic compounds were detected within the C2-C10 range, including 27 aldehydes, 16 alcohols, 12 ketones, 3 esters, 2 acids, 1 pyrazine, 1 furan, and 5 other compounds. Aldehydes, alcohols, and acids were the most abundant, accounting for 50.48%, 24.38%, and 12.39% of the dry-rendered (DL) lard at 130℃, and 42.01%, 29.32%, and 14.2% of the wet-rendered (WL) lard at 110℃, respectively. IMS discriminates electronegative analytes and Brønsted bases, with particular responsiveness to conjugated carbonyl volatile organic compounds [31], allowing differentiation between compound forms like monomers and dimers. Significant differences were observed in most volatile components, except for seven compounds-propionic acid, acetic acid, 2-ethyl-1-hexanol, ethanol-D, 3-methyl-1-butanol, methanol, and thiophene—which showed no significant variation (p > 0.05) between the two processing methods.
Aldehydes, which result from the auto-oxidation of unsaturated fatty acids, were found in higher concentrations in lard heated to 130℃ (1473.25 ± 11.8 μg/100 g) than at 110℃ (925.33 ± 9.09 μg/100 g) (p < 0.001). The primary unsaturated fatty acids in lard are oleic, linoleic, and linolenic acids. During oleic acid oxidation, four hydroperoxides (8, 9, 10, and 11) form, with hydroperoxides 10 and 11 breaking down into nonanal and octanal, respectively [32]. The nonanal content in DL at 130℃ (25.4 ± 0.58 μg/100 g) was significantly higher than at 110℃ (9.77 ± 0.71 μg/100 g) (p < 0.001). Similarly, octanal content at 130℃ (17.39 ± 0.33 μg/100 g) exceeded that at 110℃ (4.43 ± 0.35 μg/100 g) (p < 0.001). Linoleic acid undergoes auto-oxidation to form 11- and 13-linoleic acid hydroperoxides. The 11-hydroperoxides decompose into heptanal and (E)-2-octenal, while the 13-hydroperoxides cleave into pentanal and (E)-2-heptenal [33]. Oxidation of linolenic acid produces 12-, 13-, and 16-linolenic acid hydroperoxides. (E, E)-2,4-Heptadienal, a cleavage product of 12-linolenic acid hydroperoxides and a major contributor to lard aroma, was significantly higher in DL at 130℃ (13.04 ± 0.27 μg/100 g) than at 110℃ (11.07 ± 0.46 μg/100 g) (p < 0.01). (E)-2-Hexenal derives from cleavage of 13-linolenic acid peroxide, while propionaldehyde originates from 16-linolenic acid peroxide. These unsaturated aldehydes further oxidize to form short-chain aldehydes such as 3-methylbutanal [34]. DL contained significantly more octanal (16.84 ± 0.66 μg/100 g) than WL at 110℃ (0.69 ± 0.04 μg/100 g) (p < 0.001). Given their low aroma thresholds and high volatility, aldehydes contribute notably to oil flavor even at low concentrations. C3-C4 aldehydes typically emit a strong pungent odor, while C5-C9 aldehydes provide clean, oily, and fatty aromas, consistent with findings by Song [35] on lard and Yao et al.’s review of meat aroma compounds. The variations in these components probably account for the flavor discrepancies between the two types of lard [36].
Alcohols, as key volatile flavor compounds, are synthesized via the oxidation of fatty acids and the degradation of secondary hydroperoxides [37]. The total alcohol content in dry-rendered lard (DL) at 130℃ (711.57 ± 7.95 μg/100 g) was significantly higher than in wet-rendered lard (WL) at 100℃ (645.86 ± 3.73 μg/100 g) (p < 0.01). Among the identified alcohols, no significant differences (p > 0.05) were observed for 2-ethyl-1-hexanol, ethanol-D, ethanol-M, 3-methyl-1-butanol, and methanol. However, highly significant differences (p < 0.01) were found for 1-octen-3-ol, 1-heptanol, 1-hexanol, and 1-butanol-D. Even more pronounced differences (p < 0.001) were observed for tetrahydrolinalool, 1-pentanol-M, 1-pentanol-D, 1-pentan-3-ol, 1-butanol-M, 1-propanol, and 2-propanol. The formation pathways include 10-oleate hydroperoxides producing 1-heptanol and 1-octanol, while linoleic acid and palmitoleic acid hydroperoxides lead to 1-pentanol formation. Notably, 1-octen-3-ol—derived from linoleic acid oxidation—has a low odor threshold of 1 μg/kg and significantly influences food flavor. Its concentration in DL at 130℃ (8.58 ± 0.56 μg/100 g) was markedly higher than in WL at 100℃ (4.36 ± 0.69 μg/100 g) (p < 0.01). This compound is commonly detected in oil-rich foods, imparting mushroom, rose, and hay-like aromas. Meanwhile, 1-hexanol contributes musty, sweet, and woody notes, and 1-pentanol provides fuel-oil-like, sweet, and balm aromas [38].
Furan compounds form during oil oxidation. 2-Pentylfuran, produced via cyclization of 9-hydroperoxide with an alkoxy group, has a flavor threshold of 6 μg/kg and imparts earthy, green, and vegetable-like aromas [39]. In DL prepared at 130℃, 2-pentylfuran content (5.06 ± 0.16 μg/100 g) and 2-ethylpyrazine content (3.22 ± 0.02 μg/100 g) were significantly higher than in WL at 100℃ (2.5 ± 0.21 μg/100 g and 2.71 ± 0.12 μg/100 g, respectively). The difference in 2-pentylfuran was extremely significant (p < 0.001), while 2-ethylpyrazine showed a highly significant difference (p < 0.01). 2-Ethylpyrazine exhibits nutty, woody, potato-like, roasted, and meaty aromas, whereas 2-pentylfuran has bean-like, fruity, soil, green, and vegetable notes. These sensory properties are consistent with electronic nose results.
Esterification reactions involving alcohols and free fatty acids during the oxidation of lard primarily produce ketones. Most ketones impart floral and fruity aromas and have relatively low odor threshold concentrations. The ketone content in DL at 130℃ was 150.56 ± 1.41 μg/100 g, significantly higher than 97.37 ± 0.67 μg/100 g in WL at 100℃. Key ketones such as 2-pentanone, 2-heptanone, 2,3-butanedione, and 2-butanone contribute importantly to the characteristic flavors of animal and vegetable oils [40].
Ethyl butyrate and ethyl acetate, the two esters detected, are primarily formed by esterification of ethanol with acetic and butyric acids, providing fruity and sweet aromas [41]. The content of ethyl butyrate (5.87 ± 0.18 μg/100 g) and ethyl acetate (monomer: 29.55 ± 1.55 μg/100 g, dimer: 10.16 ± 0.86 μg/100 g) in WL at 100℃ was significantly higher than that in DL at 130℃ (5.27 ± 0.22 μg/100 g and 24.41 ± 0.66 μg/100 g, 7.45 ± 0.26 μg/100 g, respectively).
3.2.4. PCA and OPLS-DA analysis of HS-GC-IMS
Fingerprinting alone inadequately differentiates the volatile components in lard processed by various methods, making it difficult to precisely identify those responsible for sample variation. To effectively discern flavor differences between lard processed at 130℃ and 110℃, multivariate statistical analyses were applied. Among these, OPLS-DA models the relationship between compound expression and sample groups. As shown in Figure 3A, the PC1 and PC2 explained 88.6% and 3.3% of the variance, respectively. This separated the lard samples prepared at 130°C and 110°C, indicating significant compositional differences. VIP analysis (Figure 3B) identified 20 metabolites with significant differences between the groups. These include 1-pentanol-M, 1-penten-3-one-M, 3-methylbutanal, heptanal-M, 2-heptanone-M, (E)-2-hexenal-D, 2-methylbutanal, pentanal-D, 1-propanol, (E)-2-heptenal-M, 2-butanone-D, butanal-D,2-butanone-M, pentanal-M, propanal-D, 2-propanol, (E)-2-pentenal-D, (E)-2-pentenal-M, octanal, and 2-heptanone-D.
3.3. Sensory analysis of lard
Flavor plays a critical role in shaping consumer preferences and determining product applications [42]. The processing temperature of lard significantly influences its aroma profile. As shown in Figure 4, lard processed at 130℃ exhibits markedly stronger overall aroma, frying, and baking notes compared to WL processed at 100℃. This difference stems from the hydrolysis and oxidation of triglycerides during extraction, which release free fatty acids. Unsaturated fatty acids form primary and secondary peroxides that further decompose into aldehydes, ketones, alcohols, and other aromatic compounds. Elevated temperatures accelerate the formation of these flavor-active substances [43].
Among the key flavor compounds identified in lard are aldehydes, including nonanal, hexanal, (E)-2-octenal, and (E)-2-heptenal, which contribute green and fatty aromas; alcohols like 1-octen-3-ol, noted for mushroom and greasy scents; γ-lactone, imparting a deep-frying aroma; and 2-pentylfuran, associated with baking notes. The concentration of these compounds increases with processing temperature, consistent with the HS-GC-IMS analysis. Both lard samples processed at 130℃ and 110℃ showed only mild “odor” intensity, with no significant difference between them. Unique to lard are volatile compounds such as 3-methylindole and indole, which produce undesirable fecal odors. These arise from microbial decomposition of tryptophan in pig intestines and accumulate in adipose tissue via circulation. These lipophilic compounds were not uncovered by HS-GC-IMS, likely due to methodological differences in detection.
3.4. Analysis of Electronic Nose Results
The electronic nose is a rapid and objective analytical tool for detecting volatile odor substances through sensor arrays combined with pattern recognition technology, playing a vital role in aroma analysis [44]. It has been successfully applied to distinguish flavors in tea [45], meat [46], fish [47], and various other substances. An electronic nose was utilized to characterize the volatile signatures of lard samples processed under different thermal conditions. The flavor radar diagram is shown in Figure 5A. It reveals that the response values of the DL (lard processed at 130℃) to 18 sensors were generally higher than those of the WL (lard processed at 100℃). Except for the WLSGF/C sensor, which showed no significant difference (p > 0.05), all other sensors exhibited varying degrees of significance. Specifically, WLSGF/A showed significant differences (p < 0.05); WLSGF/B, WLSGF/D, WMSGF/B, WMSGF/C, WMSGF/E, WMSGF/F, WHSGF/C, and WHSGF/E showed highly significant differences (p < 0.01); and WLSGF/E, WLSGF/F, WMSGF/A, WMSGF/D, WHSGF/A, WHSGF/B, WHSGF/D, and WHSGF/F showed extremely significant differences (p < 0.001). These results indicate that heating lard at a higher temperature of 130℃ produces more volatile compounds such as acids and alcohols. Notably, WHSGF/F and WLSGF/F sensors are sensitive to aldehydes, which are key contributors to lard’s flavor profile [48]. Further, OPLS-DA analysis was conducted on the aroma sensor response data for lard prepared at different temperatures. As depicted in Figure 5B, the initial two principal components (PC1 accounting for 92.3% and PC2 for 4.8%) together accounted for 97.1% of the total variance, indicating that the model efficiently encapsulated the comprehensive information within the sample. The OPLS-DA plot separates DL and WL samples along the PC1 axis, with samples clustering distinctly in different regions, indicating significant taste differences between the two processing methods. These findings confirm that the electronic nose can effectively distinguish lard processed under varying temperature conditions.
3.5. Lipid Composition Analysis
The lipid profiles of lard prepared at 130℃ (DL) and 100℃ (WL) were analyzed using UPLC-Q-TOF-MS. The results, summarized in Figure 6A, classified the identified lipids into five major categories. The WL sample (100℃) contained a total of 253 lipid molecules, including 195 glycerolipids (GLs) — with 171 triacylglycerols (TGs) and 24 diacylglycerols (DGs); 29 glycerophospholipids (GPs), comprising 11 phosphatidylcholines (PCs), 4 phosphatidylethanolamines (PEs), 2 phosphatidylinositols (PIs), 1 phosphatidylglycerol (PG), and 3 N-acyl-lysophosphatidylethanolamines (LNAPEs); 2 phosphatidylethanols (PEtOHs); 6 phosphatidylmethanols (PMeOHs); 25 sphingolipids (SPs), including 14 ceramides (Cers), 9 hexosylceramides (HexCers), and 2 sulfated hexosylceramides (SHexCers); 2 glycolipids (SLs); and 2 free fatty acids (FFAs).
In contrast, the DL sample (130℃) contained 256 lipid molecules: 195 GLs (171 TGs and 24 DGs); 32 GPs (12 PCs, 4 PEs, 3 PIs, 1 PG, 2 LNAPEs); 2 PEtOHs; 7 PMeOHs; 24 SPs (14 Cers, 8 HexCers, 2 SHexCers); 3 SLs; and 2 FFAs. The relative proportions of lipid classes in DL were GLs (77.10%), GPs (11.46%), SPs (9.88%), SLs (0.79%), and FFAs (0.79%), compared with WL proportions of GLs (76.2%), GPs (12.5%), SPs (9.37%), SLs (1.17%), and FFAs (0.78%). TGs and DGs were the predominant lipid molecules in both samples. Statistically significant (p < 0.05) discrepancies in FFA concentrations between the samples were identified through quantitative analysis (Figure 6B). while no significant differences were observed in the total amounts of other lipid classes. Among TGs, 21 species exceeded 1% relative abundance, with the six most abundant species being: TG (16:1-16:1-18:0), TG (16:0-16:0-18:1), TG (16:0-16:0-20:4), TG (16:0-18:1-18:2), TG (16:0-16:0-20:1), and TG (18:1-18:2-18:2). The dominant fatty acids in these glycerides were stearic acid, palmitic acid, linoleic acid, and oleic aicd, consistent with the known fatty acid composition of lard [49].
PC1 captured 42.1% of dataset variance while PC2 accounted for 25.0%, collectively representing 67.1% of total variation in lipid profiles (Figure 7A). To identify significantly different lipid molecules between WL and DL, both t-tests (p < 0.05) and OPLS-DA (VIP > 1) were applied. VIP scores were computed from the OPLS-DA algorithm to prioritize significant lipid molecules, combined with ANOVA results (p < 0.05) and VIP > 1 criteria, these 49 lipid biomarkers were identified and chosen for their notable ability to distinguish between groups, demonstrating substantial discriminative power in the analysis.
Among 49 types of lipids, 34 types of TGs, 4 types of DGs, 5 types of GPs, 1 type of FAs, and 5 types of SPs were detected, with Figure 7C only presenting those differential lipids with VIP > 1. Compared to WL, lipids marked as “up” indicate higher abundance in DL, while “down” indicates lower abundance in DL relative to WL. The analysis revealed that 30 lipid molecules were significantly elevated in DL, whereas 19 were lower (Figure 7D).
To further characterize the 49 differential lipids, the proportions of each lipid subclass were calculated, focusing on TG, DG, FA, SP, and GP categories. Among the TGs, eight species—TG (16:1-16:1-18:0), TG (18:0-18:1-18:1), TG (17:2-18:1-18:1), TG (18:1-18:1-20:1), TG (16:1-17:1-18:1), TG (16:0-16:0-16:0), TG (17:1-19:1-19:1), and TG (10:0-16:0-18:0)—were the major contributors, accounting for 87.19% and 85.80% of the differences observed in WL and DL, respectively. Within DGs, DG (18:0-18:0) was the predominant species, explaining 61.3% of DG variation in WL and 59.2% in DL.
3.6. Correlation analysis of VOCs and lipids
In this study, correlation analysis was conducted between 20 differential aroma compounds identified by HS-GC-IMS and 49 lipid molecules screened from lipidomics data. As shown in Figure 8, the TG molecules were categorized into 10 saturated TGs and 24 unsaturated TGs. These included 2 mono-unsaturated bis-saturated TGs (TG(14:0-16:0-17:1), TG(17:1-18:0-18:0)), 10 biunsaturated monosaturated TGs (e.g., TG(14:0-17:1-18:3), TG(16:1-16:1-18:0), TG(O-16:0-18:1-18:1), TG(18:0-18:1-18:1), TG(16:0-18:1-18:1), TG(18:0-18:2-22:4), TG(16:0-20:1-22:1), TG(18:1-18:2-24:0), TG(18:1-18:1-24:0), TG(18:1-18:1-20:1)) and 12 tri-unsaturated TGs (e.g., TG(18:2-18:2-19:2), TG(18:2-18:2-19:1), TG(18:1-18:1-19:2), TG(17:1-19:1-19:1), TG(18:1-18:1-22:5), TG(16:1-21:1-22:1), TG(15:1-15:1-21:2)). Among these, 19 differential aroma compounds (all except 2-propanol) showed a negative correlation with saturated TGs. For aldehydes, such as (E)-2-heptenal, octanal, heptanal-M, (E)-2-hexenal-D, (E)-2-pentenal M(D), pentanal-M(D), 3-methylbutanal,2-methylbutanal, butyral-D, and propanal-D, a positive correlation was found with 21 unsaturated TGs (except TG (14:0-16:0-17:1)). Alcohols like 1-pentanol and 1-propanol were also positively associated with unsaturated TGs, except TG (18:0-18:1-18:1), TG (17:1-18:0-18:0), and TG (18:2-18:2-19:2). Similarly, ketones were positively correlated with most unsaturated TGs, except TG (17:1-18:0-18:0) and TG (18:2-18:2-19:2). The top four unsaturated TGs showing strong correlations were TG(16:1-16:1-18:0), TG(17:2-18:1-18:1), TG(16:1-17:1-18:1), and TG(18:1-18:1-20:1), all containing key unsaturated fatty acids C16:1 and C18:1. Beyond TGs, ketones and alcohols also showed positive correlations with sphingolipids and phospholipids, including FA(20:4), Cer(20:0; 2O/14:1), Cer(18:1; 2O/24:0), HexCer(17:2; 2O/32:0), HexCer(9:1; 2O/40:0), HexCer(9:0; 2O/30:4), PMeOH(18:1-26:2), PG(O-22:6-26:7), and PE(O-26:0-24:4). These lipid classes also contain unsaturated fatty acids. These findings demonstrate that the differential volatile aroma compounds are closely associated with triglycerides, glycerophospholipids, and fatty acids, especially those containing unsaturated fatty acid chains.
Fat oxidation is fundamentally critical for the generation of volatile compounds throughout the oil processing and production stages. The degradation pathways of key triglycerides—TG (16:1-16:1-18:0), TG (17:2-18:1-18:1), TG (16:1-17:1-18:1), and TG (18:1-18:1-20:1)—are illustrated in Figure 9. These major TG molecules break down their constituent fatty acids C18:1, C16:1, and C17:2, with C16:1 and C18:1 being the primary unsaturated fatty acids in lard. These unsaturated fatty acids undergo oxidation to form hydroperoxides [50]. Hydroperoxides are chemically unstable, and cleavage of their peroxy bonds (-O–O-) generates reactive alkoxy and hydroxyl radicals. These radicals initiate a cascade of reactions that cleave fatty acid chains, producing various volatile compounds such as aldehydes—(E)-2-heptenal, octanal, (E)-2-hexenal, heptanal, (E)-2-pentenal, pentanal—alcohols like 1-pentanol, and ketones including 2-heptanone and 2-butanone.
4. Conclusion
This study systematically analyzed the differential lipid composition and volatile flavors of lard processed at either 100°C (WL) or 130°C (DL). The lipidomic analysis identified TG and DG as the primary lipid components. Using OPLS-DA, 49 significantly different lipids were identified, with TG as the predominant class. Volatile flavor profiling via HS-GC-IMS revealed 67 volatile compounds, mainly aldehydes, alcohols, and acids. OPLS-DA further pinpointed 20 differential volatiles, including 3 alcohols, 12 aldehydes, and 5 ketones. Correlation analysis highlighted that TGs containing unsaturated fatty acids—such as TG (16:1-16:1-18:0), TG (17:2-18:1-18:1), TG (16:1-17:1-18:1), and TG (18:1-18:1-20:1)—serve as key precursors driving flavor differences. The study confirmed the oxidative degradation of C18:1 and C16:1 during high-temperature processing, elucidating the mechanism of lard flavor formation under varying thermal conditions.
Supplementary Materials
The following supporting information can be downloaded at the website of this paper posted on Preprints.org.
Author Contributions
E.Z. Methodology, Investigation, Data curation. J.Z: Writing-original draft, Data curation, Conceptualization. Supervision, Resources. J.Z: Validation, Software. R.Z Conceptualization. Y.N: Writing-original draft. Z.X. Writing review & editing, Supervision. All authors have read and agreed to the published version of the manuscript.
Funding
This work was sponsored by the National Natural Science Foundation of China (Grants 31201415).
Data Availability Statement
The data presented in this study are available in the article and Supplementary Materials.
Conflicts of Interest
The authors declare no conflict of interest.
References
- Wang, Y.; Wang, R.; Li, Y.; Zhang, L. Beef tallow/lard blends in O/W emulsions: Characterization of fat crystals, partial coalescence, rheology, and aeration performance [J]. Food Res. Int. 2023, 172, 113140. [Google Scholar] [CrossRef] [PubMed]
- Cheong, L. Z.; Zhang, H.; Xu, Y.; Xu, X. Physical characterization of lard partial acylglycerols and their effects on melting and crystallization properties of blends with rapeseed oil [J]. J. Agric. Food Chem. 2009, 57, 5020–5027. [Google Scholar] [CrossRef] [PubMed]
- Marikkar, J. M. N.; Yanty, N. A. M. Effect of Chemical and Enzymatic Modifications on the Identity Characteristics of Lard: A Review [J]. Int. J. Food Prop. 2013, 17, 321–330. [Google Scholar] [CrossRef]
- Roslan, N. I. M.; Gani, S. S. A.; Sahri, M. M.; Zaidan, U. H.; Halmi, M. I. E. Comparative study on physical properties of cookies and dough made with palm-based shortening and lard [J]. Journal of Critical Reviews 2020, 1374–1378. [Google Scholar]
- Yanty, N. A. M.; Marikkar, J. M. M.; Miskandar, M. S. Comparing the thermo-physical characteristics of lard and selected plant fats [J]. Grasas Y. Aceites. 2012, 63, 328–334. [Google Scholar] [CrossRef]
- Ault, W. C. Technology of edible animal fats [J]. Prog. Chem. Fats Other Lipds. 1958, (5), 263-284. [CrossRef].
- Cravotto, G.; Boffa, L.; Mantegna, S.; Perego, P.; Avogadro, M.; Cintas, P. Improved extraction of vegetable oils under high-intensity ultrasound and/or microwaves [J]. Ultrason. Sonochem. 2008, 15, 898–902. [Google Scholar] [CrossRef]
- Wang, Q. L.; Jiang, J.; Li, J. W.; Qiu, M. B.; Lin, C. Z.; Shi, X. H.; Cao, P. R.; Liu, Y. F. High quality lard with low cholesterol content produced by aqueous enzymatic extraction and β-cyclodextrin treatment [J]. Eur J Lipid Sci Tech. 2015, 118, 553–563. [Google Scholar] [CrossRef]
- Song, H.; Liu, J. GC-O-MS technique and its applications in food flavor analysis [J]. Food Res. Int. 2018, 114, 187–198. [Google Scholar] [CrossRef]
- Li, J.; Xu, Y.; Du, W.; Jin, L.; Ren, P.; Ren, f.; Xie, J. Comparative analysis of aroma compounds in Chinese traditional dry-rendered fat by HS/GC-IMS, SPME/GC-MS, and SPME/GC-O [J]. J. Food Compos. Anal. 2022, 107, 104378. [Google Scholar] [CrossRef]
- Liu, D.; Bai, L.; Feng, X.; Chen, Y. P.; Zhang, D.; Yao, W.; Zhang, H.; Chen, G.; Liu, Y. Characterization of Jinhua ham aroma profiles in specific to aging time by gas chromatography-ion mobility spectrometry (GC-IMS) [J]. Meat Sci. 2020, 168, 108178. [Google Scholar] [CrossRef]
- Rao, W.; Li, X.; Ouyang, L.; Zhu, S.; Hu, S.; Zhou, J. Characterization of key aroma compounds in Rice flavor baijiu from different rice raw materials by gas chromatography-ion mobility spectrometry and gas chromatography-olfactometry-quadrupole time of flight mass spectrometry [J]. Food Biosci. 2023, 56, 103370. [Google Scholar] [CrossRef]
- Dominguez, R.; Pateiro, M.; Gagaoua, M.; Barba, F. J.; Zhang, W.; Lorenzo, J. M. A Comprehensive Review on Lipid Oxidation in Meat and Meat Products [J]. Antioxidants (Basel, Switzerland). 2019, 8, 1–31. [Google Scholar] [CrossRef] [PubMed]
- Mottram, D. S. Flavour formation in meat and meat a review [J]. Food Chem. 1998, 62, 415–424. [Google Scholar] [CrossRef]
- Xu, Y.; Chen, Q.; Lei, S.; Wu, P.; Fan, G.; Xu, X.; Pan, S. Effects of lard on the formation of volatiles from the Maillard reaction of cysteine with xylose [J]. J Sci Food Agric. 2011, 91, 2241–2246. [Google Scholar] [CrossRef]
- Antonietta Paleari, M.; Maria Moretti, V.; Bersani, C.; Beretta, G.; Mentasti, T. Characterisation of a lard cured with spices and aromatic herbs [J]. Meat Sci. 2004, 67, 549–557. [Google Scholar] [CrossRef]
- Liu, S.; Ye, T.; Liu, X.; Wang, Z.; Chen, D. Pork phospholipids influence the generation of lipid-derived lard odorants in dry rendering process [J]. LWT. 2021, 152. [Google Scholar] [CrossRef]
- Zhu, X.; Wang, K.; Zhu, J.; Koga, M. Analysis of cooking oil fumes by ultraviolet spectrometry and gas chromatography−mass spectrometry [J]. J. Agric. Food Chem. 2001, 49, 4790–4794. [Google Scholar] [CrossRef]
- Zhou, L.; Zhao, M.; Bindler, F.; Marchioni, E. Comparison of the volatiles formed by oxidation of phosphatidylcholine to triglyceride in model systems [J]. J. Agric. Food Chem. 2014, 62, 8295–8301. [Google Scholar] [CrossRef]
- Chen, J.; Kong, Q.; Sun, Z.; Liu, J. Freshness analysis based on lipidomics for farmed Atlantic salmon (Salmo salar L.) stored at different times [J]. Food Chem. 2022, 373. [Google Scholar] [CrossRef]
- Liu, Y.; Xia, Q.; Qian, Y.; Kuang, Y.; Liu, J.; Lin, L. Effects of Three Extraction Methods on Avocado Oil Lipid Compounds Analyzed via UPLC-TOF-MS/MS with OPLS-DA [J]. Foods. 2023, 12. [Google Scholar] [CrossRef]
- Wu, B. F.; Wei, F.; Xu, S. L.; Xie, Y.; Lv, X.; Chen, H.; Huang, F. H. Mass spectrometry-based lipidomics as a powerful platform in foodomics research [J]. Trends Food Sci. Technol. 2021, 107, 358–376. [Google Scholar] [CrossRef]
- Zhou, L.; Ren, Y.; Shi, Y.; Fan, S.; Zhao, L.; Dong, M.; Li, J.; Yang, Y.; Yu, Y.; Zhao, Q.; Zhang, J.; Tang, C. Comprehensive foodomics analysis reveals key lipids affect aroma generation in beef [J]. Food Chem. 2024, 461, 140954. [Google Scholar] [CrossRef] [PubMed]
- Liu, H.; Ma, Q.; Xing, J.; Li, P.; Gao, P.; Hamid, N.; Wang, Z.; Wang, P.; Gong, H. Exploring the formation and retention of aroma compounds in ready-to-eat roasted pork from four thermal methods: A lipidomics and heat transfer analysis [J]. Food Chem. 2024, 431, 137100. [Google Scholar] [CrossRef]
- Zhang, R.; Chen, K.; Chen, X.; Yang, B.; Kan, J. Thermostability and kinetics analysis of oil color, carotenoids and capsaicinoids in hotpot oil models (butter, rapeseed oil, and their blends) [J]. LWT. 2021, 152, 112216. [Google Scholar] [CrossRef]
- Zhou, X.; Zhou, D.-Y.; Liu, Z.-Y.; Yin, F.-W.; Liu, Z.-Q.; Li, D.-Y.; Shahidi, F. Hydrolysis and oxidation of lipids in mussel Mytilus edulis during cold storage [J]. Food Chem. 2019, 272, 109–116. [Google Scholar] [CrossRef]
- Mariutti, L. R. B.; Bragagnolo, N. Influence of salt on lipid oxidation in meat and seafood products: A review [J]. Food Res. Int. 2017, 94, 90–100. [Google Scholar] [CrossRef]
- Yin, W.-t.; Ma, X.-t.; Li, S.-j.; Wang, X.-d.; Liu, H.-m.; Shi, R. Comparison of key aroma-active compounds between roasted and cold-pressed sesame oils [J]. Food Res. Int. 2021, 150, 110794. [Google Scholar] [CrossRef]
- Guo, K.; Wang, Q.; Xia, T.; Wang, L.; Song, H.; Yang, L. Effect of smelting temperatures on the odor compounds of beef tallow through instrumental and sensory techniques [J]. J. Food Compos. Anal. 2023, 119. [Google Scholar] [CrossRef]
- Liu, N.; Ren, G.; Faiza, M.; Li, D.; Cui, J.; Zhang, K.; Yao, X.; Zhao, M. Comparison of conventional and green extraction methods on oil yield, physicochemical properties, and lipid compositions of pomegranate seed oil [J]. J. Food Compos. Anal. 2022, 114, 104747. [Google Scholar] [CrossRef]
- Wang, S.; Chen, H.; Sun, B. Recent progress in food flavor analysis using gas chromatography–ion mobility spectrometry (GC–IMS) [J]. Food Chem. 2020, 315, 126158. [Google Scholar] [CrossRef]
- Du, W.; Zhao, M.; Zhen, D.; Tan, J.; Wang, T.; Xie, J. Key aroma compounds in Chinese fried food of youtiao. [J]. Flavour Frag J. 2020, 35, 88–98. [Google Scholar] [CrossRef]
- Yang, Y.; Yuan, B.; Yu, P.; Jia, Y.; Zhou, Q.; Sun, J. Flavor characteristics of peanut butter pretreated by radio frequency heating, explosion puffing, microwave, and oven heating [J]. Food Chem. 2022, 394, 133487. [Google Scholar] [CrossRef] [PubMed]
- Meinert, L.; Andersen, L. T.; Bredie, W. L. P.; Bjergegaard, C.; Aaslyng, M. D. Chemical and sensory characterisation of pan-fried pork flavour: Interactions between raw meat quality, ageing and frying temperature [J]. Meat Sci. 2007, 75, 229–242. [Google Scholar] [CrossRef] [PubMed]
- Song, S.; Tang, Q.; Fan, L.; Xu, X.; Song, Z.; Hayat, K.; Feng, T.; Wang, Y. Identification of pork flavour precursors from enzyme-treated lard using Maillard model system assessed by GC-MS and partial least squares regression [J]. Meat Sci. 2017, 124, 15–24. [Google Scholar] [CrossRef]
- Yao, W.; Ma, S.; Wu, H.; Liu, D.; Liu, J.; Zhang, M. Flavor profile analysis of grilled lamb seasoned with classic salt, chili pepper, and cumin (Cuminum cyminum) through HS-SPME-GC-MS, HS-GC-IMS, E-nose techniques, and sensory evaluation on Sonit sheep [J]. Food Chem. 2024, 454, 139514. [Google Scholar] [CrossRef]
- Duan, S.; Tian, Z.; Zheng, X.; Tang, X.; Li, W.; Huang, X. Characterization of flavour components and identification of lipid flavour precursors in different cuts of pork by phospholipidomics [J]. Food Chem. 2024, 458, 139422. [Google Scholar] [CrossRef]
- Guo, Q.; Kong, X. F.; Hu, C. J.; Zhou, B.; Wang, C. T.; Shen, Q. W. Fatty acid content, flavor compounds, and sensory quality of pork loin as affected by dietary supplementation with L-arginine and glutamic acid [J]. J Food Sci. 2019, 84, 3445–3453. [Google Scholar] [CrossRef]
- Qi, S. S.; Zhan, P.; Tian, H.; Wang, P.; Ma, X.; Li, K. Effects of thyme (Thymus vulgaris L.) addition on the volatile compounds of mutton broth during boiling [J]. Food Sci Hum Well. 2022, 11, 305–315. [Google Scholar] [CrossRef]
- Zheng, A.-R.; Wei, C.-K.; Wang, M.-S.; Ju, N.; Fan, M. Characterization of the key flavor compounds in cream cheese by GC-MS, GC-IMS, sensory analysis and multivariable statistics [J]. Curr. Res. Food Sci. 2024, 8, 100772. [Google Scholar] [CrossRef]
- Martínez-Onandi, N.; Rivas-Cañedo, A.; Ávila, M.; Garde, S.; Nuñez, M.; Picon, A. Influence of physicochemical characteristics and high pressure processing on the volatile fraction of Iberian dry-cured ham [J]. Meat Sci. 2017, 131, 40–47. [Google Scholar] [CrossRef]
- O’quinn, T. G.; Legako, J. F.; Woerner, D. R.; Kerth, C. R.; Nair, M. N.; Brooks, J. C.; Lancaster, J. M.; Miller, R. K. A current review of U.S. beef flavor II: Managing beef flavor [J]. Meat Sci. 2024, 209, 109403. [Google Scholar] [CrossRef]
- Zhuang, Y.; Dong, J.; He, X.; Wang, J.; Li, C.; Dong, L.; Zhang, Y.; Zhou, X.; Wang, H.; Yi, Y.; Wang, S. Impact of Heating Temperature and Fatty Acid Type on the Formation of Lipid Oxidation Products During Thermal Processing [J]. Front. Nutr. 2022, 9, 913297. [Google Scholar] [CrossRef]
- Knobloch, H.; Turner, C.; Spooner, A.; Chambers, M. Methodological variation in headspace analysis of liquid samples using electronic nose [J]. Sensors and Actuators B: Chemical. 2009, 139, 353–360. [Google Scholar] [CrossRef]
- Liu, H. Y.; Liu, Y.; Li, M. Y.; Mai, Y. H.; Guo, H.; Wadood, S. A.; Raza, A.; Wang, Y.; Zhang, J. Y.; Li, H. B.; Gan, R. Y. The chemical, sensory, and volatile characteristics of instant sweet tea (Lithocarpus litseifolius [Hance] Chun) using electronic nose and GC-MS-based metabolomics analysis [J]. LWT. 2022, 163. [Google Scholar] [CrossRef]
- Yang, F.; Gao, H.; Zhang, Y.; Liao, Y.; Zeng, Q.; He, X.; Xu, K.; He, J. Optimizing conditions of electronic nose for rapid detection of flavor substances in Ningxiang Pork [J]. J. Food Process Eng. 2021, 44. [Google Scholar] [CrossRef]
- Buratti, S.; Grassi, S.; Ubaldi, P. G.; Pianezzola, A.; Benedetti, S. E-nose based control charts for fish freshness evaluation [J]. Food Res. Int. 2025, 209, 116313. [Google Scholar] [CrossRef]
- Gerlach, C.; Leppert, J.; Santiuste, A. C.; Pfeiffer, A.; Boeker, P.; Wust, M. Comparative Aroma Extract Dilution Analysis (cAEDA) of Fat from Tainted Boars, Castrated Male Pigs, and Female Pigs [J]. J. Agric. Food Chem. 2018, 66, 2403–2409. [Google Scholar] [CrossRef]
- Zhang, L.; Zhang, K.; Yang, H.; Yue, K.; Liu, R.; Bi, Y.; Ma, C. Characterization of lard from different adipose tissues: Physicochemical properties, thermodynamics characteristics and crystallization behaviors [J]. J. Food Compos. Anal. 2023, 115. [Google Scholar] [CrossRef]
- Ding, A.; Zhu, M.; Qian, X.; Shi, L.; Huang, H.; Xiong, G.; Wang, J.; Wang, L. Effect of fatty acids on the flavor formation of fish sauce [J]. LWT. 2020, 134, 110259. [Google Scholar] [CrossRef]
Figure 1.
HS-GC-IMS top view of sample spectrum.
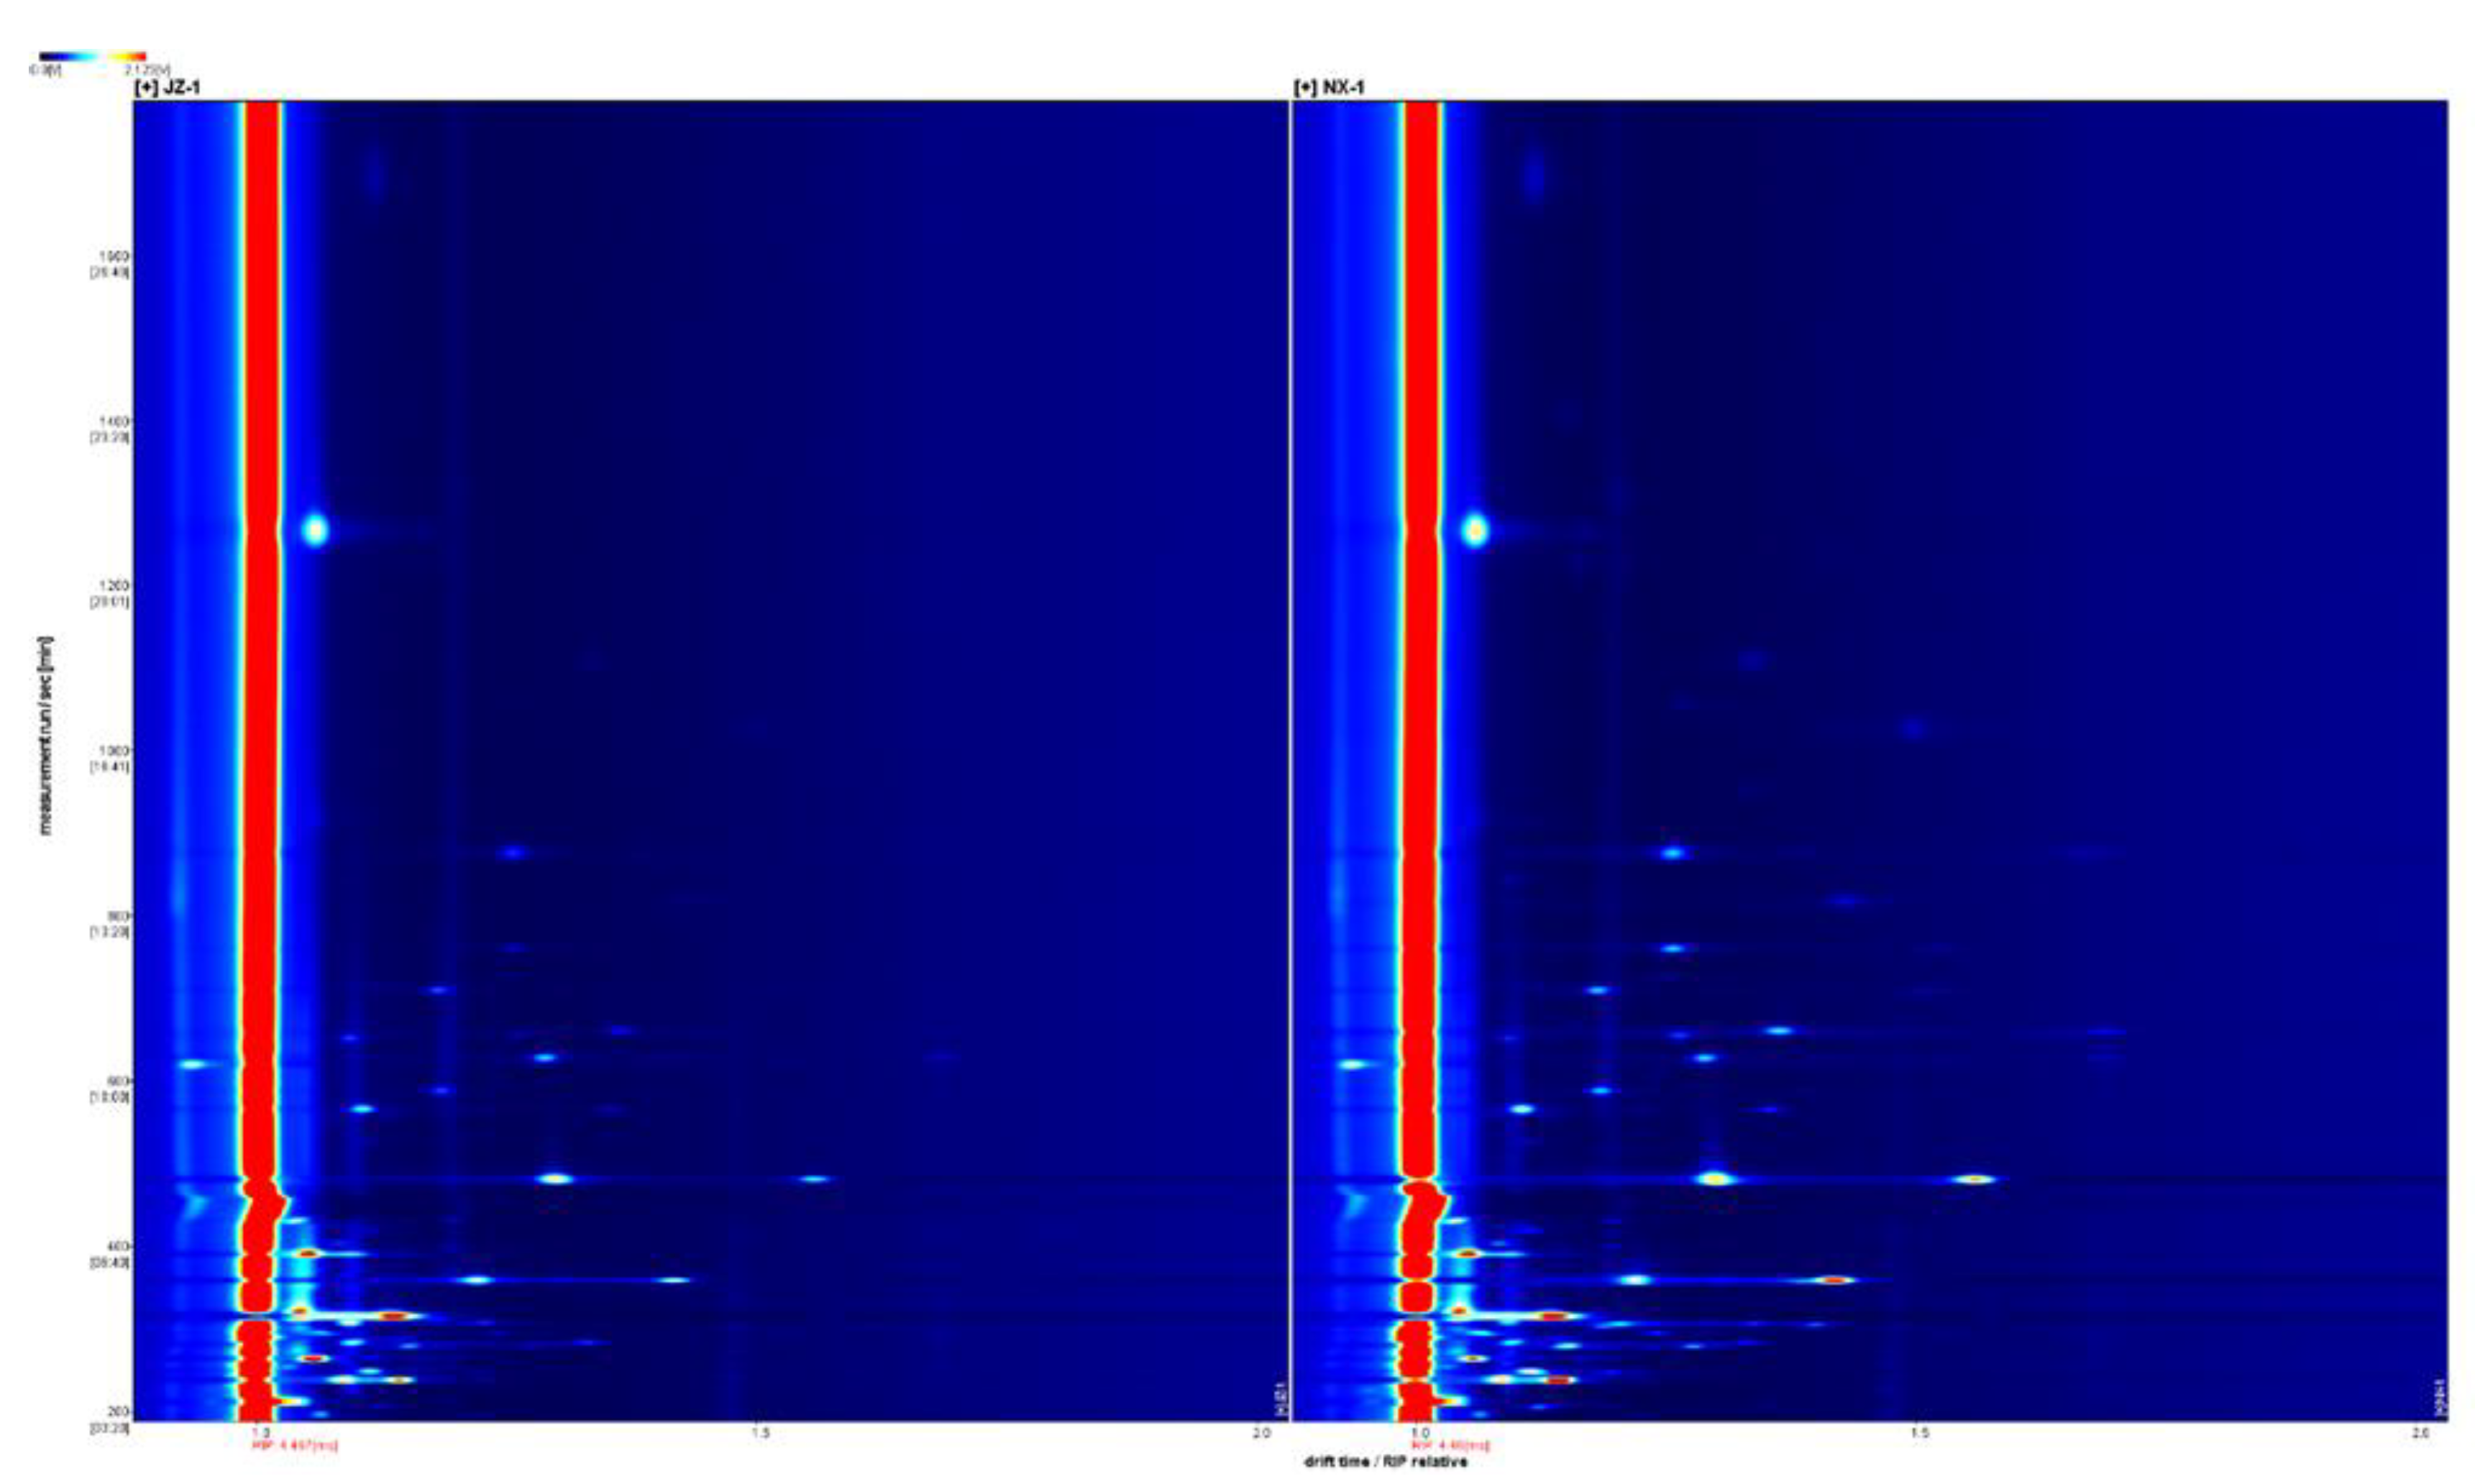
Figure 2.
Volatile organic compound (VOC) fingerprint of lard. Compounds labeled with “M” and “D” represent the monomeric and dimeric forms, respectively.
Figure 2.
Volatile organic compound (VOC) fingerprint of lard. Compounds labeled with “M” and “D” represent the monomeric and dimeric forms, respectively.
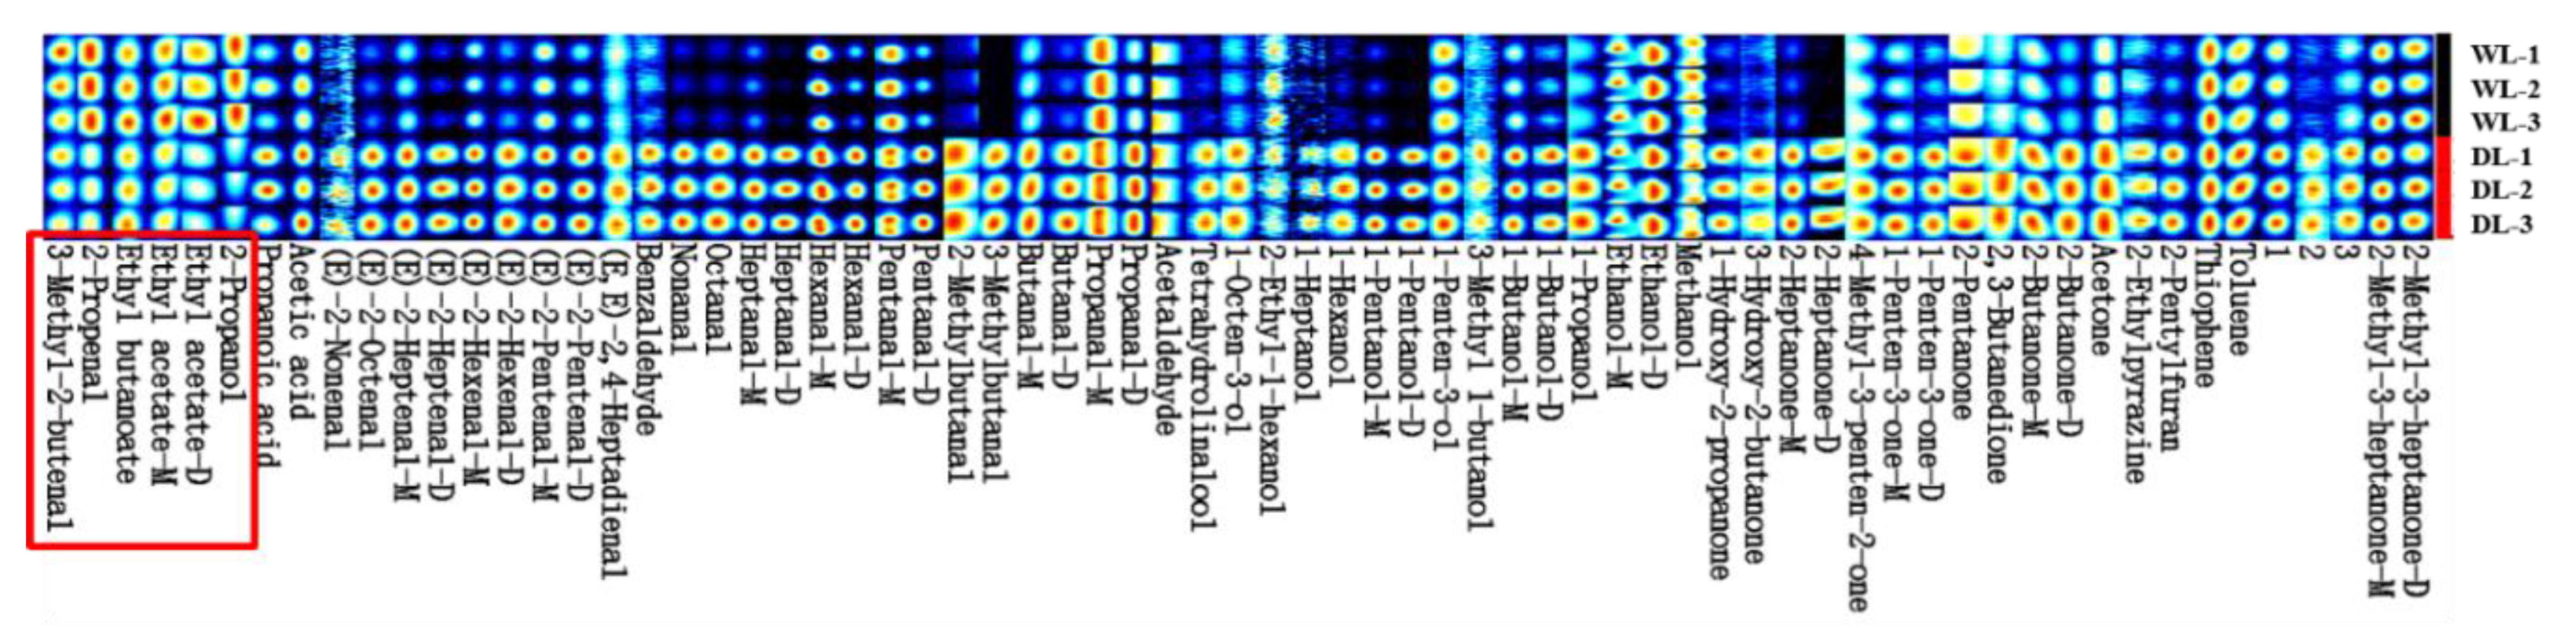
Figure 3.
Identification and analysis of volatiles in DL and WL by HS-GC-IMS. (A) OPLS-DA plot; (B) VIP scores.
Figure 3.
Identification and analysis of volatiles in DL and WL by HS-GC-IMS. (A) OPLS-DA plot; (B) VIP scores.
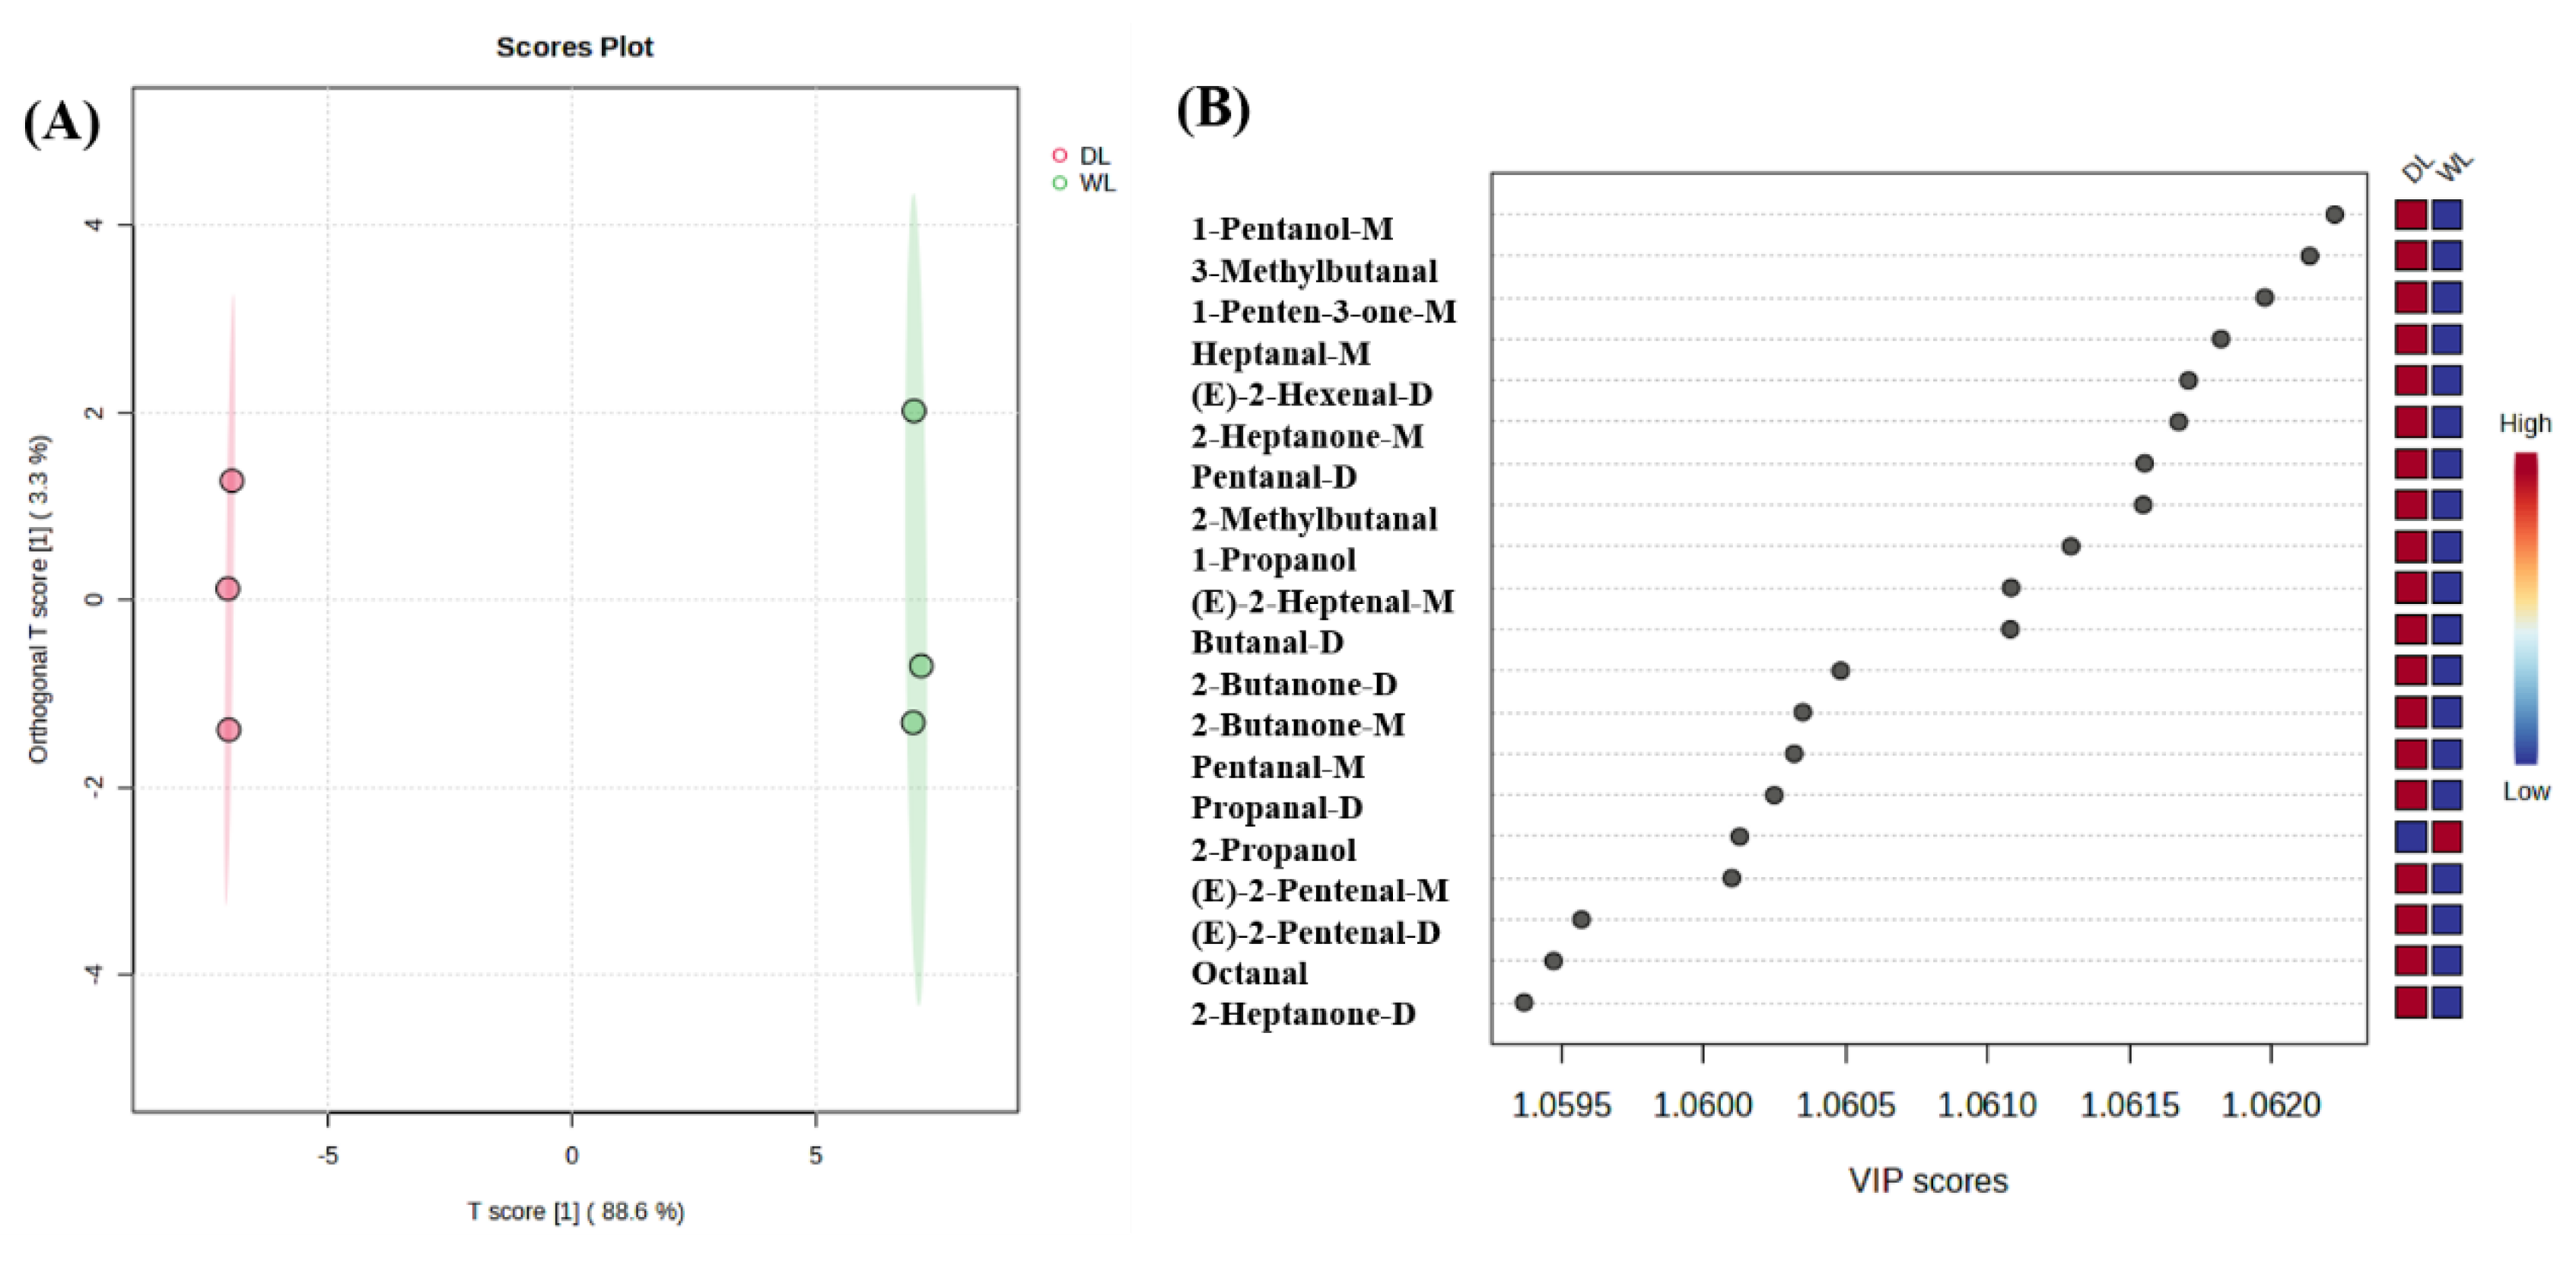
Figure 4.
Sensory evaluation analysis of DL and WL.
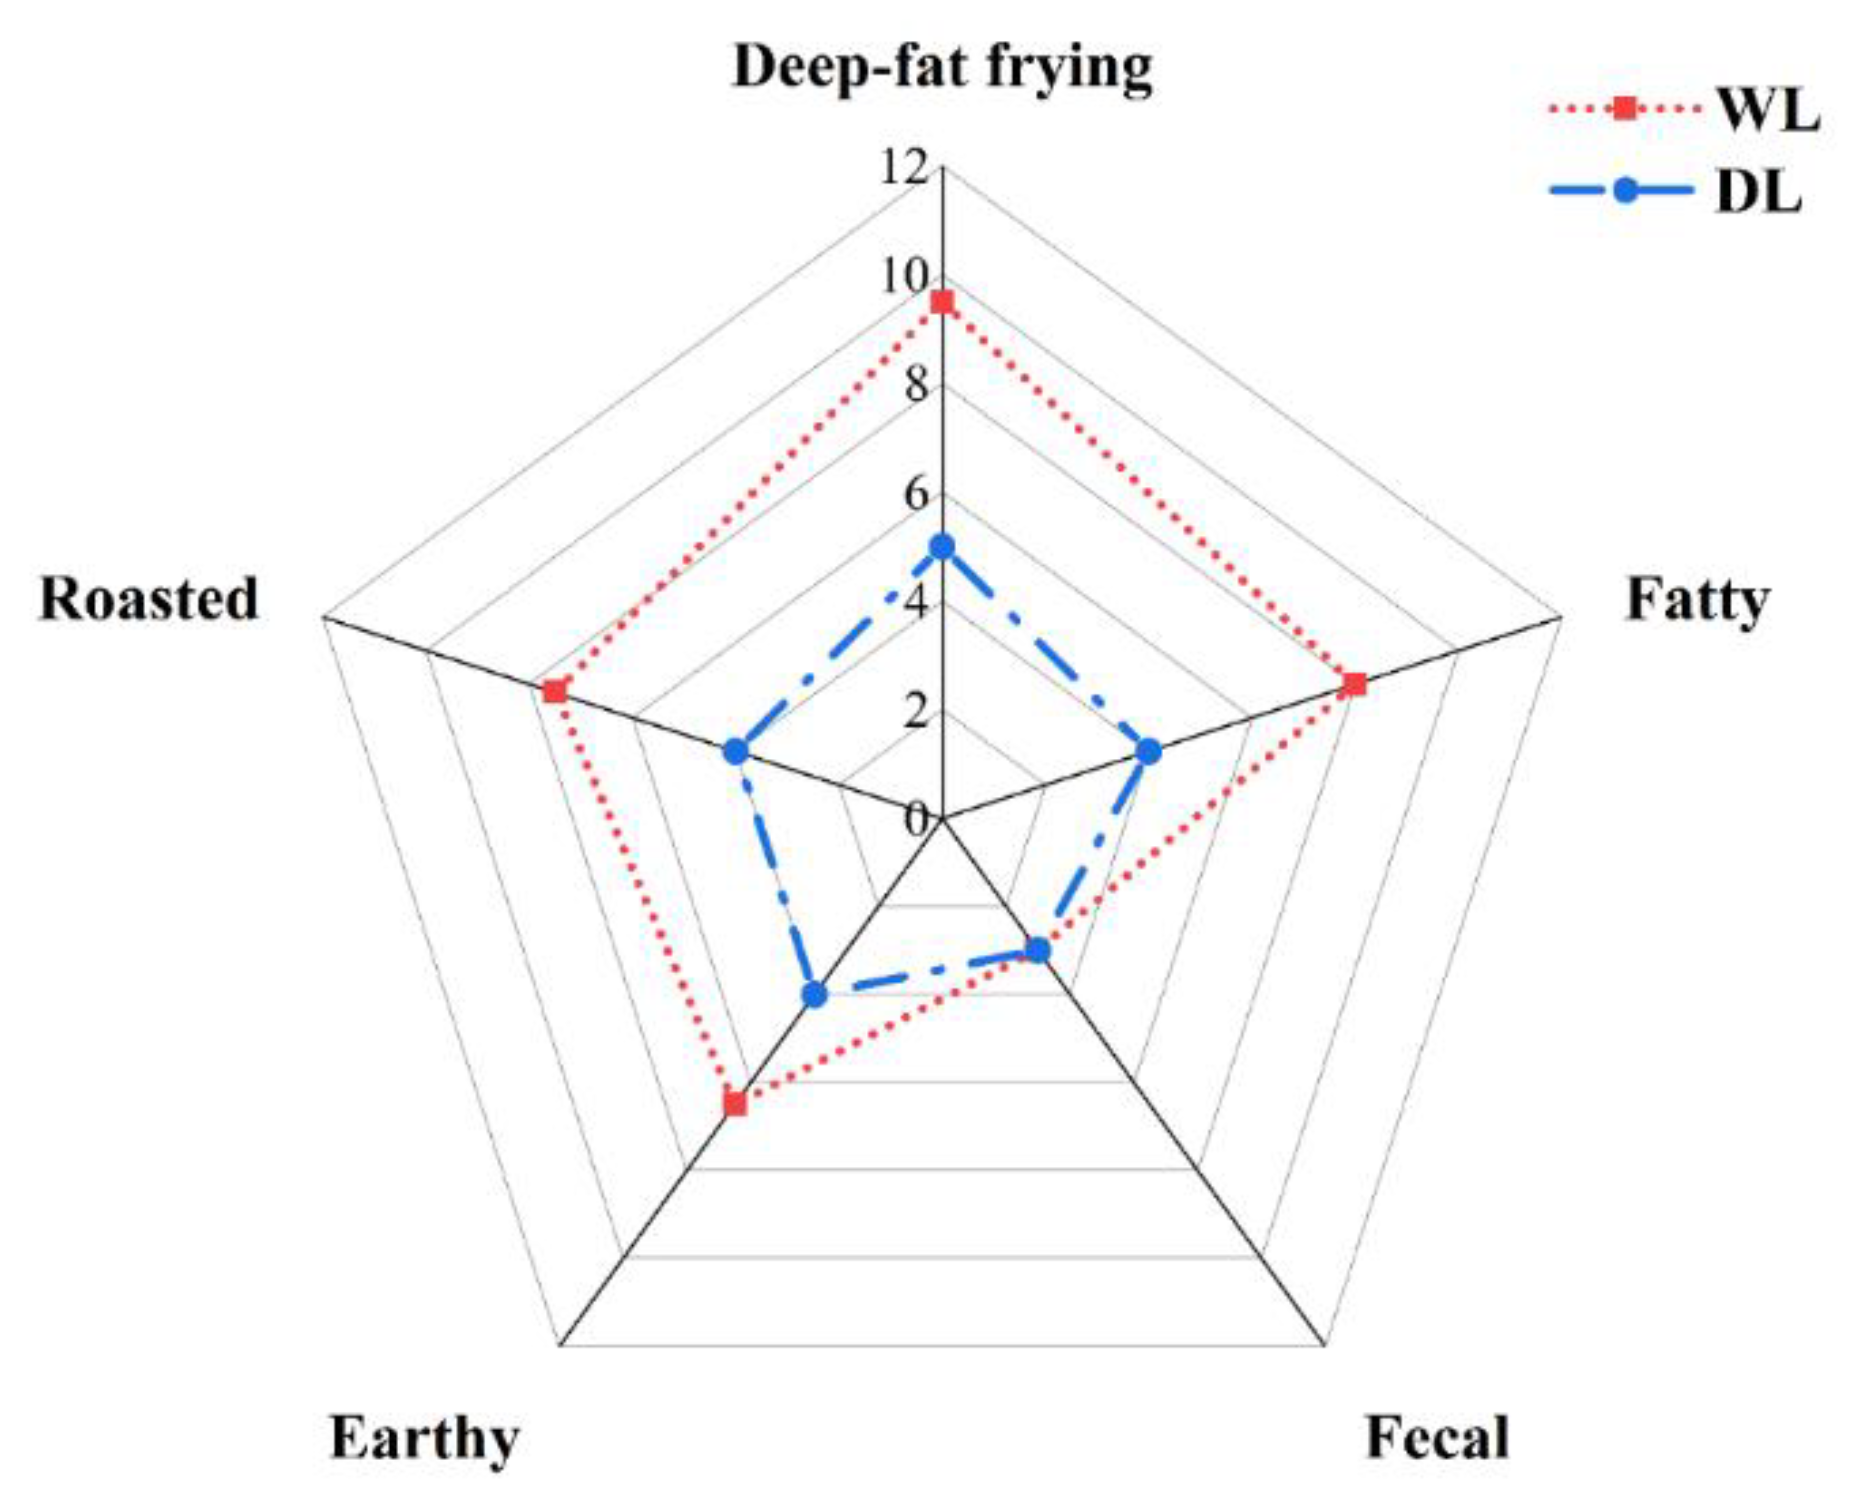
Figure 5.
Electronic nose discrimination of DL and WL. (A) Radar chart of aroma attributes. (B) OPLS-DA score plot.
Figure 5.
Electronic nose discrimination of DL and WL. (A) Radar chart of aroma attributes. (B) OPLS-DA score plot.
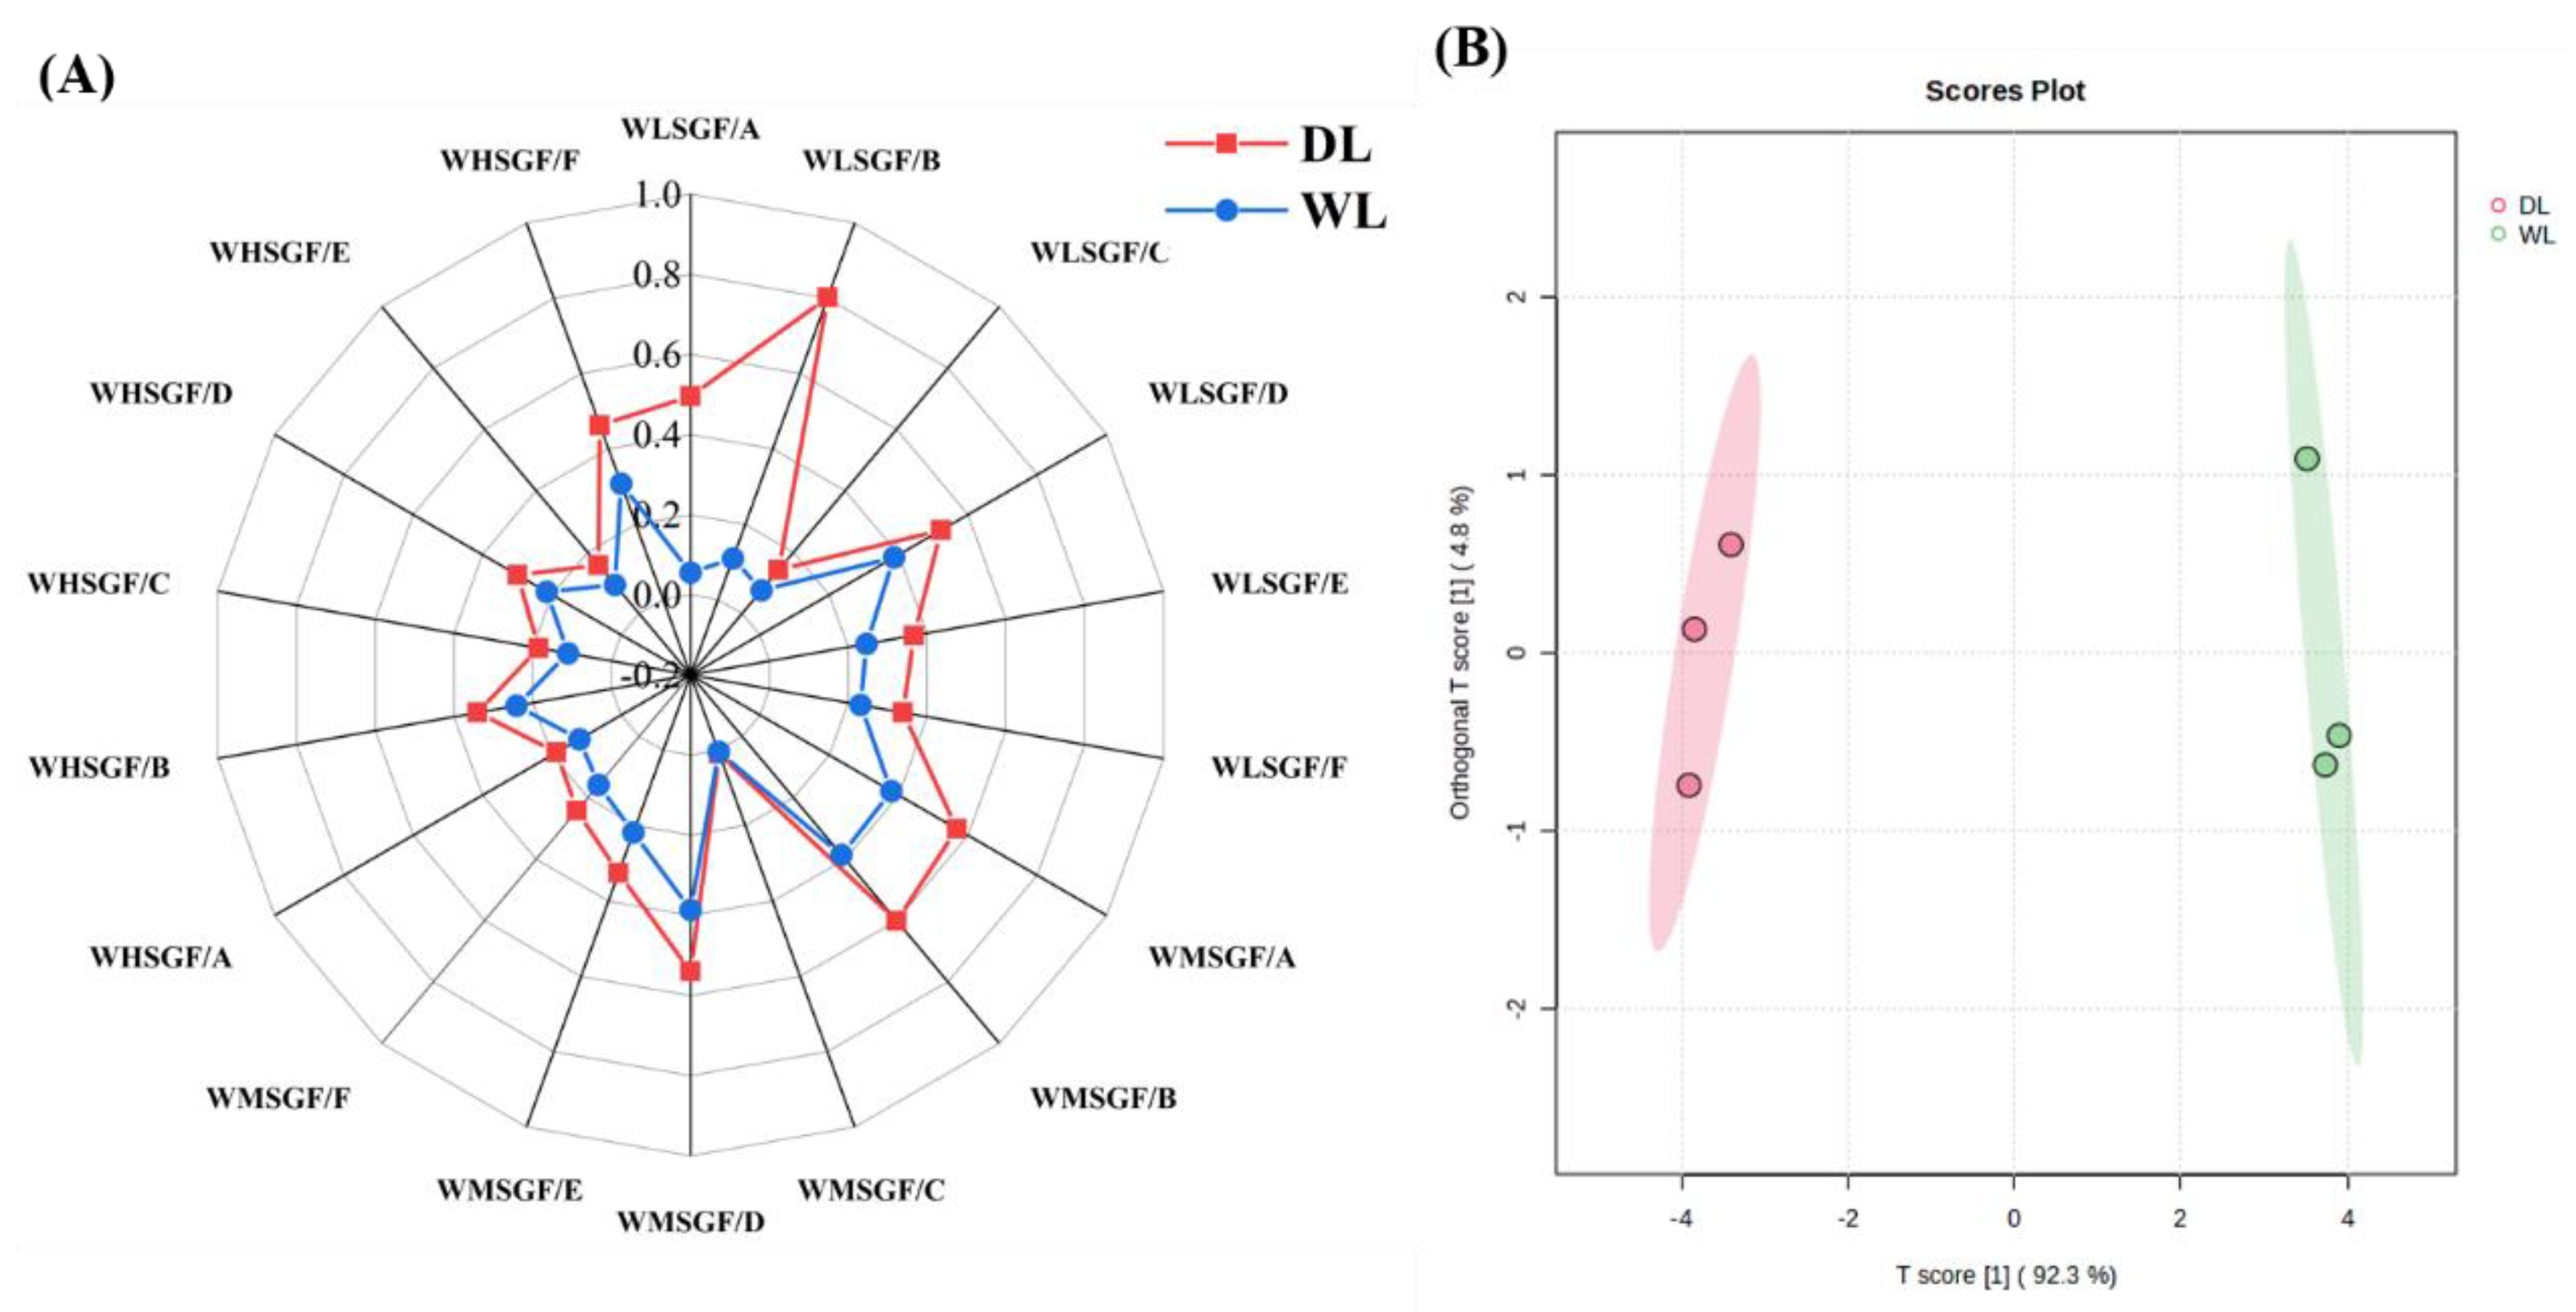
Figure 6.
Lipid profiles in WL and DL. (A) Proportional composition of lipid classes. (B) Lipid subclass.
Figure 6.
Lipid profiles in WL and DL. (A) Proportional composition of lipid classes. (B) Lipid subclass.
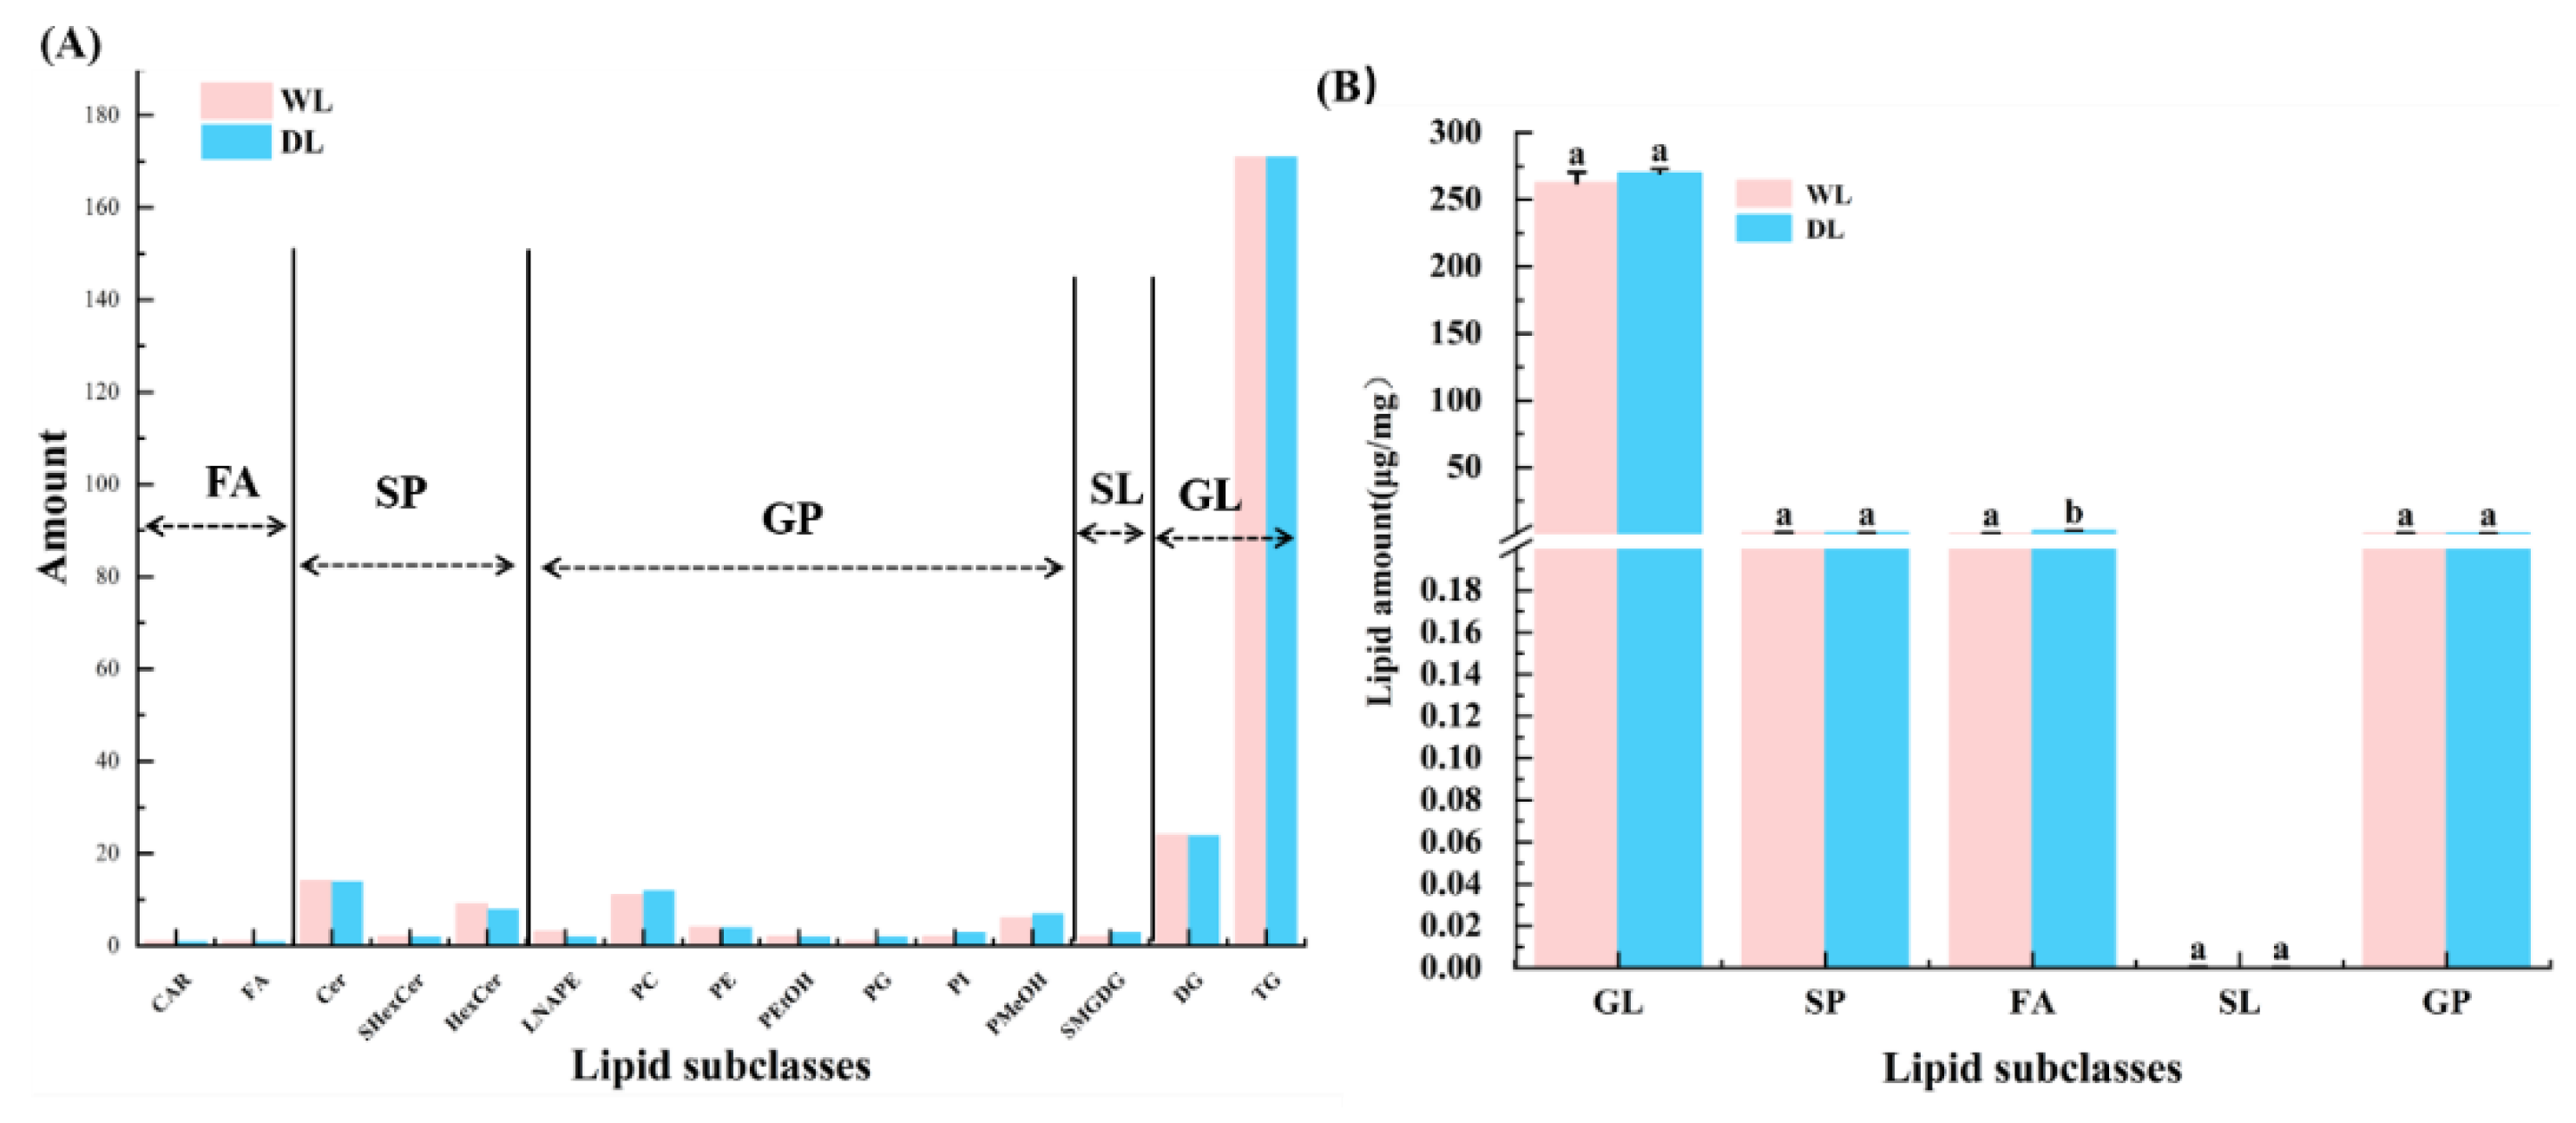
Figure 7.
Lipid profiles in WL and DL. (A) PCA score chart. (B) OPLS-DA score plots. (C) Score plot of VIP. (D) The number of differentially expressed lipid molecules. “Up” means lipid molecules in DL are more concentrated than in WL whereas “down” means they are less concentrated.
Figure 7.
Lipid profiles in WL and DL. (A) PCA score chart. (B) OPLS-DA score plots. (C) Score plot of VIP. (D) The number of differentially expressed lipid molecules. “Up” means lipid molecules in DL are more concentrated than in WL whereas “down” means they are less concentrated.
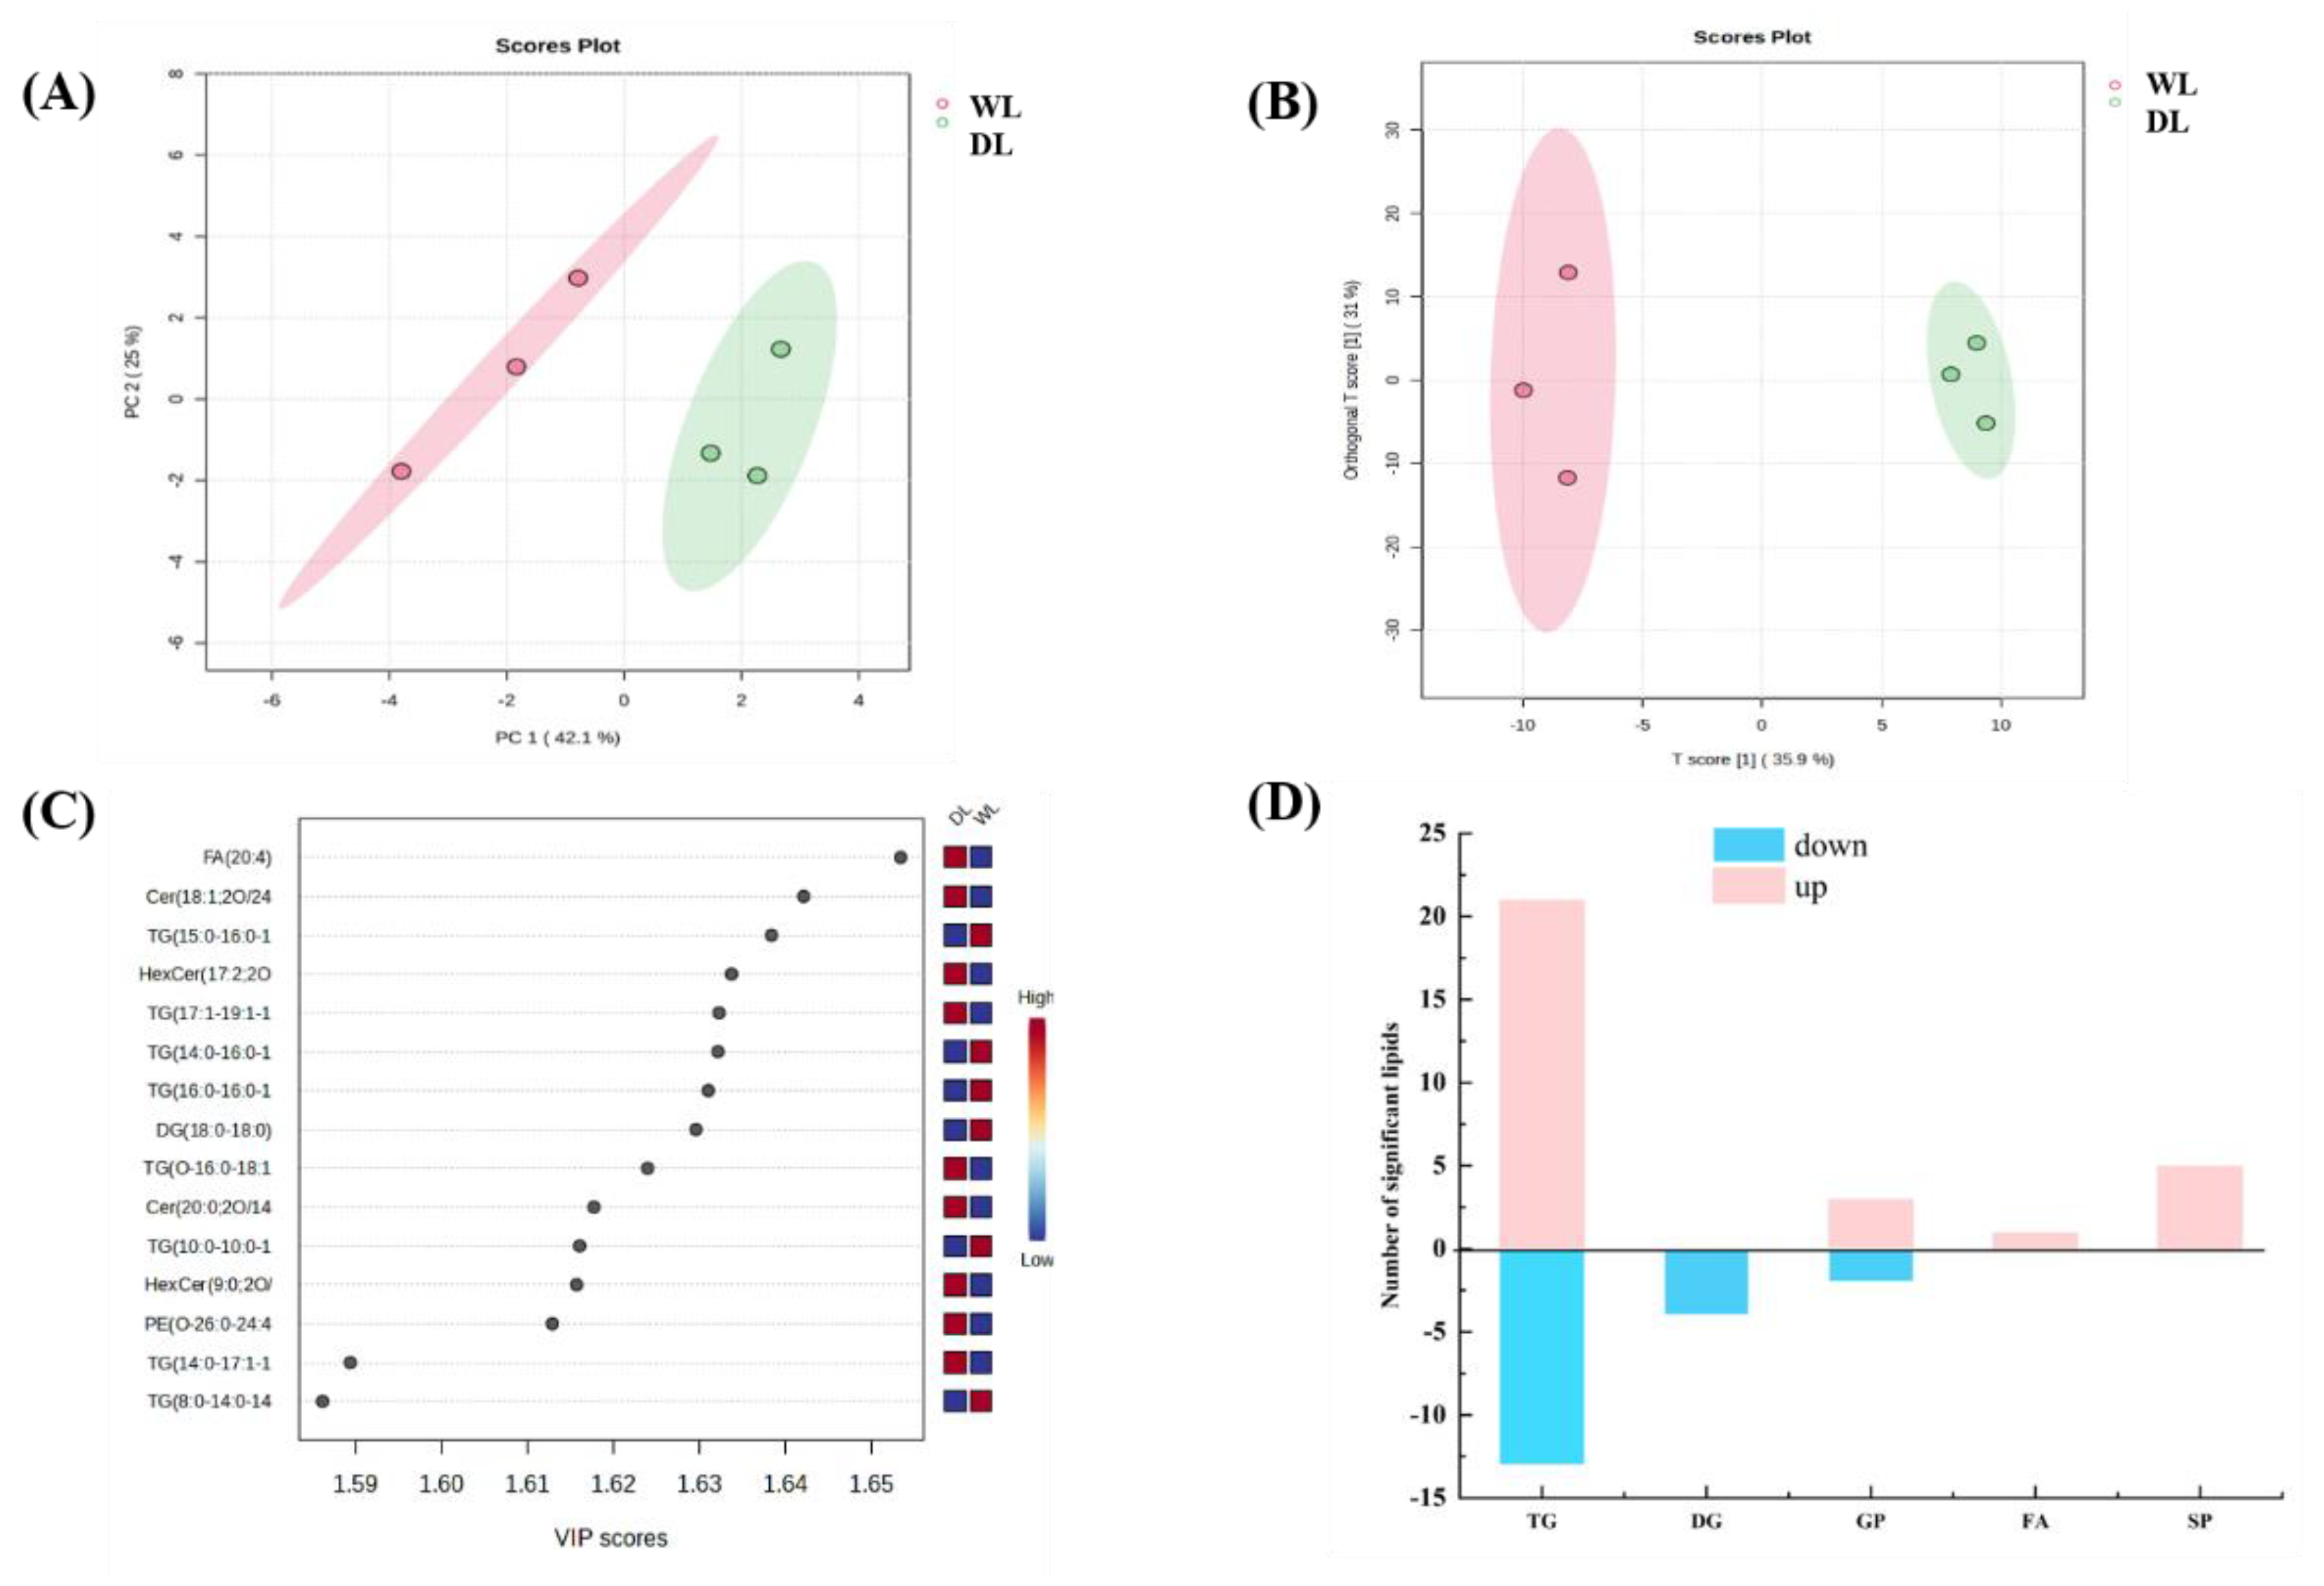
Figure 8.
Correlation analysis between discriminatory lipids and signature VOCs.
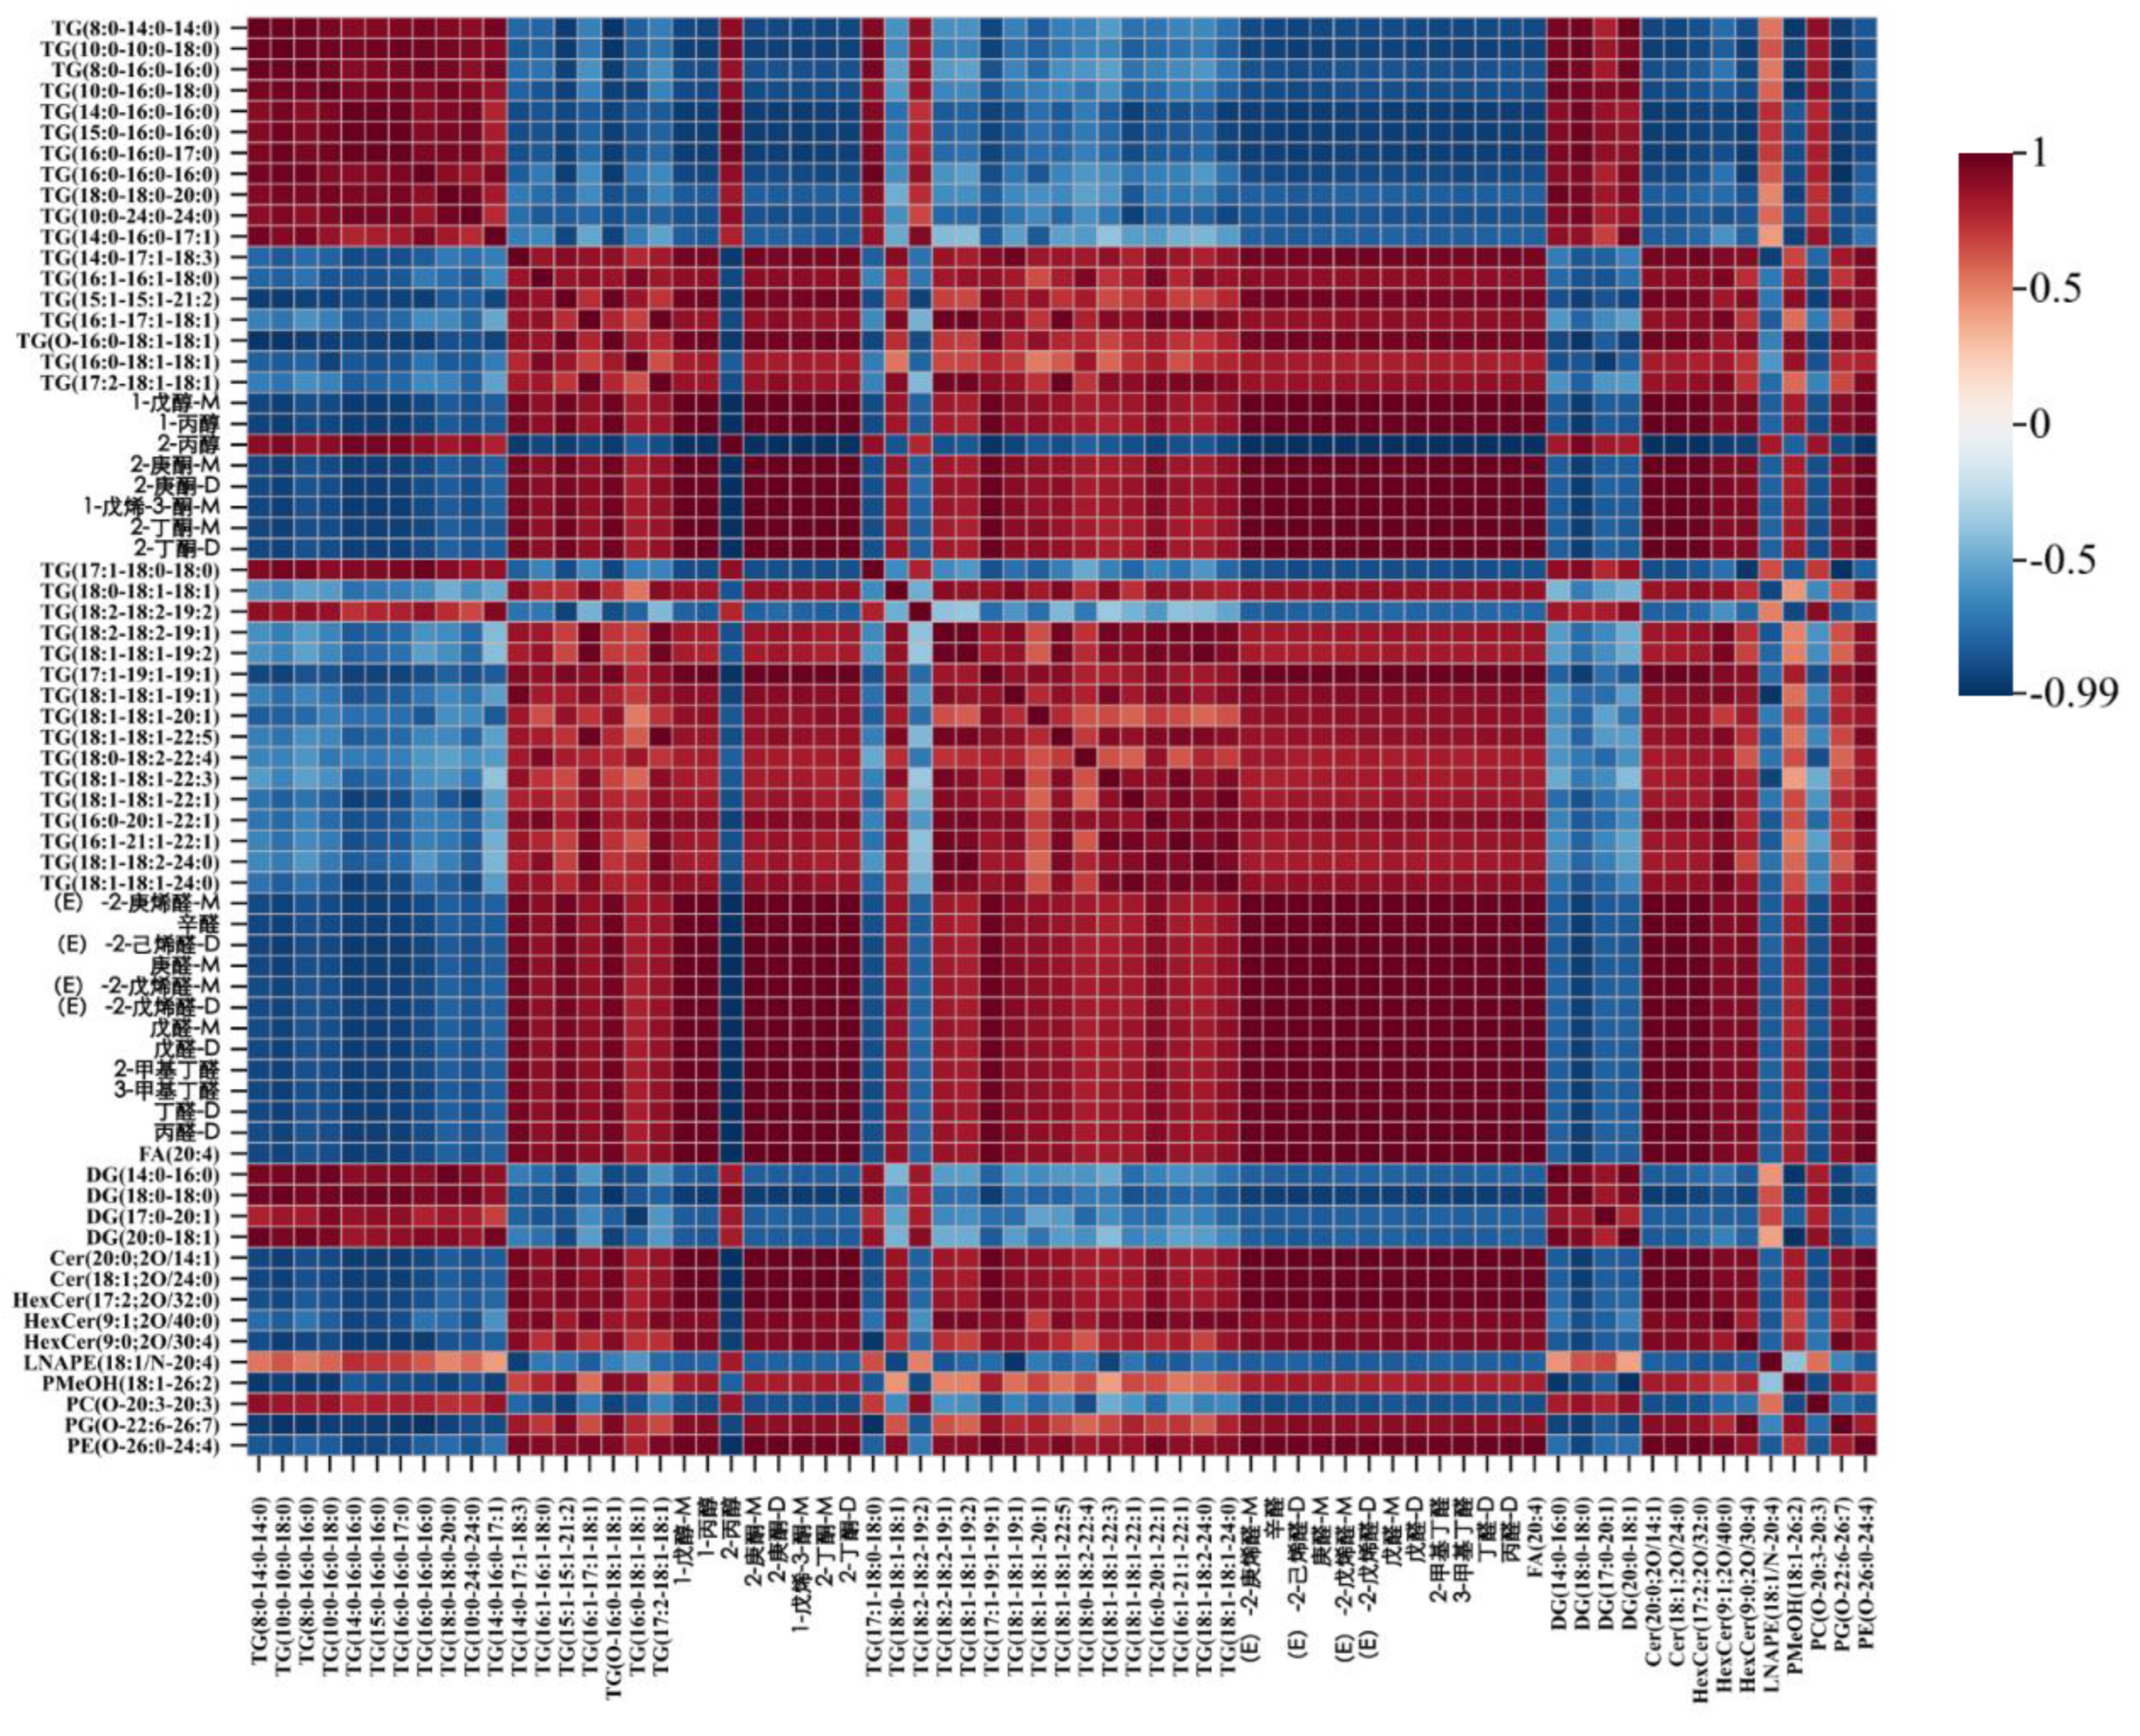
Figure 9.
Formation pathway of the typical VOCs from the degradation of the main lipids.
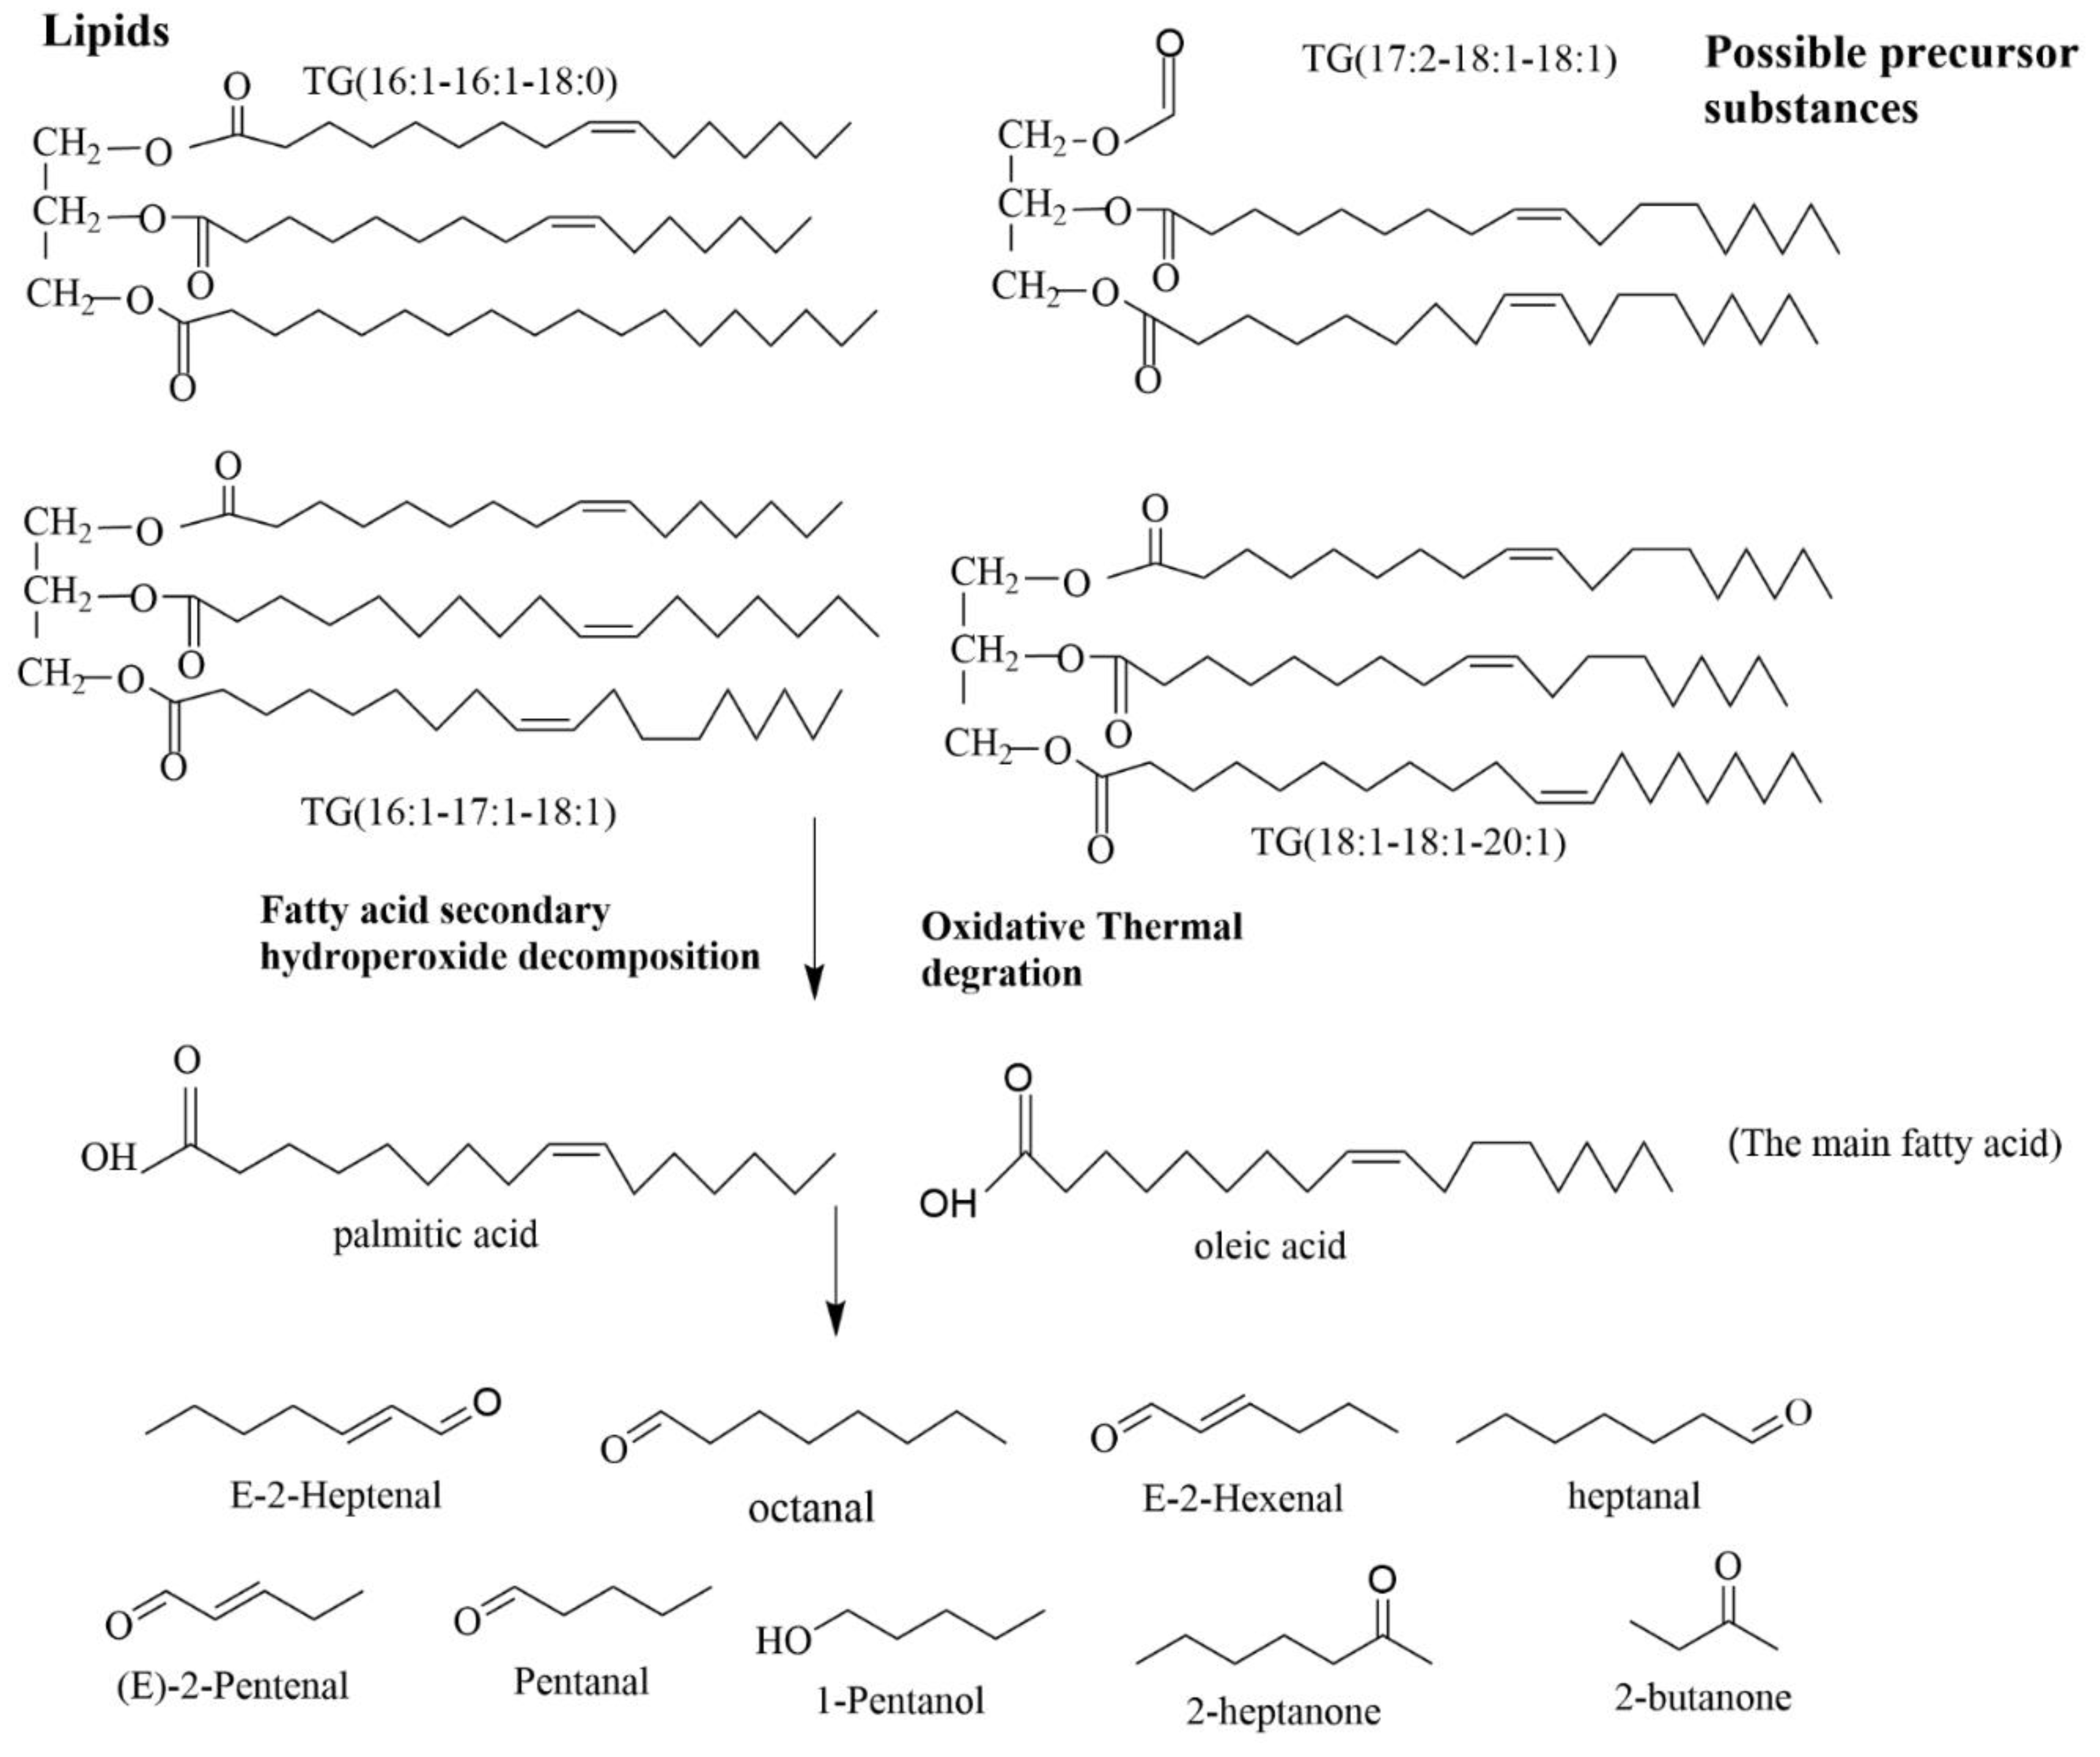

Table 1.
Determination results for AV, PV, and water content of DL and WL.
| Classification | WL | DL |
|---|---|---|
| PV (g/100g) | 0.066±0.001 | 0.083±0.003* |
| AV (mg KOH/g) | 0.675±0.010 | 0.895±0.033* |
| Water content (%) | 0.12±0.0009 | 0.11 ±0.04 |
Note:* indicate significant differences at p<0.05. DL: dry rendering lard; WL: wet rendering lard.
Table 2.
The volatile compound identifications via GC-IMS of WL and DL.
| WL | DL | ||||||
|---|---|---|---|---|---|---|---|
| No | Compound | Formula | MW | RI | Rt (s) | Concentration (μg/100g Lard) | |
| 1 | (E)-2-Nonenal | C9H16O | 140.2 | 1577 | 1479.388 | 13.38±1.89 | 17.81±1.28* |
| 2 | Benzaldehyde | C7H6O | 106.1 | 1551.1 | 1398.721 | 11.06±0.44 | 16.11±0.28*** |
| 3 | (E,E)-2,4-Heptadienal | C7H10O | 110.2 | 1520.2 | 1308.643 | 11.07±0.46 | 13.04±0.27** |
| 4 | (E)-2-Octenal | C8H14O | 126.2 | 1442.8 | 1106.975 | 8.94±0.49 | 20.31±0.31*** |
| 5 | Nonanal | C9H18O | 142.2 | 1407.6 | 1025.979 | 9.77±0.71 | 25.4±0.58*** |
| 6 | (E)-2-Heptenal-M | C7H12O | 112.2 | 1334.6 | 876.241 | 34.64±0.75 | 63.05±0.47*** |
| 7 | (E)-2-Heptenal-D | C7H12O | 112.2 | 1334.3 | 875.567 | 3.83±0.43 | 9.06±0.44*** |
| 8 | Octanal | C8H16O | 128.2 | 1302.5 | 817.541 | 4.43±0.35 | 17.39±0.33*** |
| 9 | (E)-2-Hexenal-M | C6H10O | 98.1 | 1234 | 710.356 | 27.87±0.69 | 40.71±0.45*** |
| 10 | (E)-2-Hexenal-D | C6H10O | 98.1 | 1234 | 710.356 | 2.02±0.05 | 4.68±0.06*** |
| 11 | Heptanal-M | C7H14O | 114.2 | 1198.8 | 661.26 | 17.6±0.41 | 52.88±0.41*** |
| 12 | Heptanal-D | C7H14O | 114.2 | 1199.2 | 661.8 | 1.84±0.25 | 11.96±0.09*** |
| 13 | 3-Methyl-2-butenal | C5H8O | 84.1 | 1192.8 | 653.168 | 13.38±0.89* | 11.66±0.51 |
| 14 | (E)-2-Pentenal-M | C5H8O | 84.1 | 1150.6 | 565.767 | 50.21±0.62 | 65.14±0.34*** |
| 15 | (E)-2-Pentenal-D | C5H8O | 84.1 | 1151.4 | 567.386 | 7.9±0.28 | 14.75±0.15*** |
| 16 | Hexanal-M | C6H12O | 100.2 | 1103.5 | 481.604 | 122.05±7.19 | 189.77±2.18*** |
| 17 | Hexanal-D | C6H12O | 100.2 | 1103.9 | 482.143 | 41.26±8.98 | 122.53±8.9*** |
| 18 | Pentanal-M | C5H10O | 86.1 | 1003.6 | 359.674 | 76.66±0.72 | 100.04±1.06*** |
| 19 | Pentanal-D | C5H10O | 86.1 | 1003.4 | 359.515 | 55.24±1.36 | 141.32±2.23*** |
| 20 | 2-Methylbutanal | C5H10O | 86.1 | 932 | 306.038 | 5.59±0.1 | 18.21±0.65*** |
| 21 | 3-Methylbutanal | C5H10O | 86.1 | 931.4 | 305.624 | 0.69±0.04 | 16.84±0.66*** |
| 22 | Butanal-M | C4H8O | 72.1 | 890.6 | 279.539 | 22.41±0.71 | 39.11±1.3*** |
| 23 | Butanal-D | C4H8O | 72.1 | 890.9 | 279.746 | 7.74±0.22 | 20.79±0.66*** |
| 24 | 2-Propenal | C3H4O | 56.1 | 864.4 | 264.013 | 89.84±0.48*** | 61.07±1.54 |
| 25 | Propanal-M | C3H6O | 58.1 | 818.3 | 238.756 | 87.07±1.02 | 96.3±0.76*** |
| 26 | Propanal-D | C3H6O | 58.1 | 818.7 | 238.963 | 96.24±2.26 | 165.59±2.68*** |
| 27 | Acetaldehyde | C2H4O | 44.1 | 764 | 212.05 | 102.6±2.26 | 117.75±3.65** |
| Aldehydes | Subtotal | 925.33±9.09 | 1473.25±11.8 | ||||
| 28 | Propanoic acid | C3H6O2 | 74.1 | 1637.6 | 1686.433 | 47.27±6.19 | 64.19±12.14 |
| 29 | Acetic acid | C2H4O2 | 60.1 | 1505.8 | 1268.309 | 265.5±18.64 | 297.41±19.08 |
| Acids | Subtotal | 312.77±22.07 | 361.59±11.96 | ||||
| 30 | 1-Octen-3-ol | C8H16O | 128.2 | 1490.3 | 1226.631 | 4.36±0.69 | 8.58±0.56** |
| 31 | 2-Ethyl-1-hexanol | C8H18O | 130.2 | 1544.8 | 1379.898 | 11.72±1.07 | 12.74±0.74 |
| 32 | 1-Heptanol | C7H16O | 116.2 | 1490.3 | 1226.631 | 8.35±0.69 | 11.77±0.16** |
| 33 | Tetrahydrolinalool | C10H22O | 158.3 | 1422.3 | 1059.045 | 3.04±0.7 | 7.18±0.31*** |
| 34 | 1-Hexanol | C6H14O | 102.2 | 1373.7 | 953.416 | 1.89±0.15 | 4.49±0.71** |
| 35 | 1-Pentanol-M | C5H12O | 88.1 | 1268.1 | 761.54 | 12.03±0.1 | 45.22±0.64*** |
| 36 | 1-Pentanol-D | C5H12O | 88.1 | 1267.8 | 761.07 | 1.54±0.15 | 5.65±0.14*** |
| 37 | 1-Penten-3-ol | C5H10O | 86.1 | 1177.4 | 620.258 | 35.47±0.86 | 40.35±0.34*** |
| 38 | 1-Butanol-M | C4H10O | 74.1 | 1162.3 | 588.966 | 26.82±0.62 | 37.64±0.51*** |
| 39 | 1-Butanol-D | C4H10O | 74.1 | 1162.5 | 589.506 | 1.39±0.12 | 2.46±0.28** |
| 40 | 1-Propanol | C3H8O | 60.1 | 1057.4 | 420.099 | 7.1±0.15 | 12.09±0.08*** |
| 41 | Ethanol-M | C2H6O | 46.1 | 947.4 | 316.489 | 181.66±0.48 | 185.24±1.61* |
| 42 | Ethanol-D | C2H6O | 46.1 | 946.7 | 315.983 | 228.47±3.59 | 232.53±0.76 |
| 43 | 2-Propanol | C3H8O | 60.1 | 934.5 | 307.694 | 36.14±1.04*** | 19.8±0.43 |
| 44 | 3-Methyl 1-butanol | C5H12O | 88.1 | 1222.7 | 694.258 | 1.54±0.37 | 1.66±0.04 |
| 45 | Methanol | CH4O | 32 | 908.4 | 290.658 | 84.37±3.97 | 84.17±6.82 |
| Alcohols | Subtotal | 645.86±3.73 | 711.57±7.95 | ||||
| 46 | 2-Ethylpyrazine | C6H8N2 | 108.1 | 1354.1 | 913.921 | 2.71±0.12 | 3.22±0.02** |
| 47 | 2-Pentylfuran | C9H14O | 138.2 | 1245.8 | 727.62 | 2.5±0.21 | 5.06±0.16*** |
| Heterocyclic compounds | Subtotal | 5.21±0.23 | 8.28±0.16 | ||||
| 48 | 1-Hydroxy-2-propanone | C3H6O2 | 74.1 | 1317.9 | 845.205 | 4.51±0.6 | 7.74±0.44** |
| 49 | 2-Heptanone-M | C7H14O | 114.2 | 1195.2 | 656.405 | 6.67±0.21 | 20.98±0.17*** |
| 50 | 2-Heptanone-D | C7H14O | 114.2 | 1195.2 | 656.405 | 0.82±0.06 | 2.76±0.14*** |
| 51 | 4-Methyl-3-penten-2-one | C6H10O | 98.1 | 1129.5 | 526.383 | 7.61±0.04 | 8.74±0.19*** |
| 52 | 1-Penten-3-one-M | C5H8O | 84.1 | 1044.7 | 404.993 | 9.67±0.09 | 13.83±0.07*** |
| 53 | 1-Penten-3-one-D | C5H8O | 84.1 | 1044.2 | 404.454 | 0.97±0.03 | 1.67±0.1*** |
| 54 | 2-Pentanone | C5H10O | 86.1 | 999.5 | 355.466 | 5.45±0.05 | 6.82±0.16*** |
| 55 | 2-Butanone-M | C4H8O | 72.1 | 915.3 | 295.066 | 24.27±0.27 | 31.45±0.22*** |
| 56 | 2-Butanone-D | C4H8O | 72.1 | 915.6 | 295.273 | 3.91±0.1 | 8.11±0.2*** |
| 57 | Acetone | C3H6O | 58.1 | 837 | 248.693 | 29.66±0.89 | 42.92±0.88*** |
| 58 | 3-Hydroxy-2-butanone | C4H8O2 | 88.1 | 1301.9 | 816.467 | 2.47±0.38 | 3.6±0.26* |
| 59 | 2,3-Butanedione | C4H6O2 | 86.1 | 994.1 | 350.47 | 1.38±0.05 | 1.95±0.19** |
| Ketones | Subtotal | 97.37±0.67 | 150.56±1.41 | ||||
| 60 | Ethyl butanoate | C6H12O2 | 116.2 | 1040.5 | 400.138 | 5.87±0.18* | 5.27±0.22 |
| 61 | Ethyl acetate-M | C4H8O2 | 88.1 | 897.6 | 283.887 | 29.55±1.55** | 24.41±0.66 |
| 62 | Ethyl acetate-D | C4H8O2 | 88.1 | 897.6 | 283.887 | 10.16±0.86** | 7.45±0.26 |
| Esters | Subtotal | 45.58±2.55 | 37.12±0.73 | ||||
| 63 | Thiophene | C4H4S | 84.1 | 1033 | 391.505 | 137.69±1.47 | 136.68±0.44 |
| 64 | Toluene | C7H8 | 92.1 | 1066.7 | 431.491 | 24.36±0.25 | 27.96±0.43*** |
| 65 | 1 | * | 0 | 1067.1 | 431.969 | 5.73±0.1 | 6.7±0.06*** |
| 66 | 2 | * | 0 | 1206.6 | 671.868 | 0.82±0.11 | 1.45±0.08** |
| 67 | 3 | * | 0 | 1170.4 | 605.673 | 1.95±0.07 | 2.89±0.08*** |
| Others | Subtotal | 170.55±1.56 | 175.69±0.92 | ||||
| Total | 2202.67±26.6 | 2918.06±22.35 | |||||
The values are the means ± standard deviation; *: p<0.05; **: p<0.01; ***: p<0.001.
Disclaimer/Publisher’s Note: The statements, opinions and data contained in all publications are solely those of the individual author(s) and contributor(s) and not of MDPI and/or the editor(s). MDPI and/or the editor(s) disclaim responsibility for any injury to people or property resulting from any ideas, methods, instructions or products referred to in the content. |
© 2025 by the authors. Licensee MDPI, Basel, Switzerland. This article is an open access article distributed under the terms and conditions of the Creative Commons Attribution (CC BY) license (http://creativecommons.org/licenses/by/4.0/).
Copyright: This open access article is published under a Creative Commons CC BY 4.0 license, which permit the free download, distribution, and reuse, provided that the author and preprint are cited in any reuse.


