Preprint
Article

This version is not peer-reviewed.

The Overall Quality Changes of Chinese Sauced Ducks at Different Stages during Processing and Storage

A peer-reviewed article of this preprint also exists.

Submitted:

10 February 2025

Posted:

10 February 2025

You are already at the latest version

Abstract

This study revealed the physicochemical, microbial, flavor and sensory changes in sauced duck from the marinating phase to the end of storage, divided into six stages (stages A-F). The changes in color, total plate count, total volatile basic nitrogen, and thiobarbituric acid reactive substance at different stages were clarified. We utilized 16S rRNA gene sequencing, GC-IMS, and GC-MS to explore the changes in bacterial flora, fatty acid composition, and flavor characters. The dominant bacteria identified in stages A-C included Psychrobacter, Flavobacterium, and Pseudomonas, while Lactobacillus and Staphylococcus dominated during stages D-F. Aldehydes, esters, alcohols, and ketones emerged as the main flavor compounds. Several unsaturated fatty acids significantly (P< 0.05) decreased from stage A to stage F. The sensory quality of sauced duck improved. The potential reactions and correlation analysis of sauced duck samples across different stages were performed. 3-Methy-1-butanol could be a crucial indicator of sauced duck’s overall quality. This research could support reference for the treatment optimization of sauced duck products.

Keywords: 
;  ;  ;  ;  ;  

1. Introduction

China has the highest consumption of duck meat globally, accounting for over 70% of global production (Li et al., 2022; Lyu et al., 2021). In Zhejiang Province, locals typically select Shaoxing pockmark duck (Anas platyrhyncha var. domestica) as raw material for the sauced duck. Chinese consumers widely favor this traditional sauced duck product for its delicious taste, unique flavor, and desirable textural properties. Duck meat is rich in high-quality protein and poly-unsaturated fatty acids (PUFA), including C18: 2 and C18: 3 (Arshad et al., 2020). The processing methods of sauced duck vary across different regions in China. Therefore, sauced duck’s flavor compounds and sensory qualities may differ due to different processing methods (Chang et al., 2023; Zhu et al., 2023). In Zhejiang Province, the cooking and drying treatments for sauced duck are performed after marinating, which brings an intense aroma and delicious taste and is highly favored by consumers (Fan et al., 2024). Additionally, the natural air drying and sun drying during storage could strengthen the aroma and taste of sauced duck.
However, previous studies of duck meat have yet to deal with the flavor and sensory development during processing and storage. The processing properties of Shaoxing duck need to be further explored. Sauced duck is highly vulnerable to bacterial growth and spoilage due to its high moisture content (Liu et al., 2019). Also, the flavor development might be highly related to bacterial flora, especially during storage. It still need to discover the change rule of sauced duck during processing and storage, especially from the perspective of marinating to storage.
Therefore, this work aimed to investigate the physicochemical, microbial, chemical, and flavor changes in sauced ducks from the marinating treatment to the end of storage. The change in flavor compounds was clarified, and relevant potential correlations were further analyzed. This work could provide a basis for optimizing the processing and storage of sauced duck and improving its overall quality.

2. Materials and Methods

2.1. Chemicals and Reagents

The aqueous solutions were prepared using ultrapure water. All chromatographic grade reagents were purchased from Sigma-Aldrich Chemical Co., Ltd. Other analytical grade chemicals and reagents were all purchased from Aladdin Co., Ltd. All spice food additives were food-grade.

2.2. Sauced Duck Preparation

Lanhai Ecological Agriculture (Hangzhou, Zhejiang Province, China) Co., Ltd. provided fresh duck carcasses and the main production methods of sauced duck. Three-year-old laying Shaoxing pockmark ducks were slaughtered to make sauced ducks. The primary production process included marinating, cooking, drying, and preserving. Marinating ingredients contain more than ten spices (cinnamon, star anise, allspice, pepper, etc.). The carcasses were marinated in the mixture for 72 h and were flipped sides every 24 h. The packet was boiled with soy sauce and yellow wine for 10 min during the cooking process. The drying treatment was conducted within a 50 - 60 ℃ temperature range for 15 h. All dried samples were stored at room temperature and exposed to the air circulation and nature lights on sunny days, based on the chief engineer’s experience.

2.3. Experimental Group Design

12 parallel samples were collected from 72 Shaoxing pockmark duck samples at six stages. All main body parts (including duck leg, breast, and wing) were tested for all indexes and the mean values were calculated in this study. The processing and storage treatment of all parallel samples was the same. A-F represents each of the six sampling stages in sequential order. Concretely, stage A stands for after marinating and before cooking; B stands for after cooking and before drying; C stands for samples collected after drying and before storage; D, E, and F stand for stored for 5, 10, and 15 d, respectively.

2.4. Determination of Edible Indexes

The color, total plate count (TPC), total volatile basic nitrogen (T-VBN), and thiobarbituric acid reactive substance (TBARS) values are essential indexes of evaluating whether the sauced duck is edible.
Color: We measured the surface color values of the duck sample with a Minolta colorimeter (CR-10 Plus, Minolta, Japan).
TPC: The determination of TPC was also strictly performed according to our previous study (Liu et al., 2019). Briefly, 25 g of sample was placed into 225 ml of sterile 0.85% sodium chloride (NaCl) solution and homogenized in a Bag-Mixer (Inter-science Ltd., France) for 2 min. Samples were plated on agar plates (Land Bridge Co., Ltd., China) and incubated at 37°C for 48 h. The TPC was expressed as log10 CFU/g meat.
T-VBN: T-VBN was determined according to Liu et al. (2019). Briefly, 20 g of sample was homogenized in 2% trichloroacetic acid at 5000 rpm for 1 min. The mixture was filtered and added with 1% magnesium oxide (MgO) solution. The liberated T-VBN was absorbed utilizing a 2% boric acid solution, and titrated with a 0.01 N hydrochloric acid (HCl) solution. The result was expressed as mg/100 g of sample.
TBARS: We analyzed the value of TBARS with malondialdehyde (MDA) assay kit (Jiancheng Ltd., China) following the manufacturer’s instruction and the result was expressed as mg of MDA per kg.

2.5. Fatty Acid Analysis

The fatty acid (FA) composition was determined according to the method of Duan et al. (2023). The minced sample was added with chloroform–methanol solution (1: 2: 0.8, v/v/v) and extracted for the fat content using saturated salt water. After saponifying fat content, we removed water using Na2SO4 and dissolved it with hexane. The 7890B-7000C gas chromatography-mass spectrometry (GC–MS) system (Agilent, CA, USA) equipped with a capillary column (CD-2560, 100 m × 250 μm × 0.20 μm; CNW, Germany) was applied. The FA were identified using the NIST 14 database. In this study, FA were classified as saturated fatty acid (SFA), mono-unsaturated fatty acid (MUFA), PUFA, and cholesterol.

2.6. Sensory Evaluation

The method was referenced from the Xu et al. (2023). The sensory evaluation was conducted by ten professionally-trained panelists, aged 20 – 30, including five males and five females. We signed an agreement with all participants to use and study their information. In line with the agreement, all participants’ privacy rights are committed being protected fully. All duck meat samples were water rinsed, cut into even-sized pieces, and placed into clean glass jars. In order to simulate the general consumption mode of sauced duck, these samples were steamed in boiling water until the core temperature exceeded 75 °C. All cooked samples were provided as blind samples. Panelists could not communicate with each other during the sensory evaluation. The concrete criteria are shown in Table S1. Before each tasting, all panelists should rinse their mouths thoroughly to ensure no residues interfere.

2.7. Microbial Community Analysis

The 16S rRNA gene sequencing was performed based on the previous studies (Li et al., 2022; Ma et al., 2024). Sequencing libraries were generated using Next® Ultra™ DNA Library Prep Kit for Illumina (New England Biolabs, USA). The library quality was assessed using Qubit 2.0 Fluorometer (Thermo Fisher Co., USA) and Bioanalyzer 2100 system (Agilent Co., USA). The library was sequenced on Mi-Seq platform (Illumina Co., USA). Paired-end reads from the original DNA fragments were merged using FLASH (Johns Hopkins University, USA). Sequences analysis was performed by UPARSE (Independent Investigator, California, USA), according to Edgar. (2013).
Sequences with more than 97% similarity were assigned to the same OTUs. The relative abundances were visualized using the Krona chart referred to Ondov et al. (2011). The heat map was drawn with software R 4.2.2. Effect Size (LEfSe) analysis was used for identifying biomarkers within different groups (Figure 1). To identify differences in microbial species, ANOSIM and MRPP were performed based on the Bray-Curtis dissimilarity distance matrices. Species with an LDA score of more than four were identified as biomarkers. Rarefaction curves were found based on these metrics (Figure S1). We calculated three metrics: Chao1, Simpson, and the Shannon index (Figure S2). Cluster analysis was preceded by principal component analysis (PCA) in Figure S1 using the QIIME (version 1.8.0, Knight Lab, University of California, USA). We used unweighted unifrac distance for PCoA and UPGMA clustering (Figure S2).

2.8. Gas Chromatography-Ion Mobility Spectrometry Analysis

The volatile flavor compounds were determined by a Flavor spec® gas chromatography-ion mobility spectrometry (GC-IMS) system (G.A.S, Germany). Samples were incubated at 60 °C for 20 min, and then 500 µL of gas was injected into the injector. After being ionized, the analyte was added to the ionization chamber. The main parameters set as 500 V/cm of linear voltage, 45 °C of drift tube temperature, and 75 ml/min of drift gas flow rate.
We analyzed measurement data in IMS using the VOCal software 0.4.03. The retention index (RI) was calculated according to the retention time and ion migration time of volatile substances in GC. The substances were clarified by matching the GC-IMS database and NIST 2020. The description of flavor compounds was identified according to the Flavor Ingredient Library (https://www.femaflavor.org/flavor-library) and the LRI& odour database (http://www.odour.org.uk).

2.9. Statistical Analysis

The present study employed ANOVA analysis of variance and an independent t-test to assess differences in the groups, utilizing Duncan’s test from SPSS Statistics 26.0 (IBM Co., USA). The significance level for this study was established at P < 0.05. The Pearson correlation analysis was calculated by SAS 9.1.3 Software (SAS Institute Inc., USA). The heat maps of Pearson Correlation Analysis were generated by Graphpad Prism Software 8.3.0.

3. Results and Discussion

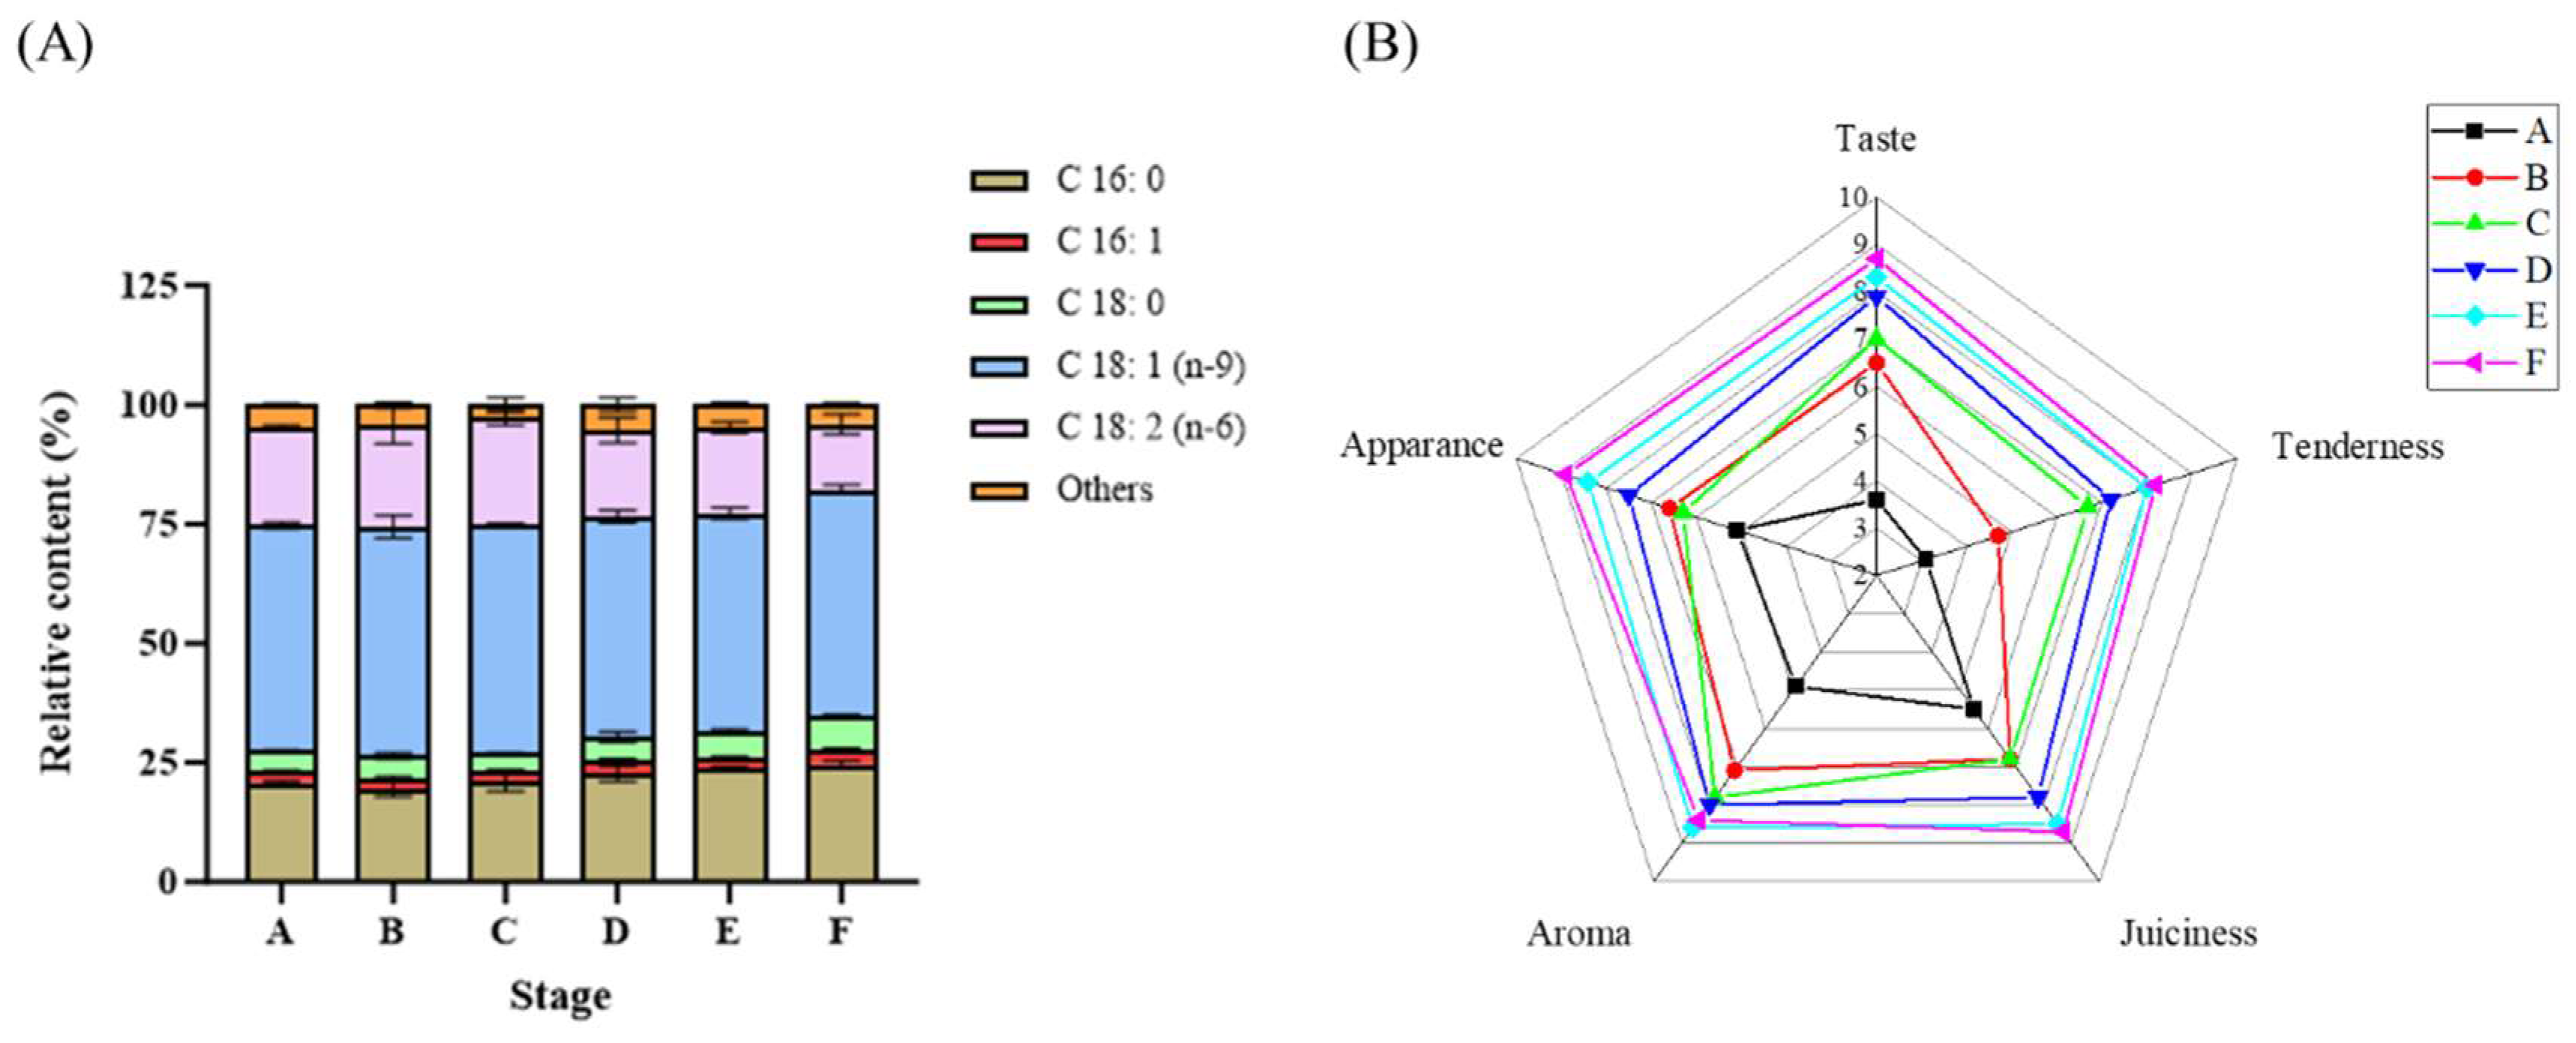
3.1. Chemical and Physical Changes of Samples Across Different Stages Were Analyzed

The color, TPC, T-VBN, and TBARS results are shown in Table 1. Color is a crucial sensory indicator for sauced duck and affects the human appetite. In this study, the marinating and drying treatment significantly (P < 0.05) influenced the L* values. The insignificant correlations of a* values might be due to the marinating treatment. Duck meat products are ideal mediums for microbial growth (Geeraerts et al., 2017; Liu et al., 2019; Mann et al., 2015). The unpacked samples with high water activity were vulnerable to microbial growth and contamination. Cooking and drying treatment could inhibit microbial growth by regulating temperature and humidity. The TVBN and TBARS significantly (P < 0.05) increased at stages D-F (Table 1). T-VBN, which is highly correlated with their off-odor, is as a critical indicator of spoilage for meat samples (Bassey et al., 2018; Senapati & Sahu, 2020). The high T-VBN and TBARS values at stage F revealed the limited shelf-life.
Xia et al. (2021) reported the relative contents of C16:0, C18:0 and SFA were 50.11 - 58.42%, 33.86 - 38.03%, and 85.59 - 92.88% in sauced duck samples, which are similar to our findings (Figure 2A). The relative content of C18: 2 (n-6) significantly (P < 0.05) decreased (20.56 ± 0.46% to 13.64 ± 2.13%); C18: 1 (n-9) presented insignificant change. Moreover, the relative contents of C18: 3 (n-6), C20: 4 (n-6), and C22: 6 (n-6) also significantly decreased (P < 0.05) from stage A to F. All referred UFA accounted for an even lower relative content at stage F. The oxidation and lipolysis of FA, especially for C18: 2 (n-6) and C18: 3 (n-6), produced alcohols, aldehydes, and ketones, which were responsible for abundant aroma as well as “rancid” off-flavors after storage (Liu et al., 2022; Zhou et al., 2022). The change of FA composition was consistent with the increase in TBARS values. Previous studies presented similar results (Shi et al., 2019; Xia et al., 2021; Zhou et al., 2022).
In our research, sensory factors included taste, tenderness, juiciness, aroma, and appearance (Figure 2B). The previous studies mainly focused on analyzing the sensory change in sauced duck during storage. The change rule of sensory quality during marinating, cooking, and drying was revealed in this study. Cooking and drying could significantly improve the score of taste, aroma, and tenderness. The high salt contents in marinating treatment and water losses could give duck meat a firm texture (Khan et al., 2014; Zhou et al., 2022). Sauced duck could have a more abundant aroma under the metabolism of microbes and enzymes after proper storage (Zhu et al., 2024). However, excessive storage for sauced duck could increase the values of T-VBN, TBARS, ammonia, and PUFA metabolites, negatively affecting aroma and taste. The total scores could reach a relatively high level after 15 d storage.

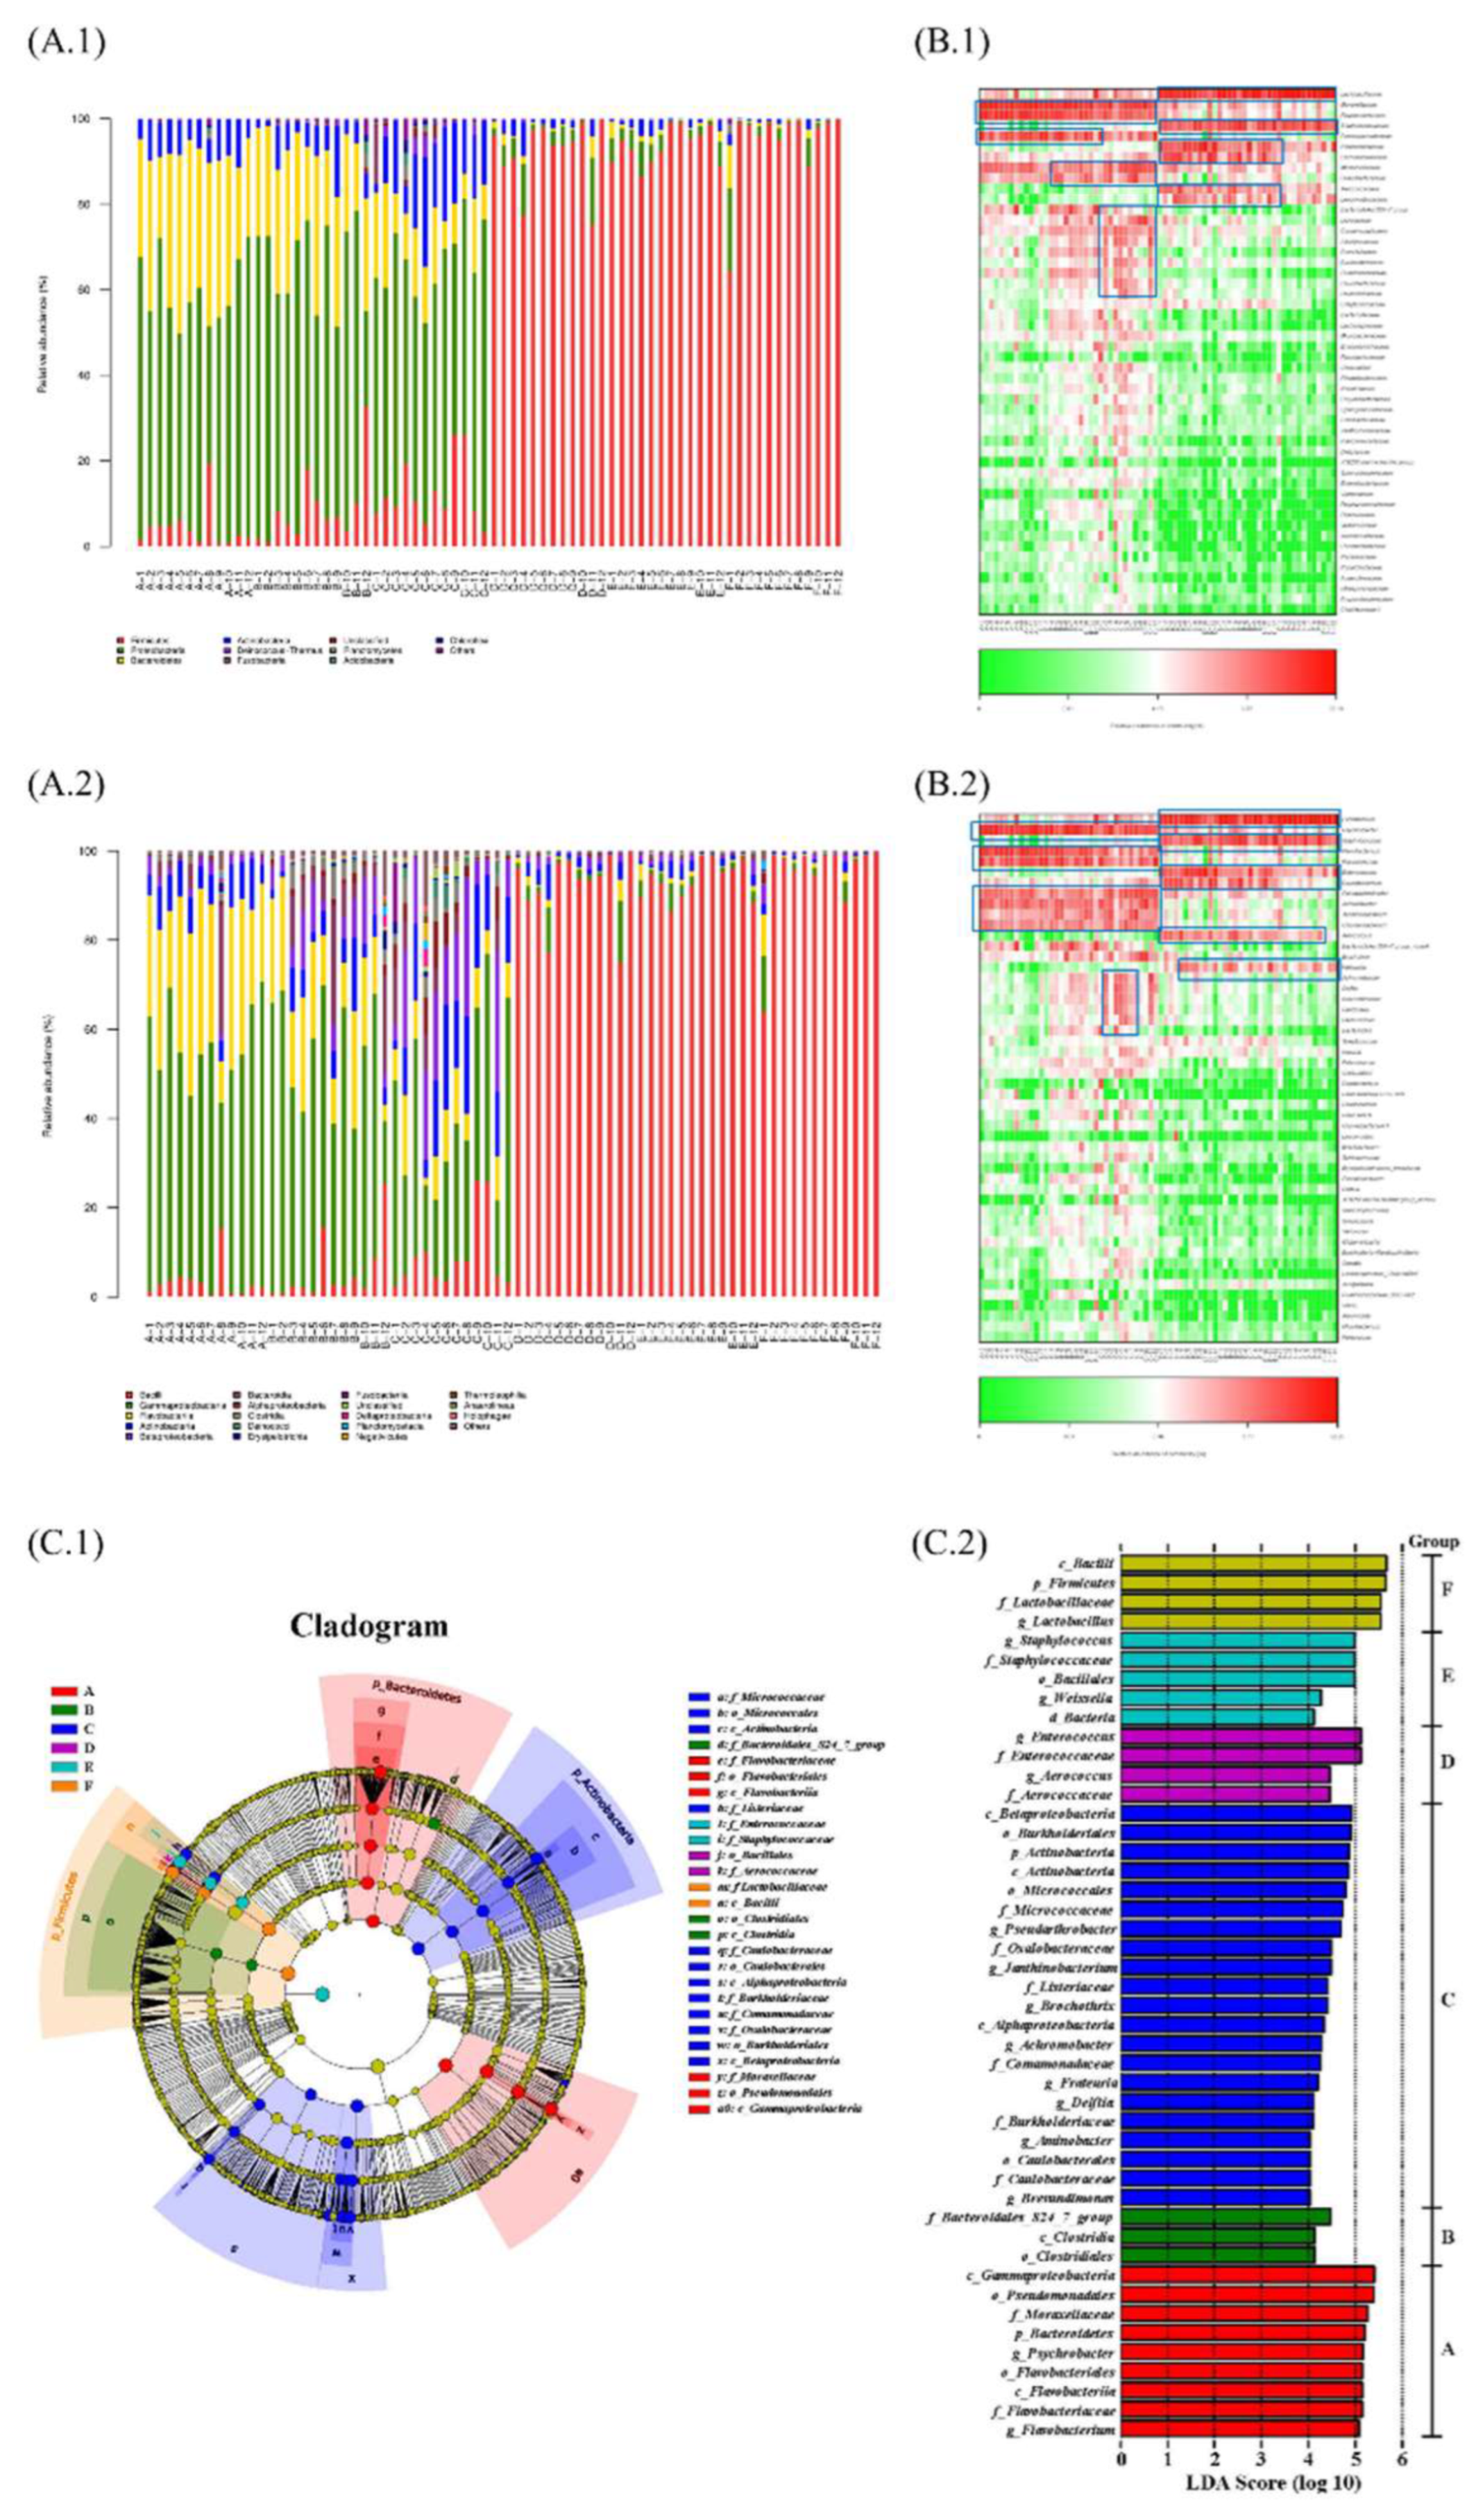
3.2. The Microbial Biomarkers of Samples Were Identified at Different Stages

Rarefaction curves in Figure S1 indicate the reliability of sequencing results. Figure 1A demonstrates the relative proportion of bacteria at different stages. At the Family level, Moraxellaceae, Flavobacteriaceae, and Pseudomonadaceae dominated during the stages A-C, which is consistent with the previous studies (Bassey et al., 2018; Li et al., 2022). At the Genus level, Psychrobacter, Flavobacterium, and Pseudomonas were the dominant genera during stages A-C. In the heat map (Figure 1B), more red spots observed during stages A-C indicate the higher bacterial abundance; Lactobacillus, Staphylococcus, and Enterococcus dominated stages D-F. As demonstrated in Figure 1C, 46 biomarkers were found, and most (n = 21) were detected at stage C. The α-diversity showed the most complex bacterial floras at stage B (Figure S2).
Two groups were distinguished in the cluster tree: one comprised mainly samples of stages A-C groups, and the other was almost found during stages D-F. Also, the potential pathogenic biomarkers at stages C (f_Listeriaceae), D (f_Enterococcus and g_Enterococcus), and E (f_Staphylococcus and g_Staphylococcus) were worthy of our vigilance. The sequencing results are consistent with previous studies (Geeraerts et al., 2017). The duck’s initial microbial load, which is related to poultry health, temporal development, and rearing conditions, could be the essential source of these pathogenic bacteria (Geeraerts et al., 2019; Ma et al., 2024). Also, the variations could be caused by several treatments, such as the slaughtering, slicing, and marinating process or during storage (Liu et al., 2019). The optimization of poultry health management and the development of the hygiene level during processing and storage are essential for sauced duck production. However, disinfection and microbial change might influence the flavor development of sauced duck.

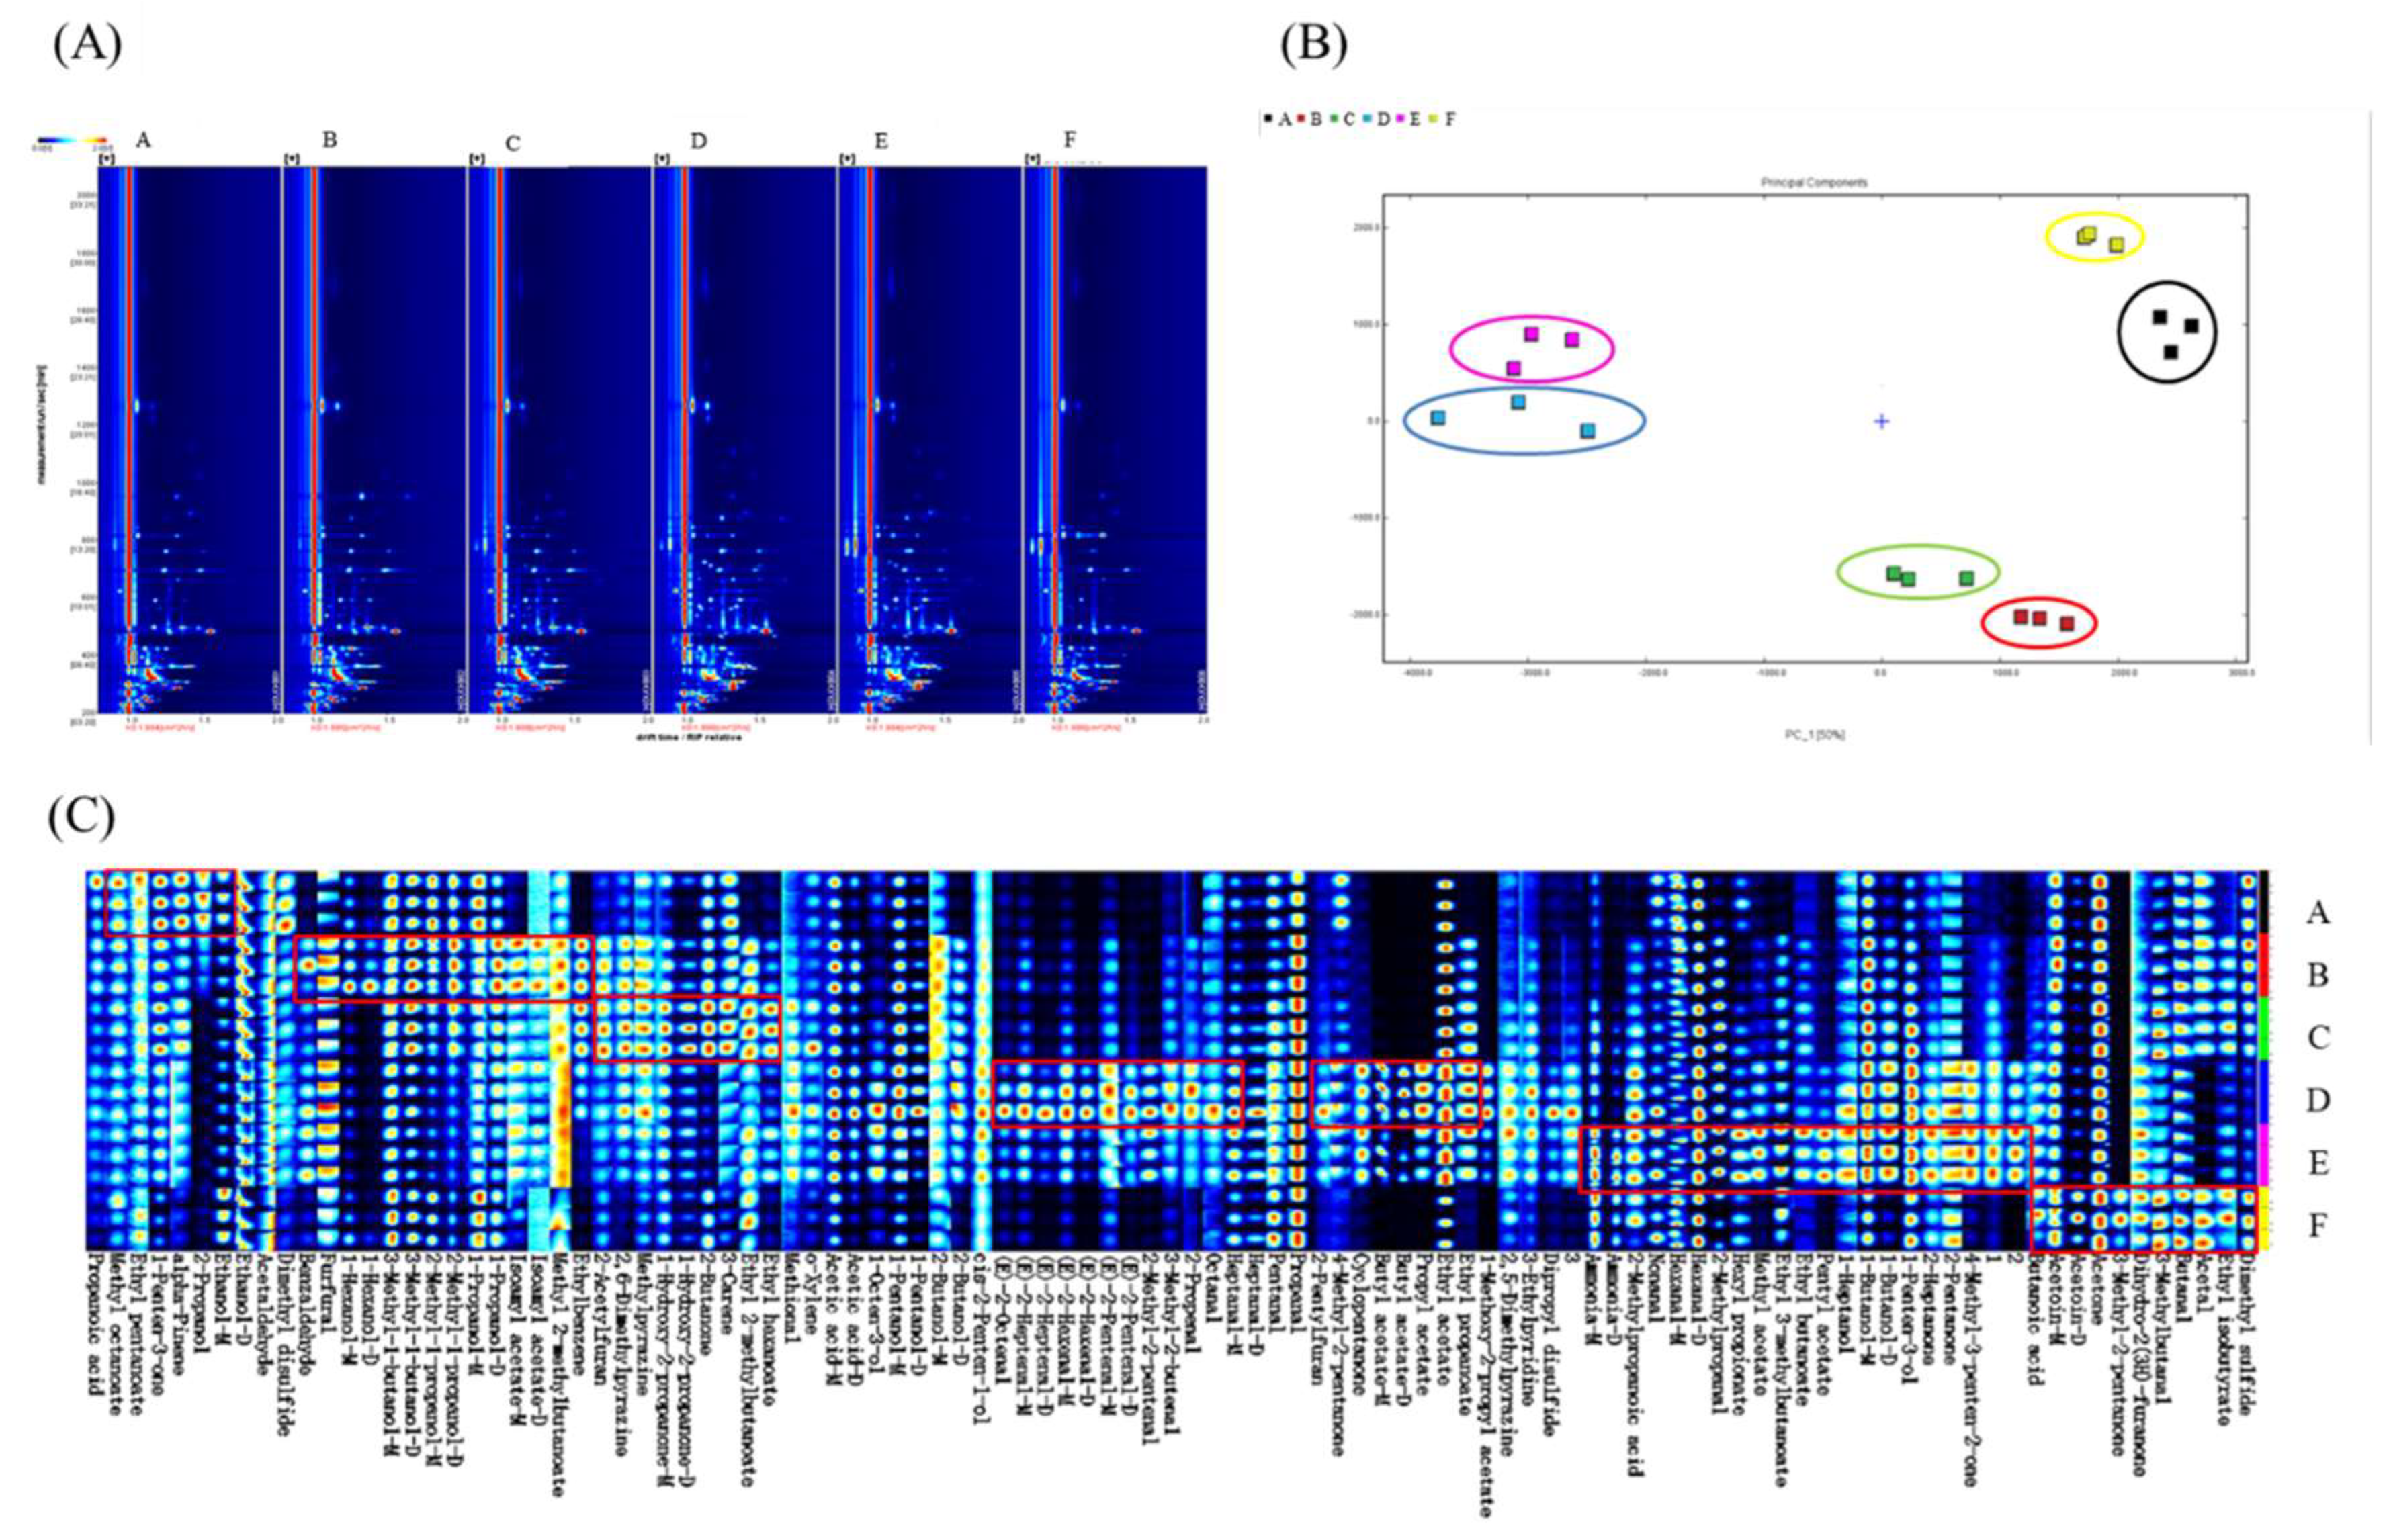
3.3. The Quantitative and Qualitative Analysis of Flavor Compounds of Samples at Different Were Performed

Aldehydes, esters, alcohols, and ketones contributed significantly to the sauced duck’s flavor (Duan et al., 2023). Rasinska et al. (2019) also reported that aldehydes, such as hexanal, octanal, heptanal, and benzaldehyde, are the most crucial compounds of sauced duck. In this study, 81 flavor compounds were clarified, including 19 aldehydes, 19 esters, 13 alcohols, 11 ketones, and four acids (Table 2 and Figure 3). Xia et al. (2021) reported 105 volatile flavor compounds, including 23 esters, 14 aldehydes, 14 ketones, and 14 alcohols, from the sauced duck samples. Ethanol was the flavor compound with the highest relative contents from stage A to F. The addition of yellow wine brought meat a mellow aroma and attractive flavor. Hexanal, ethyl acetate, acetone, acetic acid, and propanal were the main flavor compounds, constituting the characteristic flavor of sauced duck. The minimum values of acetone and hexanal as well as the maximum value of ethyl acetate were found at stage E.
According to the odor descriptions in Table 2, such chemical changes gave the samples at stage E a more robust floral and fruity aroma and less pungent, presenting a more desirable flavor. The increase in ammonia was consistent with the T-VBN value. High ammonia contents could exhibit an unpleasant odor (Liu et al., 2019).
Various flavor markers at different stages of samples were exhibited (Figure 3A). There were plenty of flavor markers at stages A-C and D-F. Ethyl pentanoate, alpha-pinene, and 2-propanol were the flavor markers at stage A. Four flavor markers were screened at both stage B (furfural, 1-hexanol, isoamyl acetate, and methyl 2-methylbutyrate) and stage C (2-acetylfuran, 1-hydroxy-2-propanone, 3-carene, and ethyl hexanoate). Both lipid oxidation and Strecker degradation could produce aldehydes and alcohols, such as 1-octen-3-ol, 1-pentanol, hexanal, and (E)-2-hexenal (Zhou et al., 2022). The high hexanal content could present a rotten odor in sauced ducks (Shi et al., 2019). However, the sensory results reflected that the odor of sauced ducks at stage F was acceptable. The interaction of flavor compounds might influence the threshold of off-flavor. The esters, mainly ethyl acetate, were derived from the esterification reactions during the cooking treatment.
During stages D-F, seven, seven, and four markers were identified. At stage D, butyl acetate, propyl acetate, 1-methoxy-2-propyl acetate, cis-2-penten-1-ol, (E)-2-octenal, 2-propenal, 2-pentylfuran, were found the flavor markers. Sauced duck samples were rich in carbonyl compounds and AA compounds, which are the primary substrates of the Maillard reaction. Therefore, the contents of furans, including furfural, 2-acetylfuran, 2-pentylfuran, and dihydro-2(3H)-furanone significantly (P < 0.05) increased during stages C-D. At stage E, apparent increases were found in the contents of ammonia, nonanal, hexyl propionate, methyl acetate, pentyl acetate, 1-butanol, and 2-heptanone. At stage F, acetoin, propanal, 3-methyl-2-pentanone, 3-methylbutanal, butanal, and acetal increased. Figure 3C exhibited the decrease in new esters and the increase in original acids and alcohols, which might account for such PCA results. Our results differ slightly from previous findings because of different processing materials and methods (Chang et al., 2023; Zhu et al., 2023).

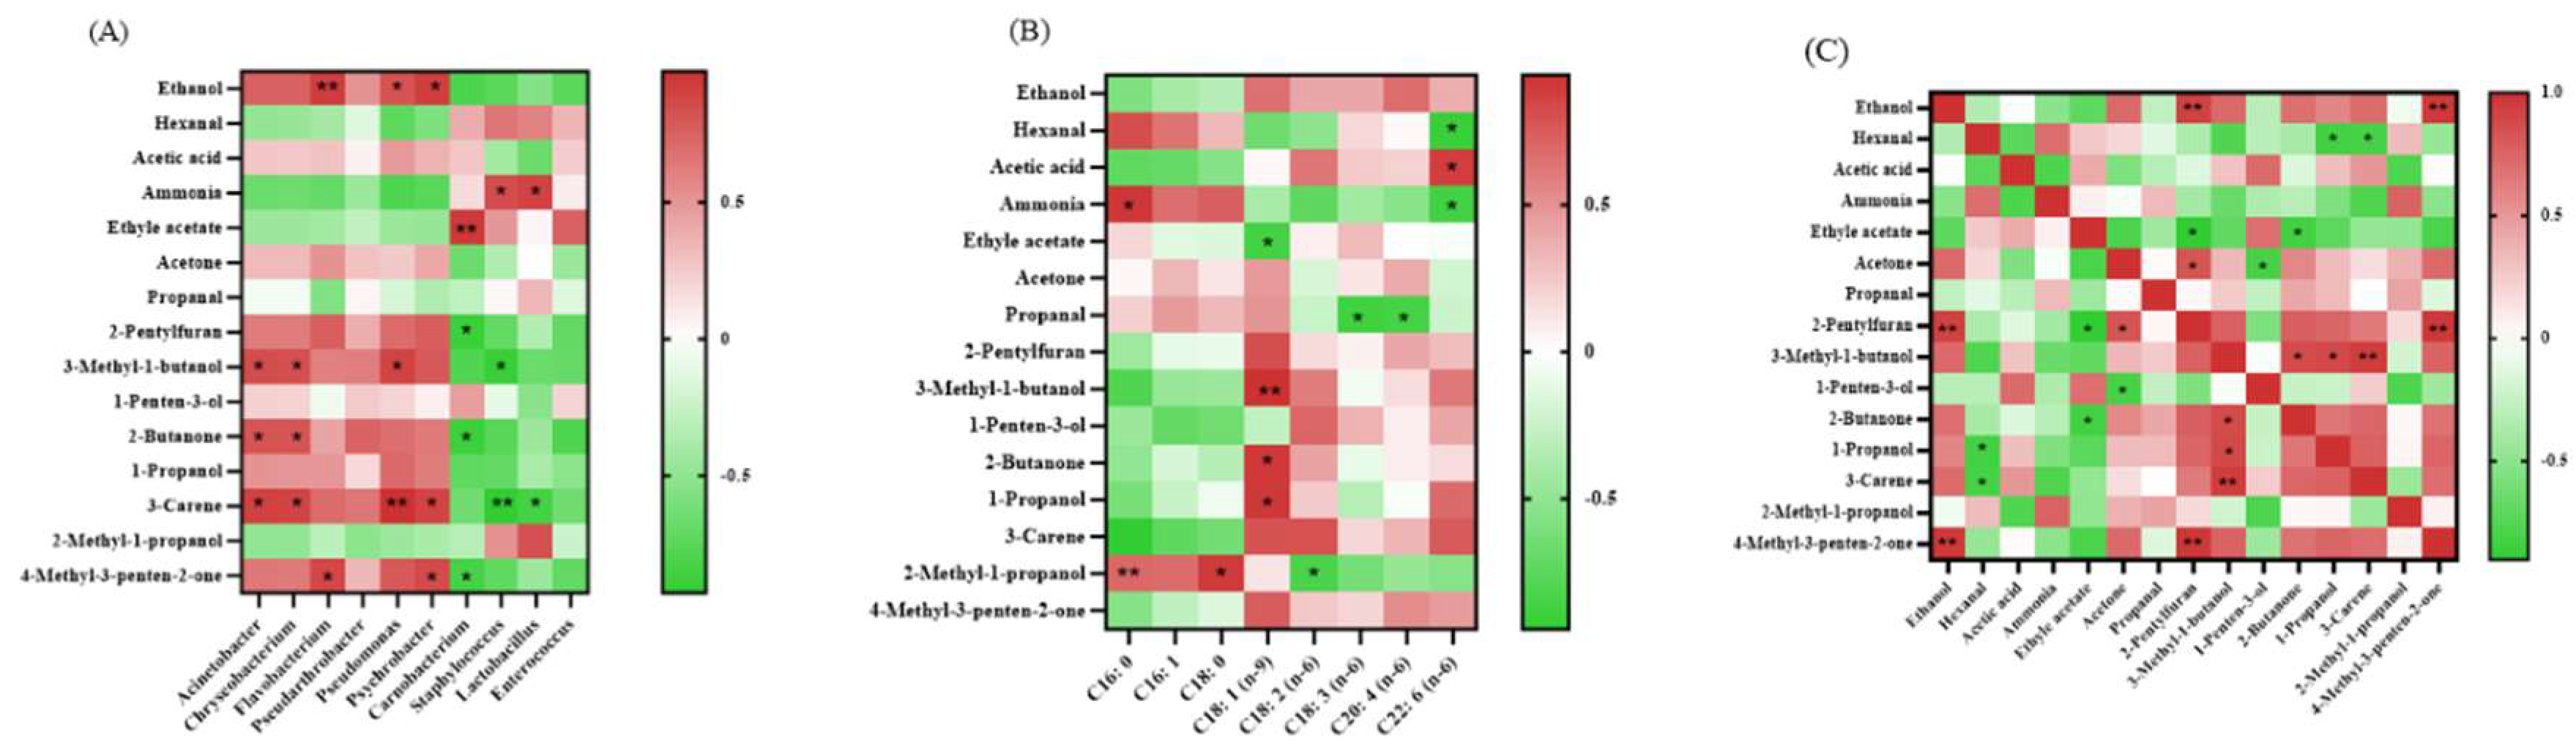
3.4. The Biomarker 3-Carene Were Clarified Through Correlation Analysis

The different thermal processing parameters of marinating, cooking, drying, and storage change accounted for the flavor development of sauced duck. The Pearson correlation analysis results were presented in Figure 5. All dominant bacteria showed significant correlation to the main flavor substances except for Pseudarthrobacter and Enterococcus (Figure 4A). The dominant bacteria of stages A-C exhibited a mainly positive correlation, which was different from the dominant bacteria of stages D-F. 3-carene showed significant correlations in six of the ten dominant bacteria.
In general, terpenes, such as 3-carene, were mostly derived from spices rather than the flavor metabolites during stages A-F (Álvarez et al., 2020). In this study, the change of C 18: 1 (n-9) presents a high correlation with the main flavor compounds in Figure 4B, which differed from previous studies. As discussed before, the change of C18: 1 (n-9) was insignificant during stages A-F. The different result could be attributed to the relatively stable properties of these flavor compounds as well as the addition of several spices and seasonings. Previous studies reported that C18: 2 (n-6) and C18: 3 (n-6) accounted for several flavor substances because of lipid oxidation and Strecker degradation (Shi et al., 2019; Zhou et al., 2022; Duan et al., 2023). The low relative contents of C18: 2 (n-6) and C18: 3 (n-6) could be an essential reason. The actual numerical relation and concrete molecular mechanism need further verification.

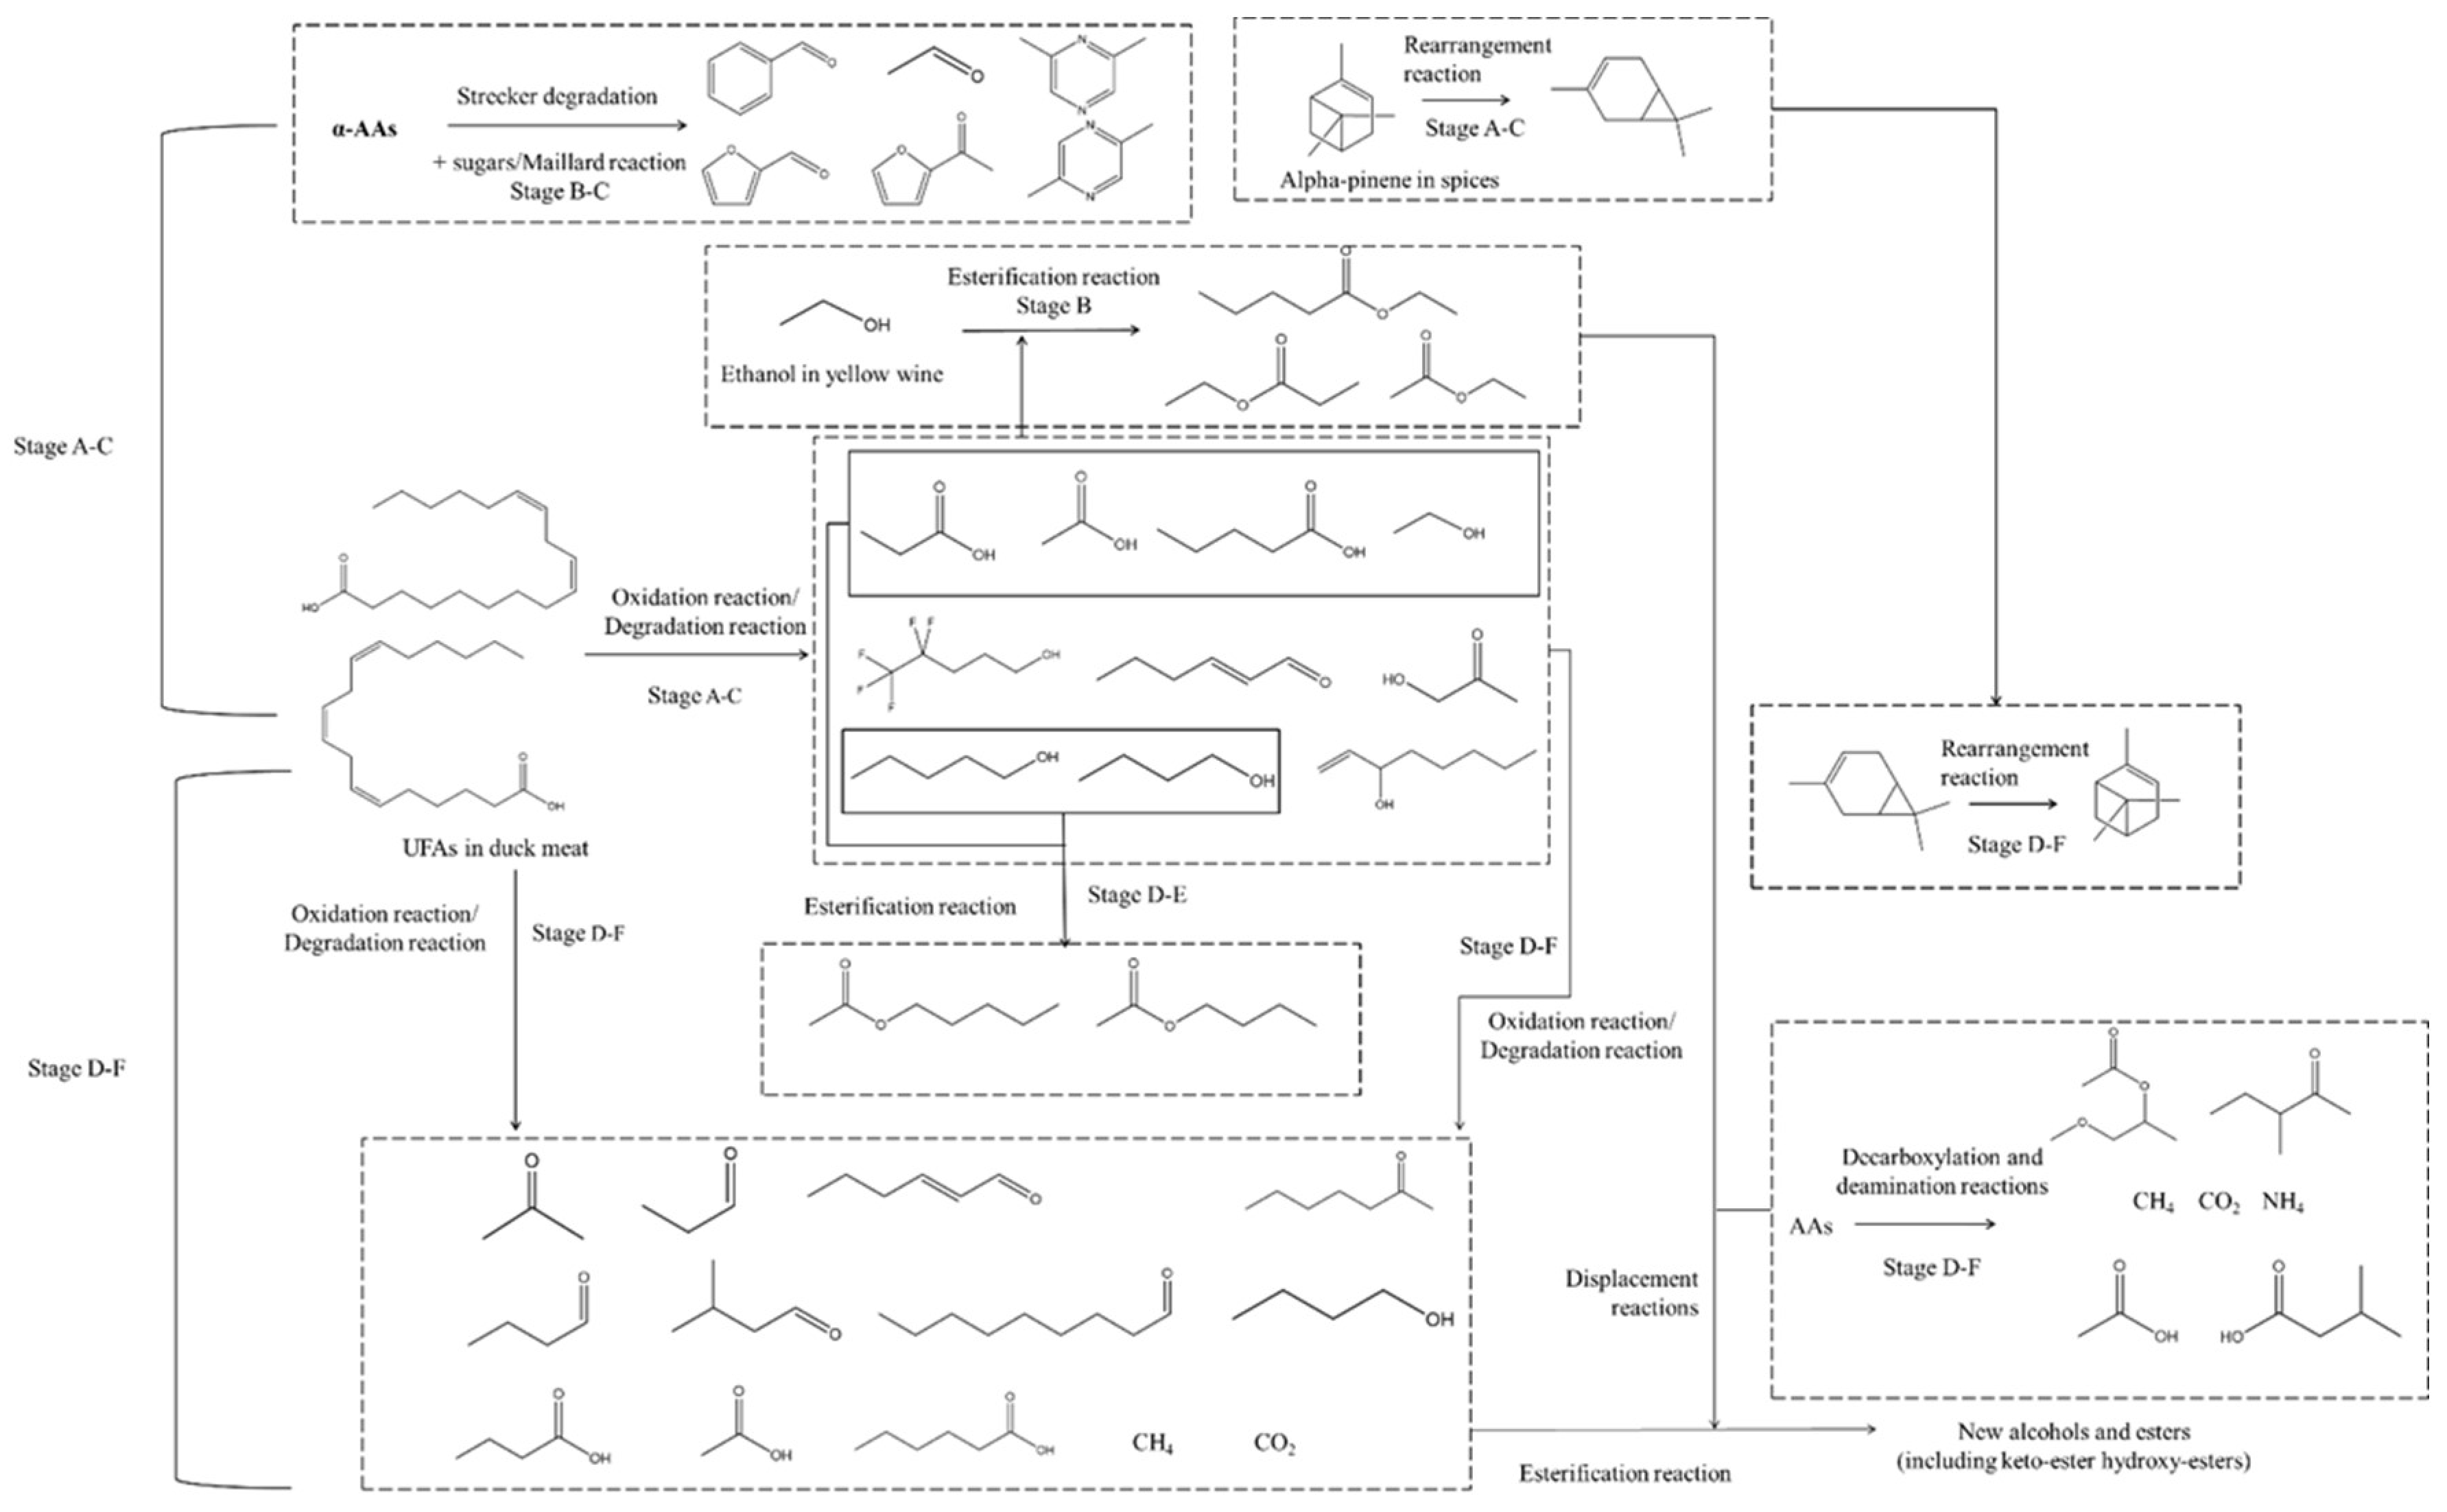
3.5. The Potential Chemical Reactions Were Predicted Based on the Previous Analysis

The correlations between main flavor compounds were presented in Figure 5C. 2-Pentylfuran and 3-methy-1-butanol were significantly correlated (P < 0.05) to more than three compounds. They are regarded as the products of the Maillard reaction and Strecker degradation (Shi et al., 2019; Duan et al., 2023). As shown in Figure 4, 3-methy-1-butanol presented a more significant correlation (P < 0.05 or 0.005) with FA and dominant bacteria compared to 2-pentylfuran. Based on the changes in FA and flavor composition results, the potential chemical reactions at different stages were depicted in Figure 5. The complex reactions, such as Maillard reaction, Strecker degradation, oxidation reaction, and esterification, were the essential reasons for the changes of FA and flavor. As the crucial compound in flavor development, 2-pentylfuran and 3-methy-1-butanol have the “Butter, Floral” description. Moreover, the content of 3-methy-1-butanol increased significantly from stage A to F, the same as the scores of sensory quality. 3-Methy-1-butanol could be an essential indicator for the quality evaluation of sauced ducks.

4. Conclusions

The present study investigated the changes in the sauced duck across six different stages. The values of edible indices and FA composition exhibited significant change (P < 0.05). The dominant bacteria of stages A-C were Psychrobacter, Flavobacterium, and Pseudomonas. Lactobacillus, Staphylococcus, and Enterococcus dominated during the stages D-F. Furan compounds were the primary Maillard reaction products in sauced duck. 3-Methy-1-butanol could serve as an indicator for the quality evaluation of sauced duck.

Supplementary Materials

The following supporting information can be downloaded at the website of this paper posted on Preprints.org.

Author Contributions

Methodology, Kaiyong Yao and Daxi Ren; Formal analysis, Jie Cai and Yingping Xiao; Investigation, Daodong Pan, Bindan Chen and Jinghui Fan; Resources, Jie Cai, Daodong Pan, Bindan Chen, Jinghui Fan and Yingping Xiao; Writing – original draft, Kaiyong Yao; Writing – review & editing, Daxi Ren; Supervision, Daxi Ren; Project administration, Kaiyong Yao; Funding acquisition, Yingping Xiao.

Data Availability Statement

The original contributions presented in the study are included in the article/supplementary material, further inquiries can be directed to the corresponding authors.

Abbreviations

The following abbreviations are used in this manuscript:
AA amino acid
ANOSIM analysis of similarities
CTAB/SDS cetyltrimethylammonium bromide/sodium docecyl sulfate-based
DT drift time
FA free fatty acid
GC-IMS gas chromatography-ion mobility spectrometry
GC-MS gas chromatography-mass spectrometry
HCl hydrochloric acid
LDA linear discriminant analysis
MDA malondialdehyde
MgO magnesium oxide
MRPP multi-response permutation procedure
MUFA mono-unsaturated fatty acid
MW molecular weight
NaCl sodium chloride
PCA principal component analysis
PCoA principal coordinate analysis
PUFA poly-unsaturated fatty acid
RI retention index
RIP rel normalization treatment
RT retention time
SFA saturated fatty acid
Stage A samples collected after marinating and before cooking
Stage B samples collected after cooking and before drying
Stage C samples collected after drying and before storage
Stage D samples stored after 5 d
Stage E samples stored after 10 d
Stage F samples stored after 15 d
TBARS thiobarbituric acid reactive substance
TPC total plate count
T-VBN total volatile basic nitrogen
UPGMA unweighted pair group method with arithmetic mean
UFA unsaturated fatty acid

References

  1. Álvarez, M.; Andrade, M.J.; García, C.; Rondán, J.J.; Núñez, F. Effects of preservative agents on quality attributes of dry-cured fermented sausages. Foods 2020, 9, 1505. [Google Scholar] [CrossRef] [PubMed]
  2. Arshad, M.S.; Kwon, J.H.; Ahmad, R.S.; Ameer, K.; Ahmad, S.; Jo, Y. Influence of E-beam irradiation on microbiological and physicochemical properties and fatty acid profile of frozen duck meat. Food Sci. Nutr. 2020, 8, 1020–1029. [Google Scholar] [CrossRef]
  3. Bassey, A.P.; Chen, Y.; Zhu, Z.; Odeyemi, O.A.; Frimpong, E.B.; Ye, K.; Li, C.; Zhou, G. Assessment of quality characteristics and bacterial community of modified atmosphere packaged chilled pork loins using 16S rRNA amplicon sequencing analysis. Food Res. Int. 2021, 145, 110412. [Google Scholar] [CrossRef]
  4. Chang, Y.; Chen, J.; Wu, Y.; Wang, S.; Chen, Y. A possible systematic culinary approach for spent duck meat: Sous-vide cuisine and its optimal cooking condition. Poultry Sci. 2023, 102, 102636. [Google Scholar] [CrossRef] [PubMed]
  5. Duan, M.; Xu, L.; Gu, T.; Sun, Y.; Xia, Q.; He, J.; Pan, D.; Lu, L. Investigation into the characteristic volatile flavor of old duck. Food Chem. X 2023, 20, 100899. [Google Scholar] [CrossRef]
  6. Edgar, R.C. . UPARSE: highly accurate OTU sequences from microbial amplicon reads. Nat. Methods 2013, 10, 996–998. [Google Scholar] [CrossRef] [PubMed]
  7. Fan, X.; Li, Y.; Sun, Y.; Zhou, C.; Wu, Z.; Xia, Q.; Pan, D. Mechanisms of inhibition of prevailing spoilage bacteria Weissella viridescens in sauced duck product by e-beam irradiation synergistic modified atmosphere packaging. Food Control 2024, 159, 110261. [Google Scholar] [CrossRef]
  8. Geeraerts, W.; Pothakos, V.; De Vuyst, L.; Leroy, F. Diversity of the dominant bacterial species on sliced cooked pork products at expiration date in the Belgian retail. Food Microbiol. 2017, 65, 236–243. [Google Scholar] [CrossRef]
  9. Geeraerts, W.; De Vuyst, L.; Leroy, F. Mapping the dominant microbial species diversity at expiration date of raw meat and processed meats from equine origin, an underexplored meat ecosystem, in the Belgian retail. Int. J. of Food Microbiol. 2019, 289, 189–199. [Google Scholar] [CrossRef]
  10. Khan, M.A.; Ali, S.; Abid, M.; Cao, J.; Jabbar, S.; Tume, R.K.; Zhou, G. Improved duck meat quality by application of high pressure and heat: A study of water mobility and compartmentalization, protein denaturation and textural properties. Food Res. Int. 2014, 62, 926–933. [Google Scholar] [CrossRef]
  11. Li, Y.; Zhou, C.; He, J.; Wu, Z.; Sun, Y.; Pan, D.; Tian, H.; Xia, Q. Combining e-beam irradiation and modified atmosphere packaging as a preservation strategy to improve physicochemical and microbiological properties of sauced duck product. Food Control 2022, 136, 108889. [Google Scholar] [CrossRef]
  12. Liu, C.; Xiao, Y.; Hu, D.; Liu, J.; Chen, W.; Ren, D. The safety evaluation of chilled pork from online platform in China. Food Control. 2019, 96, 244–250. [Google Scholar] [CrossRef]
  13. Liu, R.; Kong, F.; Xing, S.; He, Z.; Bai, L.; Sun, J.; Tan, X.; Zhao, D.; Zhao, G.; Wen, J. (). Dominant changes in the breast muscle lipid profiles of broiler chickens with wooden breast syndrome revealed by lipidomics analyses. J. Anim. Sci. Biotechno. 2022, 13, 93. [Google Scholar] [CrossRef]
  14. Lyu, W.; Yang, H.; Li, N.; Lu, L.; Yang, C.; Jin, P.; Xiao, Y. Molecular characterization, developmental expression, and modulation of occludin by early intervention with Clostridium butyricum in Muscovy ducks. Poultry Sci. 2021, 100, 101271. [Google Scholar] [CrossRef]
  15. Ma, L.; Lyu, W.; Zeng, T.; Wang, W.; Chen, Q.; Zhao, J.; Zhang, G.; Lu, L.; Yang, H.; Xiao, Y. . Duck gut metagenome reveals the microbiome signatures linked to intestinal regional, temporal development, and rearing condition. iMeta 2024, e198. [Google Scholar] [CrossRef] [PubMed]
  16. Mann, E.; Dzieciol, M.; Pinior, B.; Neubauer, V.; Metzler-Zebeli, B.U.; Wagner, M.; Schmitz-Esser, S. High diversity of viable bacteria isolated from lymph nodes of slaughter pigs and its possible impacts for food safety. J. Appl. Microbiol. 2015, 119, 1420–1432. [Google Scholar] [CrossRef]
  17. Mao, T.; Xia, C.; Zeng, T.; Xia, Q.; Zhou, C.; Cao, J.; He, J.; Pan, D.; Wang, D. The joint effects of ultrasound and modified atmosphere packaging on the storage of sauced ducks. LWT 2023, 177, 114561. [Google Scholar] [CrossRef]
  18. Ondov, B.D.; Bergman, N.H.; Phillippy, A.M. Interactive metagenomic visualization in a Web browser. BMC Bioinformatics 2011, 12, 1–10. [Google Scholar] [CrossRef]
  19. Rasinska, E.; Rutkowska, J.; Czarniecka-Skubina, E.; Tambor, K. Effects of cooking methods on changes in fatty acids contents, lipid oxidation and volatile compounds of rabbit meat. LWT 2019, 110, 64–70. [Google Scholar] [CrossRef]
  20. Senapati, M.; Sahu, P.P. Meat quality assessment using Au patch electrode Ag-SnO2/SiO2/Si MIS capacitive gas sensor at room temperature. Food Chem. 2020, 324, 126893. [Google Scholar] [CrossRef]
  21. Shi, Y.; Li, X.; and Huang, A. A metabolomics-based approach investigates volatile flavor formation and characteristic compounds of the Dahe black pig dry-cured ham. Meat Sci. 2019, 15, 107904. [Google Scholar] [CrossRef] [PubMed]
  22. Xia, C.; He, Y.; Cheng, S.; He, J.; Pan, D.; Cao, J.; Sun, Y. Free fatty acids responsible for characteristic aroma in various sauced-ducks. Food Chem. 2021, 343, 128493. [Google Scholar] [CrossRef]
  23. Xu, L.; He, J.; Duan, M.; Chang, Y.; Gu, T.; Tian, Y.; Cai, Z.; Zeng, T.; Lu, L. Effects of lactic acid bacteria-derived fermented feed on the taste and quality of duck meat. Food Res. Int. 2023, 174, 113679. [Google Scholar] [CrossRef]
  24. Yang, X.; Li, Y.; Wang, P.; Luan, D.; Sun, J.; Huang, M.; Wang, B.; Zheng, Y. Quality changes of duck meat during thermal sterilization processing caused by microwave, stepwise retort, and general retort heating. Front. Nutr. 2022, 9, 1016942. [Google Scholar] [CrossRef] [PubMed]
  25. Zhou, H.; Cui, W.; Gao, Y.; Li, P.; Pu, X.; Wang, Y.; Wang, Z.; Xu, B. Analysis of the volatile compounds in Fuliji roast chicken during processing and storage based on GC-IMS. Curr. Res. Food Sci. 2022, 5, 1484–1493. [Google Scholar] [CrossRef] [PubMed]
  26. Zhu, J.; Lin, W.; Sun, Y.; Pan, D.; Xia, Q.; Zhou, C.; He, J. Relationship between flavor characteristics and lipid oxidation in air-dried beef at different roasting stages. Int. J. Gastron. Food S. 2024, 37, 100988. [Google Scholar] [CrossRef]
  27. Zhu, X.; Yang, C.; Song, Y.; Qiang, Y.; Han, D.; Zhang, C. Changes provoked by altitudes and cooking methods in physicochemical properties, volatile profile, and sensory characteristics of yak meat. Food Chem. X. 2023, 20, 101019. [Google Scholar] [CrossRef]
Figure 1. Bacterial flora of samples at different stages; Bar-plot at Family level (A.1) and at Genus level (A.2); Heat map at Family level (B.1) and at Genus level (B.2); Cladogram (C.1) and LDA analysis diagram (C.2) of bacterial flora at different stages. Note: Different letter (A-F) stands for different stages. Different number (1-12) after letters stands for different repetitions in each stage.
Preprints 148847 g001
Figure 2. Free fatty acids analysis (A) and sensory evaluation (B).
Preprints 148847 g002
Figure 3. Two-dimensional topographic plot (A), fingerprint spectra (B) and PCA (C) in the GC-IMS results.
Preprints 148847 g003
Figure 4. The correlation analysis between flavor compounds and dominant bacteria (A), free acids (B) or themselves (C). Note: * P < 0.05; ** P < 0.005. Red color stands for positive correlation; green color stands for negative correlation; white color stands for no correlation.
Preprints 148847 g004
Figure 5. The potential chemical reactions of sauced duck samples during stages A-F (Shi et al., 2019; Yang et al., 2022; Zhou et al., 2022; Duan et al., 2023).
Preprints 148847 g005
Table 1. Color changes of samples at different stages.
Index Stage
A B C D E F
L* 32.1 ± 0.3a 48.2 ± 0.8f 46.5 ± 0.3e 44.3 ± 0.2d 42.5 ± 0.1c 41.3 ± 0.1b
a* 8.2 ± 0.9a 10.5 ± 0.3b 11.2 ± 0.6c 11.5 ± 0.1c 12.6 ± 0.5d 12.1 ± 0.3d
b* 5.8 ± 0.6a 6.0 ± 1.2b 7.0 ± 0.4c 7.8 ± 0.6d 8.1 ± 0.3d 8.2 ± 0.3d
T-VBN (mg/ 100 g) 5.92 ± 0.42a 6.85 ± 0.25b 7.12 ± 0.92b 20.25 ± 0.89c 24.58 ± 0.43d 48.20 ± 1.06e
TBARS (mg/ kg) 0.16 ± 0.00a 0.27 ± 0.03b 0.58 ± 0.05c 0.96 ± 0.08d 1.37 ± 0.02e 2.13 ± 0.15f
TPC (log10 CFU /g) 1.82 ± 0.02a 2.24 ± 0.06b 2.20 ± 0.05b 6.85 ± 0.01c 7.82 ± 0.12d 8.45 ± 0.08e
Note: The same letter means the difference is not significant, while different letter means the difference is significant (P < 0.05).
Table 2. The main flavor substances in the GC-IMS results.
No. Compound CAS# Formula MW RI Rt (s) Dt
(RIP rel)
Comment
Description
Aldehydes (n = 19)
1 Benzaldehyde C100527 C7H6O 106.1 1553.6 1406.451 1.157 Bitter Almond, Brunt sugar, Cherry, Malt, Roasted Pepper
2 Nonanal C124196 C9H18O 142.2 1406.4 1023.341 1.48016 Fat, Floral, Green, Lemon
3 (E)-2-Heptenal C18829555 C7H12O 112.2 1334.5 876.019 1.26147 Monomer Almond, Fat, Fruit
1334.9 876.877 1.67092 Dimer
4 (E)-2-Hexenal C6728263 C6H10O 98.1 1234.5 711.029 1.18832 Monomer \
1235.1 712.002 1.51718 Dimer
5 Heptanal C111717 C7H14O 114.2 1199.8 662.503 1.33641 Monomer Citrus, Fat, Green, Nut
1199.8 662.503 1.69504 Dimer
6 (E)-2-Pentenal C1576870 C5H8O 84.1 1152.5 569.553 1.10533 Monomer \
1152.7 570.014 1.3599 Dimer
7 Hexanal C66251 C6H12O 100.2 1103.8 482.051 1.27572 Monomer Apple, Fat, Fresh, Green, Oil
1104.2 482.69 1.56344 Dimer
8 Pentanal C110623 C5H10O 86.1 1004.9 361.067 1.42311 Almond, Bitter, Malt, Oil, Pungent
9 3-Methylbutanal C590863 C5H10O 86.1 931.3 305.536 1.4039 \
10 Acetal C105577 C6H14O2 118.2 910.8 292.146 1.02663 Creamy, Fruit, Pleasant, Tropical Fruit
11 Butanal C123728 C4H8O 72.1 889.9 279.149 1.11717 Banana, Green, Pungent
12 2-Methylpropanal C78842 C4H8O 72.1 830.7 245.279 1.2818 Burnt, Caramel, Cocoa, Green, Malt
13 Propanal C123386 C3H6O 58.1 821.0 240.159 1.14324 Floral, Pungent, Solvent
14 Acetaldehyde C75070 C2H4O 44.1 763.5 211.803 0.97998 Floral, Green Apple
15 2-Propenal C107028 C3H4O 56.1 868.1 266.153 1.05955 \
16 Methional C3268493 C4H8OS 104.2 1477.2 1192.512 1.0955 Cooked potato, Soy
17 3-Methyl-2-butenal C107868 C5H8O 84.1 1216.3 685.268 1.09732 Almond, Roasted
18 2-Methyl-2-pentenal C623369 C6H10O 98.1 1200.1 663.004 1.5201 Fruit
19 Octanal C124130 C8H16O 128.2 1304.0 820.167 1.40635 Citrus, Fat, Green, Oil, Pungent
Esters (n = 19)
1 Methyl octanoate C111115 C9H18O2 158.2 1449.1 1122.052 1.42791 Fruit, Orange, Wax, Wine
2 (E)-2-Octenal C2548870 C8H14O 126.2 1441.5 1103.868 1.33835 Dandelion, Fat, Fruit, Grass, Green, Spice
3 Hexyl propionate C2445763 C9H18O2 158.2 1343.7 893.679 1.41894 Fruit
4 1-Penten-3-ol C616251 C5H10O 86.1 1178.8 623.205 0.94299 Butter, Fish, Green, Oxidized, Wet Earth
5 Methyl 2-methylbutanoate C868575 C6H12O2 116.2 1016.1 372.882 1.18714 Apple, Fruit, Green Apple, Strawberry
6 Ethyl acetate C141786 C4H8O2 88.1 898.2 284.269 1.33393 Aromatic, Brandy, Grape
7 Methyl acetate C79209 C3H6O2 74.1 852.9 257.488 1.19263 Ester, Green
8 Ethyl propanoate C105373 C5H10O2 102.1 976.8 337.437 1.45329 Apple, Pineapple, Rum, Strawberry
9 Ethyl isobutyrate C97621 C6H12O2 116.2 984.2 342.951 1.55756 \
10 Propyl acetate C109604 C5H10O2 102.1 997.3 353.19 1.47936 Celery, Floral, Pear, Red Fruit
11 Ethyl 3-methylbutanoate C108645 C7H14O2 130.2 1084.0 453.619 1.27631 Apple, Fruit, Pineapple, Sour
12 Ethyl 2-methylbutanoate C7452791 C7H14O2 130.2 1071.1 437.077 1.25299 Apple, Ester, Green Apple, Kiwi, Strawberry
13 Isoamyl acetate C123922 C7H14O2 130.2 1139.7 545.17 1.30207 Monomer Apple, Banana, Pear
1139.7 545.17 1.74786 Dimer
14 Ethyl butanoate C105544 C6H12O2 116.2 1056.6 419.151 1.55878 Apple, Butter, Cheese, Pineapple, Strawberry
15 Butyl acetate C123864 C6H12O2 116.2 1091.1 462.925 1.2589 Monomer Apple, Banana
16 1-Methoxy-2-propyl acetate C108656 C6H12O3 132.2 1242.7 723.096 1.14241 \
17 Pentyl acetate C628637 C7H14O2 130.2 1187.5 642.203 1.31303 Apple, Banana, Pear
18 Ethyl hexanoate C123660 C8H16O2 144.2 1248.3 731.416 1.34219 Apple Peel, Brandy, Fruit Gum, Overripe Fruit, Pineapple
19 Ethyl pentanoate C539822 C7H14O2 130.2 1180.5 626.931 1.68337 Apple, Dry Fish, Herb, Nut, Yeast
Alcohols (n = 13)
1 1-Octen-3-ol C3391864 C8H16O 128.2 1488.6 1222.062 1.16669 Cucumber, Earth, Fat, Floral, Mushroom
2 1-Hexanol C111273 C6H14O 102.2 1373.6 953.204 1.33238 Monomer Banana, Flower, Grass, Herb
1373.6 953.204 1.63689 Dimer
3 1-Heptanol C111706 C7H16O 116.2 1489.1 1223.36 1.40403 \
4 Acetoin C513860 C4H8O2 88.1 1302.7 817.787 1.06521 Monomer Butter, Creamy, Green Pepper
1303.2 818.758 1.33106 Dimer
5 1-Pentanol C71410 C5H12O 88.1 1267.5 760.526 1.25791 Monomer Balsamic, Fruit, Green, Pungent, Yeast
1268.1 761.497 1.51126 Dimer
6 3-Methyl-1-butanol C123513 C5H12O 88.1 1223.6 695.501 1.24185 Monomer Burnt, Cocoa, Floral, Malt
1224.3 696.471 1.49164 Dimer
7 1-Butanol C71363 C4H10O 74.1 1163.7 591.908 1.18249 Monomer Fruit
1163.7 591.908 1.37859 Dimer
8 2-Methyl-1-propanol C78831 C4H10O 74.1 1113.0 497.38 1.17445 Monomer Apple, Bitter, Cocoa, Wine
1113.3 498.019 1.37055 Dimer
9 1-Propanol C71238 C3H8O 60.1 1058.7 421.718 1.11306 Monomer Alcohol, Candy, Pungent
1058.7 421.718 1.25436 Dimer
10 2-Butanol C78922 C4H10O 74.1 1042.2 402.026 1.14873 Monomer \
1042.5 402.42 1.32433 Dimer
11 Ethanol C64175 C2H6O 46.1 944.7 314.594 1.04172 Monomer \
945.8 315.382 1.12678 Dimer
12 2-Propanol C67630 C3H8O 60.1 934.8 307.899 1.09111 Floral
13 cis-2-Penten-1-ol C1576950 C5H10O 86.1 1341.3 889.042 0.94555 \
Ketones (n = 11)
1 1-Hydroxy-2-propanone C116096 C3H6O2 74.1 1317.8 844.962 1.05629 Monomer Butter, Herb, Malt, Pungent
1317.8 844.962 1.05629 Dimer
2 2-Heptanone C110430 C7H14O 114.2 1195.4 656.68 1.26504 Blue Cheese, Fruit, Green, Nut, Spice
3 4-Methyl-3-penten-2-one C141797 C6H10O 98.1 1147.5 559.973 1.12301 \
4 1-Penten-3-one C1629589 C5H8O 84.1 1034.3 392.968 1.09385 Fish, Green, Mustard, Pungent
5 4-Methyl-2-pentanone C108101 C6H12O 100.2 1029.4 387.454 1.48622 \
6 2-Pentanone C107879 C5H10O 86.1 1003.4 359.492 1.35177 Fruit, Pungent
7 2-Butanone C78933 C4H8O 72.1 918.7 297.266 1.24339 Fragrant, Fruit, Pleasant
8 Acetone C67641 C3H6O 58.1 838.7 249.612 1.11443 Pungent
9 3-Methyl-2-pentanone C565617 C6H12O 100.2 1040.2 399.732 1.47772 \
10 Cyclopentanone C120923 C5H8O 84.1 1202.5 666.24 1.1045 Mint, Cool
11 Dihydro-2(3H)-furanone C96480 C4H6O2 86.1 1711.3 1977.29 1.08782 Caramel, Cheese, Roasted Nut
Acids (n = 4)
1 Propanoic acid C79094 C3H6O2 74.1 1638.6 1689.857 1.11514 Fat, Fruit, Pungent, Silage, Soy
2 Butanoic acid C107926 C4H8O2 88.1 1705.5 1952.665 1.16147 Butter, Cheese, Sour
3 Acetic acid C64197 C2H4O2 60.1 1505.5 1267.521 1.05921 Monomer Acid, Fruit, Pungent, Sour, Vinegar
1505.9 1268.819 1.15624 Dimer
4 2-Methylpropanoic acid C79312 C4H8O2 88.1 1635.5 1678.655 1.15151 Burnt, Butter, Cheese, Sweat
Others (n = 18)
1 2,6-Dimethylpyrazine C108509 C6H8N2 108.1 1362.7 931.124 1.14579 Cocoa, Coffee, Green, Roast Beef, Roasted Nut
2 Ammonia C7664417 H3N 17.0 1273.1 769.261 0.84576 Dimer \
1273.7 770.231 0.90642 Monomer
3 Methylpyrazine C109080 C5H6N2 94.1 1279.9 779.937 1.09376 Cocoa, Green, Hazelnut, Popcorn, Roasted
4 2-Pentylfuran C3777693 C9H14O 138.2 1247.0 729.469 1.2472 Butter, Floral, Fruit, Green Bean
5 o-Xylene C95476 C8H10 106.2 1194.0 654.739 1.08127 \
6 3-Carene C13466789 C10H16 136.2 1149.5 563.805 1.20821 Lemon
7 Dimethyl disulfide C624920 C2H6S2 94.2 1072.1 438.259 1.13775 Cabbage, Garlic, Onion
8 alpha-Pinene C80568 C10H16 136.2 1029.4 387.454 1.23104 Cedarwood, Pine, Sharp
9 Dimethyl sulfide C75183 C2H6S 62.1 795.5 227.163 0.95529 Cabbage, Organic, Sulfur, Wet Earth
10 Ethylbenzene C100414 C8H10 106.2 1135.4 537.092 1.09147 \
11 Unidentified 1 \ \ 0 1119.6 508.818 1.09608 \
12 Unidentified 2 \ \ 0 1148.5 561.814 1.32483 \
13 Furfural C98011 C5H4O2 96.1 1500.0 1252.624 1.09377 Almond, Baked Potatoes, Bread, Burnt, Spice
14 Dipropyl disulfide C629196 C6H14S2 150.3 1421.2 1056.408 1.26895 Cooked Meat, Garlic, Onion, Pungent, Sulfur
15 3-Ethylpyridine C536787 C7H9N 107.2 1388.7 984.954 1.09723 Nuts
16 2,5-Dimethylpyrazine C123320 C6H8N2 108.1 1354.5 914.793 1.10361 Cocoa, Roast Beef, Roasted Nut
17 Unidentified 3 \ \ 0 1207.3 672.711 1.15699
18 2-Acetylfuran C1192627 C6H6O2 110.1 1543.9 1377.171 1.12539 Balsamic, Cocoa, Coffee
Note: MW, molecular weight; RI, retention index; RT, retention time; DT, drift time; RIP rel, normalization treatment.
Disclaimer/Publisher’s Note: The statements, opinions and data contained in all publications are solely those of the individual author(s) and contributor(s) and not of MDPI and/or the editor(s). MDPI and/or the editor(s) disclaim responsibility for any injury to people or property resulting from any ideas, methods, instructions or products referred to in the content.
Copyright: This open access article is published under a Creative Commons CC BY 4.0 license, which permit the free download, distribution, and reuse, provided that the author and preprint are cited in any reuse.
Prerpints.org logo

Preprints.org is a free preprint server supported by MDPI in Basel, Switzerland.

Subscribe

Disclaimer

Terms of Use

Privacy Policy

Privacy Settings

© 2025 MDPI (Basel, Switzerland) unless otherwise stated