
Submitted:
24 June 2025
Posted:
25 June 2025
You are already at the latest version
Abstract
Electrostatic separation is a promising technology for the recovery of valuable metals from electronic waste, particularly from printed circuit boards (PCBs). This study explores the application of electrostatic separation for the selective recovery of metallic and non-metallic fractions from crushed PCBs (PCBs). The process exploits the differences in electrical properties between conductive metals and non-conductive polymers and ceramics, facilitating their separation through applied electric fields. The raw materials were pre-treated via mechanical comminution using shredders and hammer mills to achieve an optimal particle size distribution (< 3 mm), which enhances separation efficiency. Ferrous materials were removed prior to electrostatic separation to improve process selectivity. Key operational parameters, including particle size, charge accumulation, environmental conditions, and separation efficiency, were systematically analysed. The results demonstrate that electrostatic separation effectively recovers high-value metals such as copper and gold while minimizing material losses. Additionally, the process contributes to the sustainability of e-waste recycling by enabling the recovery of non-metallic fractions for potential secondary applications. This work underscores the significance of electrostatic separation as a viable technique for e-waste management and highlights optimization strategies for enhancing its performance in large-scale recycling operations.
Keywords:
PCB
; electrostatic separation
; Feed flow rate
; Electrode voltage
; Drum speed
; Cupper
; Silver
; Gold
1. Introduction
Electrostatic separation is an advanced material recovery technique widely recognized for its efficiency in separating particles based on their electrical properties. The process leverages electrostatic forces generated by electric fields to manipulate and segregate materials that exhibit different conductive and dielectric behaviours. Particles are charged either through contact electrification (triboelectricity), electrostatic induction, or direct exposure to an electric field. This charge allows the particles to be influenced by the applied field, enabling the separation of conductive materials, such as metals, from non-conductive ones, such as polymers and ceramics [1,2]. The versatility of this technique makes it suitable for a wide range of applications, including recycling, mineral processing, and waste management.
One of the key advantages of electrostatic separation lies in its ability to handle finely divided materials with high precision. This is especially important when dealing with heterogeneous mixtures where conventional mechanical separation methods may fail. Conditions such as particle size, moisture content, environmental humidity, and temperature significantly affect the performance of the process. Maintaining consistent operating conditions is crucial to ensure the reliability and efficiency of the separation [3]. Moreover, the low energy requirements of this method compared to other separation technologies make it an economically viable and environmentally friendly option for large-scale operations [4].
In recent years, electrostatic separation has gained significant attention for its application in recycling electronic waste (e-waste). E-waste, particularly from printed circuit boards (PCBs), presents a unique challenge due to its complex composition. PCBs contain a mixture of metals, polymers, and ceramics, often embedded in intricate layers, making the recovery of valuable materials a challenging task. Particularly, aluminium (Al) is present in heat sinks attached to processors, power transistors, and some capacitors [5]. Gold (Au) can be found in high-quality contacts and connections, commonly used in pins, connectors, edge plating on boards, and thin layers in electronic chips, because of its excellent conductivity and resistance to corrosion. Silver (Ag) is used also in electrical contacts and connections and, in smaller amounts, in solder and high-quality metallic coatings, due to its high electrical conductivity. In turn, Copper (Cu) makes up the majority of the conductive material in PCBs, used for tracks that connect electronic components, for cables and coils within components like inductors and transformers. Nickel (Ni) is used as an intermediate layer in connections and metal coatings, typically beneath gold or silver layers to improve adhesion and prevent corrosion, and also in magnetic components such as inductor or transformer cores. Palladium (Pd) is found in the contacts of switches, relays, and connectors, usually in small quantities, together with ceramic capacitors, especially in multilayer ceramic capacitors (MLCCs). Platinum (Pt) is rare in PCBs but may be found in specialized sensors or electrical contacts, such as in medical or telecommunications equipment. Silicon (Si) is the base material for semiconductors, present in integrated circuits, microprocessors, and other electronic devices. Found in the form of silicon wafers inside integrated circuits. Tin (Sn) is widely used in solder to connect components to the board. It may also form part of alloys with lead (in older devices) or lead-free alloys in modern electronics. Finally, iron (Fe) is found primarily in magnetic cores of inductors and transformers, screws, metal supports, and other structural elements. Therefore, meanwhile noble metals such as Ag, Au, and Pd are particularly valuable in PCBs due to their high conductivity and resistance to corrosion, the other common metals like Al, Cu, Ni, Sn are abundant and essential for the basic functionality of the board. This diversity makes PCBs a critical source for metal recycling and recovery from electronic waste. Most of those metals are present in significant quantities and/or are of high economic value [6,7].
However, these metals are often intertwined with non-metallic materials, necessitating advanced separation techniques for effective recovery. Thus, the process of electrostatic separation begins with the mechanical pre-treatment of e-waste. Crushing and grinding are essential steps to reduce the size of the material and liberate the metallic and non-metallic components [8]. The particle size achieved during this stage plays a critical role in the success of the electrostatic separation process, as smaller particles are more likely to exhibit distinct conductive and dielectric properties, and the electrostatic charge effect is enhanced by the higher surface area to volume ratio [9]. Once reduced to an appropriate size, the material is subjected to an electric field, where the differential charging behavior of the particles allows for their segregation.
The application of electrostatic separation to PCBs offers several advantages. It enables the efficient recovery of high-value metals such as copper and gold while minimizing the loss of these materials to waste streams [10,11]. Additionally, the separation of non-metallic fractions, including glass fibres and resins, contributes to a cleaner recycling process. These non-metallic fractions, often considered as waste, can also find secondary applications, further enhancing the sustainability of the process.
This method has found utility in various industries, from recycling plants to mineral beneficiation processes. In the context of electronic waste, the application of electrostatic separation addresses critical environmental and economic challenges. By recovering valuable metals from e-waste, this technique reduces the dependency on primary mineral resources and, consequently, the environmental impact due to the mining [10]. Moreover, it pushes toward the circular economy by reintroducing recovered materials into the production cycle.
This study delves into the application of electrostatic separation for recovering metals from crushed PCBs. It provides a comprehensive analysis of the underlying principles, operational conditions, and material behavior during the process. Furthermore, it highlights the potential of this technology to enhance the efficiency of e-waste recycling and underscores the challenges associated with its practical implementation. By focusing on the optimization of separation parameters and the integration of pre-treatment techniques, this work aims to contribute to the development of a sustainable framework for managing electronic waste.
2. Materials and Methods
2.1. Raw Materials and Output Flow Rates
The raw materials selected for this work was obtained from the known as Printed Circuit Boards (in advance, PCBs). They were previously crushed consecutively by shredder and hammer mills (both designed by Mayper S.L., Spain), down to less than 3 mm. As stated before, particle size is a critical parameter. Firstly, the smaller the particle the more likely that elements of different electrostatic behavior will be separate. Secondly, smaller particles have higher surface area to volume ratio, which enhances the separation effect of the electrostatic charge, since electrostatic charge happens on the surface of the particle. Researchers and manufacturers of drum electrostatic separation equipment have found ideal particle size to be under 4 mm. Subsequently, to remove ferrous materials, the crushed PCBs were consecutively treated by two ferrite and neodymium drum magnetic separators (designed by Drago Electrónica, Spain). Afterward, the electrostatic separation procedure was carried out in an electrostatic separator (designed by Vanest, China). The equipment consisted of a vibrating feeding chamber, a rotating conductive drum, a group of four electrodes, three collectors and two deflector blades. The vibrating feeding chamber released a flow of material to the rotating conductive drum, where it was exposed to an electrostatic field induced by the electrodes. Conductive particles would release any electrostatic charge through the drum and freely fall on a first collector. However, non-conductive particles would experience attraction force toward the drum and are only released and fall on a second collector once they reach the second half of the drum, were the brush is located. A third collector can be placed in between to capture particles with mixed behavior. The deflector blades can be used to further adjust the collector’s inlet area if needed. A schematic diagram of the operation of a drum electrostatic separator is shown in Figure 1, courtesy of Hamos company ®.
To study the optimal conditions for maximum separation of the metallic fraction (MF) and the non-metallic fraction (NMF) in the electrostatic separator, the following process parameter were modified: a) feed flow rates between 30 and 120 kg/h, b) voltage across the electrodes between 0 and 40kV, and c) drum speed between 20 and 100 rpm. Considering all these process parameters modified, the treated specimens were labelled as follows: FR-EV-DS being “FR” the Feed Flow Rate; “EV” the electrode voltage; and “DS” the drum speed. All tests carried out are arranged according to Table 1. The deflection plates to discriminate between MF and NMF were fixed in vertical position according to initial tests. At each conditions, batches of 100 kg of each raw material were electrostatically separated and later analysed.
2.2. Chemical and Physical Characterizations
For both input and output material flow rates, a deep chemical and physical characterization, evolved particle size distribution, chemical composition, density, MF, NMF, and mixed fraction (MIX) percentages were determined. Thus, the particle size distribution has been determined by sieving according to the ISO 3310-1:2016 standard, using sieves with aperture sizes of 0.038, 0.075, 0.150, 0.3, 0.6 and 1.18 mm. In turn, the composition of the initial raw materials, and the electrostatically separated PCBs were determined by Inductively Coupled Plasma-Optical Emission Spectroscopy (ICP-OES) for the main metals, such as Cu, Ni and Sn. Meanwhile, the precious metals such as Au, Ag, Pd, and Pt, were measured by Inductively Coupled Plasma- Mass Spectroscopy (ICP-MS) due to its higher sensibility. Concretely, a spectroBlue ICP-OES (Spectro Analytical Instruments GmbH, Germany) and an ICP-MS/MS Agilent 8800 spectrometers (Agilent Scientific Instruments, USA), were used for these purposes. 1 g per each raw material, and each electrostatic separated crushed PCBs were acid digested in 3 mL HNO3 + 3 mL HCl + 1mL HF, using a ultraWAVE microwave digestor (Milestone, Italy), at 220ºC and 45 bar during 20 min. At these conditions all specimens, including the fibre glass, were completely digested. This protocol is similar to those used by different authors.
Subsequently, 10 g of each treated material, quintuplicated, were calcinated at 400ºC during 2h, using a custom-made and high-capacity furnace (designed by Thermolab, Portugal) in static air. The weight loss was associated to the calcination of the plastic fraction of the separated PCBs. Finally, the density of each crushed and electrostatic separated PCBs was determined using the gas picnometer AccuPyc II 1340 TEC (Micromeritics, United Kingdom).
3. Results and Discussions
3.1. Raw Material Characterization
The particles size distribution of the PCBs raw material was displayed in Figure 2. It is observed that although after the pretreatment carried out in the shredder and hammer mills having an outlet sieve of 3 mm, the crushed PCBs raw material has 90 wt.% of particle size less than 1.16 mm, with about 50 wt.% of particles having a particle size less than 0.3 mm and, only 5 wt.% of particle between 1.18-0.3 mm.
The plastic fraction of the crushed PCBs was determined by gravimetry analysis, obtaining an average value of 27.6 ± 4.9 wt.%. This corresponds mainly to epoxy resin coming from the motherboard. The same characterization was carried out on the crushed PCBs raw material to determinate the metallic composition (Table 2), in this case, by ICP-OES. It was observed that the main metals presented are Al, Cu, Fe, Ni, Si, and Sn, representing a total amount of 44.9 wt.%. It is also important to highlight the amount of Cu (21.7 wt.%), mainly coming from the tracks that connect the electronic components, which is one of the most valuable metals to recover in the PCBs. Finally, the noble metals correspond to around 1.1 wt.%. Although their amounts are really low, the higher price of noble metals make them also an interest point to recover in this type of e-waste.
Finally, the remanent material, excluding plastics (27.6 ± 4.9 wt.%) and metals (45.5 wt.%)in the crushed PCBs, must correspond to the fiberglass existing in the substrate motherboard of the PCBs. i.e., a 26.9 wt.% of fiberglass.
In addition, the density of the crushed PCBs used as raw materials before the electrostatic separation tests as 4.10 ± 0.07 g/cm3. Attending to the percentage of phases above-mentioned and the corresponding density of each phase and metals, by Vegard’s Law it is possible to estimate a theoretical density value of 3.98 g/cm3. Thus, both experimental and theoretical values are in concordance, suggesting that the compositions and percentage of phases are correctly determined.
3.2. Effect of Feed Flow Rates in the Electrostatic Separation
For this purpose, the feed flow rate was modified from 30 kg/h to 75 kg/h and, finally, 125 kg/h, meanwhile other technological parameters were maintained constants, such as 20 rpm for the drum speed, and 35 kV as electrode voltage. In the Table 3 and Figure 3 below it is displayed the tests carried out and the main results obtained.
The first data to highlight is the mixed fraction (MIX), i.e., the no separated fraction between the conductive fraction (CF) and non-conductive fraction (NCF). It was slightly increased, but still low amount with the increase of feed flow rate (between 1.4 and 3.o wt.%). In turn, the CF was increased with the feed flow rate and, consequently, opposite behaviour for the NCF. Therefore, attending only to the optimization of the separation of fraction (Figure 3a), the increase of the flow rate from 30 kg/h to 120 kg/h improve this separation.
The determined amount of plastic for the CF fraction was low in all cases, between 1.9 and 2.8 wt.%, suggesting an interesting degree of separation between metals and plastic, suggesting a high purity in metals in the CF. Opposite, for the NCF fraction, the amount of plastic determined by calcination, between 32.2 wt.% and 44.1 wt.%, suggests the presence of other elements with different nature. They can be, concretely, fibres and metals. Therefore, the NCF streams after the electrostatic separation is susceptible to be separated by another consecutive physical separation techniques, such as shaking tables, flotation, hydrocyclone, etc.
In this context, determined the degree of presence of metals in these NCF, the metallic composition in the NCF is displayed in the Table 4. They need to be quantitatively measured to determine the amount of metals that must require to be recover by another subsequent separation method after electrostatic separation. It is important to comment that the CF can be identified as a concentrated metallic stream because the plastic content analysis in the CF shows results under 3 wt.% of plastic. Therefore, the metallic composition was not measured and the CF accepted as a total recovered phase. In addition, the low amount of the mixed fraction also in all tests carried out, together with their low amount of plastics, make them also admissible as recovered metal streams. Thus, it is observed in the NCF how the separation of Cu is not adequate, obtaining high value between 11.1 and 16.7 wt. %. Extrapolating these amounts to the initial crushed PCBs, they correspond between 3.8 to 2.7 wt.% of the total PCBs. Even more, attending to the relative non-recovered metallic percentage of Cu over the total initial Cu in the PCBs, it was determined between 17.8 and 12.6 wt.%, corroborating the requirements to additional separation steps for the NCF, even, a recirculation of these NCF in the electrostatic separation step at different operation parameters.
By other hand, the quantification of the different metals in the NCF (Figure 3b) showed an inhomogeneous behaviour of them with the feed flow rate. Meanwhile as a general trend, the noble metals reached stable or low values at 120 kg/h, the main metal, Cu, increased its percentage in the NCF, reached a value of 16.7 wt.% for the FR120-EV35-DS20 sample. Specifically, the lowest percentage of Ag was 431 and 445 ppm for the FR75-EV35-DS20 and FR120-EV35-DS20, respectively. For Au, the values remained constant, around 120 ppm independent of the electrostatic separation conditions. Pd reduces its amount up to 3.3 wt.% in the NCF of the 120kg/h of the feed flow rate (FR120-EV35-DS20).
However, the previous values must be analysed not only in terms of the NCF, but they also need to be compared with the percentage that they represent in the original PCB (Figure 3c). In this case, a general and consistent trend was found for all measured metals. Specifically, the increase of the feed flow rate reduced the amount of unrecovered metals after the electrostatic separation tests, suggesting that the increase of the speed of the materials increase the different behaviour of metals and electrical insulators (plastic and fibres) during separation tests. Thus, with the increase of the feed flow rate , the amount of metals represents lower unrecovered absolute amount of them based on the total amount of the PCBs. Going even further, in the quantification of separated metals, in the Figure 3d and Figure 3e it is displayed the non-recovered and recovered metals based on the absolute initial amount of those metals in the PCBs, respectively, Thus, can be detected for the quantified metals a general increase of the recovery metals in the CF and mixed fraction with the feed flow rate, reaching values more than 85 wt.% for all of them. More specifically, 87.4 wt.% of Cu, 91.6 wt.% of Ag, 94.6 wt.% of Pd, 95.8 wt. % of Au, 96.9 wt. % of Sn, and 99.4 wt.% of Sn were recovered in the CF and MIX fractions
3.3. Effect of Electrode Voltage in the Electrostatic Separation
Analogous to the effect of the feed flow rate applied, in this section, the electrostatic separation tests were carried out by the modification of the electrode voltage applied. In this case, the electrodes voltages were modulated at 25 kV, 30 kV, and 40 kV. In these conditions, the percentage of phases (displayed in Table 5 and Figure 4a) showed no significant variation using 30 kV or 40 kV of electrode voltage. Thus, the electrostatic separation produced a maximum separation of CF, NCF and MIX fractions at 30 kV, concretely, 24.6 wt.% of CF, 57.8 wt.% of NCF, and 17.7 wt.% of mixed fraction (MIX). However, in general terms, although the separation of fraction reached no modification, the presence of a not negligible amount of a mixed phase suggests the necessity to modify another parameter to optimize this separation of phases and diminish the MIX phase.
Subsequently, the composition of the NCF was determined in terms of the metals content. These metals amounts were referred to the percentage over the initial amount of PCBs and, in terms of the recovered metals, corresponding to the difference between the percentage in the NCF and the presence in the original PCBs. Thus, all this information is exhibited in the Table 6 and the Figure 4b-e. As a first view, the modification of the electrode voltage had no clear influence on the amount of most of metals in the NCF and, considering the similar amount of CF and MIX fraction, also in the initial PCBs. As an exception, the percentage of Cu in the NCF and in terms of the initial PCBs increase with the electrode voltage. Pd showed an opposite behaviour with lower values when the electrode voltage was increased.
The most important aspect in this study is based in terms of the recovered and non-recovered amount of each metal (Figure 4d and Figure 4e). Heterogeneous behaviours were observed for different metals. Meanwhile the total recovery of Sn and Pd increased with the electrode voltage, the recovery of the valuable Ag, Au, and Cu metals decreased with the electrode voltage. In any case, the minimum non-recovered amount of some of the studied metals(marked in bold in the Table 6), concretely, 26.2 wt.% of Ag, 9.9 wt.% of Au, 24.6 wt.% of Cu, and 19.2 wt.% of Pd, suggests the necessity of improve the electrode voltage in the electrostatic separation process to optimize the recovery of metals in the CF. The high amount of the mixed phase also supports this position. Thus, another experimental parameter should be also modified.
3.4. Effect of Electrode Voltage in the Electrostatic Separation
The effect of the modification of the drum speed, between 20 rpm and 100 rpm on the electrostatic separation of the pre-crushed PCBs was studied, with fixed values of 30 kg/h of feed flow rate and 40 kV of electrode voltage. In the Table 7 and Figure 5a it is displayed the percentage of the separated CF, NCF and MIX phases. Thus, the increase in the drum speed generated an abrupt decrease in the CF phase from 76.6 wt.% at 20 rpm to 24.4 wt.% at 40 rpm, and 39.3 wt.% at 100 rpm. This time it is clear that, in terms of CF separation, applying lower drum speed shows clear advantage in comparison with higher drum speed. In addition, also for the non-optimal separated phase, i.e., the mixed phase (MIX), only the FR30-EV40-DS20 showed a low amount of this phase, suggesting an optimal separation between the CF and the NCF at this lower 20 rpm. Therefore, the increase of drum speed is clearly detrimental for this separation of CF, NCF, and MIX phases.
The subsequently aspect is the determination of the composition of the NCF in order to quantify the non-recovered metals present in this phase that would suggest subsequent separation stages. Thus, although the CF was lower at 20 rpm (FR30-EV40-DS20), the increase in the drum speed allowed to decrease the amount of Ag, Au, Cu, and Pd in the NCF at 40 or 100 rpm (Figure 5b). The initial low amount of Ni and Sn makes difficult to observe a clear trend for those metals. Extending this quantification over the initial PCBs (Figure 5c), it is also determined how the Ag, Au, and Pd decrease the amount over the PCBs, corroborating the requirement to compare not only the percentage in the NCF fraction, also the total amount in comparison with the initial PCB. Opposite, the Cu amount increased with the rpm in comparison with the initial PCB.
The last interesting comparison is based on the recovery of each metal based on the total amount of them (Figure 5d-e). In this sense, the recovery of Ag, Au, Cu, and Sn was reached at low drum speed (20 or 40 rpm). Recovery percentages more than 90 wt.% were reached for those metals. In contrast, the recovery of Pd, another key metals, were clearly increased with the drum speed, reaching values close to 100% at 100 rpm. However, the low initial amount of this noble metal makes this measurement less reliable.

Table 7.
Physical characterization (mass percentage, density, and plastics percentage) of distinct phases obtained from specimens tested at different drum speed.
Table 7.
Physical characterization (mass percentage, density, and plastics percentage) of distinct phases obtained from specimens tested at different drum speed.
| Sample | Output flow type | Mass (wt.%) |
Density (g/cm3) | Plastics (wt.%) |
|---|---|---|---|---|
| FR30-EV40-DS20 | CF | 76.6 | 5.6 | < 1 |
| NCF | 18.7 | 2.0 | 48.8 | |
| MIX | 4.7 | 3.0 | 38.5 | |
| FR30-EV40-DS40 | CF | 24.4 | 5.2 | < 1 |
| NCF | 55.9 | 2.3 | 33.4 | |
| MIX | 19.7 | 3.0 | < 1 | |
| FR30-EV40-DS100 | CF | 39.3 | 5.6 | < 1 |
| NCF | 47.2 | 2.0 | 43.0 | |
| MIX | 13.5 | 2.4 | 18.9 |
Table 8.
Composition of distinct phases obtained from specimens tested at different drum speed.
| Sample | Fraction | Ag (ppm) |
Au (ppm) |
Cu (wt.%) | Ni (wt.%) | Pd (ppm) |
Sn (wt.%) |
|---|---|---|---|---|---|---|---|
| FR30-EV40-DS20 | NCF* | 643 | 124 | 13.7 | 0.04 | 20.4 | 0.7 |
| AP# | 120 | 23.2 | 2.6 | 0.0 | 3.8 | 0.1 | |
| MP@ | 14.0 | 5.0 | 12.0 | 0.5 | 38.5 | 2.8 | |
| FR30-EV40-DS40 | NCF | 148 | 0 | 4.5 | 0.04 | 3.5 | 0.7 |
| AP | 82.7 | 0.0 | 2.5 | 0.0 | 2.0 | 0.4 | |
| MP | 9.6 | 0.0 | 11.8 | 1.4 | 19.8 | 8.3 | |
| FR30-EV40-DS100 | NCF | 103 | 0 | 13.2 | 0.08 | 0 | 1.7 |
| AP | 48.6 | 0.0 | 6.2 | 0.0 | 0.0 | 0.8 | |
| MP | 5.7 | 0.0 | 29.1 | 2.4 | 0.0 | 17.1 |
* NFC: Non-Conductive Fraction; #AP: Absolute Percentage over the initial PCB; @MP: Metallic percentage over the initial metallic amount.
4. Conclusions
- Electrostatic separation tests were successfully carried out on pre-crushed Printed Circuit Boards (PCBs) at different Feed Flow Rates, Electrode Voltages and Drum Speed.
- The determination of different output fraction suggest that tests separated accordingly to Conductive Fractions (CF) and Nonconductive Fractions (NCF), with a, intermediate non correctively separated fraction (Mixed fraction, MIX), but in all cases with a really low percentage (always less than 3.5 wt.%).
- In terms of recovery of metals from the initial PCBs, the maximum values are obtained for the specimen FR120-EV35-DS20, i.e., for a Feed Flow Rate of 120kg/h, 35kV of electrode voltage and a drum speed of 20 rpm. In those conditions, more than a 90% of metals recovery were reached for all of them, excepting CU, where an 85% of recovery was reached.
- Specifically, if it is required the maximum percentage of Cu, as key metal in the industry, use low drum speed is the key parameter, 20-40 rpm, corresponding to the samples FR30-EV40-DS20 and FR30-EV40-DS40. Opposite, if it is required the maximum recovered amount for noble metals(Au, and Ag, mainly), the drum speed has less influence, suggesting the use of intermediate values of Feed Flow Rates and Electrode Voltage to recover up to 95 wt.% of both noble metals.
Author Contributions
Conceptualization, Jose Maria Gallardo and ERNESTO CHICARDI; Methodology, Antonio Manuel Lopez-Paneque, Victoria Humildad Gallardo García-Orta, Jose Maria Gallardo and ERNESTO CHICARDI; Software, Victoria Humildad Gallardo García-Orta; Formal analysis, Antonio Manuel Lopez-Paneque and Ranier Enrique Enrique Sepúlveda-Ferrer; Investigation, Antonio Manuel Lopez-Paneque, Ranier Enrique Enrique Sepúlveda-Ferrer and ERNESTO CHICARDI; Data curation, ERNESTO CHICARDI; Writing—original draft, Antonio Manuel Lopez-Paneque and ERNESTO CHICARDI; Writing—review & editing, Antonio Manuel Lopez-Paneque, Victoria Humildad Gallardo García-Orta, Jose Maria Gallardo, Ranier Enrique Enrique Sepúlveda-Ferrer and ERNESTO CHICARDI; Project administration, Victoria Humildad Gallardo García-Orta and ERNESTO CHICARDI; Funding acquisition, Jose Maria Gallardo and ERNESTO CHICARDI. All authors have read and agreed to the published version of the manuscript.
Funding
This research was funded by EIT Raw Materials, grant number 21021.
Data Availability Statement
The original contributions presented in this study are included in the article. Further inquiries can be directed to the corresponding author.
Conflicts of Interest
The authors declare no conflicts of interest.
References
- Cui, J.; Forssberg, E. Mechanical recycling of waste electric and electronic equipment: a review. J. Hazard. Mater. 2003, 99, 243–263. [CrossRef]
- Park, Y.J.; Fray, D.J. Recovery of high purity precious metals from printed circuit boards. J. Hazard. Mater. 2009, 164, 1152–1158. [CrossRef]
- Kelly, E.; Spottiwood, D. The theory of electrostatic separations: A review part II. Particle charging. Miner. Eng. 1989, 2, 193–205. [CrossRef]
- Zhou, Y.; Qiu, K. A new technology for recycling materials from waste printed circuit boards. J. Hazard. Mater. 2010, 175, 823–828. [CrossRef]
- Huang, T.; Zhu, J.; Huang, X.; Ruan, J.; Xu, Z. Assessment of precious metals positioning in waste printed circuit boards and the economic benefits of recycling. Waste Manag. 2022, 139, 105–115. [CrossRef]
- Veit, H.M.; Bernardes, A.M.; Ferreira, J.Z.; Tenório, J.A.S.; Malfatti, C.d.F. Recovery of copper from printed circuit boards scraps by mechanical processing and electrometallurgy. J. Hazard. Mater. 2006, 137, 1704–1709. [CrossRef]
- Ogunniyi, I.; Vermaak, M.; Groot, D. Chemical composition and liberation characterization of printed circuit board comminution fines for beneficiation investigations. Waste Manag. 2009, 29, 2140–2146. [CrossRef]
- Chicardi, E.; Lopez-Paneque, A.; García-Orta, V.H.G.; Sepúlveda-Ferrer, R.E.; Gallardo, J.M. Enrichment Methods for Metal Recovery from Waste from Electrical and Electronic Equipment: A Brief Review. Metals 2025, 15, 140. [CrossRef]
- Kumar, A.; Holuszko, M.; Espinosa, D.C.R. E-waste: An overview on generation, collection, legislation and recycling practices. Resour. Conserv. Recycl. 2017, 122, 32–42. [CrossRef]
- Wu, J.; Li, J.; Xu, Z. Electrostatic Separation for Recovering Metals and Nonmetals from Waste Printed Circuit Board: Problems and Improvements. Environ. Sci. Technol. 2008, 42, 5272–5276. [CrossRef]
- de Oliveira, C.M.; Bellopede, R.; Tori, A.; Zanetti, G.; Marini, P. Gravity and Electrostatic Separation for Recovering Metals from Obsolete Printed Circuit Board. Materials 2022, 15, 1874. [CrossRef]
Figure 1.
Schematic diagram for a drum electrostatic separator. Courtesy of Hamos company ®.
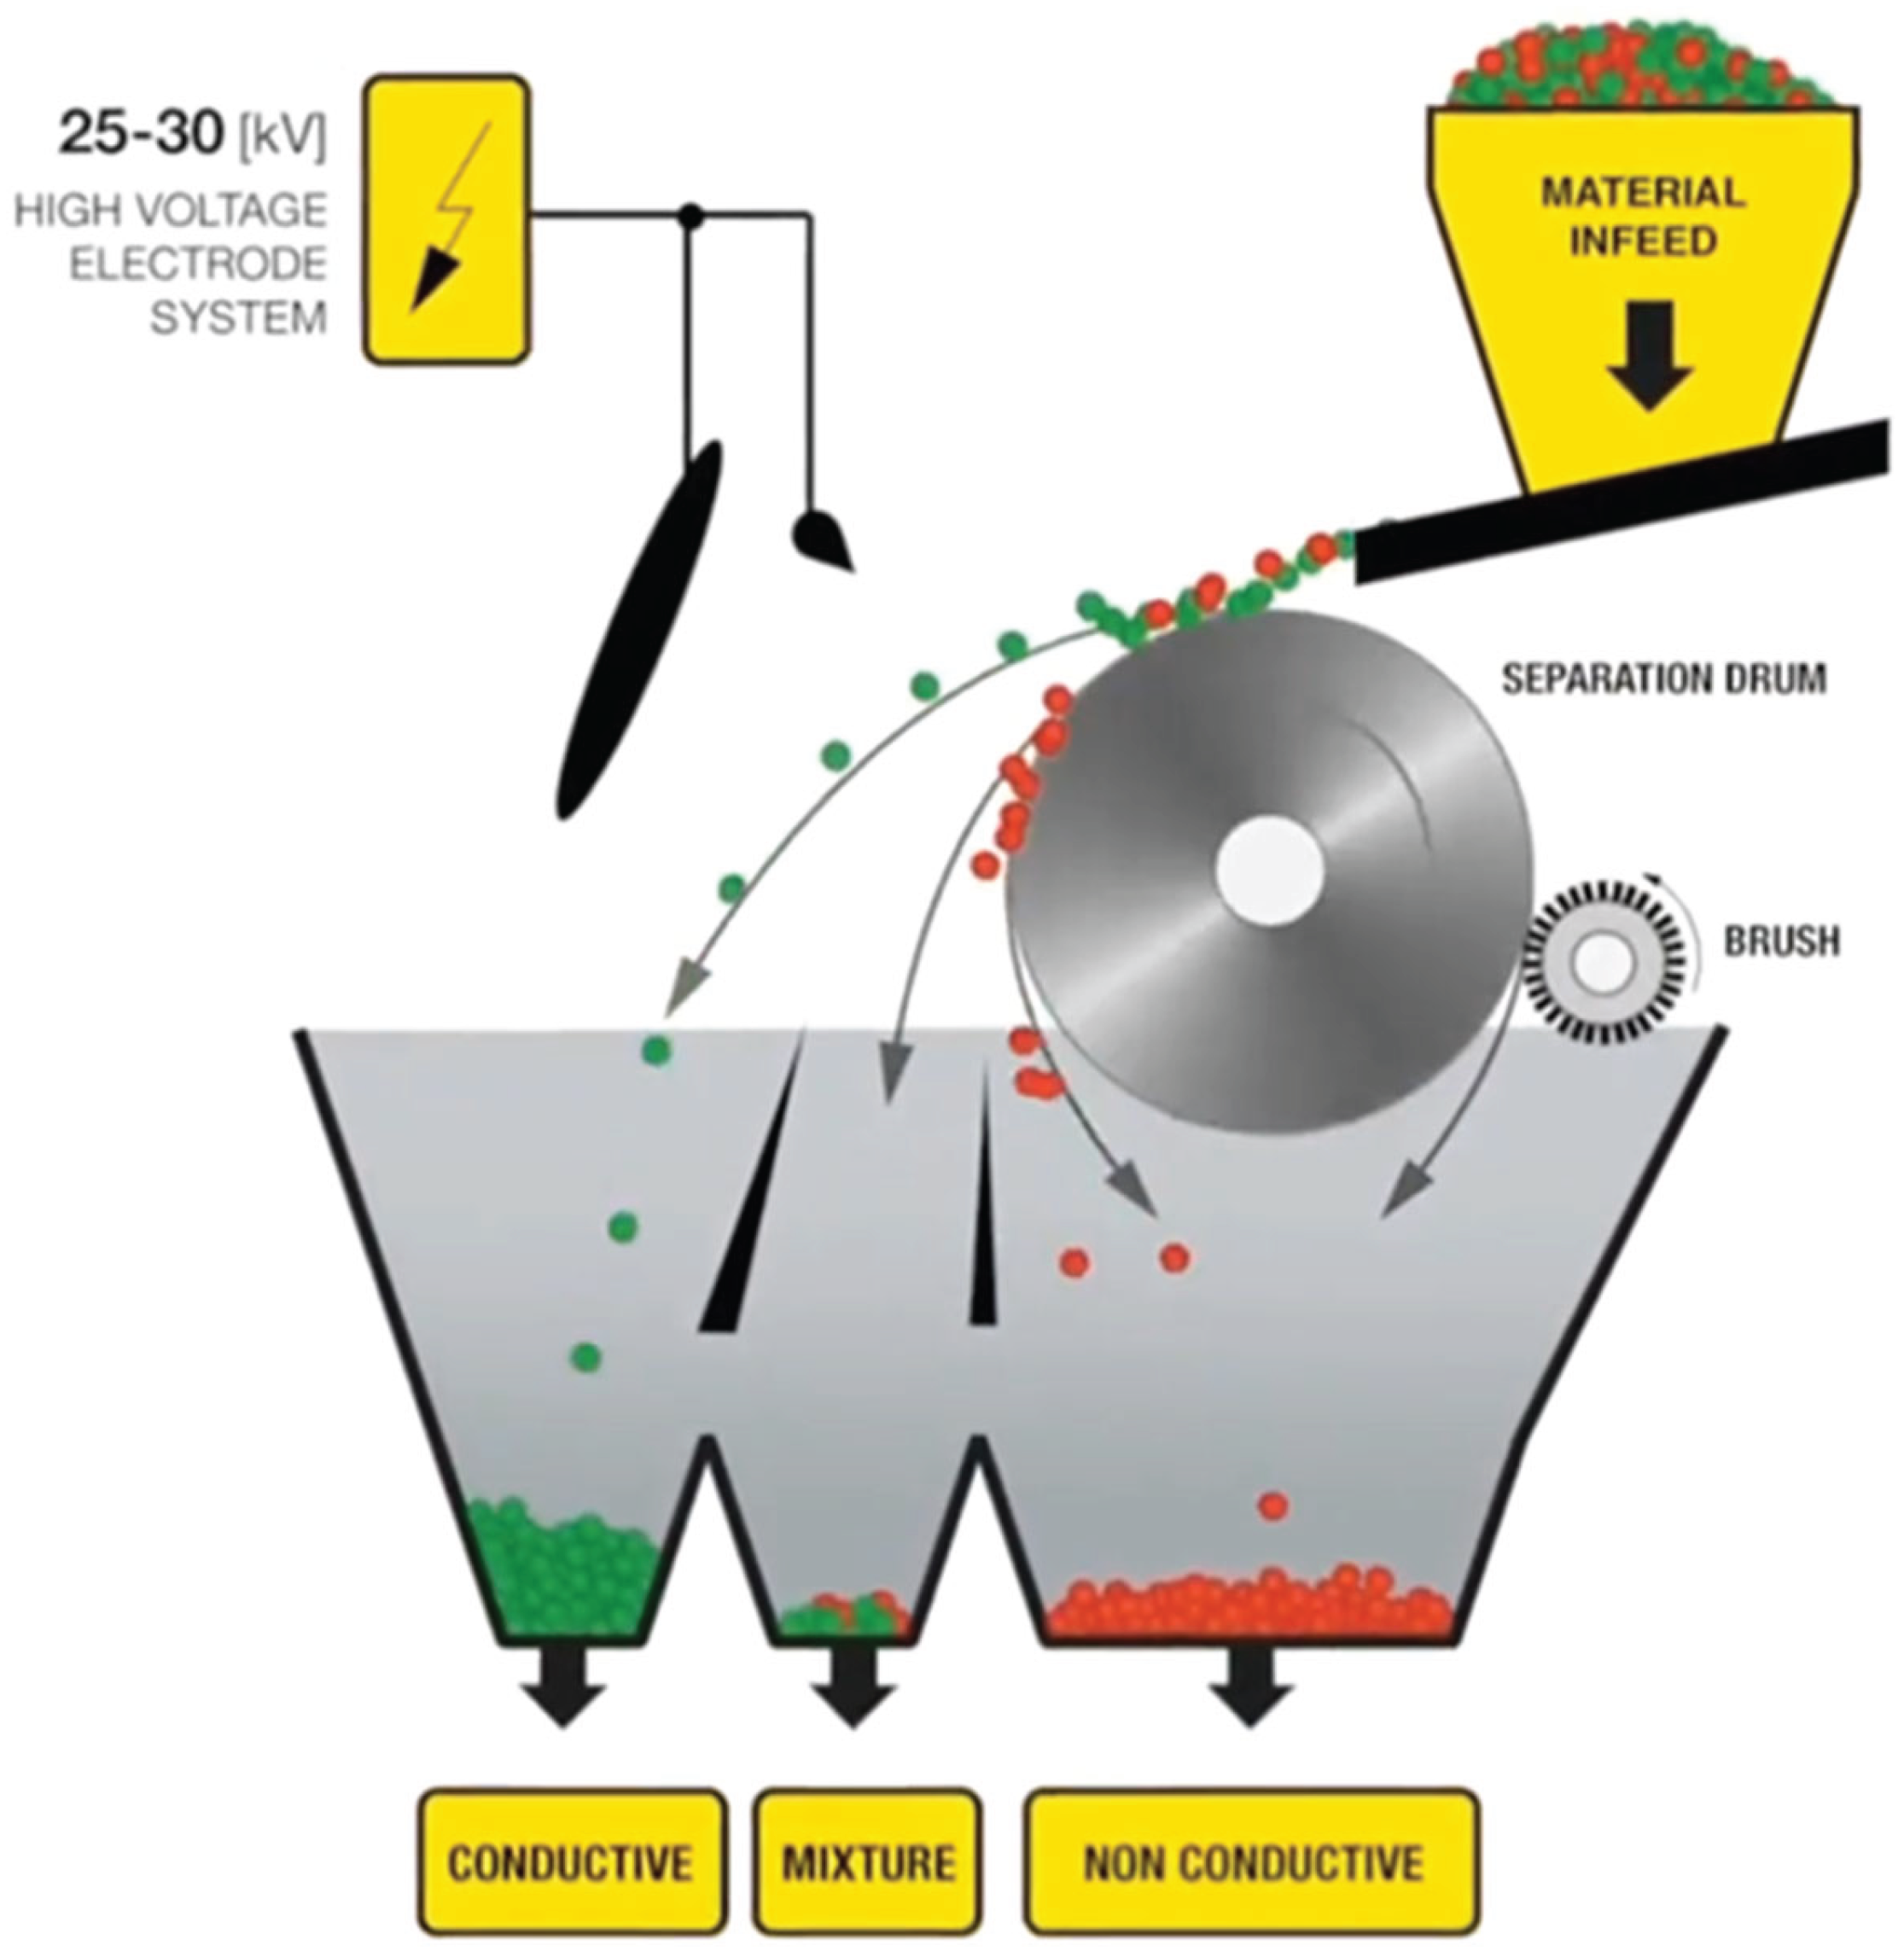
Figure 2.
Particle size distribution for the PCBs raw material.
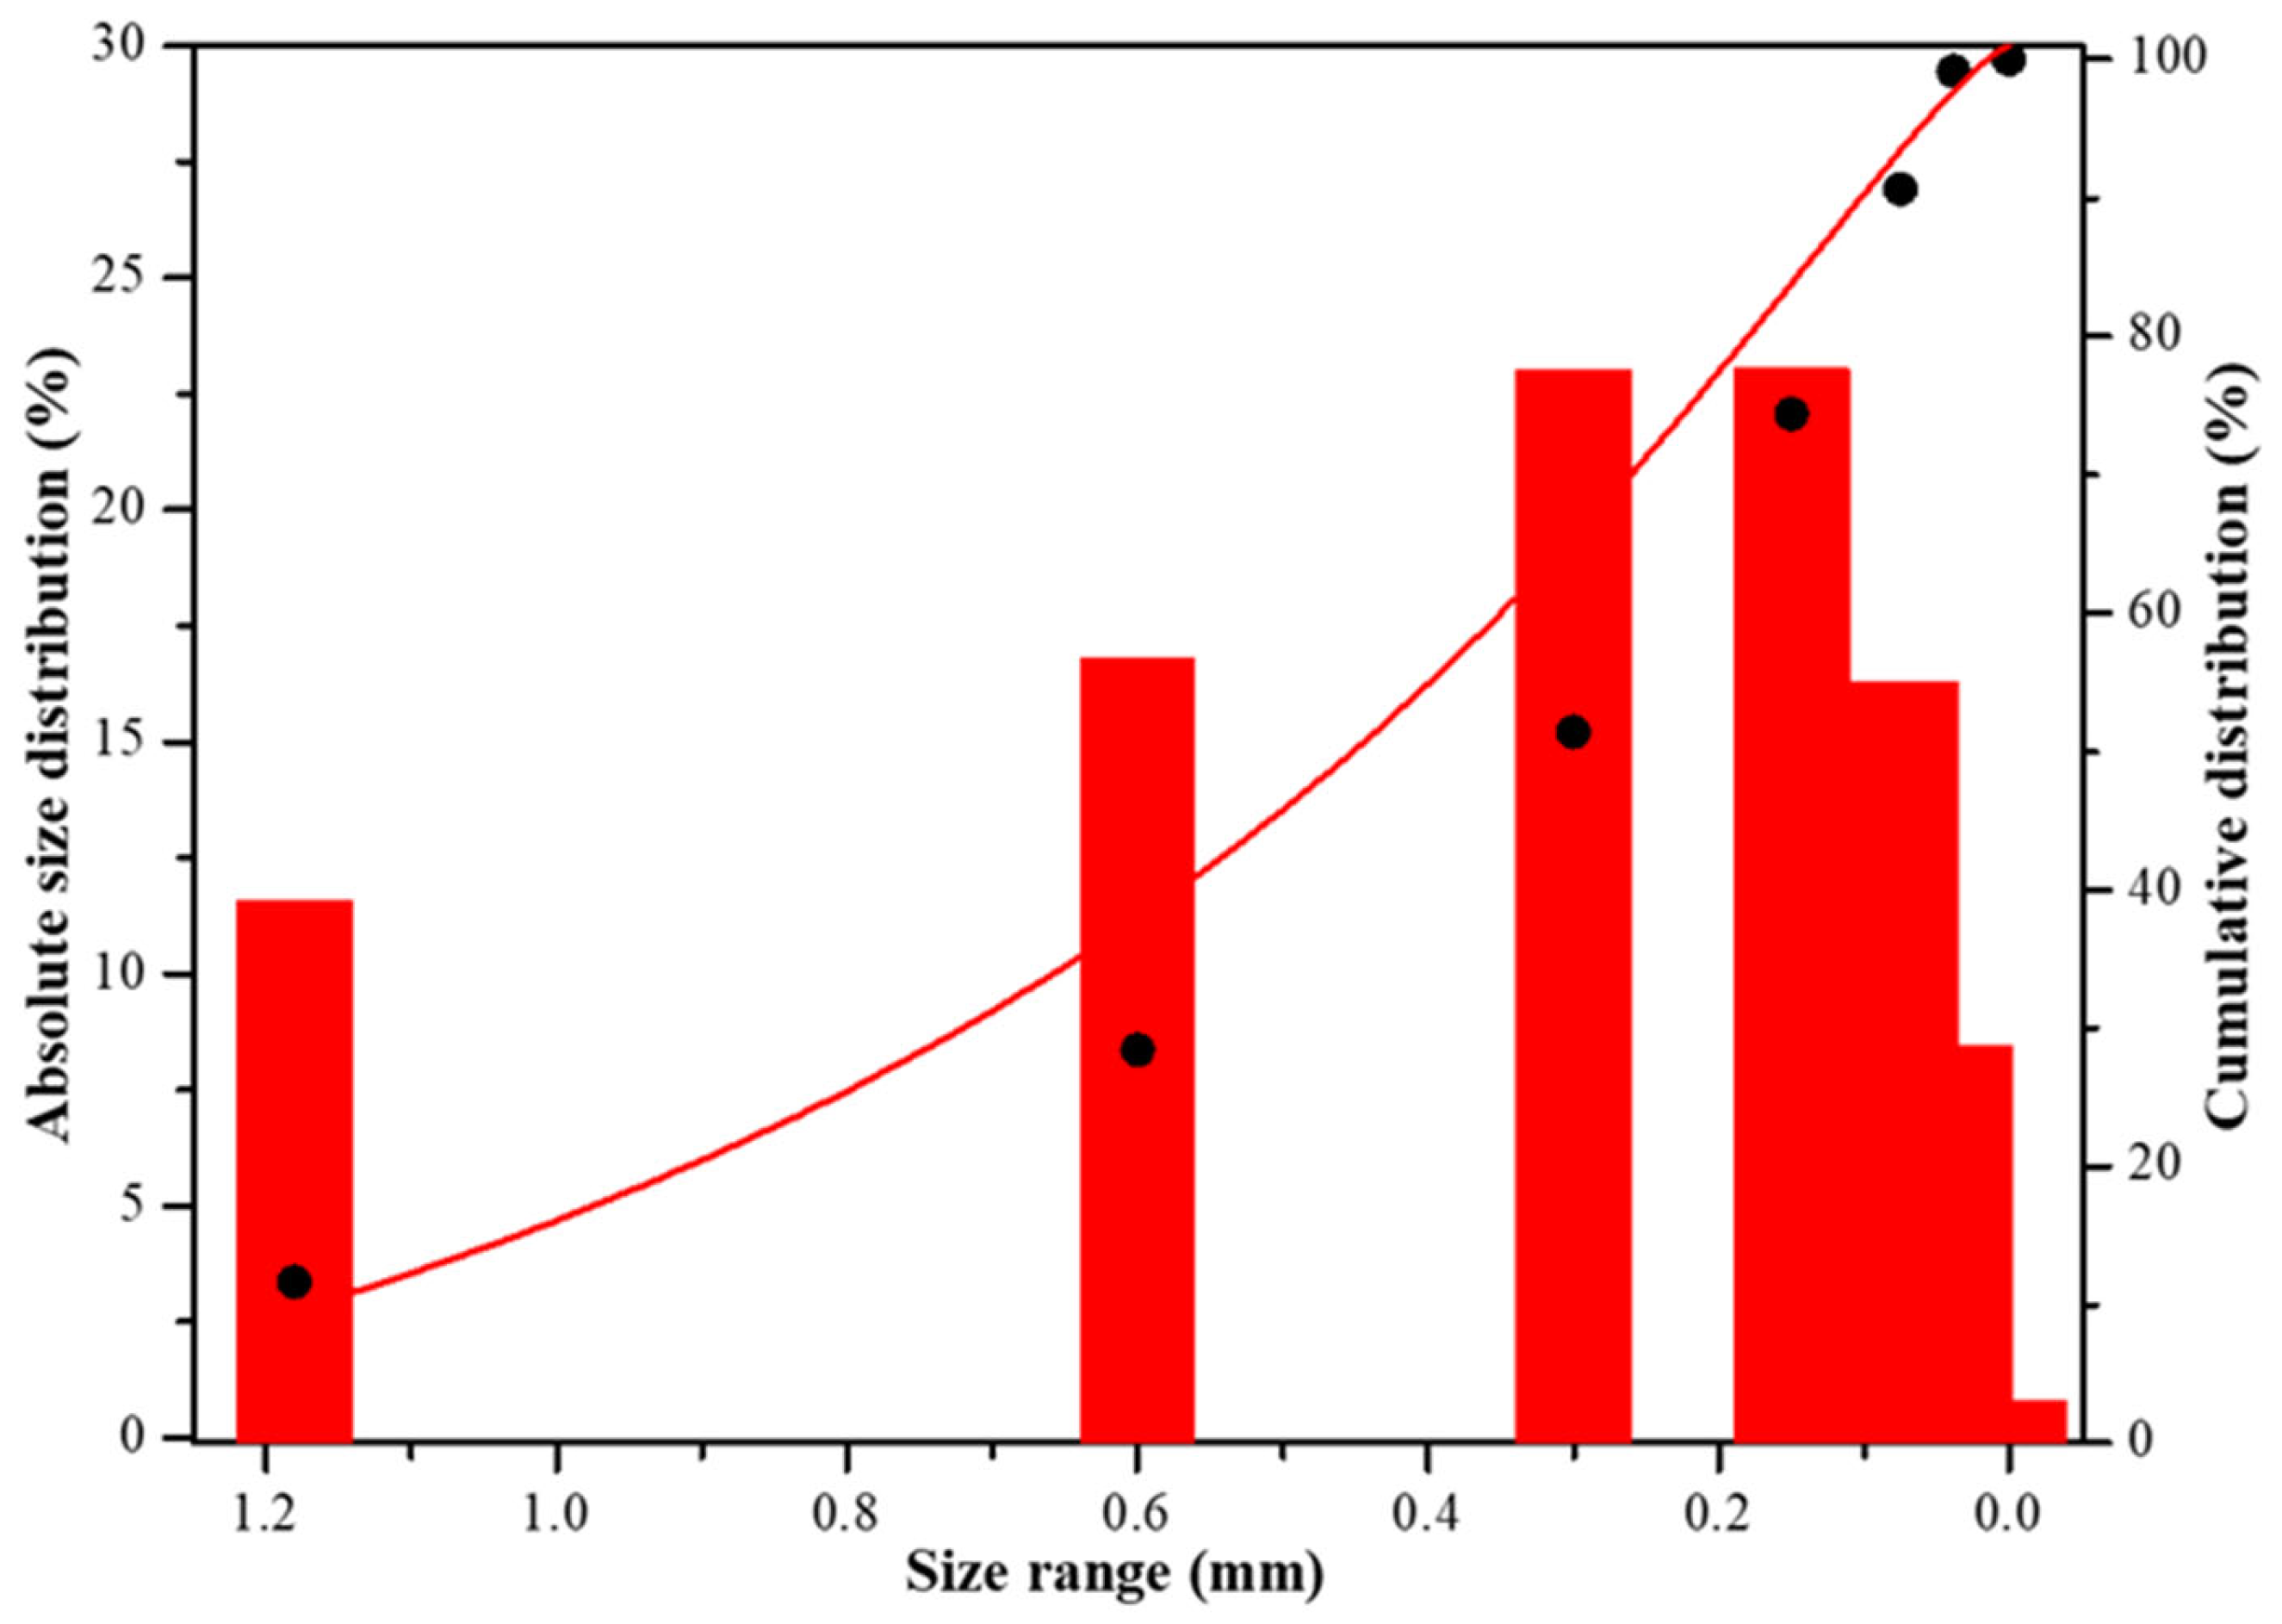
Figure 3.
Percentage of different output fractions (a), and metallic percentage over the different fractions (b-e) after the electrostatic separation tests for variation of the feed flow rate.
Figure 3.
Percentage of different output fractions (a), and metallic percentage over the different fractions (b-e) after the electrostatic separation tests for variation of the feed flow rate.
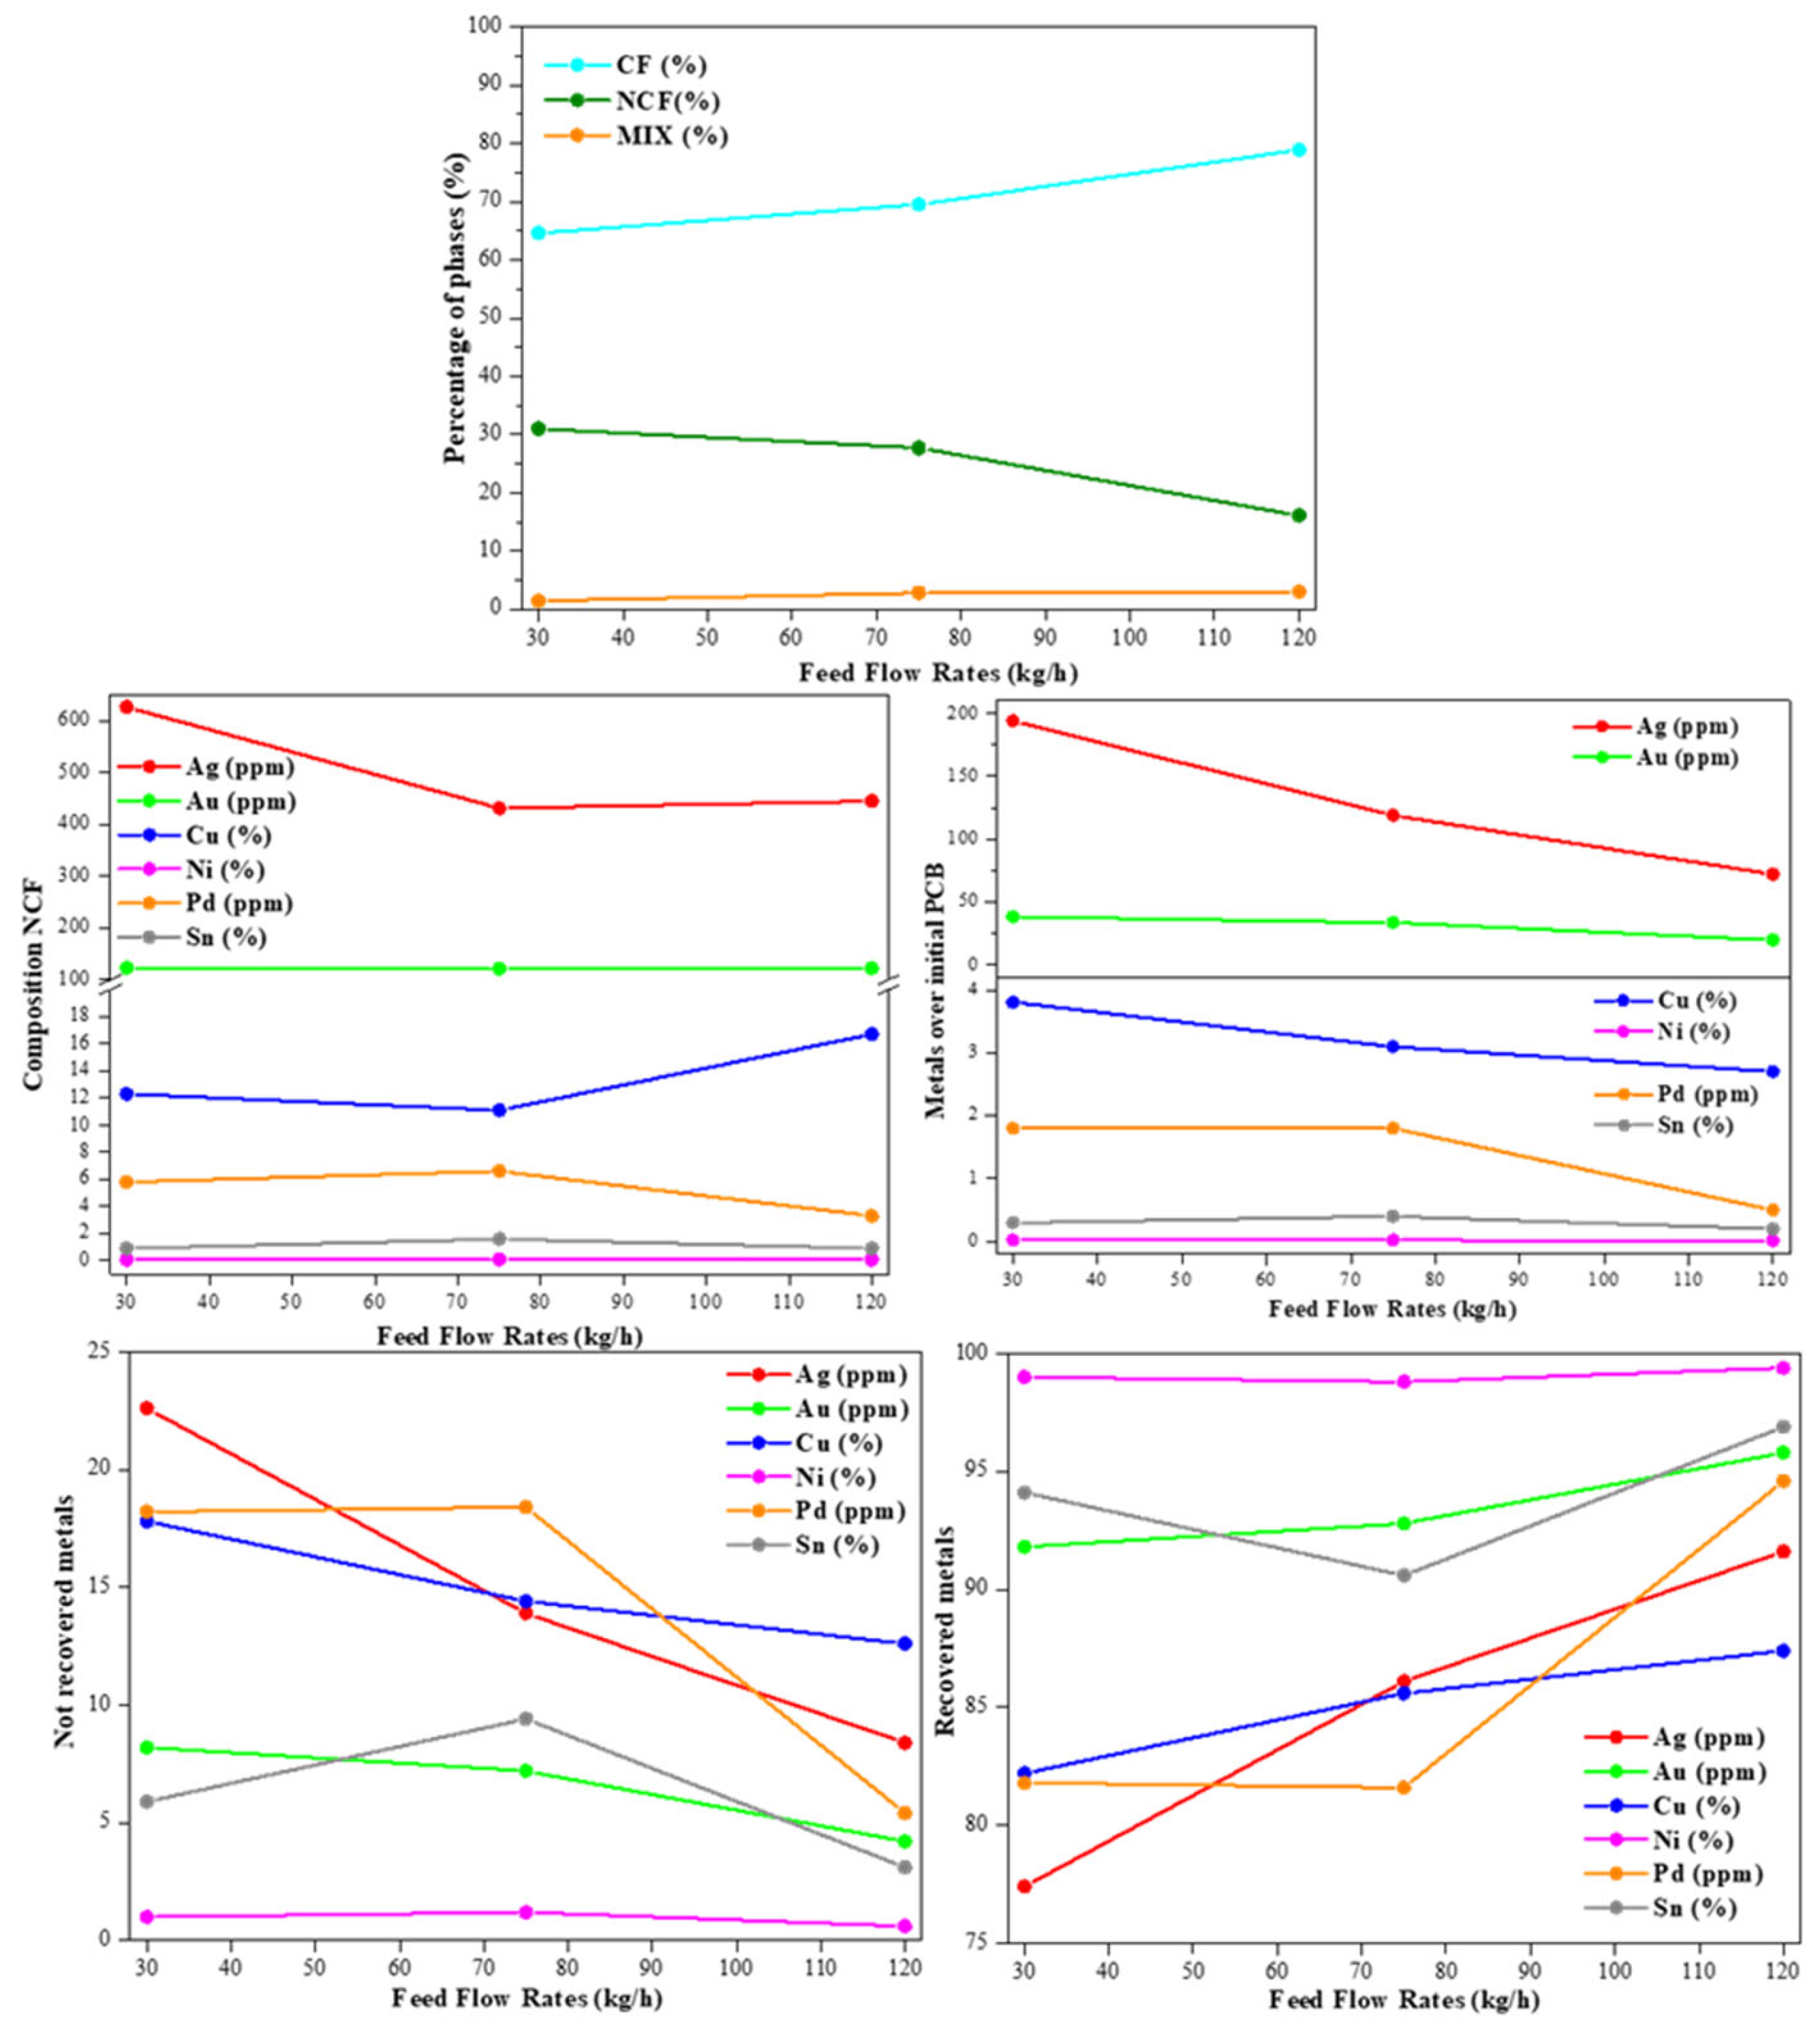
Figure 4.
Percentage of different output fractions (a), and metallic percentage over the different fractions (b-e) after the electrostatic separation tests for variation of the electrode voltages.
Figure 4.
Percentage of different output fractions (a), and metallic percentage over the different fractions (b-e) after the electrostatic separation tests for variation of the electrode voltages.
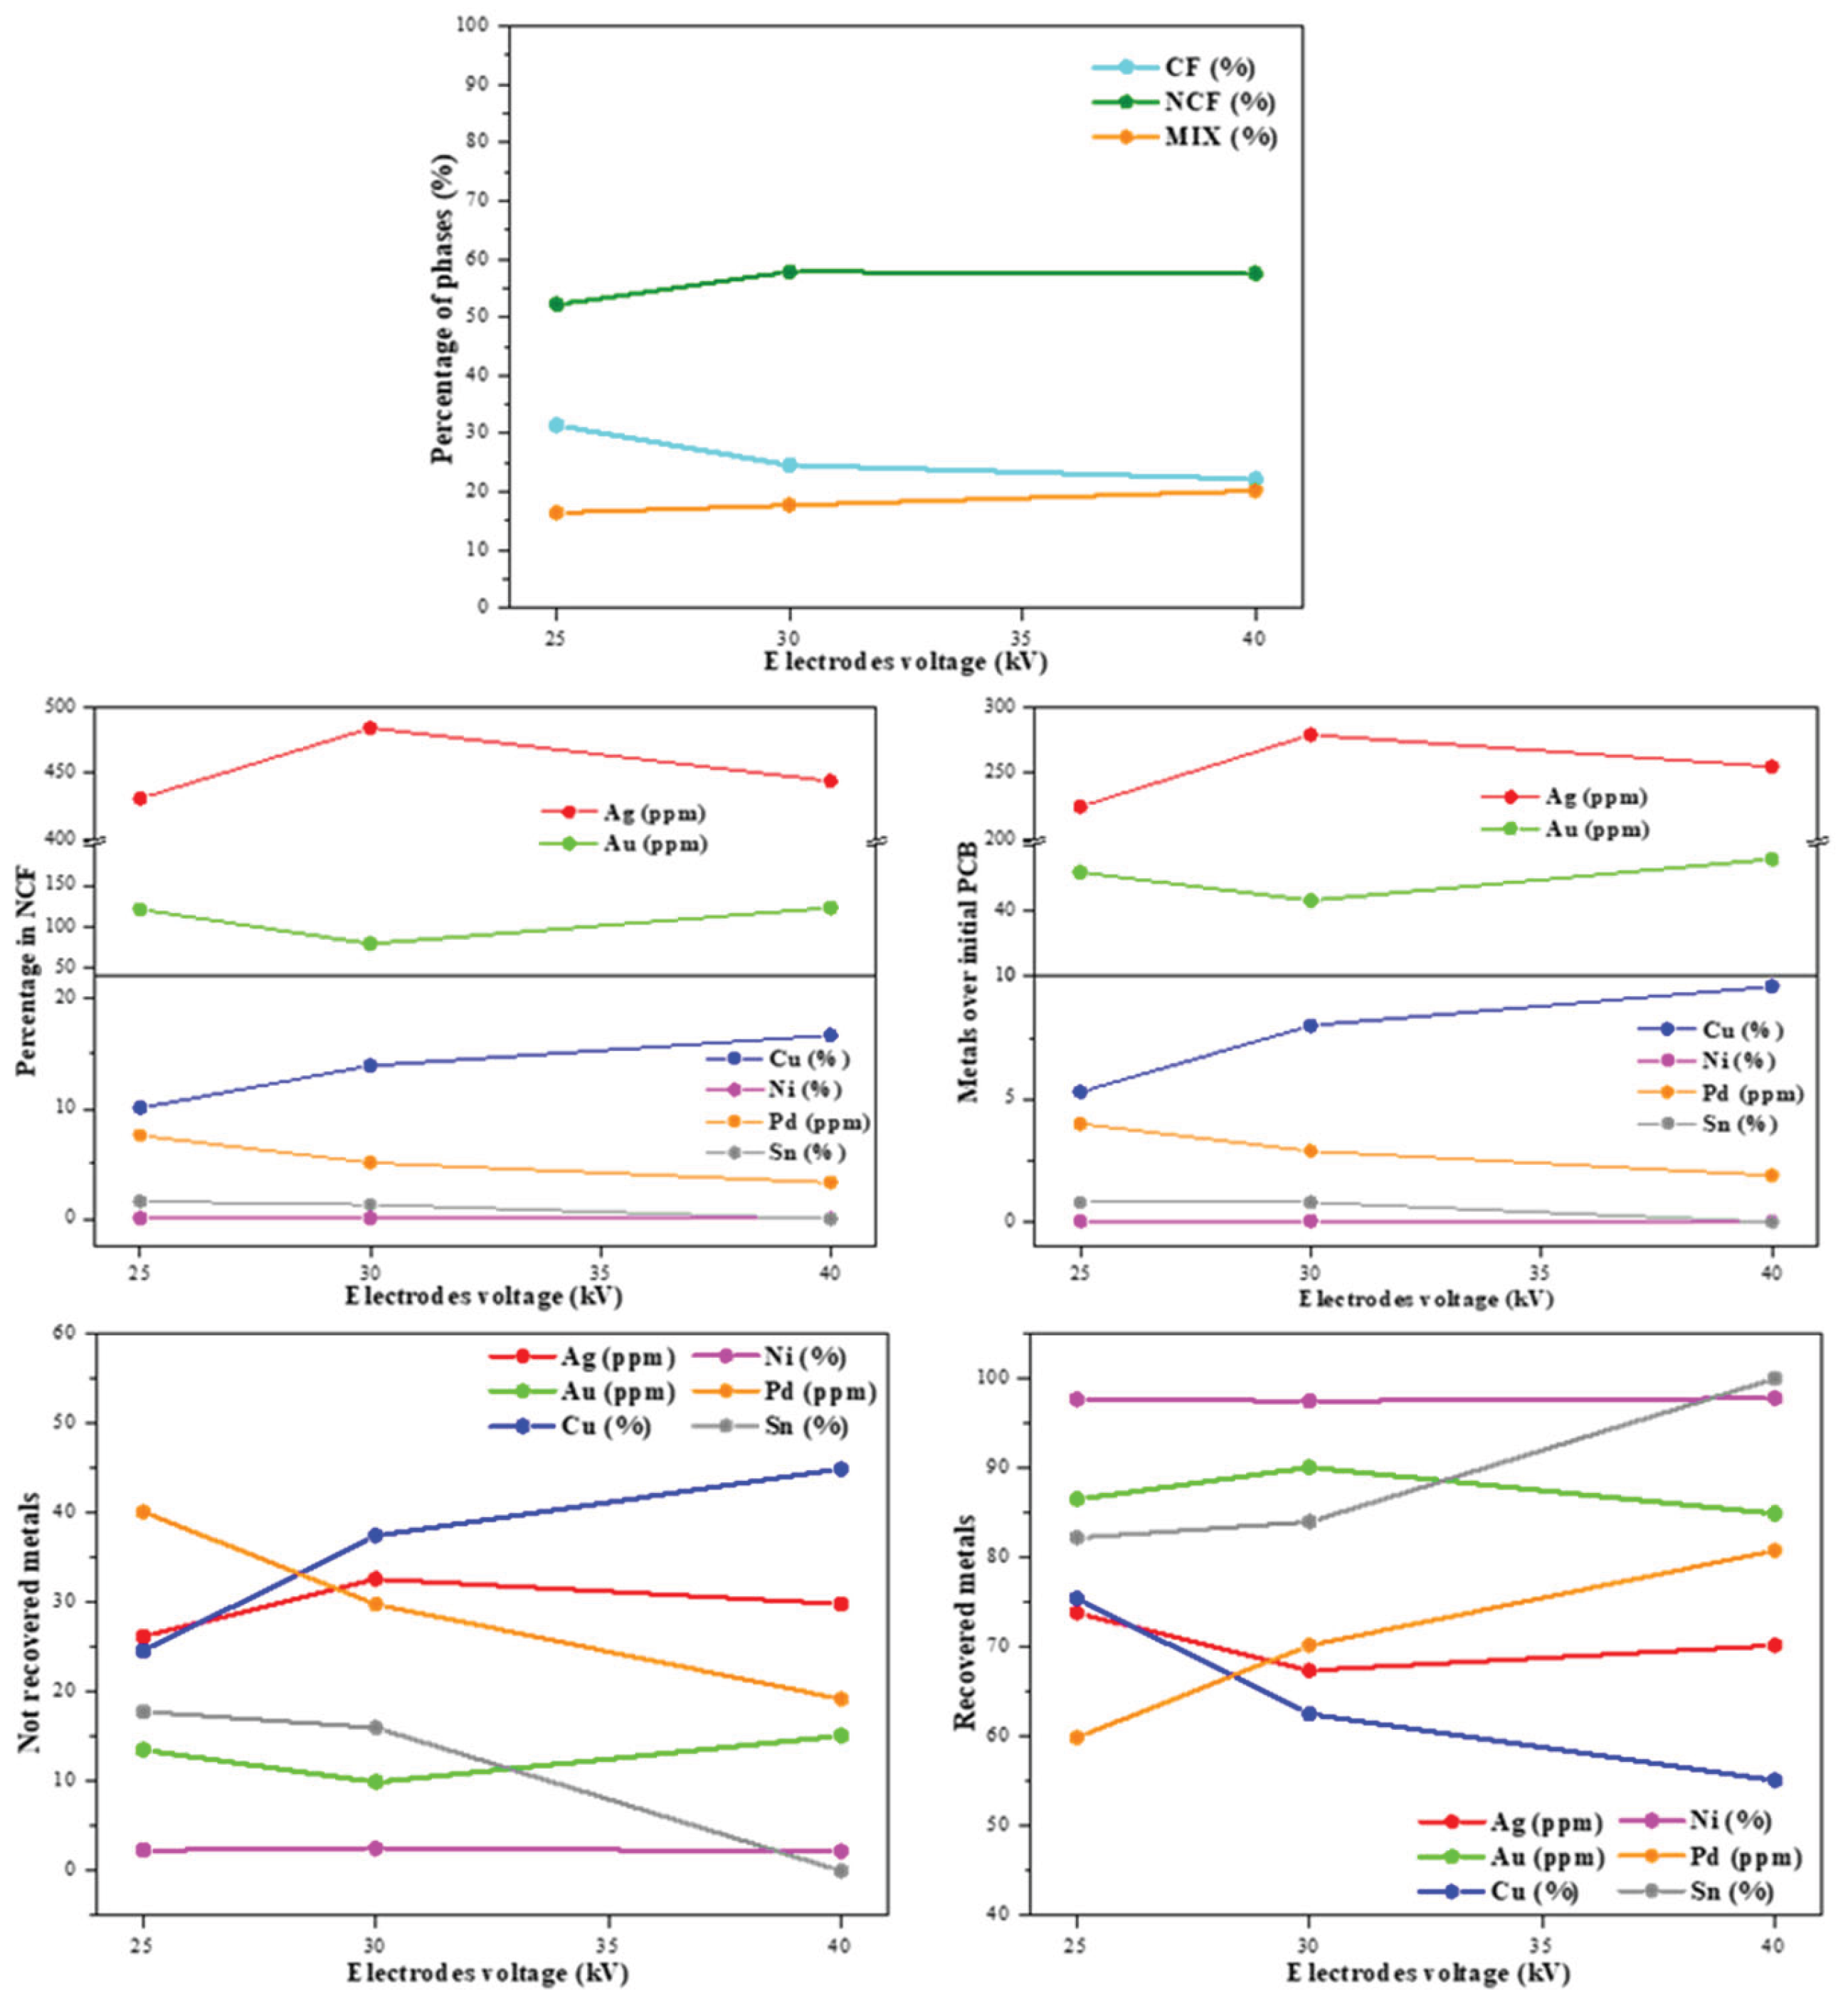
Figure 5.
Percentage of different output fractions (a), and metallic percentage over the different fractions (b-e) after the electrostatic separation tests for variation of the drum speed.
Figure 5.
Percentage of different output fractions (a), and metallic percentage over the different fractions (b-e) after the electrostatic separation tests for variation of the drum speed.
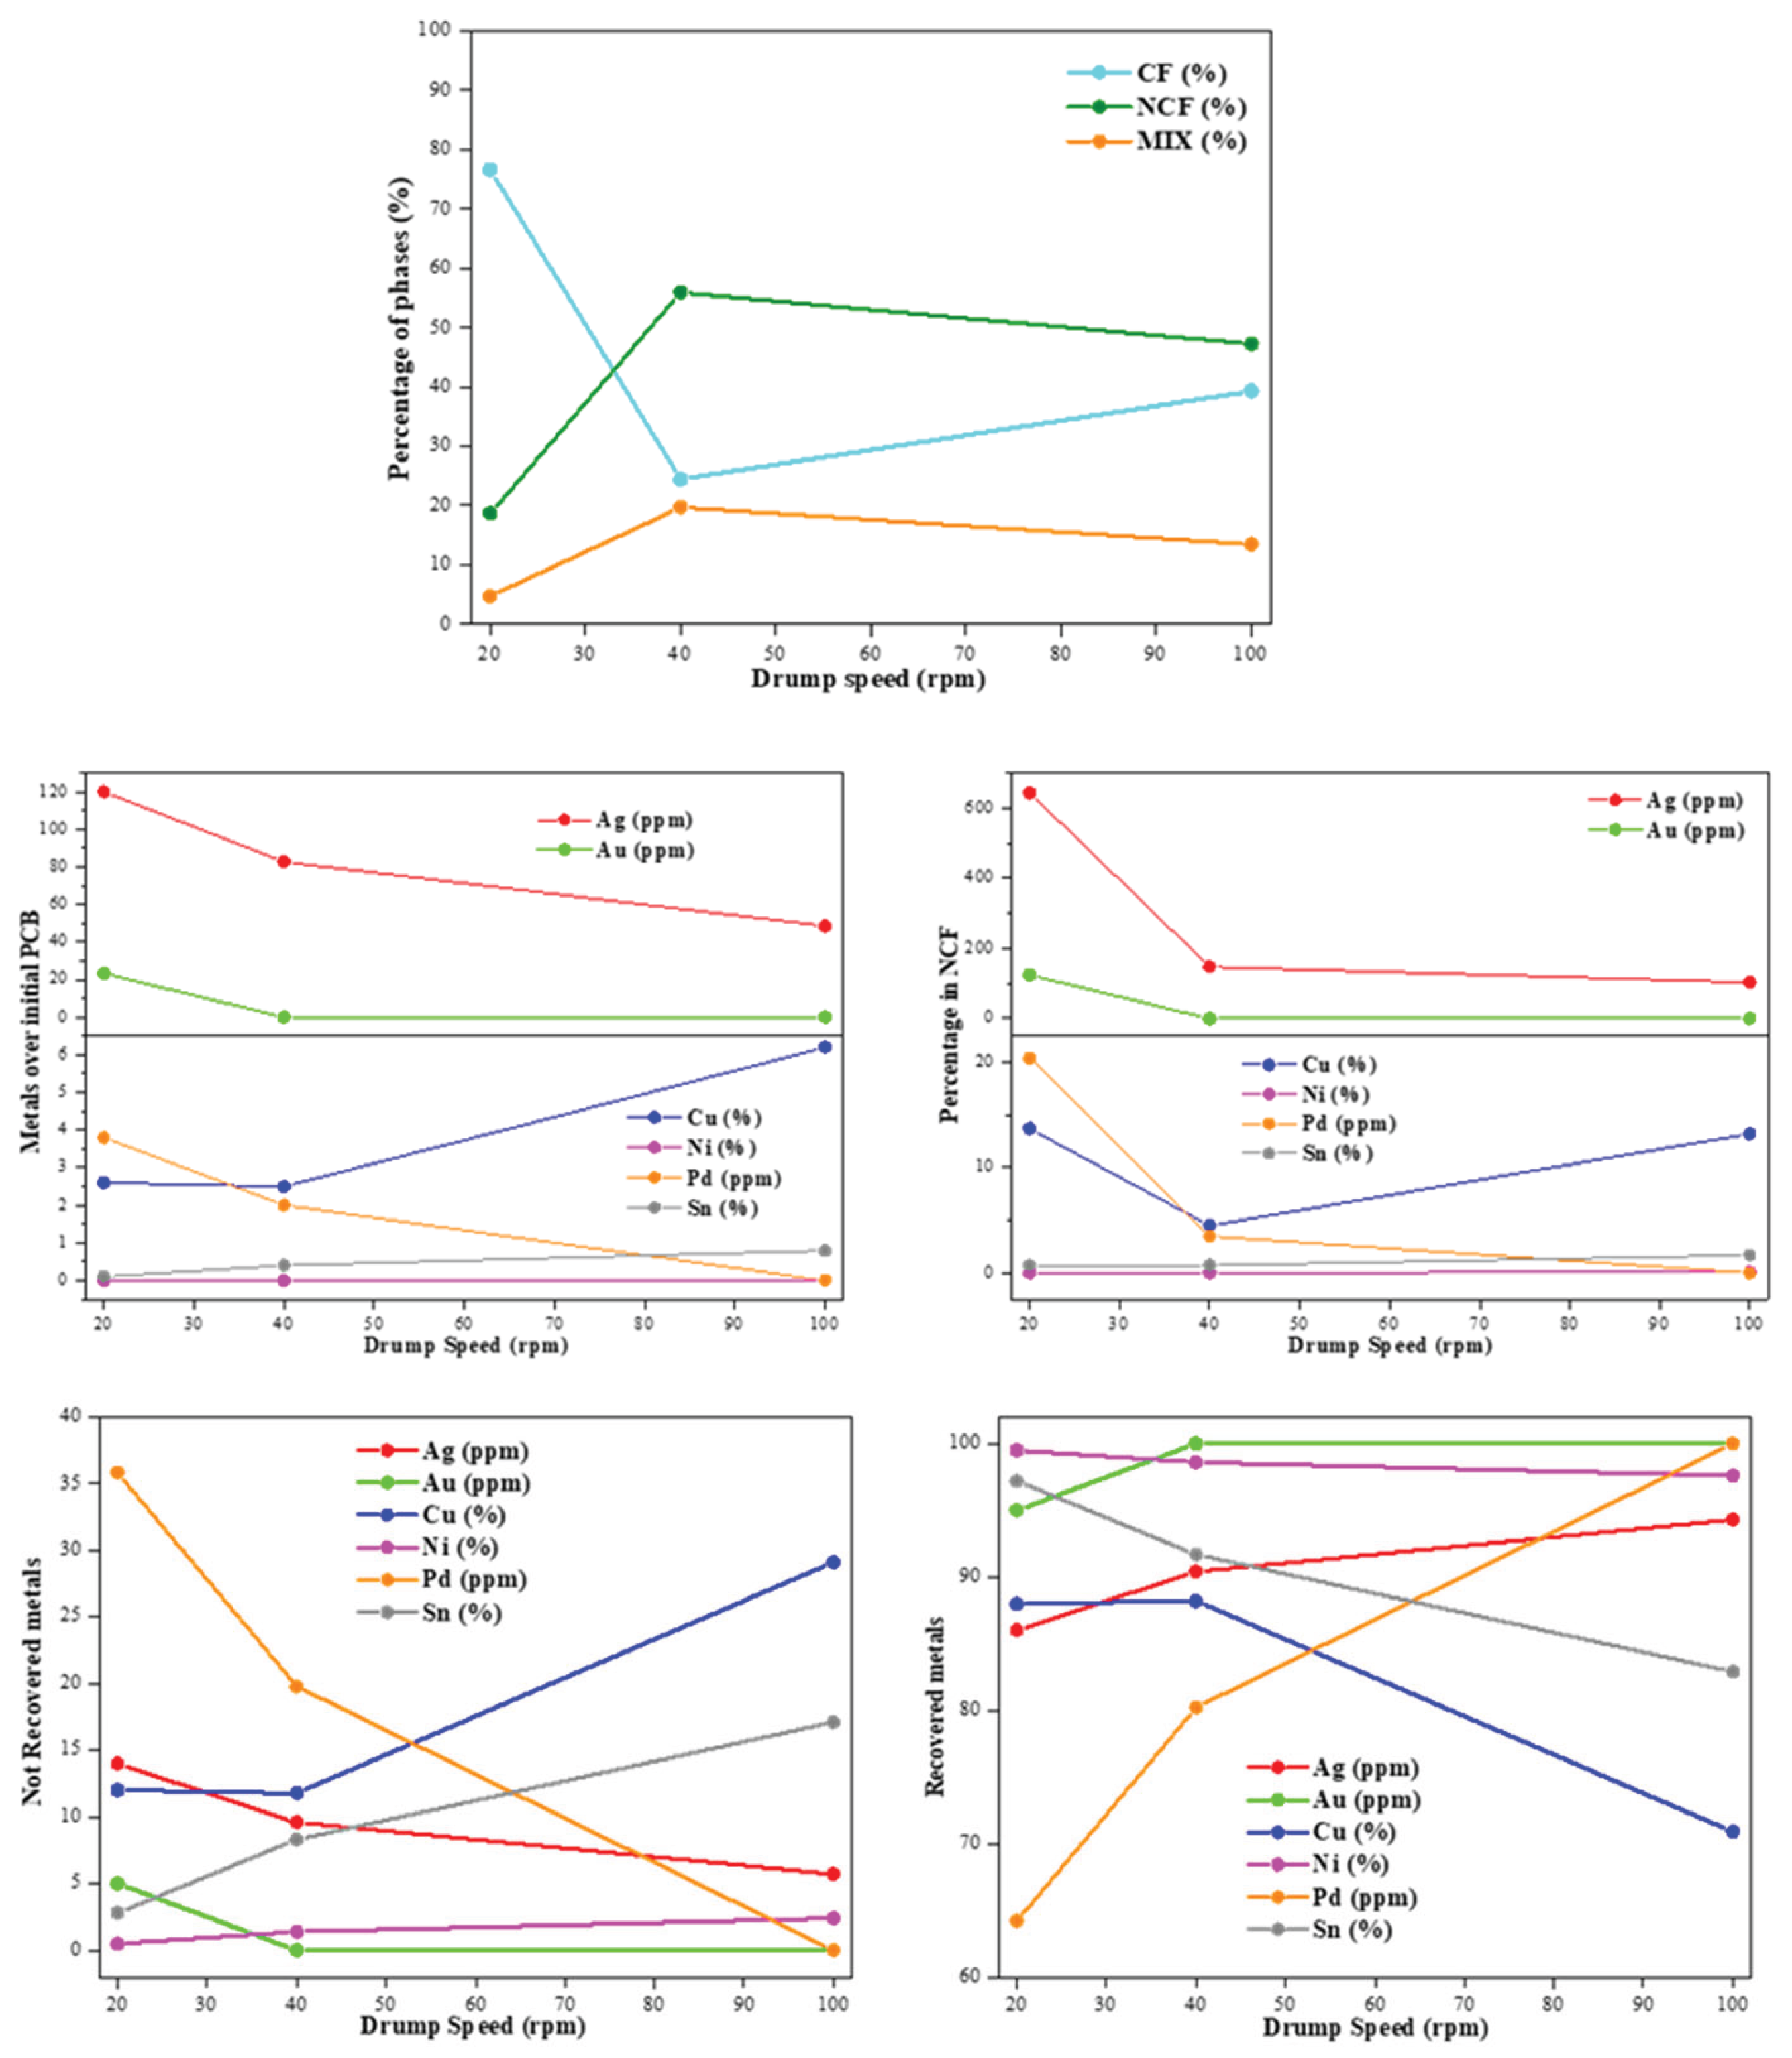
Table 1.
Experimental conditions for specimens from electrostatic separation. Green boxes: Feed Flow rate modification; Pink boxes: Electrode Voltage modification; Blue boxes: Drum speed modification.
Table 1.
Experimental conditions for specimens from electrostatic separation. Green boxes: Feed Flow rate modification; Pink boxes: Electrode Voltage modification; Blue boxes: Drum speed modification.
| Sample | Feed Flow rate (kg/h) |
Electrode voltage (kV) | Drumm speed (rpm) |
|---|---|---|---|
| FR30-EV35-DS20 | 30 | 35 | 20 |
| FR75-EV35-DS20 | 75 | ||
| FR120-EV35-DS20 | 120 | ||
| FR30-EV25-DS40 | 30 | 25 | 40 |
| FR30-EV30-DS40 | 30 | ||
| FR30-EV40-DS40 | 40 | ||
| FR30-EV40-DS20 | 30 | 40 | 20 |
| FR30-EV40-DS40 | 40 | ||
| FR30-EV40-DS100 | 100 |
Table 2.
Metallic composition from original MG crushed PCBs.
| Sample | Al (wt.%) | Ag (ppm) | Au (ppm) | Cu (wt.%) | Fe (wt.%) | Ni (wt.%) | Pd (ppm) | Si (wt.%) |
Sn (wt.%) |
|---|---|---|---|---|---|---|---|---|---|
| Crushed PCBs | 12.7 | 858 | 467.5 | 21.4 | 0.7 | 1.6 | 9.9 | 3.8 | 4.7 |
Table 3.
Physical characterization (mass percentage, density, and plastic percentage) for distinct phases obtained from specimens tested at different feed flow rate.
Table 3.
Physical characterization (mass percentage, density, and plastic percentage) for distinct phases obtained from specimens tested at different feed flow rate.
| Sample | Output fraction* | Mass (wt.%) |
Density (g/cm3) | Plastics (wt.%) |
|---|---|---|---|---|
| FR30-EV35-DS20 | CF | 64.6 | 5.7 | 2.8 |
| NCF | 31.0 | 2.1 | 44.1 | |
| MIX | 1.4 | 3.1 | 7.3 | |
| FR75-EV35-DS20 | CF | 69.5 | 7.7 | 1.9 |
| NCF | 27.7 | 2.0 | 32.2 | |
| MIX | 2.8 | 2.2 | 16.7 | |
| FR120-EV35-DS20 | CF | 78.9 | 8.1 | 2.1 |
| NCF | 16.1 | 1.9 | 39.6 | |
| MIX | 3.0 | 2.9 | 12.1 |
* CF: Conductive Fraction; NCF: Non-Conductive Fraction; MIX: Mixed fraction.
Table 4.
Composition of distinct phases obtained from specimens tested at different feed flow rate.
| Sample | Fraction | Ag (ppm) |
Au (ppm) |
Cu (wt.%) | Ni (wt.%) | Pd (ppm) |
Sn (wt.%) |
|---|---|---|---|---|---|---|---|
| FR30-EV35-DS20 | NCF* | 627 | 123.0 | 12.3 | 0.05 | 5.8 | 0.9 |
| AP# | 194 | 38.1 | 3.8 | 0.02 | 1.8 | 0.3 | |
| MP@ | 22.6 | 8.2 | 17.8 | 1.0 | 18.2 | 5.9 | |
| FR75-EV35-DS20 | NCF | 431 | 121.0 | 11.1 | 0.07 | 6.6 | 1.6 |
| AP | 119 | 33.5 | 3.1 | 0.02 | 1.8 | 0.4 | |
| MP | 13.9 | 7.2 | 14.4 | 1.2 | 18.4 | 9.4 | |
| FR120-EV35-DS20 | NCF | 445 | 122 | 16.7 | 0.06 | 3.3 | 0.9 |
| AP | 72 | 19.6 | 2.7 | 0.01 | 0.5 | 0.2 | |
| MP | 8.4 | 4.2 | 12.6 | 0.6 | 5.4 | 3.1 |
* NFC: Non-Conductive Fraction; #AP: Absolute Percentage over the initial PCB; @MP: Metallic percentage over the initial metallic amount.
Table 5.
Physical characterization (mass percentage, density, and plastics percentage) of distinct phases obtained from specimens tested at different electrode voltage.
Table 5.
Physical characterization (mass percentage, density, and plastics percentage) of distinct phases obtained from specimens tested at different electrode voltage.
| Sample | Output fraction* | Mass (wt.%) |
Density (g/cm3) | Plastics (wt.%) |
|---|---|---|---|---|
| FR30-EV25-DS40 | CF | 31.4 | 4.8 | < 1 |
| NCF | 52.2 | 2.3 | 29.1 | |
| MIX | 16.4 | 2.4 | 24.7 | |
| FR30-EV30-DS40 | CF | 24.6 | 5.8 | < 1 |
| NCF | 57.8 | 2.3 | 30.5 | |
| MIX | 17.7 | 2.5 | 16.1 | |
| FR30-EV40-DS40 | CF | 22.2 | 5.3 | < 1 |
| NCF | 57.5 | 2.2 | 33.4 | |
| MIX | 20.2 | 3.0 | < 1 |
* CF: Conductive Fraction; NCF: Non-Conductive Fraction; MIX: Mixed fraction.
Table 6.
Composition of distinct phases obtained from specimens tested at different electrode voltage.
Table 6.
Composition of distinct phases obtained from specimens tested at different electrode voltage.
| Sample | Fraction | Ag (ppm) |
Au (ppm) |
Cu (wt.%) | Ni (wt.%) | Pd (ppm) |
Sn (wt.%) |
|---|---|---|---|---|---|---|---|
| FR30-EV25-DS40 | NCF* | 431 | 121 | 10.1 | 0.07 | 7.6 | 1.6 |
| AP# | 225 | 63 | 5.3 | 0.04 | 4.0 | 0.8 | |
| MP@ | 26.2 | 13.5 | 24.6 | 2.3 | 40.1 | 17.8 | |
| FR30-EV30-DS40 | NCF | 484 | 80 | 13.9 | 0.07 | 9.7 | 1.3 |
| AP | 279 | 46 | 8.0 | 0.04 | 5.6 | 0.8 | |
| MP | 32.6 | 9.9 | 37.5 | 2.5 | 56.6 | 16.0 | |
| FR30-EV40-DS40 | NCF | 444 | 123 | 16.7 | 0.06 | 3.3 | 0 |
| AP | 255 | 71 | 9.6 | 0.03 | 1.9 | 0.0 | |
| MP | 29.8 | 15.1 | 44.9 | 2.2 | 19.2 | 0.0 |
* NFC: Non-Conductive Fraction; #AP: Absolute Percentage over the initial PCB; @MP: Metallic percentage over the initial metallic amount.
Disclaimer/Publisher’s Note: The statements, opinions and data contained in all publications are solely those of the individual author(s) and contributor(s) and not of MDPI and/or the editor(s). MDPI and/or the editor(s) disclaim responsibility for any injury to people or property resulting from any ideas, methods, instructions or products referred to in the content. |
© 2025 by the authors. Licensee MDPI, Basel, Switzerland. This article is an open access article distributed under the terms and conditions of the Creative Commons Attribution (CC BY) license (http://creativecommons.org/licenses/by/4.0/).
Copyright: This open access article is published under a Creative Commons CC BY 4.0 license, which permit the free download, distribution, and reuse, provided that the author and preprint are cited in any reuse.


