Submitted:
21 June 2025
Posted:
24 June 2025
You are already at the latest version
Abstract
Due to its broad climatic adaptability, extensive host range, robust ability to overcome re-sistance genes, and high pathogenicity, M. enterolobii has emerged as one of the most de-structive roots knot nematodes. Conventional root knot nematode resistance genes are in-effective against this species, as it can reproduce on crops carrying common resistance loci. Chitin, a major structural component of the nematode eggshell and cuticle, is synthesized by chitin synthase (CHS), an enzyme essential for regulating nematode development and re-production. Previous studies have demonstrated that silencing chitin synthase genes en-hances plant resistance to root knot nematodes; however, to date, no investigations have targeted chitin synthase genes in M. enterolobii specifically. In this study, we cloned a full-length chitin synthase gene (Me-chs-1) from M. enterolobii with a 3,788-bp coding sequence (CDS) encoding a 1,261-amino acid protein. Based on amino acid multiple sequence align-ment and phylogenetic tree analysis, the gene was designated Me-chs-1. Furthermore, three silencing vectors targeting the conserved domain of Me-chs-1 were constructed. Host-induced gene silencing (HIGS) was employed to suppress the chitin synthase gene in M. en-terolobii. Results demonstrated that all three vectors efficiently silence Me-chs-1. Compared to wild-type controls, the RNAi-treated groups exhibited significant reductions in gall number, egg-mass number, eggs per mass, and total egg count. The most effective RNAi line showed decreases of 76.12% in gall number, 82.35% in egg mass number, 62.44% in eggs per mass, and 82.73% in total egg count. Acid fuchsin staining revealed that nematodes in the RNAi-treated groups were notably smaller than in their wild-type counterparts, with delayed de-velopment and even developmental malformations, thereby tomato resistance to M. enter-olobii was enhanced. Transcriptome sequencing analysis identified a total of 501 differential-ly expressed genes (DEGs), and further pathway interaction network analysis revealed a po-tential indirect regulatory network between the chitin biosynthesis pathway and the Wnt signaling pathway. This research provides a novel direction for root-knot-nematode-resistant breeding and the development of innovative nematicides.
Keywords:
M. enterolobii
; HIGS
; RNAi
; transcriptome sequencing technology
1. Introduction
Meloidogyne spp. are sedentary endoparasitic nematodes that infect plant roots and have a broad geographic distribution [1]. Upon penetration of the root cortex, these nematodes establish specialized feeding sites and secrete effector proteins—such as cellulases and pectinases—that induce abnormal cell division, resulting in the formation of root galls or tumor-like structures of various sizes [2]. In the early stages, these galls appear white or yellowish white; over time they brown and decay, causing severe deformities in the root system that obstruct normal water and nutrient uptake. Although gall formation is often accompanied by an apparent increase in the number of lateral and fine roots, the functional root surface area is reduced, further impairing the plant’s ability to absorb soil resources. These pathological changes ultimately manifest aboveground as stunted growth and leaf chlorosis and in severe cases lead to wilting and plant death [3,4]. For example, melon plants infected with root-knot nematodes become dwarfed and chlorotic, with poorly developed fruits [5], while the yields of tomato, cucumber, and other vegetables can decline by more than 50% due to root damage [6]. In addition to directly siphoning off plant nutrients, root-knot nematode infection damages the root tissue, creating entry points for fungal, bacterial, and viral pathogens and thereby precipitating secondary diseases such as root rot and wilt [7,8].
Meloidogyne spp. inflict severe economic damage, causing global annual losses estimated at up to USD 100 billion [9], and have emerged as major worldwide phytopathogens [10]. Over 100 species of root-knot nematodes have been described; the most prevalent include Meloidogyne incognita, Meloidogyne hapla, Meloidogyne arenaria, Meloidogyne javanica, and Meloidogyne enterolobii [11,12]. Among these, M. enterolobii poses the greatest threat. First reported in 1983 on Cerrado bean (Erythrina variegata) in Danzhou, Hainan Province, China [13],it has since been detected in Fujian, Guangdong, Yunnan, and Liaoning provinces [13,14]. Its distribution is primarily tropical and subtropical but is expanding into higher-latitude regions—a trend expected to accelerate under global warming and soil-heating in protected agriculture [15].
Compared with closely related species such as M. incognita and M. javanica, M. enterolobii causes more severe damage. Its host range is exceptionally broad, encompassing major solanaceous and cucurbit crops far beyond that of other root-knot nematodes [16]. Moreover, M. enterolobii can overcome multiple plant resistance genes—such as tomato Mi-1, potato Mh, pepper N, sugar beet Tabasco, and soybean Mir1 [17,18,19,20]—rendering conventional resistant cultivars ineffective, whereas other root-knot species generally cannot break these resistances. Its pathogenicity is also greater: the minimum infective dose on tomato is 0.08 J2 per cm³ of soil, compared to 1.0 J2/cm³ for M. incognita and 0.64 J2/cm³ for M. javanica, with subsequent gall counts, egg mass counts, and reproduction indices significantly higher than those of other species [21]. Hence, further investigation into M. enterolobii and the development of effective control strategies are critically important.
The life cycle of root-knot nematodes comprises three stages: egg, larval (second-, third-, and fourth-stage juveniles), and adult [22]. Each stage fulfills a distinct and indispensable role in the complex pathogenic process. First, eggs are deposited within a gelatinous matrix, which both protects the next generation of infective agents and sets the stage for the mass release of infective second-stage juveniles (J2s). Upon hatching, J2s display high motility and strong chemotactic responses, enabling them to detect and migrate toward root exudates. Using their stylet and secreting cell-wall-degrading enzymes (e.g., cellulases and pectinases), they penetrate the root epidermis and successfully invade the cortical tissue [23]. Once inside the root, J2s secrete a suite of effector proteins that not only suppress the plant’s primary immune defenses—including pattern-triggered immunity (PTI) and effector-triggered immunity (ETI)—but also disrupt hormonal homeostasis (notably the auxin–cytokinin balance). This induces adjacent root cells to undergo abnormal division and expansion, leading to the formation of nutrient-rich giant cells that serve as a continuous food source for the nematodes [23,24]. As the nematodes progress to third- and fourth-stage juveniles (J3, J4) and ultimately to the adult stage, they remain anchored to these giant cells, perpetuating and reinforcing the effector-mediated pathogenic state. Concurrently, females begin egg production, thereby establishing a self-sustaining disease cycle through continuous reproduction [24]. In summary, the pathogenic strategy of root-knot nematodes—from egg laying and J2 invasion to giant cell induction and long-term parasitism—relies on the coordinated function of each developmental stage to ensure successful infection and dissemination. This is a focal point of current research into effective disease control.
Chitin, a linear polymer of β-1,4–linked N-acetylglucosamine, is an abundant structural polysaccharide [25]. It is a key component of fungal cell walls, insect cuticles, and the eggshells and hypodermal layers of certain nematodes, where it contributes to cell shape, structural stability, and developmental processes [26,27,28,29]. Therefore, chitin has been extensively studied and applied in pest and disease control, with biological control one of its key applications. For instance, chitin-derived fragments can be recognized by plants to induce multiple defense responses, such as the accumulation of phytoalexins, pathogenesis-related (PR) proteins, and protease inhibitors. Additionally, cell wall lignification and the deposition of callose further strengthens the crop’s immune barrier. These properties make chitin a promising bioagricultural material [30]. The chitin biosynthesis pathway comprises three key steps: substrate generation, chitin polymerization, and modification/deposition. First, glucose undergoes a series of metabolic reactions catalyzed by hexokinase, glucose-6-phosphate isomerase, and other related enzymes to produce UDP-N-acetylglucosamine (UDP-GlcNAc), the direct substrate for chitin synthesis. Subsequently, UDP-GlcNAc is catalyzed by chitin synthase localized on the cell membrane. This enzyme links N-acetylglucosamine units via β-1,4-glycosidic bonds to form linear, unbranched chitin polymers. Finally, the synthesized chitin chains undergo further modifications and are deposited in structures such as cell walls, insect exoskeletons, nematode eggshells, and other specialized compartments [26]. Notably, chitin synthase plays a pivotal role in this process, as its activity and regulation critically determine the quantity and quality of the chitin produced [31]. Previous studies have demonstrated that silencing chitin synthase genes in plant-parasitic nematodes enhances host resistance [32,33]; however, to date, no such investigation has been reported for M. enterolobii.
This study targeted the chitin synthase gene of M. enterolobii: the full-length gene was cloned and subjected to bioinformatic analysis, host-induced gene silencing (HIGS) was then used to knock down the chitin synthase gene in M. enterolobii, and the silenced nematodes were inoculated to validate the effect, thereby laying the groundwork for further elucidation of chitin synthase gene function and mechanism of action, as well as for the development of M. enterolobii-resistant crop varieties and novel nematicides.
2. Materials and Methods
2.1. Plant and Nematode Materials
Tested tomato variety: The susceptible tomato cultivar Microtom, preserved by the Nematology Laboratory of Yunnan Agricultural University.
Root-knot nematode source: M. enterolobii was collected, purified, and propagated by the Nematology Laboratory of Yunnan Agricultural University. Live nematodes were maintained in the root systems of the highly susceptible tomato cultivar Zhongshu No.4 and water spinach (Ipomoea aquatica).
2.2. Total RNA Extraction
Tomato seedlings infected with M. enterolobii were rinsed with distilled water, and root galls containing eggs were collected as extraction samples. Total RNA was isolated using the TransZol Up Plus RNA Kit. RNA concentration and purity were measured using a NanoDrop spectrophotometer. RNA integrity was further verified via 1% agarose gel electrophoresis. High-quality RNA (A260/A280 = 1.8–2.0, clear ribosomal bands) was reverse-transcribed into cDNA using the PrimeScript™ RT Reagent Kit with gDNA Eraser.
2.3. Cloning of the Full-Length CDS Sequence of the Chitin Synthase Gene
Using cDNA as the template, the cloning was performed in two segments, separately obtaining the 5′ and 3′ CDS fragments, which were then assembled into the pUC19 vector using the ClonExpress Ultra One Step Cloning Kit V2 to generate the full-length CDS of the chitin synthase gene.
Primers (5′ end: ATGCTTTTTTACCGCGATCACCAC/CCTGTGACCACCGCTTTTTAT; 3′ end: GTGGAGGCGCTCTTCTCTTT/CCAATCCATGACGTGTGTAACC; seamless cloning primers: aaaacgacggccagtgaattcATGCTTTTTTCCGCGATCACC/gaccatgattacgccaagcttTCATGCAATGCTTCCACTAACG) were designed using the online primer design software CE Design (http://www.vazyme.com).
2.4. Sequence Alignment and Functional Analysis
The cDNA sequences were aligned and analyzed using DNAMAN (https://www.dnaman.net/), and their nucleotide sequences were translated into amino acid sequences. Conserved domains were identified via the CD-Search tool at the National Center f-or Biotechnology Information (NCBI) (http://www.ncbi.nlm.nih.gov/blast/).The amino acid sequences of chitin synthase were retrieved from the NCBI and WormBase (https://wormbase.org/) databases. Multiple sequence alignment and phylogenetic tree construction were conducted using MEGA version 11.0 (https://www.megasoftware.net/older_versions).
2.5. Construction of the Gene Silencing Vector and Agrobacterium-Mediated Transformation of Tomato
An RNAi construct targeting the conserved domain of the Me-chs-1 gene was generated. Three primer pairs—tatF⁺/tatF⁻, loop⁺/loop⁻, and tatR⁺/tatR⁻—were designed against the target region. The tatF⁺/tatF⁻ and tatR⁺/tatR⁻ fragments were PCR-amplified from a plasmid harboring the Me-chs-1 CDS, whereas the loop⁺/loop⁻ fragment was amplified from the pCTAG11-GUSPlus vector. (Primer sequences are provided in Appendix 2). PCR products were resolved on a 1% agarose gel, and the bands corresponding to the expected sizes were excised and purified. Purified PCR fragments were then cloned into the pBWA(V)HS vector via homologous recombination to yield recombinant plasmids under the control of the CaMV 35S promoter. Following transformation into Escherichia coli, positive clones were identified using colony PCR and confirmed via Sanger sequencing; plasmids from verified clones were further validated by using EcoRV restriction analysis. The confirmed RNAi constructs were introduced into Agrobacterium tumefaciens strain GV3101 via heat shock. Transformants containing the target insert were selected and stored at –80°C. Finally, tomato cotyledons were transformed using the Agrobacterium-mediated transformation system. T₀ transgenic plants were screened by PCR to confirm genomic integration of the RNAi cassette, and T1 seeds were harvested for downstream experiments.
2.6. Inoculation of T1 Generation Seedling with M. enterolobii
Preparation of Nematode Inoculum: Roots from tomato seedlings at the egg-laying stage were thoroughly washed, chopped into small pieces, and agitated in 6% sodium hypochlorite for 7 min. The suspension was then poured through a composite sieve (upper mesh 0.075mm lower mesh 0.03 mm) and rinsed with tap water until no bleach residue remained. Egg suspensions retained on the 0.03 mm mesh were collected into Petri dishes lined with moist filter paper and incubated at room temperature to hatch second-stage juveniles (J2). The root galling percentage was calculated following the method outlined by YAN Xirui [34], and the results were classified using the root galling index grading standards described in the same paper.
Seed Surface Sterilization and Germination: T1 transgenic and wild-type tomato seeds were surface-sterilized by immersion in 6% sodium hypochlorite for 7 min, followed by thorough rinsing in sterile water. The seeds were then evenly spaced on moist filter paper in Petri dishes and germinated at 25°C until radicles emerged. Germinated seeds were subsequently transferred to seedling trays for further growth.
When seedlings developed 4–5 true leaves, they were transplanted into individual pots and placed in a solar greenhouse maintained at 25°C with a light/dark cycle of 10 hours light/114hours dark..Four to five holes approximately 1–2 cm deep were made around the base of the tomato stem at a distance of ~1 cm using a 1 ml pipette tip. A suspension of 500 second-stage juveniles (J2) of M. enterolobii was then uniformly inoculated into the root zone through the pipette, with the suspension distributed evenly around the holes.
2.7. Histopathological Staining
Three biological replicates of tomato roots were collected 2, 8, 16, 23, and 30 days after inoculation with M. enterolobii. The roots were thoroughly washed with water and stained using the sodium hypochlorite–acid fuchsin–glycerol method, as described by Byrd et al. [35], to observe nematode infection and development stages
2.8. Quantification of Pathological Parameters in Tomato 45 Days After Inoculation (dpi) with M. enterolobii
At 45 days post-inoculation, roots were harvested from three biological replicates each of wild-type and RNAi transgenic tomato lines and thoroughly washed. The following parameters were recorded: number of egg masses, number of galls, eggs per mass, and total egg count. The root galling percentage was calculated following the method outlined by YAN Xirui [34], and the results were classified using the root galling index grading standards described in the same paper.
Eggs per Mass: Single galls were excised and placed on concave slides; 6% sodium hypochlorite was added for 4–5 min to dissolve the egg mass. Released eggs were counted under a stereomicroscope, and any residual eggs on the gall surface were gently dislodged with a needle and included in the count.
Total Egg Count: Eggs were counted in 100 µL aliquots of nematode egg suspensions, prepared as described in Section 1.6, using a stereomicroscope. Counts were performed in triplicate. The total egg number was extrapolated from the overall suspension volume and summed with the previously counted eggs per mass.
2.9. qRT-PCR Analysis of Chitin Synthase Gene Expression
At 45 dpi, three biological replicates were collected from both T1 transgenic tomato plants and wild-type controls. Total RNA was extracted following the protocol described in Section 1.2 and reverse-transcribed into cDNA. The Actin gene of M. enterolobii was used as the internal reference, with amplification primers Me-Actin-F/Me-Actin-R (5′-AGTGCGACATTGACATCCGT-3′ / 5′-TCGATGGTGCCAAAGCAGTA-3′).Gene-specific qPCR primers, Me-QP-F/Me-QP-R (5′-ATGTGTTTTATGCGCGCCAG-3′ / 5′-TCCGCCAACAAGTCCAAAGT-3′), were designed based on the CDS sequence of the chitin synthase gene. qRT-PCR was performed to quantify the relative expression of the target gene.
2.10. Effect of Silencing the Chitin Synthase Gene on the M. enterolobii Transcriptome
At 45 dpi with M. enterolobii, root samples were collected from three biological replicates each of the RNAi line (ZT3) and the wild-type control. From each replicate, female nematodes were carefully isolated from individual galls and reserved. Total RNA was extracted according to the protocol described in Section 2.1, and subsequently reverse-transcribed into cDNA. RNA sample concentration and purity were assessed spectrophotometrically, and those samples meeting the quality criteria for high-throughput sequencing were submitted to Shanghai Paiseno Biotechnology Co., Ltd. for transcriptome sequencing.
3. Result
3.1. Cloning and Bioinformatics Analysis of the Chitin Synthase Gene
Four putative chitin synthase genes in M. enterolobii were identified through NCBI database searches: CAD2169478.1, CAD2180532.1, CAK5089395.1, and CAK5088075.1. Sequence alignment revealed that these genes ranged in length from 3,684 to 3,840 bp (Figure 1). With high sequence homology (97.69%) among the four genes, primers targeting conserved regions were designed to clone the chitin synthase genes from M. enterolobii.
The gene was successfully cloned, with a coding sequence (CDS) length of 3,788 bp (Figure 1A). It contains 22 exons and 21 introns, encoding a protein composed of 1,261 amino acids. Conserved domain analysis identified seven conserved domains in the gene: Chitin Synthase C, Chitin Synthase 2, CESA-like, CESA-like 1, BcsA, Glyco_trans_2_3, and Gly-co_trans_2_3(Figure 2C). Notably, Chitin Synthase C and Chitin Synthase 2 are catalytic domains characteristic of chitin synthase genes, confirming the successful cloning of chitin synthase genes from M. enterolobii.
A phylogenetic tree was constructed for the proteins encoded by chitin synthase genes from different species. Phylogenetic assessment (Figure 2) showed that among the four chitin synthase genes of M. enterolobii, the cloned gene exhibited the highest amino acid sequence homology with the chitin synthase of M. incognita (Wormbase database accession number: Minc3s00218g07846). In addition, the chitin synthase genes of M. enterolobii had a relatively close evolutionary relationship with the chs-1 gene of C. elegans (GenBank accession number: G5ECD6.1), while the homology with the chs-2 gene of C. elegans (GenBank accession number: G5EBQ8.1) was significantly lower. Based on this conserved evolutionary pattern and functional orthology, the cloned chitin synthase gene of M. enterolobii was systematically designated as Me-chs-1.
3.2. Construction of Gene Silencing Vectors
Three RNAi silencing vectors—pBWA(V)HS-Chitin Synthase Gene Silencing 1-RNAi (ZT1), pBWA(V)HS-Chitin Synthase Gene Silencing 2-RNAi (ZT2), and pBWA(V)HS-Chitin Synthase Gene Silencing 3-RNAi (ZT3)—were successfully constructed (Figure 3). These vectors target three distinct conserved domains of the chitin synthase gene: 1497–1698bp (5′ end of the Chitin synthase_C domain), 1736–1950bp (3′ end of the Chitin synthase_C domain), and 2207–2408bp (spanning regions homologous to Chitin Synthase 2, CESA-like, CESA-like 1, BcsA, Glyco_trans_2_3, and Glyco_trans_2_3 domains).
3.3. The Expression Levels of Chitin Synthase Genes After Gene Silencing
The relative expression levels of the Me-chs-1 gene in wild-type plants (CK) and RNAi lines (ZT1, ZT2, and ZT3) were analyzed via qRT-PCR at 45 days post-inoculation with M. enterolobii (Figure 4A). The results revealed that all three RNAi vectors efficiently silenced the gene compared to CK, with expression levels in ZT1, ZT2, and ZT3 reduced to 25.75%, 14.9%, and 6.87% of those in CK, respectively. Silencing efficiency varied among the vectors, with ZT3 exhibiting the strongest suppression of Me-chs-1. Furthermore, transcriptome sequencing results for the ZT3 strain targeting M. enterolobii revealed reduced expression levels of four putative chitin synthase genes (CAD2169478.1, CAD2180532.1, CAK5089395.1, and CAK5088075.1) compared to the wild type (Figure 6B).
Notably, the fold-reduction in CAK5089395.1 and CAK5088075.1 exceeded that observed for CAD2169478.1 and CAD2180532.1. Among the four genes, CAD2180532.1 displayed the highest baseline expression, suggesting that CAD2180532.1 may serve as the predominant chitin synthase gene in M. enterolobii under the current experimental conditions.
3.4. Impact of Me-chs-1 Silencing on Cumulative Infection Rate and Developmental Progression in M. enterolobii
Analysis of cumulative infection rates at 2, 8, 16, 23, and 30 dpi revealed no significant differences between RNAi lines (ZT1-ZT3) and wild-type (CK) controls during the early infection stages (2-16 dpi) (Figure 5). However, on days 23 and 30, the cumulative penetration rates in the RNAi lines were lower than those in CK, suggesting that silencing of the Me-chs-1 gene may impair the nematode’s later-stage development and penetration ability, thereby reducing the cumulative invasion rate.
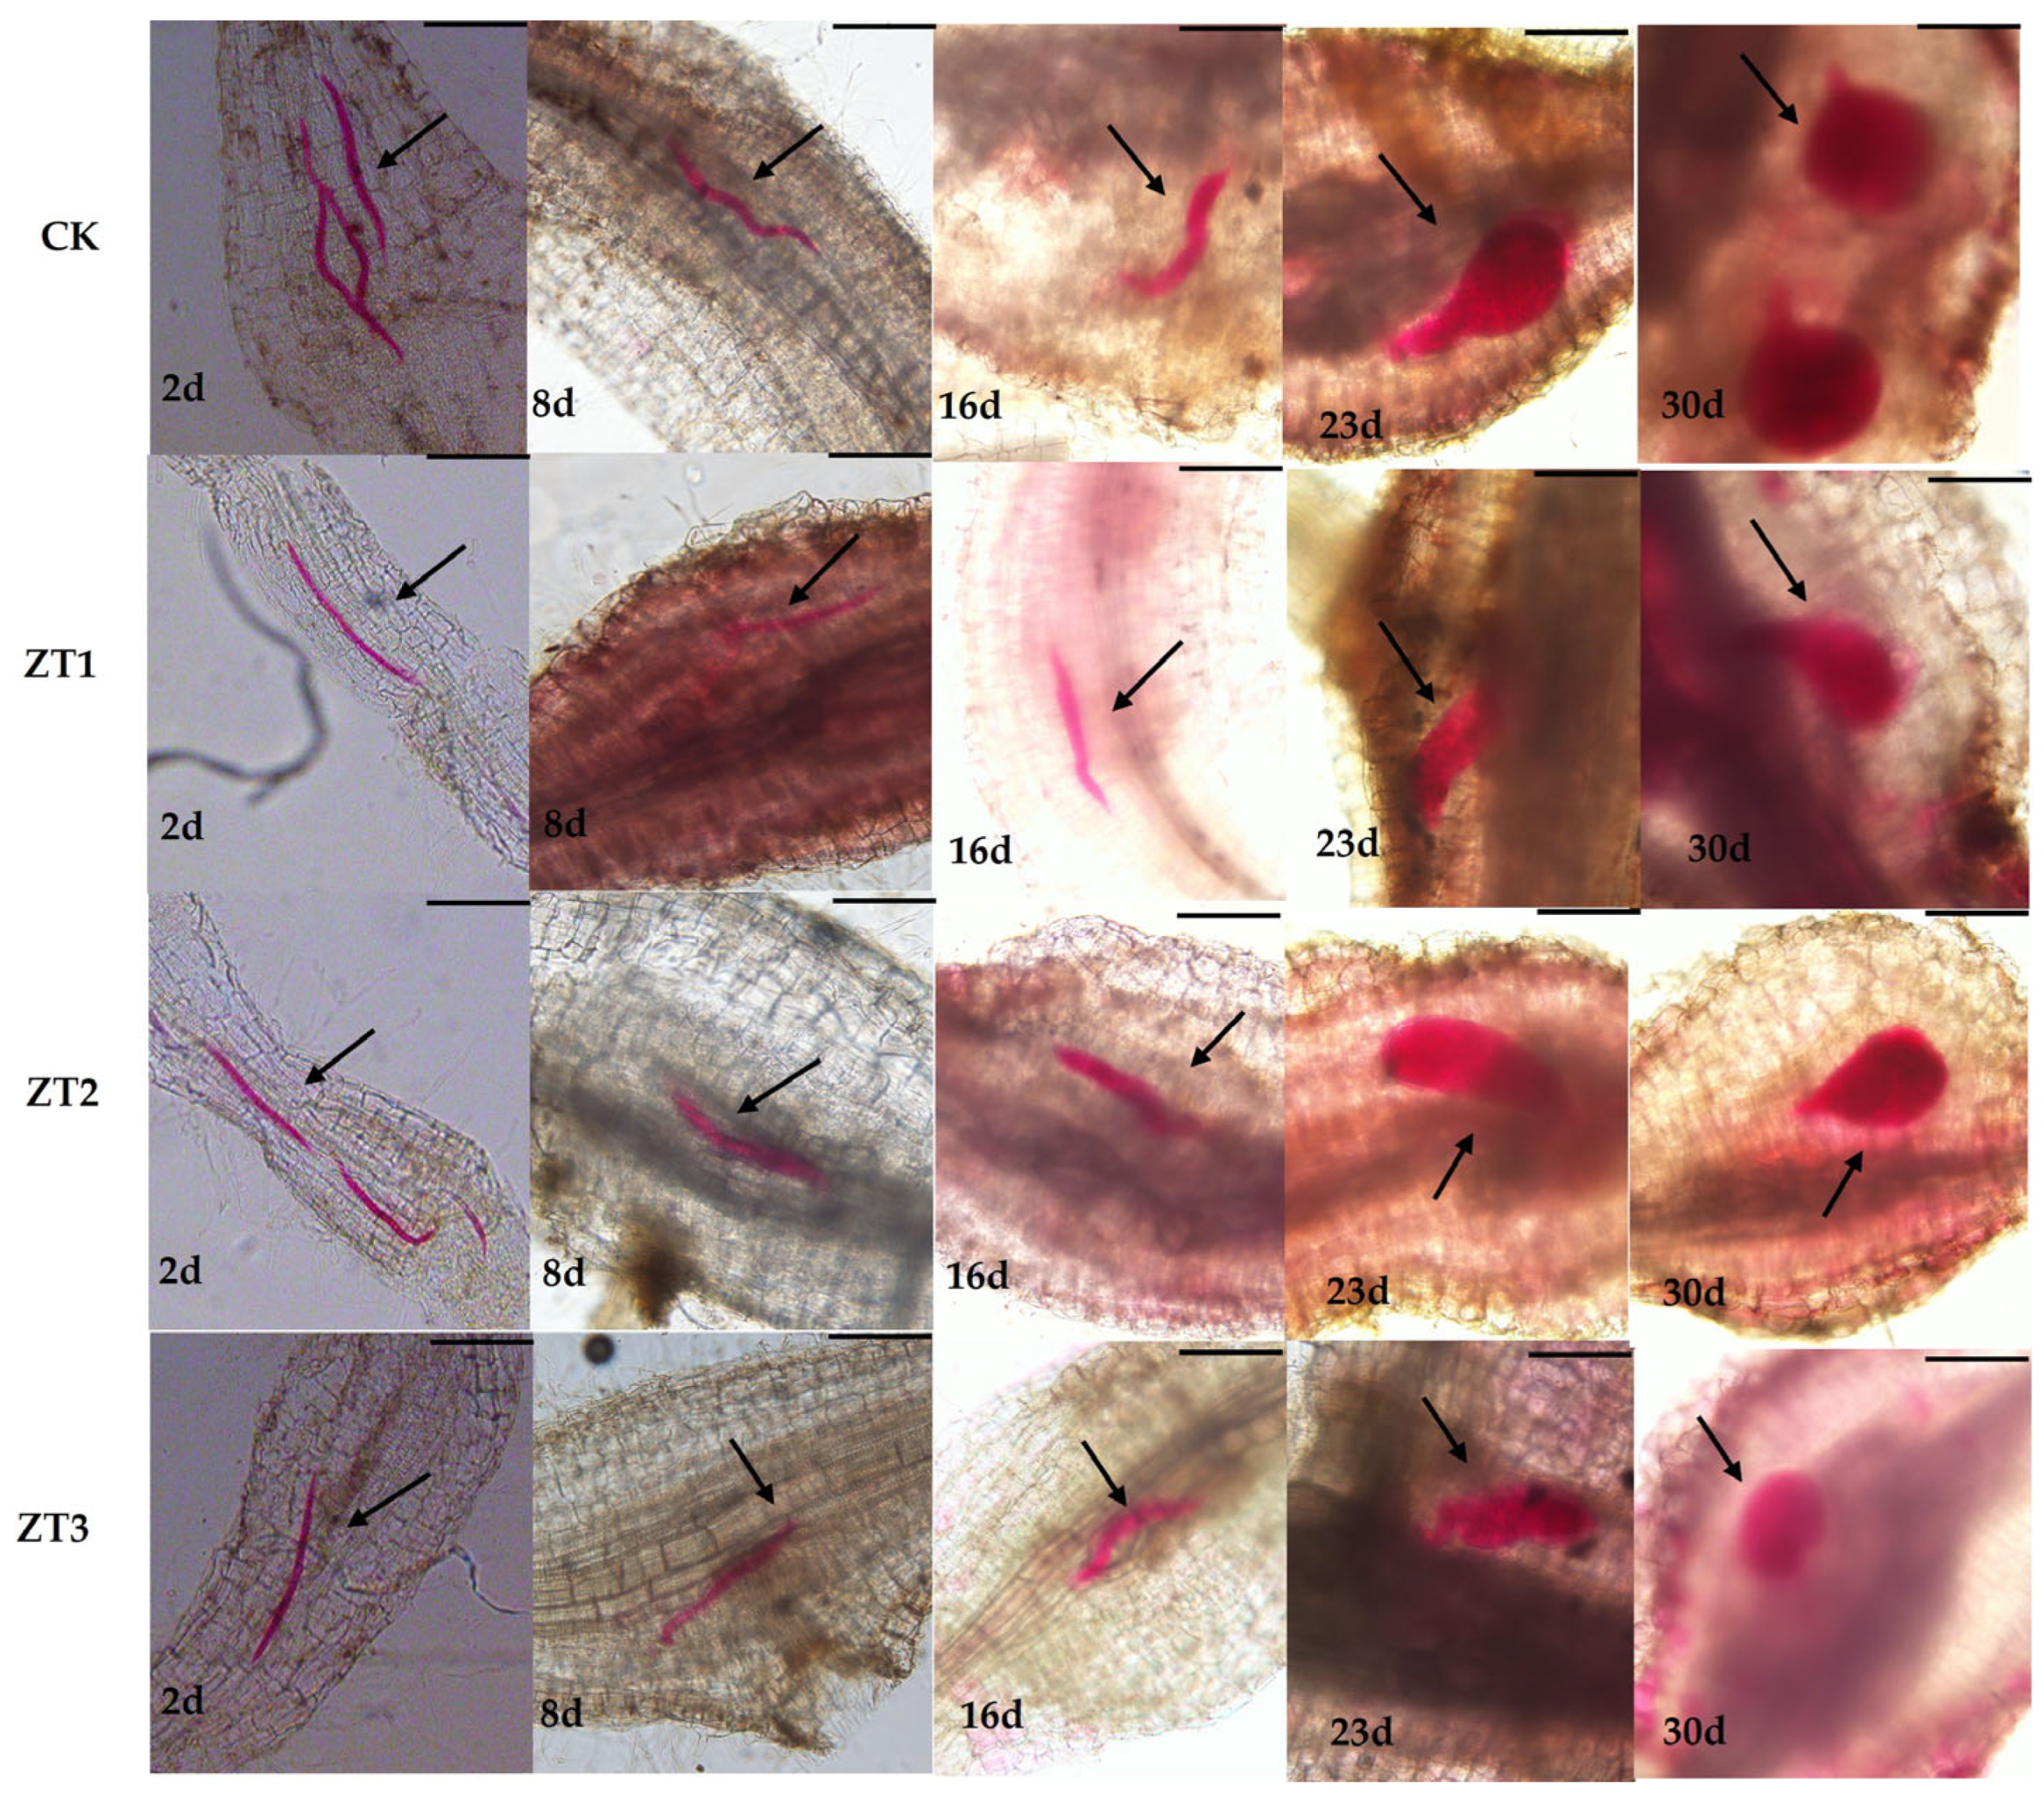
We also evaluated nematode developmental stages in CK and the three RNAi lines (ZT1, ZT2, and ZT3) at the same five time points (Figure 6). In CK roots, nematode development proceeded normally: by day 16 they had reached the third juvenile stage, by day 23 they exhibited initial female morphology, and by day 30 they were fully developed females. In contrast, although nematode development in ZT1, ZT2, and ZT3 did not differ significantly from CK from day 2 to day 16, between days 23 and 30 development was markedly delayed in all three RNAi lines, with juveniles remaining smaller than those in the wild type. Notably, in ZT3-treated roots, nematodes were not only smaller at days 2 and 30 but also displayed developmental deformities. These results indicate that RNAi-mediated silencing of Me-chs-1 suppresses middle- and late-stage development of M. enterolobii, with the strongest effect observed in ZT3.
Figure 6.
Development in the roots after inoculation with M. enterolobii in RNAi and wild-type (CK) tomato strains. ZT1-ZT3 represent T1-generation tomato lines harboring gene-silencing vectors, respectively. Black arrows indicate nematode morphology, red areas represent stained root-knot nematodes, and the remaining regions show tomato root tissue. The developmental stages of the nematodes at different time points are clearly observable.
3.5. Effects of Me-chs-1 Gene Silencing on the Pathogenicity of M. enterolobii
We compared root symptoms between RNAi tomato lines and the wild-type tomato line (CK) following inoculation with M. enterolobii (Figure 7). The RNAi lines had significantly fewer root galls and smaller gall diameters than CK did, indicating that silencing Me-chs-1 impairs nematode establishment and feeding site development.
In addition, we quantified several pathological parameters—root galling percentage, root galling index, gall number, egg mass number, eggs per mass, and total egg count—for CK and the three RNAi lines (ZT1, ZT2, and ZT3) (Table 1). CK showed a gall incidence of 46.02%, whereas ZT1, ZT2, and ZT3 had values of 35.13%, 34.77%, and 30.72%, representing reductions of approximately 23.7%, 24.5%, and 33.2%, respectively. This demonstrates that Me-chs-1 silencing lowers the root-knot nematode infection rate.
The average gall count in CK was 67± 7.41, compared with 32 ± 36 (ZT1), 19 ± 4.55 (ZT2), and 16 ± 7.26 (ZT3)—reductions of about 52.2%, 71.6%, and 76.1%, respectively—confirming a significant decrease in gall formation due to RNAi treatment.
Egg mass counts also dropped markedly: CK produced 17 ± 5.31 masses, while ZT1, ZT2, and ZT3 yielded 11 ± 4.19, 8 ± 4.99, and 3 ± 1.25, respectively,respectively, representing reductions of 35.3%, 52.9%, and 82.4% compared to the CK group. Correspondingly, eggs per mass decreased from 402 ± 18.98 in CK to 236 ± 36.5 (ZT1,), 209 ± 42.21 (ZT2), and 151 ± 36.55 (ZT3), respectively, with decreases of 41.3%, 48.0%, and 62.4%. . Total egg counts fell from 5,940 ± 146.97 in CK to 1,260 ± 146.97 (ZT1), 1,320 ± 224.5 (ZT2), and 1,027 ± 224.5 (ZT3), respectively, with decreases as high as 78.8%, 77.8%, and 82.7%. These results clearly indicate that Me-chs-1 silencing substantially reduces the reproductive capacity of M. enterolobii.
3.6. Differential Gene Expression and Functional Annotation
The pathological staining results indicated that chitin synthase gene silencing predominantly impairs the late-stage growth and development of M. enterolobii; accordingly, samples at 45 days post-inoculation (45 dpi) were selected for transcriptome sequencing. A transcriptome comparison between the RNAi tomato lines (CM) and the wild-type tomato lines (CK) at 45 days post-inoculation (45 dpi) with M. enterolobii identified 501 differentially expressed genes (DEGs) (Figure 8A), of which 230 were upregulated and 271 downregulated in CM relative to CK. Gene Ontology (GO) analysis was performed on the 501 DEGs, yielding annotations for 350 genes. These DEGs were classified into the three main GO categories: molecular function (MF), cellular component (CC), and biological process (BP) (Figure 8B). In the MF category, the most enriched terms were “structural constituent of cuticle,” “structural molecule activity,” and “L-glutamate transmembrane transporter activity,” with genes associated with cuticle structure markedly more abundant than those for other terms. Under CC, the largest clusters were “eRF1 methyltransferase complex,” “excitatory synapse,” and “acetylcholine-gated channel complex.” For BP, the DEGs were primarily associated with “membrane repolarization during action potential” and general “membrane repolarization.” KEGG pathway enrichment analysis revealed that 128 DEGs were significantly enriched (Figure 8C). The top enriched pathways included the Wnt signaling pathway, spliceosome, ferroptosis, and ABC transporters, with the Wnt signaling pathway exhibiting the highest number of associated DEGs.
4. Discussion
In 1996, Baulcombe first discovered that double-stranded siRNA could silence genetic material in nematodes [36]. In 1998, Fire and Mello further reported the RNAi phenomenon and revealed the molecular mechanism of double-stranded RNA (dsRNA)-mediated gene silencing [37]. These two studies laid the theoretical foundation for the application of RNAi technology. In 2002, Urwin and colleagues achieved in vitro RNAi silencing of target genes in infective larvae of Globodera pallida and Heterodera glycines for the first time by mediating oral uptake of dsRNA molecules with a neurostimulant [38], opening the door to the application of this technology in research and control of plant-parasitic nematodes. Studies on the model nematode C. elegans have shown that RNAi technology can protect crops by targeting essential nematode genes [39].. Based on this, researchers proposed two core strategies: targeting plant genes involved in the infection process or directly targeting essential nematode genes. The idea of accumulating hpRNA (hairpin RNA) containing key nematode gene sequences in host plants and delivering dsRNA to nematodes via feeding to inactivate their genes has made RNAi the preferred method in plant nematology research due to its high efficiency in inhibiting nematode growth, which has been confirmed effective in gene silencing of root-knot nematodes (Meloidogyne spp.) and cyst nematodes [40].Target genes for nematode gene silencing need to meet conditions such as parasitic survival necessity, functional specificity, and RNAi sensitivity, including cell wall degrading enzyme genes, molting and development regulatory genes, etc. Chitin synthase genes, as key genes in the chitin synthesis pathway, are selected as RNAi targets for controlling root-knot nematode diseases. This is because chitin is an important component of nematode eggshells, and chitin is absent in plants, so this strategy not only meets the criteria for gene silencing targets but also has the advantages of high efficiency and safety.
To validate the control potential of chitin synthase genes against nematodes, we used Host-Induced Gene Silencing (HIGS) technology to target the essential gene Me-chs-1 of Meloidogyne enterolobii. Results showed that after silencing Me-chs-1, the number of root knots, egg masses, eggs per egg mass, and total eggs in tomato lines were significantly reduced, consistent with findings in Meloidogyne incognita and Heterodera glycines: Vimalraj Mani et al. reduced root knots and egg masses by over 60% and altered female nematode morphology via silencing the chitin synthase gene of M. incognita [32]; Kong Lingan et al. observed an 83.3% reduction in cyst numbers and 37.5% reduction in eggs per cyst after silencing this gene in H. glycines [33]. Notably, this study further revealed that gene silencing decreased nematode invasion rate and caused late-stage developmental disorders: Acid fuchsin staining showed significantly fewer invading nematodes in RNAi-treated roots at 23 and 30 days post-inoculation, with smaller, developmentally delayed larvae and obvious malformations in the ZT3 line. This indicates that Me-chs-1 not only affects nematode reproduction but also regulates late developmental stages (e.g., molting or cuticle formation), supplementing earlier research with distinct findings.
To explore the mechanism of chitin synthase gene silencing, we performed transcriptome sequencing on the ZT3 line with the strongest silencing effect and wild-type nematodes, finding significant downregulation of four chitin synthase genes in M. enterolobii and identifying 501 differentially expressed genes (DEGs), of which 271 downregulated genes were significantly enriched in “chitin structural component”-related functions by GO analysis. Notably, KEGG annotation showed that DEGs were primarily enriched in the Wnt signaling pathway—a conserved cellular signaling network involved in nematode embryonic development, cell differentiation, and molting [41,42]. Although no study has directly confirmed the association between the Wnt pathway and chitin metabolism, combining our data, we propose the following hypotheses: 1) Metabolic flux cross-regulation: Chitin synthesis precursors (e.g., UDP-GlcNAc) are important donors for glycosylation modification, and changes in their metabolic flux may affect glycosylation of key Wnt pathway proteins (e.g., secretion of Wnt ligands or receptor assembly). Me-chs-1 silencing in this study reduced UDP-GlcNAc production, potentially inhibiting pathway activity by suppressing glycosylation of Wnt pathway proteins ; 2) Spatiotemporal coordinated developmental regulation: The Wnt pathway plays a key role in nematode embryonic division and molting stages [41], while chitin synthesis mainly occurs during eggshell formation and cuticle molting. Me-chs-1 silencing caused molting delay in J2 larvae (Figure 8), possibly associated with abnormal ecdysone response mediated by the Wnt pathway, forming a regulatory coupling in developmental timing.
Targeting the gene network of chitin synthase and the Wnt pathway has important biological significance: 1) Synergistic enhancement: Me-chs-1 silencing in the ZT3 line has resulted in an 82.73% reduction in total egg number (Table 3). Simultaneous inhibition of key Wnt pathway genes (such as β-catenin) can block the nematode’s compensatory response to chitin deficiency, exacerbating developmental arrest; 2) Circumventing drug resistance risks: Single targeting easily induces nematode compensation through the Wnt pathway (such as upregulation of epidermal repair genes), while the combination strategy can reduce the probability of adaptive mutations through “structure-signal dual blockade”; 3) Ecological safety: Plants and mammals lack the chitin synthesis pathway, and there are core differences between the nematode Wnt pathway and plant signaling mechanisms [42], resulting in minimal impact on non-target organisms.
Given the remarkable ability of M. enterolobii to overcome multiple resistance genes and the current scarcity of effective resistance resources, our experimental results demonstrate that chitin synthase gene silencing enhances tomato resistance to M. enterolobii infection. Considering the absence of chitin synthesis pathways in plants and mammals, chitin synthase genes present promising targets for resistance breeding. However, existing studies indicate the limited efficacy of chitin-synthase-targeting strategies in controlling M. incognita and H. glycines, suggesting the need for improved RNA interference efficiency or combinatorial multi-gene targeting approaches. Pesticides targeting the chitin biosynthetic pathway combine high efficacy with environmental friendliness [43]. Currently, commercial chitin-targeting agrochemicals—such as nikkomycins directed against fungal pathogens [44] and benzoylurea derivatives used as insecticides [45]—have not yet been developed for nematode control. This study provides a theoretical foundation for the development of novel, eco-friendly nematicides.
5. Conclusions
M. enterolobii possesses four candidate chitin synthase genes CAD2169478.1, CAD2180532.1, CAK5089395.1, and CAK5088075.1, exhibiting an overall sequence homology of 97.69%. The coding sequence (CDS) of the Me-chs-1 gene spans 3,788 base pairs, encoding a protein of 1,261 amino acids. This protein shows the highest homology to the chitin synthase protein of M. incognita. Furthermore, the proteins encoded by all four chitin synthase genes display high homology with the chs-1 protein of C. elegans.
Silencing the chitin synthase gene in M. enterolobii effectively reduces its invasion, suppresses its growth and development, and inhibits its reproduction; thereby, tomato resistance to root-knot nematodes was enhanced. Transcriptomic analysis of differentially expressed genes indicates a potential indirect regulatory relationship between the Wnt signaling pathway and chitin metabolism.
Funding
This work was supported by national natural science foundation of China project (32160618).
Appendix 1. Full-Length Coding Sequence (CDS) of the Me-chs-1 Gene and Three Target Sequences for Silencing Vectors
ATGCTTTTTTACCGCGATCACCACCAGTGGGATGCATTTAGGACTCACCCTCGAATTAAACGTACACCGCAAAAATCTCACGCTTATTACATTCGTTGGTTACAATGGTTAAAGTTGATCATTTTTGTAATTTCCCATTGTTCTTCACTTGTGGCTGTGCTCGTTTCCAAATCTGTAATTATCCTTCTCTCAACTAACATTGGACTTAACTATATTATGGCTGACACAAAATTCTATGGACATTGCAAAAGCCCCTCAACTGACCAAGATTTTGACCGATTGAGTTCAATTTGTGCCGCTCTATGGCTTATTCAAACGATTCCAGATGTCTGCGCCTTTGTACAGGATTTATTCAAAATTAGACTTACAACAAAAGCTGATCGTTCATTAATAGGAATGTTTATTCTTCTCGAATCTTTTCGAGCTACCGGACTTTCACTCGCCGTTTTGAATATATTTCCTTTATTGGACGTTTCACGTTGTATAATGTTCACCTGTGCCTTTCACTGTTTCTACTACATCAAAAATGCCCTCCAAAATTTTCACCGTTCTTTTGACTTGAACCGTTCAATCCGCTGGCGTTTTGCTTGCATTACCGCAAGTCTACCATCAGCTTTTCTTTTTGCCTTTCTATTTAGTGCTGGCTATTTATGGGCACTTTTTGATGGTCATCCAAAGTTTAAATTTGGTGTGTTACTTACCATTTCTTTTACTCTATGTTCTCTTGGTTTTTGGGAGAGTTGGGTTGACACTAAACAAAAGGAGGGTCTTTTTCAAGAACTTTATGAGATTAAATATGGCATGAGAAAACTTAATCCAGAAACAAGAATGGTTGCTTCATTCCTTCGTTTTTTGTGCACGTCTTCAGTTCTTTATTTTTCATTAAGGCATCATAATATTCCTGTTGGAACCTTAATTTTAATGCTATTCAAAAGCAAAGAAGGAGTATTTGGAGATCAAGCAAAGATTTTCATATTTGCTTTTATTTCATTGGCACTCAATTTCTACCTTCGTATTTGCTTTCGTTTTTTGGCTGCAATGCGTCTAAATTTGTTTACTTGTATCCATCCAGTGTTTTTATCAACTCCATTACTTTTAATGAGTTTTCACGGATTATGTCATGTACTTCCAATTTGTCGGATCAACGTTATCTTAAAATATTTTGATCTTAATTTGTTTTGTATCAAAGGTGTTAATCCTACTGGATCTGTAAAGGATTACTATATAACGTGGATTTGGTTATTTTCTTATATTATTTGGAGTTTAAAATTTACAAATGGGAAGAAATATGACAAAACTGATGAAATAATTGAGTCGATGACACCAATGATGAGTGGATTGGATATTTGCCAGTCACTTGTTGTTTTTCGTTATTCAATTGCAAAGAAGGATGTTGACTACGACTCTGATGAAGATGTTGAGCCTGAGGAAAGCCCTCTTCGAATTATAAATGGTCATATGGACAGAATTATTACTTTATATGTTTGTGCAACAATGTGGCATGAAACAAAAAATGAAATGACGCAGATGCTTCGATCTATTCTAAAACTTGATGTTGAACAGTCTGTCCGACAAAGCGAGGATGGAATCAAATTTCGATTAGAAATTCATATTTTCTTTGACGATGCTTGGGTTGATGACAGAGAATGTGGAAGAGTACCCAATGATTACTTCAAATTATTGTTTGATGTTTTAATTG(ZT1 target sequence) AGTTGACTAGATCAGAAAATGCTGAAACAGACTTGTTTACACGTGTTCTTGTCAATACTCCTTATGGTGGACGTATTGTTATGGCATTGAGTGGAGGCGCTCTTCTCTTTGTTCATCTTAAAGATAAGCGTTTAATTCGACATAAAAAGCGGTGGTCACAGGTTATGTATATGTACTATTTGCTTGGACACCGAATTGTTGATTCTCATCTTAGCGTTGAAGATCGTCAATTACAAGCTGACAATACTTACA (ZT2 target sequence) TTCTAGCAATTGATGGTGATTCAAAGTTTGAACCTTGTGCTGTTCTTCGTTTGATTAACCTTATGAATCTAAAAAGTGATGTTGGTTGTGCCTGTGGACGTAATCATCCTATTGGAACTGGCGTAATGGTTTGGTATCAAAAGTTTGAATATGCAATTGCTCATTGGTTTCAAAAAGCAGCTGAACACGTCTTTGGATGTGTTTTATGCGCGCCAGGTTGTTTCTCACTTTTTAGAGCATCAGCATTAATGGACGACAATATTATGAATAAATACACAAAAACTGCTTCTGAACCAAGACATTTTGTCCAATATGACCAAGGTGAAGATCGATGGCTTTCAACATTAATGCTTAAACAGGGTTATCGAATTGAATACGCTGCTACTTCTGATGCAGAAACTTATGCACCTGAAGGTTTTGATGAATTCTTTAATCAAAGGCGAAGGTGGACGCCATCT (ZT3 target sequence) TCAATTGCTAATACTTTGGACTTGTTGGCGGATTATAAGTTAGCTTCAAAAAACAATGCAAGCATTTCAAGGCTTTATATTATATATCAAATGATTGTTATTGCATTTTCATTGCTTGGTCCTGCTATAATATTTACAATGCTTGTTTATGCTCAGGTTGCCGCTTTTGCTGTCGATTCAACGCGTGTTCTTGTTTACAATGCTATTCCAGTATGTGCATTTATTTGTTGTTGTTTTGCTTTGGATTCAAGCATTCAATTGATATTTGCTAAAATTGCTTCTGTCGTTTATGCTTTCATAATGTTGGCTGTTCTCATCGCTACCACCAATCAAATTGTACTAGAAACAGTATTTTCACCAACATCAATGTTTGTCCTTGGAATGGTTATTATTTTCTCATTTGCTTCATGCATTCATCCAAAAGAATTTTCAAATATTATATTTGGAGCAATTTTCTTTTTGATGATTCCTTCAACTTATGTTTTTCTTTCTCTTTATTCTTTAATCAATTTAAATGTGATCAATTGGGGTACAAGAGAAGCTGTTGCCAAAGCTACTGGACAAACAACTTATAAAGAAAATATTGCAGAAAGAGTTCTGAGAAGAGTTGCAAATTTAAACGATGAAAATTCTTTCCTTACAAGATTACTTATTCGATATCGCGGTTCAGAAGAATCAAGCGCTAGGATACGAACTTTGGAAAGGAAAATTGAACGAACTGAACGTTTATTGCTTACAATAAAGGACTCAAATACATCAGTGGAATGTACACCAGACAATAGAAGGTTTGGACGTCCGATGGATATGGTTGATGTAGTACTCAGAGAGGTAAATGAGCCAGAATTGCCCATAAGGAGTGGTTATGAGGCTGTTGCCGTTCAACGGTTACAAACTTTGCAGCGACATTCTGTTATTTCCGATCCTTGCAAACGTTCCCTTTGGATGGATTGTGAATATCTTCAATGTTGCGATCGAGGGAAGTTGCGTGCTGGTGAGGAAACATTTTGGGACGAACTTATTGACAGATATTTAAAGCCGATAGCATCAACCGCCCAAGATCAAGCTCAAATTGCTGCTGGTTTAGTTTCTTTGAGGAACAGAATTGCCTTCTCGATCATTTTGATGAATGGTTTGCTTGTCTTGGCTGTCTTTTTGCTTCAACGTCATAAAGATGTTTTATCTGTAAAATTCATACTATACGAGGGCTTCAAATGGACAAAAATGAATGAAACAACAGGAAAATTTGAAGATACTACCGAAGCGCTAAAAGTTGATCCGCTTGGAATTGGAATAATTTTCTTTTTGATGGGAATTCTTATAGTACAAACAATTGGGATGTTGATTCATCGCCTTAATACGTTAGTGGAAGCATTGCATGA
Appendix 2. Primers for Vector Construction
| vector | Primers | Primer Sequence (5′-3′) |
| ZT1 | tatF+ | CAACTGGCATGAAACAAAAAATGAAATGACGC |
| tatF- | CAGGCAATTAAAACATCAAACAATAATTTGAAGTAATCATTGGGT | |
| tatR+ | GGGCCAATTAAAACATCAAACAATAATTTGAAGTAATCATTGGGT | |
| tatR- | CAACTGGCATGAAACAAAAAATGAAATGACGC | |
| ZT2 | tatF+ | CAACACACGTGTTCTTGTCAATACTCCTTA |
| tatF- | CAGGTGTAAGTATTGTCAGCTTGTAATTGACGATC | |
| tatR+ | GGGCTGTAAGTATTGTCAGCTTGTAATTGACGATC | |
| tatR- | TACAACACGTGTTCTTGTCAATACTCCTTA | |
| ZT3 | tatF+ | CAACACAATATTATGAATAAATACACAAAAACTGCTTC |
| tatF- | GGGCAGATGGCGTCCACCTTCG | |
| tatR+ | GGGCAGATGGCGTCCACCTTCG | |
| tatR- | TACAACAATATTATGAATAAATACACAAAAACTGCTTC | |
| LOOP | loop+ | CCTGCAGGTCTAGTTTTTCTC |
| loop- | GCCCGGGCTCTGTAACTAT |
References
- KARSSEN G. The plant parasitic nematode genus Meloidogyne Göldi, 1892 (Tylenchida) in Europe [M]. Brill, 2002.
- GOVERSE A, SMANT G. The activation and suppression of plant innate immunity by parasitic nematodes. Annual review of phytopathology, 2014, 52(1): 243-65. [CrossRef]
- JUNHAI N, YANGDONG G, HENG J. Progress in the Study of RNAi Mediated Plant Root-knot Nematodes Resistant Genetic Engineering. Genomics and Applied Biology, 2009, 28(1): 167-73.
- RUGANG C. Cloning and Identification of Root-Knot Nematode Resistance Genes in Tomato and Peppe [D]; Huazhong Agricultural University, 2006.
- XINDI W, YANQIU C, LEI C, et al. Research on the Control of Muskmelon Root-knot Nematodes by Returning Garlic Straw to the Field. China Fruit & Vegetable2024, 44(11): 67-70+82.
- DAOFENG D, LIFANG H, XIUHUI W. Rotation of resistant tomato and susceptible cucumber for control of root_knot nematode disease in greenhouses. Plant Protection, 2007, 33(1): 51-3.
- HANDOO Z, SKANTAR A, CARTA L, et al. Morphological and molecular characterization of a new root-knot nematode, Meloidogyne thailandica n. sp.(Nematoda: Meloidogynidae), parasitizing ginger (Zingiber sp.). Journal of Nematology, 2005, 37(3): 343.
- QING W, SONG L, FENGCHENG S, et al. A Preliminary Study on Reduced Resistibility of Tobacco Plants to Black Shank Fungus Caused by Root Knot Nematodes. Acta Agriculturae Boreali-Sinica, 1988, 3(2): 76-80. [CrossRef]
- LIANGHONG. C. Distribution and Identification of Root-Knot Nematodes in China. Modern Agricultural Science and Technology, 2024, (06): 58-61.
- CHANG L. Biological ControI of Vegetable Root—Knot Nematode . Anhui Agri.sci., 2009, 15(17): 137-9.
- HU YUJIN, FENG MIN, GUO WENXIU, et al. Overview of Integrated Control Techniques of Root-Knot Nematode Disease. Shandong Academy of Agricultural Sciences, 2019, 51(4): 149-56.
- JONES J T, HAEGEMAN A, DANCHIN E G, et al. Top 10 plant-parasitic nematodes in molecular plant pathology. Molecular plant pathology, 2013, 14(9): 946-61. [CrossRef]
- YANG B, EISENBACK J. Meloidogyne enterolobii n. sp.(Meloidogynidae), a root-knot nematode parasitizing pacara earpod tree in China. Journal of Nematology, 1983, 15(3): 381.
- WANG Y, WANG X Q, XIE Y, et al. First Report of Meloidogyne enterolobii on Hot Pepper in China. Plant Disease, 2015, 99(4): 557-. [CrossRef]
- SONG P, PENG D-L, LI Y-M, et al. Potential global distribution of the guava root-knot nematode Meloidogyne enterolobii under different climate change scenarios using MaxEnt ecological niche modeling. Journal of Integrative Agriculture, 2023, 22(7): 2138-50. [CrossRef]
- CHEN HUI, WANG HUIFANG, MIANCAI C. Research Progress of Meloidogyne enterolobii. GuiZhou Agricultural Science, 2016, 44(05): 51-5.
- BRITO J, STANLEY J, KAUR R, et al. Effects of the Mi-1, N and Tabasco genes on infection and reproduction of Meloidogyne mayaguensis on tomato and pepper genotypes. Journal of Nematology, 2007, 39(4): 327.
- KIEWNICK S, DESSIMOZ M, FRANCK L. Effects of the Mi-1 and the N root-knot nematode-resistance gene on infection and reproduction of Meloidogyne enterolobii on tomato and pepper cultivars. Journal of nematology, 2009, 41(2): 134.
- YE W, KOENNING S, ZHUO K, et al. First report of Meloidogyne enterolobii on cotton and soybean in North Carolina, United States. Plant Disease, 2013, 97(9): 1262-. [CrossRef]
- BERTHOU F, KOUASSI A, BOSSIS M, et al. Enhancing the resistance of the potato to southern root-knot nematodes by using Solanum sparsipilum germplasm. Euphytica, 2003, 132: 57-65. [CrossRef]
- ZHANG HUAIJUN, ZHAO ZHIXIANG, MIANCAI C. The effects of Meloidogyne enterolobii on the growth of seven tomato varieties. Hainan Academy of Agricultural Sciences, 2015, 36(4): 87-90.
- XUE-LIANG X, LIN-JUAN F, CAI-YUN W, et al. Main action mechanism of biocontrol microorganisms on plant pathogenic nematodes:A review. Journal of Southern Agriculture, 2023, 54(10): 2969-77.
- MITCHUM M G, HUSSEY R S, BAUM T J, et al. Nematode effector proteins: an emerging paradigm of parasitism. New Phytologist, 2013, 199(4): 879-94. [CrossRef]
- HEWEZI T, BAUM T J. Manipulation of plant cells by cyst and root-knot nematode effectors. Molecular plant-microbe Interactions, 2013, 26(1): 9-16.
- ZHANG Y, FOSTER J M, NELSON L S, et al. The chitin synthase genes chs-1 and chs-2 are essential for C. elegans development and responsible for chitin deposition in the eggshell and pharynx, respectively. Developmental biology, 2005, 285(2): 330-9. [CrossRef]
- MERZENDORFER H. Insect chitin synthases: a review . Journal of Comparative Physiology B, 2006, 176(1): 1-15.
- BIRD A F, MCCLURE M. The tylenchid (Nematoda) egg shell: structure, composition and permeability. Parasitology, 1976, 72(1): 19-28.
- BRYDON L, GOODAY G, CHAPPELL L, et al. Chitin in egg shells of Onchocerca gibsoni and Onchocerca volvulus. Molecular and biochemical parasitology, 1987, 25(3): 267-72. [CrossRef]
- MANSFIELD L, GAMBLE H, FETTERER R. Characterization of the eggshell of Haemonchus contortus--I. Structural components. Comparative Biochemistry and Physiology B, Comparative Biochemistry, 1992, 103(3): 681-6.
- EL HADRAMI A, ADAM L R, EL HADRAMI I, et al. Chitosan in plant protection. Marine drugs, 2010, 8(4): 968-87. [CrossRef]
- TANG B, WEI P, ZHAO L, et al. Knockdown of five trehalase genes using RNA interference regulates the gene expression of the chitin biosynthesis pathway in Tribolium castaneum. BMC biotechnology, 2016, 16(1): 1-14. [CrossRef]
- MANI V, REDDY C S, LEE S-K, et al. Chitin biosynthesis inhibition of Meloidogyne incognita by RNAi-mediated gene silencing increases resistance to transgenic tobacco plants. International Journal of Molecular Sciences, 2020, 21(18): 6626. [CrossRef]
- KONG L, SHI X, CHEN D, et al. Host-induced silencing of a nematode chitin synthase gene enhances resistance of soybeans to both pathogenic Heterodera glycines and Fusarium oxysporum. Plant Biotechnology Journal, 2022, 20(5): 809. [CrossRef]
- XIRUI1 Y, ZEWEN G, YING D, et al. Preliminary functional analysis of T106 gene specifically induced by Meloidogyne enterolobii in root-knot in tomato plants. ACTA PHYTOPATHOLOGICA SINICA, 2024, 54(05): 950-60.
- BYBD JR, DW KIRKPATRICK, T BARKER, et al. An improved technique for clearing and staining plant tissues for detection of nematodes. Journal of nematology, 1983, 15(1): 142.
- BAULCOMBE D C. RNA as a target and an initiator of post-transcriptional gene silencing in trangenic plants . Post-transcriptional control of gene expression in plants, 1996: 79-88. [CrossRef]
- FIRE A, XU S, MONTGOMERY M K, et al. Potent and specific genetic interference by double-stranded RNA in Caenorhabditis elegans. nature, 1998, 391(6669): 806-11. [CrossRef]
- DUTTA T K, BANAKAR P, RAO U. The status of RNAi-based transgenic research in plant nematology. Frontiers in Microbiology, 2015, 5: 760. [CrossRef]
- BHARATHI J K, ANANDAN R, BENJAMIN L K, et al. Recent trends and advances of RNA interference (RNAi) to improve agricultural crops and enhance their resilience to biotic and abiotic stresses. Plant Physiology and Biochemistry, 2023, 194: 600-18. [CrossRef]
- MANN S K, KASHYAP P L, SANGHERA G S, et al. RNA interference: an eco-friendly tool for plant disease management. Transgenic Plant J, 2008, 2(2): 110-26.
- LIE D-C, COLAMARINO S A, SONG H-J, et al. Wnt signalling regulates adult hippocampal neurogenesis. Nature, 2005, 437(7063): 1370-5. [CrossRef]
- NUSSE R, VARMUS H E. Wnt genes. Cell, 1992, 69(7): 1073-87.
- CHEN W, CAO P, LIU Y, et al. Structural basis for directional chitin biosynthesis. Nature, 2022, 610(7931): 402-8. [CrossRef]
- LI YING, CUI ZINING, HU JUN, et al. Studies on Chitin Synthase Inhibitors. Progress in chemistry, 2007, (04): 535-43.
- MINFENG W. Mechanism of Action and Applications of Benzoylurea Insecticides . Forest By-Products of China, 2023, (06): 89-91.
Figure 1.
Full-length sequence and gene structure of chitin synthase gene. (A) Electropherogram of the full-length CDS sequence of chitin synthase gene. (B) Nucleotide structure diagram: white trapezoids represent untranslated regions (UTRs), black quadrilaterals indicate exon regions, and the regions between the black line segments correspond to intron regions. (C) Conserved domain structure diagram.
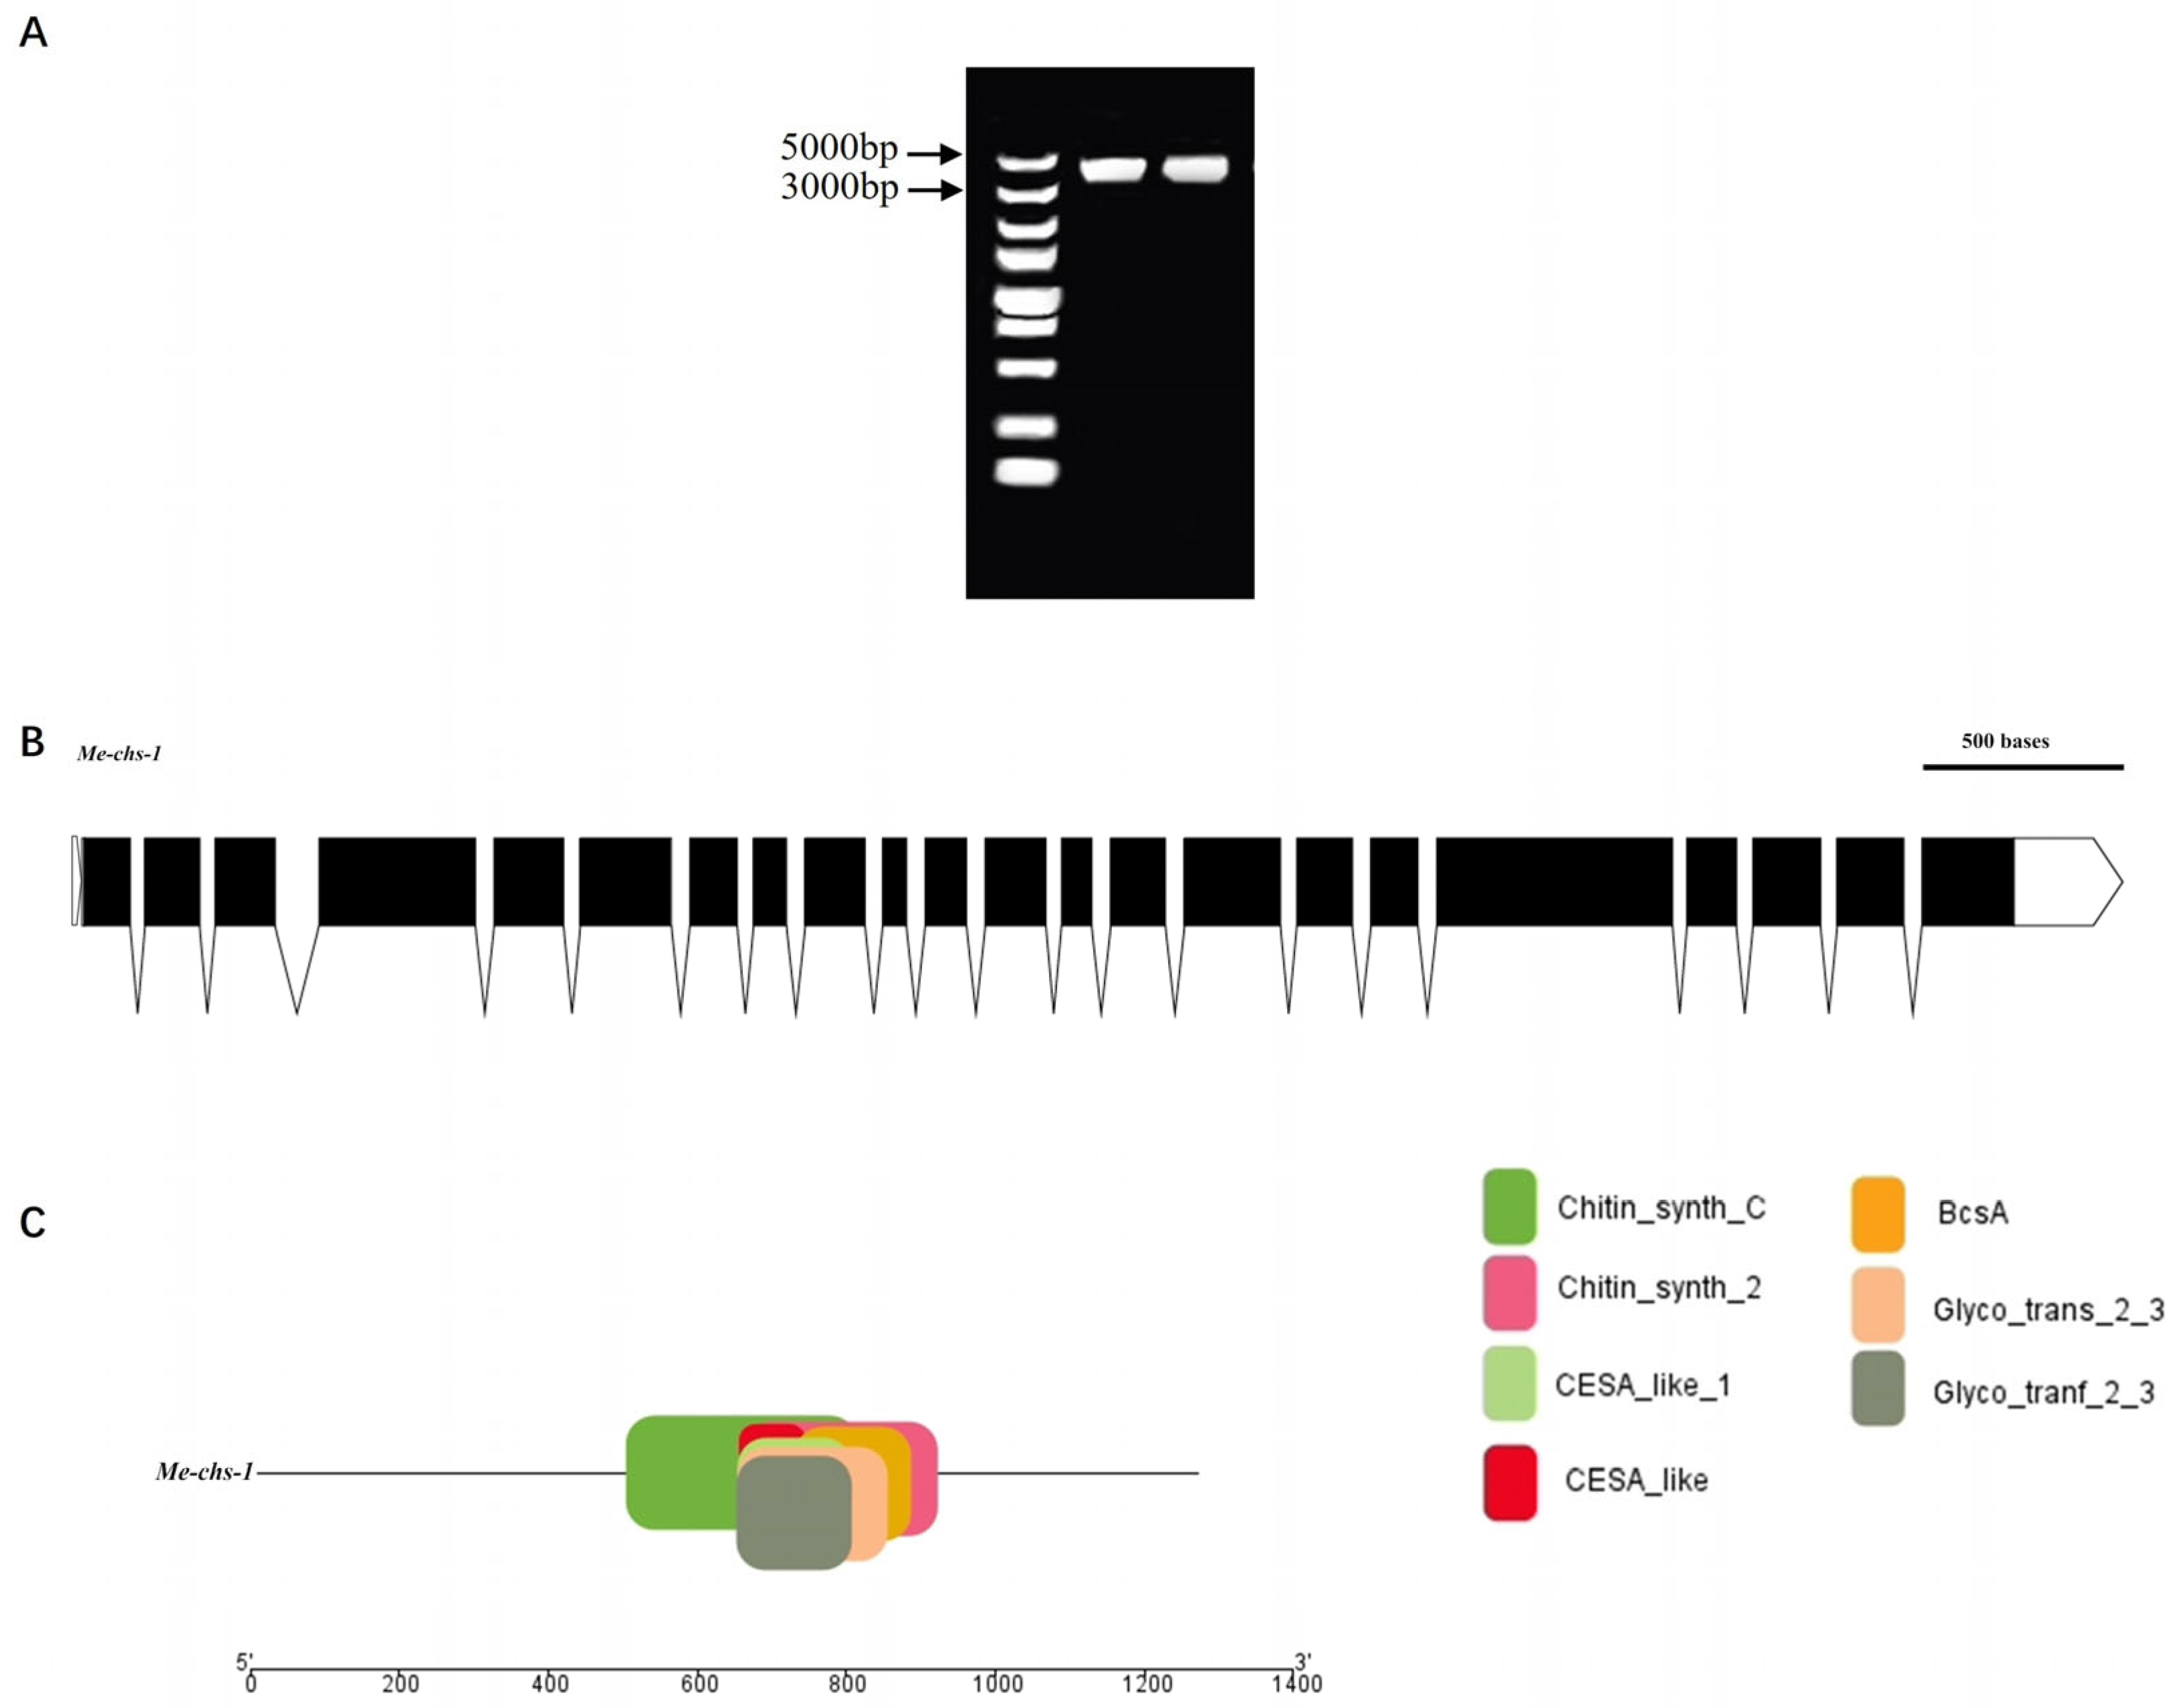
Figure 2.
Phylogenetic tree of Me-chs-1 and homologous proteins based on amino acid sequence.
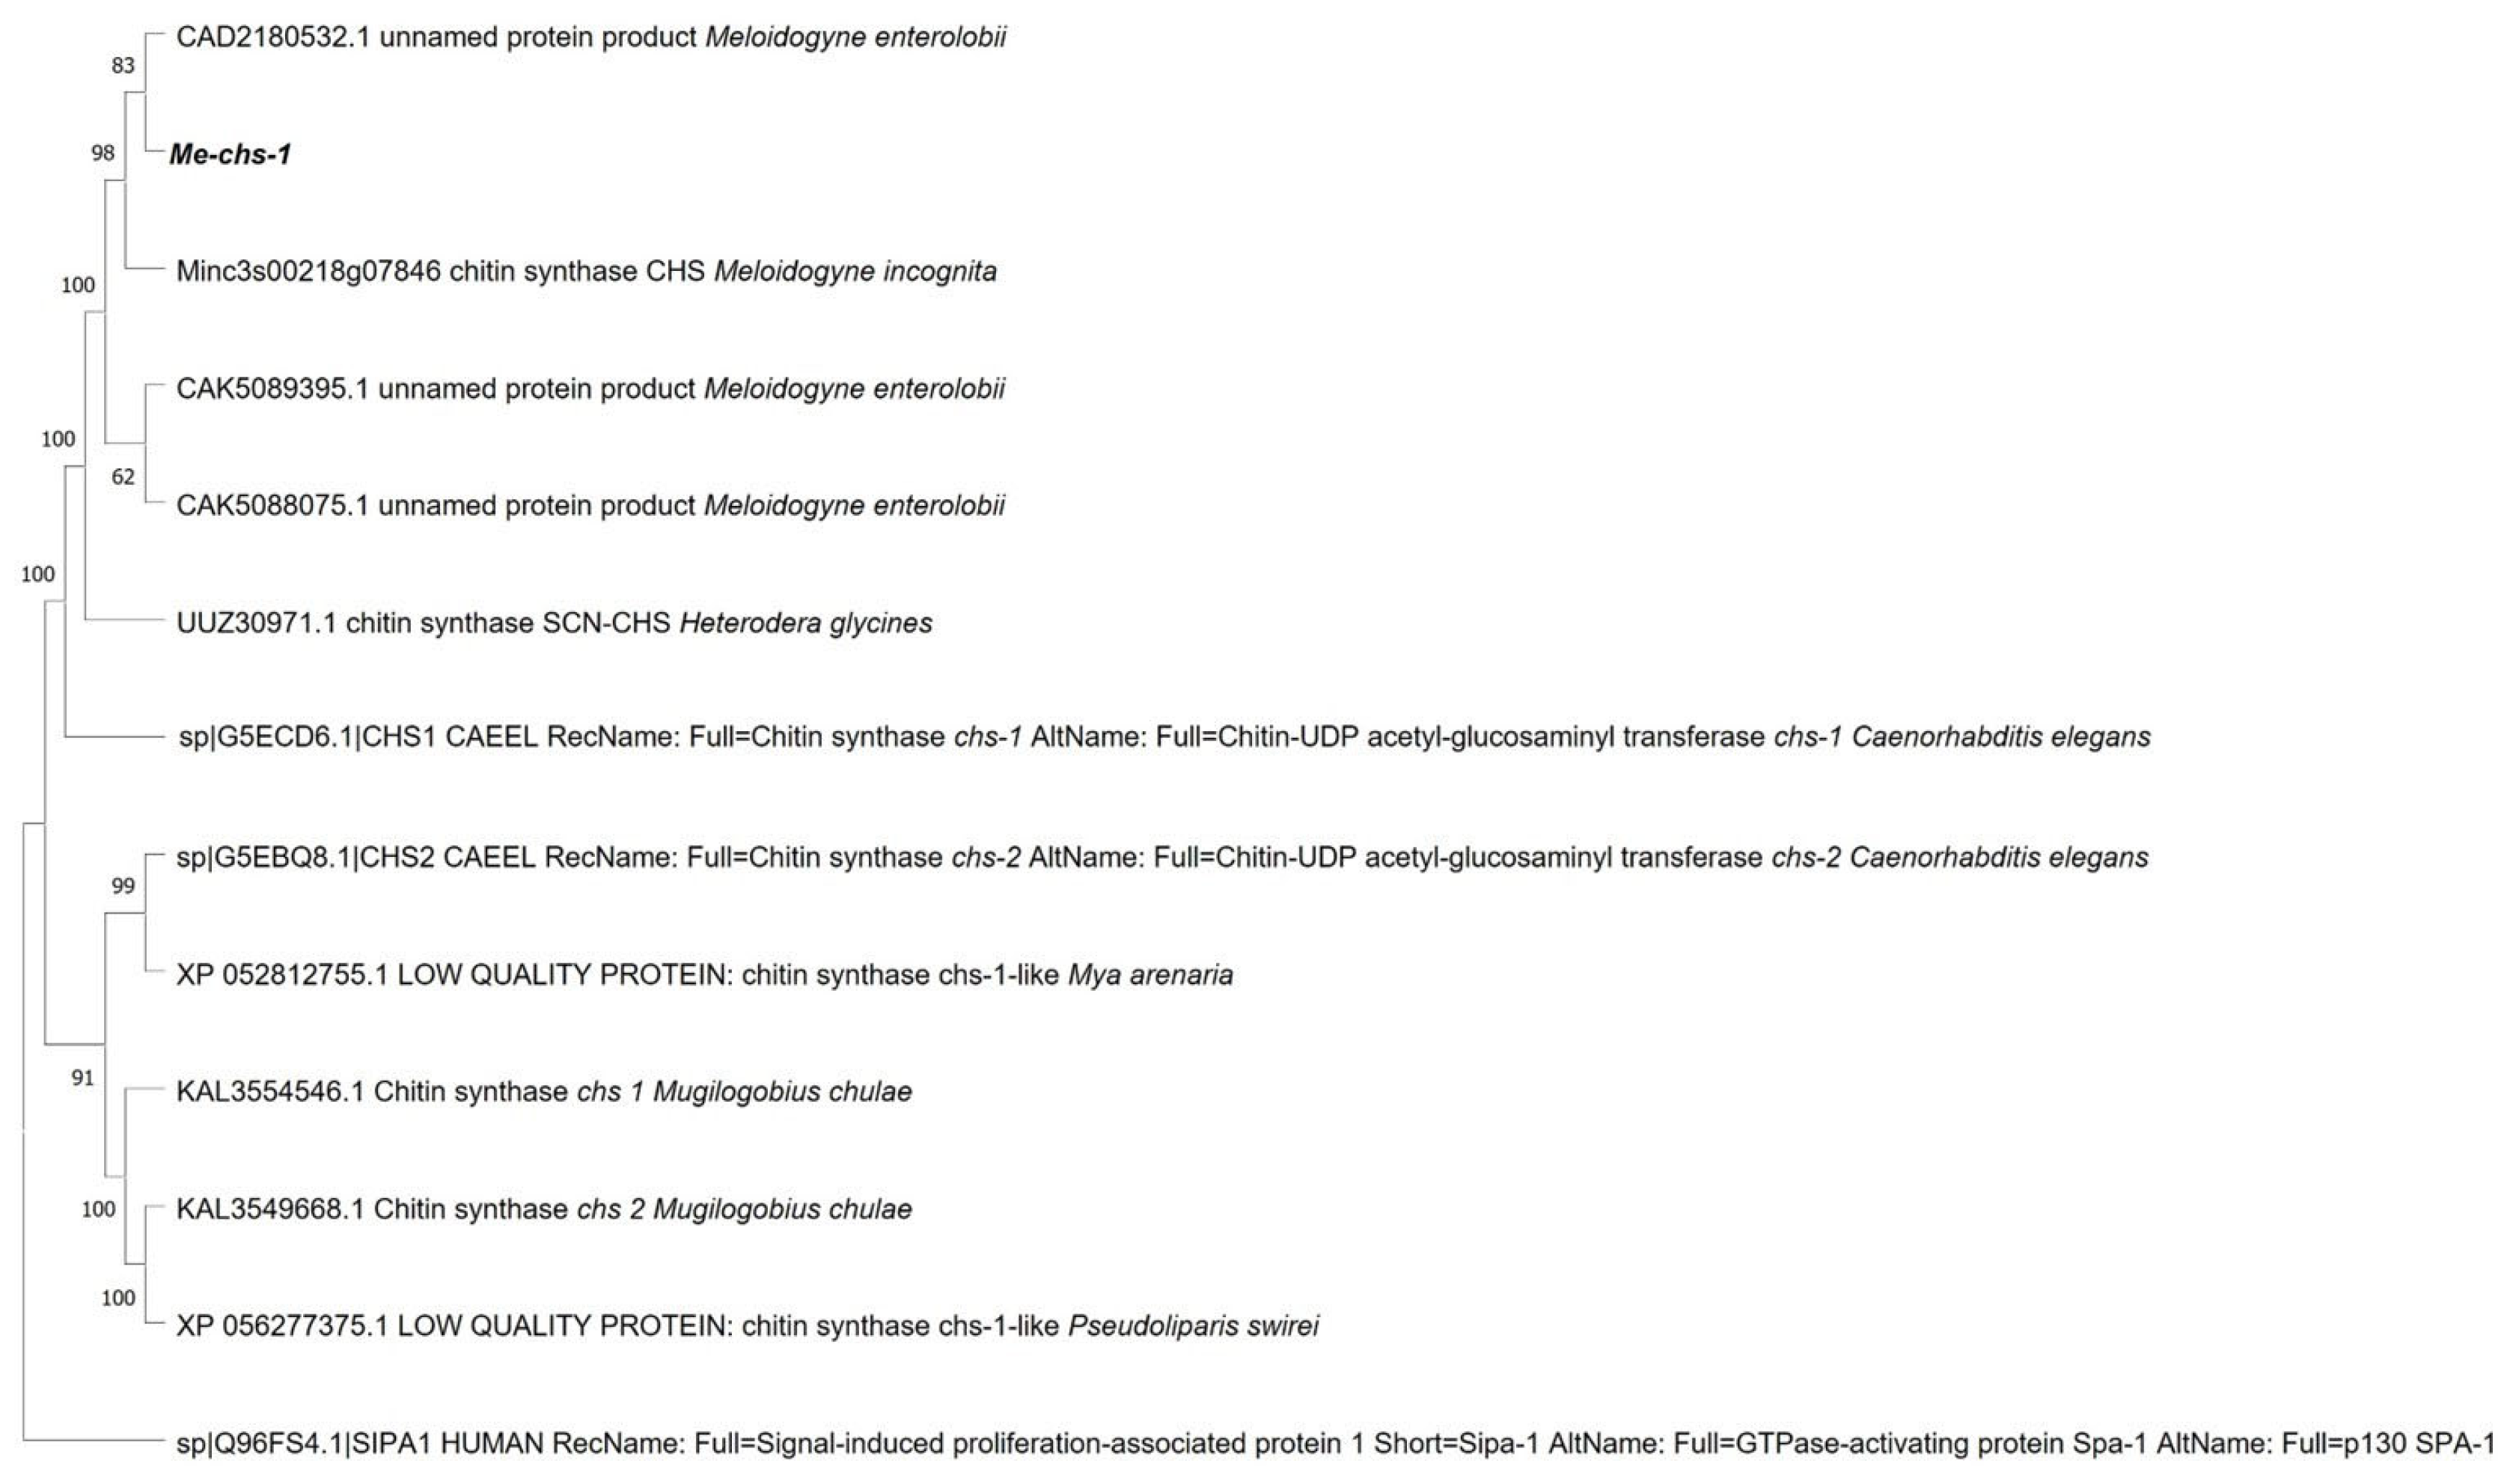
Figure 3.
Schematic diagram of the silencing vector structure and restriction enzyme digestion identification results. ( A)Schematic diagram of the RNAi silencing vector construct. (B–D)EcoRV restriction enzyme digestion verification of ZT1, ZT2, and ZT3. The constructed silencing vector contains four EcoRV restriction sites. Digestion with EcoRV generates four fragments: 5,324 bp, 2,691 bp, 1,134 bp, and 1,205–1,232 bp. Electrophoresis results should theoretically display 3–4 bands (the two fragments around 1,000 bp may not be resolved as distinct bands). The three bands observed in the ZT1, ZT2, and ZT3 lanes confirm successful vector construction.
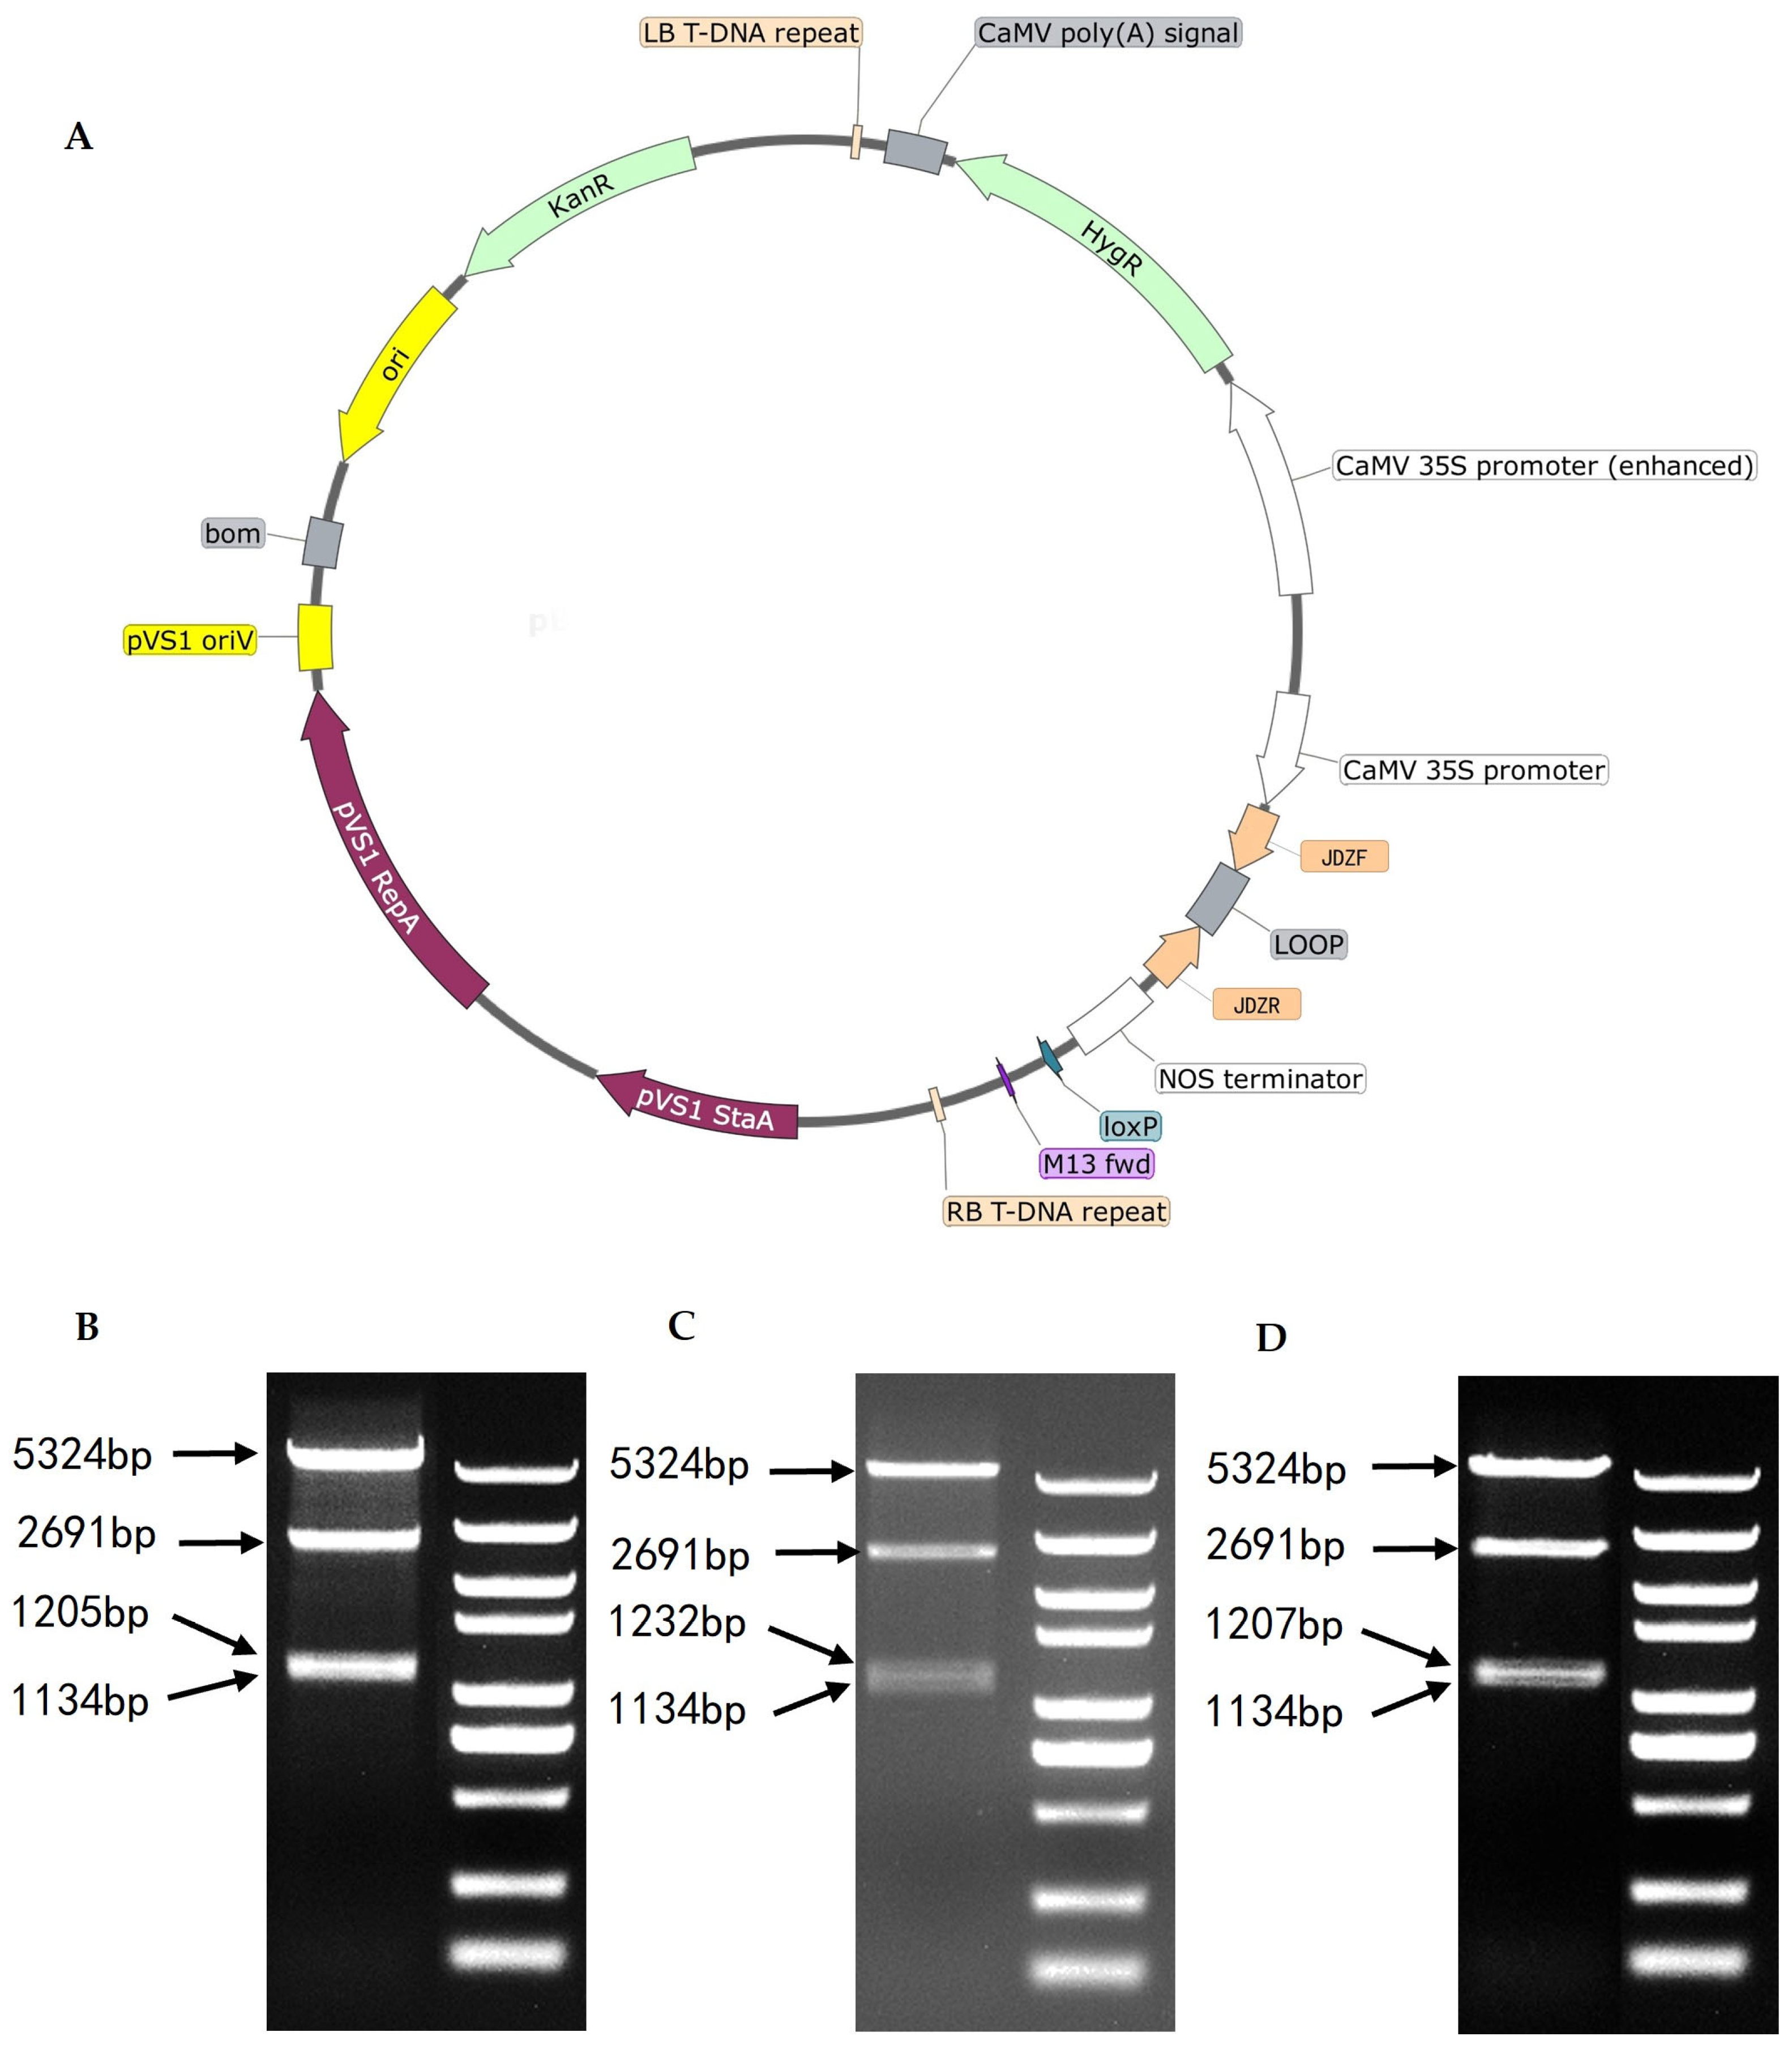
Figure 4.
The expression levels of chitin synthase genes after gene silencing CK represents the wild-type tomato; CM denotes the gene-silenced tomato; ZT1-ZT3 represent T1-generation tomato lines harboring gene-silencing vectors, respectively. AS shown by ANOVA, “ns” indicates non-significant differences, “*” denotes significant differences (P<0.05), and “***” represents extremely significant differences (P<0.0001).
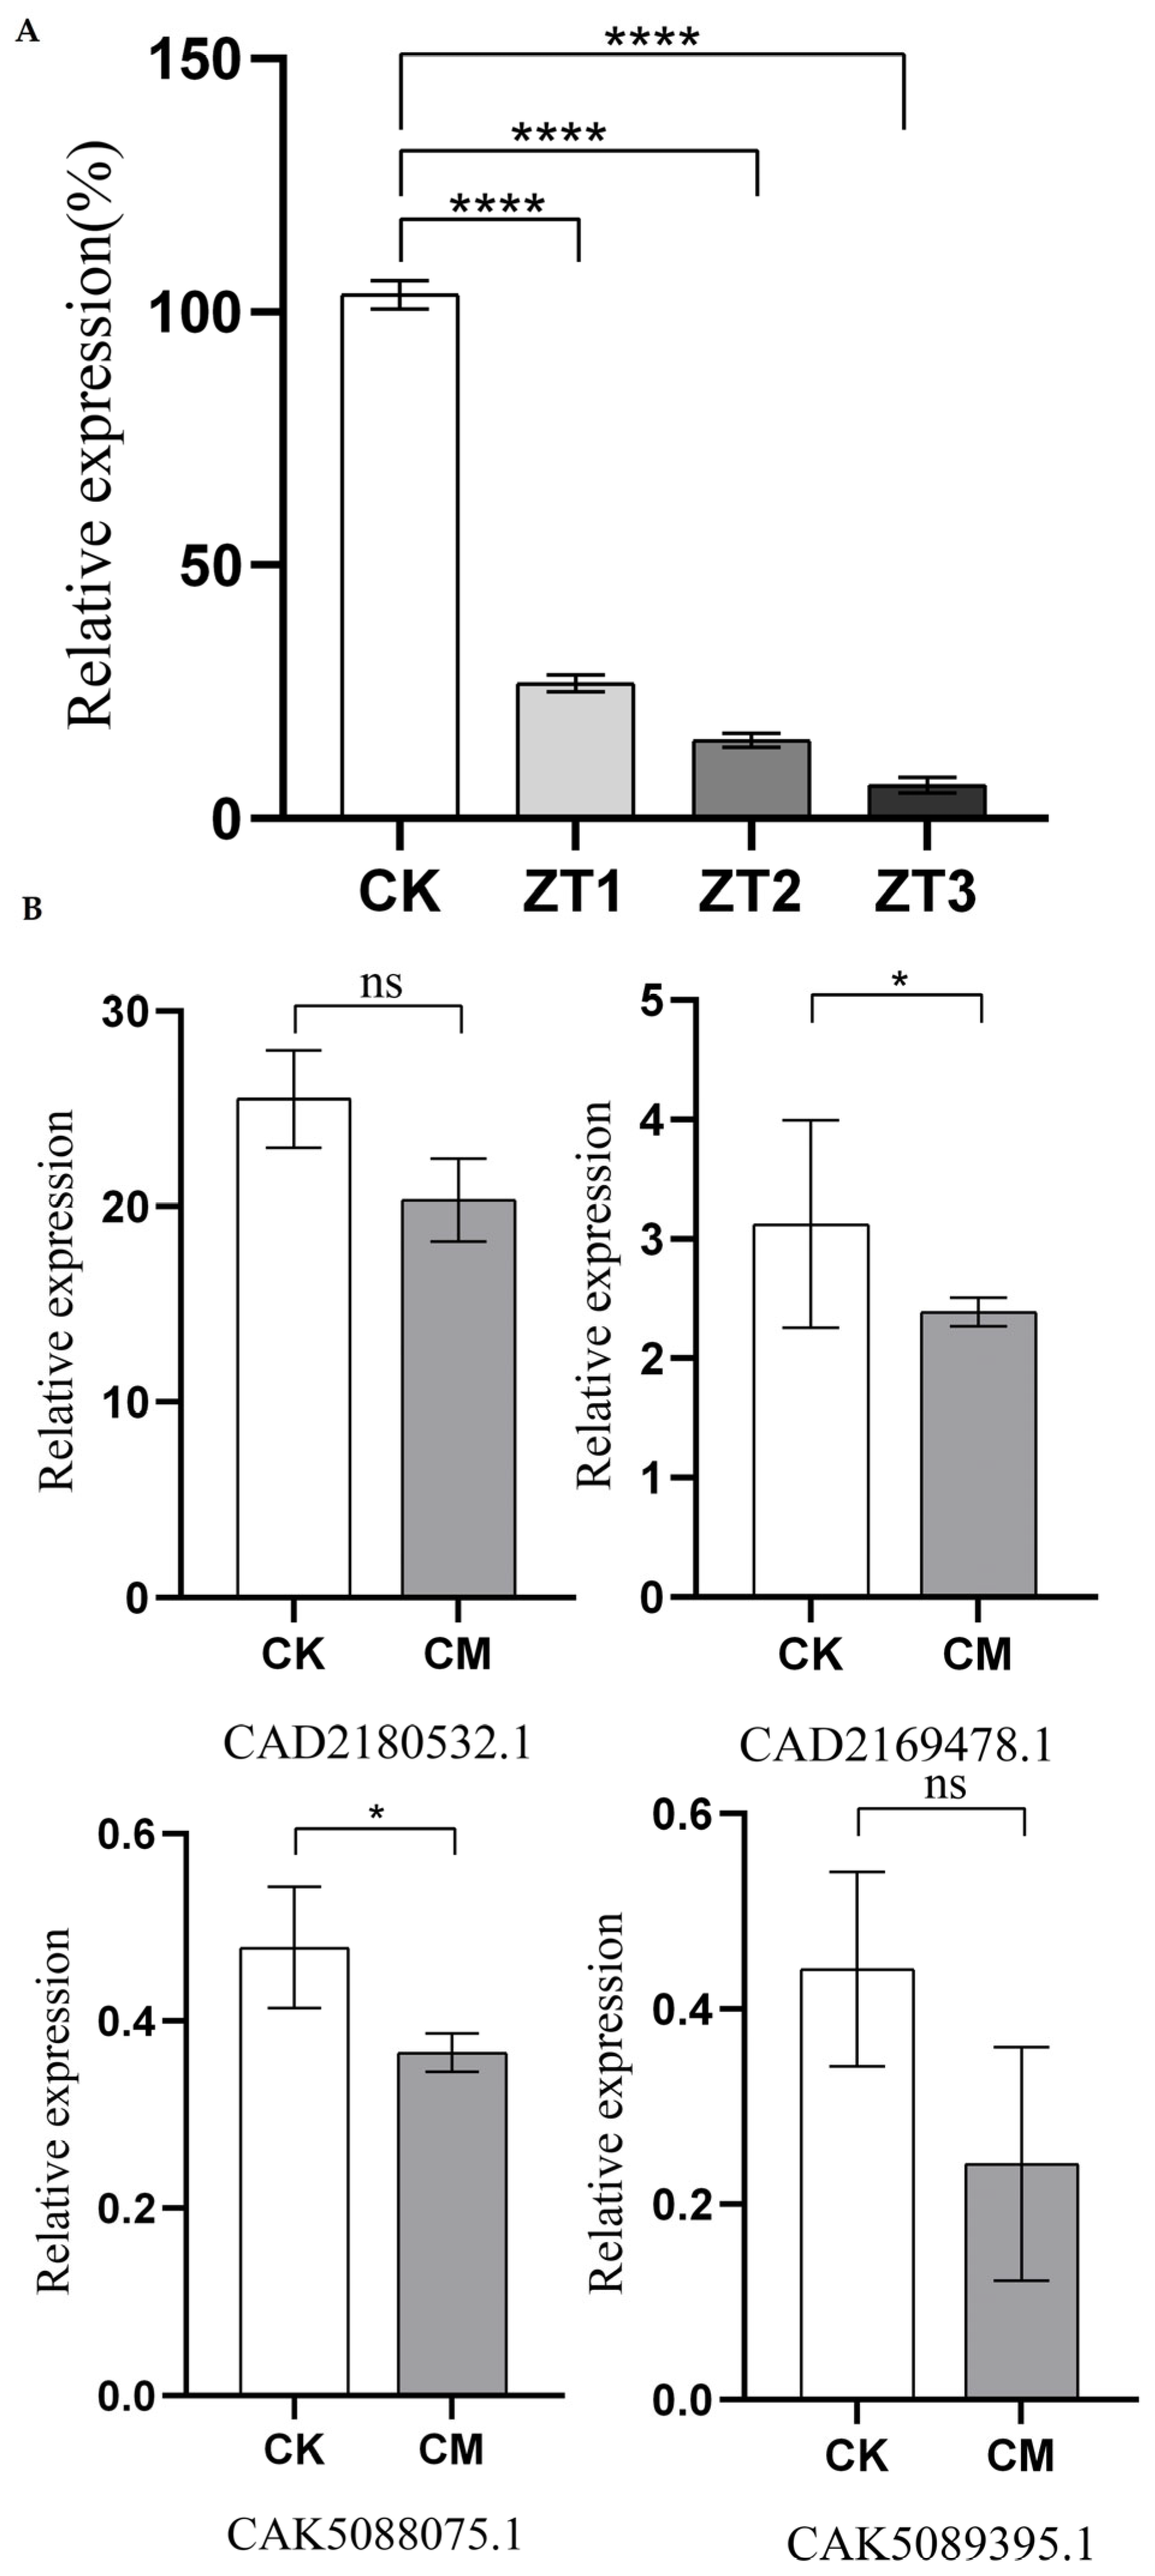
Figure 5.
Time-course accumulation of M. enterolobii infections in Me-chs-1 RNAi and wild-type (CK) tomato strains; ZT1-ZT3 represent T1-generation tomato lines harboring gene-silencing vectors, respectively. The horizontal lines in the figure indicate the significance analysis of CK with ZT1, ZT2 and ZT3 respectively. AS shown by ANOVA, “ns” indicates non-significant differences, “*” denotes significant differences (P<0.05).
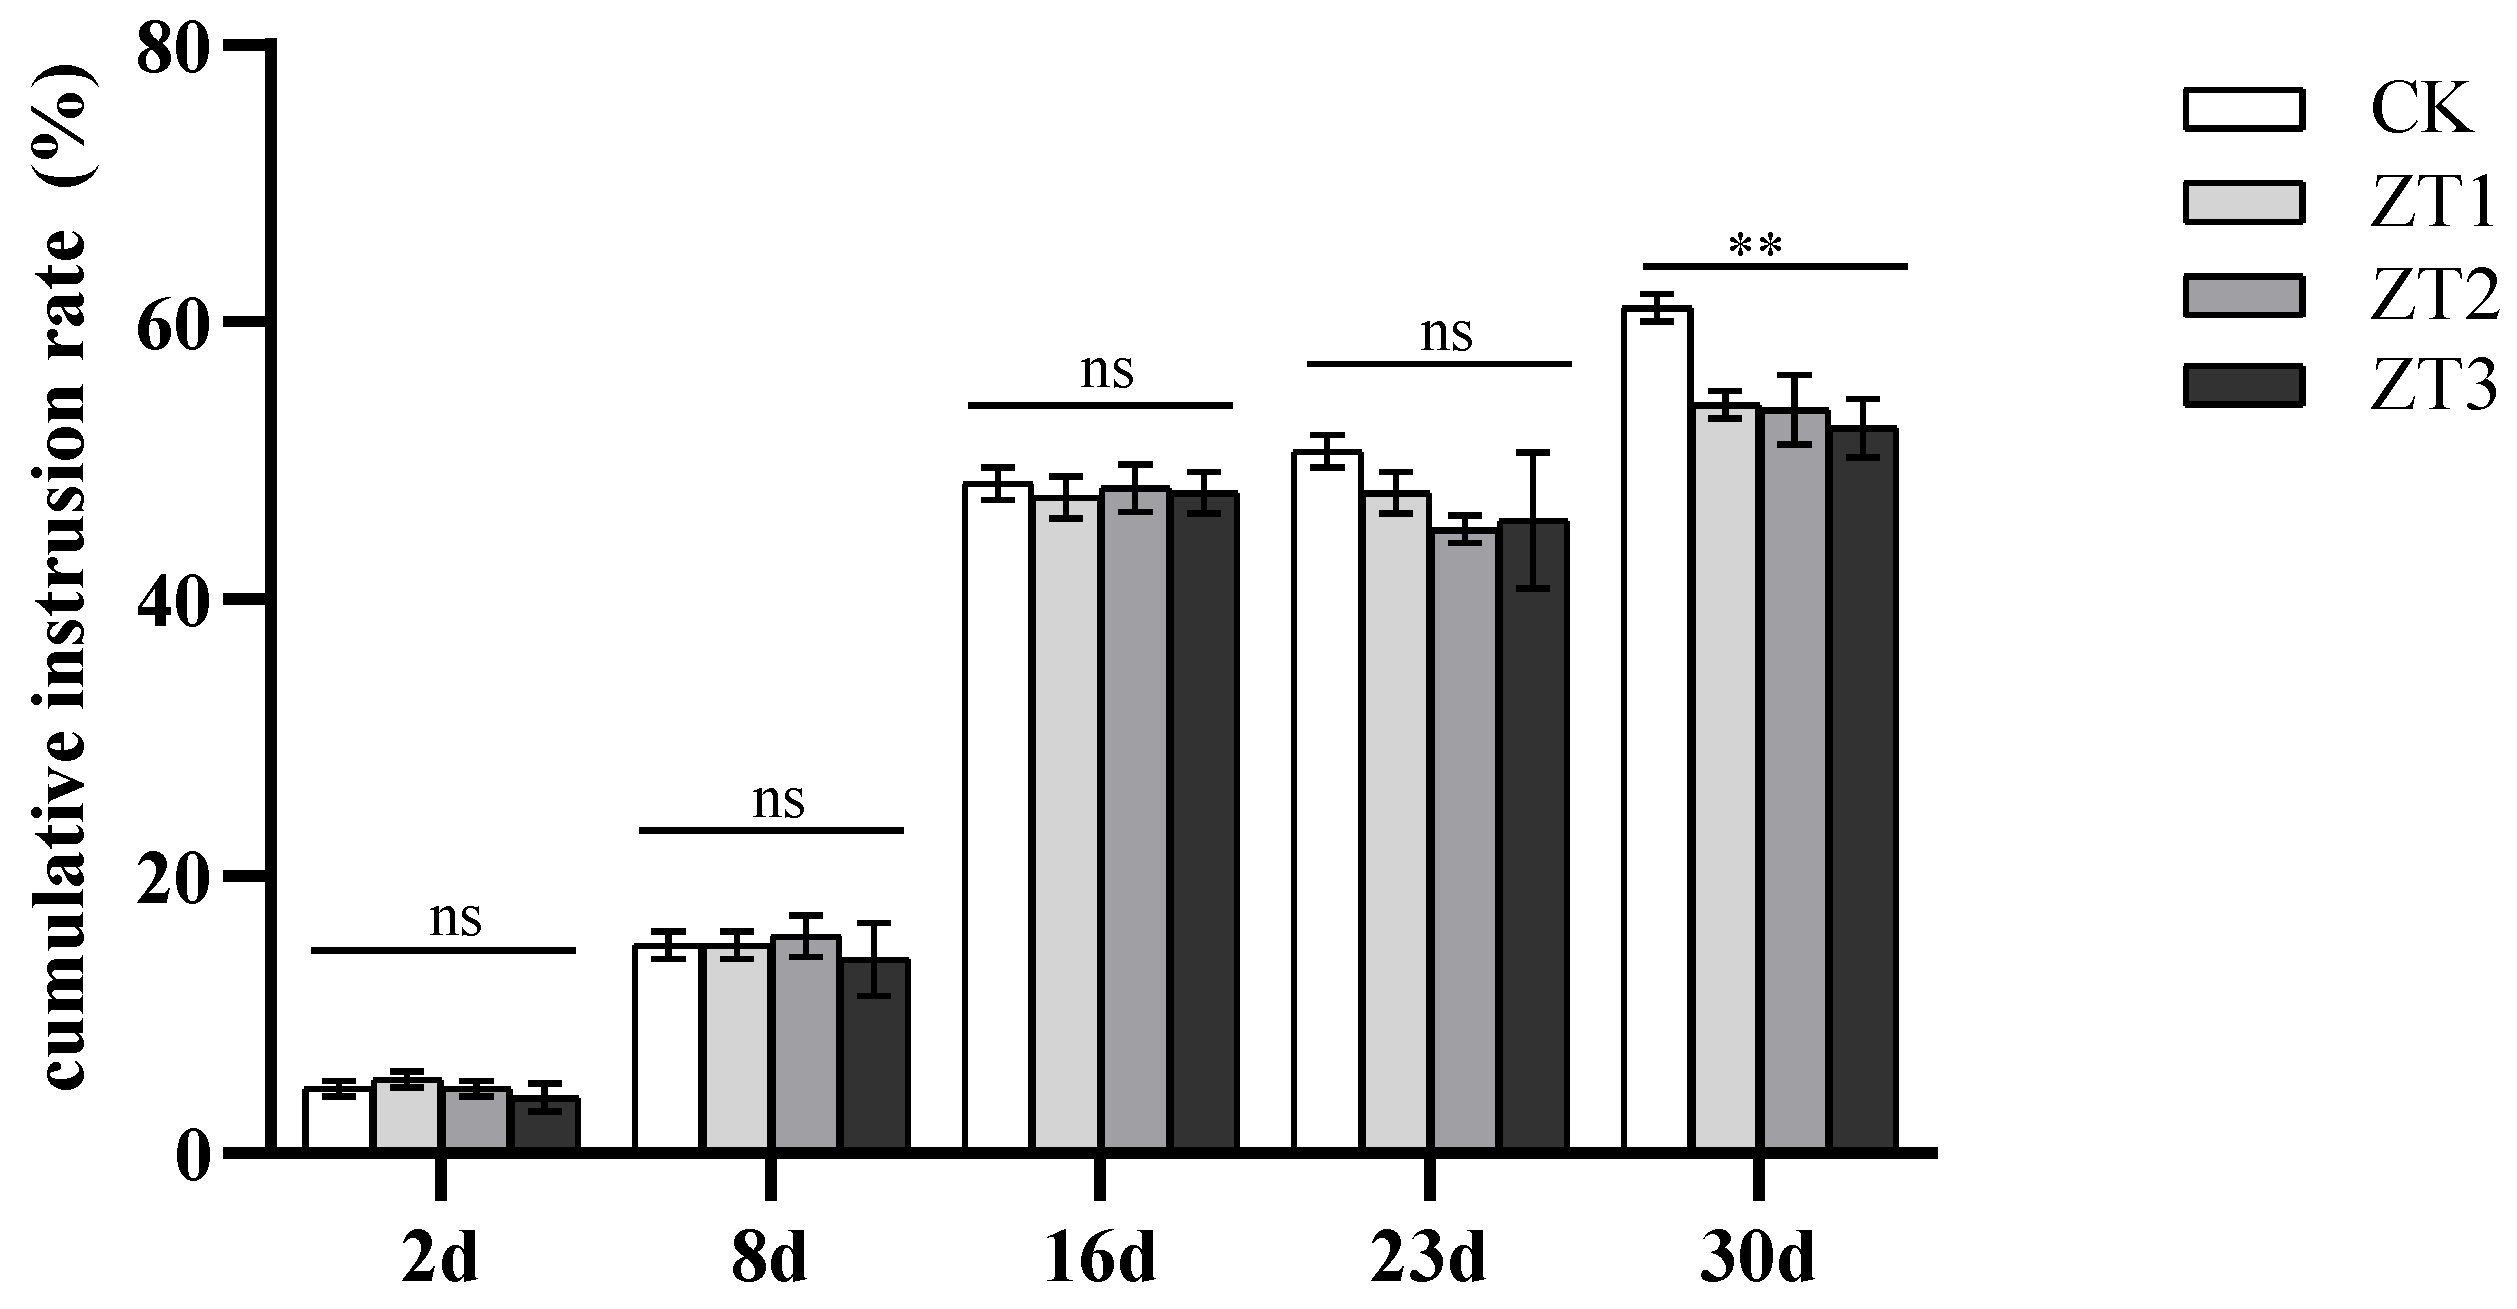
Figure 7.
Root symptom phenotypes of RNAi tomato strains and wild-type tomato strains (CK) at 45 days post-inoculation with M enterolobii. ZT1-ZT3 represent T1-generation tomato lines harboring gene-silencing vectors, respectively. The red arrows point to the root galls; the more arrows there are, the greater the number of root galls.
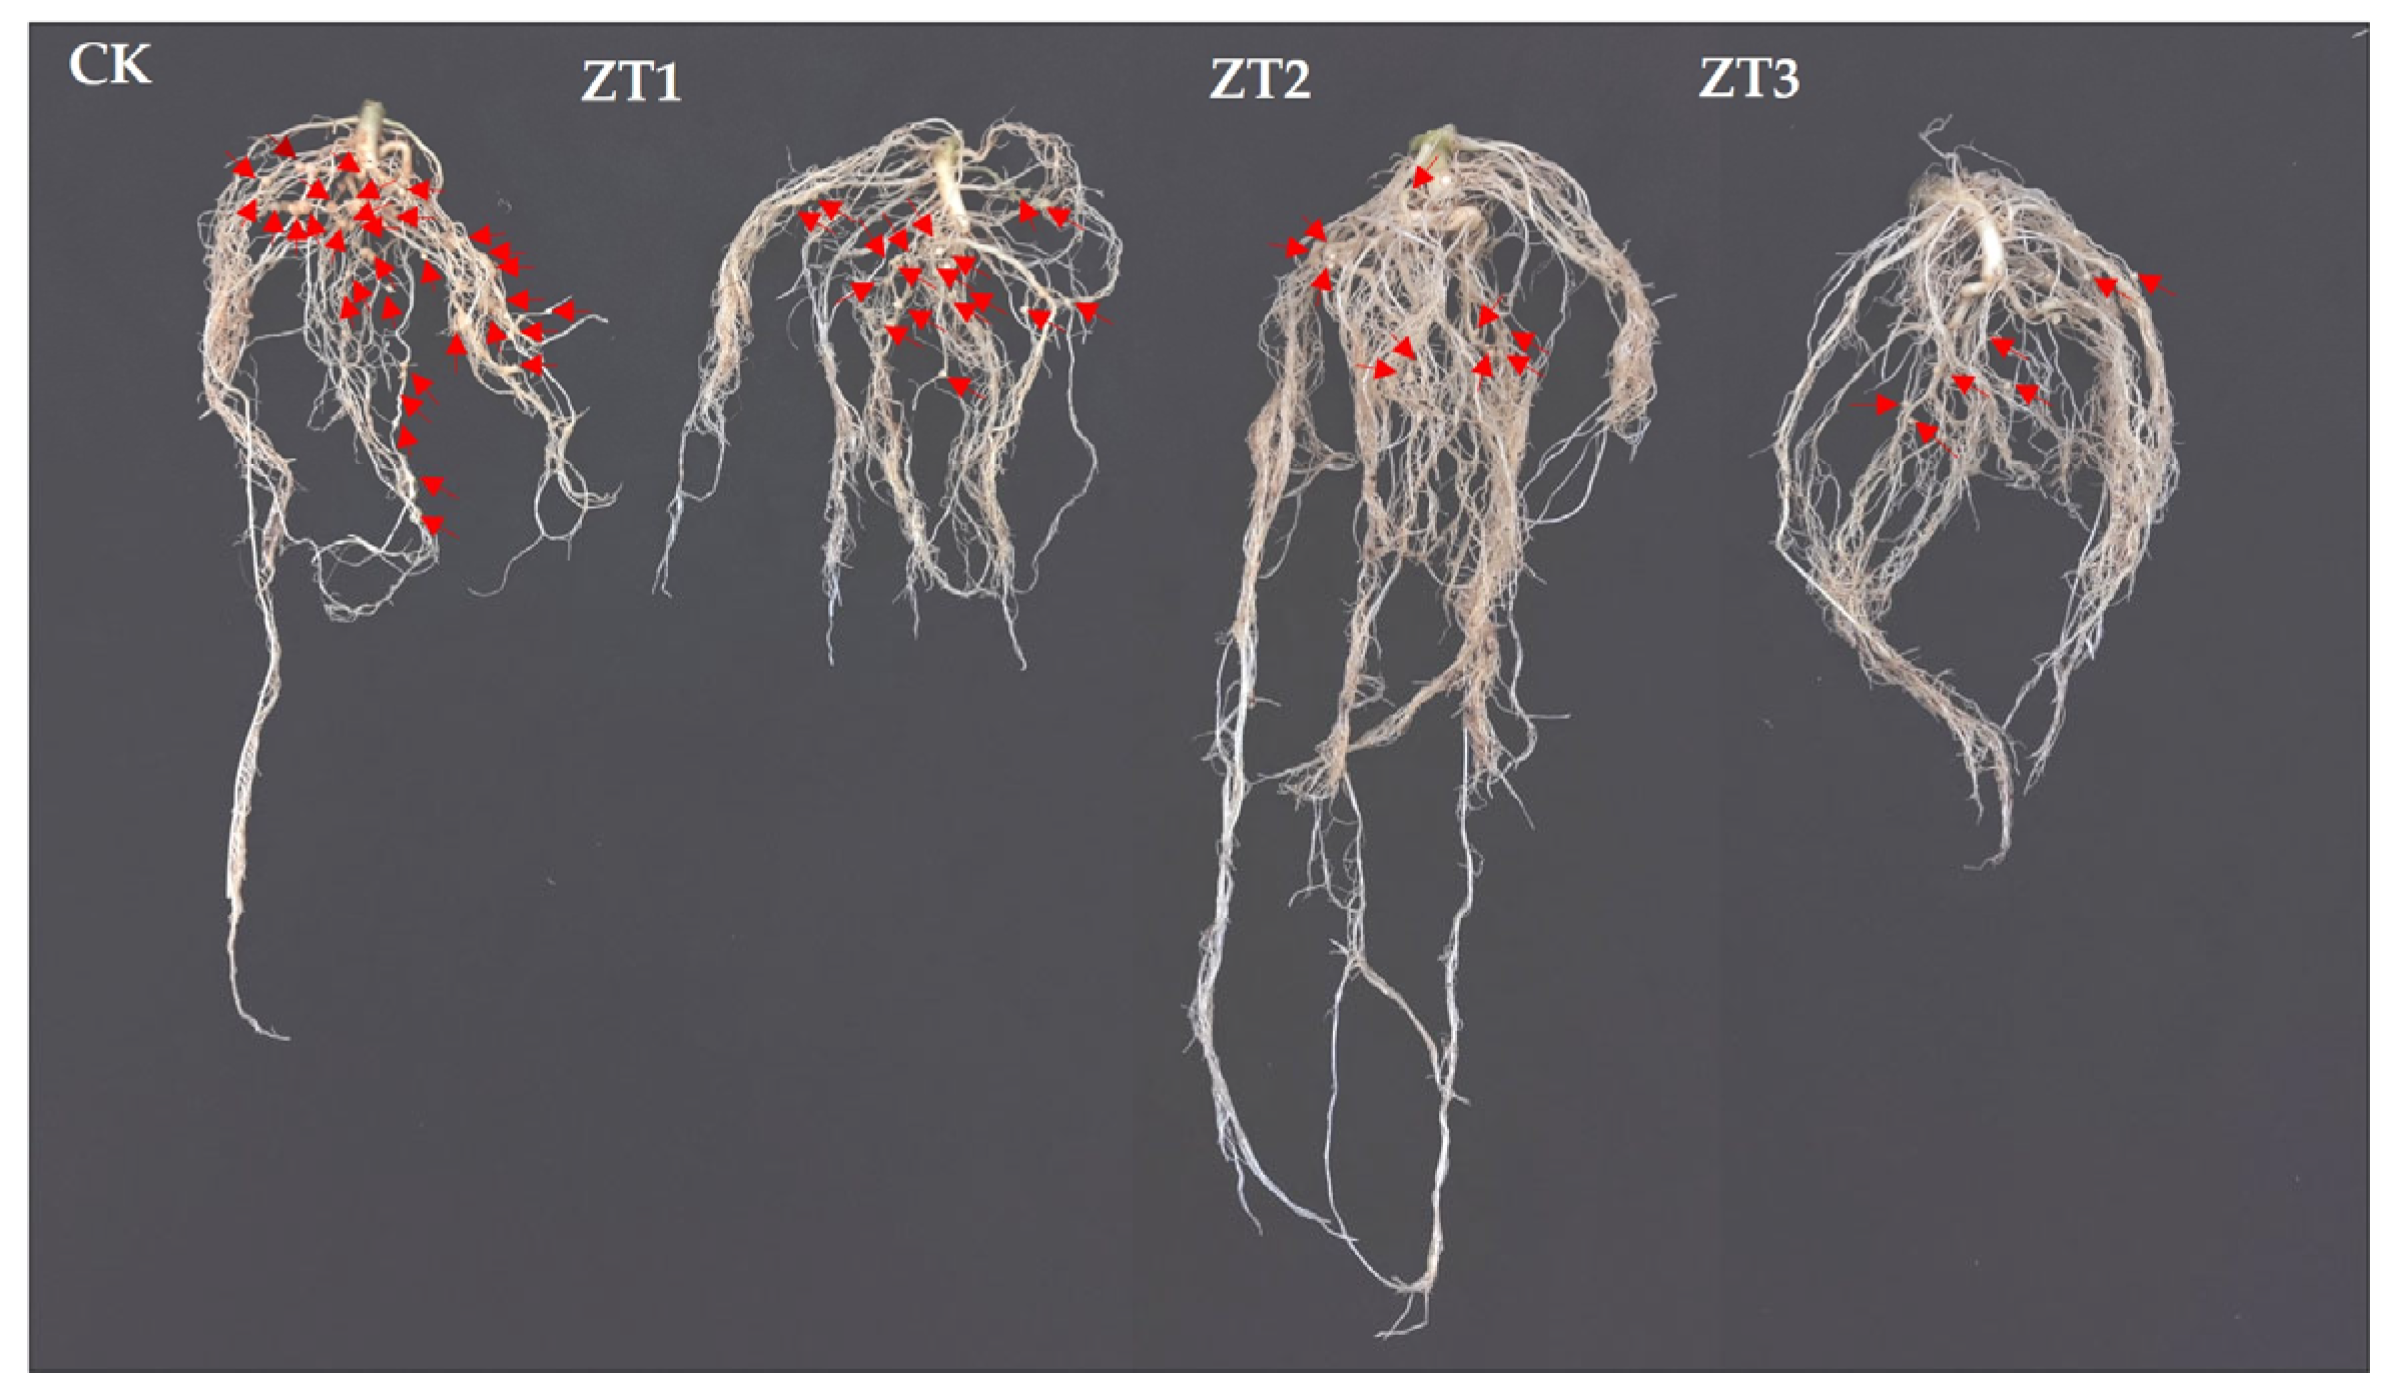
Figure 8.
Transcriptome sequencing analysis. (A) Volcano plot of differential gene expression. (B) GO functional annotation of differential genes. (C) Bubble plot of KEGG enrichment analysis for differentially expressed genes.
Figure 8.
Transcriptome sequencing analysis. (A) Volcano plot of differential gene expression. (B) GO functional annotation of differential genes. (C) Bubble plot of KEGG enrichment analysis for differentially expressed genes.
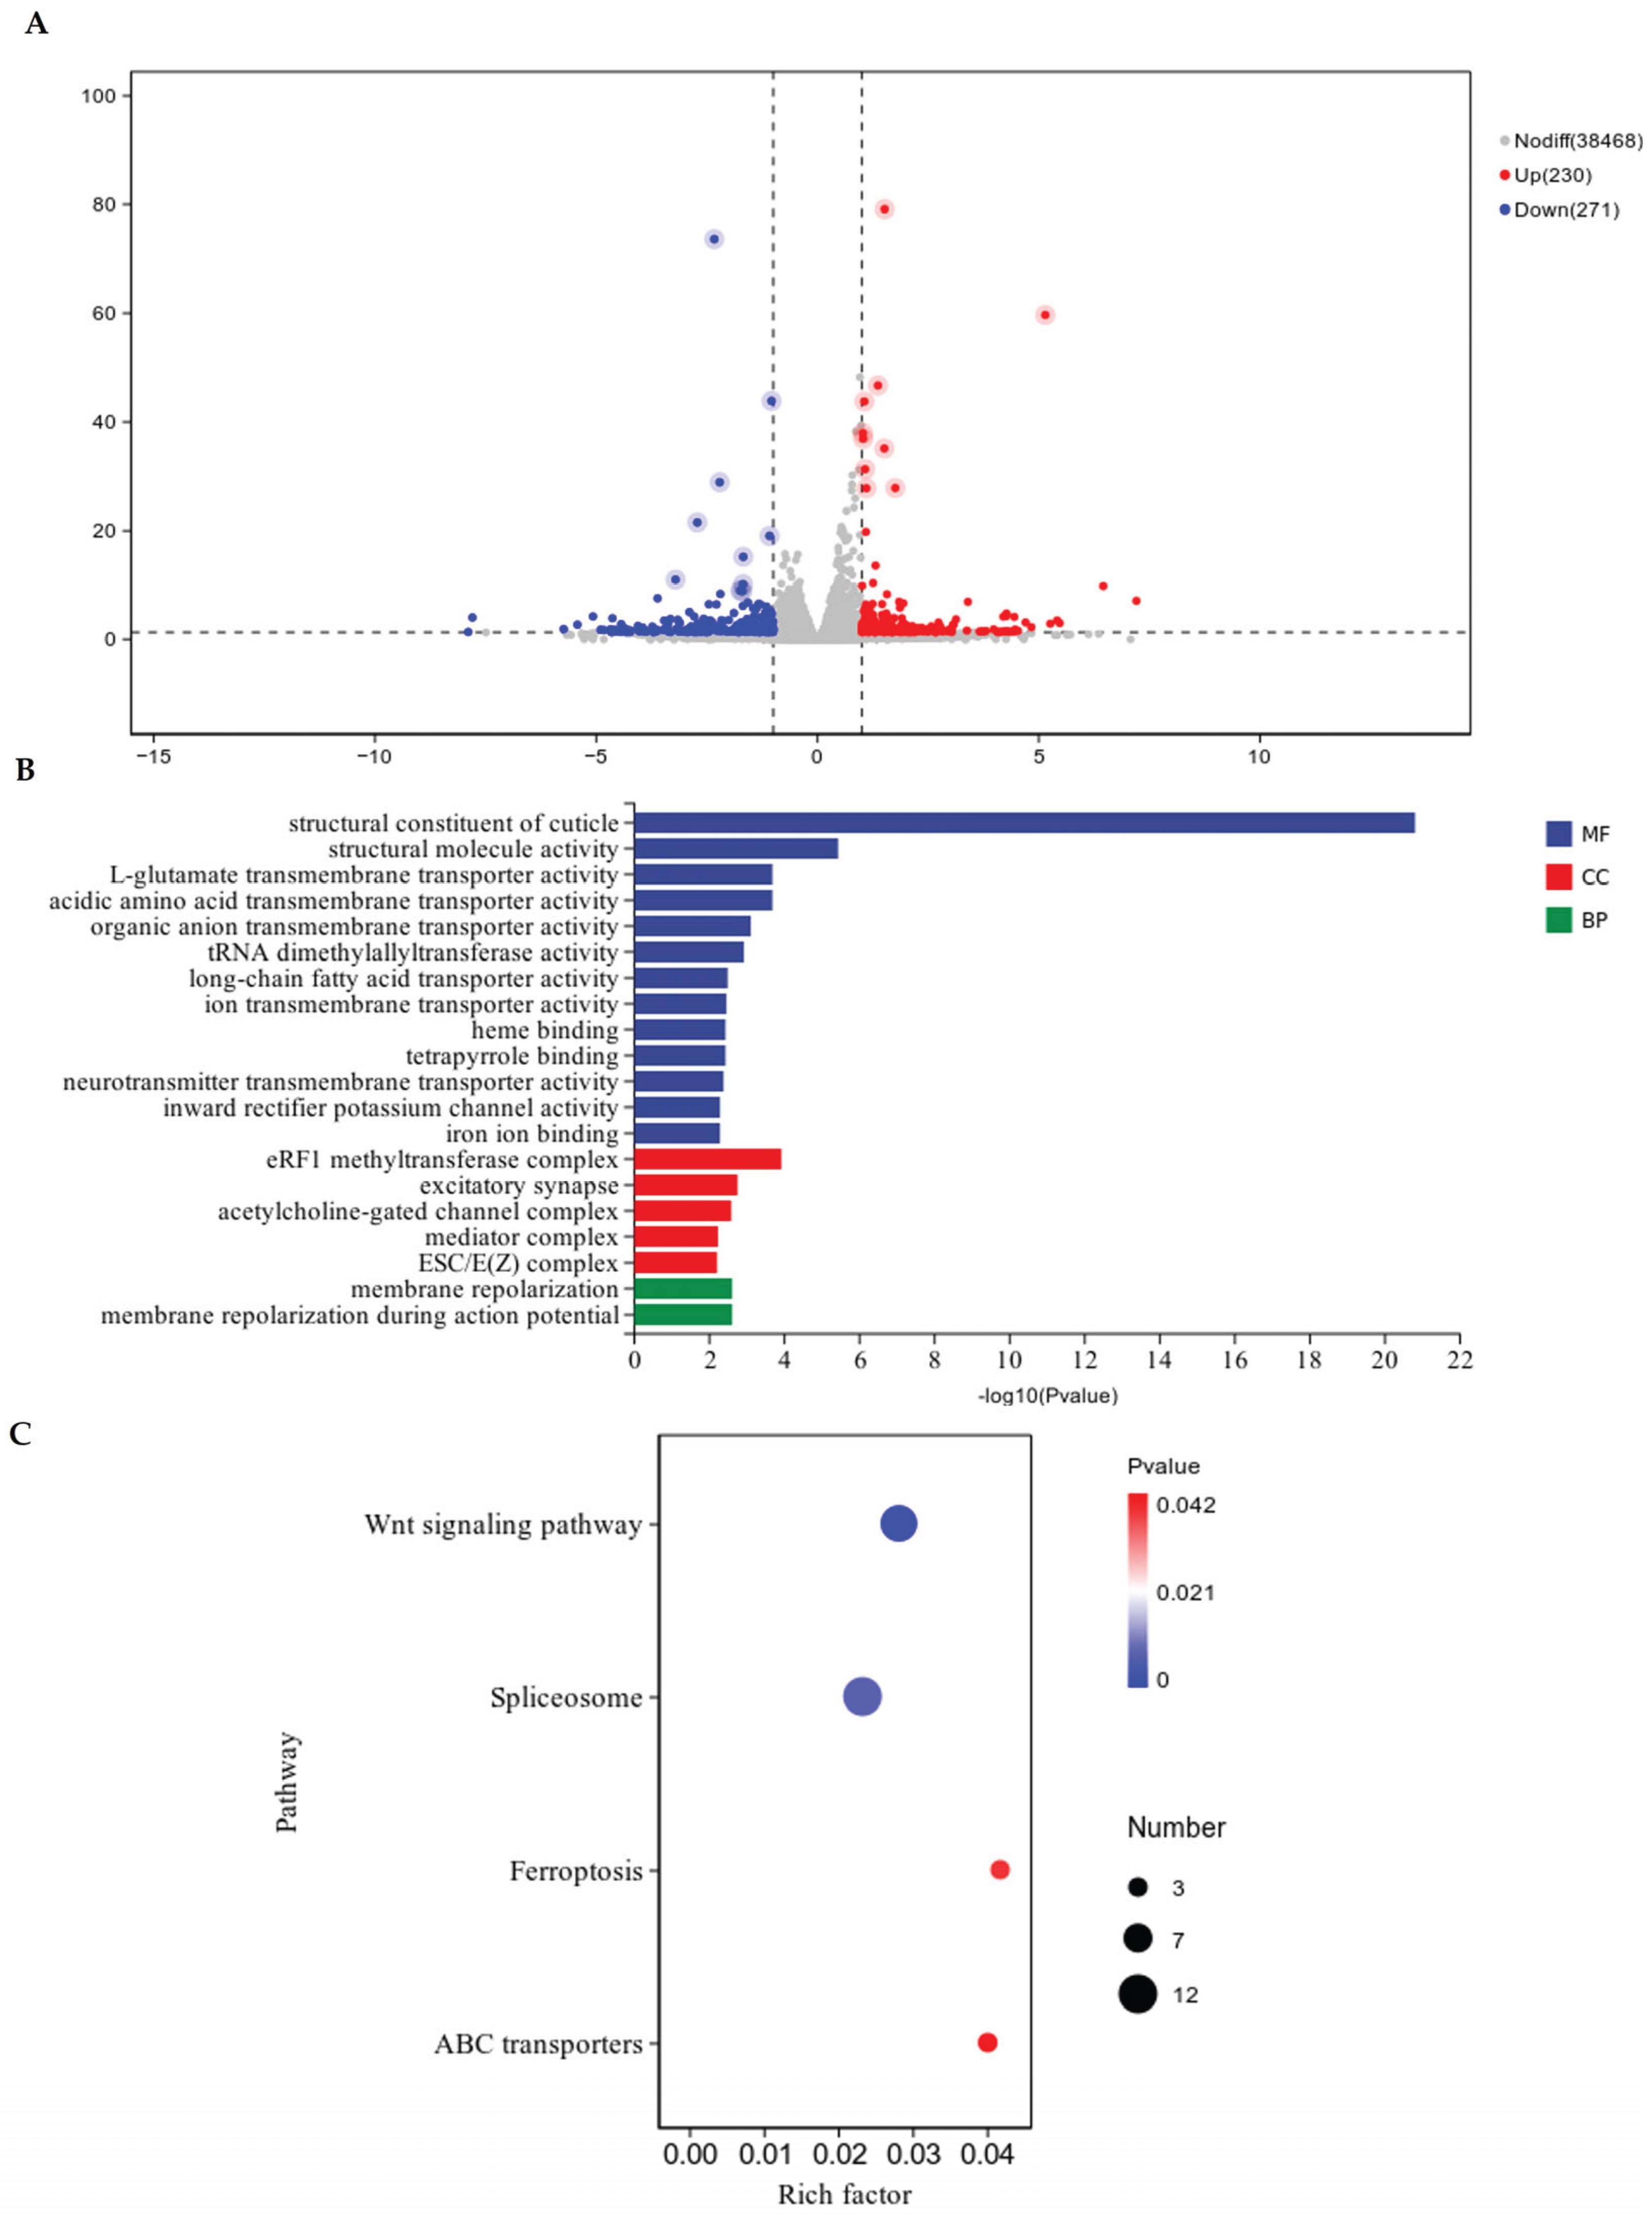

Table 1.
Pathological evaluation of RNAi tomato strains and wild-type tomato strains (CK) at 45 days post-inoculation with M enterolobii.
Table 1.
Pathological evaluation of RNAi tomato strains and wild-type tomato strains (CK) at 45 days post-inoculation with M enterolobii.
| Root galling percentage | Root galling index | Gall number |
Egg mass number | Eggs per mass | Total egg count | |
|---|---|---|---|---|---|---|
| CK | 46.02% | 3 | 67±7.41a | 17±5.31a | 402±18.98a | 5940±136.8a |
| ZT1 | 35.13% | 3 | 32±7.36b | 11±4.19ab | 236±36.5b | 1260±146.9b |
| ZT2 | 34.77% | 3 | 19±4.55b | 8±4.99ab | 209±42.21bc | 1320±213.4b |
| ZT3 | 30.72% | 3 | 16±7.26b | 3±1.25b | 151±36.55c | 1027±224.5b |
ZT1-ZT3 represent T1-generation tomato lines harboring gene-silencing vectors, respectively. Different lowercase letters indicate statistically significant differences (P < 0.05).
Disclaimer/Publisher’s Note: The statements, opinions and data contained in all publications are solely those of the individual author(s) and contributor(s) and not of MDPI and/or the editor(s). MDPI and/or the editor(s) disclaim responsibility for any injury to people or property resulting from any ideas, methods, instructions or products referred to in the content. |
© 2025 by the authors. Licensee MDPI, Basel, Switzerland. This article is an open access article distributed under the terms and conditions of the Creative Commons Attribution (CC BY) license (http://creativecommons.org/licenses/by/4.0/).
Copyright: This open access article is published under a Creative Commons CC BY 4.0 license, which permit the free download, distribution, and reuse, provided that the author and preprint are cited in any reuse.


