
Submitted:
29 May 2023
Posted:
31 May 2023
You are already at the latest version
Abstract
The chitin synthase B gene is a key enzyme in the chitin synthesis of insect peritrophic matrix (PM), affecting insects' feeding behavior. The chitin synthase B gene has been cloned from the transcription library of Heortia vitessoides Moore. RT-qPCR showed that HvChsb was highly expressed in the larval stage of H. vitessoides, especially on the first day of the prepupal stage, and in the midgut of larvae and the abdomen of adults. After starvation treatment, HvChsb was found to be significantly inhibited with time. After 48 h of starvation, the feeding experiment showed that HvChsb increased with the prolongation of the refeeding time. The experimental data showed that feeding affected the expression of HvChsb. HvChsb was effectively silenced by RNA interference, so its function was lost, significantly decreasing the survival rate of H. vitessoides. The survival rate from larval-to-pupal stages was only 43.33%, accompanied by abnormal phenotypes. It can be seen that HvChsb plays a key role in the average growth and development of H. vitessoides.
Keywords:
Heortia vitessoides Moore
; Chitin synthase B gene
; RNA interference
; Starvation
; Refeeding
1. Introduction
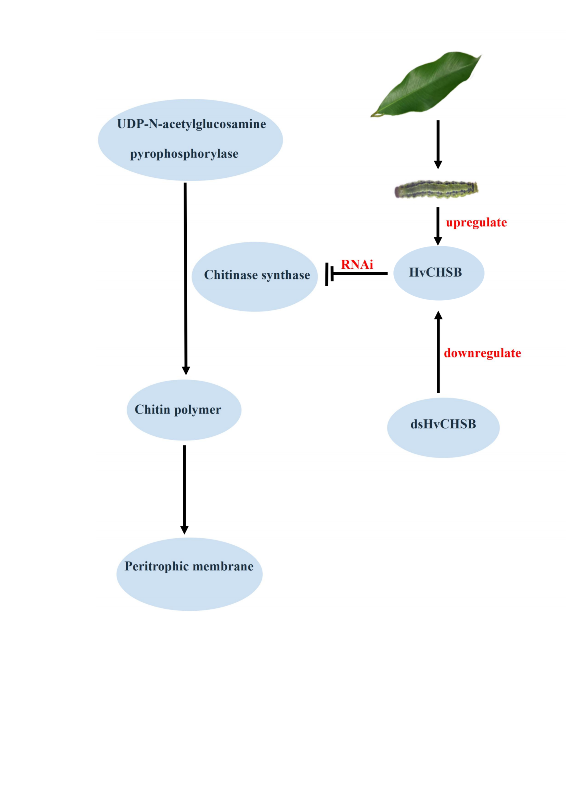
Chitin is the second most abundant organic compound after cellulose and is found in various organisms. It is a linear polymer of β-(1,4)-N-acetyl-D-glucosamine (GlcNAc) [1]. It is widely found in arthropods and in some invertebrates, fungi, protozoa, and algae [2,3]. In insects, chitin plays eaaential roles in protection, support, and nutrition. For example, it is the main structural component of insect epidermis and peritrophic matrix (PM), closely related to growth and development [4,5]. Chitin synthesis is a complex process that requires the cooperation and participation of many enzymes, in which chitin synthase (CHS) is indispensable [1,6]. Previous studies identified genes encoding chitin synthase in many insects, with the findings showing that there are two chitin synthase types: chitin synthase A (Chsa) and B (Chsb), which are now known as Chs1and Chs2 [7,8,9].
Studies have found that these two CHS exhibit significant differences in mRNA expression specificity and function. Chsa is expressed explicitly in the formation of trachea and integument, while Chsb is mainly expressed in the midgut [10,11,12]. The two genes also differ markedly in their physiological functions: Chsa is mainly involved in the tissue synthesis of the epidermis and trachea at various stages of insect growth, while Chsb is mainly responsible for synthesizing chitin in the PM upon eating [13,14,15,16]. Studies on the Chsb gene in insects have confirmed its functionality [17,18,19]. Breakthroughs have also been achieved by using RNAi technology to silence Chsb function in insects. Analysis of the expression of Chs2 in Locusta migratoria by Xiaojian Liu showed that LmChs2 expression was not detected in the pre-egg and mid-egg stages, and the expression level increased sharply during late egg development and was stable in the L4, L5, and adult stages. RNAi technology was also used to inject dsLmChs2 into female and male adults. Compared with the level in the control group, it was found that the expression of this gene was significantly reduced, also feeding noticeably decreased, and the mortality of female and male adults was increased [20]. In addition, Arakane et al. performed RNAi on Chsb of Tribolium castaneum. This led to an absence of PM formation in the midgut of larvae of T. castaneum, which resulted in reduced larval growth due to starvation. Chsb thus greatly impacts insect feeding behavior, and plays important roles in insect growth and development [21]. The study of this gene thus has major biological significance. To date, Chsb has been partially characterized in Locusta migratoria, Spodoptera exigua, Ostrinia furnacalis, Bombyx mori, and other insects, but it has not been reported in H. vitessoides [20,22,23,24].
Aquilaria sinensis (Lour.) Spreng. (Myrtales: Thymelaeaceae: Aquilaria) is an economically important evergreen tree [25,26]. Heortia vitessoides Moore (Lepidoptera: Crambidae: Odontiinae) is a serious leaf-eating pest characterized by eating large amounts of leaves in a short period, causing damage that lasts a long time. This moth uses A. sinensis as its only food source [27]. In this study, RT-qPCR was used to detect the expression specificity of HvChsb in H. vitessoides in different stages and tissues. After silencing HvChsb by RNAi, its role in the growth and development of H. vitessoides was analyzed. At the same time, the expression level of HvChsb upon starvation treatment was measured, which further confirmed the importance of this gene in insect feeding behavior. This work provides a scientific basis for exploring the prevention and control of H. vitessoides via molecular biology.
2. Materials and methods
2.1. Insects
The insects were kept in a climatic cabinet (27°C with 70% relative humidity and a photoperiod of 14:10 h light:dark) and fed A. sinensis leaves. When the larvae matured, they were transferred into a container with sand at a humidity of 50% and thickness of 2–4 cm, where they were allowed to undergo pupation and eclosion.
2.2. Sample Preparation
To study the expression characteristics of the target gene in each developmental stage of H. vitessoides, 90 first-instar larvae (three biological replicates, 30 per replicate), 45 second-instar larvae (three biological replicates, 15 per replicate), 6 each of third-, fourth-, and fifth-instar larvae, 6 pupae, and 6 adults (three biological replicates, 2 per replicate) were analyzed. Second, to examine the tissue-specific expression of the target gene, the tissues of L5 larvae and adults were dissected and collected. For starvation treatment, 90 of the L4 larvae (three biological replicates, 30 per replicate) were deprived of food for 96 h and sampled every 12 h. For refeeding after the starvation treatment, 60 of the L4 larvae (three biological replicates, 30 per replicate) were fed after being deprived of food for 48 h and samples were collected after 0.5, 1, 4, and 12 h. These samples were wiped clean with sterile cotton balls, treated with liquid nitrogen, and finally stored in a freezer at −80°C.
2.3. Sequence Verification and Phylogenetic Analysis
A search for the gene sequence in the transcriptome of H. vitessoides was performed [28]. After BLAST homology alignment on the NCBI website, the complete sequence of the Chsb gene was obtained and named HvChsb (accession number: ON783456). The cDNA sequence of the Chsb open reading frame was also acquired using the open reading frame (ORF) Finder (http://www.ncbi.nlm.nih.gov/gorf/gort.html). Corresponding gene-specific primer pairs were designed to amplify the Chsb ORF for sequence verification (Table 1). Primer Premier 5.0 (Premier Biosoft International, Palo Alto, CA, USA) software was used to design HvChsb-specific primer sequences. PCR amplification conditions were as follows: 98°C for 3 min; 15 cycles starting at 98°C for 20 s, 66°C for 10 s, and 72°C for 15 s with a decrease in temperature of 1°C each cycle; 25 cycles of 98°C for 20 s, 51°C for 10 s, and 72°C for 15 s; along with 72°C for 2 min and then being held at 12°C. The product was recovered, purified, ligated with pClone007, and transferred into Escherichia coli DH5α competent cells. Finally, it was sequenced to confirm that the target gene had been successfully cloned. The isoelectric protein point and relative molecular weight of HvChsb were predicted by the ExPASy - ProtParam tool (http://web.expasy.org/protparam/); Prediction of Transmembrane Domain of Gene Protein by TMHMM; Glycosylation site prediction of this gene on NetNGlyc 1.0 Server. The amino acid sequences encoded by other insect Chsb genes were downloaded from the GenBank database for phylogenetic tree construction and homology comparison. The sequences were aligned on the MAFFT version 7 website. The phylogenetic tree was constructed by MEGA 7.0 software based on the neighbor-joining method.
2.4. RNA Extraction and cDNA Synthesis
Total RNA Kit II (OMEGA) was used to extract total RNA from the sample. Then the concentration of the extracted RNA was determined using the Implen Ultramicro-spectrophotometer (Nanophotometer series). The PrimeScriptTM RT Reagent Kit with gDNA Eraser kit was used to synthesize cDNA following its operating instructions. The synthesized cDNA was stored in a freezer (−20°C) for later use.
2.5. Primer Design and Quantitative Real-Time Polymerase Chain Reaction (RT-qPCR)
Under the conserved region, specific primers were designed using Primer Premier 5.0 software, the synthesis of which was then outsourced to Guangzhou Qingke Biotechnology Company. The primer sequences are shown in Table 1. The previously synthesized cDNA templates were diluted for RT-qPCR reaction templates. The instrument LightCycler 480 II Real-Time PCR System was used for quantitative fluorescence analysis. Three technical replicates were established, with β-actin [29] used as an internal reference gene.
2.6. dsRNA Preparation and Injection
The synthesis of dsRNA was performed using the T7 RiboMAXTM Express RNAi System kit. Primers containing the T7 polymerase promoter sequence were synthesized to run PCR to obtain DNA templates, after which dsChsb and dsGFP fragments were synthesized together. The DNA template was removed, followed by dsRNA annealing and single-stranded RNA (ssRNA), and finally dsRNA was purified. The purified dsRNA was diluted with nuclease-free water and quantified using an Implen Ultramicro-spectrophotometer (Nanophotometer series).
The dsRNA was diluted to a concentration of 3 μg/μL, and 1 μL was injected into the dorsal part of the antepenultimate abdominal segment of each larva using a microinjector. The same concentration and dose of dsGFP and DEPC were used in the control group. Each group contained at least 30 larvae, and four boxes of injection were used to record the phenotypic changes and survival rates during the experiment.
2.7. Phenotype Observation and Analysis
Careful observation of the phenotypic changes was performed in the experimental and control groups after injection. To determine whether the treated insects survived, they were touched with a brush to see whether they responded within 1 min.
2.8. Starvation Treatment and Refeeding
L4D1 larvae were randomly selected and divided into three groups, with 30 in each group, and deprived of food for 96 h. The samples of starved larvae were collected at 12, 24, 36, 48, 72, and 96 h. The duration of starvation varied, while the other conditions remained unchanged. H. vitessoides that were fed during the same period were collected as a control group. The L4D1 larvae were selected and divided into three groups, with 20 larvae in each group. After 48 h of starvation, they were fed again. Samples from the refed larvae were collected at 0.5, 1, 4, and 12 h, and H. vitessoides usually reared in the same period was used as a control group. These collected samples were quickly frozen in liquid nitrogen and stored in an ultra-low-temperature freezer (−80°C).
2.9. Statistical Analysis
Excel was used for the primary statistical analysis of experimental data, and then SPSS 18.0 (IBM, Armonk, NY, USA) was used for statistical analysis. Tukey’s test and one-way analysis of variance (ANOVA) were used for analyses among multiple samples, while the t-test was used for two samples. In the software, the 2−△△ Ct data analysis method was used to obtain the relative expression of the target gene [30]. At p<0.05, the difference was statistically significant. The data obtained are expressed as mean ± standard error.
3. Results
3.1. Sequence Analysis of HvChsb and Phylogenetic Analysis
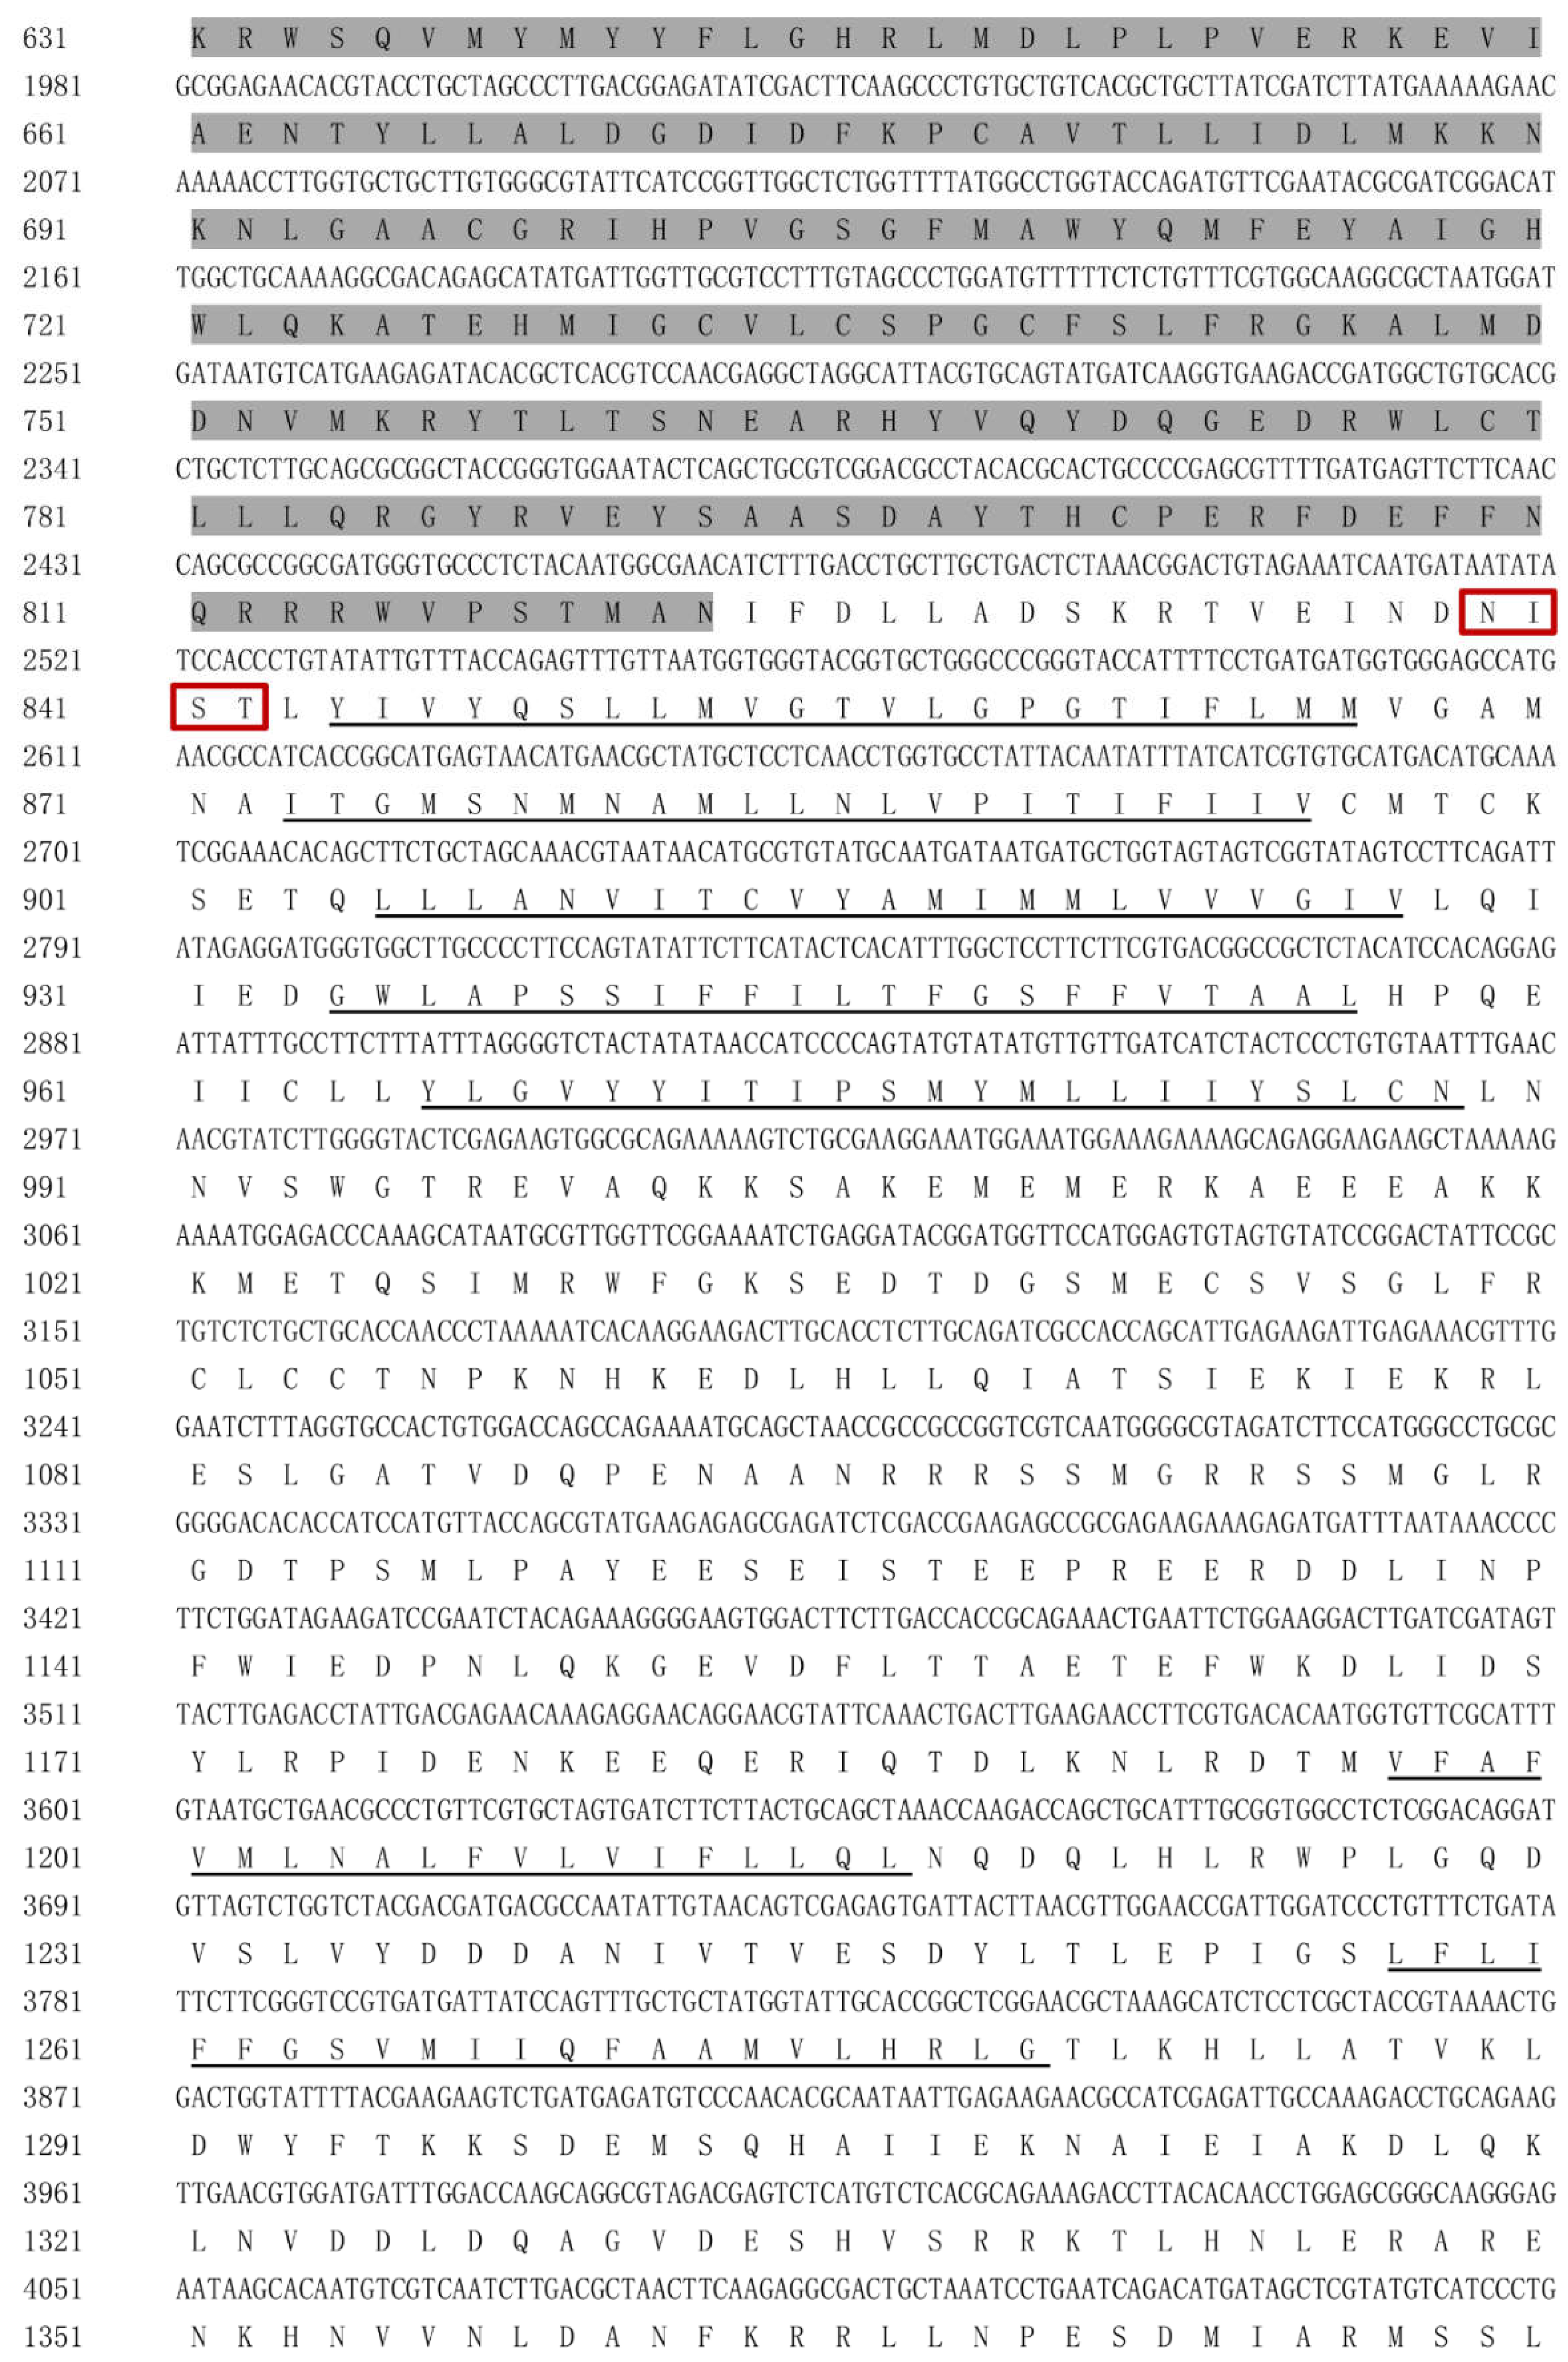
The gene sequence was searched in the transcriptome of H. vitessoides. After BLAST homology alignment on the NCBI website, the complete sequence of the Chsb gene was obtained and named HvChsb (GenBank accession number: ON783456). The full length of the sequence was 4971 bp, and the sequence had an ORF of 4410 bp, encoding 1469 amino acids. With the help of the online program ProtParam, the theoretical molecular weight of the protein encoded by the gene was 168.11 kDa, with a predicted isoelectric point of 5.97. Among the residues, the negatively charged residues (Asp + Glu) numbered 172, while the positively charged ones (Arg + Lys) numbered 154. Analysis by TMHMM showed that HvChsb has 16 transmembrane domains (Figure 1).
Continued Figure 1. The amino acid sequence of HvChsb from H. vitessoides.
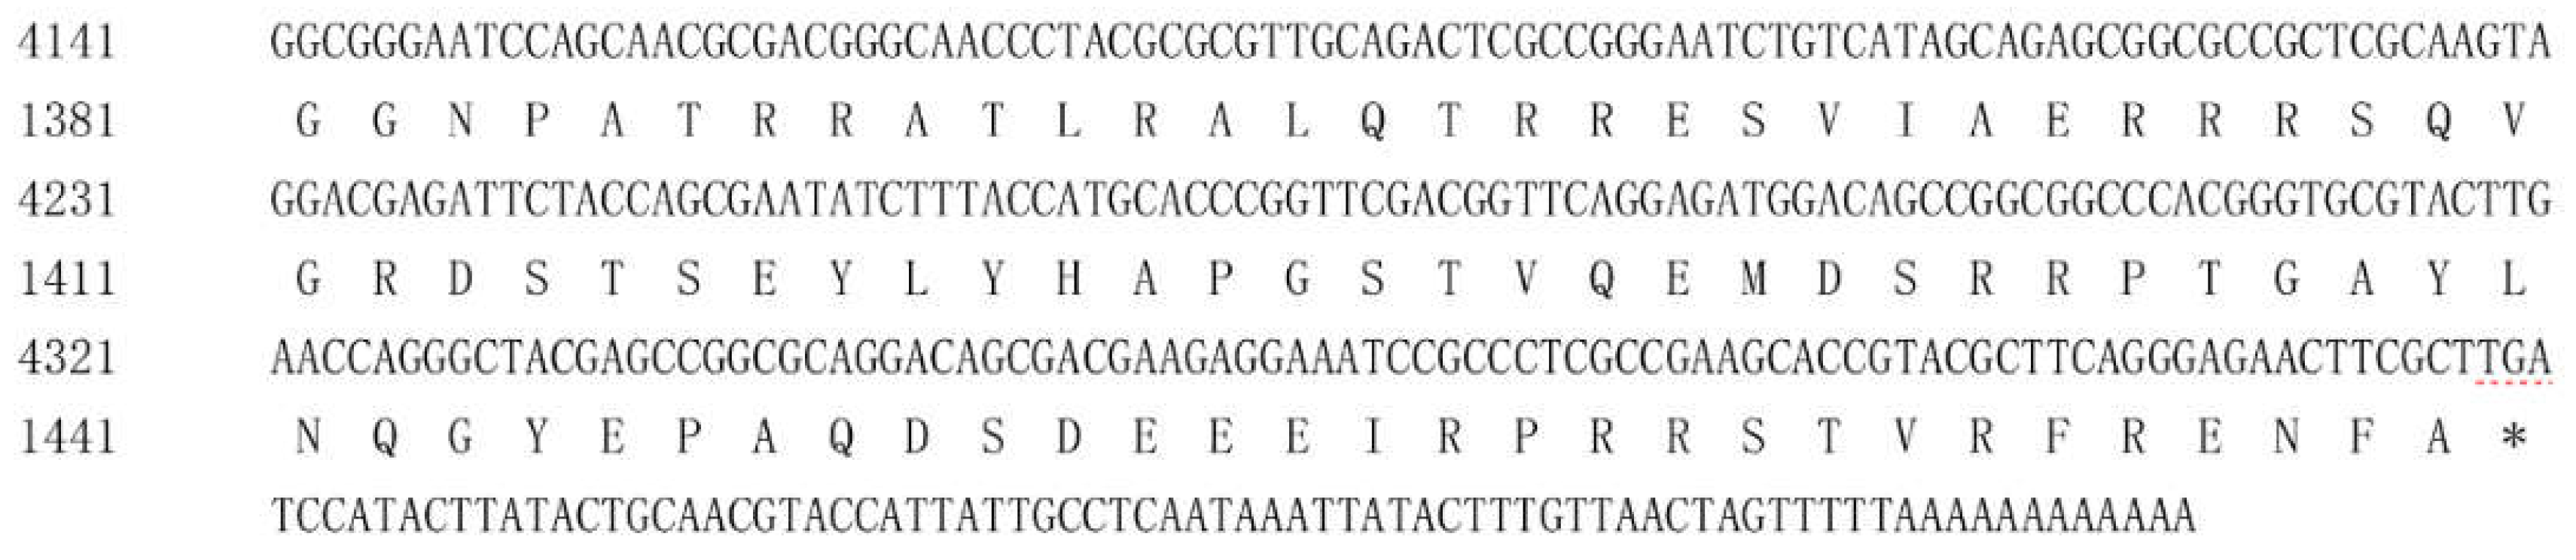
Continued Figure 1. The amino acid sequence of HvChsb from H. vitessoides. The start codon and the termination codon are marked with a red dotted line, conserved regions are marked with gray shading, the 16 transmembrane domains are marked with black underlines, and the 4 potential N-glycosylation sites are shown by red boxes.
The amino acid sequences of six insects were downloaded from GenBank (Helicoverpa armigera, Cnaphalocrocis medinalis, Mythimna separata, Tribolium castaneum, Bactrocera dorsalis, Locusta migratoria). The results showed that the amino acid sequence similarity between HvChsb and the Chsb genes of these insects was 70.64%, 73.37%, 68.31%, 43.06%, 38.22%, and 45.95%, respectively (Figure 2).
To understand the relationship of the Chsb genes among different insects, the Chsb genes of insects in Lepidoptera, Diptera, Orthoptera, Coleoptera, and Hymenoptera were selected to construct a phylogenetic tree. The results showed that the relationship between Cnaphalocrocis medinalis and H. vitessoides was the closest in Lepidoptera, with a confidence level of 96% (Figure 3)
3.2. Stage-Specific and Tissue-Specific Expression Patterns of HvChsb
HvChsb was highly expressed in the growth and development stages of the larvae, which peaked at the L5 larval stage. Subsequently, the expression level of HvChsb peaked among all stages on the first day of the prepupal stage, and then its level began to decrease rapidly until there was no expression in the pupal stage. Expression was detected in adulthood, but its level was much lower than that at the L1 larval stage (Figure 4).
Expression levels in five different tissues (head, epidermis, foregut, midgut, hindgut, and fat) of the larvae. The results show that the expression of HvChsb was not detected in the head and epidermis, and the expression was only present in the foregut, midgut, hindgut, and fat, and peaked in the midgut (Figure 5).
The relative expression levels in five regions (head, thorax, abdomen, wings, and feet) of H. vitessoides adults showed that the abdomen, wings, and feet exhibited HvChsb expression. Among these regions, HvChsb expression peaked in the abdomen, and the expression level in the head was about 350 times that of the control (HD) (Figure 6).
3.3. Silencing of HvChsb by RNAi
dsRNA was injected into L3D1 (first day of third instar) larvae and total RNA was extracted. The expression level of HvChsb after RNAi was determined using RT-qPCR. The results showed that dsHvChsb could silence the target gene. The expression of HvChsb was lower than that of the control at 12, 24, 36, 48, 72, and 96 h after dsRNA injection. Especially at 12 h after injection, the interference efficiency was the highest, while the HvChsb level was the lowest (about 60% of the control group) (Figure 7).
3.4. Phenotypic Analysis and Survival Assay after RNAi
After successful silencing of HvChsb, we performed comparisons with the control group injected with dsGFP and DECP. We found that the individuals injected with dsHvChsb exhibited clear lethality and developmental abnormalities (Figure 8A).The survival rate from larval the stage to successful pupation was 43.3%, significantly higher in the control group than in the experimental group (Figure 8B). The average weights of the experimental and control groups measured at 24 h were significantly different (Figure 8C).
3.5. Starvation Treatment and Refeeding
L4 larvae of H. vitessoides were randomly selected for starvation stress experiments, and their expression levels were determined at 12, 24, 36, 48, 72, and 96 h. The results showed that HvChsb expression was significantly inhibited with increasing starvation time, and reached its lowest level at 96 h (Figure 9).
L4 larvae of H. vitessoides were randomly selected for refeeding after starvation., and their expression levels were detected at 0.5, 1, 4, and 12 h. The results showed that the expression level of HvChsb began to increase when the starved larvae were refed for 0.5 h. Upon refeeding for 12 h, there was no difference between the experimental and control groups (Figure 10).
4. Discussion
Previous studies showed that chitin is an important molecule for insects, which is key to forming of insect epidermis and PM [4,31,32]. Chitin synthesis in insects involves many complex steps, in which CHS is a key component [4,33]. The study of chitin synthase has a long history, and the genes encoding it were initially simply divided into the two genes Chs1 and Chs2; in 2005, researchers instead named these two genes chitin synthase A (Chsa) and chitin synthase B (Chsb) based on differences in function and specificity [33,34]. Regarding differences between these two genes, the Chsa gene is mainly involved in chitin synthesis in insect cuticles, while the Chsb gene is expressed in insect midgut PM, which catalyzes the formation of midgut PM [10,17,35,36]. In this study, a Chsb gene (HvChsb) was obtained and successfully identified from the existing transcriptome of H. vitessoides (Figure 1). Homology analysis showed that the amino acid sequence encoded by HvChsb had high similarity to Chsb of Lepidoptera. The homology was 73.37% with CmChsb of C. medinalis and 69% with those of other insects. Meanwhile, the homology of Chsb with the sequences in other Coleoptera T. castaneum, Orthoptera L. migratoria, and Diptera B. dorsalis was less than 50%. This indicates that the Chsb of insects differs markedly among different orders. The phylogenetic tree constructed using the amino acid sequences showed that HvChsb could be divided into two categories. HvChsb had the closest relationship with C. medinalis, but low homology with Chsb of Diptera and Hymenoptera (Figure 3). Chsb is particularly expressed in lepidopterans, suggesting it is involved in growth and development.
Insects of many species differ in the duration of development, and their expression patterns with age also vary [37]. For example, in the metamorphosis of Drosophila melanogaster and Tribolium castaneum, the relative expression of the Chsb gene differs significantly. In a study on D. melanogaster, DmChsb was found to be expressed at all developmental stages, but peaked during the prepupal stage [7]. Meanwhile, TcChsb expression in the prepupal stage was significantly lower than in the adult stage in T. castaneum [8]. In this study, analysis of the expression during H. vitessoides development showed that HvChsb was highly expressed in the larval stage, which is also consistent with the feeding behavior of this species. Specifically, this species exhibits aggregate feeding during the L1–L2 instar larval stage, and its limited ability to disperse leads to it only feeding on the leaves around the hatching site. It was reported that the feeding level began to increase and the feeding range was expanded during the L3–L5 instar larval stage. The food intake was significantly reduced during the prepupal period, and no food was eaten during the pupal period [27,38]. Therefore, H. vitessoides larvae must eat a lot to promote their growth and development. The expression level increased continuously in the larval stage and decreased significantly in the prepupal stage; expression was not observed in the pupal stage. The development cycle has a certain regularity, indicating that HvChsb may also be involved in energy metabolism. The growth and feeding of H. vitessoides require a large amount of energy supply, so HvChsb also shows a certain regularity. The expression level of HvChsb was higher in the larval stage, which may require a lot of energy for feeding behavior, so the expression level of HvChsb was also higher in this period (Figure 4). The expression level of HvChsb is not high in the pupal stage and adult stage.In fact in some cases at the pupal stage it is almost undetectable. It is speculated that H. vitessoides pupae do not need to eat and are in a dormant state. Adults of H. vitessoides do not need to eat the leaves of A. sinensis, supplement nutrition with nectar, and then complete the finishing work [27,39]. In this study, the expression level of HvChsb reached its highest on the first day of the prepupal stage,similar to some researchers' results. Because the change in gene expression has a great relationship with its function, the specific function of this result can be further studied and explored. The change of gene expression is also closely related to its function. HvChsb expression in H.vitessoides peaked on the first day of the prepupal stage, but the specific function associated with this requires further study. However, the experimental results for Ostrinia furnacalis differ within the same lepidopteran order. Specifically, the expression of OfChsb on the last day of the L5 instar stage and expression at the prepupal stage are relatively consistent, and are lower than at other stages [23]. The above results also show that the expression of the Chsb gene differs significantly along development in different insects. We speculate that these differences are probably due to different insects having different development periods, and to differences in the design of each experiment, such as insect breeding conditions and the time interval for collecting samples.
In this study, HvChsb was expressed in the foregut, midgut, hindgut, and fat at the larval stage, especially in the midgut (Figure 5). This is consistent with the reported expression patterns of CmChsb (Cnaphalocrocis medinalis), BdChsb (Bactrocera dorsalis), and BmChsb (Bombyx mori) in larval tissues [19,24,40]. High expression in the midgut is likely to be associated with eating behavior [21,22,23,41], During the feeding period of H. vitessoides, its activity and feeding behavior increased, which increased the synthesis of chitin in the peritrophic midgut membrane, so the expression of HvChsb in the midgut also increased. However, contrasting findings were made for AgChsb (Anopheles gambiae), where expression was higher in the foregut than in the midgut [3]. It is speculated that this may be because these insects belong to different orders and their digestive systems have different structures. In this study, there was almost no expression of the Chsb gene in the head and epidermis of H. vitessoides larvae. It is speculated that expression of the Chsb gene is mainly concentrated in the digestive tract, where its product specifically catalyzes the formation of PM chitin in the midgut [3,31,42], while the expression is low or absent in other anatomical regions. The expression pattern of HvChsb in adult tissues showed that this gene was expressed in the abdomen, feet, and wings at this stage, particularly in the abdomen (Figure 6). This is also associated with insect feeding behavior, increasing the synthesis of PM chitin in the midgut [18,21,43].
The fact that different insects exhibit different RNAi silencing effects shows that insects vary in their sensitivity to RNAi [44], as revealed by numerous RNAi experiments. In the H. vitessoides experiments, RNAi had a high silencing effect [29,45,46]. In this study, 1 μL of dsRNA was injected into the L3 instar larvae at a concentration of 3 μg/μL. Through comparative analysis of the experimental and control groups, the results showed that the effect of RNAi was detected within 12 h after injection of dsHvChsb, and its relative expression reached its lowest level at 12 h after such injection. After that, the relative expression level began to increase. This indicates that RNAi had the expected effect of inhibiting Chsb expression (Figure 7). After injection of dsHvChsb, the growth and development of H. vitessoides also showed abnormalities (Figure 8A). Specifically, the larvae in the experimental group developed more slowly than those in the control group. Their body color in the experimental group became yellow and the larvae were shorter due to their limited feeding. Molting disorder was also identified, with the larvae being unable to pupate successful. It was also found that the pupal shell could not be successfully removed during eclosion. After eclosion, the experimental group's adults (males and females) were also smaller than those of the control group. In normal insect feeding, the Chsb gene plays a major role in the digestive tract, synthesizes chitin in the midgut PM, and digests and transforms food [47.48]. Upon silencing of the gene because of the obstruction of eating, it is impossible to obtain the energy-providing substances needed for growth and development, which also affects growth, pupation, and emergence; this in turn increases the likelihood of developmental abnormalities [18,49,50]. After injection of dsHvChsb, the survival rate of larvae decreased significantly, especially in the larval stage, and the survival rate from larvae to pupation was only 43.33% (Figure 8B). Similar findings have also been made upon silencing Chsb genes in other insects. For example, upon interfering with the expression of BmChsb in Bombyx mori at the larval stage, most larvae could not normally molt [16]. In addition, after silencing the expression of LmChsb in Locusta migratoria adults, they were unable to digest and absorb food, and eventually died of starvation, with a mortality rate of 78% [20]. It is speculated that silencing of the Chsb gene mediated by RNAi destroys the mechanism of chitin synthesis in the midgut PM, and the structure and function of the PM are also destroyed accordingly. This would in turn affect insects’ feeding and food absorption and digestion. In this study, the inability of H. vitessoides to eat and its lack of energy supply for growth and development eventually led to mortality. At the same time, upon injection in the control group, these phenomena were not observed. These results further indicate that HvChsb plays an essential role in the growth and development of H. vitessoides, and suggest that it is a key gene for the substantial feeding that occurs in H. vitessoides larvae.
The Chsb gene is closely related to insects' activity and feeding behavior. The enzyme it encodes is key to the synthesis of chitin in the midgut PM of insects. Experiments involving the induction of starvation stress showed that this can stimulate the expression of the Chsb gene [20,41,51]. Upon starving L. migratoria for 24 and 48 h, it was shown that the expression of LmChsb in the experimental group was significantly lower than that in the control group. At the same time, the PM was severely damaged in the experimental group, which impaired eating and digestive function. Moreover, the midgut length of the experimental group was also shorter than that of the control group [20]. Meanwhile, in the current exploratory study, H. vitessoides at the L4 instar stage was subjected to starvation stress and refeeding. During the 96 h of starvation, HvChsb expression in the experimental group was significantly inhibited from 12 h. Over time, its expression continued to drop, reaching its nadir at 96 h (Figure 9). In a further experiment involving refeeding after starvation, H. vitessoides starved for 48 h was refed. It was found that HvChsb expression began to increase at 0.5 h after refeeding. In comparison, there was no significant difference in expression between the experimental and control groups at 12 h (Figure 10). This is consistent with the experimental results from L. migratoria. This further indicates that the function of the Chsb gene is closely related to insect-feeding behavior and the formation of PM chitin in the midgut. Previous studies also showed that Chsb catalyzes the synthesis of chitin in insect midgut PM [1,4,52]. Silencing the Chsb gene would impede insects' feeding behavior,obstruct their energy supply, and destroy the functional mechanism of PM chitin in the midgut.
5. Conclusion
The Chsb gene was successfully obtained from the transcriptome database of H. vitessoides and identified as HvChsb. HvChsb is highly expressed at the larval stage, with its relative expression peaking on the first day of the prepupal stage. The detection of HvChsb expression in larvae and adults showed that its relative expression levels peaked in the larval midgut and adult abdomen. Moreover, the results of starvation treatment showed that HvChsb was significantly inhibited with increasing starvation duration. Meanwhile, the results of a refeeding experiment after 48 h of starvation showed that HvChsb expression in the experimental group began to grow at 0.5 h of refeeding. No significant difference compared with the control group was found at 12 h. Furthermore, the injection of dsHvChsb resulted in the silencing of HvChsb, with the strongest inhibitory effect occurring at 12 h, with the phenotypic abnormalities occurred during growth and development. At the same time, survival rate of H. vitessoides decreasing significantly. In this study, the knowledge of the insect Chsb gene was enriched, and it also provided a reference for the application of RNAi technology in insect control.
Author Contributions
Chen Qingling: Data curation, Investigation, Software, Methodology, Visualization, Writing-original draft. Sun Mingxu: Investigation, Software, Methodology. Wang Hanyang: Investigation, Software. Liang Xiaohan: Visualization. Yin Mingliang: writing-review and editing. Lin Tong: Funding acquisition, writing-review and editing. All authors have read and agreed to the published version of the manuscript.
Funding
Financial support: This research was supported by projects from the National Natural Science Foundation of China (32070012).
Data Availability Statement
The data presented in this study are available upon request from the corresponding author.
Acknowledgments
This research was supported by projects from the National Natural Science Foundation of China (32070012).
Conflicts of Interest
The authors declare no conflict of interest.
References
- Merzendorfer, H. Insect chitin synthases: a review. J. Comp. Physiol. B 2005, 176, 1–15. [Google Scholar] [CrossRef] [PubMed]
- Merzendorfer, H. The cellular basis of chitin synthesis in fungi and insects: Common principles and differences. Eur. J. Cell Biol. 2011, 90, 759–769. [Google Scholar] [CrossRef] [PubMed]
- Zhang, X.; Zhang, J.; Park, Y.; Zhu, K.Y. Identification and characterization of two chitin synthase genes in African malaria mosquito, Anopheles gambiae. Insect Biochem. Mol. Biol. 2012, 42, 674–682. [Google Scholar] [CrossRef] [PubMed]
- Merzendorfer, H.; Zimoch, L. Chitin metabolism in insects: structure, function and regulation of chitin synthases and chitinases. J. Exp. Biol. 2003, 206, 4393–4412. [Google Scholar] [CrossRef] [PubMed]
- Chen, J.; Tang, B.; Chen, H.; Yao, Q.; Huang, X.; Chen, J.; Zhang, D.; Zhang, W. Different Functions of the Insect Soluble and Membrane-Bound Trehalase Genes in Chitin Biosynthesis Revealed by RNA Interference. PLOS ONE 2010, 5, e10133. [Google Scholar] [CrossRef]
- Zhu, Q.; Arakane, Y.; Banerjee, D.; Beeman, R.W.; Kramer, K.J.; Muthukrishnan, S. Domain organization and phylogenetic analysis of the chitinase-like family of proteins in three species of insects. Insect Biochem. Mol. Biol. 2008, 38, 452–466. [Google Scholar] [CrossRef] [PubMed]
- Gagou, M.E.; Kapsetaki, M.; Turberg, A.; Kafetzopoulos, D. Stage-specific expression of the chitin synthase DmeChSA and DmeChSB genes during the onset of Drosophila metamorphosis. Insect Biochem. Mol. Biol. 2001, 32, 141–146. [Google Scholar] [CrossRef] [PubMed]
- Arakane, Y.; Specht, C.A.; Kramer, K.J.; Muthukrishnan, S.; Beeman, R.W. Chitin synthases are required for survival, fecundity and egg hatch in the red flour beetle, Tribolium castaneum. Insect Biochem. Mol. Biol. 2008, 38, 959–962. [Google Scholar] [CrossRef]
- Maue, L.; Meissner, D.; Merzendorfer, H. Purification of an active, oligomeric chitin synthase complex from the midgut of the tobacco hornworm. Insect Biochem. Mol. Biol. 2009, 39, 654–659. [Google Scholar] [CrossRef]
- Tellam R L, Vuocolo T, Johnson S E, Jarmey J, Pearson R D. 2000. Insect chitin synthase cDNA sequence, gene organization and expression. European Journal of Biochemistry, 267, 6025–6043.
- Arakane, Y.; Hogenkamp, D.G.; Zhu, Y.C.; Kramer, K.J.; Specht, C.A.; Beeman, R.W.; Kanost, M.R.; Muthukrishnan, S. Characterization of two chitin synthase genes of the red flour beetle, Tribolium castaneum, and alternate exon usage in one of the genes during development. Insect Biochem. Mol. Biol. 2004, 34, 291–304. [Google Scholar] [CrossRef]
- Zimoch, L.; Hogenkamp, D.; Kramer, K.; Muthukrishnan, S.; Merzendorfer, H. Regulation of chitin synthesis in the larval midgut of Manduca sexta. Insect Biochem. Mol. Biol. 2005, 35, 515–527. [Google Scholar] [CrossRef] [PubMed]
- Hopkins, T.L.; Harper, M.S. Lepidopteran peritrophic membranes and effects of dietary wheat germ agglutinin on their formation and structure. Arch. Insect Biochem. Physiol. 2001, 47, 100–109. [Google Scholar] [CrossRef] [PubMed]
- Maue, L.; Meissner, D.; Merzendorfer, H. Purification of an active, oligomeric chitin synthase complex from the midgut of the tobacco hornworm. Insect Biochem. Mol. Biol. 2009, 39, 654–659. [Google Scholar] [CrossRef]
- Mansur, J.F.; Alvarenga, E.S.; Figueira-Mansur, J.; Franco, T.A.; Ramos, I.B.; Masuda, H.; Melo, A.C.; Moreira, M.F. Effects of chitin synthase double-stranded RNA on molting and oogenesis in the Chagas disease vector Rhodnius prolixus. Insect Biochem. Mol. Biol. 2014, 51, 110–121. [Google Scholar] [CrossRef] [PubMed]
- Zhuo W, Chu F, Kong L, Tao H, Sima Y, Xu S. 2014. Chitin synthase B: A midgut-specific gene induced by insect hormones and involved in food intake in Bombyx mori larvae. Archives of Insect Biochemistry and Physiology, 85, 36–47.
- Senthil Kumar N, Tang B, Chen X, Tian H, Zhang W. 2008. Molecular cloning, expression pattern and comparative analysis of chitin synthase gene B in Spodoptera exigua. Comparative Biochemistry and Physiology Part B: Biochemistry and Molecular Biology, 149, 447–453.
- Yang, X.; Yin, Q.; Xu, Y.; Li, X.; Sun, Y.; Ma, L.; Zhou, D.; Shen, B. Molecular and physiological characterization of the chitin synthase B gene isolated from Culex pipiens pallens (Diptera: Culicidae). Parasites Vectors 2019, 12, 1–11. [Google Scholar] [CrossRef] [PubMed]
- Zhang, Z.-J.; Xia, L.; Du, J.; Li, S.-W.; Zhao, F. Cloning, characterization, and RNAi effect of the chitin synthase B gene in Cnaphalocrocis medinalis. J. Asia-Pacific Èntomol. 2020, 24, 486–492. [Google Scholar] [CrossRef]
- Liu, X.; Zhang, H.; Li, S.; Zhu, K.Y.; Ma, E.; Zhang, J. Characterization of a midgut-specific chitin synthase gene (LmCHS2) responsible for biosynthesis of chitin of peritrophic matrix in Locusta migratoria. Insect Biochem. Mol. Biol. 2012, 42, 902–910. [Google Scholar] [CrossRef]
- Arakane, Y.; Muthukrishnan, S.; Kramer, K.J.; Specht, C.A.; Tomoyasu, Y.; Lorenzen, M.D.; Kanost, M.; Beeman, R.W. The Tribolium chitin synthase genes TcCHS1 and TcCHS2 are specialized for synthesis of epidermal cuticle and midgut peritrophic matrix. Insect Mol. Biol. 2005, 14, 453–463. [Google Scholar] [CrossRef]
- Senthil Kumar N, Tang B, Chen X, Tian H, Zhang W. 2008. Molecular cloning, expression pattern and comparative analysis of chitin synthase gene B in Spodoptera exigua. Comparative Biochemistry and Physiology Part B: Biochemistry and Molecular Biology, 149, 447–453.
- Qu, M.; Liu, T.; Yang, J.; Yang, Q. The gene, expression pattern and subcellular localization of chitin synthase B from the insect Ostrinia furnacalis. Biochem. Biophys. Res. Commun. 2011, 404, 302–307. [Google Scholar] [CrossRef]
- Zhuo, W.; Fang, Y.; Kong, L.; Li, X.; Sima, Y.; Xu, S. Chitin synthase A: a novel epidermal development regulation gene in the larvae of Bombyx mori. Mol. Biol. Rep. 2014, 41, 4177–4186. [Google Scholar] [CrossRef]
- Zhou, M.; Wang, H.; Suolangjiba; Kou, J. ; Yu, B. Antinociceptive and anti-inflammatory activities of Aquilaria sinensis (Lour.) Gilg. Leaves extract. J. Ethnopharmacol. 2008, 117, 345–350. [Google Scholar] [CrossRef] [PubMed]
- Wu, Y.; Li, E.; Li, Y.; Wu, Q.; Tian, W.; Liu, K.; Niu, Y.; Wang, D.; Liu, J.-G.; Hu, Y. Iriflophenone Glycosides from Aquilaria sinensis. Chem. Nat. Compd. 2016, 52, 834–837. [Google Scholar] [CrossRef]
- Qiao H, Lu P, Chen J, Ma W, Qin R, Li X. 2012. Antennal and behavioural responses of Heortia vitessoides females to host plant volatiles of Aquilaria sinensis. Entomologia Experimentalis et Applicata, 143, 269–279.
- Cheng, J.; Chen, J.; Lin, T. De novo assembly and analysis of the Heortia vitessoides transcriptome via high-throughput Illumina sequencing. J. Asia-Pacific Èntomol. 2017, 20, 1241–1248. [Google Scholar] [CrossRef]
- Cheng J, Wang C Y, Lyu Z H, Chen J X, Lin T. 2018. Identification and characterization of the catalase gene involved in resistance to thermal stress in Heortia vitessoides using RNA interference. Journal of Thermal Biology, 78, 114–121.
- Livak K J, Schmittgen T D. 2001. Analysis of relative gene expression data using real-time quantitative PCR and the 2-ΔΔCT method. Methods, 25, 402–408.
- Cohen, E. Chitin synthesis and inhibition: a revisit. Pest Manag. Sci. 2001, 57, 946–950. [Google Scholar] [CrossRef] [PubMed]
- Doucet D, Retnakaran A. 2012. Chapter Six - Insect Chitin: Metabolism, genomics and pest management. Advances in Insect Physiology, 43, 437–511.
- Wang, G.; Gou, Y.; Guo, S.; Zhou, J.-J.; Liu, C. RNA interference of trehalose-6-phosphate synthase and trehalase genes regulates chitin metabolism in two color morphs of Acyrthosiphon pisum Harris. Sci. Rep. 2021, 11, 1–12. [Google Scholar] [CrossRef] [PubMed]
- Hogenkamp, D.G.; Arakane, Y.; Zimoch, L.; Merzendorfer, H.; Kramer, K.J.; Beeman, R.W.; Kanost, M.R.; Specht, C.A.; Muthukrishnan, S. Chitin synthase genes in Manduca sexta: characterization of a gut-specific transcript and differential tissue expression of alternately spliced mRNAs during development. Insect Biochem. Mol. Biol. 2005, 35, 529–540. [Google Scholar] [CrossRef] [PubMed]
- Bolognesi, R.; Arakane, Y.; Muthukrishnan, S.; Kramer, K.J.; Terra, W.R.; Ferreira, C. Sequences of cDNAs and expression of genes encoding chitin synthase and chitinase in the midgut of Spodoptera frugiperda. Insect Biochem. Mol. Biol. 2005, 35, 1249–1259. [Google Scholar] [CrossRef]
- Chen, X.; Yang, X.; Kumar, N.S.; Tang, B.; Sun, X.; Qiu, X.; Hu, J.; Zhang, W. The class A chitin synthase gene of Spodoptera exigua: Molecular cloning and expression patterns. Insect Biochem. Mol. Biol. 2007, 37, 409–417. [Google Scholar] [CrossRef]
- McPhee, C.K.; Baehrecke, E.H. Autophagy in Drosophila melanogaster. Biochim. et Biophys. Acta (BBA) - Mol. Cell Res. 2009, 1793, 1452–1460. [Google Scholar] [CrossRef]
- Jin, X.; Ma, T.; Chang, M.; Wu, Y.; Liu, Z.; Sun, Z.; Shan, T.; Chen, X.; Wen, X.; Wang, C. Aggregation and Feeding Preference of GregariousHeortia vitessoides(Lepidoptera: Crambidae) Larvae toAquilaria sinensis(Thymelaeaceae). J. Èntomol. Sci. 2016, 51, 209–218. [Google Scholar] [CrossRef]
- Blüthgen N, Metzner A. 2007. Contrasting leaf age preferences of specialist and generalist stick insects (Phasmida). Oikos, 116, 1853–1862.
- Chen L, Yang W J, Cong L, Xu K K, Wang J J. 2013. Molecular cloning, characterization and mRNA expression of a chitin synthase 2 gene from the oriental fruit fly, Bactrocera dorsalis (Diptera: Tephritidae). International Journal of Molecular Sciences, 14, 17055–17072.
- Ibrahim, G.H.; Smartt, C.T.; Kiley, L.M.; Christensen, B.M. Cloning and characterization of a chitin synthase cDNA from the mosquito Aedes aegypti. Insect Biochem. Mol. Biol. 2000, 30, 1213–1222. [Google Scholar] [CrossRef] [PubMed]
- Lehane, M.J. PERITROPHIC MATRIX STRUCTURE AND FUNCTION. Annu. Rev. Èntomol. 1997, 42, 525–550. [Google Scholar] [CrossRef] [PubMed]
- Shao Z M, Li Y J, Ding J H, Liu Z X, Zhang X R, Wang J, Sheng S, Wu F A. 2020. Identification, characterization, and functional analysis of chitin synthase genes in Glyphodes pyloalis walker (Lepidoptera: Pyralidae). International Journal of Molecular Sciences, 21, 4656.
- Terenius, O.; Papanicolaou, A.; Garbutt, J.S.; Eleftherianos, I.; Huvenne, H.; Kanginakudru, S.; Albrechtsen, M.; An, C.; Aymeric, J.-L.; Barthel, A.; et al. RNA interference in Lepidoptera: An overview of successful and unsuccessful studies and implications for experimental design. J. Insect Physiol. 2011, 57, 231–245. [Google Scholar] [CrossRef]
- Lyu, Z.; Chen, J.; Li, Z.; Cheng, J.; Wang, C.; Lin, T. Knockdown of β-N-acetylglucosaminidase gene disrupts molting process in Heortia vitessoides Moore. Arch. Insect Biochem. Physiol. 2019, 101, e21561. [Google Scholar] [CrossRef] [PubMed]
- Li Z, Lyu Z, Ye Q, Cheng J, Wang C, Lin T. 2020. Cloning, expression analysis, 20-hydroxyecdysone induction, and RNA interference study of autophagy-related gene 8 from Heortia vitessoides Moore. Insects, 11.
- Ostrowski S, Dierick H A, Bejsovec A. 2002. Geneticcontrol of cuticle formation during embryonic development of Drosophila melanogaster. Genetics, 161, 171–182.
- Zhu, Y.-C.; Specht, C.A.; Dittmer, N.T.; Muthukrishnan, S.; Kanost, M.R.; Kramer, K.J. Sequence of a cDNA and expression of the gene encoding a putative epidermal chitin synthase of Manduca sexta. Insect Biochem. Mol. Biol. 2002, 32, 1497–1506. [Google Scholar] [CrossRef]
- Kelkenberg, M.; Odman-Naresh, J.; Muthukrishnan, S.; Merzendorfer, H. Chitin is a necessary component to maintain the barrier function of the peritrophic matrix in the insect midgut. Insect Biochem. Mol. Biol. 2015, 56, 21–28. [Google Scholar] [CrossRef]
- Shi J F, Mu L L, Chen X, Guo W C, Li G Q. 2016. RNA interference of chitin synthase genes inhibits chitin biosynthesis and affects larval performance in Leptinotarsa decemlineata (Say). International Journal of Biological Sciences, 12, 1319–1331.
- Khajuria, C.; Buschman, L.L.; Chen, M.-S.; Muthukrishnan, S.; Zhu, K.Y. A gut-specific chitinase gene essential for regulation of chitin content of peritrophic matrix and growth of Ostrinia nubilalis larvae. Insect Biochem. Mol. Biol. 2010, 40, 621–629. [Google Scholar] [CrossRef]
- Zimoch, L.; Merzendorfer, H. Immunolocalization of chitin synthase in the tobacco hornworm. Cell Tissue Res. 2002, 308, 287–297. [Google Scholar] [CrossRef]
Figure 1.
The amino acid sequence of HvChsb from H. vitessoides.
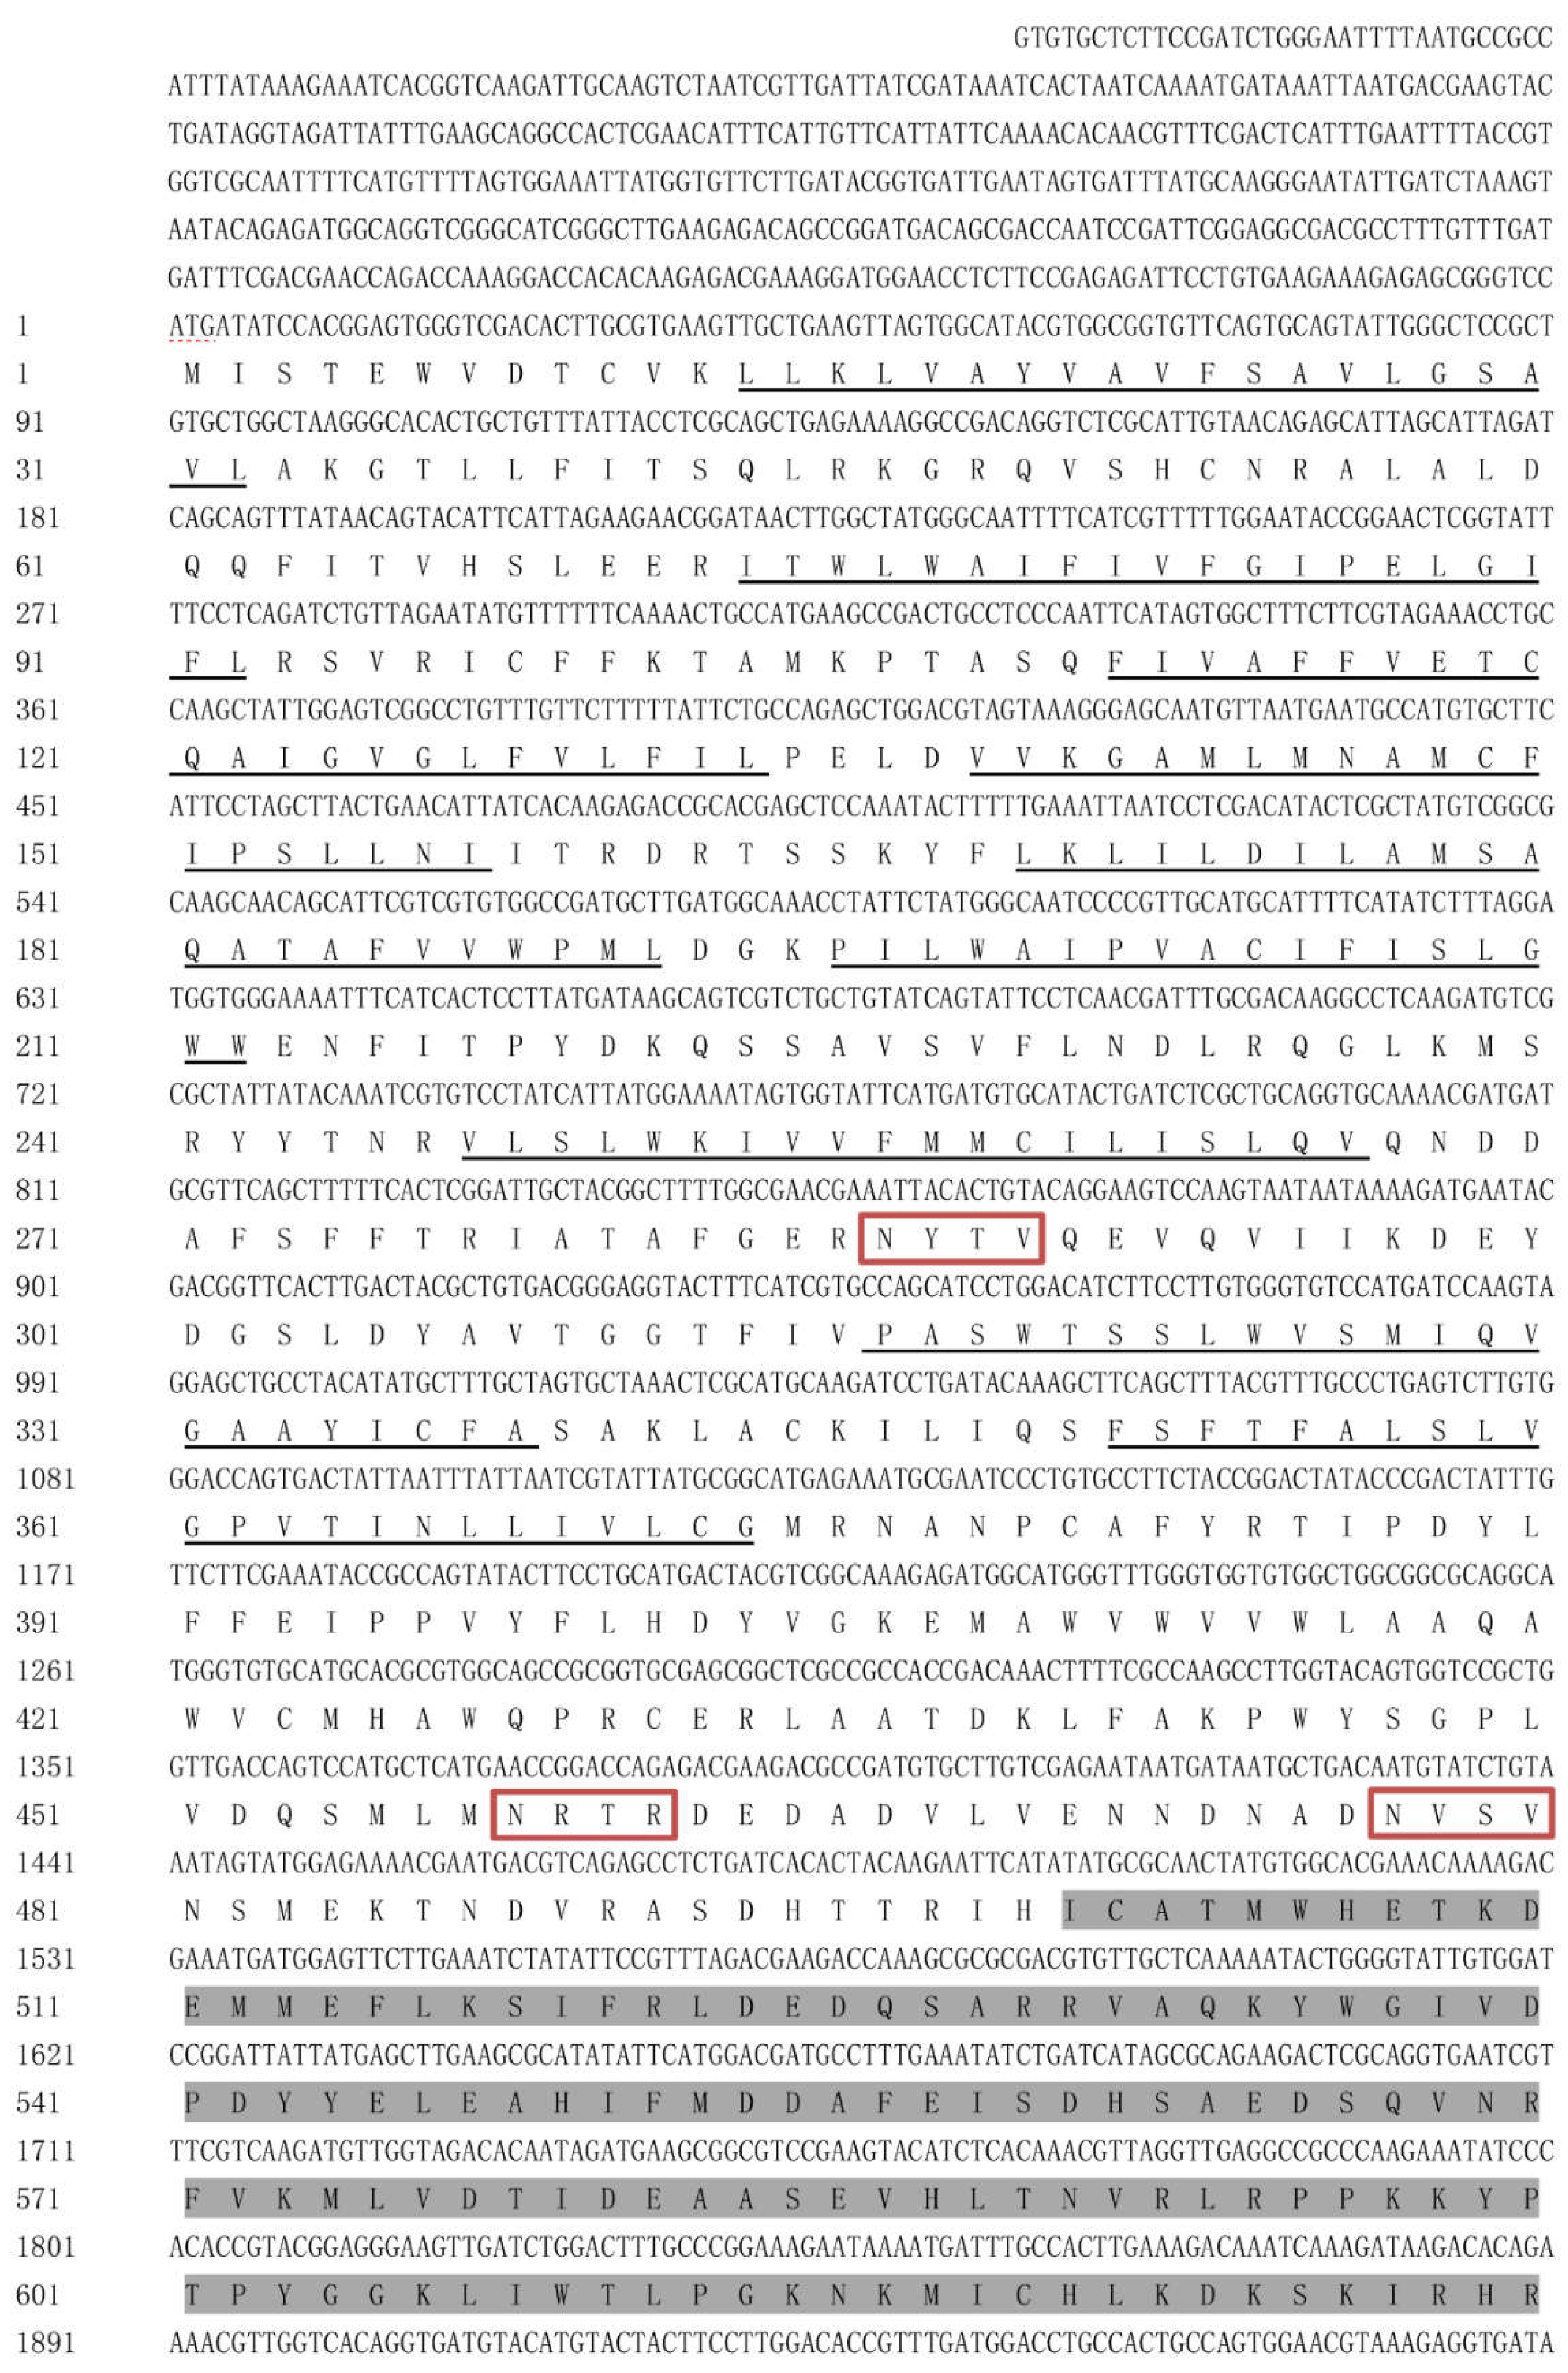
Figure 2.
Sequence alignment of HvChsb with insect homologs. The amino acid residues that are identical in all sequences are shown by dark shading, whereas light shading indicates at least 75% identical amino acids in all sequences. The aligned sequences are the predicted amino acid sequences of Chsbs from H. vitessoides (HvChsb GenBank accession number ON783456), Helicoverpa armigera (HaChsb AKZ08595.1), Cnaphalocrocis medinalis (CmChsb AJG44539.1), Mythimna separata (MsChsb ASF79498.1), Tribolium castaneum (TcChsb AAQ55061.1), Bactrocera dorsalis (BdChsb KC354694.1), and Locusta migratoria (LmChsb JQ901491.1).
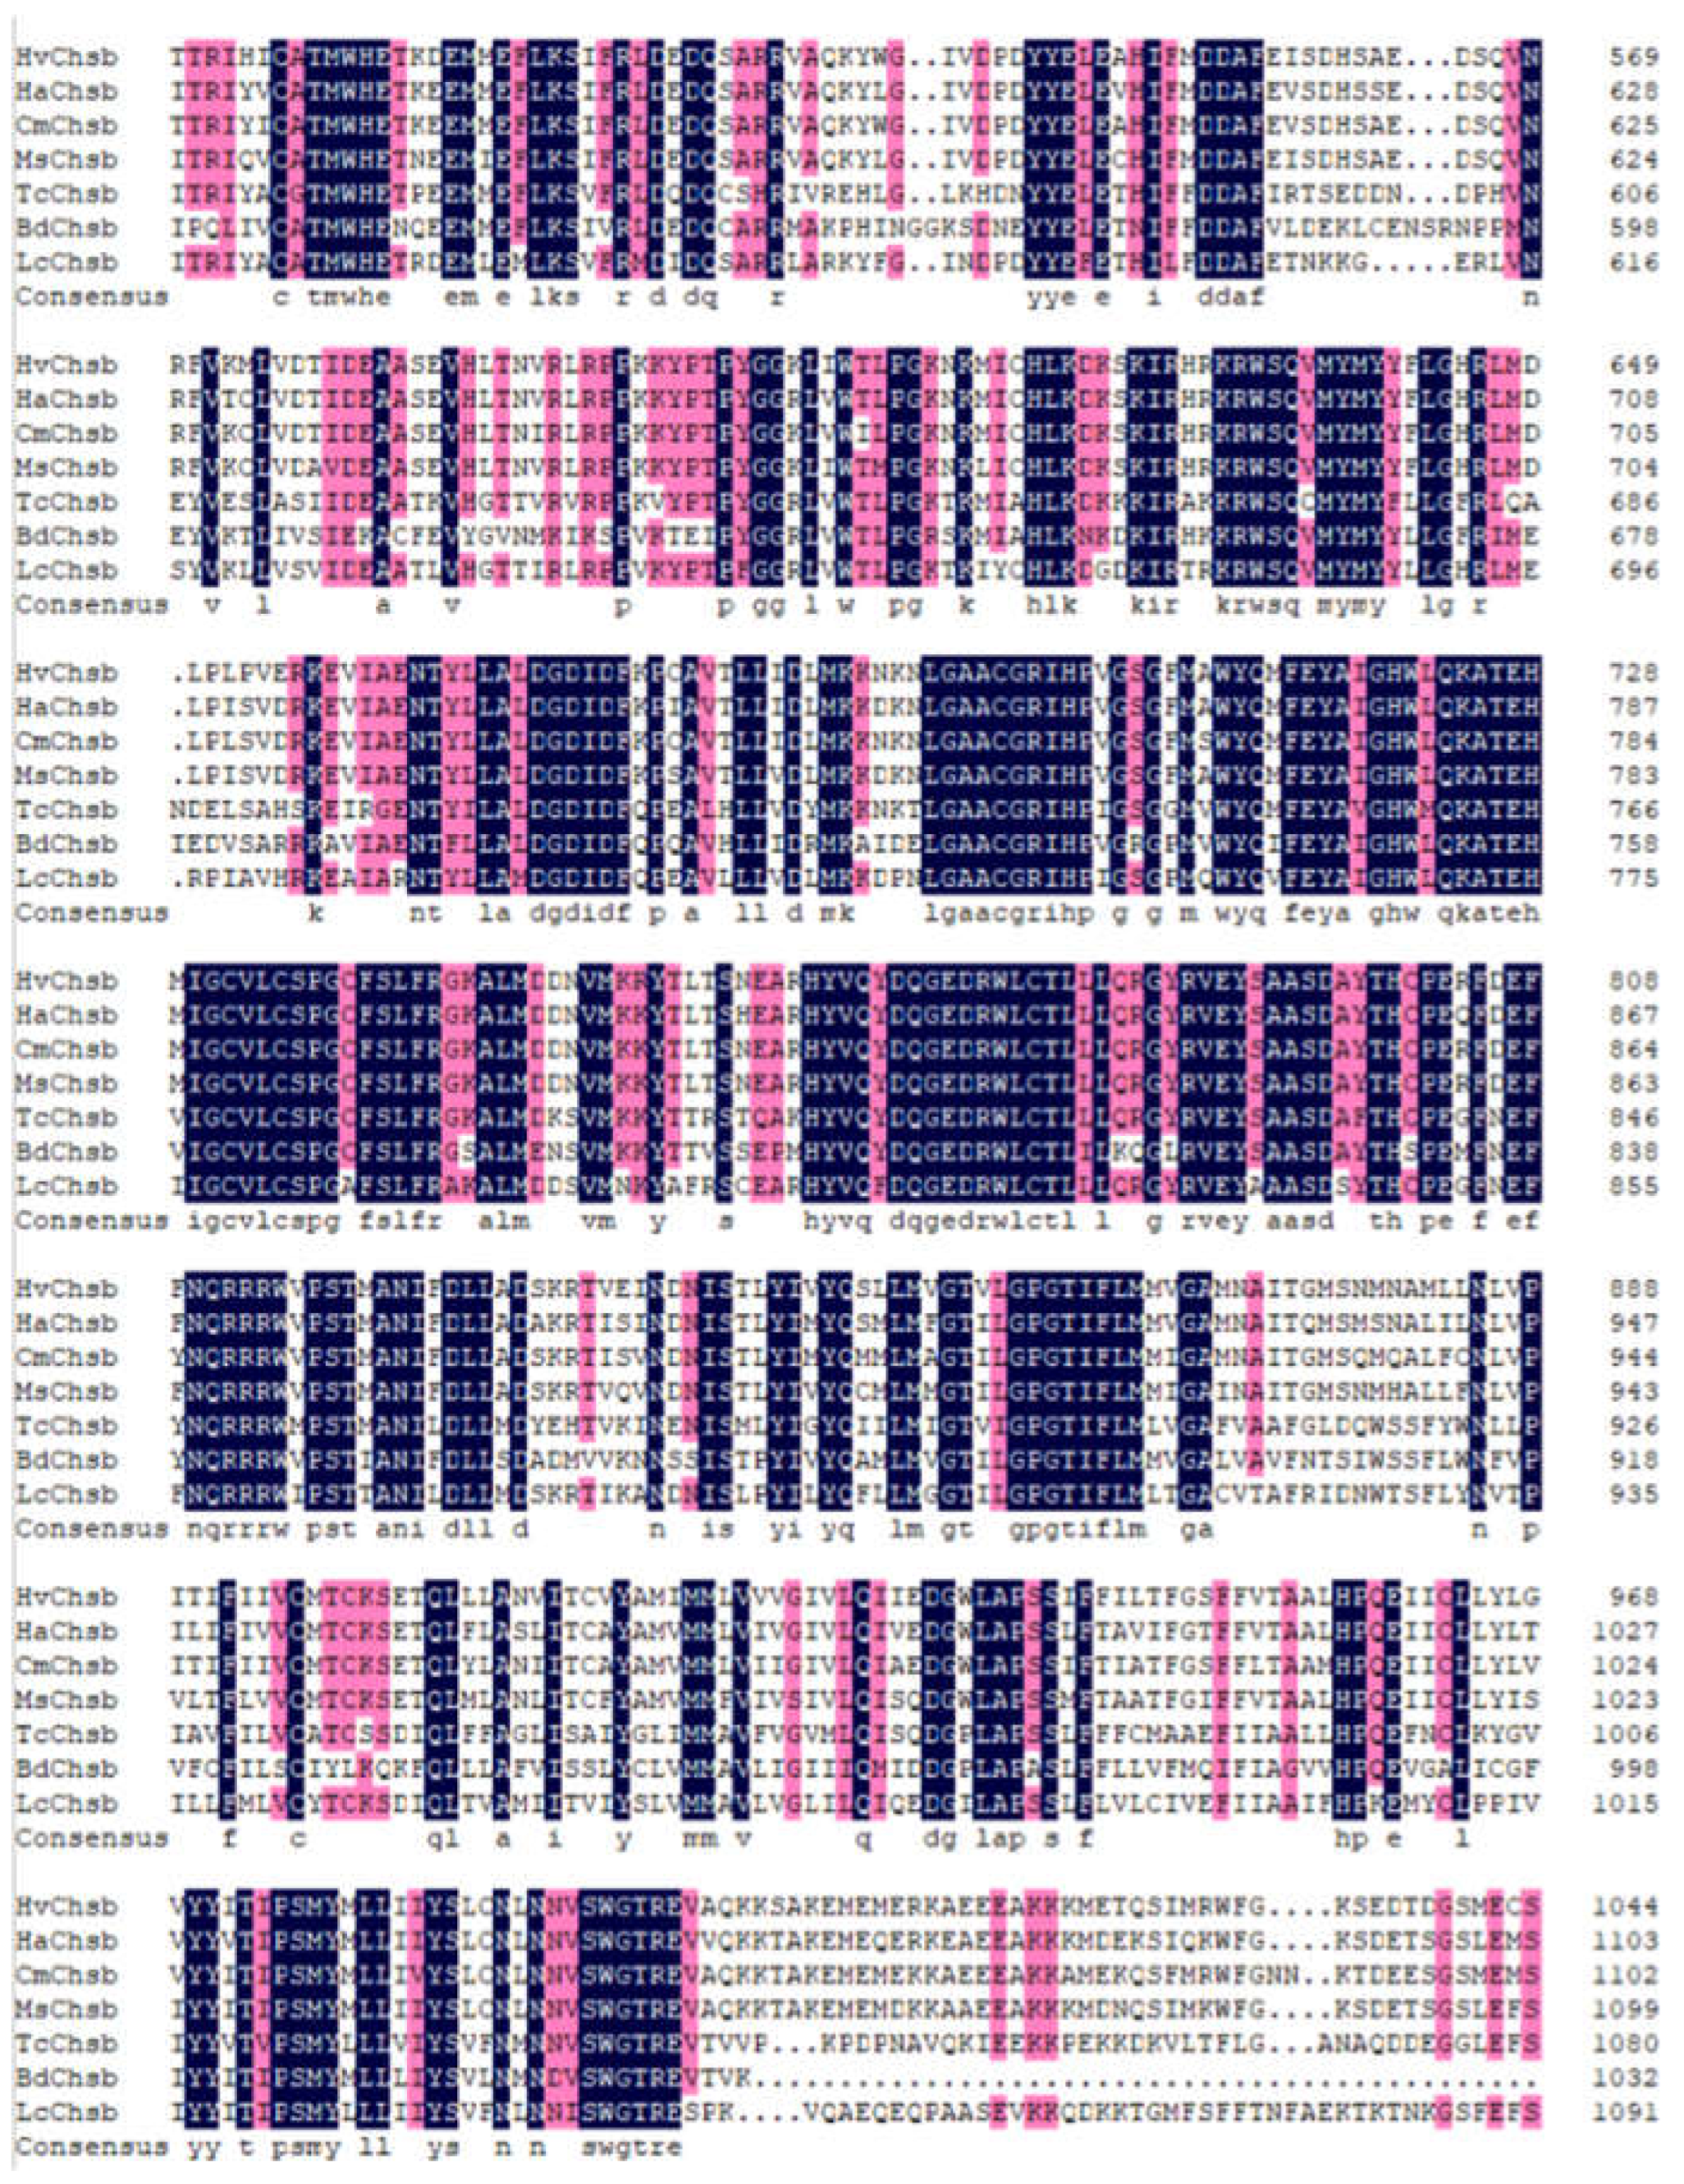
Figure 3.
Phylogenetic analysis of HvChsb. The predicted amino acid sequences of HvChsb together with 14 selected Chsb members were aligned and a phylogenetic tree was constructed using MEGAX. GenBank accession numbers are as follows: HaChsb, H. armigera (AKZ08595.1); HzChsb, H. zae (ADX66427.1); MsChsb, M. separata (ASF79498.1); SeChsb, S. exigua (ABI96087.1); SfChsb, S. frugiperda (AY525599.1); MsChsb, M. sexta (AY821560.1); CmChsb, C. medinalis (AJG44539.1); BmChsb, B. mori (AFC69002.1); LmChsb, L. migratoria (JQ901491.1); TcChsb, T. castaneum (AAQ55061.1); BdChsb, B. dorsalis (KC354694.1); DmChsb, D. melanogaster (NP_001137997.2); DpChsb, D. pseudoobscura (XP_001352881.4); and AmChsb, A. mellifera (XP_001121152.2).
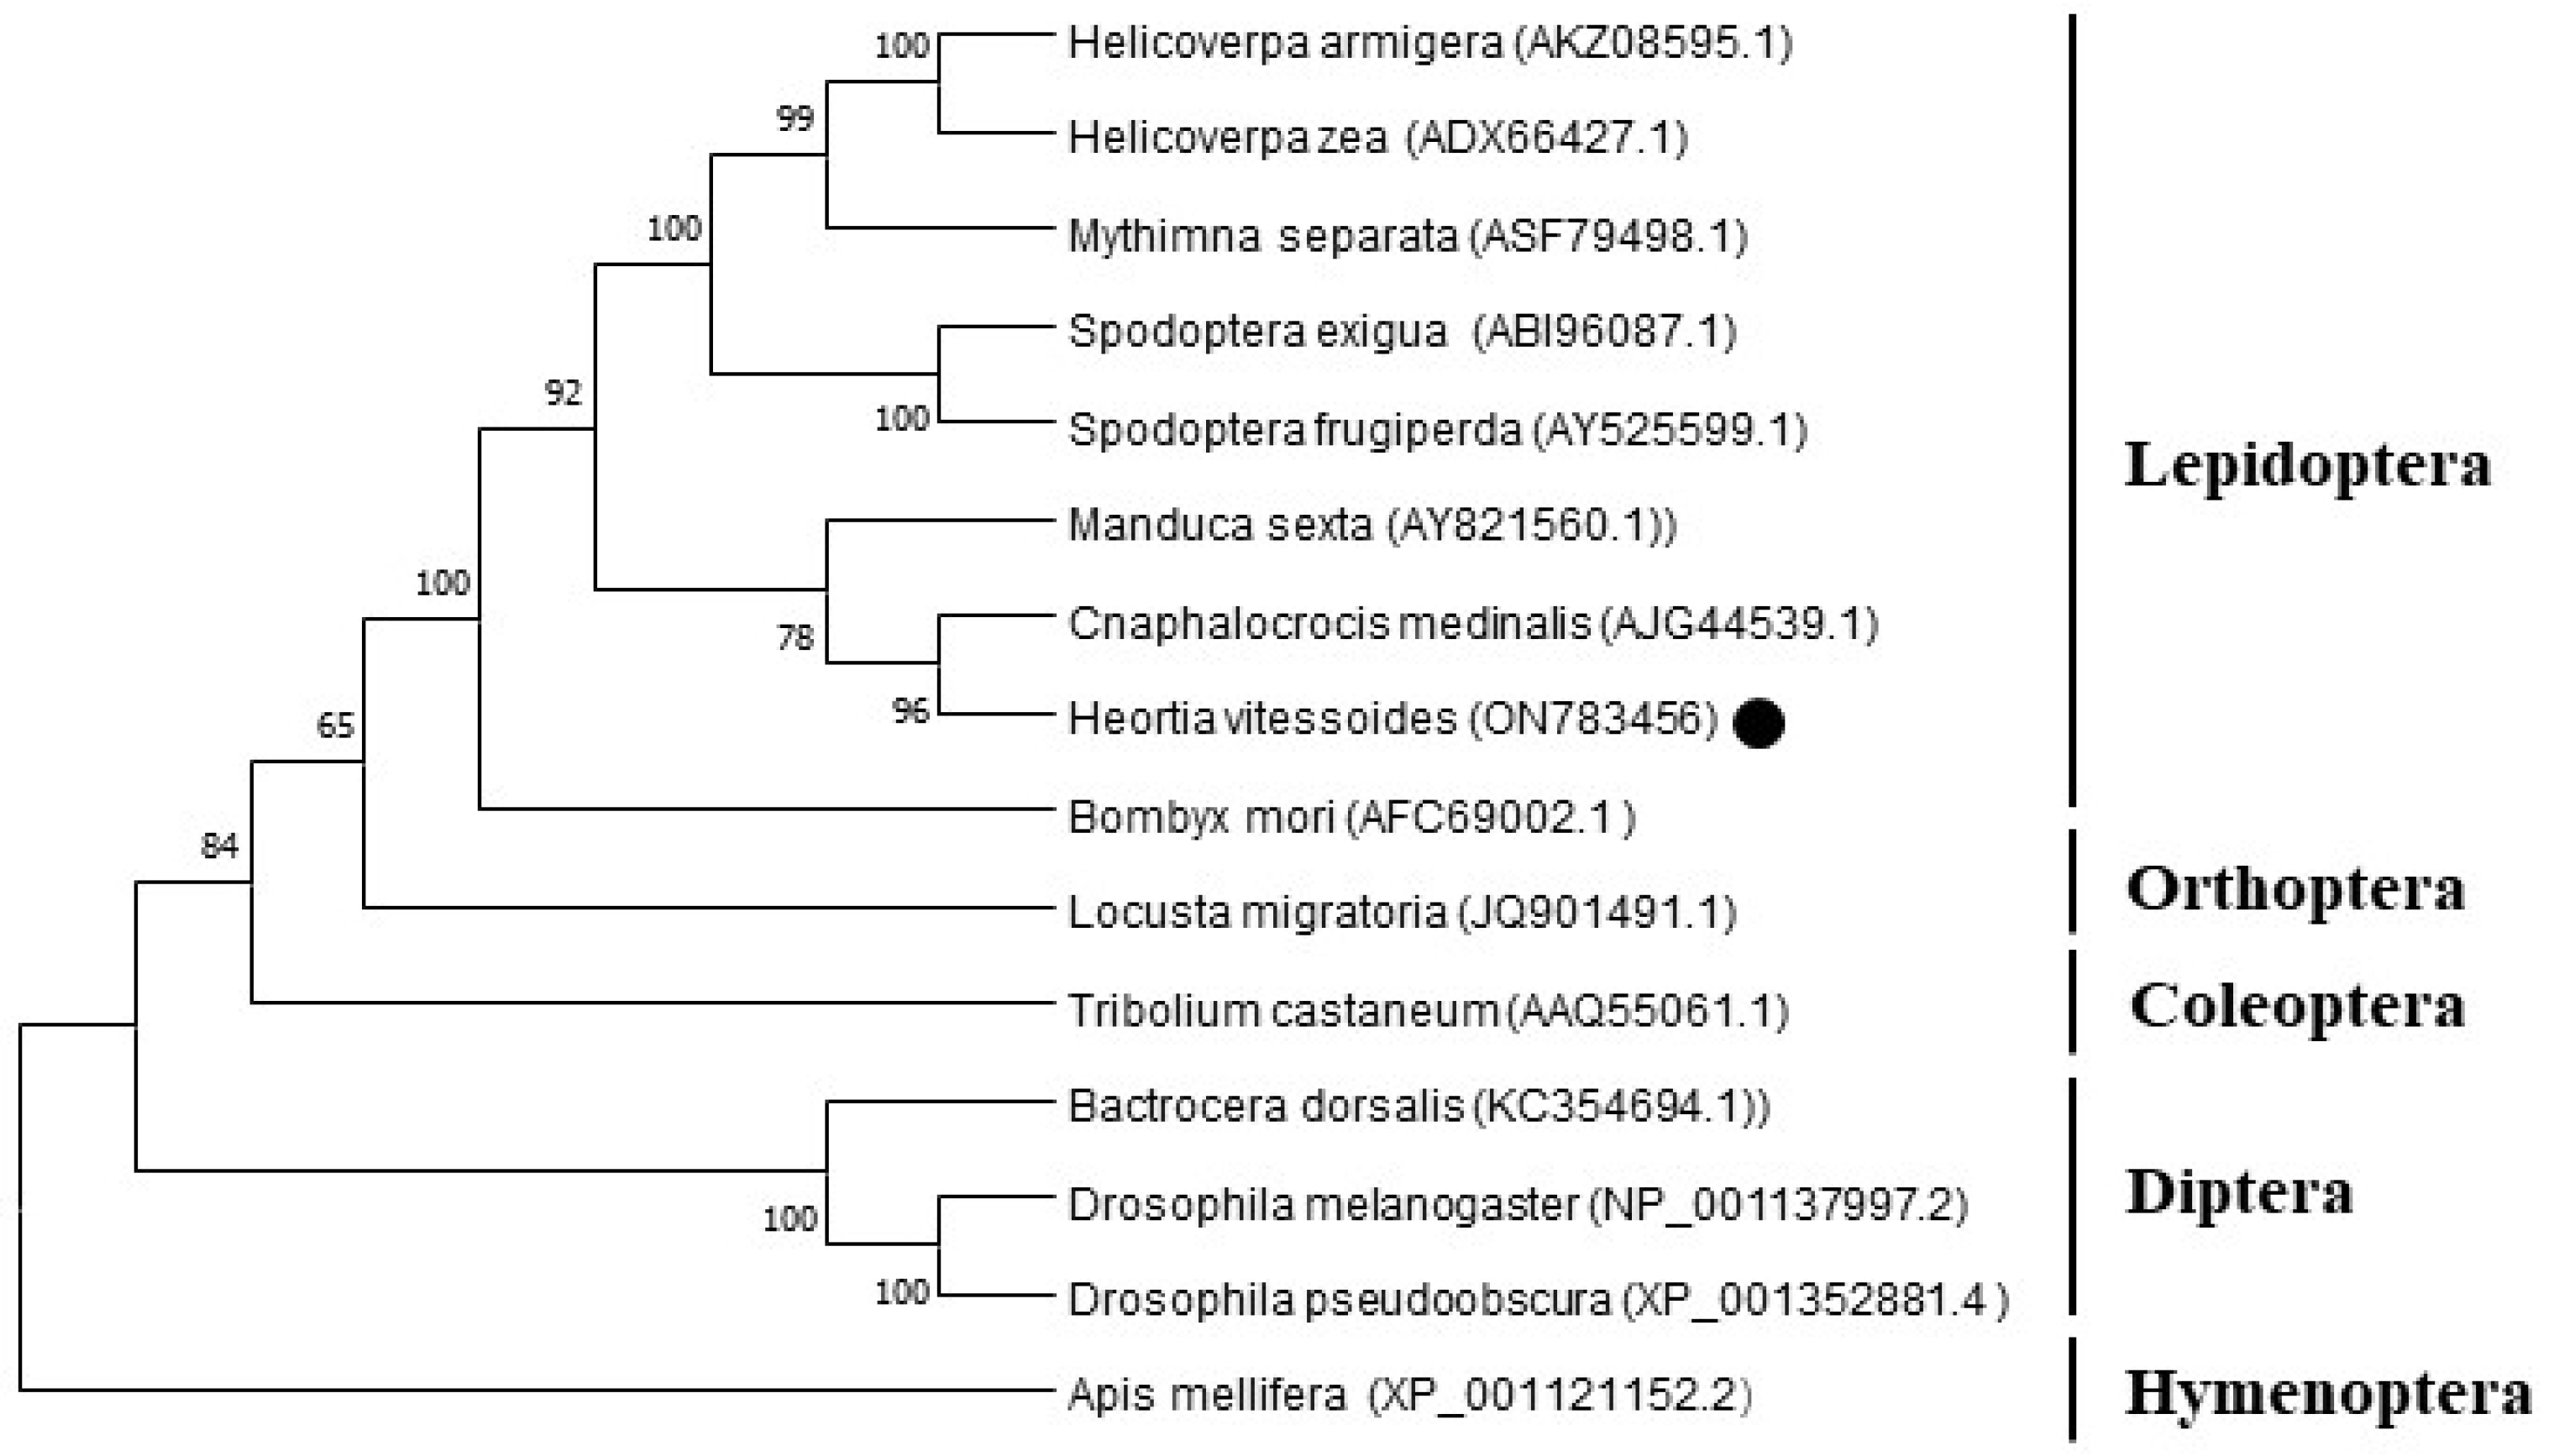
Figure 4.
Relative expression levels of HvChsb at different stages: L1–L5, first- to fifth-instar larvae; PP1–PP3, 1-day-old to 4-day-old prepupae; P1–P3, 1-day-old to 3-day-old pupae; A1, 1-day-old adults. Error bars represent mean ± standard error of three biological replicates. Different letters above error bars indicate significant differences (P < 0.05) based on one-way ANOVA and Tukey’s test.
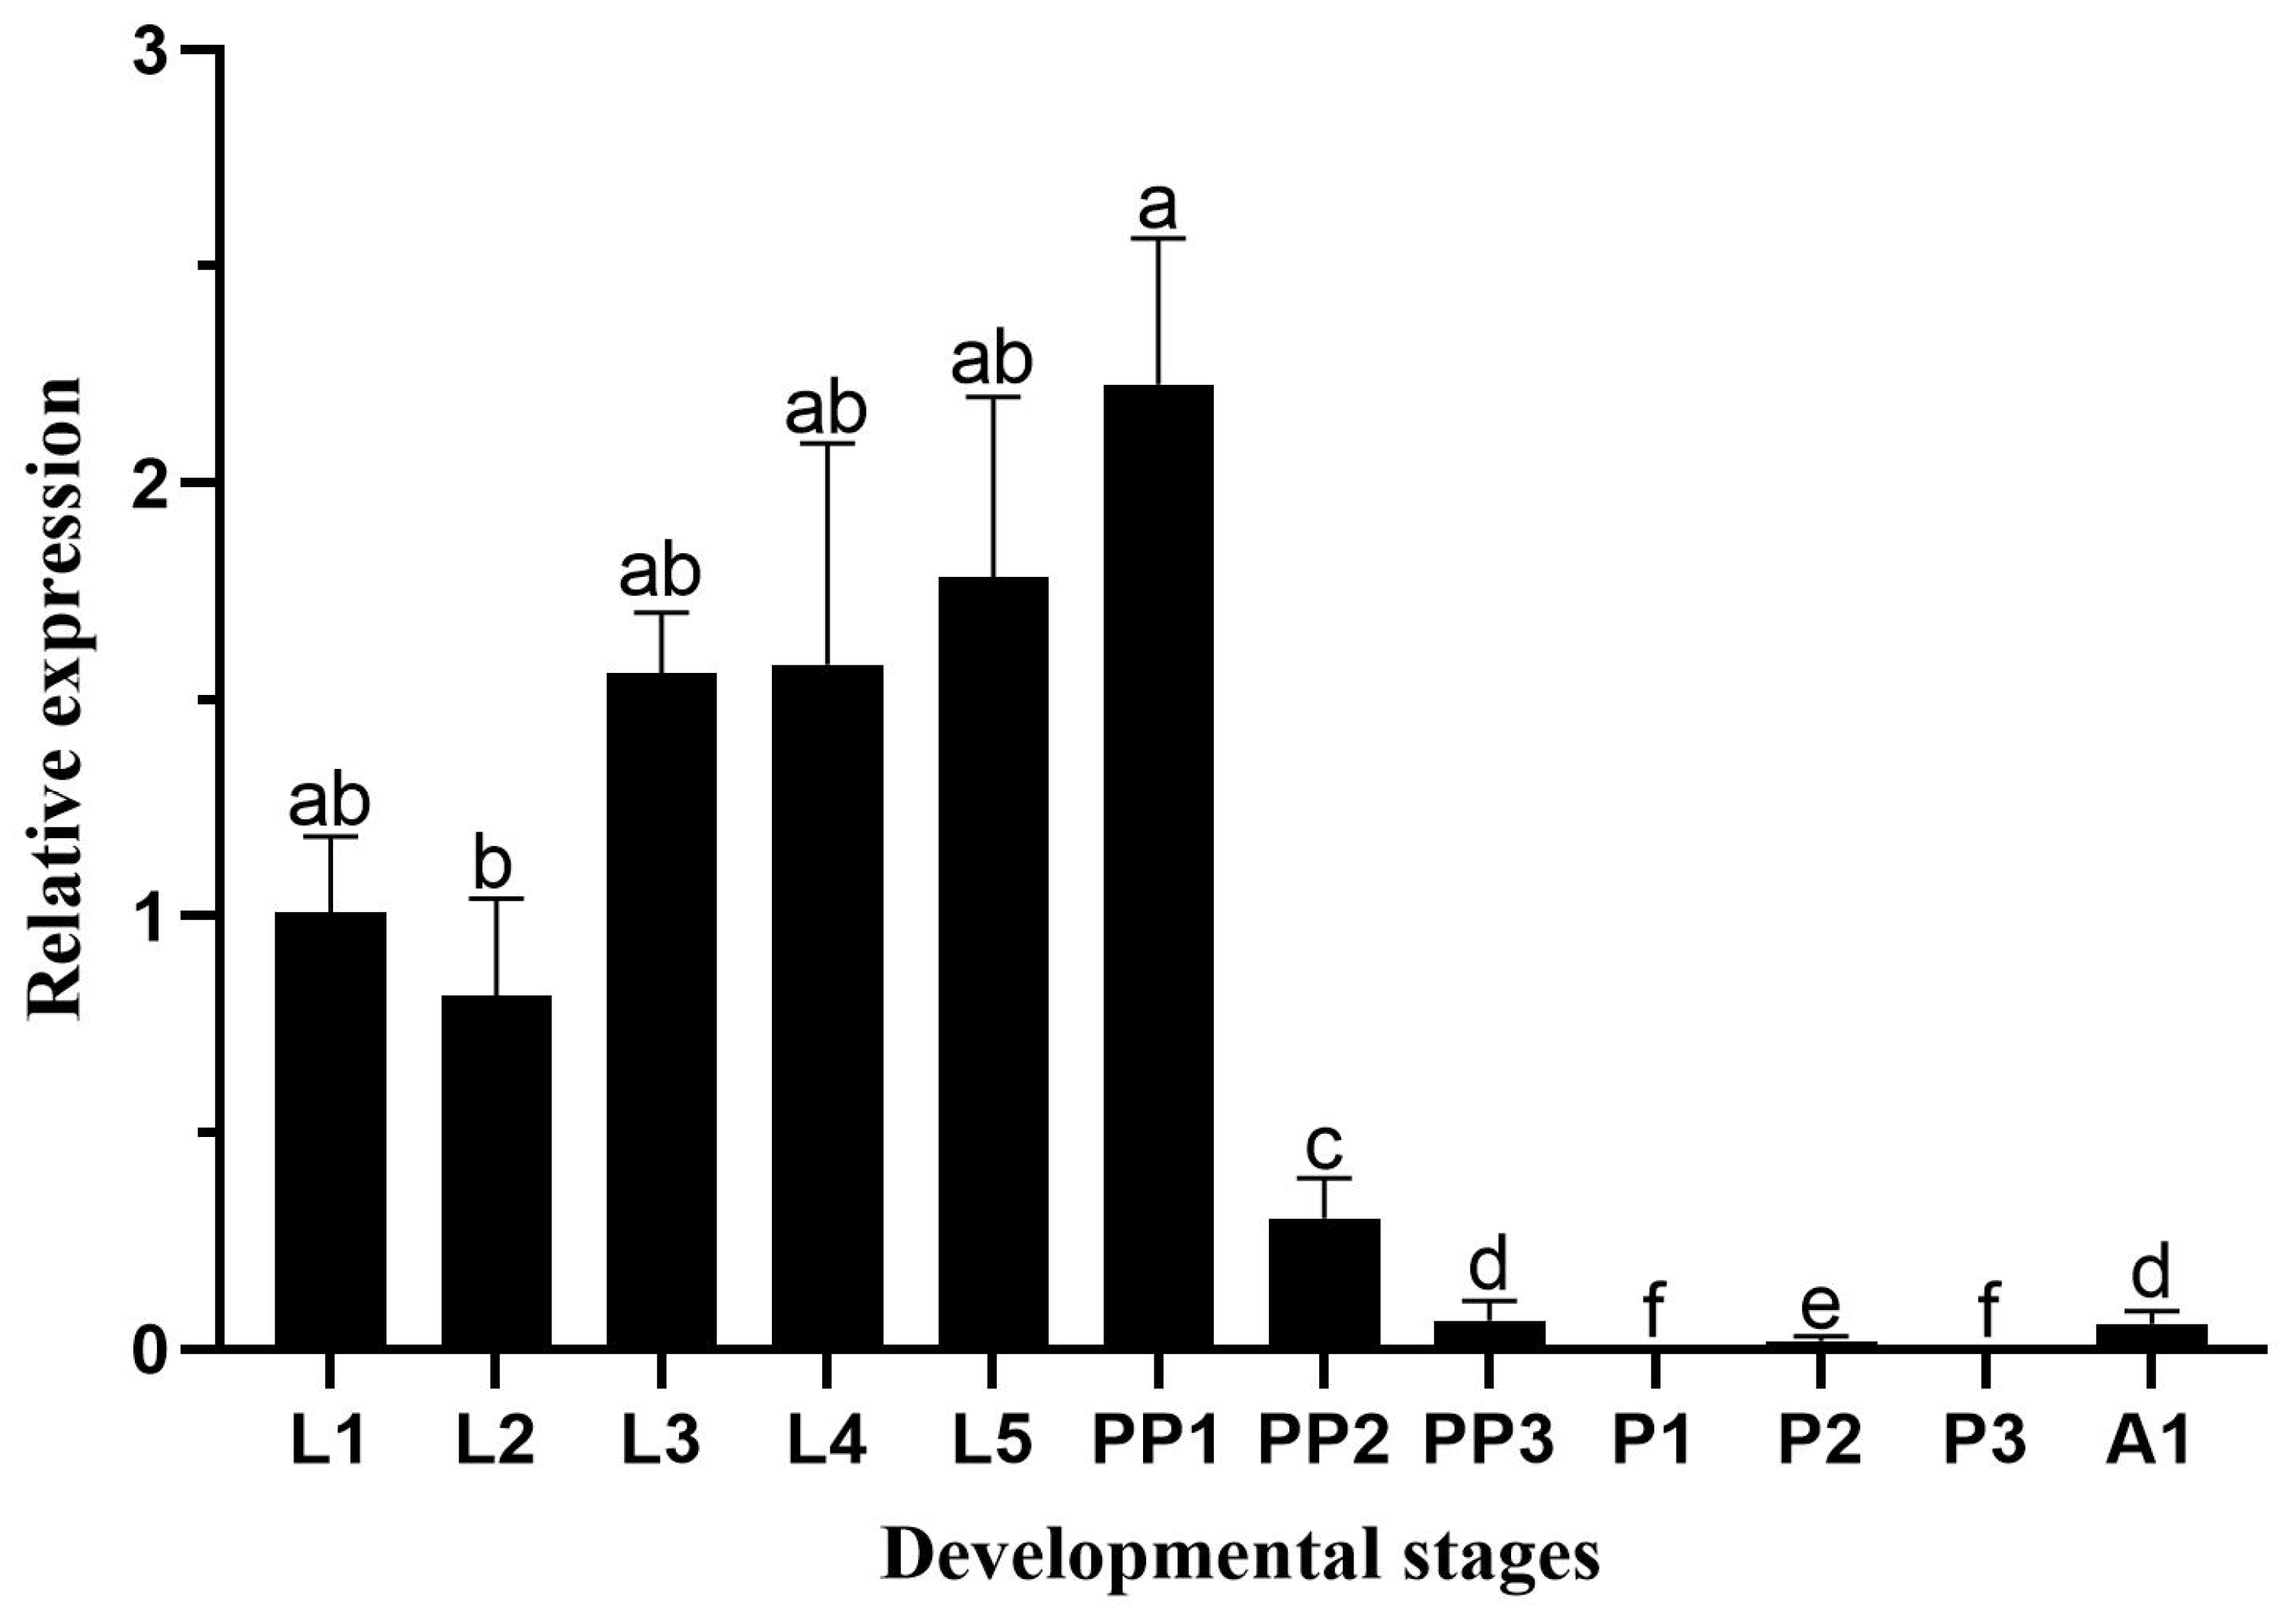
Figure 5.
Relative expression levels of HvChsb in different larval tissues (Tissue anatomy for the fifth-instar larvae). Relative expression in larval tissues: HD, head; EP, epidermis; FG, foregut; MG, midgut; HG, hindgut; and FB, fat body. Error bars represent mean ± standard error of three biological replicates. Different letters above error bars indicate significant differences (P < 0.05), based on one-way analysis of variance (ANOVA) followed by Tukey’s test.
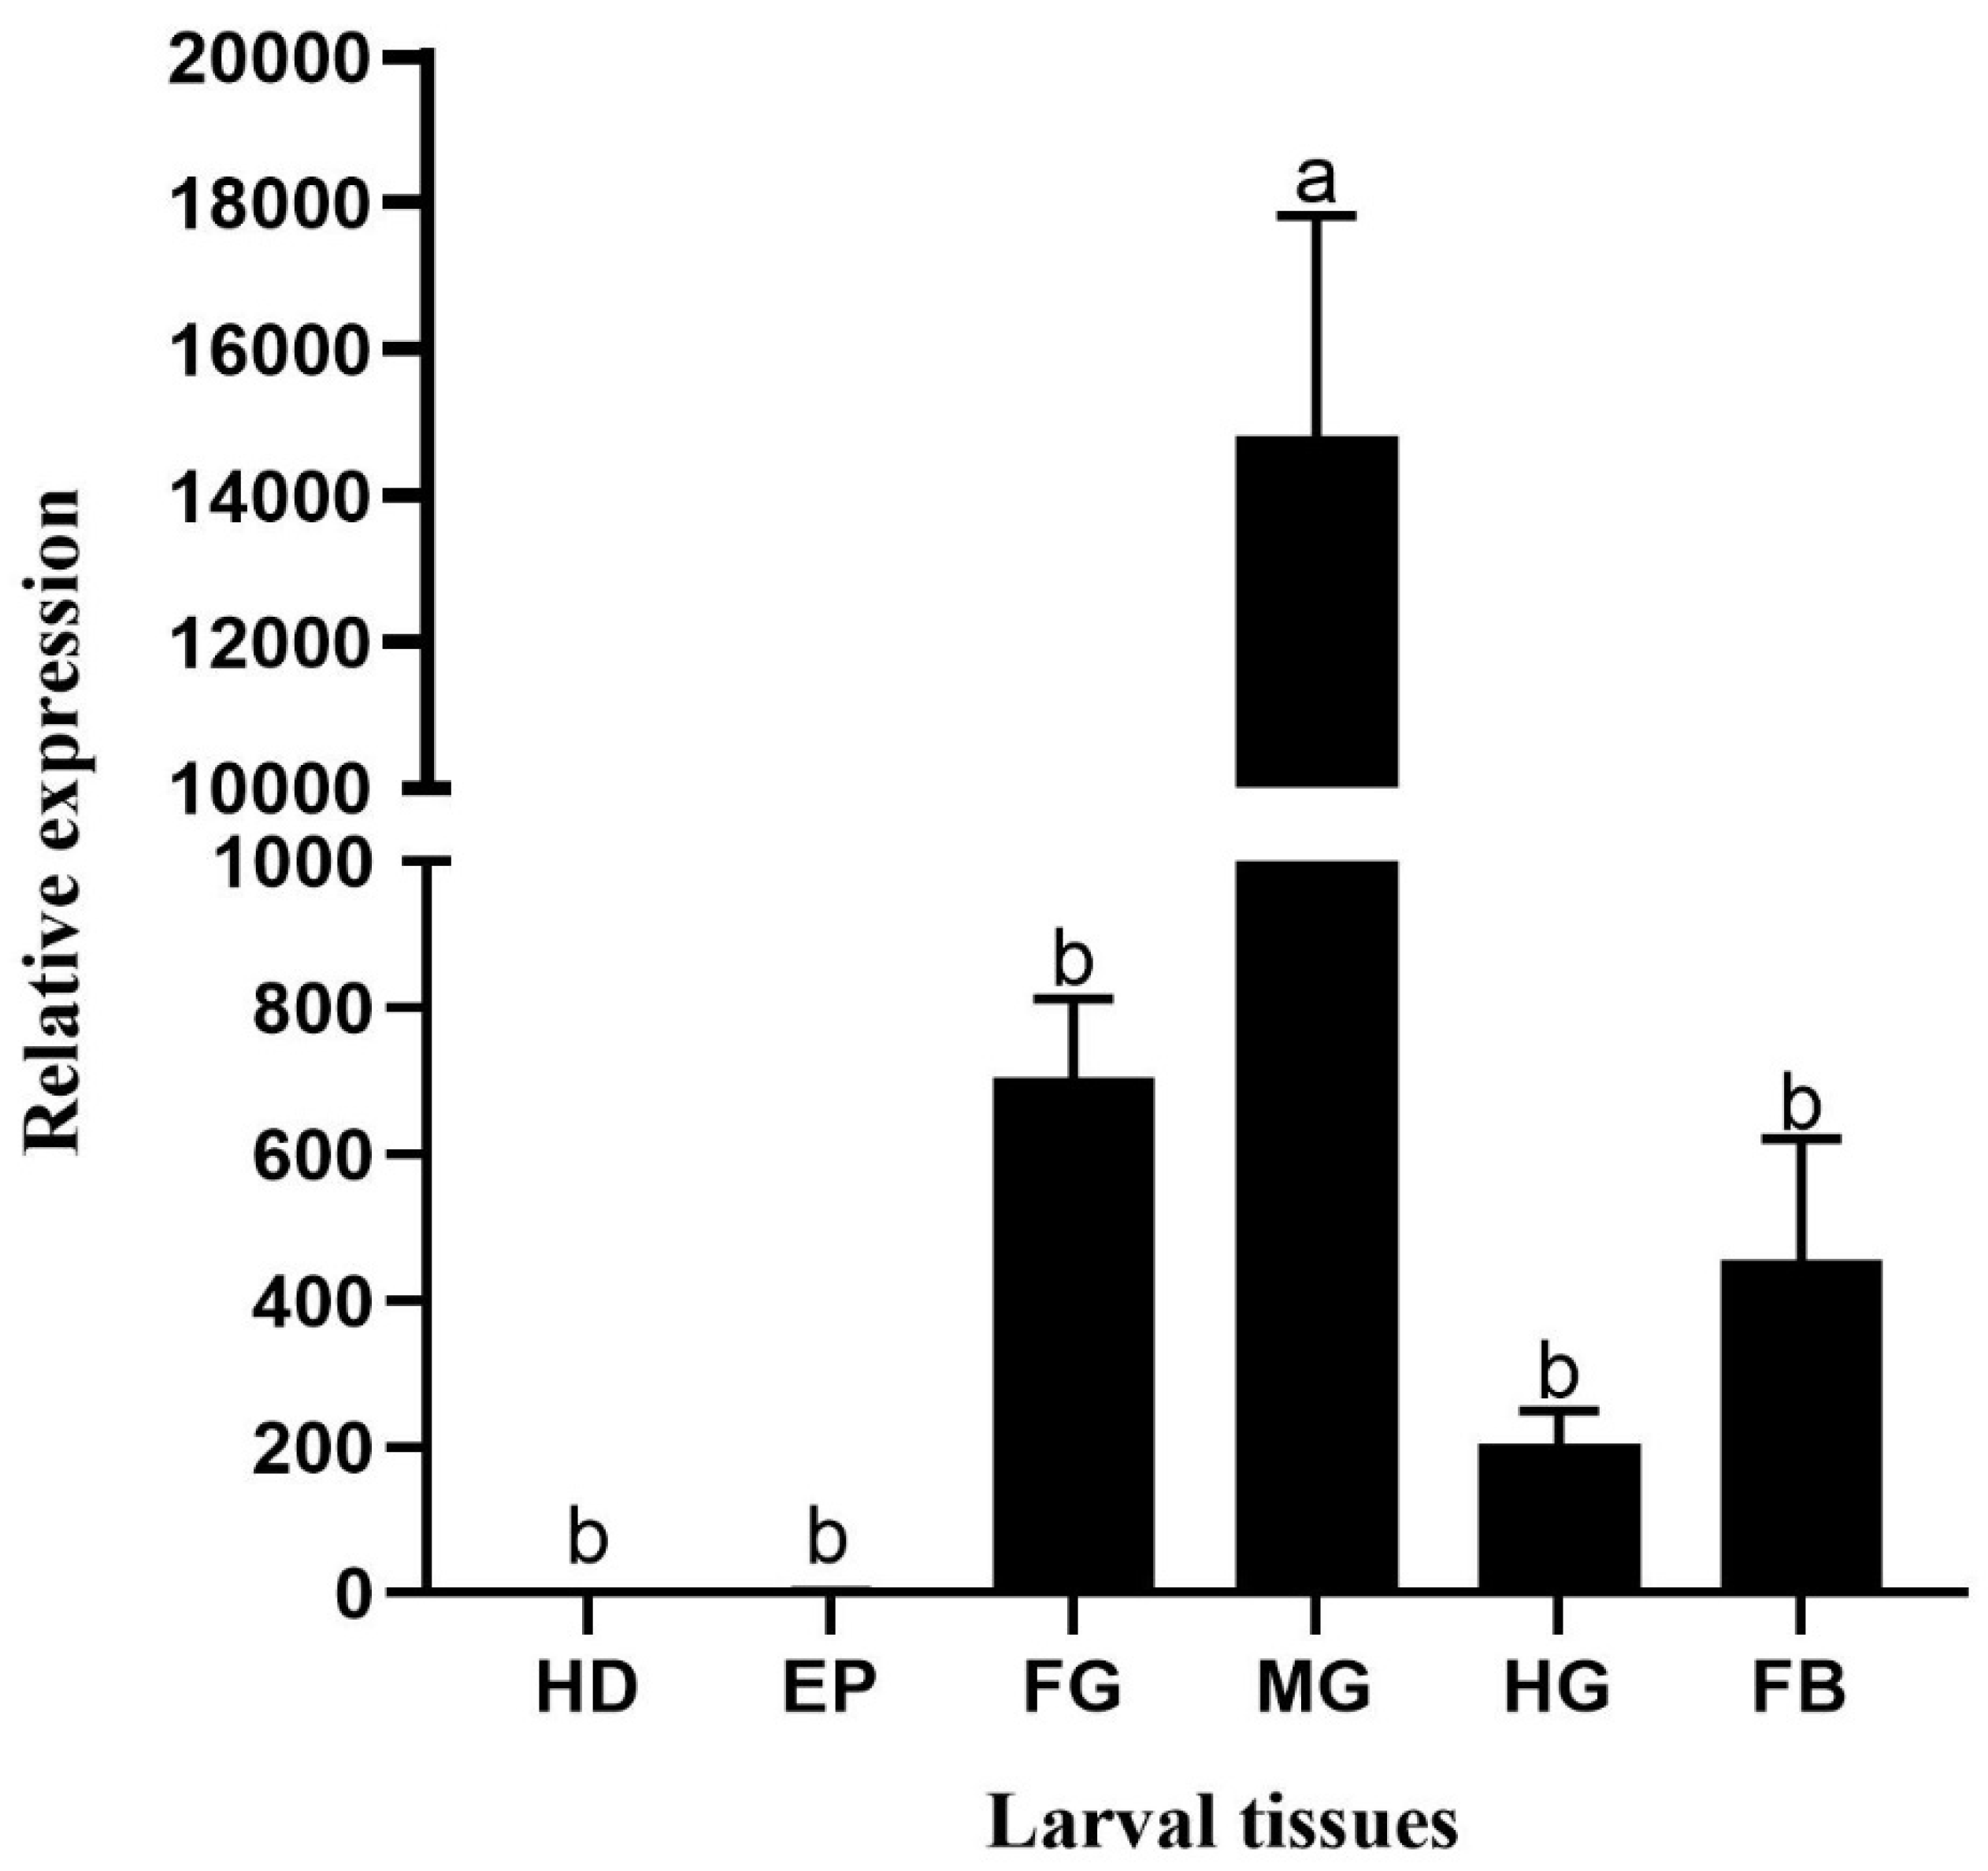
Figure 6.
Relative expression in adult tissues: HD, head; TH, thorax; AB, abdomen; FO, foot; and WI, wing. Error bars represent mean ± standard error of three biological replicates. Different letters above error bars indicate significant differences (P < 0.05), based on one-way analysis of variance (ANOVA) followed by Tukey’s test.
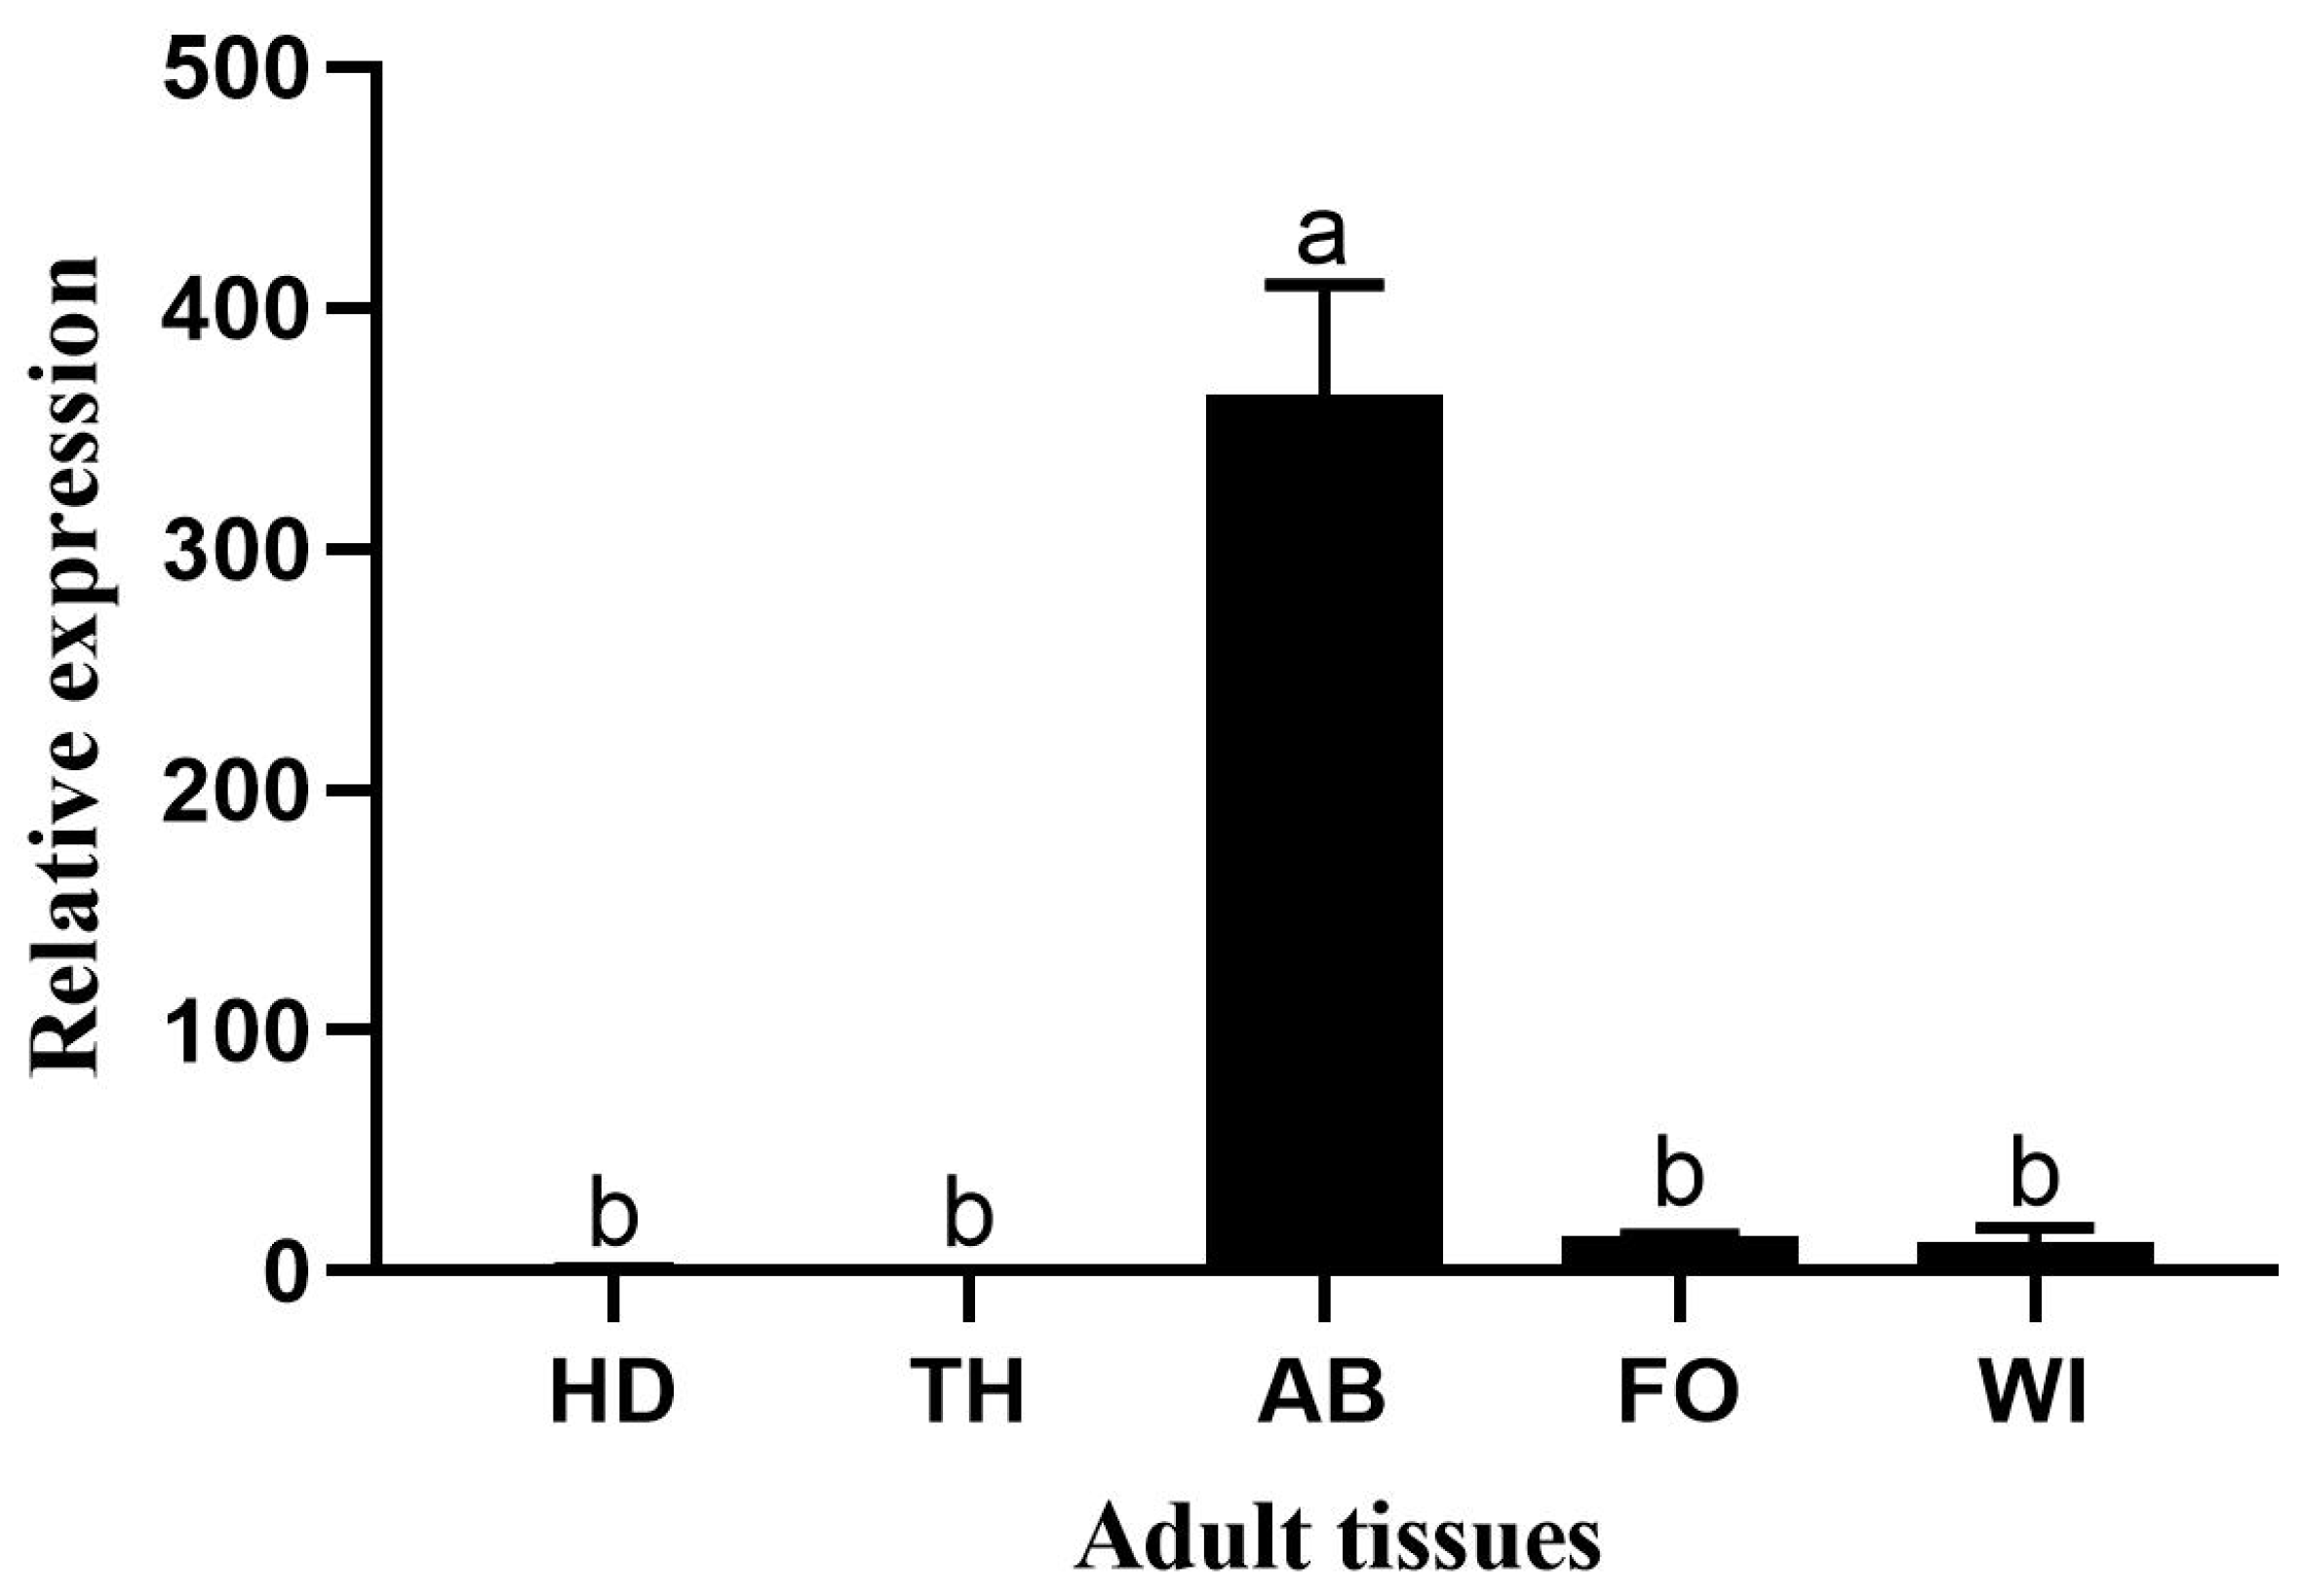
Figure 7.
Changes in mRNA level after treatment with specific RNA interference. Relative transcript levels of HvChsb in L3D1 larvae after injection with dsHvChsb at a concentration of 3.0 µg/µL for 12, 24, 36, 48, 72, and 96 h. The sample size was 120 larvae, which were divided into three biological replicates. Error bars represent mean ± standard error of three biological replicates. *P < 0.05, **P < 0.01. Analysis was performed by one-way analysis of variance (ANOVA) followed by Student’s t-test.
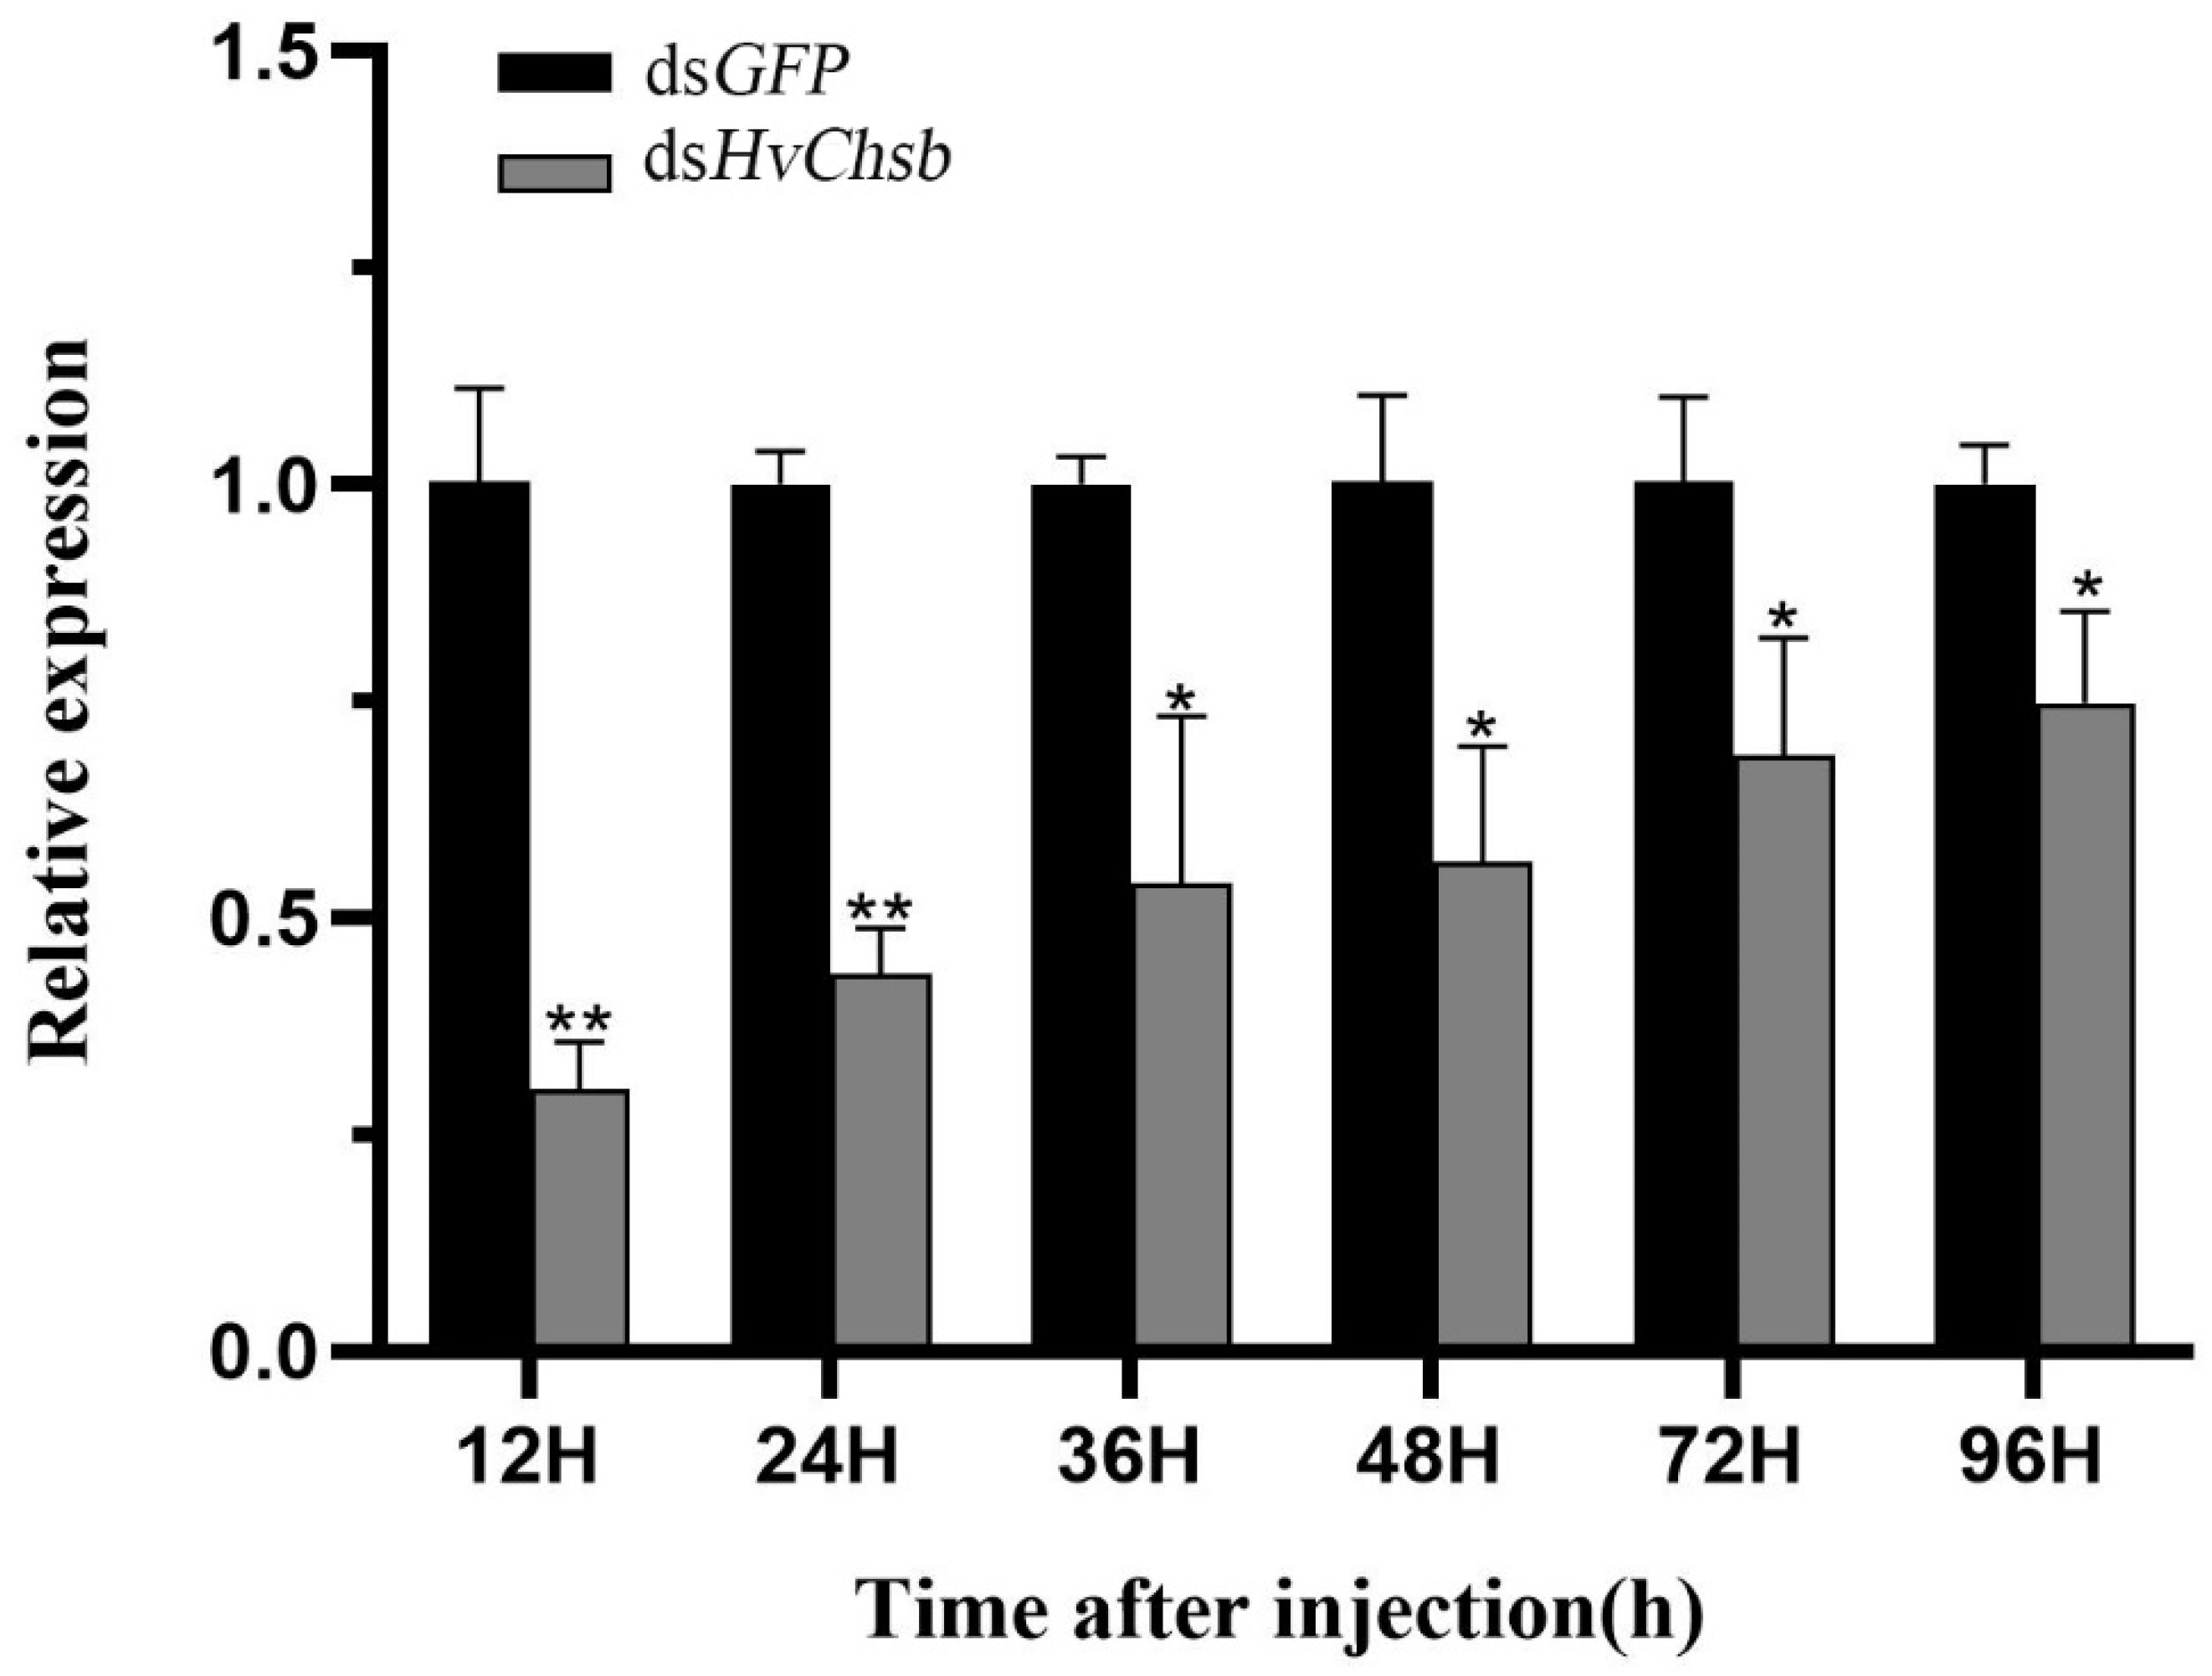
Figure 8.
Effects of HvChsb RNAi on larval-to-pupal and pupal-to-adult molting. (A) Data on developmental abnormalities or lethality due to the RNAi treatment of HvChsb are shown as the mean ± standard error of three biological repeats. (B) Effects of HvChsb RNAi on larval-to-pupal and pupal-to-adult transition rates. Rates of insect survival from fifth-instar larval stage to adulthood after dsHvChsb injection (*P < 0.05, Kaplan-Meier survival analysis with log-rank test). Data are the mean ± standard error of three biological repeats. (C) Larval weight at 24 h after dsHvChsb and dsGFP injections. These data were recorded separately based on a sample size of 120 larvae. Error bars represent mean ± standard error of three biological replicates.*P < 0.05, based on Student’s t-test.
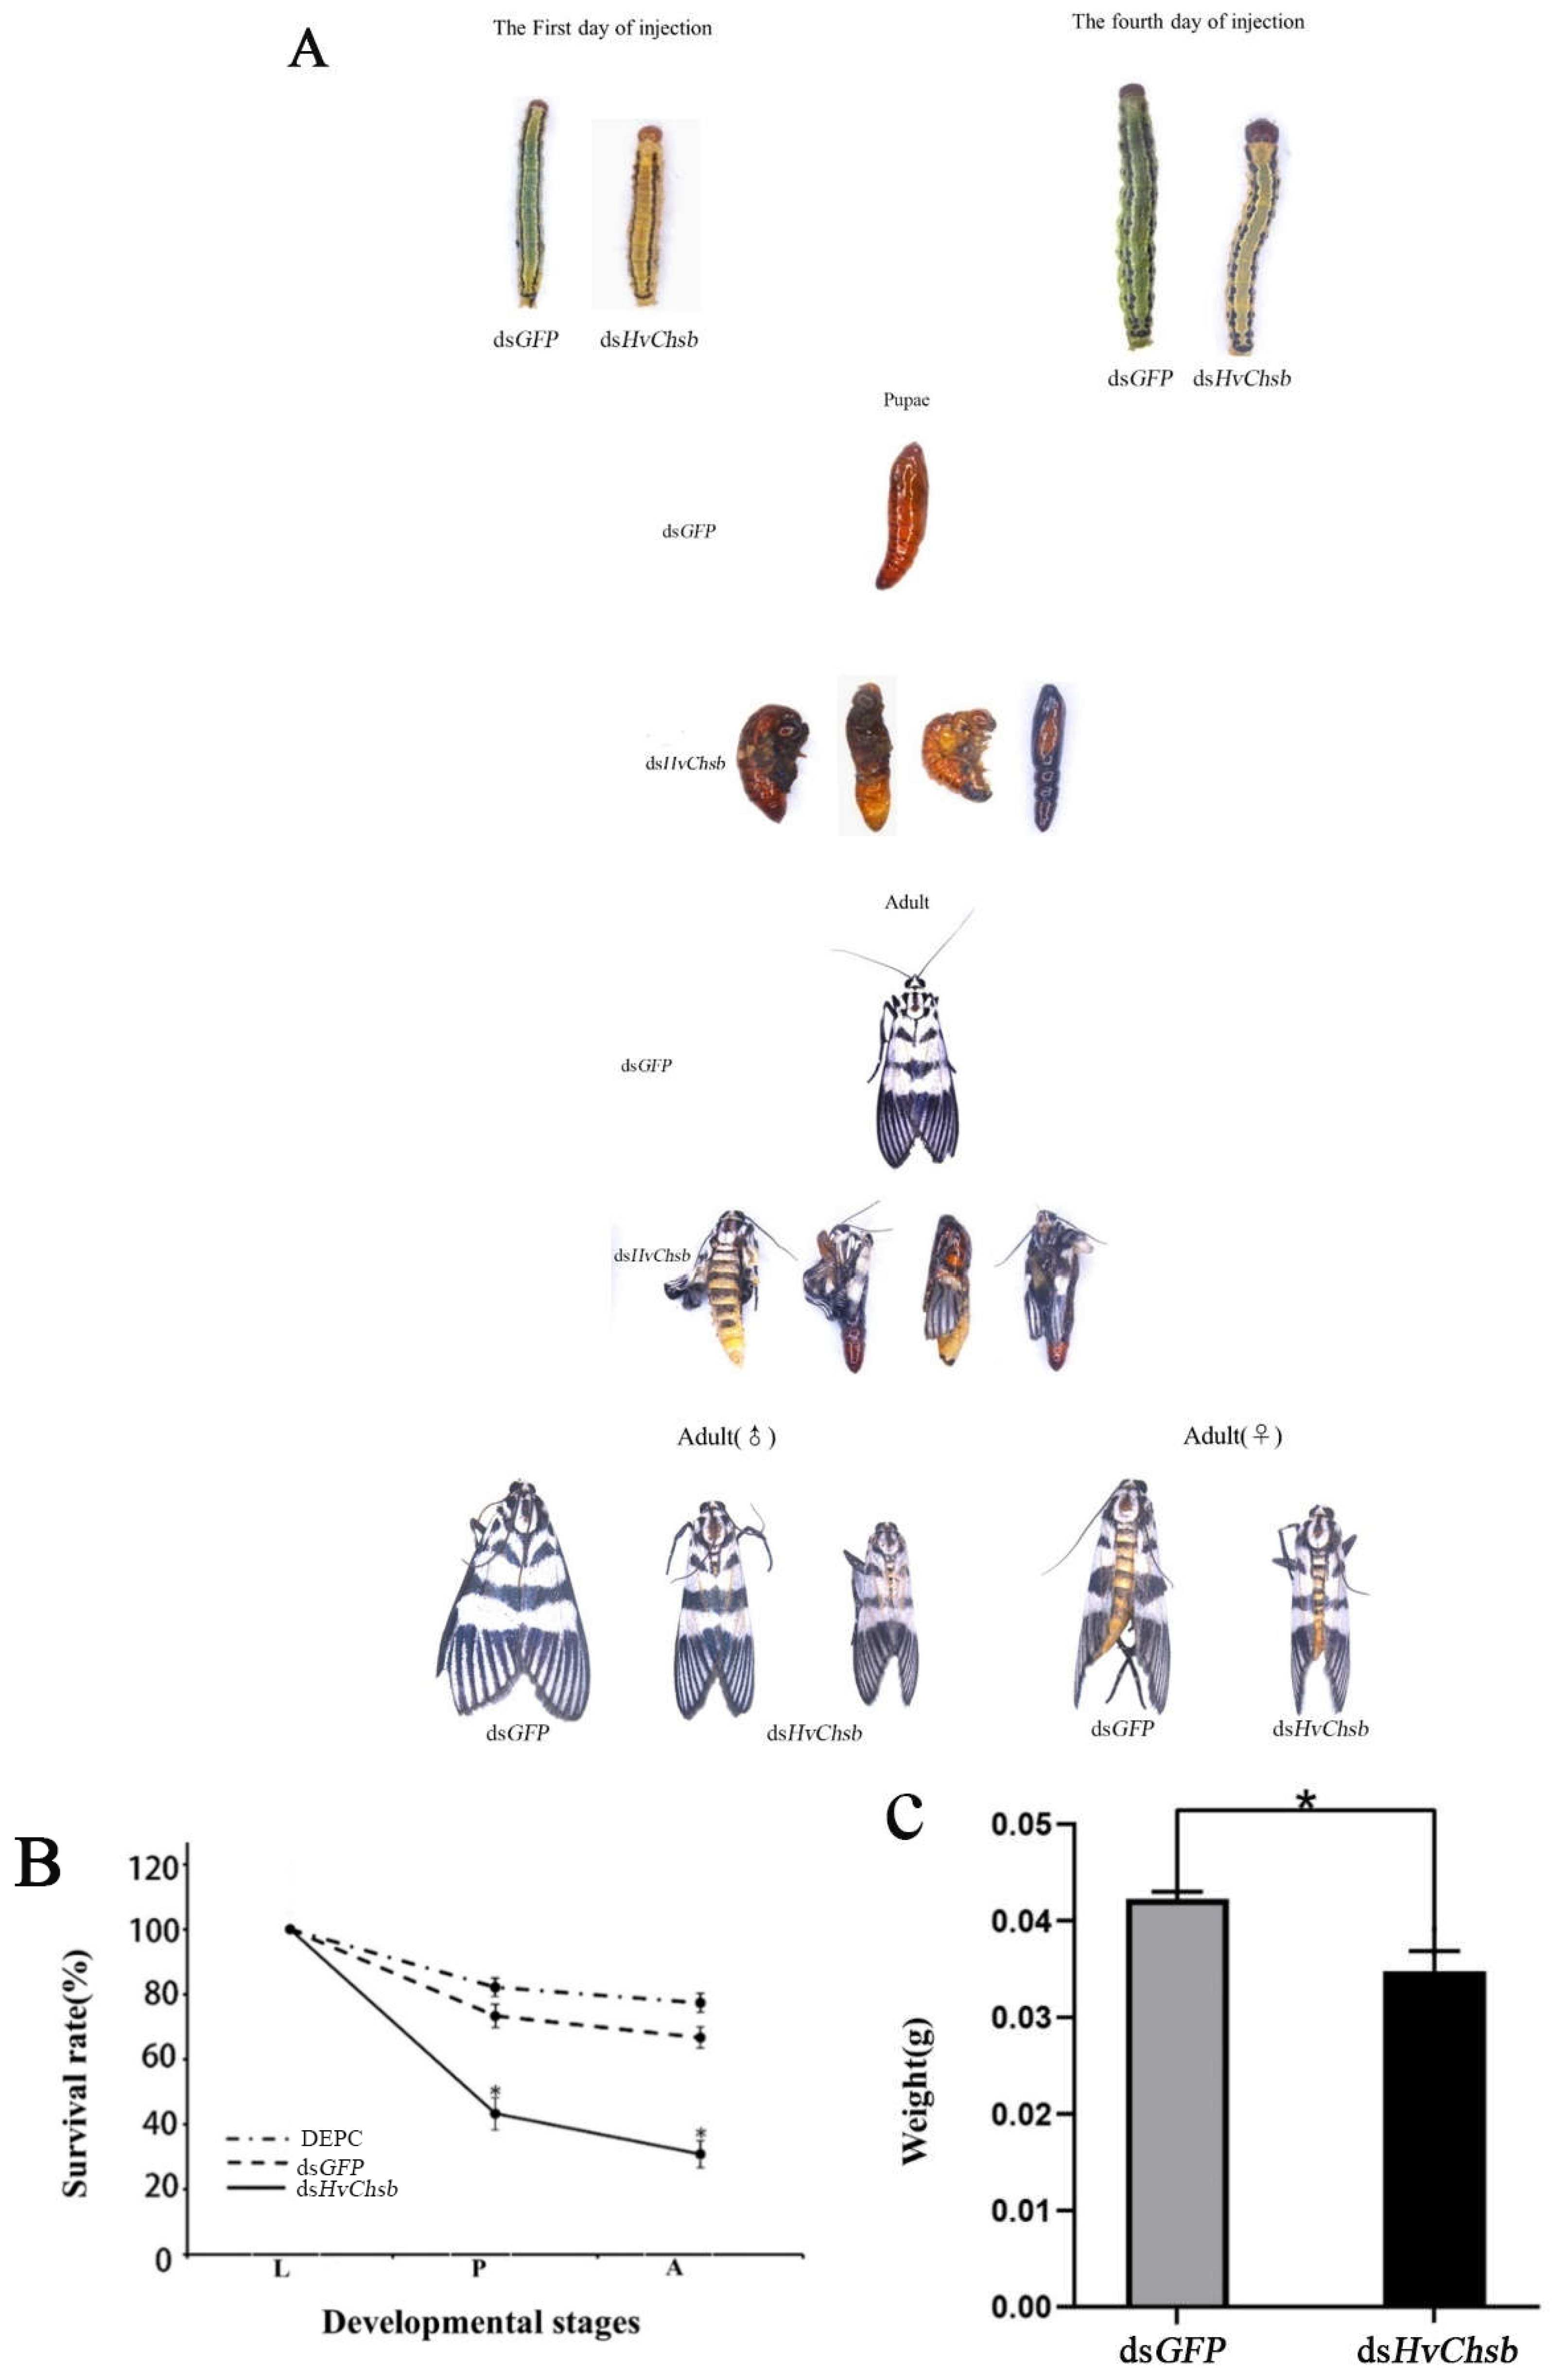
Figure 9.
Expression profiles of HvChsb after 96 h of starvation. Expression levels at 12, 24, 36, 48, 72, and 96 h after starvation were normalized compared with those at 12, 24, 36, 48, 72, and 96 h after feeding (control). *P < 0.05; **P < 0.01 (t-test). Data are the mean ± standard error of three biological repeats.
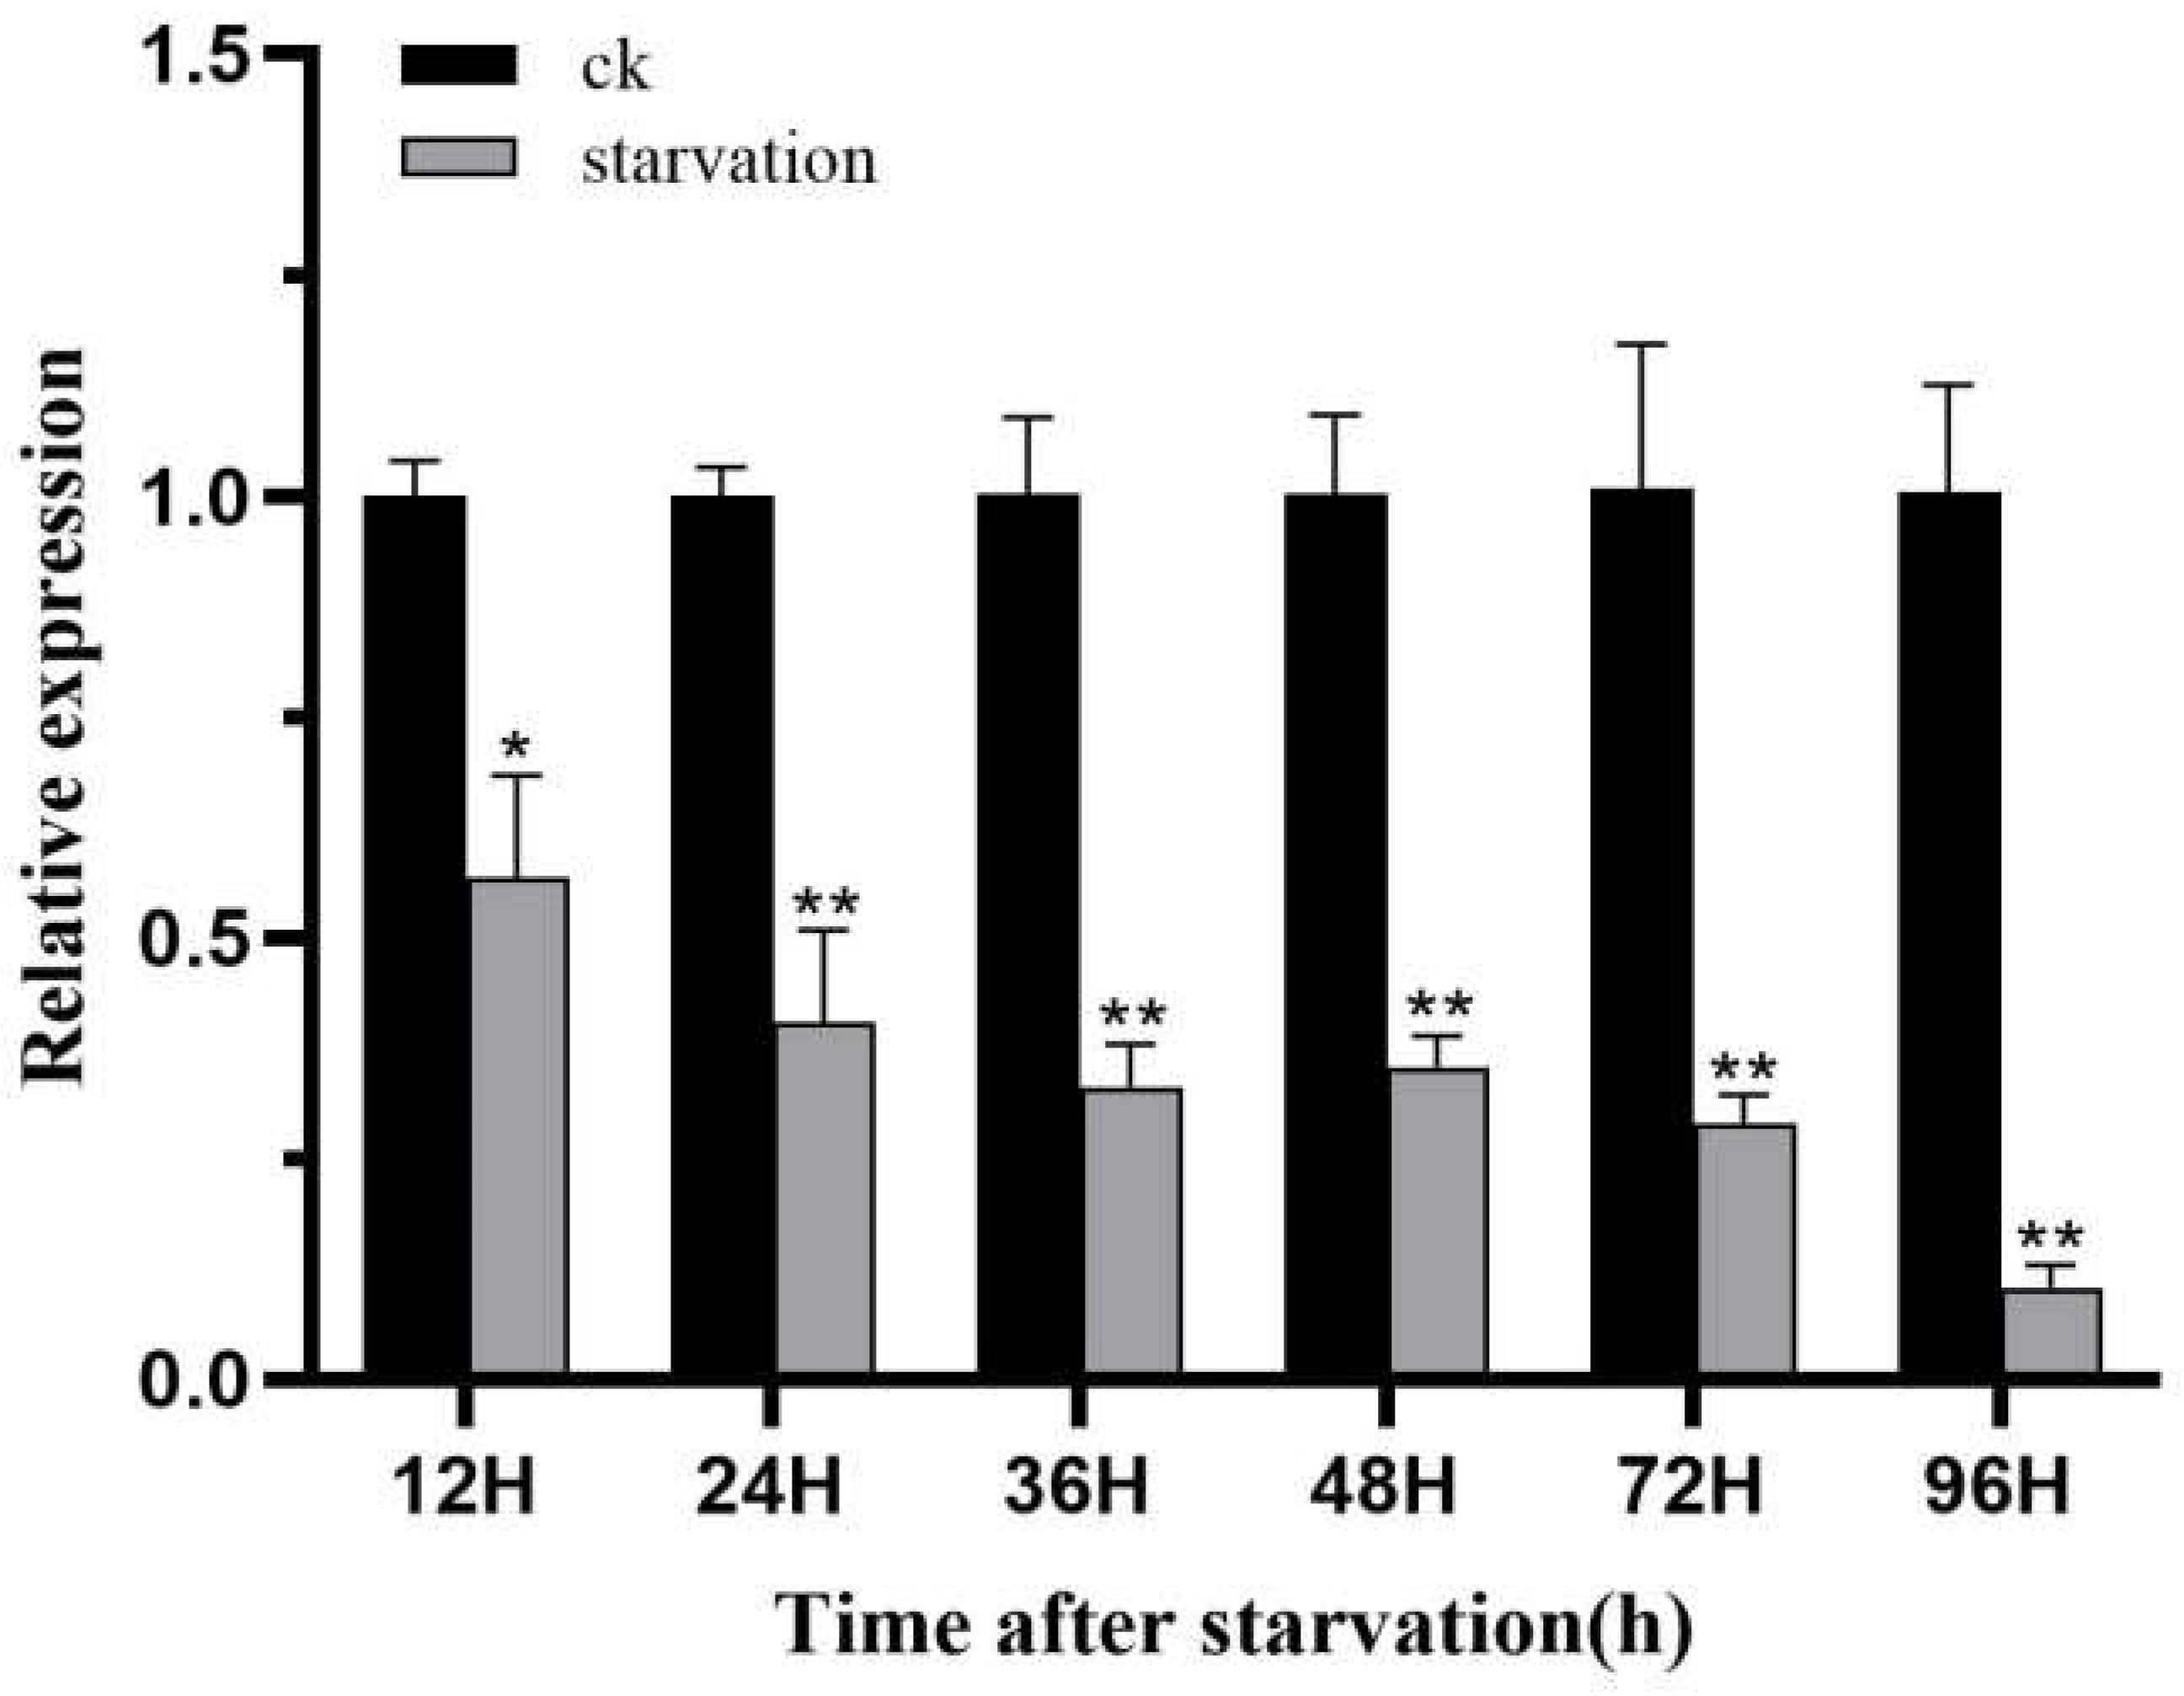
Figure 10.
The expression profile of HvChsb upon refeeding. After 48 h of starvation, the insects were refed. The expression levels at 0.5, 1, 4, and 12 h were standardized with the expression levels of the control group. *P < 0.05; **P < 0.01 (t-test). No significant difference between the two groups was represented by NS. Data are mean ± standard error of three biological replicates.
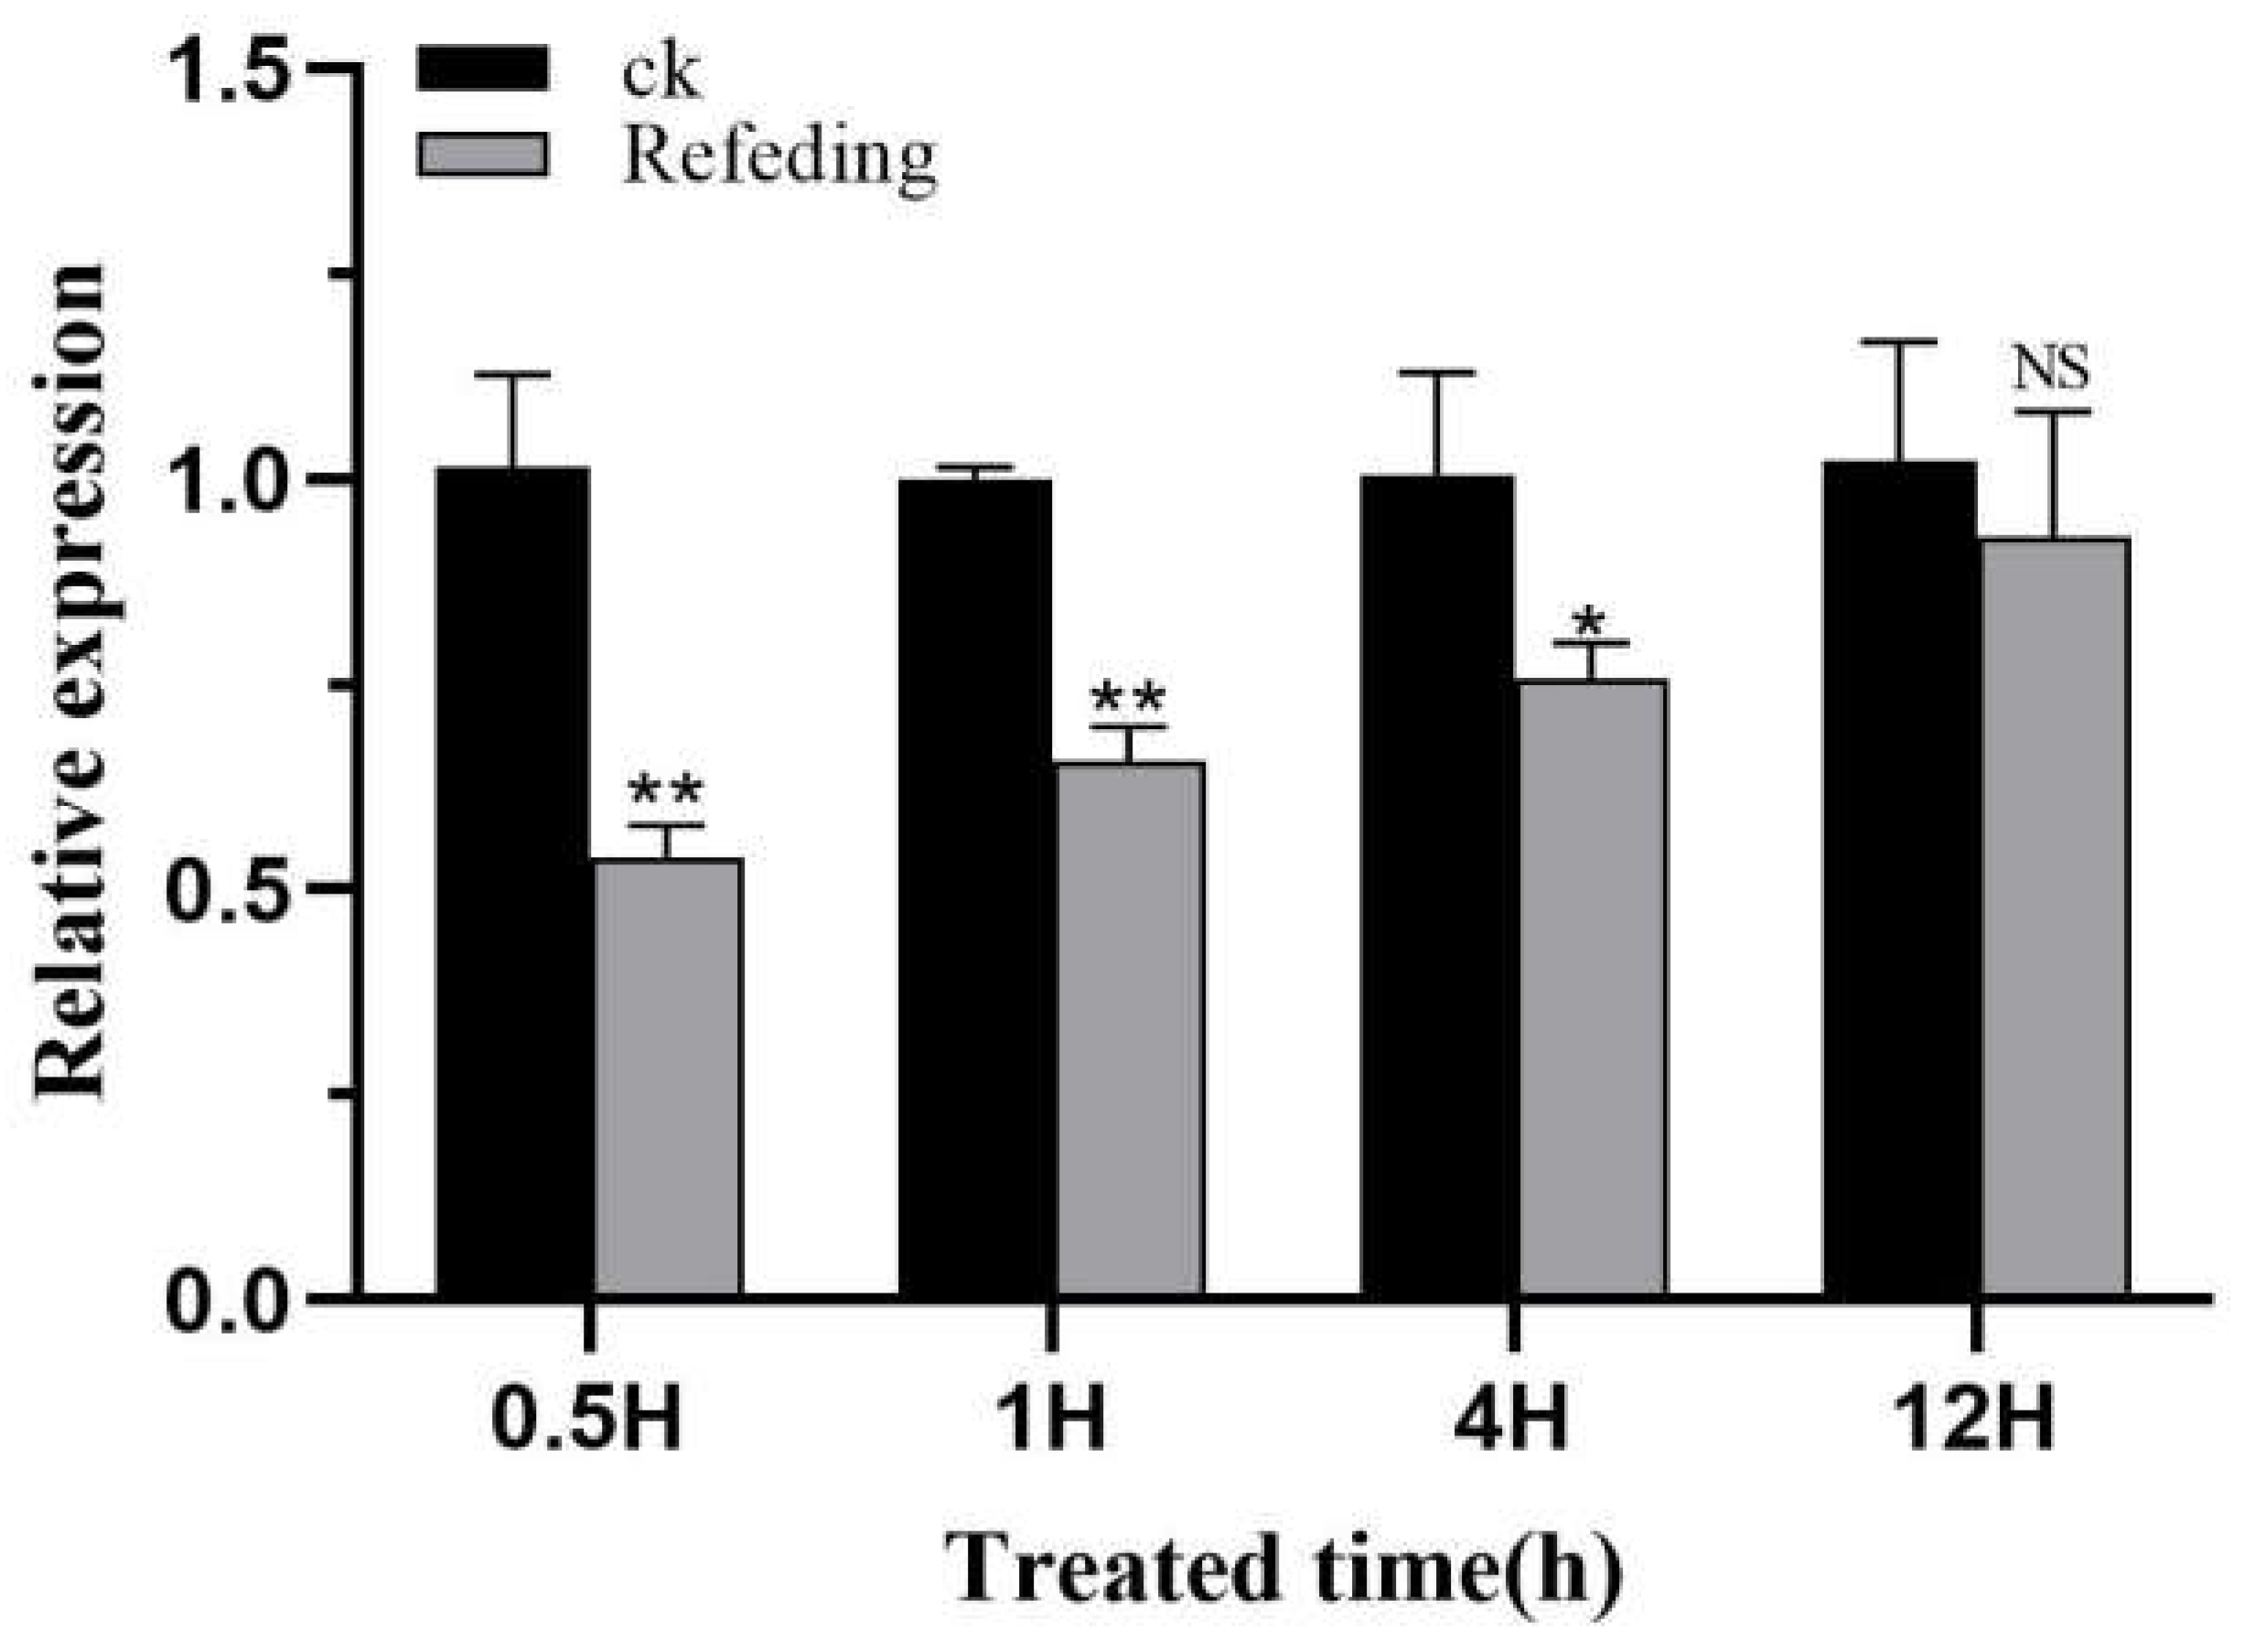

Table 1.
Primers used for RT-qPCR and synthesis of dsChsb and dsGFP.
| Primer name | Forward primer (5′–3′) | Reverse primer (5′–3′) |
| β-actin | GTGTTCCCCTCTATCGTGG | TGTCGTCCCAGTTGGTGAT |
| HvChsb | CCGCCCAAGAAATATCCCACAC | GCCATAAAACCAGAGCCAACCG |
| dsHvChsb | CGTTTGCCCTGAGTCTTG | TTTCGTCTTTTGTTTCGT |
| T7+dsHvChsb | TAATACGACTCACTATAGGCGTTTGCCCTGAGTCTTG | TAATACGACTCACTATAGGTTTCGTCTTTTGTTTCGT |
| T7+dsGFP | TAATACGACTCACTATAGGCAGTTCTTGTTGAATTAGATG | TAATACGACTCACTATAGGTTTGGTTTG TCTCCCATGATG |
Disclaimer/Publisher’s Note: The statements, opinions and data contained in all publications are solely those of the individual author(s) and contributor(s) and not of MDPI and/or the editor(s). MDPI and/or the editor(s) disclaim responsibility for any injury to people or property resulting from any ideas, methods, instructions or products referred to in the content. |
© 2023 by the authors. Licensee MDPI, Basel, Switzerland. This article is an open access article distributed under the terms and conditions of the Creative Commons Attribution (CC BY) license (http://creativecommons.org/licenses/by/4.0/).
Copyright: This open access article is published under a Creative Commons CC BY 4.0 license, which permit the free download, distribution, and reuse, provided that the author and preprint are cited in any reuse.


