
Submitted:
20 June 2025
Posted:
24 June 2025
You are already at the latest version
Abstract
Amid escalating regulatory and stakeholder pressures, corporate environmental practices emerge as strategic competitive advantages. Yet, research lacks depth on interactions among PLU (Power, Legitimacy, Urgency) attributes and resource-constrained decision pathways. Integrating stakeholder theory and the attention-based view (ABV), this study develops a pressure-attention-action model to explain voluntary adoption of ultra-regulatory environmental practices (PEPs). Analyzing survey data from 503 Taiwanese firms via PLS-SEM, legitimacy and urgency significantly drive pressure perception, while power shows no independent effect. Firm size moderates pressure-resource linkages, with urgency prompting resource reallocation for environmental proactivity across scales. A dynamic PLU assessment tool and scale-sensitive strategies are proposed, challenging power-centric paradigms and aiding SMEs through collaborative networks. Limitations include cross-sectional data and regional focus, urging longitudinal and cross-industry validation.
Keywords:
stakeholder attributes
; stakeholder pressure
; environmental proactivity
; resource availability
; attention-based view
; firm size
1. Introduction
The escalating regulatory requirements and stakeholder pressures have propelled corporate environmental initiatives to evolve from compliance obligations into pivotal sources of strategic competitive advantage (Ko et al., 2021). Grounded in Mitchell et al.'s (1997) PLU theoretical framework, recent empirical evidence demonstrates the significant influence of power, legitimacy, and urgency attributes on corporate sustainability decision-making (Villena et al., 2021). However, existing research exhibits two critical limitations. First, the interactive mechanisms of PLU attributes and their systemic impacts on organizational pressure transmission remain theoretically underdeveloped. Second, within Industry 4.0 contexts, the transformative mechanisms through which AI-driven analytical technologies and IoT-enabled circular economy systems mediate external pressures and corporate environmental strategies persist inadequately explored (Kolk & Pinkse, 2010).
Proactive environmental practices (PEPs), as voluntary environmental measures exceeding regulatory compliance (González-Benito & González-Benito, 2005), have demonstrated strategic value in addressing resource scarcity and reducing operational costs (Danso et al., 2020). However, extant research (Table 1) exhibits disproportionate focus on large corporations while neglecting small and medium-sized enterprises (SMEs), leaving unclear the mechanisms for balancing multiple stakeholder demands under resource constraints. This research gap holds significant scholarly merit, given SMEs' current composition of 90% of global enterprises and their greater reliance on adaptive strategies like micro-innovation for sustainable development. While contemporary digital technologies enhance corporate capacity to quantify stakeholder demands (e.g., web-based public opinion monitoring), their potential to reconfigure traditional power dynamics remains underexplored. This study integrates the attention-based view (ABV) to construct a pressure-attention-action translation model, offering novel theoretical perspectives for explaining corporate environmental decision-making mechanisms.
This study addresses the core research question: Under what conditions do enterprises voluntarily allocate resources to implement ultra-regulatory environmental practices (PEPs) when confronting pluralistic stakeholder pressures arising from asymmetric power structures, legitimacy conflicts, and urgency differentials? Building upon stakeholder theory (Mitchell et al., 1997) and the attention-based view (Ocasio, 1997), we propose that dynamic PLU (power, legitimacy, urgency) configurations influence corporate resource reconfiguration through cognitive mechanisms. Although existing research confirms stakeholder pressures drive environmental actions (Reyes-Santiago et al., 2019), two critical gaps persist: (1) insufficient theoretical explanation of mechanisms governing resource-constrained pressure modulation in small and medium-sized enterprises (SMEs), and (2) unverified mediating effects driving corporate decision-making. Our research objectives focus on theorizing the contingent relationship between PLU pressures and firm scale while revealing organizational thresholds for reshaping managerial attention allocation and resource deployment (Dal Maso et al., 2020).
This study develops an innovative framework for corporate environmental decision-making by integrating PLU dynamic mechanisms (Mitchell et al., 1997) with the attention-based view (Ocasio, 1997), proposing three theoretical innovations. First, we identify nonlinear synergistic effects among PLU attributes. Under high-urgency conditions, legitimacy significantly amplifies power's influence on decision-making, challenging conventional linear assumptions. We further reveal that temporal pressures compel firms to prioritize responses to stakeholders demonstrating "high power-high legitimacy" configurations. Second, we demonstrate scale-mediated pathways in resource availability utilization. While small and medium-sized enterprises (SMEs) compensate for resource gaps through strategic reallocation under intensive pressures, large corporations leverage organizational slack to buffer such constraints (Udayasankar, 2008), validating heterogeneous resource deployment patterns across firm sizes. Third, we propose a salience empowerment model showing urgency-driven dynamics can reconfigure traditional power structures. For instance, community residents enhance claim legitimacy through social media tools, challenging static PLU framework assumptions and providing new evidence for stakeholder theory.
The contributions are twofold: (1) We integrate stakeholder theory with resource-based theory to establish a contingency model explaining how firms expand resource efficacy through adaptive mechanisms; (2) We elucidate legitimacy empowerment strategies that enhance decision-making influence, challenging static conceptions of stakeholder salience while providing novel tools for strategic agility in pressure transformation.
This study proposes a practical framework comprising three components: (1) Development of a PLU prioritization decision-making tool that dynamically optimizes resource allocation priorities through quantitative assessment of stakeholder attributes (e.g., urgency scoring generated from environmental monitoring); (2) Implementation of a circular economy hub model for small and medium-sized enterprises (SMEs) to enhance resource efficiency via collaborative networks, while large corporations are advised to establish green innovation budgets to strengthen strategic resilience; (3) Creation of scale-sensitive environmental policy systems.
2. Theoretical Background and Hypothesis Development
2.1. Stakeholder Attributes (Power, Legitimacy, Urgency) and Corporate Behavior
2.1.1. Theoretical Foundation Framework
Stakeholder theory elucidates how corporations allocate resources among competing interests through descriptive, instrumental, and normative dimensions (Donaldson & Preston, 1995). Its core premise posits that firms prioritize satisfying critical stakeholders who influence organizational survival (Jawahar & McLaughlin, 2001). Extending this premise, the attention-based view (ABV) emphasizes how managers' dynamic perceptions of external pressures (e.g., regulatory shifts, consumer activism) guide resource allocation (Ocasio, 2011). Unlike static stakeholder classifications, ABV reveals the path dependency of decision-making - where historical resource commitments persistently constrain future environmental strategy selection (Ocasio, 1997), thereby generating cumulative effects in environmental behaviors.
2.1.2. Interactive Mechanisms of the PLU Framework
The PLU framework by Mitchell et al. (1997) deconstructs stakeholder salience through three-dimensional dynamic interplay:
1. Power: A stakeholder's capacity to compel corporate decision-making changes, encompassing coercive, utilitarian, and normative dimensions (Dahl, 1957; Pfeffer, 1981). For instance, the RE100 Alliance leverages market influence to drive renewable energy adoption, exemplifying environmental governance effects through utilitarian power.
2. Legitimacy: Socially constructed recognition of claim appropriateness (Suchman, 1995). The EU Carbon Border Adjustment Mechanism (CBAM) demonstrates regulatory efficacy over corporate behavior by internalizing carbon costs, showcasing policy legitimacy in action (Crossley et al., 2021).
3 .Urgency: Temporal sensitivity and criticality of claims (Miles, 2017). CBAM's 2026 mandatory reporting deadline exemplifies urgency mechanisms, demonstrating how temporal constraints amplify policy instrument effectiveness.
2.1.3. Interactive Formation of Asymmetric Pressure Gradients
The dynamic interplay of these three attributes generates asymmetric pressure gradients: Government agencies possess power and legitimacy advantages, though urgency may fluctuate with regulatory implementation timelines, while non-governmental organizations (NGOs) lacking formal power can elevate issue urgency perception through media mobilization to influence decision-making. This dynamic compels enterprises to establish systematic stakeholder salience evaluation mechanisms, enabling real-time PLU attribute quantification and prioritization. For instance, viral social media dissemination amplifies grassroots organizational influence, thereby disrupting traditional governance structures dominated by governments and corporations.
2.1.3. Strategic Corporate Responses to Stakeholder Pressures
Corporate environmental strategy selection is moderated by two critical factors (Sharma & Vredenburg, 1998): First, *resource flexibility* - large enterprises utilize budgetary slack to buffer PLU pressures while maintaining core operational stability (Bansal & Roth, 2000), whereas small and medium-sized enterprises (SMEs) achieve resource optimization through circular economy hubs via collaborative networks. Second, *attention orchestration* - under the attention-based view (ABV) framework, firms establish tri-dimensional PLU evaluation mechanisms to prioritize resource allocation for high-salience stakeholders (e.g., ESG investors). Large corporations demonstrate faster decision-response speeds due to resource abundance compared to SMEs.
However, two critical paradoxes emerge: The *legitimacy paradox* manifests when compliance mechanisms like CBAM's carbon cost internalization potentially incite conflicting stakeholder opposition (Crossley et al., 2021). The *urgency inflation* phenomenon occurs as social media compresses environmental technology decision cycles, risking technology lock-in effects (Jiang et al., 2022). While stakeholder salience assessment enhances decision-making efficiency, it may simultaneously exacerbate short-termism tendencies. This study focuses on the three antecedents of stakeholder pressure, examining how company size moderates resource availability and drives proactive environmental decision-making, as illustrated in Figure 1.
H1
: The power attributes of stakeholders positively influence the perceived stakeholder pressure of the company.
H2
: The legitimacy attributes of stakeholders positively influence the perceived stakeholder pressure of the company.
H3:
The urgency attribute of stakeholders positively influences the perceived stakeholder pressure of the company.
2.2. Resource Availability and Corporate Environmental Proactivity
The resource-based view (RBV) posits that the efficacy of proactive environmental practices (PEPs) hinges on transforming heterogeneous resources (financial / technological / human) into non-substitutable capabilities (Barney, 1991; Chang & Chen, 2020). By strategically integrating renewable technology patents with circular supply chains, enterprises not only respond to stakeholder pressures but cultivate differentiated competitive advantages. Industry 4.0-driven intelligent resource allocation systems necessitate dynamic capability deployment mechanisms (Teece, 2018), enhancing organizational agility and regulatory adaptability.
Integrating the attention-based view (ABV) with stakeholder theory reveals how firms prioritize high-salience issues (e.g., CBAM compliance) through structured decision protocols. Digital filtering mechanisms supplant traditional processes by enabling quantitative assessment of urgency metrics (e.g., carbon emission deadlines) and legitimacy indicators (e.g., ESG ratings), thereby facilitating dynamic threshold adjustments of resource allocation. Contrary to resource dependence theory's (RDT) static model, the ABV framework reconceptualizes environmental strategy as an ongoing negotiation between attentional bandwidth and external pressures. This optimization reduces compliance costs while amplifying green innovation outputs through refined resource distribution.
2.3. The Impact of Firm Size on Stakeholder Pressures and Resource Allocation
Firm size moderates pressure response mechanisms through structural visibility, resource endowment, and institutional embeddedness (Udayasankar, 2008). Large enterprises face intensified ESG scrutiny due to high market exposure, necessitating budgetary slack to buffer compliance pressures (Darnall et al., 2010). Consequently, their legitimacy-driven environmental investments predominantly stem from reputational management motivations. Conversely, small and medium-sized enterprises (SMEs) confront heightened environmental pressure focalization from supply chains and communities (Crossley et al., 2021), yet resource constraints engender strategic trade-off dilemmas between compliance costs and innovation investments.
While large corporations possess modular resource architectures (e.g., cross-departmental budgets supporting circular economies), hierarchical structures limit their environmental innovation to incremental improvements. SMEs conversely achieve scale economies in innovation through networked strategies like resource-sharing partnerships. Structural rigidity in large firms induces decision latency, whereas SME resource flexibility enhances response speed.
H4:
The greater the perceived pressure from stakeholders on a company, the more positively it will affect its resource availability.
H5:
The larger the firm, the more likely it is to moderate the relationship between stakeholder pressure and enterprise resource availability.
2.4. Typology and Determinants of Proactive Environmental Practices
Proactive environmental practices (PEPs) denote corporate initiatives that surpass regulatory requirements by embedding sustainability into core strategic operations (Prakash, 2001). These encompass two predominant forms: (1) *proactive technological innovation* (e.g., carbon capture technology R&D for efficiency enhancement), and (2) *systemic collaborative networks* (e.g., participation in cross-industry circular ecosystems to reduce industrial waste).
The adoption of PEPs is driven by dual mechanisms. First, *attentional agility*: Enterprises with dedicated sustainability departments demonstrate higher PLU pressure conversion efficiency than non-specialized counterparts (Sharma & Vredenburg, 1998), indicating organizational attention focus determines environmental strategy responsiveness. Second, *resource fluidity*: Small and medium-sized enterprises (SMEs) compensate for resource gaps through open innovation networks generating synergistic effects, whereas large corporations allocate supplementary R&D budgets to support high-risk PEPs initiatives.
This study reveals PEPs' dual strategic nature - serving both as reactive pressure responses and active levers for reshaping industry norms (e.g., RE100 Alliance's energy standard reconfiguration). Contrasting traditional resource-based view's (RBV) static analysis, we propose an attention-based view (ABV) dynamic capability perspective, demonstrating PEPs' explanatory power regarding competitive advantage while contributing novel theoretical insights to strategic management.
H6:
The greater the perceived pressure from stakeholders, the more positively it will impact environmental positivity.
H7:
The greater the resources availability in a company, the more positively it will influence environmental positivity.
H8:
When a company focuses on stakeholders' power attributes, it will positively influence environmental positivity. This relationship is mediated through stakeholder pressure and resource availability.
H9:
When a company focuses on stakeholders' legitimacy attributes, it will positively influence environmental positivity. This relationship is mediated through stakeholder pressure and resource availability.
H10:
When a company focuses on urgent content related to stakeholders, it will positively influence environmental positivity. This relationship is mediated through stakeholder pressure and resource availability.
3. Methods
3.1. Data Sources and Sample
To verify our hypothesis, we included both service and manufacturing industries in the implementation of environmental practices. The questionnaire used in this study was developed based on established scales from previous research. The initial draft was first sent to managers in the chemical, machinery, information technology, pharmaceutical, food, banking, tourism, and hospitality industries for review. Additionally, a pilot test was conducted with 30 EMBA students. Their feedback and suggestions were incorporated to improve the readability and clarity of the questionnaire, ensuring more accurate and honest responses.
3.2. Procedures for Collecting Data
Several steps were taken to reduce response bias and the effects of social desirability among participants. First, the cover letter of the questionnaire made it clear that the survey was for academic purposes only. Second, we ensured that all responses were anonymous and that the collected data would remain confidential. We targeted companies that had received government awards in the past five years, such as the Taiwan Quality Award, National Environmental Protection Award, and Innovation Research Award. To avoid duplicate data, we confirmed that these companies were still active. Data collection was done through an online survey system (Survey Cake), with a URL and QR code provided to reach 1,986 companies. We received 581 responses, but 78 were excluded due to insufficient knowledge of environmental issues. The final sample size was 503 companies, with an adjusted response rate of 25.3%, which was used for further analysis.
To ensure the reliability of the survey data, we addressed potential limitations in several ways. First, standardized measurement criteria and Likert scales consistent with previous research were used to maintain objectivity. Second, the questionnaire was simplified and organized into categories to reduce any confusion for respondents. Lastly, anonymity was guaranteed for knowledgeable managers. These measures helped encourage honest and thoughtful responses, making the data a reliable source of information.
3.3. Descriptive Statistics
We conducted various statistical tests on the data. Table 2 provides an overview of the respondents, further confirming the sample's representativeness. The respondents in our study are categorized by (1) gender, (2) management level, (3) industry type (manufacturing or service industry), (4) firm age, and (5) firm size. Therefore, the sample represents a broad range of companies.
3.4. Nonresponse Bias
To control for nonresponse bias, we employed several statistical methods. First, a t-test mean analysis was used to check for any response bias, and the results showed no significant deviations across the responses. Additionally, we applied time trend extrapolation to test for response bias. This method assumes that non-responders are more similar to late responders than early responders. As a result, we classified the first 25% of respondents as early responders and the last 25% as a proxy for non-responders. Finally, we conducted Levene's test to determine if there were significant differences between these two groups. The results showed no statistically significant differences for any of the questions in the survey (as shown in Table 3), indicating that our sample is both representative and statistically sound.
3.5. Common Method Bias
This study employs several methods to mitigate the potential threat of common method bias (CMB) in our research results (Wang et al., 2018). First, reverse-coded questions were included in the questionnaire to address potential bias. Second, we conducted Harman's single-factor test. Third, we applied exploratory factor analysis (EFA) to examine the factor structure of the relevant variables. The results showed that the eigenvalues for all measured items were greater than 1.0, accounting for 69.51% of the total variance, with the first factor explaining only 31.45%, which is well below the 50.0% benchmark. We also performed a correlation coefficient analysis, confirming that the correlations between all variables were lower than the square root of the average variance extracted (AVE), further ruling out CMB concerns. Finally, we conducted a full collinearity assessment, and all variance inflation factor (VIF) values were below the threshold. Overall, these results indicate that common method bias does not pose a significant threat to our study.
3.6. Measures and Scales
3.6.1. Power, Legitimacy, Urgency
To assess the influence of the three key stakeholder attributes on the levels of pressure they exert, we used established scales for stakeholder power, legitimacy, and urgency (Agle et al., 1999). The evaluation focused on how these stakeholder attributes were represented in the items. A five-point Likert scale, ranging from 1 (strongly disagree) to 5 (strongly agree), was used for rating the items.
3.6.2. Stakeholder Pressure
We applied an existing scale for stakeholder pressure (Buysse & Verbeke, 2003), covering most of the measurement items found in other literature, with minor adjustments. Business managers were asked to respond using a single Likert scale, ranging from 1 (representing the lowest level of stakeholder pressure) to 5 (representing the highest level).
3.6.3. Resource Availability
To evaluate resource deployment in high-pressure environments, we used an existing scale to measure resource availability (Chang & Chen, 2020). The scale captures various company resources, reflecting how resource deployment is influenced by pressure. We used a five-point Likert scale ranging from 1 (strongly disagree) to 5 (strongly agree).
3.6.4. Proactive Environmental Practice
We reviewed scholars' definitions of environmental proactivity based on three criteria: proactive behaviors that go beyond compliance (i.e., proactive behavior), behaviors that simply comply with legal requirements (i.e., reactive behavior), and active resistance to environmental regulations (i.e., proactive resistance). Additionally, we identified four key characteristics of environmental proactivity: (1) a forward-looking approach, (2) development of new products or services, (3) anticipation of future demand, and (4) the use of harmful processes and products as selection criteria for determining measurement items (Andreou & Kellard, 2021).
From there, we refined the content, drawing on 12 items derived from 71 literature sources identified through a meta-analysis by scholars (Liu et al., 2015). Ultimately, we selected 12 items from the four categories of 24 environmental proactivity measures classified by scholars (González-Benito & González-Benito, 2005). These 12 items were evaluated using a six-point Likert scale, ranging from 0 (not implemented at all) to 5 (mostly implemented).
3.6.5. Firm Size
Measuring firm size can be complex, as it involves various company characteristics. Simply counting the number of employees may not fully capture the intricacies of an enterprise. To address this, we used the logarithm of the total number of employees, based on Taiwan's enterprise size classification standards, to measure firm size. In this study, we employed a binary variable to represent firm size. Small service companies (fewer than 50 employees) were assigned a value of 0, while large service companies (51 or more employees) were assigned a value of 1. Similarly, small manufacturing companies (fewer than 200 employees) were assigned a value of 0, while large manufacturing companies (201 or more employees) were assigned a value of 1.
3.7. Control Variables
In this empirical study, we included firm age and industry category as control variables to assess the significance of firm characteristics in explaining environmental practices. Empirical evidence suggests that more experienced firms tend to adhere to stricter industry standards (Huergo & Jaumandreu, 2004). As a result, our analysis controlled for firm age and industry category as covariates.
3.8. Analysis
In this study, we aimed to ensure that our sample size was sufficient for analysis. To achieve this, we used G*Power 4 software to conduct a power analysis for an F-test involving four predictor factors related to the R² of the endogenous structure. With an effect size of f2=0.149f^2 = 0.149, R2=0.13R^2 = 0.13, a significance level 0.05, and an expected power of 0.80, our analysis required at least 104 samples. We collected 503 samples, exceeding the required threshold.
We then analyzed the reliability and validity of the measurement model, structural model, and hypothesis testing. This study focused on predicting proactive environmental practices for the collected survey data. Using SMART-PLS4 as the analytical software, we explored variable relationships and model structures to maximize the explanatory power of the endogenous variables (Hair et al., 2018). After performing reliability and validity analyses of the measurement model, we employed the PLS Algorithm to generate path coefficients (β\beta values). We used the bootstrapping method to obtain t-values and model explanatory power (R) to evaluate the statistical significance and explanatory strength of the constructs in the structural model.
Additionally, this study involved more complex models, including mediating and moderating variables. When incorporating mediating variables into the path model, we verified both direct and indirect path effects and assessed the proportion of explained variance attributed to the mediating variable (indirect effects) and the independent variable (direct effects). If the indirect effect was significant but did not substantially diminish the direct impact on the endogenous variable, the Variance Accounted For (VAF) might fall below 20%, indicating minimal mediation. If the VAF exceeded 80%, this would indicate complete mediation. A VAF between 20% and 80% suggests partial mediation. If the direction of the direct effect reverses, this signifies a suppressor effect.
We also investigated whether stakeholder pressure on resource availability was moderated by company size. To confirm whether the moderating variable influenced the path from the independent variable to the dependent variable, we performed moderation tests to validate the interaction effect.
4. Results
4.1. Measurement Model Assessment
For the model in this study, we refer to Composite Reliability (CR) and Cronbach's α. The composition reliability of all structures was evaluated. We further measured the convergence validity by the Average Variance Extracted (AVE) from the reference structure. We assessed the discriminant validity (DV) section using three criteria. First, we tested the discriminant or divergent validity of all potential variables in the model by observing the cross-loading, Fornell-Lacker Criterion, and Heterotrade Monotrade Ratio Criterion (HTMT) (Sarstedt et al., 2016).
As shown in Table 4, in Cronbach's α and Composite Reliability (CR): power (POW); Legalities (LEG); Urgency (URG); Stakeholder pressure (SPR); Resource availability (REA); Environmental proactivity (PES), which are within the range of standard values(Cronbach's α > 0.729 or above; Composite Reliability > 0.845 or above). These structures have high internal consistency reliability. In the part of convergence validity, the measured values of standardized factor loading and average variance extracted (AVE) are, which are within the range of standard values(Factor loading > 0.559 or above; AVE > 0.505 or above), and the measured value of construction item should have convergent validity. In addition, we also refer to Dijkstra Henseler's rho (rho_A) coefficient of more than 0.7 to ensure that variable items are highly correlated and all measure the same concept.
Correlations and discriminant validity results: The square root measurement value of the average variation extraction amount on the measurement diagonal, as shown in Table 5, indicates that all variables in the model meet the conditions and that the model has discriminant validity.
4.2. Structural Model Assessment
In addition, as shown in Table 5, to evaluate that the exogenous structure has the most significant predictive correlation, the size of the Q² effect shown in Table 6 indicates that the path model is related to the prediction of the specific target structure. Therefore, it shows that our model has predictive relevance. f² The magnitude of the effect shows the change in R². The magnitude of the f² effect shown in Table 6 shows that resource availability has the most critical impact on Environmental proactivity, followed by stakeholder pressure. Finally, we determined no multicollinearity problem in the model because the VIF of each measurement item was lower than the recommended threshold value<3, indicating no colinearity problem between the independent and dependent variables.
4.3. Tests of Hypotheses
4.3.1. Pressure on Stakeholders from Power, Legitimacy, and Urgency
In Table 7, we can see from the results: Hypothesis 1, which shows that stakeholder power affects the perceived stress of enterprises, shows that the P value is>0.05, and 95% CI contains 0. That is, this hypothesis is not supported. The hypothesis that the legitimacy of hypothesis 2 stakeholders affects the perceived pressure of enterprises is supported (P value < 0.05; 95% CI does not contain 0). Hypothesis 3 that stakeholders urgently influence the perceived pressure of enterprises, shows that this hypothesis is supported (P value < 0.05; 95% CI does not contain 0).
4.3.2. Stakeholder Pressure on Resource Availability
In Table 7, In the part where stakeholder pressure affects resource availability, Hypothesis 4 in the part where stakeholder pressure affects resource availability shows that this hypothesis is supported (P value < 0.05; 95% CI does not contain 0).
Hypothesis 5 that the firm size reduces the relationship between stakeholder pressure and resource availability, is also supported (P value < 0.05; 95% CI does not contain 0).
4.3.3. Stakeholder Pressure and Resource Availability on Proactive Environmental Practice
Hypothesis 6 that stakeholder pressure affects Environmental proactivity, shows that this hypothesis is supported (P value < 0.05; 95% CI does not contain 0).
Hypothesis 7 resource availability affects the Environmental proactivity. The results show that this hypothesis is supported (P value < 0.05; 95% CI does not contain 0)
4.3.4. Mediating Analysis of Power, Legitimacy, and Urgency on Positive Environmental Practices
Based on Baron & Kenny's (1986) framework for testing mediation effects, as shown in Table 8, Models 1 and 2 did not reach significance. However, Model 3 demonstrated a significant result, indicating an indirect effect of urgency on proactive environmental practices through stakeholder pressure and resource availability, with a p-value of 0.035, a t-value of 2.107, and a 95% confidence interval (CI) of (0.034, 0.378). Since the CI does not include 0, it achieves significance. According to the VAF (variance accounted for) criterion suggested by Hair et al. (2014), mediation is determined by calculating VAF = indirect effect / (indirect effect + direct effect) = 57.38%. Consequently, Hypothesis 10 is supported, and the mediation is classified as partial.
5. Discussion and Conclusions
5.1. Major Findings
This study empirically extends Mitchell et al.'s (1997) salience model by revealing differentiated PLU attribute impacts: Legitimacy and urgency significantly drive pressure perception, whereas isolated power proves ineffective. This challenges conventional power-centric perspectives (Frooman, 1999) while supporting cognitive legitimacy theory (Crilly & Sloan, 2012), indicating corporate decisions prioritize social norm alignment over coercive influence.
Breaking from traditional homogeneous pressure assumptions, we quantify PLU attribute differential effects through salience scoring. Empirical results demonstrate legitimacy's explanatory power significantly surpasses power, compelling firms to prioritize institutional norm compliance (Mitchell et al., 1997). Crucially, legitimacy-driven pressures (e.g., CBAM compliance) and urgency-triggered imperatives (e.g., pollution crises) interact to induce corporate resource reallocation, thereby addressing critical gaps in stakeholder prioritization theory (Crilly & Sloan, 2012).
The ABV framework validation shows that stakeholder pressure can explain the variability of enterprise resource reallocation. While large enterprises leverage structural slack to buffer pressures, they must mitigate greenwashing risks arising from redundant environmental commitments. Conversely, SMEs constrained by agility reallocate operational budgets to urgent demands, necessitating pressure-tiered response mechanisms in policy design to prevent compliance cost overload (Jiang et al., 2021).
This study validates and extends the ABV-RBV integrated framework by revealing scale's dual moderating mechanism - demonstrating how organizational size moderates the decoupling of attention and resources, thereby providing size-sensitive amendments to ABV. Challenging traditional RBV assumptions (Barney, 1991), We found that external urgency pressure has led to the adjustment and relocation of enterprise resources, narrowing the gap in the adoption of proactive environmental practices between small and medium-sized enterprises and large companies.
That is to say, in situations with high emergency thresholds, the moderating effect of enterprise size will dissipate: 1. Large firms utilize institutional slack to stabilize environmental strategies under critical pressure levels. 2. SMEs adopt networked agility strategies through external collaborations, compensating resource gaps with resource efficiency gains. Thus, urgency-driven resource reallocation becomes the primary catalyst for PEPs adoption across organizational scales.
5.2. Theoretical Implications
This study pioneers an integrative PLU-ABV-RBV framework to explain variance in corporate environmental practices. Through structural equation modeling (SEM) validation, legitimacy demonstrates significantly stronger influence on resource allocation than power, with normative demands (e.g., CBAM compliance) driving increased environmental investments - challenging conventional power-centric perspectives (Mitchell et al., 1997). We validate that legitimacy claims capture more managerial attention than power-based demands, establishing an "attentional anchoring effect" and stakeholder ecosystem prediction model where legitimacy-driven decisions lag behind urgency-driven imperatives.
The research extends RBV by demonstrating how external pressures superseding resource scale effects challenge RBV's fundamental premises, revealing scale threshold effects wherein even resource-constrained SMEs adopt proactive measures under critical pressure levels. Crucially, environmental actions are incentivized not merely by internal resources but through institutional isomorphism mechanisms exceeding traditional RBV assumptions.
5.3. Practical Implications
Enterprises should develop PLU (Power, Legitimacy, Urgency) assessment tools to guide resource allocation, prioritizing environmental budgets for high-legitimacy and high-urgency stakeholder groups to mitigate conflicts and preserve corporate reputation. Large corporations can institutionalize innovation through environmental incubators, reallocating dormant resources (e.g., R&D budgets) to drive proactive ESG investments that transcend regulatory compliance and overcome institutional inertia. Small and medium-sized enterprises (SMEs) should leverage organizational agility via circular economy alliances and network collaborations, pooling technological costs while enhancing green innovation adoption efficiency - demonstrating environmental adaptability under resource-constrained contexts (Darnall et al., 2010).
Regardless of organizational scale, firms must integrate stakeholder pressures into strategic calculus by clarifying priority demands and deploying rapid-response mechanisms to strengthen environmental actions and reduce latent risks. This approach not only optimizes resource governance but fosters cross-departmental synergies, consolidating competitive advantages in increasingly sustainability-driven markets.
5.4. Limitations and Future Research
This study is based on cross-sectional data of Taiwan's manufacturing and service industries, with causal inference and external validity limitations (Podsakoff et al., 2003). Future research can adopt longitudinal design to track the evolution of strategies over 3-5 years and verify the universality of the PLU framework across industries such as energy vs. technology. The existing models have not fully incorporated internal decision-making factors (such as managers' risk preferences), and in the future, mixed methods can be combined to deepen micro mechanism analysis.
5.5. Conclusion
The comprehensive PLU-ABV-RBV framework confirms that legitimacy and urgency significantly outweigh power in promoting environmental resource allocation, and the moderating effect of firm size explains the strategic heterogeneity across organizational scales. This study advocates for the establishment of a dynamic policy framework that includes real-time PLU monitoring, while advancing an AI based saliency assessment system to quantify stakeholder stress thresholds. It is crucial that we call for empirical exploration of resource flexibility mechanisms (such as modular budget architecture) that interact with digital governance infrastructure, and propose that these synergies can increase the adoption rate of sustainable practices in various industries.
Funding
This research received no external financial support.
Appendix
- Power
This stakeholder group had power, whether used or not; This stakeholder group had access to, influence on, or the ability to impact our firm, whether used or not; This stakeholder group had the power to enforce its claims.
- 2.
- Legitimacy
The claims of this particular stakeholder group were viewed by our management team as legitimate; Our management team believes that the claims of this stakeholder group were not proper or appropriate (R); The claims of this group were legitimate in the eyes of our management team.
- 3.
- Urgency
This stakeholder group exhibited urgency in its relationship with our firm; This stakeholder group actively sought the attention of our management team; This stakeholder group urgently communicated its claims to our firm.
- 4.
- Stakeholder pressure
Customers; (2) Suppliers; (3) Employees of the firm; (4) Shareholders of the firm; (5) Landing financial institutions; (6) Rivals; (7) Agreements; (8) ENGOs; (9) Media; (10) Regulatory authorities.
- 5.
- Resource availability
Our firm owns sufficient human resources to implement environmental management practices; Our firm owns sufficient financial resources to implement environmental management practices; Our firm owns adequate physical resources to implement environmental management practices; Our firm owns sufficient intangible assets to implement environmental management practices.
- 6.
-
Environmental proactivity
- (1)
-
Planning and Organizational PracticesThe company has a clear definition of the implementation of environmental policies; Our company will undertake clear environmental responsibilities; For managers and employees, we have done environmental-related education and training.
- (2)
-
Process DesignThe process design of our company focuses on reducing the consumption of energy and natural resources in operation; The process design of our company focuses on the configuration of clean (environmental) technology or equipment; Our company has a high preference for environmental protection products in purchasing.
- (3)
-
Product DesignOur products (services) will use environmentally friendly materials to replace polluting and harmful materials; Our product (service) design focuses on reducing resource consumption and waste generation in the process of production and distribution; The products (services) of our company use decomposable, repeatable, and recyclable designs.
- (4)
-
Communicational PracticesOur company will prepare environmental reports regularly; Our company will cooperate with ecological organizations or sponsor environmental and ecological activities; Our company will regularly and voluntarily provide information related to environmental management.
References
- Agle, B. R. , Mitchell, R. K., & Sonnenfeld, J. A. Who matters to CEOs? An investigation of stakeholder attributes and salience, corporate performance, and CEO values. Academy of Management Journal 1999, 42, 507–525. [Google Scholar] [CrossRef]
- Andreou, P. C. , & Kellard, N. Corporate environmental proactivity: A meta-analytic review. Journal of Business Ethics 2021, 174, 521–545. [Google Scholar] [CrossRef]
- Bansal, P. , & Roth, K. Why companies go green: A model of ecological responsiveness. Academy of Management Journal 2000, 43, 717–736. [Google Scholar] [CrossRef]
- Barney, J. Firm resources and sustained competitive advantage. Journal of Management 1991, 17, 99–120. [Google Scholar] [CrossRef]
- Buysse, K. , & Verbeke, A. Proactive environmental strategies: A stakeholder management perspective. Strategic Management Journal 2003, 24, 453–470. [Google Scholar] [CrossRef]
- Chang, C.-H. , & Chen, Y.-S. Green organizational identity and environmental performance: The mediating role of sustainability exploration and exploitation. Journal of Business Research 2020, 112, 202–212. [Google Scholar] [CrossRef]
- Crilly, D. , & Sloan, P. Enterprise logic: Explaining corporate attention to stakeholders from the ‘inside-out’. Strategic Management Journal 2012, 33, 1174–1193. [Google Scholar] [CrossRef]
- Crossley, R. M. , Hassan, L. M., & Shiu, E. M. The EU Carbon Border Adjustment Mechanism: Implications for corporate environmental strategy. Journal of International Business Policy 2021, 4, 342–360. [Google Scholar] [CrossRef]
- Dahl, R. A. The concept of power. Behavioral Science 1957, 2, 201–215. [Google Scholar] [CrossRef]
- Dal Maso, L. , Liberatore, G., & Mazzi, F. Sustainability performance and stakeholder pressure: The moderating role of resource availability. Business Strategy and the Environment 2020, 29, 1230–1245. [Google Scholar] [CrossRef]
- Darnall, N. , Henriques, I., & Sadorsky, P. Adopting proactive environmental strategy: The influence of stakeholders and firm size. Journal of Management Studies 2010, 47, 1072–1094. [Google Scholar] [CrossRef]
- Donaldson, T. , & Preston, L. E. The stakeholder theory of the corporation: Concepts, evidence, and implications. Academy of Management Review 1995, 20, 65–91. [Google Scholar] [CrossRef]
- Frooman, J. Stakeholder influence strategies. Academy of Management Review 1999, 24, 191–205. [Google Scholar] [CrossRef]
- González-Benito, J. , & González-Benito, Ó. Environmental proactivity and business performance: An empirical analysis. Omega 2005, 33, 1–15. [Google Scholar] [CrossRef]
- Hair, J. F. , Hult, G. T. M., Ringle, C. M., & Sarstedt, M. (2018). A primer on partial least squares structural equation modeling (PLS-SEM) (2nd ed.). Sage Publications.
- Huergo, E. , & Jaumandreu, J. Firms’ age, process innovation and productivity growth. International Journal of Industrial Organization 2004, 22, 541–559. [Google Scholar] [CrossRef]
- Jawahar, I. M. , & McLaughlin, G. L. Toward a descriptive stakeholder theory: An organizational life cycle approach. Academy of Management Review 2001, 26, 397–414. [Google Scholar] [CrossRef]
- Jiang, Y. , Xue, L., & Zhang, J. Social media urgency and technology lock-in in environmental innovation. Technological Forecasting and Social Change 2022, 178, 121586. [Google Scholar] [CrossRef]
- Ko, W. W. , Liu, G., & Tse, E. Y. Stakeholder pressure and corporate environmental strategy: A meta-analytic review. Journal of Business Ethics 2021, 173, 491–513. [Google Scholar] [CrossRef]
- Kolk, A. , & Pinkse, J. The integration of corporate governance in corporate social responsibility disclosures. Corporate Social Responsibility and Environmental Management 2010, 17, 15–26. [Google Scholar] [CrossRef]
- Liu, X. , Anbumozhi, V., & Kimura, F. Determinants of corporate environmental responsibility in emerging markets: Evidence from China. Journal of Cleaner Production 2015, 106, 507–516. [Google Scholar] [CrossRef]
- Miles, S. Stakeholder theory classification: A theoretical and empirical evaluation of definitions. Journal of Business Ethics 2017, 142, 437–459. [Google Scholar] [CrossRef]
- Mitchell, R. K. , Agle, B. R., & Wood, D. J. Toward a theory of stakeholder identification and salience: Defining the principle of who and what really counts. Academy of Management Review 1997, 22, 853–886. [Google Scholar] [CrossRef]
- Ocasio, W. Towards an attention-based view of the firm. Strategic Management Journal 1997, 18, 187–206. [Google Scholar] [CrossRef]
- Ocasio, W. Attention to attention. Organization Science 2011, 22, 1286–1296. [Google Scholar] [CrossRef]
- Pfeffer, J. (1981). Power in organizations*. Pitman Publishing.
- Podsakoff, P. M. , MacKenzie, S. B., Lee, J.-Y., & Podsakoff, N. P. Common method biases in behavioral research: A critical review of the literature and recommended remedies. Journal of Applied Psychology 2003, 88, 879–903. [Google Scholar] [CrossRef]
- Prakash, A. Why do firms adopt ‘beyond-compliance’ environmental policies? Business Strategy and the Environment 2001, 10, 286–299. [Google Scholar] [CrossRef]
- Reyes-Santiago, M. R. , Sánchez-Medina, P. S., & Díaz-Pichardo, R. Stakeholder pressure and environmental proactivity: Moderating effects of competitiveness. Sustainability 2019, 11, 6102. [Google Scholar] [CrossRef]
- Sarstedt, M. , Hair, J. F., Ringle, C. M., Thiele, K. O., & Gudergan, S. P. Estimation issues with PLS and CBSEM: Where the bias lies! Journal of Business Research 2016, 69, 3998–4010. [Google Scholar] [CrossRef]
- Sharma, S. , & Vredenburg, H. Proactive corporate environmental strategy and the development of competitively valuable organizational capabilities. Strategic Management Journal 1998, 19, 729–753. [Google Scholar] [CrossRef]
- Suchman, M. C. Managing legitimacy: Strategic and institutional approaches. Academy of Management Review 1995, 20, 571–610. [Google Scholar] [CrossRef]
- Teece, D. J. Dynamic capabilities as (workable) management systems theory. Journal of Management & Organization 2018, 24, 359–368. [Google Scholar] [CrossRef]
- Udayasankar, K. Corporate social responsibility and firm size. Journal of Business Ethics 2008, 83, 167–175. [Google Scholar] [CrossRef]
- Villena, V. H. , Choi, T. Y., & Revilla, E. Revisiting the sustainability–performance relationship: A systematic literature review. Journal of Operations Management 2021, 67, 553–580. [Google Scholar] [CrossRef]
- Wang, Y. , Zhang, Y., & Zhang, C. Reducing common method bias in PLS analysis: The marker variable technique with data transformation. Industrial Management & Data Systems 2018, 118, 1837–1855. [Google Scholar] [CrossRef]
Figure 1.
Enterprise's proactive environmental decision-making behavior in the Context of Attention-Based View.
Figure 1.
Enterprise's proactive environmental decision-making behavior in the Context of Attention-Based View.
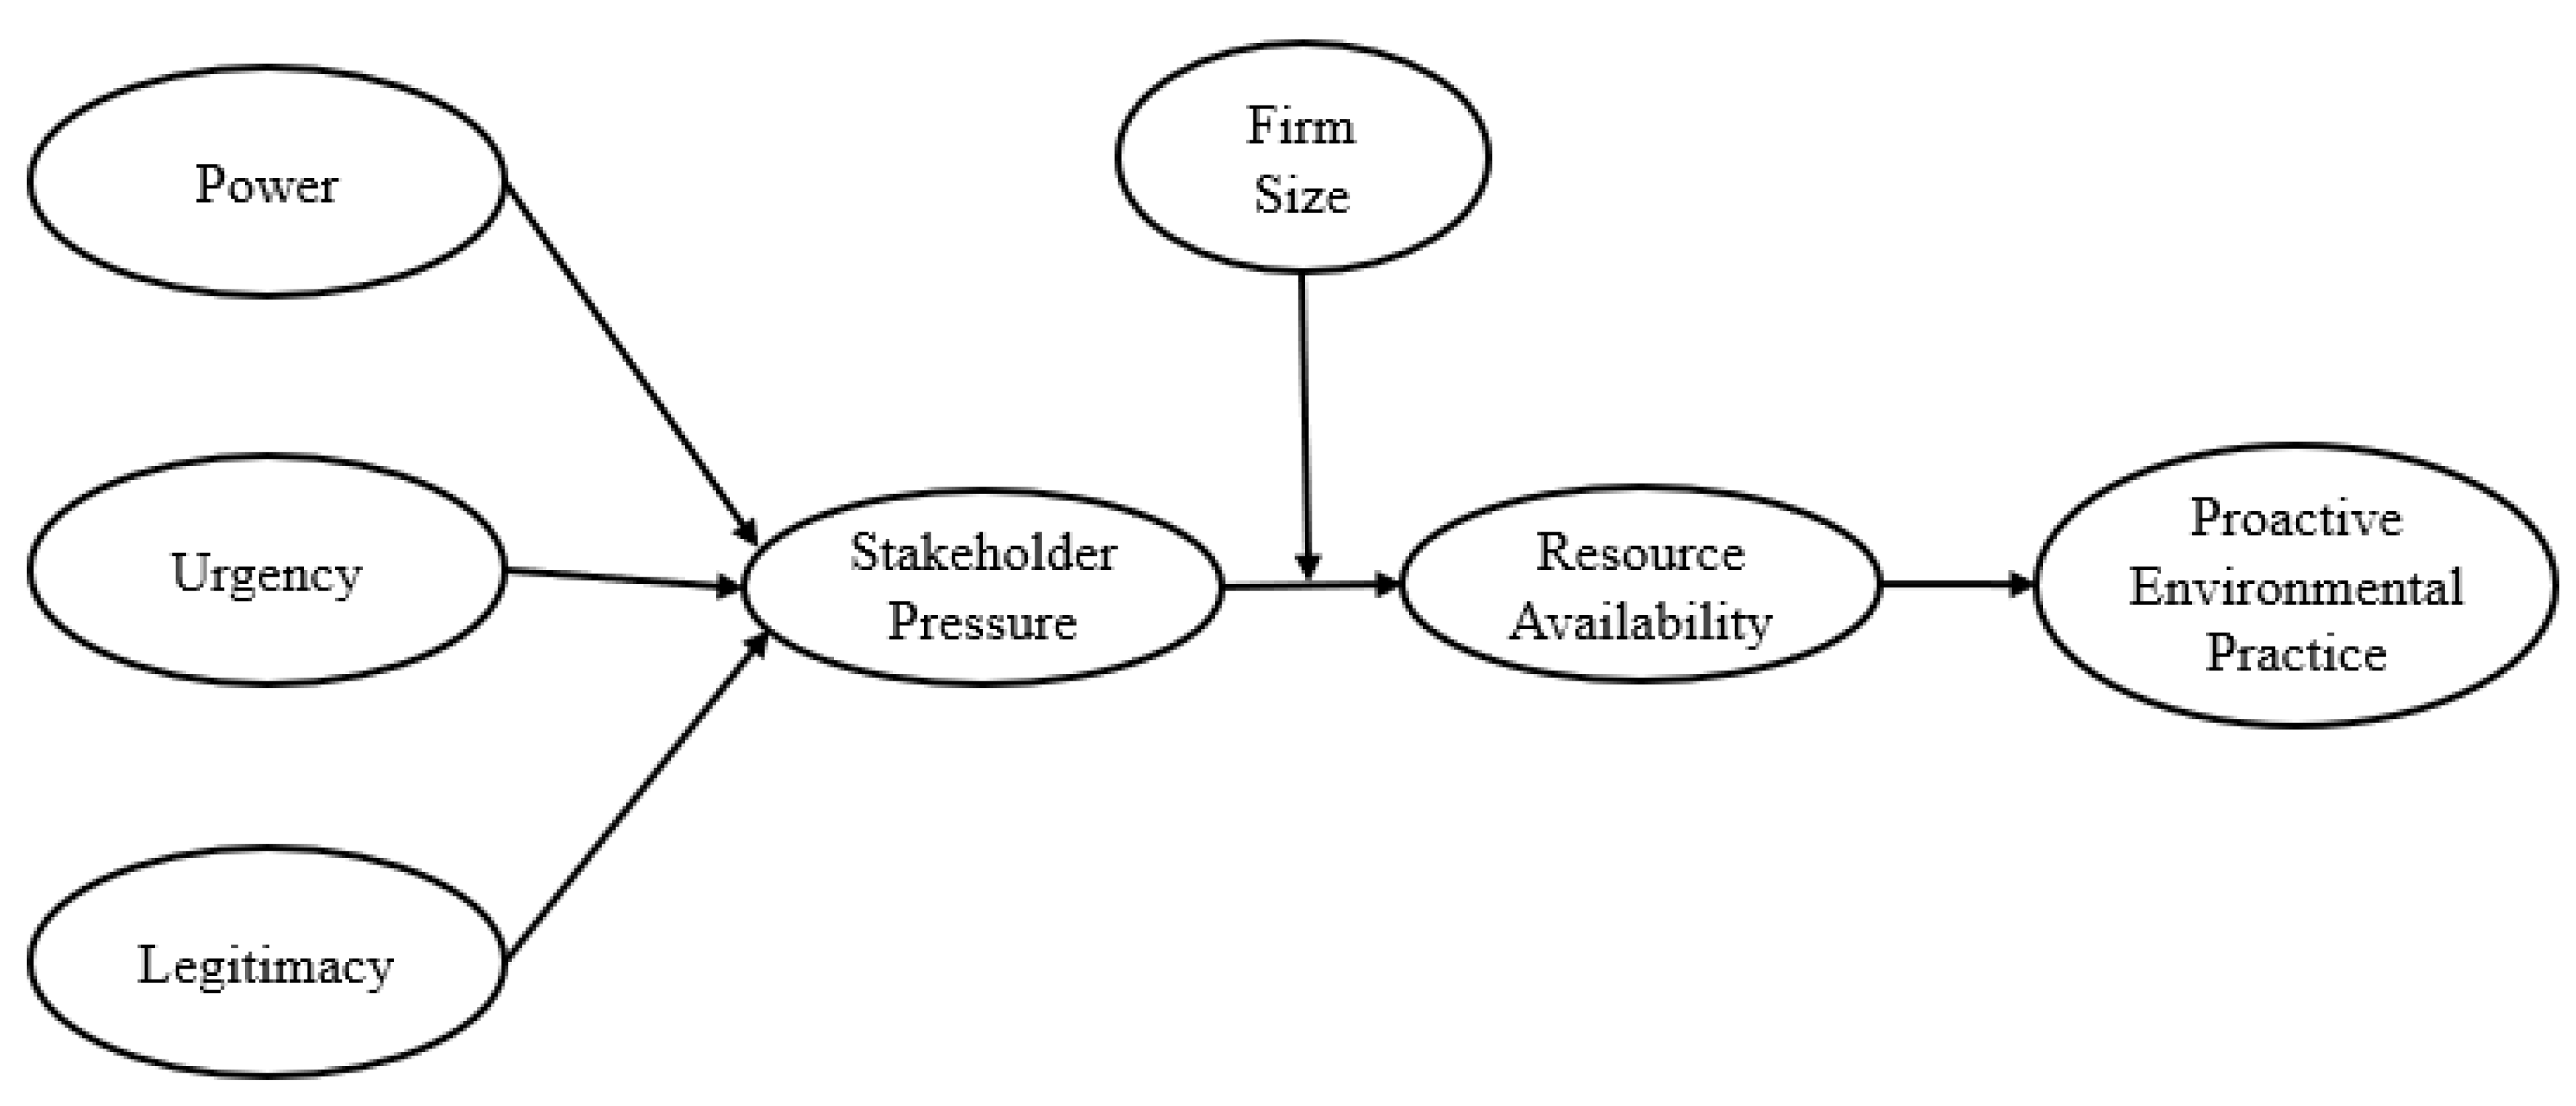

Table 1.
Empirical Study on Trigger Factors of Relevant Environmental Initiative.
| Author |
|
|
| Shi & Tsai (2022) |
|
|
| Ko et al., (2021) |
|
|
| Danso et al., (2020) |
|
|
| Seroka-Stolka & Fijorek, (2020) |
|
|
| Reyes-Santiago et al., (2019) |
|
|
| Darnall et al., (2010) |
|
|
| González-Benito, J., & González-Benito, O. (2005) |
|
|
Table 2.
Profile of firms and respondents.
| Item | Project | Frequency | Percentage |
|---|---|---|---|
| Gender | Male | 250 | 49.7 |
| Female | 253 | 50.3 | |
| Manager Level | Senior | 66 | 13.1 |
| Middle | 332 | 66.0 | |
| Specialized | 105 | 20.9 | |
| Industry Category | Manufacturing | 205 | 40.8 |
| Service | 298 | 59.2 | |
| Firm Age | 5 (Less) | 32 | 6.4 |
| 6-10 | 47 | 9.4 | |
| 11-15 | 55 | 10.9 | |
| 16-25 | 158 | 31.4 | |
| 25 (More) | 211 | 41.9 | |
| Employees | 1-5 | 39 | 7.8 |
| 6-50 | 130 | 25.8 | |
| 51-100 | 93 | 18.5 | |
| 101-200 | 47 | 9.3 | |
| 200 (More) | 194 | 38.6 | |
| Total | Sample Size | 503 | 100 |
Table 3.
Nonresponse bias test.
| Construct | Sig. Levene's Test | Sig. t-test for Equality of Means |
|---|---|---|
| POW | 0.829 | 0.425 |
| URG | 0.319 | 0.659 |
| LEG | 0.928 | 0.943 |
| SRP | 0.079 | 0.151 |
| REA | 0.675 | 0.555 |
| PES | 0.573 | 0.181 |
Note 1: Value are significant if < 0.05. Note 2: POW= power, LEG= legitimacy, URG= urgency, SPR= stakeholder pressure, REA= resource availability, PES= Environmental proactivity.
Table 4.
Construct indicators and measurement model.
| Construct | Item | mean | S.D. | Loading | α | CR | AVE | rho_A |
|---|---|---|---|---|---|---|---|---|
| POW | Pow1 | 3.940 | 0.791 | 0.859 | 0.801 | 0.882 | 0.713 | 0.829 |
| Pow2 | 4.020 | 0.803 | 0.873 | |||||
| Pow3 | 3.970 | 0.812 | 0.800 | |||||
| LEG | Leg1 | 3.690 | 0.908 | 0.819 | 0.763 | 0.863 | 0.678 | 0.773 |
| Leg2 | 3.682 | 0.769 | 0.799 | |||||
| Leg3 | 3.853 | 0.797 | 0.851 | |||||
| URG | Urg1 | 3.704 | 0.807 | 0.805 | 0.729 | 0.845 | 0.645 | 0.751 |
| Urg2 | 3.740 | 0.814 | 0.763 | |||||
| Urg3 | 3.926 | 0.847 | 0.838 | |||||
| SPR | Spr1 | 3.654 | 1.058 | 0.723 | 0.891 | 0.911 | 0.505 | 0.911 |
| Spr2 | 3.421 | 0.970 | 0.651 | |||||
| Spr3 | 3.569 | 1.057 | 0.756 | |||||
| Spr4 | 3.493 | 1.046 | 0.644 | |||||
| Spr5 | 3.252 | 0.985 | 0.698 | |||||
| Spr6 | 3.608 | 0.046 | 0.716 | |||||
| Spr7 | 3.640 | 0.045 | 0.704 | |||||
| Spr8 | 3.141 | 0.044 | 0.760 | |||||
| Spr9 | 3.346 | 0.047 | 0.735 | |||||
| Spr10 | 3.710 | 0.046 | 0.722 | |||||
| REA | Rea1 | 3.549 | 0.046 | 0.887 | 0.929 | 0.950 | 0.825 | 0.950 |
| Rea2 | 3.529 | 0.046 | 0.915 | |||||
| Rea3 | 3.551 | 0.045 | 0.918 | |||||
| Rea4 | 3.477 | 0.046 | 0.913 | |||||
| PES | Pes1 | 3.857 | 0.883 | 0.775 | 0.934 | 0.943 | 0.583 | 0.943 |
| Pes2 | 3.801 | 1.020 | 0.774 | |||||
| Pes3 | 3.596 | 1.142 | 0.828 | |||||
| Pes4 | 3.141 | 1.398 | 0.823 | |||||
| Pes5 | 3.048 | 1.389 | 0.763 | |||||
| Pes6 | 3.139 | 1.351 | 0.756 | |||||
| Pes7 | 3.537 | 1.144 | 0.559 | |||||
| Pes8 | 3.513 | 1.196 | 0.649 | |||||
| Pes9 | 3.495 | 1.181 | 0.733 | |||||
| Pes10 | 3.523 | 1.100 | 0.816 | |||||
| Pes11 | 3.529 | 1.109 | 0.816 | |||||
| Pes12 | 3.463 | 1.187 | 0.823 |
Note 1: POW= power, LEG= legitimacy, URG= urgency, SPR= stakeholder pressure, REA= resource availability, PES= Environmental proactivity. Note 2: AVE= average variation extraction; CR= combination reliability.
Table 5.
Means, Standard Deviations, and Correlations matrix.
| Construct | POW | LEG | URG | SPR | REA | PES |
|---|---|---|---|---|---|---|
| POW | 0.844 | 0.424 | 0.725 | 0.265 | 0.099 | 0.215 |
| LEG | 0.330 | 0.823 | 0.599 | 0.315 | 0.211 | 0.253 |
| URG | 0.547 | 0.445 | 0.803 | 0.381 | 0.208 | 0.262 |
| SPR | 0.231 | 0.263 | 0.316 | 0.711 | 0.485 | 0.542 |
| REA | 0.087 | 0.182 | 0.165 | 0.438 | 0.908 | 0.736 |
| PES | 0.171 | 0.209 | 0.209 | 0.492 | 0.695 | 0.764 |
| MEAN | 3.977 | 3.742 | 3.790 | 3.483 | 3.526 | 3.470 |
| S.D. | 0.678 | 0.679 | 0.663 | 0.725 | 0.935 | 0.900 |
Note1: POW= power, LEG= legitimacy, URG= urgency, SPR= stakeholders pressure, REA= resource availability, PES= Environmental proactivity. Note 2: The diagonal repres ents the square root of average variation extraction (AVE), and the triangle below represents the Fornell-Larckrer criterion. The upper triangle represents the Heterotrait- Monotrait Ratio criterion.
Table 6.
Structural model results.
| Construct | R² | Adj. R² | Q² | f² | VIF |
|---|---|---|---|---|---|
| POW | - | - | - | 0.003 | 1.453 |
| LEG | - | - | - | 0.018 | 1.273 |
| URG | - | - | - | 0.035 | 1.609 |
| SPR | 0.136 | 0.127 | 0.109 | 0.210 | 1.931 |
| REA | 0.218 | 0.210 | 0.022 | 0.602 | 1.245 |
| PES | 0.532 | 0.528 | 0.055 | - | - |
Note1: POW= power, LEG= legitimacy, URG= urgency, SPR= stakeholders pressure, REA= resource availability, PES= Environmental proactivity.
Table 7.
Relationships between variables.
| Hypothesis | Structural path |
Coef(β) | S.D | T Statistics | P Values |
95%CI LL |
95%CIUL |
|---|---|---|---|---|---|---|---|
| H1 | POW→SPR | 0.067 | 0.059 | 1.137 | 0.256 | -0.044 | 0.191 |
| H2 | LEG→SPR | 0.146 | 0.051 | 2.847 | 0.004 | 0.049 | 0.247 |
| H3 | URG→SPR | 0.215 | 0.066 | 3.239 | 0.001 | 0.087 | 0.341 |
| H4 | SPR→REA | 0.563 | 0.051 | 10.979 | 0.000 | 0.459 | 0.662 |
| H5 | SIZE*SPR→REA | 0.239 | 0.040 | 5.928 | 0.000 | -0.463 | -0.088 |
| H6 | SPR→PES | -0.277 | 0.095 | 2.904 | 0.004 | 0.165 | 0.322 |
| H7 | REA→PES | 0.588 | 0.038 | 15.285 | 0.000 | 0.508 | 0.657 |
Note1: p<0.001***; p<0.01**; p<0.05* shows Significance level. Note2: POW= power, LEG= legitimacy, URG= urgency, SPR= stakeholder pressure, REA= resource availability, PES= Environmental proactivity.
Table 8.
Relationships between variables.
| Hypothesis | Structural path |
Direct Path Effect |
Indirect Path Effect |
Overall path effect |
95%CI LL |
95%CI UL |
VAF |
|---|---|---|---|---|---|---|---|
|
P t |
P t |
||||||
| H8 | POW → SPR → REA →PES |
0.898 (0.128) |
0.900 (0.126) |
1.798 | -0.133 | 0.126 | Not significant |
| H9 | LEG → SPR → REA →PES |
0.145 (1.457) |
0.164 (1.393) |
0.309 | -0.018 | 0.193 | Not significant |
| H10 | URG → SPR → REA →PES |
0.026 (2.234) |
0.035 (2.107) |
0.061 | 0.034 | 0.378 | 57.38% |
Note1: p<0.001***; p<0.01**; p<0.05* shows Significance level. Note2: POW= power, LEG= legitimacy, URG= urgency, SPR= stakeholder pressure, REA= resource availability, PES= Environmental proactivity. VAF(Variance Accounted for).
Disclaimer/Publisher’s Note: The statements, opinions and data contained in all publications are solely those of the individual author(s) and contributor(s) and not of MDPI and/or the editor(s). MDPI and/or the editor(s) disclaim responsibility for any injury to people or property resulting from any ideas, methods, instructions or products referred to in the content. |
© 2025 by the authors. Licensee MDPI, Basel, Switzerland. This article is an open access article distributed under the terms and conditions of the Creative Commons Attribution (CC BY) license (http://creativecommons.org/licenses/by/4.0/).
Copyright: This open access article is published under a Creative Commons CC BY 4.0 license, which permit the free download, distribution, and reuse, provided that the author and preprint are cited in any reuse.


