
Submitted:
20 June 2025
Posted:
23 June 2025
You are already at the latest version
Abstract
Seedlings of the ecologically important and “critically endangered” tree, Ocotea monteverdensisis, are experiencing high mortality in the cloud forests of Monteverde, Costa Rica at the onset of the wet season, yet no previous work has been conducted to determine the disease etiology. Here, healthy and diseased Plant Root and adjacent Bulk soils were analyzed for total organic carbon and nitrogen (N), respiration, nitrate, and ammonium, and DNA sequence-based bacterial and fungal community composition. All N metric levels were greater in Diseased vs. Healthy Plant Root soils, which could enhance pathogen growth and pathogenic mechanisms. Greater DNA percentages from several potential pathogens were found in Diseased vs. Healthy Plant Root soils, suggesting a root pathogen etiology. The DNA percentage of the fungus Mycosphaerella was present at greater levels in the Diseased Plant Root soils than other potential pathogens (about 11.7% vs. < 3.2%). Mycosphaerella causes similar diseases in other plants, including coffee, often after onset of the wet season. Similarly, the O. monteverdensis disease occurs in seedlings planted within or near former coffee plantations often at wet season onset. Although fungal pure culture isolation and transmission studies are needed, this is the first evidence of a potential etiologic agent of this disease.
Keywords:
Ocotea monteverdensis
; disease of Ocotea monteverdensis
; seedling disease
; fungal plant pathogens
; Mycosphaerella disease
1. Introduction
Restoration of tropical forests is essential, and the survival of seedlings is critical to the success of these efforts. Multiple factors may impact seedling survival and of those, fungal pathogens have been shown to be a significant, if not the greatest, threat to leaf health and seedling survival (Hazelwood et al. 2021). Recent reports indicate that potential fungal pathogens are increasing in response to ongoing climate change, with expanding species ranges, greater diversity, and enhanced resilience (Williams et al., 2024). It is believed that natural systems may be more vulnerable to increasing pathogens (Burdon and Zhan 2020), and the warm, humid tropics may be especially susceptible. In light of these growing concerns, emerging models are beginning to reveal the complexity of these impacts (Yang et al., 2023). Given the known challenges and costs associated with tropical forest restoration, identifying and protecting plants from these fungal pathogens is a priority. A crucial first step is to identify the specific types of fungal pathogens harming these restoration efforts.
A severely threatened tree species, Ocotea monteverdensisis, is suspected of suffering high mortality rates due to a systemic pathogen that suddenly causes necrosis of seedling leaves and subsequent death with the onset of rains during the wet season. It is one of approximately 96 species of the Lauraceae family that comprises a large percentage of the diversity of the forests in the Monteverde region of Costa Rica. This tree is listed as globally “critically endangered” (IUCN, 2019; Joslin et al., 2018), as less than 1000 mature individuals remain within its principal occupancy range in Monteverde, where a large percentage of the mature forest of this region was cleared for timber, human development, or agricultural uses (Joslin et al. 2018). Only 5% of the remaining trees in this region are on permanently protected land (Powell and Bjork 2004).
Due to the highly threatened status of O. monteverdensis and its ecological importance as the preferred food source of large frugivorous birds such as the vulnerable Three-wattled Bellbird (Procnias tricarunculatus) (Hamilton et al. 2018; Haber et al. 2000), there are multiple coordinated efforts to protect mature trees, plant seedlings, and increase awareness by the Fundacion Conservacionista Costarricense (FCC), and the Monteverde Institute. The Franklinia Foundation has provided funding for these programs with a special emphasis on augmenting existing forests and restoring abandoned pastures with plantings of threatened tree species, and to advance the knowledge regarding the factors impacting on survival of O. monteverdensis.
There have been a limited number of studies concerning O. monteverdensis, even though its ecological importance in the cloud and humid forests has been recognized (Wheelwright and Nadkarni, 2014; Joslin et al., 2018; Hamilton et al. 2018). The genetic variation within the limited population size is not known, and reproductive success to mature tree stage has not been determined. There are indications that O. monteverdensis is not regenerating its population sufficiently, which is thought to be due to decreased amounts of habitat appropriate for regeneration (Guindon 1997; Harvey et al., 2008; Sciara and Fite 2015).
From our collaborative research with the FCC restoration program, we have assessed seedling survival that shows high mortality rates of seedlings planted in both forest fragments and abandoned pasture habitats. The seedling mortality continues past its fourth year post- planting, instead of reaching a plateau after two-years as found with other tree species (Hamilton et al., 2025 for submission). Of special note is the observed, sudden death of seedlings that starts with necrosis of most leaves shortly after the first rains of the May to June rainy season. To date, even with this suspicion of pathogen involvement in seedling mortality, no work has been conducted on the root soil microbial community or activity, nor on the carbon and nitrogen components associated with healthy and diseased seedlings.
The current study was conducted to begin to address the question of the role of a pathogen in the mortality of young O. monteverdensis. While necrotropic fungal pathogens are more common (Milici et al.l, 2024) , the sudden, systemic death of O. monteverdensis seedlings suggests a below-ground pathogen. For this work, the soil carbon and nitrogen metrics were assessed, and the overall bacterial and fungal community compositions were determined (using Illumina next generation DNA sequencing) within the root-associated and the plant bulk soil (soil within the dripline) of seedlings planted in reforested areas within the Monteverde Premontane wet forest. In addition, the most common fungal and bacterial genera from each sample were determined, with any potential pathogens identified. The objective was to determine if any bacterial or fungal pathogens could be identified within the diseased plant root-associated soils that were at greater relative abundance levels than in the healthy plant-root soils, with the goal of identifying potential pathogens to target for future work.
2. Methods and Materials
2.1. Sample Site and Collections
The Fundacion Conservacionista Costarricense (FCC – www.fccmonteverde.org) was founded in 2002 to address deforestation and forest fragmentation on the Pacific slope of Costa Rica. After protecting several ecological refuges, the FCC’s major conservation contribution has distributed and planted over 140 native tree species throughout the Bellbird Biological Corridor, ranging from sea level to 1800m asl. Over 300,000 native tree seedlings have been given to 494 landowners as of 2024 to restore tropical forest that replicates the biodiversity and ecosystem functions of older, natural forests. The FCC also promotes plantings of threatened species, whether globally on the IUCN Red List or of regional concern. With this focus, over 5000 O. monteverdensis seedlings have been planted, with the monitoring of 950 individuals.
Ocotea monteverdensis is a critically endangered tree that is endemic to Costa Rica, with its core population found in the Tropical Premontane Wet life zone on the Pacific slope of the Cordillera de Tilarán (between 10ᵒ 25’ N and 10ᵒ16’ N, and longitudes 84ᵒ 42’ W and 84ᵒ 55’ W) at elevations between 1200 and 1500 m asl (Gonzalez and Proveda, 2007; Haber et al. 2000; Tropicos.org, 2013). Ocotea monteverdensis is a large canopy tree that produces 3-4 cm long avocado fruits every three years on average, with 64% synchrony within the species (Hamilton et al. 2018). Once common in the Monteverde region, it was previously harvested for its fine, red wood (Haber et al. 2000).
Our research alongside planting efforts by the FCC found survival rates that vary by site. An experiment to test survival at different elevations within the tree’s natural range resulted in an observed 16.7% four-year survival in forest habitats (n=684) and a 45.3% survival in pastures (n=317). Further analysis is necessary to determine the factors affecting its planted survival, especially given that the mortality of O. monteverdensis seedlings continues past the usual 2-year after planting mark. Studies examining natural regeneration also show concerns regarding seedling success (Sciara and Fite 2015).
There is a suspicion that the high mortality of the seedlings within the first planted year may be caused by a pathogen. This is based on the observation that the seedling mortality post-planting is associated with a sequential pattern of chlorosis (Figure 1a), followed by development of brown spots (Figure 1b,c), then curling and wilting of the leaves, (Figure 1d) followed by a sudden death and drop of all its leaves, leading to plant death. This usually occurs after the start of the rainy season and involves seedlings that are in their first two years after planting.
The site used for this study is located at 1430m asl in the Premontane Wet Life Zone and receives an average of over 2863.2 mm of precipitation per year (LaVal 2023). In 2021, 6 seedlings of diseased and 6 of non-diseased O. monteverdensis were used for this study. The seedlings were raised from the same seed stock, in the same nursery with equivalent watering and seedling care, and with the same soil source used in the seedling bags. The seedlings were planted in 2020 at the FCC’s Crandell Memorial Reserve, augmenting a reforestation effort of abandoned pasture done in 2008, and all were planted under 13-year-old O. monteverdensis thereby resulting in light availability being reduced to a partial shade status. Of the 82 planted seedlings, 62 had survived at the time of sampling in 2021. They were planted with an average height of 20.3 cm with 13.8 leaves. After one year, the average height was 23.8 with 16.7 leaves. The 6 healthy and 6 diseased young O. monteverdensis used in this study were all 20-30 cm in height and separated from adjacent sampled seedlings by > 2 m, had been propagated from seeds in the FCC nursery, maintained there for about 1 year, and had been planted in the study area 1 year prior to sampling.
For collection of soil from the 6 heathy and 6 diseased plants, 4 soil cores 10 cm deep were collected at the cardinal points around the plant at a distance from the plant equal to 75% of the dripline distance (between 10 cm to 16 cm from the plant base) using a 7.5 cm x 15 cm x 1.25 cm soil profiler. The 4 cores from individual plants were stored in sterile plastic bags. These samples are hereafter called the Plant Bulk Soil samples. After collection of the soil from an individual plant, cuts were made in the soil around the same plant that were approximately 3 cm diameter distance from the plant base to allow easy removal of the plant and root system. This plant root soil sample was placed in a sterile bag. In the lab, the loose soil and the soil attached to the roots were collected, stored in sterile bags and hereafter called the Plant Root Soil samples. This process resulted in collection of 6 Healthy and 6 Diseased Plant Bulk Soil and Plant Root Soil samples to be used for analysis. All collection tools and gloves were disinfected with 70% ethanol between individual plants and between collection of Plant Soil and Plant Root samples to inhibit cross contamination. All field moist soil samples were passed through an ASTM No. 4 sieve (about 5 mm openings) previously disinfected with 70% ethanol.
2.2. Soil Environmental Metrics
Subsamples from each sample were analyzed at the Center for Tropical Agriculture Research and Education (CATIÉ) Laboratory in Turrialba, Costa Rica for all C and N metrics. This included determination of the total organic C (TOC) mass by dry combustion analysis (Anderson and Ingram, 1993), the total N (TN) mass by standard Kjeldahl method using a Thermofinigan EA12 autoanalyzer (San Jose, CA, USA), the respiration level as CO2 (Resp) by standard closed vessel methods (Alef and Nannipieri, 1995), and both the levels of nitrate (NO3-) and ammonium (NH4+) from 2M KCl extracts using the spectrophotometric methods described in Alef and Nannapieri (1995).
2.3. DNA Extraction, Sequencing, and Bioinformatics
Total soil DNA was extracted from three 0.33g replicate sub-samples from each soil sample using the MoBio PowerSoil DNA Isolation Kit (MO BIO Laboratories Inc., Carlsbad, CA, USA), with the concentration and purity determined as the A260/A280 ratio of the individual DNA samples using a NanoDrop 1000 spectrophotometer (ThermoFisher Scientific, Waltham, MA). Briefly, A 2-step PCR amplification of the sample DNA was used to target the nuclear internal transcribed spacer (ITS) ribosomal RNA gene region for fungi (Gardes and Bruns, 1993), and the v3 and v4 of 16S ribosomal RNA gene region for bacteria (Caporaso et al., 2010), with all methods for amplification, Illumina sequencing and bioinformatics previously described in detail in McGee et al., (2018). All sequence data were submitted to NCBI Sequence Read Archive (NCBI Bioproject number PRJNA1019742). To normalize the effects of uneven numbers of sequences per sample, the number of times a specifically identified genus appeared in a sample was converted to mean proportion of the sequences (MPS) per sample, as recommended by Weiss et al., (2017).
The total of all bacterial and fungal taxa identified by DNA sequencing methods are hereafter referred to as the Total Bacterial and the Total Fungal communities in this study. A variety of resources was used to identify bacterial and fungal genera that were potential plant pathogens. These resources included: FungalTraits (Põlme et al., 2020), FAPROTAX (https://pages.uoregon.edu/slouca/LoucaLab/archive/FAPROTAX/lib/php/index.php), the National Collection of Plant Pathogenic Bacteria in the UK (https://www.ukbrcn.org/who-we-are/national-collection-of-plant-pathogenic-bacteria-ncppb/), the National Collection of Plant Pathogenic Fungi in the UK (https://www.ukbrcn.org/who-we-are/national-collection-of-pathogenic-fungi-ncpf/), the USA National Fungus Collection (https://www.ars.usda.gov/), Plant Pathology (Agrios, 2005), a 200 page list of fungal plant pathogens collated in Wikipedia (https://en.wikipedia.org/wiki/Category:Fungal_plant_pathogens_and_diseases), and a list of pathogens causing plant diseases by the University of California Agriculture and Natural Resources (https://ipm.ucanr.edu/PMG/diseases/diseaseslist.html). From these resources, bacterial and fungal genera that were potential plant pathogens were identified in the different samples and are hereafter referred to as the Bacterial Pathogen and Fungal Pathogen communities. These are listed in Supplementary Table S1. The resources FungalTraits and FAPROTAX were also used to determine other potential functional groups of the bacterial and fungal genera.
2.4. Data Analysis
All differences in the mean values of the soil sample TOC, TN, NH4+, NO3-, and respiration (CO2) were conducted using one-way ANOVA tests in SPSS (v.27, Armonk, NY, USA) with the sample year as the predictor variable. Prior to ANOVA, the Levene’s test was performed in SPSS to determine homogeneity of the variances of the data. All data had p values > 0.05, suggesting the use of the Tukey’s HSD post-hoc test was appropriate.
The MPS values for all microbial MPS values were 4th root transformed, as recommended by Anderson et al. (2008). The 4th root transformed MPS values were converted into Bray-Curtis similarity matrices and analyzed for differences in the composition of the Total Bacterial, Bacterial Pathogenic, Total Fungal and Fungal Pathogenic communities using the analysis of similarity (ANOSIM) routine performed in PRIMER-E (Anderson et al., 2008), which provided R and p values for the main and pairwise tests. The strength of any of these differences was determined using the Canonical Analysis of Principal Coordinates (CAP) method (Anderson and Willis 2003; Clarke and Gorley 2006) in PRIMER-E with the PERMANOVA + add-on. The CAP axis R2 values ≥ 0.7 represent strong compositional differences, R2 = 0.5 to 0.69 represents moderate differences, R2 = 0.20 to < 0.5 represents weak differences, and R2 < 0.20 suggests no differences. The differences in MPS values of the Bacterial Pathogens and Fungal Pathogens between the healthy and diseased Plant Bulk soils and Plant Root soils were determined using the Mann-Whitney U test in SPSS.
To further compare differences in microbial community composition between the different healthy and diseased plant soil samples, the Similarity Percentage Analysis (SIMPER) in PRIMER-E routine was used on the 4th root transformed MPS data to demonstrate differences in the Percent Taxonomic Dissimilarity. As well, the richness (as number of genera) and diversity (as Shannon’s H index) were calculated, and differences in mean values of these metrics between the healthy and diseased Bulk Soil and Root Soil samples determined using the Mann-Whitney U test in SPSS. Lastly, the differences in MPS of the more common (MPS > 1%) Total Fungal and Total Bacterial taxa were compared for the different paired healthy and diseased soil samples by Mann-Whitney analyses in SPSS. In addition, the potential functions of these taxa were determined using the resources mentioned above.
3. Results
3.1. Differences in Soil C and N Metrics:
There were no differences (all p values > 0.09) in the levels of TOC or respiration between the diseased compared to the healthy Plant root soils, but the levels of TN, NH4+ and NO3- were all greater (p range = 0.046 to 0.055) in the diseased Plant Root soils compared to that in the healthy Plant Root soils (Table 1). The levels of TN, NH4+, NO3-, and were all greater (all p values < 0.00`) in the diseased Plant Bulk soil compared to that in the healthy Plant Bulk soil, but there were no differences in respiration levels between the soils (Table 1).
3.2. Differences in Community Compositions:
The ANOSIM results (Table 2) showed there were differences in the Total Bacterial community compositions between the healthy and diseased Plant Root (R = 0.566, p = 0.003) and Plant Bulk soils (R = 0.416, p = 0.0002). Similarly, there were differences in Bacterial Pathogen communities between the healthy and disease Plant Root (R = 0.563, p = 0.004) and Plant Bulk soils (R = 0.485, p = 0.002). The CAP findings for these comparisons (Table 2) showed all these differences were considered as strong differences in community composition (CAP R2 range of 0.706 to 0.876, p values = 0.0001 and 0.0002). The ANOSIM results showed there were differences in the Total Fungal and Fungal Pathogen community compositions (Table 2) between the Healthy and Diseased Plant Root soils (R = 0.752, p = 0.004; and R = 0.554, p = 0.002). There were also differences (Table 2) in the Fungal Pathogen community composition between the healthy and diseased Plant Bulk soil (R = 0.231, p = 0.05), but not in the Total Fungal community composition between the healthy and diseased Plant Bulk soil (R = 0.046; p = 0.273). The CAP findings for these comparisons (Table 2) showed the differences in the Total Fungal and Fungal Pathogen community compositions were strong between both the healthy and diseased Plant Root soils and the Plant Bulk soils (R2 = 0.801, p = 0.0022, and R2 = 0.855, p = 0.0008). The CAP results showed that between the healthy and diseased Plant Bulk soils the differences in the Total Fungal community compositions were very weak (R2 = 0.223; p = 0.0022) and the differences in community composition of the Fungal Pathogens were moderate (R2 = 0.599; p = 0.008).
There were no differences observed in the MPS (Table 3) of the Bacterial Pathogen community between the healthy and diseased Plant Root soils (p = 0.873) or Plant Bulk soils (p = 0.109). There was also no difference in the MPS of the Fungal Pathogens between the healthy and diseased Plant Bulk soils (p = 0.749). However, the MPS of the Fungal Pathogens was greater (p = 0.016) in the diseased Plant Root soils compared to the healthy Plant Root soils (45.35% vs. 15.25%).
There were no differences in percent taxonomic dissimilarity of either the Total Bacteria or Bacterial Pathogen communities (Table 4) between the healthy and diseased Plant Bulk soil (41.97% vs. 42.19%) or Plant Root soil (36.42% vs. 36.52%). However, there were differences in the percent taxonomic dissimilarity (Table 4) of the Total Fungal and Fungal Pathogen communities between the healthy and diseased Plant Root soils (55.65% vs. 63.66%, and 50.16% vs, 61.34%, respectively). There were no differences in the richness or diversity of the Total Bacterial or Bacterial Pathogen communities (Table 4) between the healthy and diseased Plant Roots or Plant Bulk soils (p values > 0.4). There were also no differences in the richness or diversity of the Total Fungal communities (Table 4) between the healthy and diseased Plant Bulk soils (p values > 0.26). However, the richness of the Total Fungal and the Fungal Pathogen communities were greater in the diseased compared to the healthy Plant Root soils (86.83 vs. 23.51, p = 0.0002; and 20.17 vs. 8.51, p = 0.004). Similarly, the diversity of the Total Fungal and the Fungal Pathogen communities were greater (and 0.005, respectively) in the diseased compared to the healthy Plant Root soils (4.26 vs 2.74, p =0.0003; and 2.77 vs. 1.76, p =0.005).
There were many differences in the MPS of specific bacterial genera (with MPS levels > 1%) between the healthy and diseased Plant Bulk soils (Table 5), however, Clostridum was the only potential bacterial plant pathogen (Spigaglia et al., 2020) with greater MPS levels in the compared to the healthy Plant Bulk soils (3.50% vs. 0.74, p = 0.001). There were few differences in MPS of bacteria with MPS > 1% in either the healthy or diseased Plant Root soils. However, In addition, Clostridium also was present at greater MPS levels in the diseased compared to the healthy Plant Root soils (3.18% vs. 0.36%, p = 0.019).
There were 8 fungal genera with MPS levels > 1% in either the diseased or healthy Plant Bulk soils (Table 6), but the plant pathogen Ilyonectria was the only one of these genera with MPS levels that were different between the different Plant Bulk soils, and it’s MPS was much greater in the healthy compared to the diseased Plant Bulk soils (8.68 vs. 1.28, p = 0.0039). There were 10 fungal genera with MPS > 1% that were present in either the diseased or healthy Plant Root soils (Table 6). The complex organic C compound degrading (CCD) genus Apiotrichum was present at greater MPS levels in the healthy compared to the diseased Plant Roots (62.07% vs. 26.58%, p = 0.0163), while the CCD genus Saitozyma and the arbuscular mycorrhizal genus Glomus had MPS levels that were moderately (not statistically) greater in the roots from healthy compared to diseased plants (9.74% vs 4.17%, p = 0.0781; 3.00% vs 1.48%, p = 0.1093, respectively). There were 7 of the 10 genera that had MPS values greater in the diseased compared to the healthy Plant Root soils. The plant pathogen Mycoshpaerella was present in the diseased Plant Root soils at a much greater MPS level than in the healthy Plant Root soils (11.65% vs 3.20%, p = 0.0039), as were the plant pathogens Dipodascus, Didymella, and Acrocalymma, but at much lower MPS levels (1.97% to 2.76%, vs. 0.01% to 0.37%, p = 0.0021 to 0.0225). There were two other genera worth noting. The MPS of the fungal, Oomycete, and algal parasite Rozella had a much greater MPS level in the diseased compared to the healthy Plant Root soils (13.3% vs 0.65%, p = 0.0038). In addition, the MPS of the plant root-associated fungal genus Archaeorhizomyces also had much greater MPS levels in the diseased compared to the healthy Plant Root soils (11.26% vs 0.23%, p = 0.0033).
4. Discussion
The levels of the three nitrogen environmental metrics were all greater in the diseased Plant Root soils compared to the healthy Plant Root soils. In addition, the nitrogen metric values and the TOC were greater in the Diseased Plant Bulk soil compared to the healthy Plant Bulk soils. Studies have shown that increases in the soil N, and in either of the two forms of inorganic N can increase the risk of pathogens causing diseases in plants through several mechanism. Excess N can enhance the microbial pathogen’s metabolism by causing an increase in production of amino acids and gamma amino butyric acid that are used by the microbe to enhance its growth rate and pathogenic processes, and also to increase production and release of various microbial virulence factors (Mur et al., 2017). Excess N also is known to decrease the thickness of plant cuticle and wax layers and reduce the amount of lignin produced by a plant, all of which enhance a pathogens ability to penetrate the plant surface layers (Sun et al., 2020). Furthermore, excess N can inhibit production of plants metabolites that can be protective against pathogens such as phytoalexins, antimicrobial proteins, amino acids, organic acids and various defense-related enzymes (Sun et al., 2020). Given these potential pathogen enhancing effects of excess N on plants and the greater levels of N found in the diseased Plant Roots, it is possible that high levels of TN and forms of inorganic N could enhancing the pathogenesis of a yet unknown pathogen of O. monteverdensis.
There were clear differences in Total Bacterial and the Bacterial Pathogen overall community compositions between the heathy and diseased plant roots and plant soils identified by the ANOSIM and CAP analyses and the percent dissimilarity assessments. This suggests that whatever pathogenic processes are occurring in association with the diseased O. monteverdensis, they appear to be influencing the overall bacterial community compositions, however, with the greater differences in composition found for both bacterial groups being between the healthy and diseased Plant Root soils. This suggests that the disease is having a greater influence on the bacterial community near the roots, providing support that the disease is likely root-associated. That said, the only potential plant pathogen found in greater MPS levels in the diseased vs. healthy Plant Roots or Plant Bulk soil was Clostridium, which was found at MPS levels of about 3-3.5% in the soil and roots of diseased O. monteverdensis, but only at about 0.4-0.75% in the healthy plant soil and roots.
There have been 6 species of Clostridium recently identified from roots and soil of kiwi plants (Actinidia chinensis var. deliciosa ‘Hayward’) with a withering and wilting disease, somewhat similar to what has been observed in O. monteverdensis (Spigaglia et al., 2020). It is interesting that the disease in kiwi plants was enhanced with heavy moisture, which is consistent with observations by the reforestation biologists in the FCC in Costa Rica who have found that the disease in O. monteverdensis seems to occur in the rainy season. Given that Clostridium was the only potential bacterial pathogen found in greater levels associated with the diseased plants than in the healthy plants, it is the only possible bacterial candidate from this study as the causative agent for this O. monteverdensis disease.
There was also clear evidence of differences in the overall Total Fungal and the Fungal Pathogen community compositions between the heathy and diseased plants identified by the ANOSIM and CAP analyses and the percent dissimilarity assessments. This indicates that the pathogenic processes associated with O.monteverdensis disease are influencing the soil fungal community compositions. Furthermore, as the greatest differences in community composition for both groups was between the healthy and diseased Plant Root soils, and there were minimal to no differences in these communities between the healthy and diseased Plant Bulk soil strongly, supports the idea that this disease of O. monteverdensis is linked to a root-associated pathogen.
The known Fungal Pathogens Dipodascus, Didymella, Acrocalymma, and Mycosphaerella all had significantly greater MPS levels in the diseased Plant Root soils (2.76%, 2.37%, 1.97%, and 11.65%, respectively) than in the healthy Plant Root soils (0.01%, 0.09%, 0.37%, and 3.2%), which were also greater than in the healthy or diseased Plant Bulk soils. Mycosphaerella is the fungus perhaps of greatest interest in this study as its’ DNA was present in the diseased Plant Root soils at MPS levels far greater than compared to the other pathogens or to the levels in the healthy Plant Root soils. Mycosphaerella is considered a plant pathogen, is very common with over 10,000 species within the genus, and has members of the genus causing plant diseases involving chlorosis leading to leaf spot browning, leaf loss and plant death (Crous et al., 2001; Crous, 2009), which is similar to the symptoms of the O. monteverdensis disease. It also common for Mycosphaerella infection and disease to become enhanced during or following periods of heavy rain, which are thought to enhance spore growth and result in easier entry in to plant stomata (Mondal et al., 2003; Roger et al., 1999; Vicent et al., 2011; Wakeham and Kennedy, 2010). This pattern of enhanced disease after heavy rain has been observed with O. monteverdensis in the Monteverde area. Mycosphaerella coffeicola (the asexual form of Cercospora coffeicola) is a common pathogen of coffee causing a leaf spot disease that begins as chlorotic spots on the leaves surface that develop into brown and necrotic lesions. These lesions become discolored with a lighter center and yellow halo, and sometimes fuse into large irregular areas, resulting in the leaves dropping (Nelson, 2008; Gaitán, 2015). These symptoms in the plant are also similar to those associated with the O. monteverdensis disease. In addition, similar to the disease occurrence in O. monteverdensis, the disease due to M. coffeicola in coffee plantations is enhanced after continual wetness of 36-72 hours (Gaitán, 2015). Lastly, it is also of interest that many of the diseased O. monteverdensis plants are seedlings that were planted in areas that had previously been forests, then were cleared and used as coffee plantations, with some areas even still containing some abandoned coffee plants within the planted areas. It is certainly premature to suggest Mycosphaerella is the cause of the O. monteverdensis disease, but it gives us a target to look for in future studies.
There were 2 other fungi of interest that warrant further mention. Archaeorhizomyces DNA was present at MPS levels of about 12% in the diseased Plant Root soils and only about 0.2% in the healthy Plant Root soils. There is little known of this fungus, but it is known as a root-associated fungus that is involved in decomposition of various plant materials, detritus and debris found in the root zone, in particular those with low pH and high nutrient turnover, as is associated with diseased plants (Rosling et al., 2011; Rosling et al., 2013; Clemmensen et al., 2015; Carrino-Kyker et al., 2016; Urbina et al., 2018). Archaerorhyzomyces is thought to be a decomposer of glucose, cellulose and other carbohydrates released from dying plants into the root zone (Pinto-Figuero et al., 2019). It has been suggested that Archaeorhizomyces may be replacing the ectomycorrhizal fungi in the plant roots during above-ground plant senescence and associated root decay and are involved in the decomposition of the dead and dying root material released during these periods of plant senescence (Rosling et al. 2013, Lindahl et al. 2010, and Castro et al. 2010). This information and the more than 60x greater MPS levels of Archaeorhizomyces in the diseased plant roots suggests that while not being the primary pathogen of the O. monteverdensis disease, may be an indicator of the microbial community effects of this disease on the O. monteverdensis rhizosphere soil community.
The other interesting fungal genus worth noting is Rozella, as the DNA of this fungus weas present in the diseased Plant Root soils at MPS levels of about 13% and only 0.75% in the healthy Plant Root soils. Rozella is an endoparasite of the Oomycota, the fungal phyla Blastocladiomycota, Monoblepharidomycota, Chytridiomycota, and Basidiomycota, and the green algal phylum Charophyta (Letcher et al., 2018). Very little is known of this fungus, however, it has been found to parasitize fungi within soils where there is an increase in the levels of decomposition of plant debris and detritus (Gleason et al., 2012; Marano et al., 2011). As such, it is thought to somehow be involved in decomposition of dead plant root and other rhizosphere plant debris, although the mechanisms are not known. Nonetheless, this activity could explain its’ increased abundance in the Plant Root soils of diseased O. monteverdensis compared to the levels in the Plant Bulk soil of these diseased plants. Thus, the increased Rozella abundance, like that of Archaeorhizomyces, could be a consequence or indicator of the disease in O. monteverdensis seedlings.
5. Conclusions
It is unclear what is causing the disease observed in O. monteverdensis in the Monteverde Cloud Forest region of Costa Rica. The only environmental factors that were greater in the Diseased Plant Root soils than the Healthy Plant Root soils were the total nitrogen, ammonium and nitrate. Thus, it is possible that these elevated levels of N are enhancing the growth and/or pathogenic mechanisms of a potential pathogen (Murr et al., 2017), or the effectiveness of some of the plant defense mechanisms are being reduced (Sun et al., 2020). Both of these possibilities could play some role in increasing the prevalence and pathogenic outcomes associated with this plant disease in O. monteverdensis. The evidence from this study strongly points to a root-associated pathogen, based on the greater difference in community composition of the different microbial groups being found between the Diseased vs. Healthy Plant Root soils and the greater MPS levels of the potential pathogens Clostridium (bacterial), Mycosphaerella, Dipodascus, Didymella, and Acrocalymma (fungal) in the Diseased vs. Healthy Plant Root soils.
The bacteria Clostridium appears to be the only possible bacterial causative agent for this disease as it was found in greater levels in the Diseased vs. Healthy Plant Root soils and has been found to cause a withering and wilting disease with similar symptoms as occurring in O. monteverdensis (Spigaglia et al., 2020). However, it’s abundance was relatively low (about 3.2%). The fungus Mycosphaerella showed the best evidence as a possible causative agent of the O. monteverdensis disease. It was present at a much greater levels the Diseased Plant Root samples than the other three fungal pathogens (about 11.7% vs 2 to 2.8%), has members of the genus causing diseases in plants with similar symptoms to that of the O. monteverdensis disease (Crous et al., 2001; Crous, 2009), many of which are more common during or immediately after extremely wet periods (Mondal et al., 2003; Roger et al., 1999; Vicent et al., 2011; Wakeham and Kennedy, 2010), which is also the case with the O. monteverdensis disease. Particularly interesting is that M. coffeicola causes a disease of coffee plants with similar symptoms as observed with the O. monteverdensis disease which develops after a 36-72 hour period of extensive wetness (Gaitán, 2015; Nelson, 2008). This is of interest as the O. monteverdensis disease occurs in plants either within former coffee agricultural sites or within no more than a km distance from the sites. Two other observations were that the non-pathogenic fungi Archaeorhizomyces and Rozella in greater abundance the diseased plant roots may suggest that these two genera may serve as secondary indicators of the O. monteverdensis disease. While Mycosphaerella certainly may not be the causative agent of the disease, it is an interesting possibility which warrant further work. Our current studies include development of pure fungal cultures from the roots of diseased plants, determining the taxonomic identity of these cultures, and transmission studies using the pure culture isolates. This work is in progress.
Supplementary Materials
The following supporting information can be downloaded at the website of this paper posted on Preprints.org.
Author Contributions
Conceptualization, W.D.E. and D.A.H.; Methodology, W.D.E., D.A.H., A.L, P.S; Investigation, W.D.E., D.A.H.; Formal analysis, W.D.E., A.L., P.S.; Resources, W.D.E., D.A.H. A.L., P.S.; Data curation, W.D.E.; Writing—original draft, W.D.E.; Writing—review & editing, W.D.E., D.A.H., A.L., P.S.; Visualization, W.D.E.; Project administration, W.D.E.; Funding acquisition, W.D.E., D.A.H., P.S. All authors have read and agreed to the published version of the manuscript.
Funding
This work was funded by the Pace University Dyson College Dean, the Dyson Faculty Research Grant Committee, and the Provost Office for research support, and by the Fundacion Conservacionista Costarricense.
Data Availability Statement
All DNA sequencing data were submitted to the NCBI-Sequence Read Archive (SRA) repository with SRA Project Code PRJNA1019742. All other data are available upon request.
Acknowledgments
The authors thank Luisa Moreno, Monteverde Institute, for assistance in permit acquisition and laboratory access, the FCC for their restoration efforts and access to field sites, and Pace University student Wen Chen for assistance in sample collection. We especially wish to thank Patricia Leandro and the staff at the CATIE lab for their soil C and N analysis assistance. This work was conducted through the Costa Rican permit CONAGEBIO.MINAE # R-047-2019-OT-CONAGEBIO.
Conflicts of Interest
The authors declare no conflicts of interest.
References
- Agrios, G.N. 2005. Plant Pathology, 5th Edition, Academic Press, London, UK, 1-922.
- Hopkins, D.W.; Alef, K.; Nannipieri, P. Methods in Applied Soil Microbiology and Biochemistry.. J. Appl. Ecol. 1996, 33, 178. [CrossRef]
- Anderson, J.M., Ingram, J.S.I., 1993. Tropical Soil Biology and Fertility: a handbook of methods 2nd edition Wallingford Oxfordshire UK: Cambridge University Press CAB International.
- Anderson, M.J., Gorley, R.N., Clarke, R.K., 2008. PERMANOVA+ for Primer: guide to Software and Statistical Methods. Plymouth, UK.
- Anderson, M.J., Willis, T. (2003). Canonical analysis of principal coordinates: A useful method of constrained ordination for ecology. Ecology 84, 511–525.
- Burdon, J.J.; Zhan, J.; Thomas, M.B. Climate change and disease in plant communities. PLOS Biol. 2020, 18, e3000949. [CrossRef]
- Caporaso, J.G.; Lauber, C.L.; Walters, W.A.; Berg-Lyons, D.; Lozupone, C.A.; Turnbaugh, P.J.; Fierer, N.; Knight, R. Global patterns of 16S rRNA diversity at a depth of millions of sequences per sample. Proc. Natl. Acad. Sci. USA 2011, 108 (Supp. 1), 4516–4522. [CrossRef]
- Carrino-Kyker, S.R.; Kluber, L.A.; Petersen, S.M.; Coyle, K.P.; Hewins, C.R.; DeForest, J.L.; Smemo, K.A.; Burke, D.J.; Anderson, I. Mycorrhizal fungal communities respond to experimental elevation of soil pH and P availability in temperate hardwood forests. FEMS Microbiol. Ecol. 2016, 92, fiw024. [CrossRef]
- Castro, H.F.; Classen, A.T.; Austin, E.E.; Norby, R.J.; Schadt, C.W. Soil Microbial Community Responses to Multiple Experimental Climate Change Drivers. Appl. Environ. Microbiol. 2010, 76, 999–1007. [CrossRef]
- Clarke, K.R., Gorley, R.N. (2006). PRIMER v6: User manual PRIMER-E Ltd. Plymouth UK.
- Clemmensen, K.E.; Finlay, R.D.; Dahlberg, A.; Stenlid, J.; Wardle, D.A.; Lindahl, B.D. Carbon sequestration is related to mycorrhizal fungal community shifts during long-term succession in boreal forests. New Phytol. 2014, 205, 1525–1536. [CrossRef]
- Crous PW. (2009). Taxonomy and phylogeny of the genus Mycosphaerella and its anamorphs. Fungal Diversity 38, 1–24.
- Crous, P.W.; Kang, J.-C.; Braun, U. A Phylogenetic Redefinition of Anamorph Genera in Mycosphaerella Based on ITS rDNA Sequence and Morphology. Mycologia 2001, 93, 1081. [CrossRef]
- Gaitán, AL (2015). Compendium of Coffee Disease and Pests. St. Paul, MN: American Phytopathological Society. pp. 27–28, ISBN: 978-0-89054-470-9.
- Gardes, M.; Bruns, T.D. ITS primers with enhanced specificity for basidiomycetes—Application to the identification of mycorrhizae and rusts. Mol. Ecol. 1993, 2, 113–118. [CrossRef]
- Gleason, F.H.; Carney, L.T.; Lilje, O.; Glockling, S.L. Ecological potentials of species of Rozella (Cryptomycota). Fungal Ecol. 2012, 5, 651–656. [CrossRef]
- Gonzalez, J. and Poveda, L. 2007. Lauraceae. In: B.E. Hammel, M.H. Grayum, C. Herrera & N. Zamora (ed.), Manual de Plantas de Costa Rica, Vol. VI: Dicotiledoneas (Haloragaceae-hytolaccaceae), Missouri Botanical Garden Press, St. Louis, MO., USA.
- Guindon, C. 1997. The Importance of Forest Fragments to the Maintenance of Regional Biodiversity Surrounding a Tropical Montane Reserve, Costa Rica. PhD Dissertation. Faculty of the School of Forestry and Environmental Studies, Yale University.
- Haber, W., Zuchowski, W. and Bello, E. 2000. An Introduction to Cloud Forest Trees: Monteverde, Costa Rica. 2nd edition. Mountain Gem Publications, Monteverde, Costa Rica.
- Hamilton, D., V. Molina, P. Bosques and G. Powell. 2003.El estatus del pájaro campana (Procnias tricarunculata): Un ave en peligro de extinción Zeledonia 7, 15-24.
- Hamilton, D., Singleton, R. and Joslin, J.D. 2018. Resource tracking and its conservation implications for an obligate frugivore (Procnias tricarunculatus, the three-wattled bellbird). Biotropica 50, 146-156.
- Hamilton, D., T. Parshall, L. Vargas Berocal, R. Alvarado Mendez, G. Goldsmith, and T. Donovan. 2025. For Submission, June 2025. Optimizing the Restoration Practitioner’s Role: Evaluating Seedling Characteristics, Maintenance, and Cost-Effective Strategies for Tropical Forest Restoration. Submitted June 2025. Ecological Restoration.
- Harvey, C.A, C. Guindon, W.Haber, D.Hamilton, K.G. Murray. 2008.Importancia de los fragmentos de Bosque, los Arboles Dispersos and las Cortinas Rompevientos para la Biodiversidad Local y Regional in Evaluación y conservación de biodiversidad en paisajes fragmentados de Mesoamérica. Editorial INBio. Costa Rica.
- Hazelwood, K.; Beck, H.; Paine, C.E.T.; Andersen, K. Negative density dependence in the mortality and growth of tropical tree seedlings is strong, and primarily caused by fungal pathogens. J. Ecol. 2021, 109, 1909–1918. [CrossRef]
- IUCN. 2021. The IUCN Red List of Threatened Species. www.iucnredlist.org.
- Joslin, J.D., Haber, W.A, Hamilton, D. 2018. Ocotea monteverdensis. The IUCN Red List of Threatened Species 2018: e.T48724260A117762662. [CrossRef]
- LaVal, R. 2023. Datos casa LaVal Available at: https://monteverde-institute.org/mvi-digital-collections.html (Accessed October 15, 2023).
- Letcher, P.M.; Powell, M.J. A taxonomic summary and revision of Rozella (Cryptomycota). IMA Fungus 2018, 9, 383–399. [CrossRef]
- Lindahl, B.D.; de Boer, W.; Finlay, R.D. Disruption of root carbon transport into forest humus stimulates fungal opportunists at the expense of mycorrhizal fungi. ISME J. 2010, 4, 872–881. [CrossRef]
- Marano, A.V.; Pires-Zottarelli, C.L.A.; Barrera, M.D.; Steciow, M.M.; Gleason, F.H. Diversity, role in decomposition, and succession of zoosporic fungi and straminipiles on submerged decaying leaves in a woodland stream. Hydrobiologia 2010, 659, 93–109. [CrossRef]
- McGee, K.M.; Eaton, W.D.; Shokralla, S.; Hajibabaei, M. Determinants of Soil Bacterial and Fungal Community Composition Toward Carbon-Use Efficiency Across Primary and Secondary Forests in a Costa Rican Conservation Area. Microb. Ecol. 2018, 77, 148–167. [CrossRef]
- Milici, V.R.; Comita, L.S.; Bagchi, R. Foliar disease incidence in a tropical seedling community is density dependent and varies along a regional precipitation gradient. J. Ecol. 2024, 112, 642–655. [CrossRef]
- Mondal, S.N.; Gottwald, T.R.; Timmer, L.W. Environmental Factors Affecting the Release and Dispersal of Ascospores of Mycosphaerella citri. Phytopathology® 2003, 93, 1031–1036. [CrossRef]
- Mur, L.A.J.; Simpson, C.; Kumari, A.; Gupta, A.K.; Gupta, K.J. Moving nitrogen to the centre of plant defence against pathogens. Ann. Bot. 2017, 119, 703–709. [CrossRef]
- Nelson, S. (2008). Cercospora Leaf Spot and Berry Blotch of Coffee. Cooperative Extension Service, College of Tropical Agriculture and Human Resources, University of Hawai’i at Manoa. Plant Disease, June 2008, PD-41.
- Pinto-Figueroa EA, Seddon E, Yashiro E, Buri A, Niculita-Hirzel H, van der Meer JR and Guisan A (2019) Archaeorhizomycetes Spatial Distribution in Soils Along Wide Elevational and Environmental Gradients Reveal Co-abundance Patterns With Other Fungal Saprobes and Potential Weathering Capacities. Front. Microbiol. 10:656.
- Põlme, S., Abarenkov, K., Henrik, N.R., Lindah, B.D., et al. (2020). FungalTraits: a user-friendly traits database of fungi and funguslike stramenopiles. Fungal Diversity 105:1–16.
- Powell, G.V.N.; Bjork, R.D. Habitat Linkages and the Conservation of Tropical Biodiversity as Indicated by Seasonal Migrations of Three-Wattled Bellbirds. Conserv. Biol. 2004, 18, 500–509. [CrossRef]
- Roger, C.; Tivoli, B.; Huber, L. Effects of temperature and moisture on disease and fruit body development of Mycosphaerella pinodes on pea (Pisum sativum). Plant Pathol. 1999, 48, 1–9. [CrossRef]
- Rosling, A.; Cox, F.; Cruz-Martinez, K.; Ihrmark, K.; Grelet, G.-A.; Lindahl, B.D.; Menkis, A.; James, T.Y. Archaeorhizomycetes: Unearthing an Ancient Class of Ubiquitous Soil Fungi. Science 2011, 333, 876–879. [CrossRef]
- Rosling, A., Timling, I., and Taylor, D. L. (2013). “Archaeorhizomycetes: patterns of distribution and abundance in soil,” in Genomics of Soil- and PlantAssociated Fungi. Soil Biology, eds B. Horwitz, P. Mukherjee, M. Mukherjee, and C. Kubicek (Heidelberg: Springer), 333–349.
- Sciara, J. and Fite, C. 2015. Environmental factors that contribute to the reproductive ecology of Ocotea monteverdensis. Report to the CIEE Sustainability Program. Monteverde,Costa Rica.
- Spigaglia P, Barbanti F, Marocchi F, et al. (2020) Clostridium bifermentans and C. subterminale are associated with kiwifruit vine decline, known as moria, in Italy. Plant Pathol. 2020; 69: 765–774.
- Sun, Y.; Wang, M.; Mur, L.A.J.; Shen, Q.; Guo, S. Unravelling the Roles of Nitrogen Nutrition in Plant Disease Defences. Int. J. Mol. Sci. 2020, 21, 572. [CrossRef]
- Tropicos.org. 2017. Missouri Botanical Garden 08 2017. www.tropicos.org/Specimen/31076.
- Urbina, H.; Breed, M.F.; Zhao, W.; Gurrala, K.L.; Andersson, S.G.; Ågren, J.; Baldauf, S.; Rosling, A. Specificity in Arabidopsis thaliana recruitment of root fungal communities from soil and rhizosphere. Fungal Biol. 2018, 122, 231–240. [CrossRef]
- Vicent, A., Bassimba, D.D.M. and Intrigliolo, D.S. (2011), Effects of temperature, water regime and irrigation system on the release of ascospores of Mycosphaerella nawae, causal agent of circular leaf spot of persimmon. Plant Pathology, 60: 890-908.
- Wakeham, A.J.; Kennedy, R. Risk Assessment Methods for the Ringspot Pathogen Mycosphaerella brassicicola in Vegetable Brassica Crops. Plant Dis. 2010, 94, 851–859. [CrossRef]
- Weiss, S.; Xu, Z.Z.; Peddada, S.; Amir, A.; Bittinger, K.; Gonzalez, A.; Lozupone, C.; Zaneveld, J.R.; Vázquez-Baeza, Y.; Birmingham, A.; et al. Normalization and microbial differential abundance strategies depend upon data characteristics. Microbiome 2017, 5, 1–18. [CrossRef]
- Wheelwright, N. and Nadkarni, N. (editors), 2014”Monteverde: Ecology and Conservation of a Tropical Cloud Forest”. Bowdoin’s Scholars’ Bookshelf http://digitalcommons.bowdoin.edu/scholars-bookshelf/3/.
- Williams, S.L.; Toda, M.; Chiller, T.; Brunkard, J.M.; Litvintseva, A.P.; Chowdhary, A. Effects of climate change on fungal infections. PLOS Pathog. 2024, 20, e1012219. [CrossRef]
- Yang, L.-N.; Ren, M.; Zhan, J. Modeling plant diseases under climate change: evolutionary perspectives. Trends Plant Sci. 2022, 28, 519–526. [CrossRef]
Figure 1.
Ocotea monteverdensis seedlings at different stages of disease. 1A) Non-diseased, healthy seedling; 1B) Seedling demonstrating early stages of chlorosis (arrow); 1C) Seedling demonstrating later stages of chlorosis and brown spots (arrows); 1D) Seedling dying with curled leaves.
Figure 1.
Ocotea monteverdensis seedlings at different stages of disease. 1A) Non-diseased, healthy seedling; 1B) Seedling demonstrating early stages of chlorosis (arrow); 1C) Seedling demonstrating later stages of chlorosis and brown spots (arrows); 1D) Seedling dying with curled leaves.
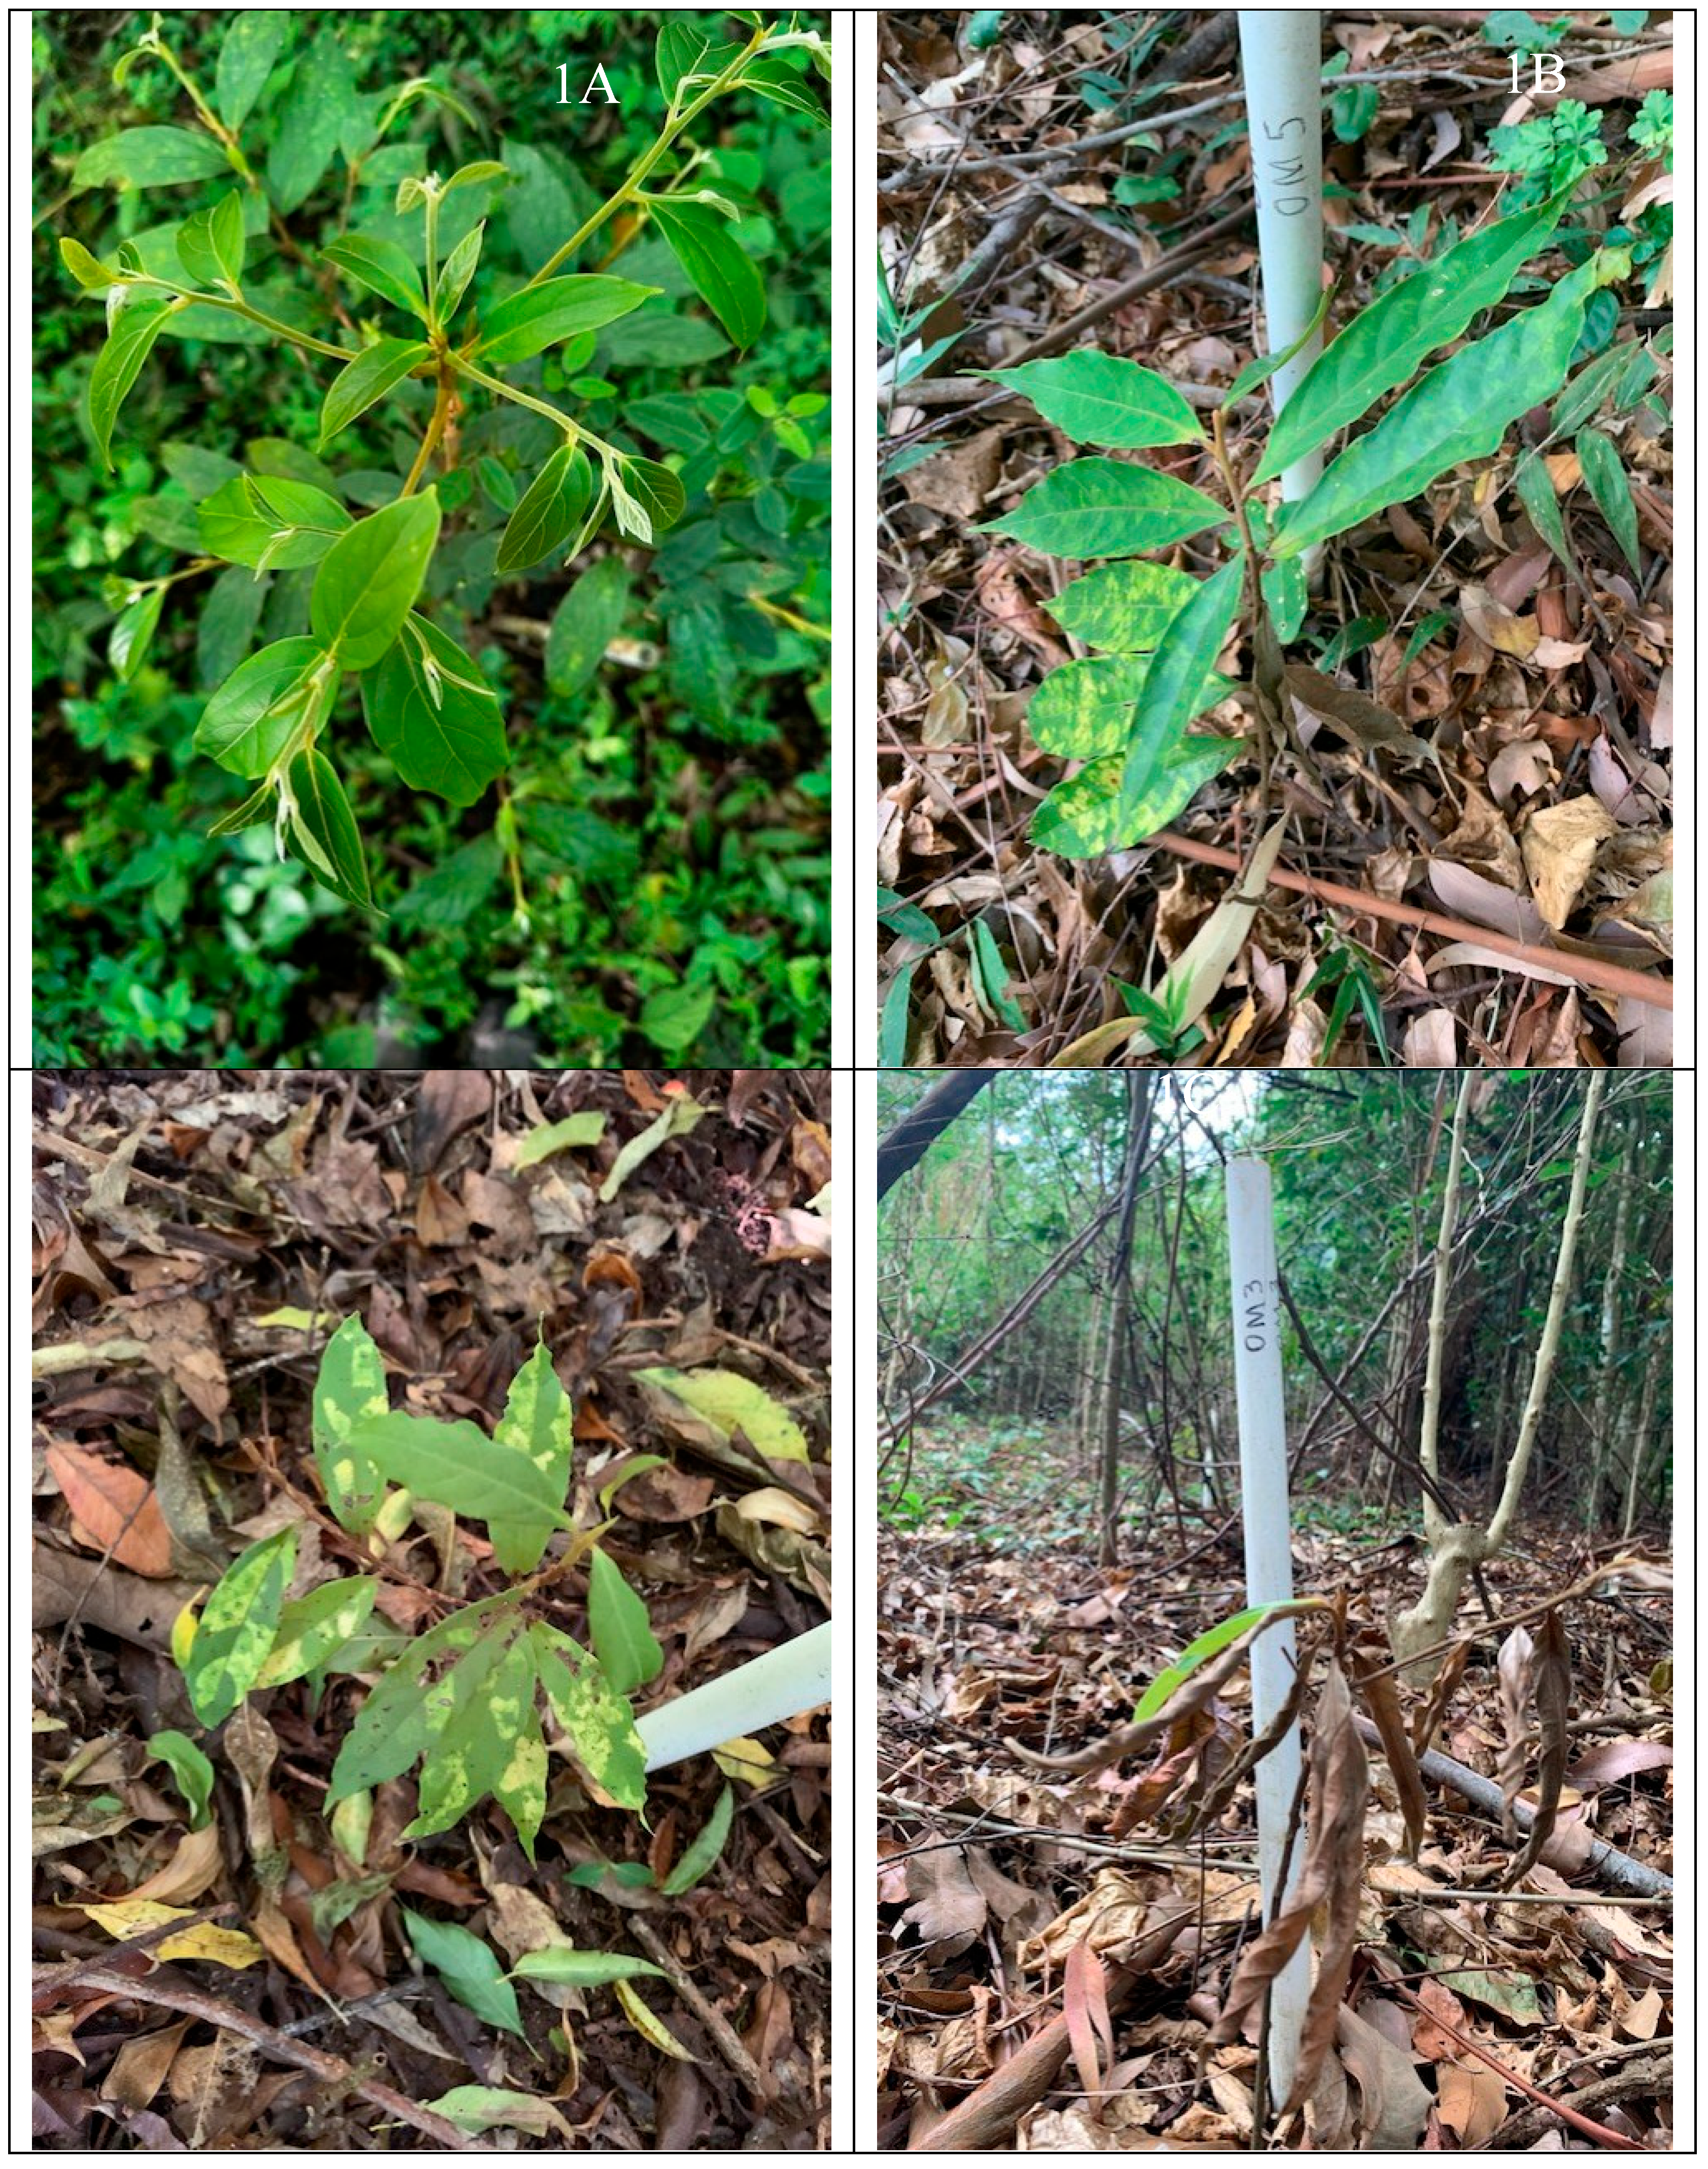

Table 1.
Mean Levels of environmental variables in soils from the root soil (Plant Root Soil) and bulk soil (Plant Bulk Soil) of diseased and healthy Ocotea monteverdensis planted in a Costa Rican primary forest for 1 year.
Table 1.
Mean Levels of environmental variables in soils from the root soil (Plant Root Soil) and bulk soil (Plant Bulk Soil) of diseased and healthy Ocotea monteverdensis planted in a Costa Rican primary forest for 1 year.
| Diseased Plant | Healthy Plant | Mann-Whitney | |
| Metric | Root Soil | Root Soil | p value |
| TN | 58.13 ± 11.27 | 44.03 ± 11.18 | 0.052 |
| TOC | 763.5 ± 184.78 | 665 ± 98.56 | 0.093 |
| NH4+ | 6.12 ± 3.01 | 2.91 ± 2.04 | 0.055 |
| NO3- | 60.19 ± 27.62 | 29.25 ± 7.92 | 0.046 |
| Resp | 196.50 ± 71.66 | 207.53 ± 28.82 | 0.735 |
| Diseased Plant | Healthy Plant | Mann-Whitney | |
| Metric | Bulk Soil | Bulk Soil | p value |
| TN | 88.01 ± 9.51 | 55.67 ± 7.84 | 0.0001 |
| TOC | 1064.83 ± 80.90 | 753.33 ± 118.21 | 0.0003 |
| NH4 | 10.03 ± 4.64 | 3.20 ± 2.40 | 0.0009 |
| NO3 | 89.70 ± 28.80 | 22.15 ± 6.03 | 0.0001 |
| Resp | 278.70 ± 51.35 | 237.52 ± 75.58 | 0.2952 |
Table 2.
The results of ANOSIM and CAP assessments to determine the differences in the taxonomic community compositions of the Total Bacteria, Bacterial Pathogens, Total Fungi and Fungal Pathogens in soils from the root soil (Plant Root Soil) and bulk soil (Plant Bulk Soil) of diseased and healthy Ocotea monteverdensis planted in a Costa Rican primary forest for 1 year.
| ANOSIM RESULTS | Total Bacteria | Bacterial Pathogens | Total Fungi | Fungal Pathogens | ||||
| Global Test Results | R = 0.373; p = 0.0002 | R = 0.366, p = 0.0003 | R = 0.347, p = 0.002 | R = 0.323, p = 0.0001 | ||||
| Pairwise Comparisons | R Stat | p Value | R Stat | p Value | R Stat | p Value | R Stat | p Value |
| Healthy vs Diseased Plant Root Soils | 0.566 | 0.003 | 0.563 | 0.004 | 0.752 | 0.004 | 0.554 | 0.002 |
| Healthy vs Diseased Plant Bulk Soils | 0.419 | 0.0002 | 0.485 | 0.002 | 0.046 | 0.273 | 0.231 | 0.05 |
| CAP RESULTS | Total Bacteria | Bacterial Pathogens | Total Fungi | Fungal Pathogens | ||||
| Comparisons | CAP R2 | p Value | CAP R2 | p Value | CAP R2 | p Value | CAP R2 | p Value |
| Healthy vs Diseased Plant Root Soils | 0.788 | 0.0001 | 0.876 | 0.0002 | 0.801 | 0.0022 | 0.855 | 0.0008 |
| Healthy vs Diseased Plant Bulk Soils | 0.706 | 0.0001 | 0.723 | 0.0002 | 0.223 | 0.0022 | 0.599 | 0.008 |
Table 3.
Differences in the Mean Proportion of DNA Sequences (MPS) of the potential Bacterial Pathogens and Fungal Pathogens in soils from the root soil (Plant Root Soil) and bulk soil (Plant Bulk Soil) of diseased and healthy Ocotea monteverdensis planted in a Costa Rican primary forest for 1 year.
| Bacterial Pathogens | Fungal Pathogens | |
| MPS LEVEL COMPARISONS | MPS (%) | MPS (%) |
| Healthy Plant Root Soils | 6.16±2.33 | 15.25±17.54 |
| Diseased Plant Root Soils | 5.81±0.93 | 45.35±10.37 |
Table 4.
Results of the Similarity Percentage (SIMPER) analyses comparing the % Taxonomic Dissimilarity and results of the Richness and Diversity analyses for the Total Bacteria, Bacterial Pathogens, Total Fungi and Fungal Pathogens in soils from the root soil (Plant Root Soil) and bulk soil (Plant Bulk Soil) of diseased and healthy Ocotea monteverdensis planted in a Costa Rican primary forest for 1 year.
| Total Bacteria | Bacterial Pathogens | Total Fungi | Fungal Pathogens | |||||
| SIMPER Comparisons | % Dissimilarity | % Dissimilarity | % Dissimilarity | % Dissimilarity | ||||
| Healthy vs Diseased Plant Root Soils | 41.97% | 36.42% | 63.66% | 61.34% | ||||
| Healthy vs Diseased Plant Bulk Soils | 42.19% | 36.52% | 55.65% | 50.16% | ||||
| Total Bacteria | Bacterial Pathogens | Total Fungi | Fungal Pathogens | |||||
| Diversity Index Comparisons | Richness | Diversity | Richness | Diversity | Richness | Diversity | Richness | Diversity |
| Healthy Plant Root Soils | 330±113 | 5.64±0.28 | 14.50±3.79 | 2.51±0.23 | 23.51±23.52 | 2.74±0.71 | 8.51±7.58 | 1.76±0.80 |
| Diseased Plant Root Soils | 335±129 | 5.54±0.43 | 14.15±4.03 | 2.54±0.24 | 86.83±19.56 | 4.26±0.26 | 20.17±3.87 | 2.77±0.21 |
| Mann-Whitney p value | 0.468 | 0.639 | 0.871 | 0.774 | 0.0002 | 0.0003 | 0.004 | 0.005 |
| Healthy Plant Bulk Soil | 322±57 | 5.67±0.16 | 14.33±2.58 | 2.58±0.17 | 42.67±24.29 | 3.44±0.66 | 15.50±7.69 | 2.44±0.61 |
| Diseased Plant Bulk Soil | 308±132 | 5.51±0.42 | 14.57±4.40 | 2.55±0.29 | 59.67±36.39 | 3.72±0.73 | 13.17±5.60 | 2.40±0.43 |
| Mann-Whitney p value | 0.813 | 0.404 | 0.911 | 0.827 | 0.262 | 0.502 | 0.571 | 0.898 |
Table 5.
The Mean Proportion of DNA Sequences (MPS) of the bacterial genera with MPS values > 1% in the root soil (Plant Root Soil) and bulk soil (Plant Bulk Soil) of diseased and healthy Ocotea monteverdensis planted in a Costa Rican primary forest for 1 year.
Table 5.
The Mean Proportion of DNA Sequences (MPS) of the bacterial genera with MPS values > 1% in the root soil (Plant Root Soil) and bulk soil (Plant Bulk Soil) of diseased and healthy Ocotea monteverdensis planted in a Costa Rican primary forest for 1 year.
| % MPS Diseased | % MPS Healthy | M-W | ||
| Bacterial Taxa | Function | Plant Bulk Soil | Plant Bulk Soil | p value |
| Clostridium | CCD, N-Fix, AMO, Possible Plant Pathogen | 3.50 ± 2.82 | 0.74 ± 0.78 | 0.001* |
| Udaeobacter | Probable CCD | 3.45 ± 1.62 | 6.19 ± 1.98 | 0.005* |
| Gemmata | Probable CCD | 3.42 ± 0.87 | 4.80 ±1.77 | 0.029* |
| Pseudolabrys | CCD | 3.22 ± 1.54 | 0.94 ± 0.92 | 0.003* |
| Solibacter | CCD | 3.20 ± 1.74 | 6.52 ± 3.40 | 0.105 |
| Pedomicrobium | CCD | 3.09 ± 1.15 | 0.68 ± 0.20 | 0.001* |
| Vicinamibacter | CCD | 2.65 ± 0.87 | 1.27 ± 1.10 | 0.015* |
| Bradyrhizobium | CCD, N-Fix, AMO | 2.37 ± 0.55 | 2.28 ± 0.83 | 0.355 |
| Bacillus | CCD, N-Fix, AMO, Possible Plant Pathogen | 1.84 ± 0.94 | 2.73 ± 1.21 | 0.015* |
| Methyloligella | Methylotrophs | 1.81 ± 0.73 | 0.56 ± 0.60 | 0.004* |
| Rokubacteriales | Unclear | 1.70 ± 0.67 | 0.44 ± 0.46 | 0.002* |
| Blastocatellia | CCD | 1.55 ± 1.20 | 0.22 ± 0.08 | 0.001* |
| Acidobacteria (Subgroup 2) | CCD | 1.51 ±2.35 | 6.38 ± 3.45 | 0.003* |
| Mycobacterium | CCD | 1.51 ± 0.56 | 0.42 ± 0.29 | 0.001* |
| Gaiella | CCD | 1.45 ± 0.67 | 0.48 ± 0.76 | 0.015* |
| Nitrospira | AMO | 1.45 ± 0.66 | 1.15 ± 0.36 | 0.105 |
| Pirellula | AMO | 1.28 ± 0.54 | 0.33 ± 0.51 | 0.002* |
| Reyranella | Unclear | 1.22 ± 0.53 | 0.40 ± 0.38 | 0.003* |
| Actinobacteria | CCD | 1.13 ± 0.54 | 0.11 ± 0.17 | 0.001* |
| Xiphinematobacter | Unclear | 1.11 ± 0.92 | 3.05 ± 1.30 | 0.001* |
| Solirubrobacter | Unclear | 1.10 ± 0.49 | 0.17 ± 0.29 | 0.001* |
| % MPS Diseased | % MPS Healthy | M-W | ||
| Bacterial Taxa | Function | Plant Root Soil | Plant Root Soil | p value |
| Xanthobacter | CCD | 8.03 ± 4.10 | 6.77 ± 0.57 | 0.628 |
| Flavobacterium | CCD | 6.80 ± 13.04 | 4.67 ± 1.78 | 0.138 |
| Udaeobacter | Probable CCD | 4.76 ± 3.19 | 4.01 ±1.81 | 1 |
| Solibacter | CCD | 4.65 ± 3.88 | 1.86 ± 0.36 | 0.731 |
| Acidobacteria (Subgroup 2) | CCD | 4.26 ± 3.72 | 1.79 ± 0.83 | 0.534 |
| Gemmata | Probable CCD | 3.27 ± 2.32 | 3.66 ± 1.32 | 1 |
| Clostridium | CCD, N-Fix, AMO, Plant Pathogen | 3.18 ± 2.82 | 0.36 ± 0.38 | 0.019* |
| Bacillus | CCD, N-Fix, AMO, Plant Pathogen | 2.73 ± 0.61 | 2.31 ± 1.27 | 0.945 |
| Acidobacteria | CCD | 2.64 ± 1.83 | 2.08± 0.40 | 0.628 |
| Rhizobium | CCD, N-Fix, AMO | 2.39 ± 2.72 | 0.0.33 ± 0.07 | 0.731 |
| Bradyrhizobium | CCD, N-Fix, AMO | 2.31 ± 0.65 | 2.86 ± 0.61 | 0.181 |
| Xiphinematobacter | Unclear | 2.89 ± 2.00 | 1.59 ± 0.57 | 0.775 |
| Ktedonobacter | Unclear | 1.94 ± 1.78 | 0.28 ± 0.18 | 0.153 |
| Elsterales | Unclear | 1.81 ± 1.80 | 0.74 ± 0.75 | 0.836 |
| Bryobacter | CCD | 1.79 ± 1.24 | 0.87 ± 0.23 | 0.253 |
| Acidibacter | Unclear | 1.33 ± 0.65 | 0.83 ± 0..31 | 0.138 |
| Acidothermus | CCD | 1.18 ± 0.72 | 1.00 ± 0.26 | 0.295 |
| Nitrospira | AMO | 1.18 ± 0.45 | 1.00 ± 0.27 | 0.181 |
| Burkholderia | CCD, N-Fix, AMO, Plant Pathogen | 1.11 ± 0.92 | 3.05 ± 1.30 | 0.008* |
Table 6.
The Mean Proportion of DNA Sequences (MPS) of the fungal genera with MPS values > 1% in the root soil (Plant Root Soil) and bulk soil (Plant Bulk Soil) of diseased and healthy Ocotea monteverdensis planted in a Costa Rican primary forest for 1 year.
Table 6.
The Mean Proportion of DNA Sequences (MPS) of the fungal genera with MPS values > 1% in the root soil (Plant Root Soil) and bulk soil (Plant Bulk Soil) of diseased and healthy Ocotea monteverdensis planted in a Costa Rican primary forest for 1 year.
| % MPS Diseased | % MPS Healthy | M-W | ||
| Fungal Taxa | Function | Plant Bulk Soil | Plant Bulk Soil | p value |
| Apiotrichum | CCD | 45.28 ± 29.11 | 48.26 ± 29.96 | 0.3367 |
| Rozella | Fungal, Oomycte, Algae parasite | 4.17 ± 6.96 | 0.88 ± 0.91 | 0.259 |
| Mycosphaerella | Plant pathogen | 3.71 ± 2.82 | 4.93 ± 4.32 | 0.7478 |
| Saitozyma | CCD | 10.09 ± 26.88 | 3.15 ± 4.79 | 0.0782 |
| Glomus | ARM | 1.54 ± 3.13 | 2.88 ± 3.71 | 0.1488 |
| Dactylonectria | Plant pathogen | 3.77 ± 8.39 | 0.01 ± 0.02 | 0.4418 |
| Ilyonectria | Plant pathogen | 1.28 ± 0.84 | 8.68 ± 5.16 | 0.0039* |
| Monochaetia | Plant pathogen | 1.03 ± 2.52 | 0.02 ± 0.01 | 0.3173 |
| % MPS Diseased | % MPS Healthy | M-W | ||
| Fungal Taxa | Function | Plant Root Soil | Plant Root Soil | p value |
| Apiotrichum | CCD | 26.58 ± 9.52 | 62.07 ± 19.02 | 0.0163* |
| Rozella | Fungal, Oomycte, Algae parasite | 13.30 ± 7.22 | 0.65 ± 0.75 | 0.0038* |
| Mycosphaerella | Plant pathogen | 11.65 ± 4.64 | 3.20 ± 1.84 | 0.0039* |
| Archaeorhizomyces | Plant root-associated | 11.26 ± 6.54 | 0.23 ± 0.50 | 0.0033* |
| Saitozyma | CCD | 5.17 ± 5.03 | 9.74 ± 5.00 | 0.0781 |
| Dipodascus | Plant pathogen | 2.76 ± 4.66 | 0.01 ± 0.01 | 0.0021* |
| Didymella | Plant pathogen | 2.37 ± 2.25 | 0.09 ± 0.21 | 0.0028* |
| Acrocalymma | Plant pathogen | 1.97 ± 1.59 | 0.37 ± 0.66 | 0.0225* |
| Glomus | ARM | 1.48 ± 1.16 | 3.00 ± 1.89 | 0.1093 |
| Tremella | CCD, Fungal parasite | 1.01 ± 1.54 | 0.06 ± 0.15 | 0.0493* |
Disclaimer/Publisher’s Note: The statements, opinions and data contained in all publications are solely those of the individual author(s) and contributor(s) and not of MDPI and/or the editor(s). MDPI and/or the editor(s) disclaim responsibility for any injury to people or property resulting from any ideas, methods, instructions or products referred to in the content. |
© 2025 by the authors. Licensee MDPI, Basel, Switzerland. This article is an open access article distributed under the terms and conditions of the Creative Commons Attribution (CC BY) license (http://creativecommons.org/licenses/by/4.0/).
Copyright: This open access article is published under a Creative Commons CC BY 4.0 license, which permit the free download, distribution, and reuse, provided that the author and preprint are cited in any reuse.


