
Submitted:
18 June 2025
Posted:
20 June 2025
You are already at the latest version
Abstract
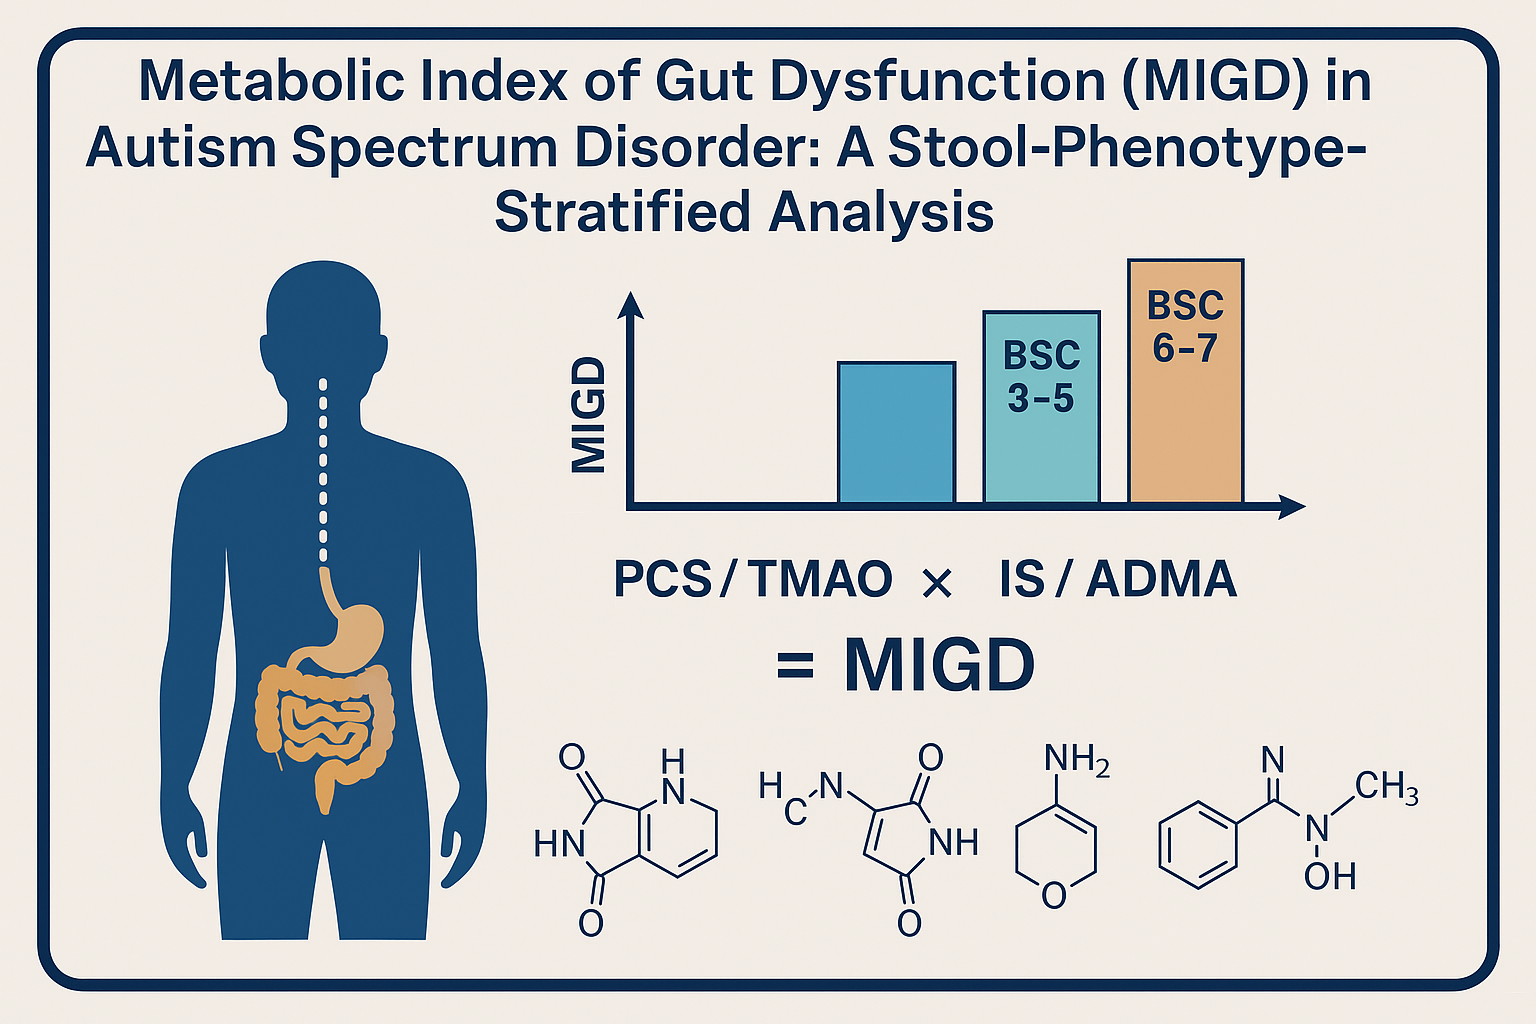
Gastrointestinal dysfunction and microbial dysbiosis are frequently reported in children with autism spectrum disorder (ASD), yet their relationship to systemic metabolic patterns remains incompletely understood. In this study, we assessed urinary levels of four gut-derived uremic toxins—p-cresyl sulfate (PCS), trimethylamine N-oxide (TMAO), indoxyl sulfate (IS), and asymmetric dimethylarginine (ADMA)—in 97 children with ASD and 71 neurotypical controls. Stool consistency was classified using the Bristol Stool Chart (BSC) into hard (BSC 1–2), normal (3–5), and loose (6–7) groups. We introduce two novel composite metrics: The Metabolic Index of Gut Dysfunction (MIGD), defined as (PCS/TMAO × 100 ÷ IS/ADMA), and the Fermentation Skew Index (FSI), defined as PCS/TMAO ÷ IS/ADMA. These indices aim to summarize phenolic and indolic microbial activity in relation to host detoxification status. Results demonstrated median MIGD values of 555.3 in ASD children with hard stools, 404.5 with normal stools, and 109.8 with loose stools. Corresponding FSI values were 5.55, 4.04, and 1.10, respectively. Controls with normal stools showed intermediate values (MIGD 242.5; FSI 2.41). These findings suggest that MIGD and FSI capture distinct gut metabolic phenotypes, with high FSI indicating phenolic-dominant skew and low values suggesting indolic predominance. These indices may support stratification of ASD subtypes and offer non-invasive metabolic biomarkers for microbiota-targeted interventions.
Keywords:
autism spectrum disorder
; uremic toxins
; MIGD
; FSI
; PCS
; indoxyl sulfate
; TMAO
; stool consistency
; urine biomarkers
1. Introduction
The complex neurodevelopmental disorder known as autism spectrum disorder (ASD) is marked by a high frequency of gastrointestinal (GI) disorders, such as constipation, diarrhea, and changed stool consistency, in addition to behavioral and cognitive abnormalities [1]. It is becoming more widely acknowledged that these symptoms are essential to the illness rather than being secondary comorbidities. Through immunological, endocrine, and metabolic pathways, the gut microbiota has been identified as a key facilitator of this brain–gut interaction, impacting neurodevelopment [2].
One important class of microbial-derived metabolites implicated in systemic and neurological health are the uremic toxins [3]. These compounds — including indoxyl sulfate (IS), p-cresyl sulfate (PCS), and trimethylamine N-oxide (TMAO) — originate from bacterial metabolism of dietary precursors such as tryptophan, tyrosine, and choline [4,5]. Despite being first investigated in chronic renal illness, these toxins are now known to have a broad impact on immunological signaling, oxidative stress, endothelial integrity, and neuroinflammation—processes that are pertinent to the pathogenesis of ASD [6,7,8].
PCS, one of the uremic toxins produced by phenolic fermentation, has been demonstrated to enhance oxidative damage, activate the aryl hydrocarbon receptor (AhR), and weaken vascular and epithelial barriers [9]. However, depending on its quantity and local context, IS, an indolic molecule, may have two functions: it can operate as a mucosal immune regulator and a neurotoxic [10]. Although its precise function in ASD is unclear, TMAO, which is generated by microbial precursors and hepatic oxidation, connects gut metabolism with neurological and cardiovascular consequences [11].
Assessing stool consistency and water content, which are functional characteristics that represent gut motility and microbial activity, is a promising method for separating these effects [12,13,14]. Fermentation time and the formation of microbial metabolites are influenced by stool form, as determined by the Bristol Stool Chart, and hydration level. For example, faster transit tends to promote phenolic fermentation (e.g., PCS) while suppressing indolic metabolism (e.g., IS) [15].
The four uremic toxins under investigation—ADMA, TMAO, IS, and PCS—come from different host and microbial metabolic pathways (Figure 1). Tyrosine and tryptophan, respectively, are the microbial fermentation products of amino acid metabolism represented by PCS and IS, whereas choline and carnitine are converted by microbes into trimethylamine and then oxidized by the liver to produce TMAO. An endogenous nitric oxide synthase inhibitor, ADMA reflects methylation load and host cellular stress. Urinary levels are a non-invasive indicator of metabolic output obtained from the gut since these substances are taken up by the bloodstream and eliminated by the kidneys.
The interplay between microbial fermentation and host detoxification is central to understanding systemic metabolite patterns and their potential impact on neurodevelopment.
Recent research supports the use of functional ratios, such as IS/PCS and PCS/TMAO, as more insightful indicators of microbial-metabolic balance than absolute toxin levels. These ratios take into consideration changes in hepatic transformation, systemic clearance, and fermentation routes, all of which can differ among ASD subtypes [16,17,18].
We suggest a unique Metabolic Index of Gut Dysfunction (MIGD), a composite biomarker that combines important toxin ratios, in order to integrate this complexity. MIGD may improve our capacity to categorize ASD patients according to metabolic profile and forecast the intensity of symptoms or responsiveness to treatment by reflecting phenolic overload, indole suppression, and uremic burden.
By establishing a connection between urine toxin profiles and stool consistency and hydration, our work seeks to explore these new indicators of microbial metabolism in ASD. We evaluate novel functional ratios, conventional toxin concentrations, and the possibility of MIGD as a comprehensive marker of gut metabolic dysfunction in autism.
2. Materials and Methods
Participants
The study cohort included children diagnosed with autism spectrum disorder (ASD) (n = 97) and neurotypical controls (n = 71), aged between 2 and 17 years. Children in the study group were diagnosed with ASD by an expert paediatrician or a neuropsychiatrist in collaboration with a psychologist. A multidisciplinary team consisting of paediatricians, psychiatrists, and psychologists diagnosed ASD with a clinical assessment and a psychological assessment. The criteria summarized by the DSM-5 were used [19].
The study protocol was approved by the National Medical Ethics Committee (0120-201/2016-2 KME 78/03/16).
Informed consent was obtained from guardians, and the study was approved by the relevant ethics committee.
Stool Assessment
Stool consistency was classified according to the Bristol Stool Chart (BSC), with types 1–2 designated as hard stools, 3–5 as normal, and 6–7 as loose stools. Subgroups were created accordingly within the ASD and control populations.
Table 1 details the distribution of sex and age among ASD and control children by BSC category. A male predominance is noted in all subgroups, especially in those with normal stools (BSC 3–5). Median ages are similar across groups, though slightly higher in those with looser stools. This stratification helps interpret metabolite levels by accounting for age-related renal function and metabolic output, and sex-linked differences in gut microbiota and toxin excretion.
Urine Collection and Normalization
First-morning urine samples were collected using standardized procedures. Samples were centrifuged and stored at -80°C until analysis.
Methods
Toxin Quantification: Urinary concentrations of p-cresyl sulfate (PCS), trimethylamine N-oxide (TMAO), indoxyl sulfate (IS), and asymmetric dimethylarginine (ADMA) were quantified using ultra-performance liquid chromatography with tandem mass spectrometry (UPLC-MS/MS), according to validated protocols. The instrumentation comprised an Agilent 1260 Infinity LC system (Agilent Technologies, Santa Clara, CA, USA) interfaced with a QTRAP 4000 mass spectrometer (AB Sciex, Framingham, MA, USA). Each compound was quantified by monitoring two transitions (MRM mode). Reference compounds and stable isotope-labeled internal standards were sourced from Toronto Research Chemicals (TRC, Canada), Analytical sensitivity, reproducibility, and recovery rates met standard criteria for clinical metabolomics.
- Quantification of TMAO, ADMA, and SDMA
The analysis was conducted in MRM mode, applying the following transitions with corresponding DP and CE settings: ADMA (m/z 203 → 46; DP: 61 V, CE: 41 V), SDMA (m/z 203 → 172; DP: 61 V, CE: 19 V), ADMA-d6 (m/z 209 → 77; DP: 66 V, CE: 45 V), TMAO (m/z 76 → 42; DP: 66 V, CE: 53 V), and TMAO-d9 (m/z 85 → 46; DP: 61 V, CE: 59 V). Separation was carried out on a SeQuant® ZIC®-HILIC column (50 × 2.1 mm, 5 µm; Merck, Germany) maintained at 25 °C, with a mobile phase flow rate of 0.5 mL/min. The mobile phases consisted of 20 mM ammonium acetate (solvent A) and acetonitrile with 0.2% formic acid (solvent B). The gradient program was set as follows: 95% B for 0–1 min, decreasing to 50% B at 7–8 min. The injected volume was 5 µL. For sample preparation, 0.1 mL of urine was mixed with 0.1 mL internal standard solution (6 µg/mL ADMA-d6 and TMAO-d9) and 0.6 mL acetonitrile, vortexed for 3 minutes, centrifuged (10,000 g, 5 minutes), and the supernatant was injected into the LC system.
- Quantification of PCS and IS
MRM transitions used were: PCS (m/z 186.9 → 106.9), PCS-d7 (m/z 194.0 → 114.0), IS (m/z 211.9 → 79.8), and IS-d4 (m/z 216.0 → 79.9). Instrument settings included the following voltages: for IS and IS-d4 – DP/CE/EP/CXP: −60/−38/−10/−5 V and −65/−46/−10/−1 V, respectively; for PCS and PCS-d7 – −65/−28/−10/−7 V and −60/−30/−10/−7 V. Chromatographic separation was achieved on a Kinetex C18 column (100 × 4.6 mm, 2.6 µm; Phenomenex, USA), maintained at 40 °C with a 0.5 mL/min flow rate. The mobile phase system consisted of 0.1% formic acid in water (A) and in methanol (B). The gradient profile was: 10% B from 0 to 0.5 min, ramping to 95% B from 4.5 to 8.5 min. A 10 µL aliquot was injected. For sample processing, 0.01 mL of urine was mixed with 0.05 mL of internal standards (2 µg/mL PCS-d7 and IS-d4) and 0.6 mL methanol, vortexed for 3 min, centrifuged at 10,000 g for 5 min,diluted with water (6-times) and analyzed by LC-MS/MS.
Creatinine levels were measured enzymatically, and metabolite concentrations were normalized to creatinine (µmol/mmol creatinine) to adjust for urinary dilution.
Statistics
R version 4.3.1 in conjunction with RStudio version 2023.12.0 was used for statistical analysis., using the tidyverse suite [20] for visualisation and arsenal package [21] to compare groups.
The Shapiro-Wilk test was used to evaluate the distribution of data. Results showed that all datasets had non-normal distributions and so non-parametric tests Wilcoxon signed-rank test was employed for comparisons. The Benjamini-Hochberg procedure was used to control false discovery rate, with alpha significance level of 0.05
MIGD Formula Application: The Metabolic Index of Gut Dysfunction (MIGD) was calculated using the formula: (PCS/TMAO × 100) ÷ (IS/ADMA). Medians of the respective toxins were used for this composite index. Additional ratios (PCS/TMAO and IS/ADMA) were computed to support interpretation of microbial fermentation dynamics.
All statistical analyses and visualizations were performed using GraphPad Prism and R statistical software
3. Results
We measured uremic toxin levels in the urine (Table 2) and computed two composite indices, the Fermentation Skew Index (FSI) and the Metabolic Index of Gut Dysfunction (MIGD), to investigate these metabolic abnormalities. These indicators are shown in Figure 2 for both ASD and control children across stool-consistency-stratified subgroups, revealing unique metabolic profiles linked to phenotypic heterogeneity.
Four urinary uremic toxins (ADMA, SDMA, TMAO, IS, and PCS) are shown in Table 2 together with their mean and median concentrations for controls and children with ASD by stool type. Children with ASD who had loose stools had the lowest ADMA and highest IS levels (BSC 6–7), although PCS was comparatively high in both the hard and normal stool groupings. These distributions imply that transit time and stool consistency affect the microbial metabolic activity and clearance. While increasing IS in loose feces may indicate increased indole turnover or hindered excretion, the noticeably high PCS in hard stool subtypes is consistent with phenolic fermentation dominance.
Due to relatively small group sizes, the statistical power for several comparisons is restricted, especially within the ASD subgroups stratified by stool consistency, even though Table 2 displays median and mean concentrations across clearly defined subgroups. As a result, even if there are trends in the levels of uremic toxin, a number of between-group comparisons fall short of statistical significance (as shown by p-values). The observed directional shifts (e.g., raised PCS in ASD with hard stools or high IS in those with loose stools) may still represent underlying metabolic changes that need to be confirmed in larger samples, thus this does not necessarily rule out biological relevance.
The median levels of the four main uremic toxins, standardized to urine creatinine, are shown in Table 3 for each of the subgroups based on stool consistency and ASD status. PCS was somewhat high in children with hard stools and higher in children with ASD who had regular stools. TMAO levels were generally lower in ASD subgroups, especially those with looser or firmer stools, and greatest in controls. The loose stool group had the highest IS values, which may indicate a higher rate of microbial turnover or retention. Children with ASD who had regular stools had the greatest ADMA, whereas those with loose stools had the lowest.
The estimated ratios that make up the Metabolic Index of Gut Dysfunction (MIGD) are given in Table 4. The ratio of methylamine-based microbial metabolism (TMAO from choline and carnitine) to phenolic fermentation (PCS from tyrosine metabolism) is shown in PCS/TMAO. Slower transit or increased proteolytic/phenolic activities are indicated by a high PCS/TMAO ratio. The equilibrium between indolic metabolites (IS from tryptophan breakdown) and host detox load (ADMA, associated with nitric oxide regulation and renal clearance) is captured by IS/ADMA. Increased tryptophan fermentation, compromised hepatic detoxification, or endothelial dysfunction could all be indicated by a high IS/ADMA ratio.
The ASD group with firm stools (BSC 1-2) had the greatest PCS/TMAO ratio, indicating strong phenolic fermentation. Conversely, children with ASD who had loose stools (BSC 6–7) had the greatest IS/ADMA ratio, which is associated with increased or maintained indole production. Because of the inhibitory effect of a high IS/ADMA denominator, MIGD was lowest in this group. The ASD hard stool subgroup had the highest MIGD, which was indicative of low indole detox efficiency and double elevation in phenolic dominance. According to these findings, MIGD and its constituent parts offer distinct and complementary insights into the metabolic profiles of microbes and hosts in ASD.
The Fermentation Skew Index (FSI), which is the ratio of the PCS/TMAO and IS/ADMA values, is another derived metric that we present. The directional bias of microbial fermentation output toward phenolic as opposed to indolic products is captured by FSI. Children with ASD who have firm stools have the highest FSI (5.55), which supports a phenolic-dominant profile with inhibited indole metabolism. In contrast, a more balanced or indole-leaning fermentation activity is supported by the loose stool group's lowest FSI (1.10). Based on gut fermentation profiles, FSI may be used as a simple marker to categorize ASD manifestations and describe microbial metabolic orientation.
4. Discussion
Our research provides strong evidence for the metabolic relationship between stool consistency and gut-derived uremic toxins in children with autism spectrum disorder (ASD). It was possible to characterize fermentation profiles linked to gastrointestinal function by using urinary levels of PCS, TMAO, IS, and ADMA.
Trends found by the Metabolic Index of Gut Dysfunction (MIGD) were paradoxical yet biologically meaningful. Unexpectedly, children with ASD who had hard stools (BSC 1-2) had the highest MIGD, whereas children with loose stools (BSC 6-7) had the lowest value. This involved the interaction of component ratios rather than just the amount of toxins. The PCS/TMAO ratio, which indicates phenolic dominance, and the IS/ADMA ratio, which indicates indole metabolism and detoxifying load, are combined in MIGD.
Children with ASD who had firm stools had low IS/ADMA and high PCS/TMAO ratios, which resulted in a MIGD of 555.26. These kids might have a phenotype characterized by an excess of phenolic load and ineffective indolic pathways, which are linked to oxidative stress and weakened mucosal immunity [18,22]. On the other hand, high IS/ADMA ratios (11.13), which may indicate increased indole synthesis or hindered elimination in the context of rapid gut transit, were the cause of the low MIGD in children with loose stools [23].
Further analysis of the PCS/TMAO and IS/ADMA ratios revealed that hard feces had higher phenolic fermentation, whereas loose stools correlated with comparatively high indolic metabolism [24,25]. This contradiction implies that MIGD measures phenotypic diversity in host-microbial dynamics rather than disease severity.
Endothelial damage and neuroinflammation have been linked to PCS, a phenolic toxin [26] IS uses AhR pathways to regulate immunological activation [27]. Hepatic oxidation of microbial metabolites influences TMAO, which is reduced in ASD groups [11]. In ASD, ADMA levels may indicate altered nitric oxide signaling or endothelial dysfunction [28].
Despite being a mathematically composite metric, MIGD has the potential to magnify non-linear interactions between host processing and microbial pathways. Therefore, MIGD should be understood in conjunction with its component ratios, especially when liver, kidney, or microbiome function may change. MIGD is meant to be a functional indicator of host responsiveness and gut microbial metabolic output rather than a stand-in for symptom intensity. Because of this, FSI and MIGD, or even OGI, the suggested Osredkar–Godnov Index, ought to be viewed as complementing instruments. When combined, they provide a multifaceted understanding of host interaction and gut microbial production in ASD.
These results are also consistent with other observations that the microbiota of ASD is dominated by proteolytic and phenolic fermentation [29,30,31,32] . Our findings, however, provide granularity by demonstrating how stool consistency affects toxin expression and by providing reliable composite measures that may be used in intervention trials or longitudinal surveillance. Future studies should verify these indices throughout time, look into connections with behavior and food, and evaluate how useful they are for classifying ASD subtypes or developing microbially focused treatments.
Extended Applications of OGI and FSI
The Osredkar–Godnov Index (OGI) and Fermentation Skew Index (FSI) provide a variety of potential for translational research and therapeutic integration beyond their primary usage as metabolic classifiers in ASD. These indicators might be useful in early detection models, especially in baby cohorts at risk, when behavioral signs are preceded by microbial metabolic imbalance. Because of their dynamic character, they can be used to track the effectiveness of pharmaceutical treatments or interventions controlled by the microbiota. They could aid in defining fermentation patterns particular to different species when combined with microbiome sequencing. They also have potential as transdiagnostic tools, which could help differentiate ASD from other gastrointestinal or neurodevelopmental disorders. These indices' significance for precision diagnostics and tailored care pathways could be increased by further integrating them with neuroimaging and exposome data inside systems biology frameworks.
Strengths
A large and clinically well-characterized cohort of children with autism spectrum disorder (ASD) and matched neurotypical controls is advantageous to our research. The Bristol Stool Chart's stool consistency stratification adds a functional gastrointestinal feature that makes it possible to identify metabolic trends unique to phenotypes. A unique method for incorporating numerous uremic toxins into biologically meaningful interpretations is the introduction of two new composite metrics: The Fermentation Skew Index (FSI) and MIGD (also proposed as the Osredkar–Godnov Index). With the potential for therapeutic use and longitudinal tracking, the use of urine biomarkers adjusted to creatinine offers a quantitative, non-invasive evaluation of host detoxification burden and systemic microbial fermentation activity.
Limitations
The cross-sectional nature of the study limits its ability to examine longitudinal dynamics and draw conclusions about causality. Subgroup sizes were relatively small, especially within the ASD cohort stratified by stool phenotype, which limited statistical power and led to nonsignificant p-values in certain comparisons despite persistent biological trends, even though the total sample size is robust. Deeper mechanistic interpretation is limited by the absence of food information, behavioral severity indicators, and microbiome characterization. Furthermore, even after creatinine adjustment, individual differences in hepatic or renal function might have affected uremic toxin excretion. These elements emphasize the necessity of additional testing of the suggested indices in larger and more well described populations.
References
- Lefter, R.; Ciobica, A.; Timofte, D.; Stanciu, C.; Trifan, A. A Descriptive Review on the Prevalence of Gastrointestinal Disturbances and Their Multiple Associations in Autism Spectrum Disorder. Medicina (Mex.) 2019, 56, 11. [Google Scholar] [CrossRef] [PubMed]
- Warner, B.B. The Contribution of the Gut Microbiome to Neurodevelopment and Neuropsychiatric Disorders. Pediatr. Res. 2019, 85, 216–224. [Google Scholar] [CrossRef] [PubMed]
- Swer, N.M.; Venkidesh, B.S.; Murali, T.S.; Mumbrekar, K.D. Gut Microbiota-Derived Metabolites and Their Importance in Neurological Disorders. Mol. Biol. Rep. 2023, 50, 1663–1675. [Google Scholar] [CrossRef]
- Meijers, B.K.I.; Evenepoel, P. The Gut-Kidney Axis: Indoxyl Sulfate, p-Cresyl Sulfate and CKD Progression. Nephrol. Dial. Transplant. 2011, 26, 759–761. [Google Scholar] [CrossRef] [PubMed]
- Garrido-Moreno, A.; García-Morales, V.J.; Lockett, N.; King, S. The Missing Link: Creating Value with Social Media Use in Hotels. Int. J. Hosp. Manag. 2018, 75, 94–104. [Google Scholar] [CrossRef]
- Cunha, R.S.D.; Santos, A.F.; Barreto, F.C.; Stinghen, A.E.M. How Do Uremic Toxins Affect the Endothelium? Toxins 2020, 12, 412. [Google Scholar] [CrossRef]
- Harlacher, E.; Wollenhaupt, J.; Baaten, C.C.F.M.J.; Noels, H. Impact of Uremic Toxins on Endothelial Dysfunction in Chronic Kidney Disease: A Systematic Review. Int. J. Mol. Sci. 2022, 23, 531. [Google Scholar] [CrossRef]
- Osredkar, J.; Baškovič, B.Ž.; Finderle, P.; Bobrowska-Korczak, B.; Gątarek, P.; Rosiak, A.; Giebułtowicz, J.; Vrhovšek, M.J.; Kałużna-Czaplińska, J. Relationship between Excreted Uremic Toxins and Degree of Disorder of Children with ASD. Int. J. Mol. Sci. 2023, 24, 7078. [Google Scholar] [CrossRef]
- Guerra-Ojeda, S.; Suarez, A.; Valls, A.; Verdú, D.; Pereda, J.; Ortiz-Zapater, E.; Carretero, J.; Mauricio, M.D.; Serna, E. The Role of Aryl Hydrocarbon Receptor in the Endothelium: A Systematic Review. Int. J. Mol. Sci. 2023, 24, 13537. [Google Scholar] [CrossRef]
- Lee, J.-H.; Wood, T.K.; Lee, J. Roles of Indole as an Interspecies and Interkingdom Signaling Molecule. Trends Microbiol. 2015, 23, 707–718. [Google Scholar] [CrossRef]
- Quan, L.; Yi, J.; Zhao, Y.; Zhang, F.; Shi, X.-T.; Feng, Z.; Miller, H.L. Plasma Trimethylamine N-Oxide, a Gut Microbe–Generated Phosphatidylcholine Metabolite, Is Associated with Autism Spectrum Disorders. NeuroToxicology 2020, 76, 93–98. [Google Scholar] [CrossRef] [PubMed]
- Asnicar, F.; Leeming, E.R.; Dimidi, E.; Mazidi, M.; Franks, P.W.; Al Khatib, H.; Valdes, A.M.; Davies, R.; Bakker, E.; Francis, L.; et al. Blue Poo: Impact of Gut Transit Time on the Gut Microbiome Using a Novel Marker. Gut 2021, 70, 1665–1674. [Google Scholar] [CrossRef] [PubMed]
- Vandeputte, D.; Falony, G.; Vieira-Silva, S.; Tito, R.Y.; Joossens, M.; Raes, J. Stool Consistency Is Strongly Associated with Gut Microbiota Richness and Composition, Enterotypes and Bacterial Growth Rates. Gut 2016, 65, 57–62. [Google Scholar] [CrossRef]
- Vork, L.; Penders, J.; Jalanka, J.; Bojic, S.; Van Kuijk, S.M.J.; Salonen, A.; De Vos, W.M.; Rajilic-Stojanovic, M.; Weerts, Z.Z.R.M.; Masclee, A.A.M.; et al. Does Day-to-Day Variability in Stool Consistency Link to the Fecal Microbiota Composition? Front. Cell. Infect. Microbiol. 2021, 11, 639667. [Google Scholar] [CrossRef]
- Kashyap, P.C.; Marcobal, A.; Ursell, L.K.; Larauche, M.; Duboc, H.; Earle, K.A.; Sonnenburg, E.D.; Ferreyra, J.A.; Higginbottom, S.K.; Million, M.; et al. Complex Interactions Among Diet, Gastrointestinal Transit, and Gut Microbiota in Humanized Mice. Gastroenterology 2013, 144, 967–977. [Google Scholar] [CrossRef]
- Frye, R.E.; James, S.J. Metabolic Pathology of Autism in Relation to Redox Metabolism. Biomark. Med. 2014, 8, 321–330. [Google Scholar] [CrossRef] [PubMed]
- Peralta-Marzal, L.N.; Prince, N.; Bajic, D.; Roussin, L.; Naudon, L.; Rabot, S.; Garssen, J.; Kraneveld, A.D.; Perez-Pardo, P. The Impact of Gut Microbiota-Derived Metabolites in Autism Spectrum Disorders. Int. J. Mol. Sci. 2021, 22, 10052. [Google Scholar] [CrossRef]
- Wang, L.; Conlon, M.A.; Christophersen, C.T.; Sorich, M.J.; Angley, M.T. Gastrointestinal Microbiota and Metabolite Biomarkers in Children With Autism Spectrum Disorders. Biomark. Med. 2014, 8, 331–344. [Google Scholar] [CrossRef]
- American Psychiatric Association Diagnostic and Statistical Manual of Mental Disorders; Fifth Edition.; American Psychiatric Association, 2013; ISBN 978-0-89042-555-8.
- Wickham, H.; Averick, M.; Bryan, J.; Chang, W.; McGowan, L.; François, R.; Grolemund, G.; Hayes, A.; Henry, L.; Hester, J.; et al. Welcome to the Tidyverse. J. Open Source Softw. 2019, 4, 1686. [Google Scholar] [CrossRef]
- Heinzen, E.; Sinnwell, J.; Atkinson, E.; Gunderson, T.; Dougherty, G. Arsenal: An Arsenal of “R” Functions for Large-Scale Statistical Summaries 2016, 3.6.3.
- Srikantha, P.; Mohajeri, M.H. The Possible Role of the Microbiota-Gut-Brain-Axis in Autism Spectrum Disorder. Int. J. Mol. Sci. 2019, 20, 2115. [Google Scholar] [CrossRef]
- Chumpitazi, B.P.; Lewis, J.; Cooper, D.; D’Amato, M.; Lim, J.; Gupta, S.; Miranda, A.; Terry, N.; Mehta, D.; Scheimann, A.; et al. Hypomorphic SI Genetic Variants Are Associated with Childhood Chronic Loose Stools. PLOS ONE 2020, 15, e0231891. [Google Scholar] [CrossRef]
- Candeliere, F.; Simone, M.; Leonardi, A.; Rossi, M.; Amaretti, A.; Raimondi, S. Indole and P-Cresol in Feces of Healthy Subjects: Concentration, Kinetics, and Correlation with Microbiome. Front. Mol. Med. 2022, 2, 959189. [Google Scholar] [CrossRef]
- Ramos, C.I.; Armani, R.G.; Canziani, M.E.; Ribeiro Dolenga, C.J.; Nakao, L.S.; Campbell, K.L.; Cuppari, L. Bowel Habits and the Association With Uremic Toxins in Non–Dialysis-Dependent Chronic Kidney Disease Patients. J. Ren. Nutr. 2020, 30, 31–35. [Google Scholar] [CrossRef] [PubMed]
- Sun, C.-Y.; Li, J.-R.; Wang, Y.-Y.; Lin, S.-Y.; Ou, Y.-C.; Lin, C.-J.; Wang, J.-D.; Liao, S.-L.; Chen, C.-J. P-Cresol Sulfate Caused Behavior Disorders and Neurodegeneration in Mice with Unilateral Nephrectomy Involving Oxidative Stress and Neuroinflammation. Int. J. Mol. Sci. 2020, 21, 6687. [Google Scholar] [CrossRef] [PubMed]
- Gutiérrez-Vázquez, C.; Quintana, F.J. Regulation of the Immune Response by the Aryl Hydrocarbon Receptor. Immunity 2018, 48, 19–33. [Google Scholar] [CrossRef]
- Cooke, J.P. Does ADMA Cause Endothelial Dysfunction? Arterioscler. Thromb. Vasc. Biol. 2000, 20, 2032–2037. [Google Scholar] [CrossRef]
- Coretti, L.; Paparo, L.; Riccio, M.P.; Amato, F.; Cuomo, M.; Natale, A.; Borrelli, L.; Corrado, G.; De Caro, C.; Comegna, M.; et al. Gut Microbiota Features in Young Children With Autism Spectrum Disorders. Front. Microbiol. 2018, 9, 3146. [Google Scholar] [CrossRef] [PubMed]
- Korteniemi, J.; Karlsson, L.; Aatsinki, A. Systematic Review: Autism Spectrum Disorder and the Gut Microbiota. Acta Psychiatr. Scand. 2023, 148, 242–254. [Google Scholar] [CrossRef]
- Plaza-Díaz, J.; Gómez-Fernández, A.; Chueca, N.; Torre-Aguilar, M.J.D.L.; Gil, Á.; Perez-Navero, J.L.; Flores-Rojas, K.; Martín-Borreguero, P.; Solis-Urra, P.; Ruiz-Ojeda, F.J.; et al. Autism Spectrum Disorder (ASD) with and without Mental Regression Is Associated with Changes in the Fecal Microbiota. Nutrients 2019, 11, 337. [Google Scholar] [CrossRef]
- Strati, F.; Cavalieri, D.; Albanese, D.; De Felice, C.; Donati, C.; Hayek, J.; Jousson, O.; Leoncini, S.; Renzi, D.; Calabrò, A.; et al. New Evidences on the Altered Gut Microbiota in Autism Spectrum Disorders. Microbiome 2017, 5, 24. [Google Scholar] [CrossRef]
Figure 1.
Microbial Metabolism of Dietary Compounds and Formation of Uremic Toxins in ASD. Conceptual illustration of the origin and urinary excretion of uremic toxins relevant to ASD. Microbial metabolism in the gut lumen produces PCS from tyrosine, IS from tryptophan, and TMAO from dietary methylamines. These toxins cross the intestinal epithelium into the bloodstream and are subsequently filtered into urine. ADMA, generated via host metabolism, reflects nitric oxide inhibition and endothelial stress. All four toxins were quantified in urine samples and used to derive functional indices of gut metabolic imbalance in ASD children.
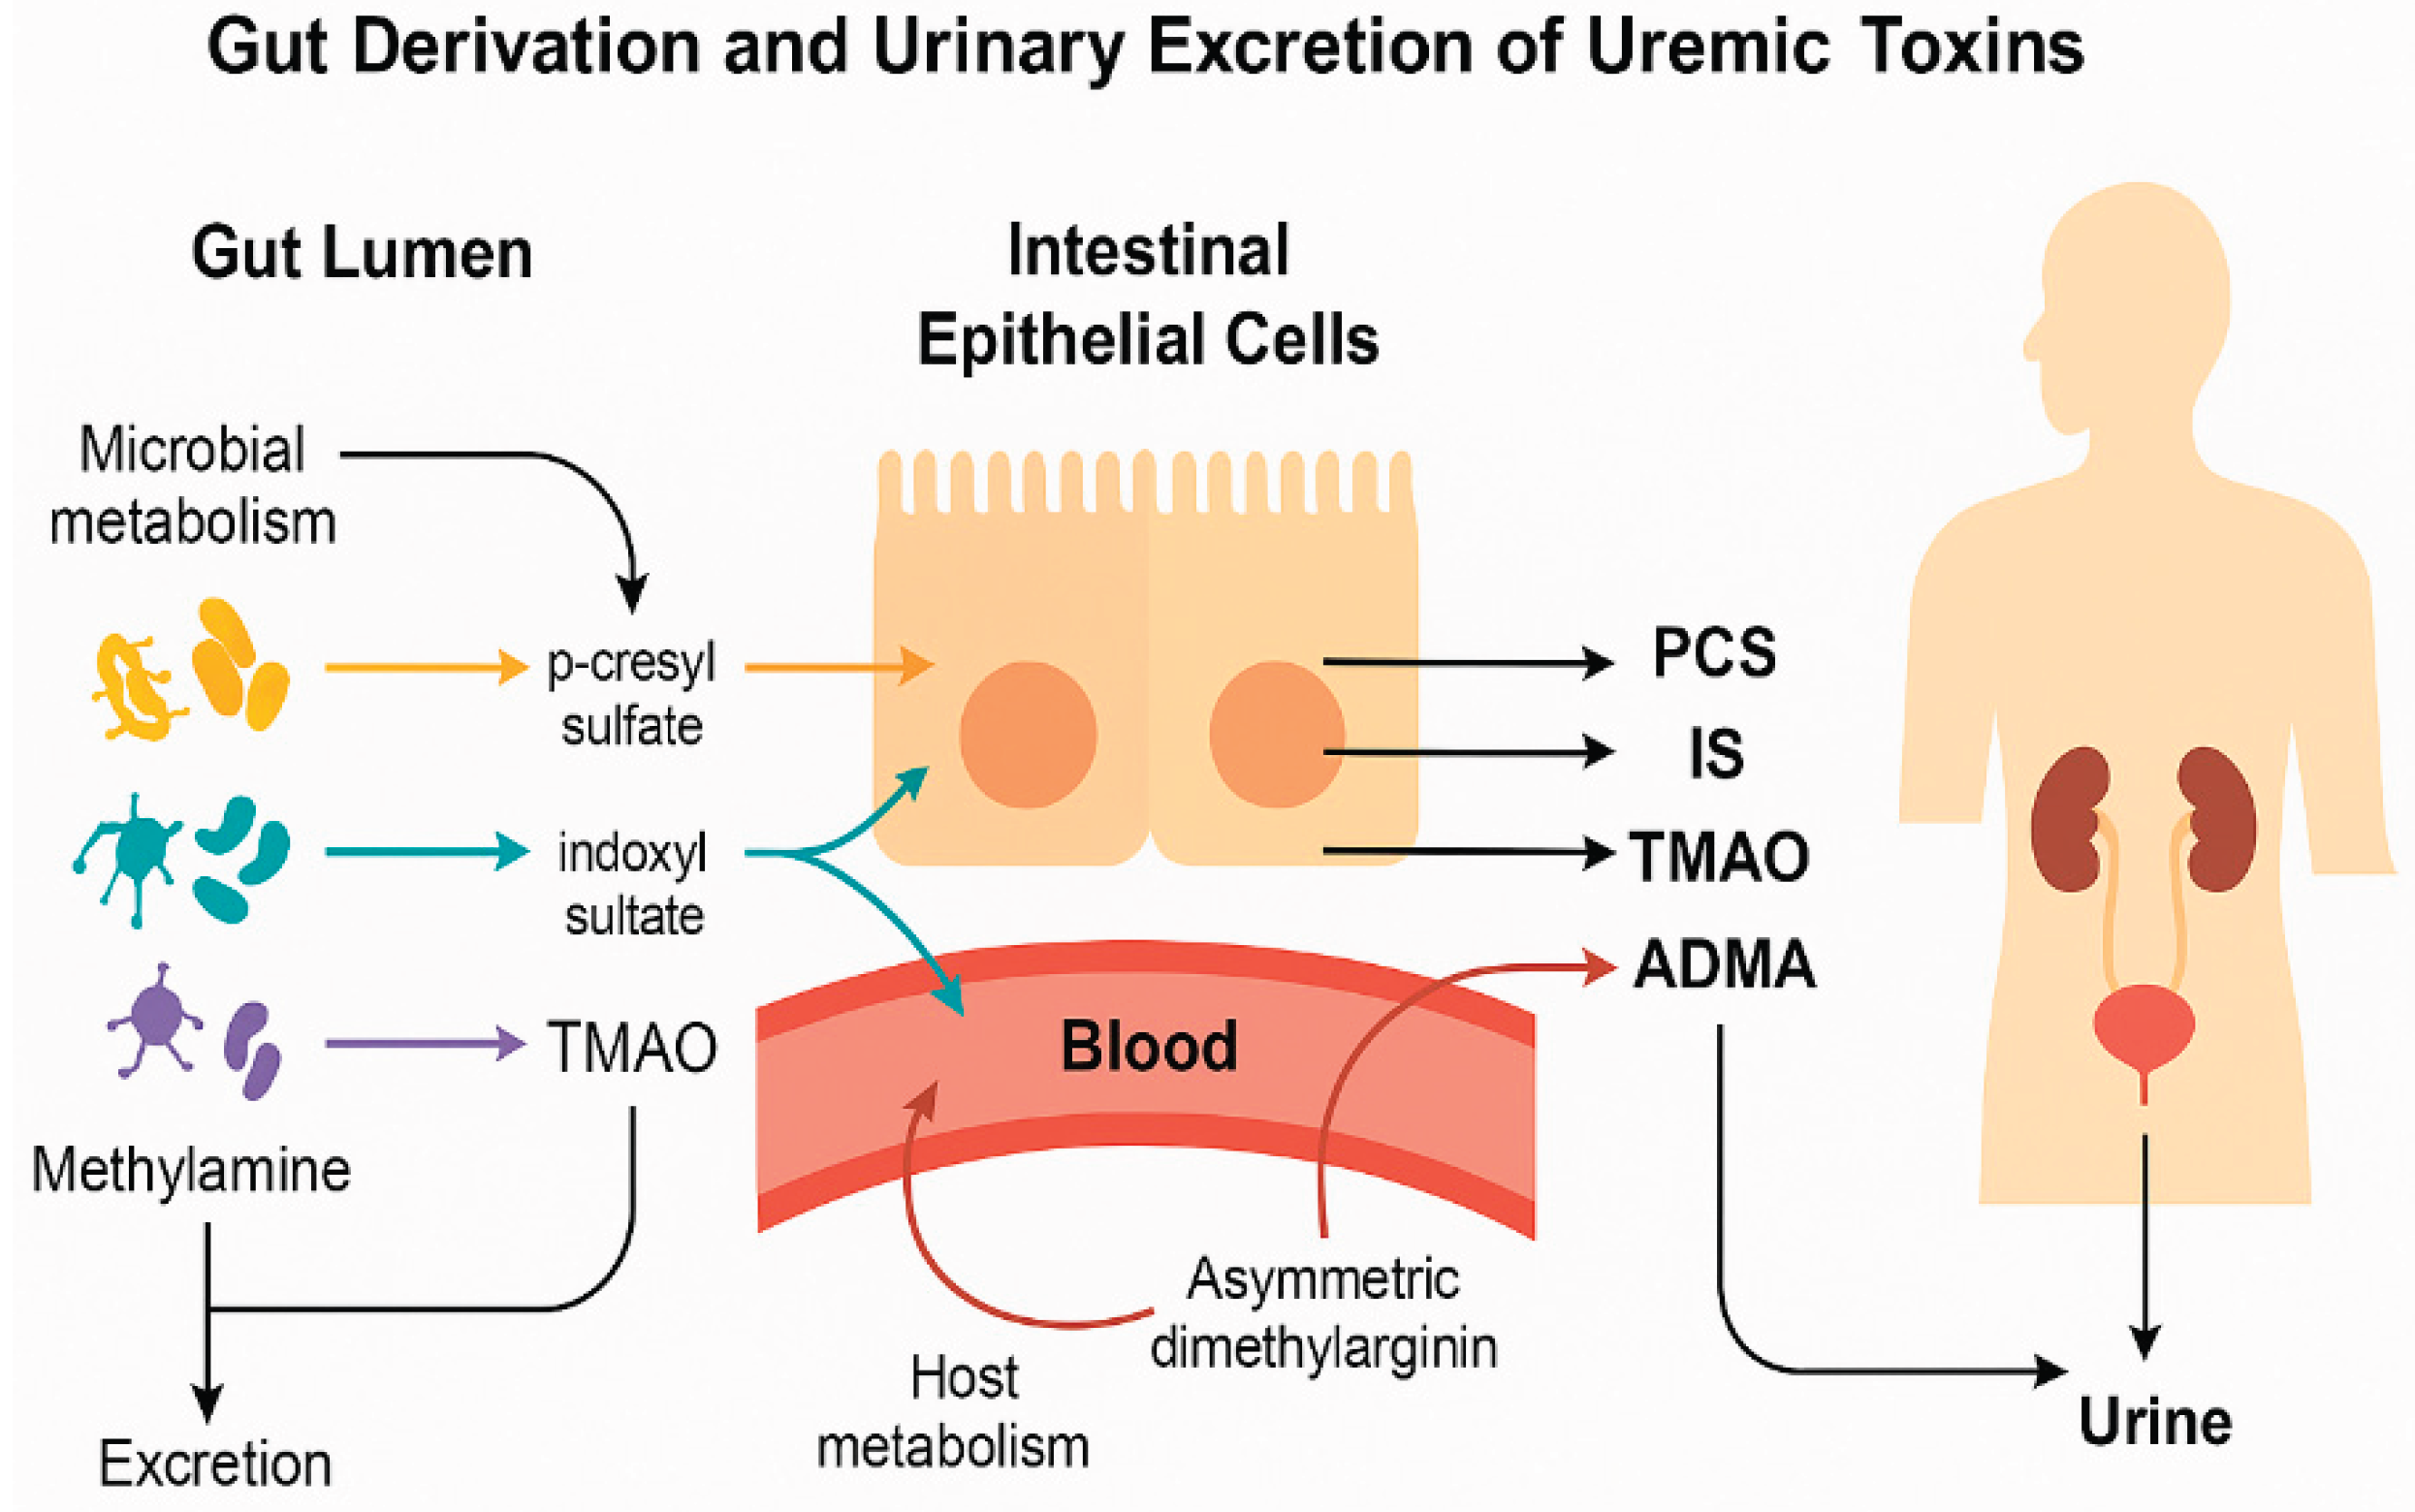
Figure 2.
Stratified Urinary Indices of Gut Dysfunction in ASD by Stool Consistency. Composite urine indices stratified by stool consistency in individuals with ASD and controls. A. Median values of the Metabolic Index of Gut Dysfunction (MIGD) across groups stratified by stool consistency. B. Corresponding values of the Fermentation Skew Index (FSI). Both indices were derived from urinary toxin ratios (PCS/TMAO and IS/ADMA) in children with ASD and neurotypical controls. Stool phenotype was based on the Bristol Stool Chart: 1–2 (hard), 3–5 (normal), 6–7 (loose). Bars represent group medians with numeric labels.
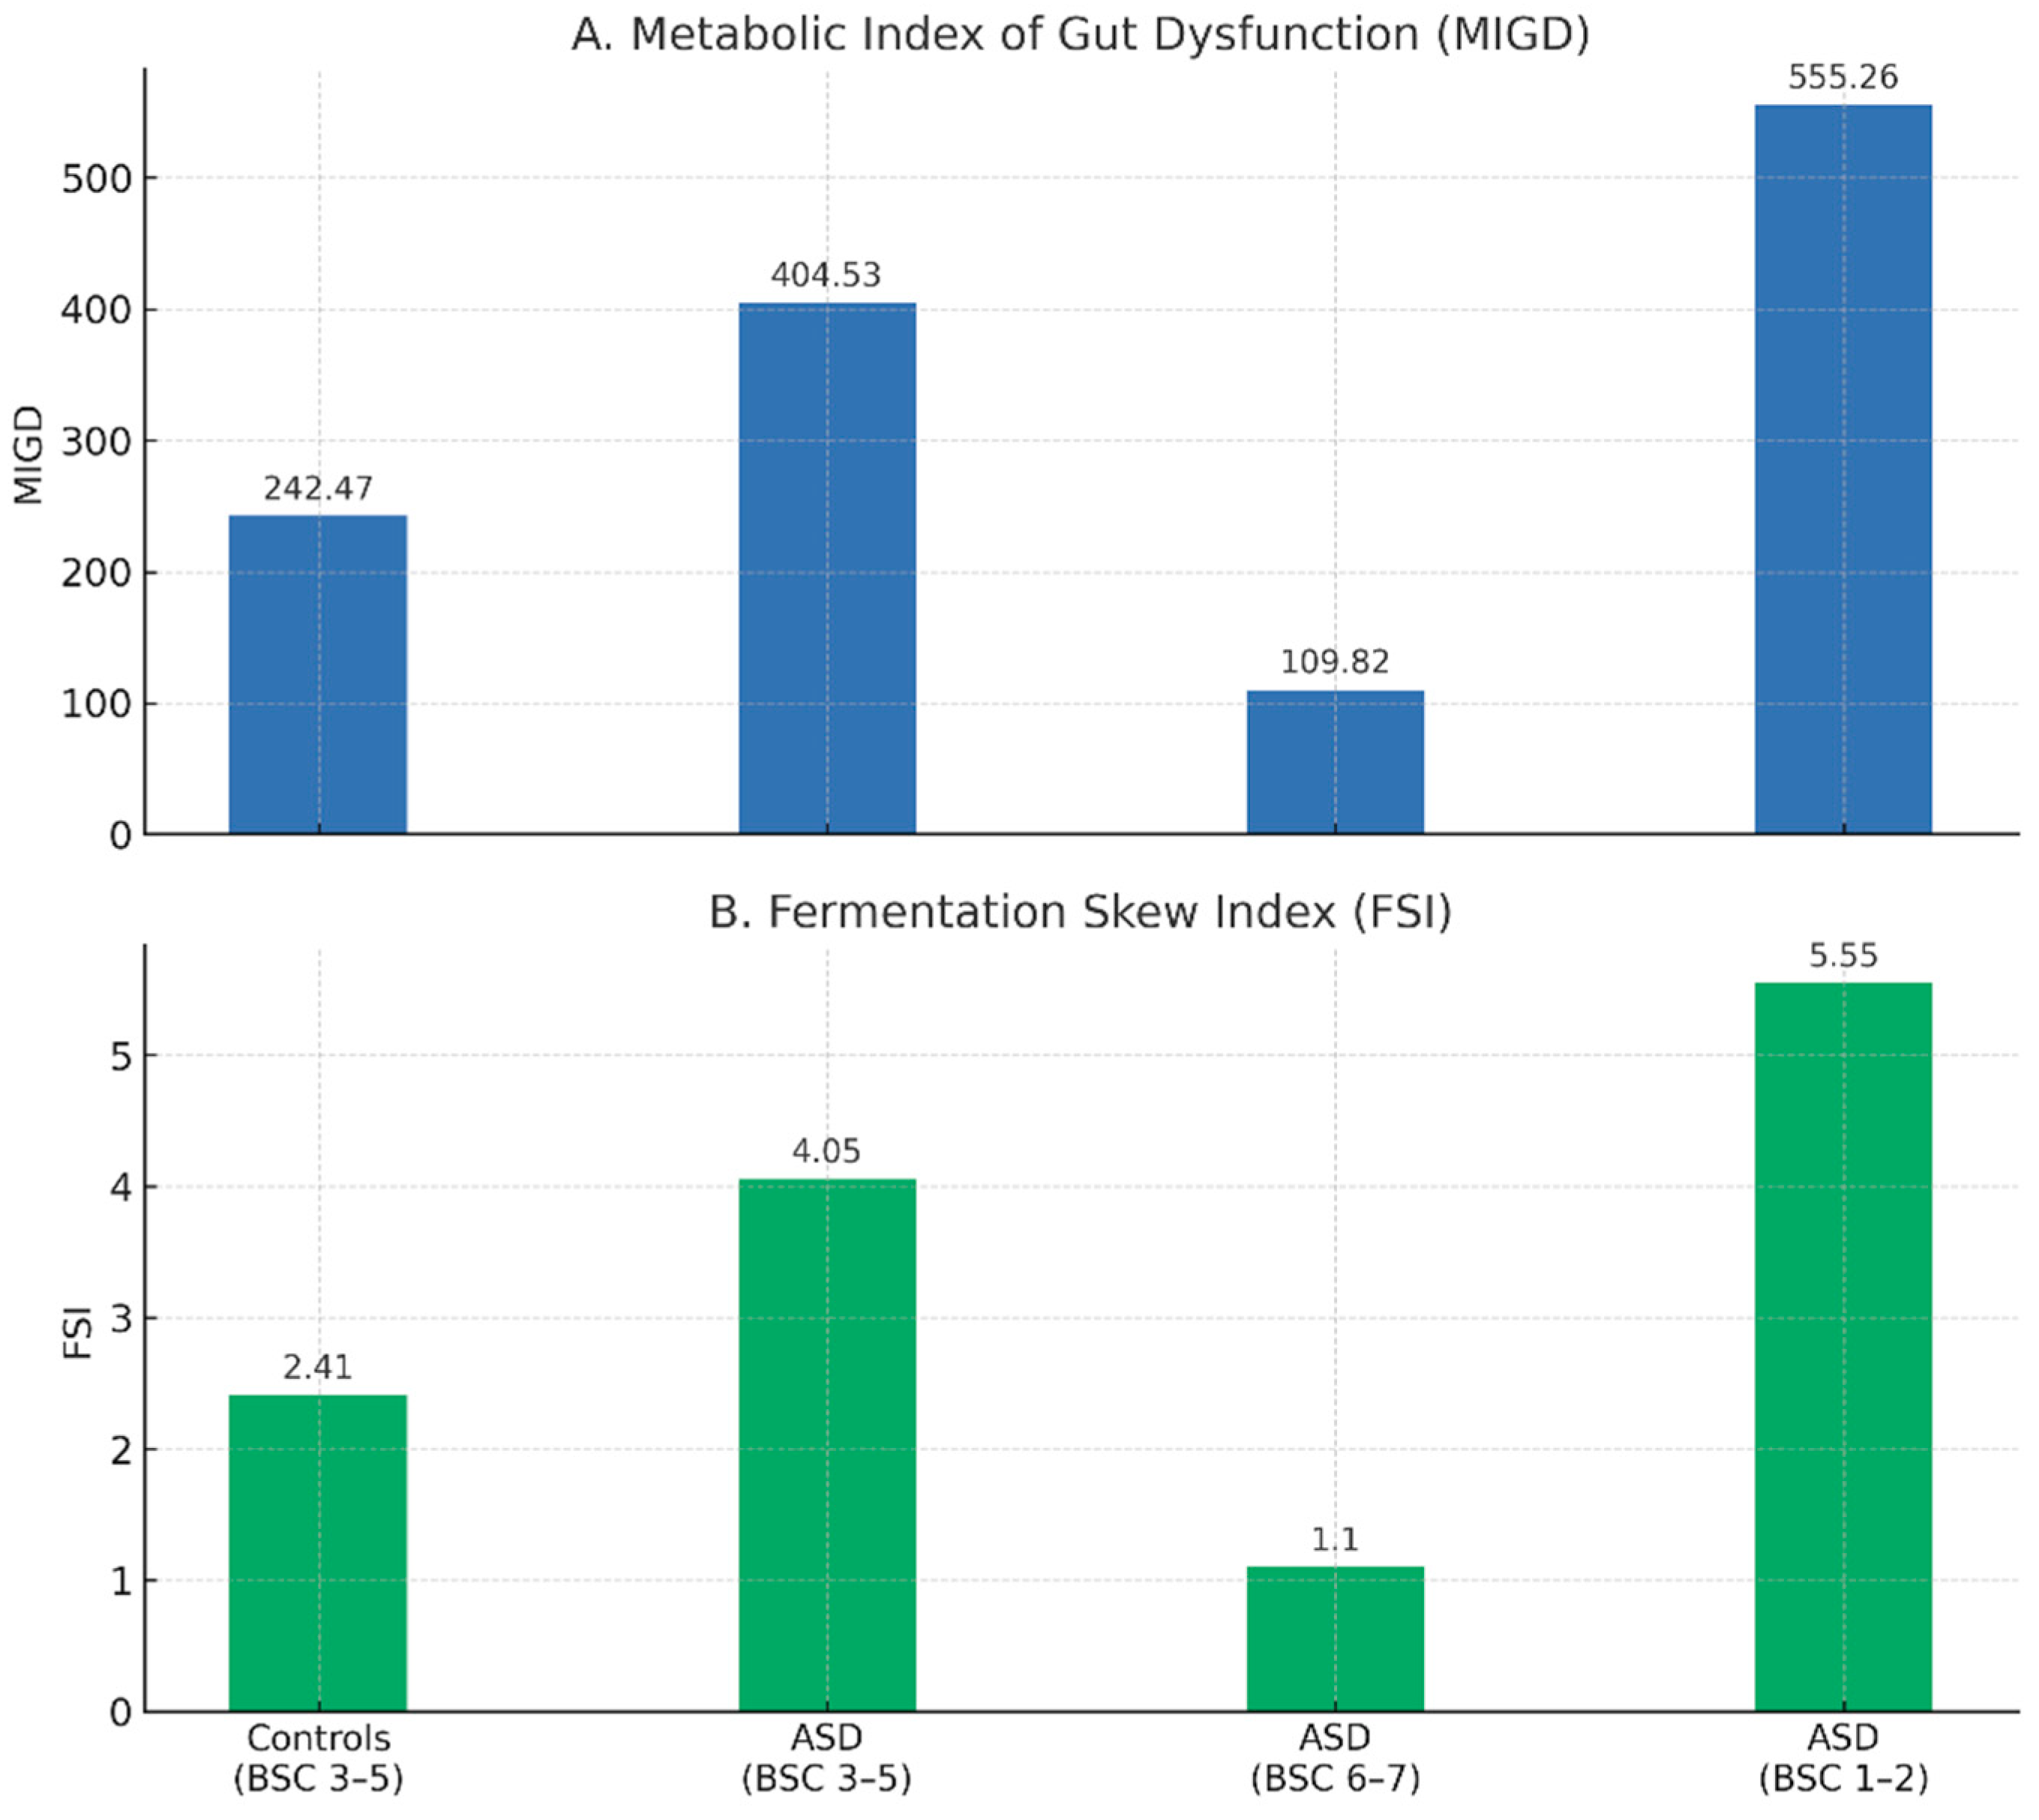

Table 1.
Demographic distribution of participants by sex and age within stool consistency groups.
| Control (N=71) | 1 (BSC 1,2) (N=28) | 1 (BSC 6,7) (N=8) | 1 (BSC 3,4,5 (N = 61) | |
|---|---|---|---|---|
| SEX | ||||
| Boys | 37 (52.1%) | 17 (60.7%) | 5 (62.5%) | 54 (88.5%) |
| Girls | 34 (47.9%) | 11 (39.3%) | 3 (37.5%) | 7 (11.5%) |
| AGE | ||||
| Mean (SD) | 8.93 (3.82) | 9.76 (4.21) | 9.88 (3.15) | 9.24 (3.68) |
| Median (Q1, Q3) | 8.60 (6.20, 11.25) | 9.05 (6.18, 13.03) | 10.40 (8.05, 12.55) | 8.70 (6.20, 11.30) |
| Min - Max | 2.40 - 16.70 | 3.50 - 17.00 | 4.60 - 13.20 | 2.50 - 16.70 |
Table 2.
Urinary uremic toxin concentrations (µmol/mmol creatinine) across ASD and control groups stratified by Bristol Stool Chart (BSC) type.
Table 2.
Urinary uremic toxin concentrations (µmol/mmol creatinine) across ASD and control groups stratified by Bristol Stool Chart (BSC) type.
| Control (N=71) |
1 (BSC 1,2) (N=28) | 1 (BSC 6,7) (N=8) | 1 (BSC 3,4,5 (N = 61) | p value | |||
|---|---|---|---|---|---|---|---|
| 0 | 1 | 2 | 3 | 0:1 | 0:2 | 0:3 | |
| ADMA | 0.68 | 0.28 | 0.25 | ||||
| Mean (SD) | 13.93 (6.66) | 14.59 (5.93) | 12.73 (9.66) | 15.65 (7.21) | |||
| Median (Q1, Q3) | 12.38 (9.73, 18.33) | 14.79 (10.69, 16.95) | 8.02 (7.57, 15.15) | 15.09 (11.32, 19.54) | |||
| Min - Max | 1.67 - 32.29 | 4.53 - 27.89 | 3.81 - 31.88 | 2.50 - 34.36 | |||
| SDMA | 0.76 | 0.48 | 0.88 | ||||
| Mean (SD) | 31.07 (12.37) | 30.98 (12.41) | 31.24 (23.59) | 33.86 (17.11) | |||
| Median (Q1, Q3) | 31.14 (23.01, 38.09) | 29.09 (20.17, 36.91) | 19.73 (14.64, 50.79) | 29.08 (23.16, 44.29) | |||
| Min - Max | 7.07 - 65.47 | 12.05 - 64.63 | 8.33 - 70.26 | 4.09 - 79.83 | |||
| TMAO | 0.11 | 0.29 | 0.76 | ||||
| Mean (SD) | 3.42 (2.61) | 2.41 (1.49) | 2.22 (2.18) | 3.68 (2.81) | |||
| Median (Q1, Q3) | 3.04 (1.44, 4.94) | 2.38 (1.69, 3.52) | 2.60 (0.04, 3.81) | 3.19 (1.67, 5.53) | |||
| Min - Max | 0.00 - 9.30 | 0.01 - 5.10 | 0.01 - 5.20 | 0.01 - 10.19 | |||
| IS | 0.43 | 0.91 | 0.26 | ||||
| Mean (SD) | 71.04 (40.71) | 63.89 (39.65) | 70.94 (48.33) | 62.65 (39.79) | |||
| Median (Q1, Q3) | 63.80 (39.77, 103.18) | 52.26 (41.88, 79.10) | 89.25 (23.98, 108.77) | 61.52 (27.95, 89.20) | |||
| Min - Max | 3.57 - 168.60 | 17.87 - 193.60 | 14.34 - 127.50 | 3.16 - 172.30 | |||
| PCS | 0.20 | 0.92 | 0.87 | ||||
| Mean (SD) | 52.82 (43.65) | 68.28 (54.65) | 68.67 (75.00) | 55.42 (42.92) | |||
| Median (Q1, Q3) | 37.74 (20.02, 80.02) | 46.65 (29.01, 86.73) | 31.85 (9.09, 140.45) | 52.65 (15.80, 84.76) | |||
| Min - Max | 1.27 - 195.67 | 1.48 - 185.10 | 0.80 - 188.20 | 0.13 - 151.05 | |||
Table 3.
Median urinary uremic toxin concentrations stratified by group and stool consistency (normalized to creatinine).
Table 3.
Median urinary uremic toxin concentrations stratified by group and stool consistency (normalized to creatinine).
| Group | PCS (µmol/mmol) | TMAO (µmol/mmol) | IS (µmol/mmol) | ADMA (µmol/mmol) |
|---|---|---|---|---|
| Controls (BSC 3–5) | 37.74 | 3.04 | 63.80 | 12.38 |
| ASD (BSC 3–5) | 52.65 | 3.19 | 61.52 | 15.09 |
| ASD (BSC 6–7) | 31.85 | 2.60 | 89.25 | 8.02 |
| ASD (BSC 1–2) | 46.65 | 2.38 | 52.26 | 14.79 |
Table 4.
MIGD and component toxin ratios calculated from median values.
| Group | PCS/TMAO | IS/ADMA | MIGD | PCS/TMAO ÷ IS/ADMA (FSI) |
|---|---|---|---|---|
| Controls (BSC 3–5) | 12.41 | 5.15 | 242.47 | 2.41 |
| ASD (BSC 3–5) | 16.50 | 4.08 | 404.53 | 4.04 |
| ASD (BSC 6–7) | 12.25 | 11.13 | 109.82 | 1.10 |
| ASD (BSC 1–2) | 19.61 | 3.53 | 555.26 | 5.55 |
Disclaimer/Publisher’s Note: The statements, opinions and data contained in all publications are solely those of the individual author(s) and contributor(s) and not of MDPI and/or the editor(s). MDPI and/or the editor(s) disclaim responsibility for any injury to people or property resulting from any ideas, methods, instructions or products referred to in the content. |
© 2025 by the authors. Licensee MDPI, Basel, Switzerland. This article is an open access article distributed under the terms and conditions of the Creative Commons Attribution (CC BY) license (http://creativecommons.org/licenses/by/4.0/).
Copyright: This open access article is published under a Creative Commons CC BY 4.0 license, which permit the free download, distribution, and reuse, provided that the author and preprint are cited in any reuse.


