
Submitted:
20 June 2025
Posted:
23 June 2025
You are already at the latest version
Abstract
Autism spectrum disorder (ASD) is increasingly associated with microbial and metabolic disturbances, including altered production of gut-derived uremic toxins. We investigated urinary concentrations of five representative uremic toxins—indoxyl sulfate (IS), p-cresyl sulfate (PCS), trimethylamine N-oxide (TMAO), asymmetric dimethylarginine (ADMA), and symmetric dimethylarginine (SDMA)—in 161 children with ASD and 71 healthy controls. Toxins were measured by LC-MS/MS and normalized to creatinine. Subgroup analyses were performed by sex, age group (2–5.9 vs. 6–17 years), and autism severity based on the Childhood Autism Rating Scale (CARS). In addition to individual concentrations, we calculated total toxin burden, proportional contributions, and functional ratios (IS/PCS, PCS/TMAO, IS/ADMA). While individual toxin levels did not differ significantly between groups, stratified analyses revealed that PCS was higher in girls and in severe ASD, whereas IS and TMAO were reduced in younger and more severely affected children. Functional ratios shifted consistently with severity: IS/PCS declined from 1.69 in controls to 0.99 in severe ASD, and PCS/TMAO increased from 12.2 to 20.5. These patterns suggest a phenolic-dominant microbial signature and altered host-microbial metabolic balance in ASD. Functional toxin profiling may offer a more sensitive approach to characterizing metabolic disturbances in ASD than concentration analysis alone.
Keywords:
autism spectrum disorder
; uremic toxins
; p-cresyl sulfate
; indoxyl sulfate
; metabolomics
; urinary biomarkers
; gut microbiota
; TMAO
; ADMA
1. Introduction
Autism spectrum disorder (ASD) is a neurodevelopmental condition marked by repetitive behaviors that can significantly lower quality of life, memory and learning problems, and deficiencies in social communication and interaction [1,2].
ASD is one of the most prevalent neurodevelopmental disorders in children, with a current global prevalence of 1% [3]. Moreover, males are diagnosed with ASD at a rate of 4.1 times higher than girls[4].
Defective sensory processing, persistent/stereotypical behaviors, limited interests, and challenges with social interaction and communication are the primary indicators of ASD. Furthermore, ASD frequently co-occurs with intellectual disabilities (ID), anxiety disorders, and hyperactivity [5].
Autism Spectrum Disorder (ASD) is a complex neurodevelopmental condition with a multifaceted etiology involving both genetic and environmental factors [6]. Environmental toxicants, particularly during prenatal development, can potentially affect brain development and contribute to ASD risk [7]. Epigenetic mechanisms are increasingly recognized as a potential link between environmental factors and ASD risk [7,8].
An increasing number of studies suggests that the gut microbiota-brain axis may have an effect on ASD. First, ASD has been associated with increased intestinal permeability and gastrointestinal (GI) problems. Second, children with ASD and concomitant GI symptoms exhibit more severe social impairments, anxiety, and sensory over-reactivity than their counterparts with ASD who do not have GI symptoms. Third, those with ASD have dysbiosis of the gut microbiota [9,10,11,12].
It is commonly known that gut-derived chemicals can enter the bloodstream from the gut, impact multiple systems, including the central nervous system, and then be filtered into urine in varying quantities at the glomerular level [13].
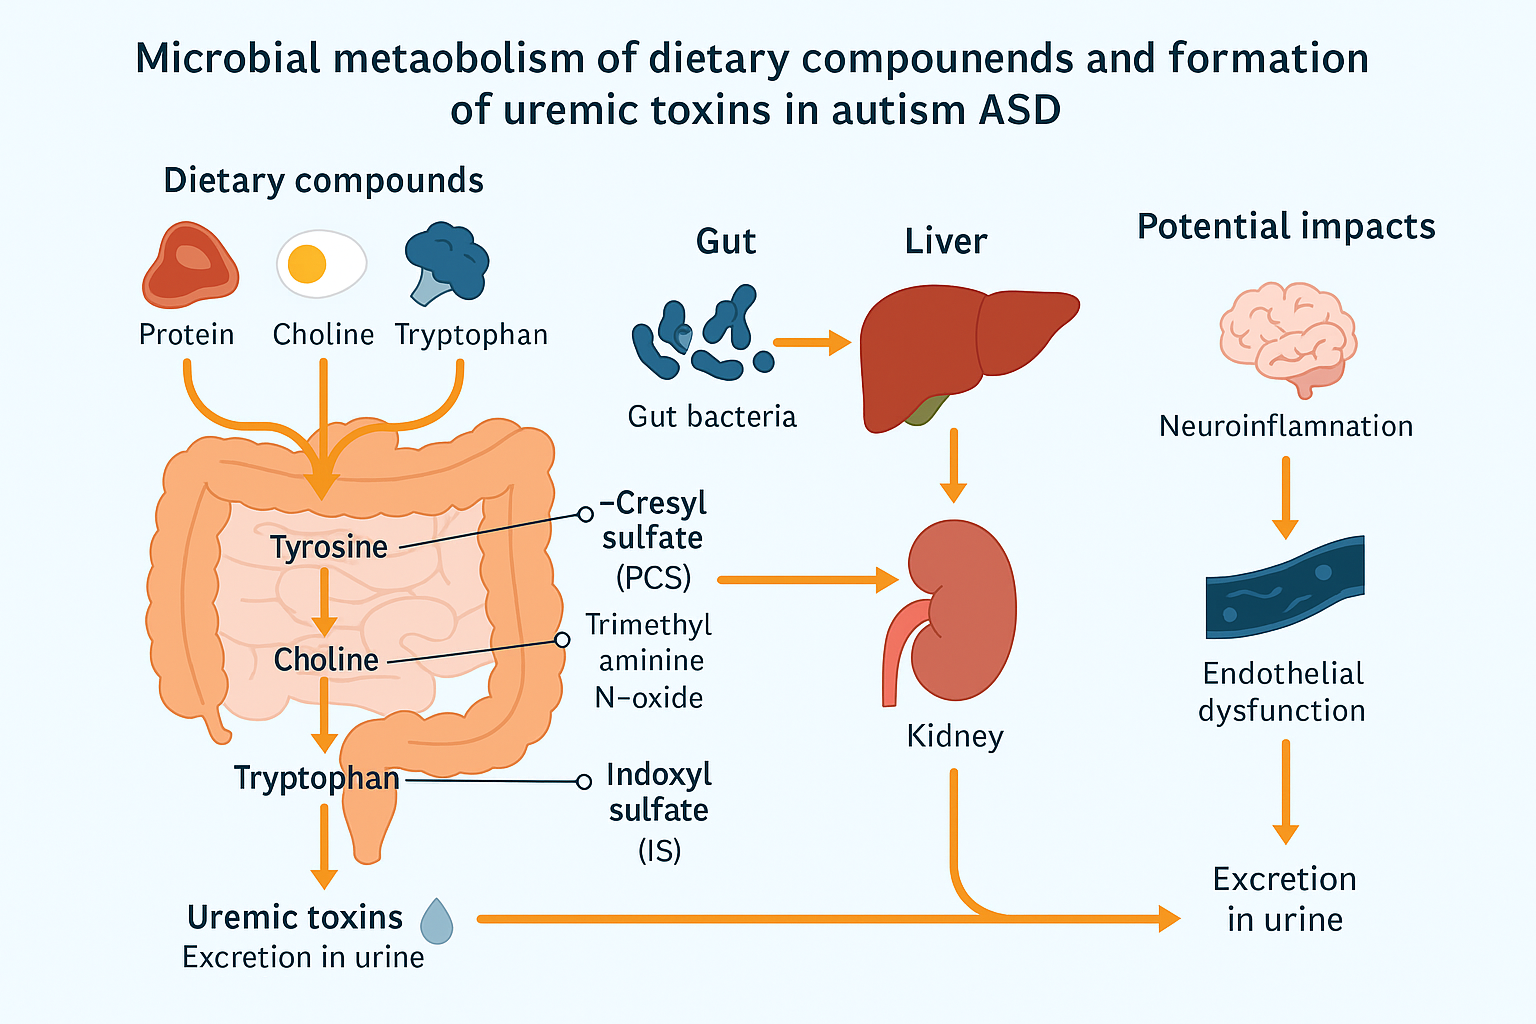
The production of uremic toxins from dietary substrates, especially amino acids like tryptophan, tyrosine, and choline, is largely dependent on the gut bacteria. Particularly IS, PCS, and TMAO, these microbial metabolites have the ability to build up in the bloodstream and affect host systems including the kidneys and brain. A schematic overview of the systemic and microbiological pathways associated with these metabolites is shown in Figure 1, emphasizing the possibility of imbalance in ASD. Using this methodology, we sought to evaluate children with ASD’s composite burden and relative functional correlations in addition to their specific toxin levels.
There is a strong link between uremic toxins and autism spectrum disorder (ASD), according to recent studies. Compared to healthy controls, children with ASD had higher urine levels of uremic toxins, especially p-cresyl sulphate and indoxyl sulphate [14,15]. Both core and comorbid symptoms of ASD may be enhanced by these toxins, which are produced by bacterial metabolism [15]. Metabolomic investigations have shown that children with ASD have altered gut microbiota, elevated oxidative stress, and aberrant amino acid metabolism [16,17].
Asymmetric dimethylarginine (ADMA), symmetric dimethylarginine (SDMA), trimethylamine N-oxide (TMAO), indoxyl sulphate (IS), and p-Cresol sulphate (PCS) are all regarded as uremic toxins that may contribute to autism spectrum disorder (ASD).
ADMA and SDMA were identified by Tain & Hsu (2017) as harmful amino acids derivatives that prevent the synthesis of nitric oxide and predict cardiovascular events in a number of illnesses [18]. In addition, Kielstein et al. described SDMA as a marker of renal function and a possible cause of inflammation and atherosclerosis, while ADMA is a strong nitric oxide synthase inhibitor and cardiovascular risk predictor [19].
In Table 1 are summarized the key informations about ADMA, SDMA, TMAO, IS (indoxyl sulfate), and PCS (p-cresol sulfate) as uremic toxins and their potential implications in autism spectrum disorder (ASD)
Although particular uremic toxins like p-cresyl sulfate (PCS) and indoxyl sulfate (IS) have been found to be elevated in ASD in the past [14,20,21,22,23]. Results are conflicting frequently because of differences in age, sex, and symptom severity. Furthermore, analyzing these toxins separately could mask underlying changes in metabolism.
By comparing the levels of five representative uremic toxins (ADMA, SDMA, TMAO, IS, and PCS) in children with ASD and healthy controls, as well as by determining their total cumulative burden, relative contribution (%), and functional ratios (e.g., IS/PCS, PCS/TMAO, IS/ADMA), we build on earlier discoveries. These derived metrics might be more sensitive in identifying metabolic and microbiota-related variations associated with age, sex, and the severity of ASD.
The present study was undertaken to investigate potential factors contributing to elevated urinary uremic toxins levels in ASD. We thus measured total urinary uremic toxins in a newly-recruited sample of 161 Slovene ASD children compared to control group of 71 healthy children. We compared these results by age, sex, and ASD severity. In the next step we formed age and sex matched groups and present the same data on the smaller group also. Determining if a composite assessment of uremic toxins, combining total burden and functional ratios, indicates more consistent metabolic changes in children with ASD was the second goal of the current investigation. Additionally, we wanted to see if these trends varied by age, sex, and the degree of ASD symptoms as determined by the Childhood Autism Rating Scale (CARS).
2. Results
2.1. Uremic Toxin Concentrations in the Whole Cohort
A total of 161 children with ASD and 71 healthy controls were included. Median values of urinary uremic toxins (normalized to creatinine) are summarized in Table 2. Overall, PCS showed a trend toward higher values in ASD (median 44.11 vs. 37.74 µmol/mmol creatinine), although not statistically significant. IS levels were slightly lower in ASD than controls (median 57.60 vs. 63.80 µmol/mmol), while TMAO showed lower concentrations in ASD as well.
Among endogenous methylated arginines, ADMA showed a non-significant elevation in ASD (14.72 vs. 12.70 µmol/mmol; p = 0.19), while SDMA remained comparable between groups (30.16 vs. 32.06 µmol/mmol).
2.2. Age-Stratified Findings
In the younger subgroup (2–5.9 years) (Table 3), TMAO levels were markedly lower in ASD children compared to controls (median 2.48 vs. 4.36 µmol/mmol; p = 0.06), pointing toward potential altered choline metabolism or dietary differences in younger ASD children. In contrast, differences were milder in the 6–17 age group (Table 4).
2.3. Sex-Based Differences
Sex-stratified analysis revealed notable differences in PCS levels, which were higher in girls with ASD than in boys (median 46.65 vs. 40.75 µmol/mmol) (Table 5). IS levels also tended to be higher in girls. These patterns suggest sex-specific differences in microbiota composition or toxin clearance mechanisms.
2.4. ASD Severity and Toxin Levels
Stratification by Childhood Autism Rating Scale (CARS) scores revealed a trend toward higher PCS in children with more severe ASD (CARS >36.5), with medians rising from 49.66 (mild/moderate) to 53.37 µmol/mmol (severe). IS levels decreased slightly with increasing severity, suggesting a shift in microbial metabolism patterns (Table S4). The proportion of children upon CARS score, sex and age is shown in Table 3.
2.5. Total Uremic Toxin Burden, Proportions, and Functional Ratios
To better reflect the overall systemic load and metabolic patterns of uremic toxins in ASD, we calculated the total median burden (sum of five urinary toxin medians), the percentage contribution of each metabolite to this total, and several functional ratios across groups.
Compared to controls, children with ASD had a slightly higher total uremic toxin load (151.95 vs. 148.65 µmol/mmol creatinine); the highest values were found in children with milder CARS scores (<36; 158.07 µmol/mmol) and younger ASD children (2–5.9 years; 155.11 µmol/mmol). These tendencies imply higher systemic exposure in situations of early or less severe ASD, despite little absolute differences (Table 4).
The overall burden’s content differed greatly between groups. The largest contributor in healthy controls was IS (42.9%), with PCS (25.4%) coming in second. On the other hand, PCS became co-dominant, contributing 35.1% of the burden, whereas IS decreased to 34.6% in children with more severe ASD (CARS >36.5). Consistent levels of ADMA and SDMA (Table 5) and a steady or decreased contribution of TMAO (1.7–2.1%) accompanied this change. According to these results, the severity of ASD is associated with a progressive microbial metabolic shift toward phenolic metabolism.
The compositional shift in uremic toxin burden was further visualized in Figure 2, which illustrates the percentage contribution of each metabolite to the total urinary burden across subgroups. As ASD severity increased, the relative dominance of IS diminished while PCS became increasingly prominent. While the absolute concentration changes were modest, the compositional burden profile provided clearer differentiation between groups. These findings support the utility of proportional and ratio-based analyses for revealing microbial-metabolic dysregulation in ASD.
To further describe metabolic interactions, functional ratios were extracted from important toxin pairings. A relative change from indolic to phenolic toxin dominance was shown by the IS/PCS ratio, which decreased from 1.69 in controls to 1.22 in mild/moderate ASD and 0.99 in severe ASD. In a similar vein, the PCS/TMAO ratio increased from 12.2 in controls to over 20 in children who were more severely affected, indicating either greater proteolytic fermentation or decreased methylamine metabolism. Additionally, the IS/ADMA ratio decreased from 5.02 to 3.55 as the severity of ASD increased, indicating a potential interaction between systemic vascular toxins and gut-derived toxins (Table 6).
The results of Table 6 are further illustrated in Figure 3, where derived functional ratios are plotted across control and ASD severity subgroups. A consistent decline in the IS/PCS ratio with increasing ASD severity suggests a progressive shift from indolic to phenolic microbial metabolism. Similarly, PCS/TMAO ratios were elevated in both mild and severe ASD, potentially reflecting increased proteolytic fermentation or decreased choline-derived methylamine conversion. The IS/ADMA ratio also declined across ASD subgroups, suggesting systemic metabolic interactions involving endothelial function and nitric oxide dysregulation. These findings support the use of composite ratios as sensitive biomarkers of metabolic shifts in ASD.
In line with previous results of higher PCS levels in females, sex-specific analysis (Table 7) showed a slightly higher total burden and PCS fraction in girls with ASD. Although girls displayed greater variability, the IS/PCS and PCS/TMAO ratios were similar for boys and girls. The constancy of the microbial-metabolic shift over development was further supported by age-stratified analysis (Table 8), which revealed that both younger and older ASD subgroups exhibited lower IS/PCS ratios and higher PCS/TMAO ratios when compared to age-matched controls. When combined, these compositional and ratio-based results imply that functional assessment of uremic toxins offers a more complex picture of metabolic imbalance associated with ASD than concentration comparisons alone.
3. Discussion
We present fresh data that urine uremic toxin profiles in children with autism spectrum disorder (ASD) show minor but biologically significant changes, including changes in the overall burden, quantities, and ratios of endogenous and gut-derived metabolites. Although there were only slight absolute differences in individual toxins between the ASD and control groups, careful stratification by sex, age, and severity of autism showed clear trends, especially a rising percentage of p-cresyl sulfate (PCS) and falling indoxyl sulfate (IS)/PCS ratios in children with more severe autism.
Toxins Derived from the Microbiota and Dysbiosis Associated with ASD
Bacterial breakdown of dietary tryptophan and tyrosine produces the microbiota-derived uremic toxins IS and PCS, respectively [24]. The intestinal epithelium absorbs these substances, the liver metabolizes them, and renal tubular secretion removes them-[25]. Clostridium, Bacteroides, and other proteolytic bacteria have been found to be more abundant in the gut microbiota of people with ASD, in line with earlier research [26,27]. Given that these microorganisms are known to promote the synthesis of phenolic and indolic metabolites, there may be a mechanism behind the observed rise in PCS burden.
The idea of microbial metabolic changes in ASD is supported by the increasing rise in PCS contribution from 25.4% in controls to 35.1% in children with more severe ASD (CARS >36.5), as well as a declining IS/PCS ratio. These changes might favor routes for tyrosine metabolism (which produces PCS) over those for tryptophan metabolism (which yields IS). This could be because of changes in intestinal transit time, microbial enzyme expression, or substrate availability [28].
Systemic Inflammation and Methylarginines
Endogenous methylated arginine derivatives, such as ADMA and SDMA, have been associated with immunological dysregulation, oxidative stress, and endothelial dysfunction [29]. They also block nitric oxide synthase. Their constant presence in uremic toxin profiles in ASD shows low-grade systemic involvement, which may contribute to altered vascular or neuroimmune function, even if group differences in these metabolites were not statistically significant. Even within normal bounds, a lower SDMA/ADMA ratio in children with ASD, particularly males, may indicate a disturbance in arginine metabolism or slight variations in renal function.
Total Burden and Shifting Proportions: Toward a Toxin Signature
Children with ASD had a somewhat higher overall burden than controls when the sum of their median toxin concentrations was considered (151.95 vs. 148.65 µmol/mmol creatinine). But the changes in proportional contribution were more noticeable. IS was the largest contributor in controls (42.9%), but in ASD subgroups, especially those with higher CARS scores, its relative proportion dropped. PCS became the co-dominant toxin at the same time. Although there aren’t many significant variations in absolute concentration, these compositional changes point to a qualitative change in toxin profiles that might more accurately represent the metabolism unique to ASD than absolute numbers alone.
Interestingly, the PCS/TMAO ratio rose significantly with severity, from 12.2 in controls to over 20 in the children who were severely afflicted. Another microbiota-derived toxin, TMAO, which is generated from dietary carnitine and choline, either stayed mostly unchanged or slightly declined. These trends could be the result of changes in liver FMO activity, which changes trimethylamine (TMA) to TMAO, microbial shifts away from TMA producers, or changing dietary behaviors in ASD (such as decreased choline consumption or food selectivity) [30].
Effects Dependent on Age and Sex
Despite having fewer females in the cohort overall, sex-stratified analysis revealed that girls with ASD exhibited greater levels of PCS and IS than boys. This is consistent with earlier studies demonstrating sex-specific variations in detoxification pathways, immunological response, and gut microbiota composition [31]. Estrogens are known to interact with microbial profiles and may alter the activity of the sulfotransferase enzyme, which could affect the clearance of toxins. Age-related variations were particularly noteworthy: younger children with ASD (2–5.9 years) had considerably lower TMAO than controls, a tendency that was not seen in older children. Age-related differences in food composition, hepatic FMO activity, and gut microbiota maturation may be the cause of this [32].
Clinical Consequences
The patterns of the uremic toxins, particularly the ratios and proportions, may be useful in classifying ASD subtypes or tracking the effectiveness of treatment, even though none of them alone are reliable biomarkers for ASD. Indirect indications of changes in gut microbiota or therapeutic response to nutritional, probiotic, or microbiota-targeted therapies could include variations in the IS/PCS or PCS/TMAO ratios.
Furthermore, the presence of uremic toxins such as IS and ADMA, which are both associated with oxidative stress and endothelial dysfunction, suggests that some ASD phenotypes may be influenced by neurovascular mechanisms [33].
4. Materials and Methods
Participants
Urine samples were collected from children diagnosed with ASD (n = 161; 124 boys,37 girls) and healthy controls (n = 71; 37 boys, 34 girls). The group consisted of children from 2 years to 17 years. In the first step, we formed a group of children aged between 2 and 5.9 years in which we had 35 children with ASD and 14 healthy children (group code = A), and the remainder was a group of children aged between 6 and 17 years in which we had 126 children with ASD and 57 healthy children (group code = B). The data on the proportions by sex and age are given in Table 9.
Methods
Uremic toxins measured included IS, pCS, TMAO, ADMA, and SDMA using validated LC-MS/MS techniques. Concentrations were normalized to urinary creatinine. The CARS score categorized ASD severity. Stool form was assessed using the Bristol Stool Chart (BSC). Data were statistically analyzed using appropriate non-parametric tests with significance set at p<0.05.Quantification of TMAO, ADMA, and SDMA: MRM transitions along with the corresponding declustering potential (DP) and collision energy (CE) values were as follows: for ADMA, the transition m/z 203 → 46 was used (DP: 61 V, CE: 41 V); for SDMA, m/z 203 → 172 (DP: 61 V, CE: 19 V); for ADMA-d6, m/z 209 → 77 (DP: 66 V, CE: 45 V); for TMAO, m/z 76 → 42 (DP: 66 V, CE: 53 V); and for TMAO-d9, m/z 85 → 46 (DP: 61 V, CE: 59 V). Chromatographic separation was carried out using a SeQuant® ZIC®-HILIC column (50 × 2.1 mm, 5 μm particle size; Merck, Darmstadt, Germany), maintained at 25 °C, with a mobile phase flow rate of 0.5 mL/min. The mobile phases consisted of 20 mM ammonium acetate (eluent A) and acetonitrile containing 0.2% formic acid (eluent B). The gradient elution profile (%B) was as follows: 0 min – 95%, 1 min – 95%, 7 min – 50%, and 8 min – 50%. A 5 μL volume of sample was injected. Urine samples (0.1 mL) were prepared by mixing with internal standards (0.1 mL of 6 μg/mL ADMA-d6 and TMAO-d9) and acetonitrile (0.6 mL), followed by vortexing for 3 minutes and centrifugation at 10,000 g for 5 minutes before LC analysis.
Quantification of PCS and IS: MRM transitions were as follows: for PCS, m/z 186.9 → 106.9, and for PCS-d7, m/z 194.0 → 114.0; for IS, m/z 211.9 → 79.8, and for IS-d4, m/z 216.0 → 79.9. Instrument settings including DP, CE, EP, and CXP were: for IS and IS-d4: −60, −38, −10, −5 V and −65, −46, −10, −1 V, respectively; for PCS and PCS-d7: −65, −28, −10, −7 V and −60, −30, −10, −7 V, respectively. Separation was performed using a Kinetex C18 column (100 × 4.6 mm, 2.6 μm; Phenomenex, Torrance, CA, USA), held at 40 °C with a flow rate of 0.5 mL/min. The mobile phases included water with 0.1% formic acid (A) and methanol with 0.1% formic acid (B). The gradient program was: 0 min – 10% B, 0.5 min – 10% B, 4.5 min – 95% B, 8.5 min – 95% B. Injection volume was 10 μL. Prior to LC injection, urine (0.01 mL) was mixed with 0.05 mL of internal standards (2 μg/mL PCS-d7 and IS-d4) and 0.6 mL of methanol, vortexed for 3 minutes, and centrifuged for 5 minutes at 10,000 g and subsequently diluted sixfold with water.
Statistics
R version 4.3.1 in conjunction with RStudio version 2023.12.0 was used for statistical analysis., using the tidy verse suite [34] for visualisation and arsenal package [35] to compare groups.
The Shapiro-Wilk tests from stats package [36,37] was used to evaluate the distribution of data. Results showed that all datasets had non-normal distributions and so non-parametric tests Wilcoxon signed-rank test was employed for comparisons. The Benjamini-Hochberg procedure was used to control false discovery rate, with alpha significance level of 0.05
5. Conclusions
Our research sheds new light on the profile of urinary uremic toxins in children with autism spectrum disorder (ASD), revealing modest but physiologically significant changes in the ratios and makeup of metabolites produced by the host and those obtained from the gastrointestinal system. Although there was not a significant difference in the absolute concentrations of individual toxins such as trimethylamine N-oxide (TMAO), p-cresyl sulfate (PCS), indoxyl sulfate (IS), asymmetric dimethylarginine (ADMA), and symmetric dimethylarginine (SDMA) between children with ASD and control children, compositional patterns and functional ratios showed more distinct trends.
In particular, PCS’s percentage contribution rose as the severity of ASD grew, but IS’s decreased. The IS/PCS ratio gradually decreased as a result, indicating a functional change in gut microbial metabolism toward phenolic rather than indolic pathways. Indicating changed protein fermentation and/or decreased choline-derived detoxification, the PCS/TMAO ratio, which combines microbial and hepatic processing, also rose with severity.
Higher PCS and IS levels in girls and lower TMAO levels in younger ASD children were among the sex- and age-specific effects that were noted. These findings were indicative of the underlying impacts of nutrition, microbiota maturation, hormonal regulation, and hepatic development.
Despite the lack of significant group differences, the consistent presence of methylated arginines (ADMA and SDMA) and the trend toward higher levels of ADMA in girls with ASD may suggest low-grade systemic or vascular involvement, which is consistent with the idea that nitric oxide dysregulation plays a role in the pathophysiology of ASD.
Our results give support to the idea that ASD heterogeneity is influenced by a gut-microbiota-metabolite-host axis. The capacity of metabolite ratios and toxin proportions to capture underlying metabolic and microbial functions may be what makes them valuable instead of raw concentrations. As a result, they might be used as exploratory biomarkers for subtypes of ASD, offer insight into the interplay between microbiota and host, and guide focused treatments meant to alter systemic metabolism or gut function.
Supplementary Materials
The following supporting information can be downloaded at: Preprints.org, Table S1-Table S4
Author Contributions
Conceptualization, O.J.; methodology, O.J. and G.J.; software, G.U..; validation, O.J., K.K., J.V.M., A.G., and F.T.; formal analysis, G.J., B.K.B. and F.T.; investigation, O.J.; resources, O.J.; data curation, K.K.; writing—original draft preparation, O.J.; writing—review and editing, O.J., and K.K.; visualization, K.K.; supervision, O.J.; project administration, O.J.; funding acquisition, O.J. All authors have read and agreed to the published version of the manuscript.
Funding
This research was funded by the scientific-research program grants P3-0124 and project J3-1756, financed by the Slovenian Research Agency.
Institutional Review Board Statement
The study was conducted in accordance with the Declaration of Helsinki, and approved by the National Medical Ethics Committee (0120-201/2016-2 KME 78/03/16).
Informed Consent Statement
Informed consent was obtained from all subjects involved in the study.
Data Availability Statement
The data that support the findings of this study are available from the study’s principal investigator, O.J., upon reasonable request.
Acknowledgments
The authors would like to thank all parents and guardians who allowed their children to participate in the study, and especially Ms Vera Troha for her careful processing of the samples.
Conflicts of Interest
The authors declare no conflicts of interest.
References
- American Psychiatric Association. Diagnostic and Statistical Manual of Mental Disorders. Diagnostic Stat. Man. Ment. Disord. 2013. [CrossRef]
- Lord, C.; Elsabbagh, M.; Baird, G.; Veenstra-Vanderweele, J. Autism Spectrum Disorder. Lancet, 2018, 392, 508–520. [Google Scholar] [CrossRef]
- Fombonne, E.; MacFarlane, H.; Salem, A. C. Epidemiological Surveys of ASD: Advances and Remaining Challenges. J. Autism Dev. Disord., 2021, 51, 4271–4290. [Google Scholar] [CrossRef]
- Bourson, L.; Prevost, C. Characteristics of Restricted Interests in Girls with ASD Compared to Boys: A Systematic Review of the Literature. Eur. Child Adolesc. Psychiatry, 2024, 33, 987–1004. [Google Scholar] [CrossRef] [PubMed]
- Lai, M. C.; Lombardo, M. V.; Baron-Cohen, S. Autism. Lancet, 2014, 383, 896–910. [Google Scholar] [CrossRef]
- Chaste, P.; Leboyer, M. Autism Risk Factors: Genes, Environment, and Gene-Environment Interactions. Dialogues Clin. Neurosci., 2012, 14, 281–292. [Google Scholar] [CrossRef] [PubMed]
- Persico, A. M.; Merelli, S. Environmental Factors in the Onset of Autism Spectrum Disorder. Curr. Dev. Disord. Reports, 2014, 1, 8–19. [Google Scholar] [CrossRef]
- Ou, J.; Liu, R.; Shen, Y.; Xia, K.; Zhao, J. An Overview of Genetic and Environmental Risk of Autism Spectrum Disorder. Glob. Clin. Transl. Res. 2019, 37–44. [Google Scholar] [CrossRef]
- Vuong, H. E.; Hsiao, E. Y. Emerging Roles for the Gut Microbiome in Autism Spectrum Disorder. Biol. Psychiatry, 2017, 81, 411–423. [Google Scholar] [CrossRef]
- Mazurek, M. O.; Vasa, R. A.; Kalb, L. G.; Kanne, S. M.; Rosenberg, D.; Keefer, A.; Murray, D. S.; Freedman, B.; Lowery, L. A. Anxiety, Sensory over-Responsivity, and Gastrointestinal Problems in Children with Autism Spectrum Disorders. J. Abnorm. Child Psychol., 2013, 41, 165–176. [Google Scholar] [CrossRef]
- Nikolov, R. N.; Bearss, K. E.; Lettinga, J.; Erickson, C.; Rodowski, M.; Aman, M. G.; McCracken, J. T.; McDougle, C. J.; Tierney, E.; Vitiello, B.; et al. Gastrointestinal Symptoms in a Sample of Children with Pervasive Developmental Disorders. J. Autism Dev. Disord., 2009, 39, 405–413. [Google Scholar] [CrossRef] [PubMed]
- Gorrindo, P.; Williams, K. C.; Lee, E. B.; Walker, L. S.; McGrew, S. G.; Levitt, P. Gastrointestinal Dysfunction in Autism: Parental Report, Clinical Evaluation, and Associated Factors. Autism Res., 2012, 5, 101–108. [Google Scholar] [CrossRef] [PubMed]
- Halm, B. M.; Franke, A. A.; Ashburn, L. A.; Hebshi, S. M.; Wilkens, L. R. Oral Antibiotics Decrease Urinary Isoflavonoid Excretion in Children after Soy Consumption. Nutr. Cancer, 2008, 60, 14–22. [Google Scholar] [CrossRef] [PubMed]
- Osredkar, J.; Baškovič, B. Ž.; Finderle, P.; Bobrowska-Korczak, B.; Gątarek, P.; Rosiak, A.; Giebułtowicz, J.; Vrhovšek, M. J.; Kałużna-Czaplińska, J. Relationship between Excreted Uremic Toxins and Degree of Disorder of Children with ASD. Int. J. Mol. Sci., 2023, 24. [Google Scholar] [CrossRef]
- Hill, Z. R.; Flynn, C. K.; Adams, J. B. Indoxyl Sulfate and Autism Spectrum Disorder: A Literature Review. Int. J. Mol. Sci. 2024, Vol. 25, Page 12973, 2024, 25, 12973. [Google Scholar] [CrossRef]
- Ming, X.; Stein, T. P.; Barnes, V.; Rhodes, N.; Guo, L. Metabolic Perturbance in Autism Spectrum Disorders: A Metabolomics Study. J. Proteome Res., 2012, 11, 5856–5862. [Google Scholar] [CrossRef]
- Rossignol, D. A.; Frye, R. E. Evidence Linking Oxidative Stress, Mitochondrial Dysfunction, and Inflammation in the Brain of Individuals with Autism. Front. Physiol. 2014, 5 APR. [Google Scholar] [CrossRef]
- Tain, Y. L.; Hsu, C. N. Toxic Dimethylarginines: Asymmetric Dimethylarginine (ADMA) and Symmetric Dimethylarginine (SDMA). Toxins (Basel)., 2017, 9, 92. [Google Scholar] [CrossRef]
- Kielstein, J. T.; Fliser, D.; Veldink, H. Asymmetric Dimethylarginine and Symmetric Dimethylarginine: Axis of Evil or Useful Alliance? Semin. Dial., 2009, 22, 346–350. [Google Scholar] [CrossRef]
- Gabriele, S.; Sacco, R.; Cerullo, S.; Neri, C.; Urbani, A.; Tripi, G.; Malvy, J.; Barthelemy, C.; Bonnet-Brihault, F.; Persico, A. M. Urinary P-Cresol Is Elevated in Young French Children with Autism Spectrum Disorder: A Replication Study. Biomarkers, 2014, 19, 463–470. [Google Scholar] [CrossRef]
- Li, C.; Shen, K.; Ning, Y.; Wang, S.; Song, Y.; Liu, P.; Han, Q.; Wei, L.; Kang, X. Improved Sample Preparation Using Packed-Fiber Solid Phase Extraction in the Determination of Urinary P-Cresol. Nanosci. Nanotechnol. Lett., 2018, 10, 1469–1475. [Google Scholar] [CrossRef]
- Chen, Q.; Qiao, Y.; Xu, X. J.; Tao, Y.; You, X. Urine Organic Acids as Potential Biomarkers for Autism-Spectrum Disorder in Chinese Children. Front. Cell. Neurosci., 2019, 13. [Google Scholar] [CrossRef]
- Daneberga, Z.; Nakazawa-Miklasevica, M.; Berga-Svitina, E.; Murmane, D.; Isarova, D.; Cupane, L.; Masinska, M.; Nartisa, I.; Lazdane, A.; Miklasevics, E. Urinary Organic Acids Spectra in Children with Altered Gut Microbiota Composition and Autistic Spectrum Disorder. Nord. J. Psychiatry, 2022, 76, 523–529. [Google Scholar] [CrossRef] [PubMed]
- Evenepoel, P.; Meijers, B. K. I.; Bammens, B. R. M.; Verbeke, K. Uremic Toxins Originating from Colonic Microbial Metabolism. Kidney Int., 2009, 76 (SUPPL. 114). [Google Scholar] [CrossRef]
- Meyer, T. W.; Hostetter, T. H. Uremia. N. Engl. J. Med., 2007, 357, 1316–1325. [Google Scholar] [CrossRef]
- Finegold, S. M.; Dowd, S. E.; Gontcharova, V.; Liu, C.; Henley, K. E.; Wolcott, R. D.; Youn, E.; Summanen, P. H.; Granpeesheh, D.; Dixon, D.; et al. Pyrosequencing Study of Fecal Microflora of Autistic and Control Children. Anaerobe, 2010, 16, 444–453. [Google Scholar] [CrossRef]
- Luna, R. A.; Savidge, T. C.; Williams, K. C. The Brain-Gut-Microbiome Axis: What Role Does It Play in Autism Spectrum Disorder? Curr. Dev. Disord. reports, 2016, 3, 75. [Google Scholar] [CrossRef] [PubMed]
- De Preter, V.; Arijs, I.; Windey, K.; Vanhove, W.; Vermeire, S.; Schuit, F.; Rutgeerts, P.; Verbeke, K. Impaired Butyrate Oxidation in Ulcerative Colitis Is Due to Decreased Butyrate Uptake and a Defect in the Oxidation Pathway. Inflamm. Bowel Dis., 2012, 18, 1127–1136. [Google Scholar] [CrossRef]
- Sydow, K.; Münzel, T. ADMA and Oxidative Stress. Atheroscler. Suppl., 2003, 4, 41–51. [Google Scholar] [CrossRef]
- Wang, Z.; Tang, W. H. W.; Buffa, J. A.; Fu, X.; Britt, E. B.; Koeth, R. A.; Levison, B. S.; Fan, Y.; Wu, Y.; Hazen, S. L. Prognostic Value of Choline and Betaine Depends on Intestinal Microbiota-Generated Metabolite Trimethylamine-N-Oxide. Eur. Heart J., 2014, 35, 904–910. [Google Scholar] [CrossRef]
- Jašarević, E.; Howard, C. D.; Morrison, K.; Misic, A.; Weinkopff, T.; Scott, P.; Hunter, C.; Beiting, D.; Bale, T. L. The Maternal Vaginal Microbiome Partially Mediates the Effects of Prenatal Stress on Offspring Gut and Hypothalamus. Nat. Neurosci., 2018, 21, 1061–1071. [Google Scholar] [CrossRef] [PubMed]
- Stewart, C. J.; Ajami, N. J.; O’Brien, J. L.; Hutchinson, D. S.; Smith, D. P.; Wong, M. C.; Ross, M. C.; Lloyd, R. E.; Doddapaneni, H. V.; Metcalf, G. A.; et al. Temporal Development of the Gut Microbiome in Early Childhood from the TEDDY Study. Nature, 2018, 562, 583–588. [Google Scholar] [CrossRef] [PubMed]
- Lu, C. L.; Zheng, C. M.; Lu, K. C.; Liao, M. T.; Wu, K. L.; Ma, M. C. Indoxyl-Sulfate-Induced Redox Imbalance in Chronic Kidney Disease. Antioxidants, 2021, 10, 936. [Google Scholar] [CrossRef] [PubMed]
- Wickham, H.; Averick, M.; Bryan, J.; Chang, W.; McGowan, L.; François, R.; Grolemund, G.; Hayes, A.; Henry, L.; Hester, J.; et al. Welcome to the Tidyverse. J. Open Source Softw., 2019, 4, 1686. [Google Scholar] [CrossRef]
- Ethan, A.; Atkinson, E.; Dougherty, G.; Lennon, R.; Hanson, A.; Goergen, K.; Lundt, E.; Broderick, B.; Mccullough, M.; Heinzen, M. E. Package ‘ Arsenal ’ R Topics Documented : 2022, No. 1.
- Core, T. R. D. A Language and Environment for Statistical Computing; 2018; Vol. 2.
- R Core Team. R: The R Project for Statistical Computing https://www.r-project.org/ (accessed Jan 14, 2019).
Figure 1.
Microbial Origins and Systemic Impacts of Uremic Toxins in Autism Spectrum Disorder. Schematic overview illustrating the gut microbiota-mediated production of key uremic toxins—indoxyl sulfate (IS), p-cresyl sulfate (PCS), and trimethylamine N-oxide (TMAO)—from dietary amino acids (tryptophan, tyrosine, choline). These toxins enter systemic circulation and may contribute to oxidative stress, inflammation, and neurological disturbances through interactions with the kidney and brain. This functional pathway supports the rationale for studying toxin ratios and burden in ASD.
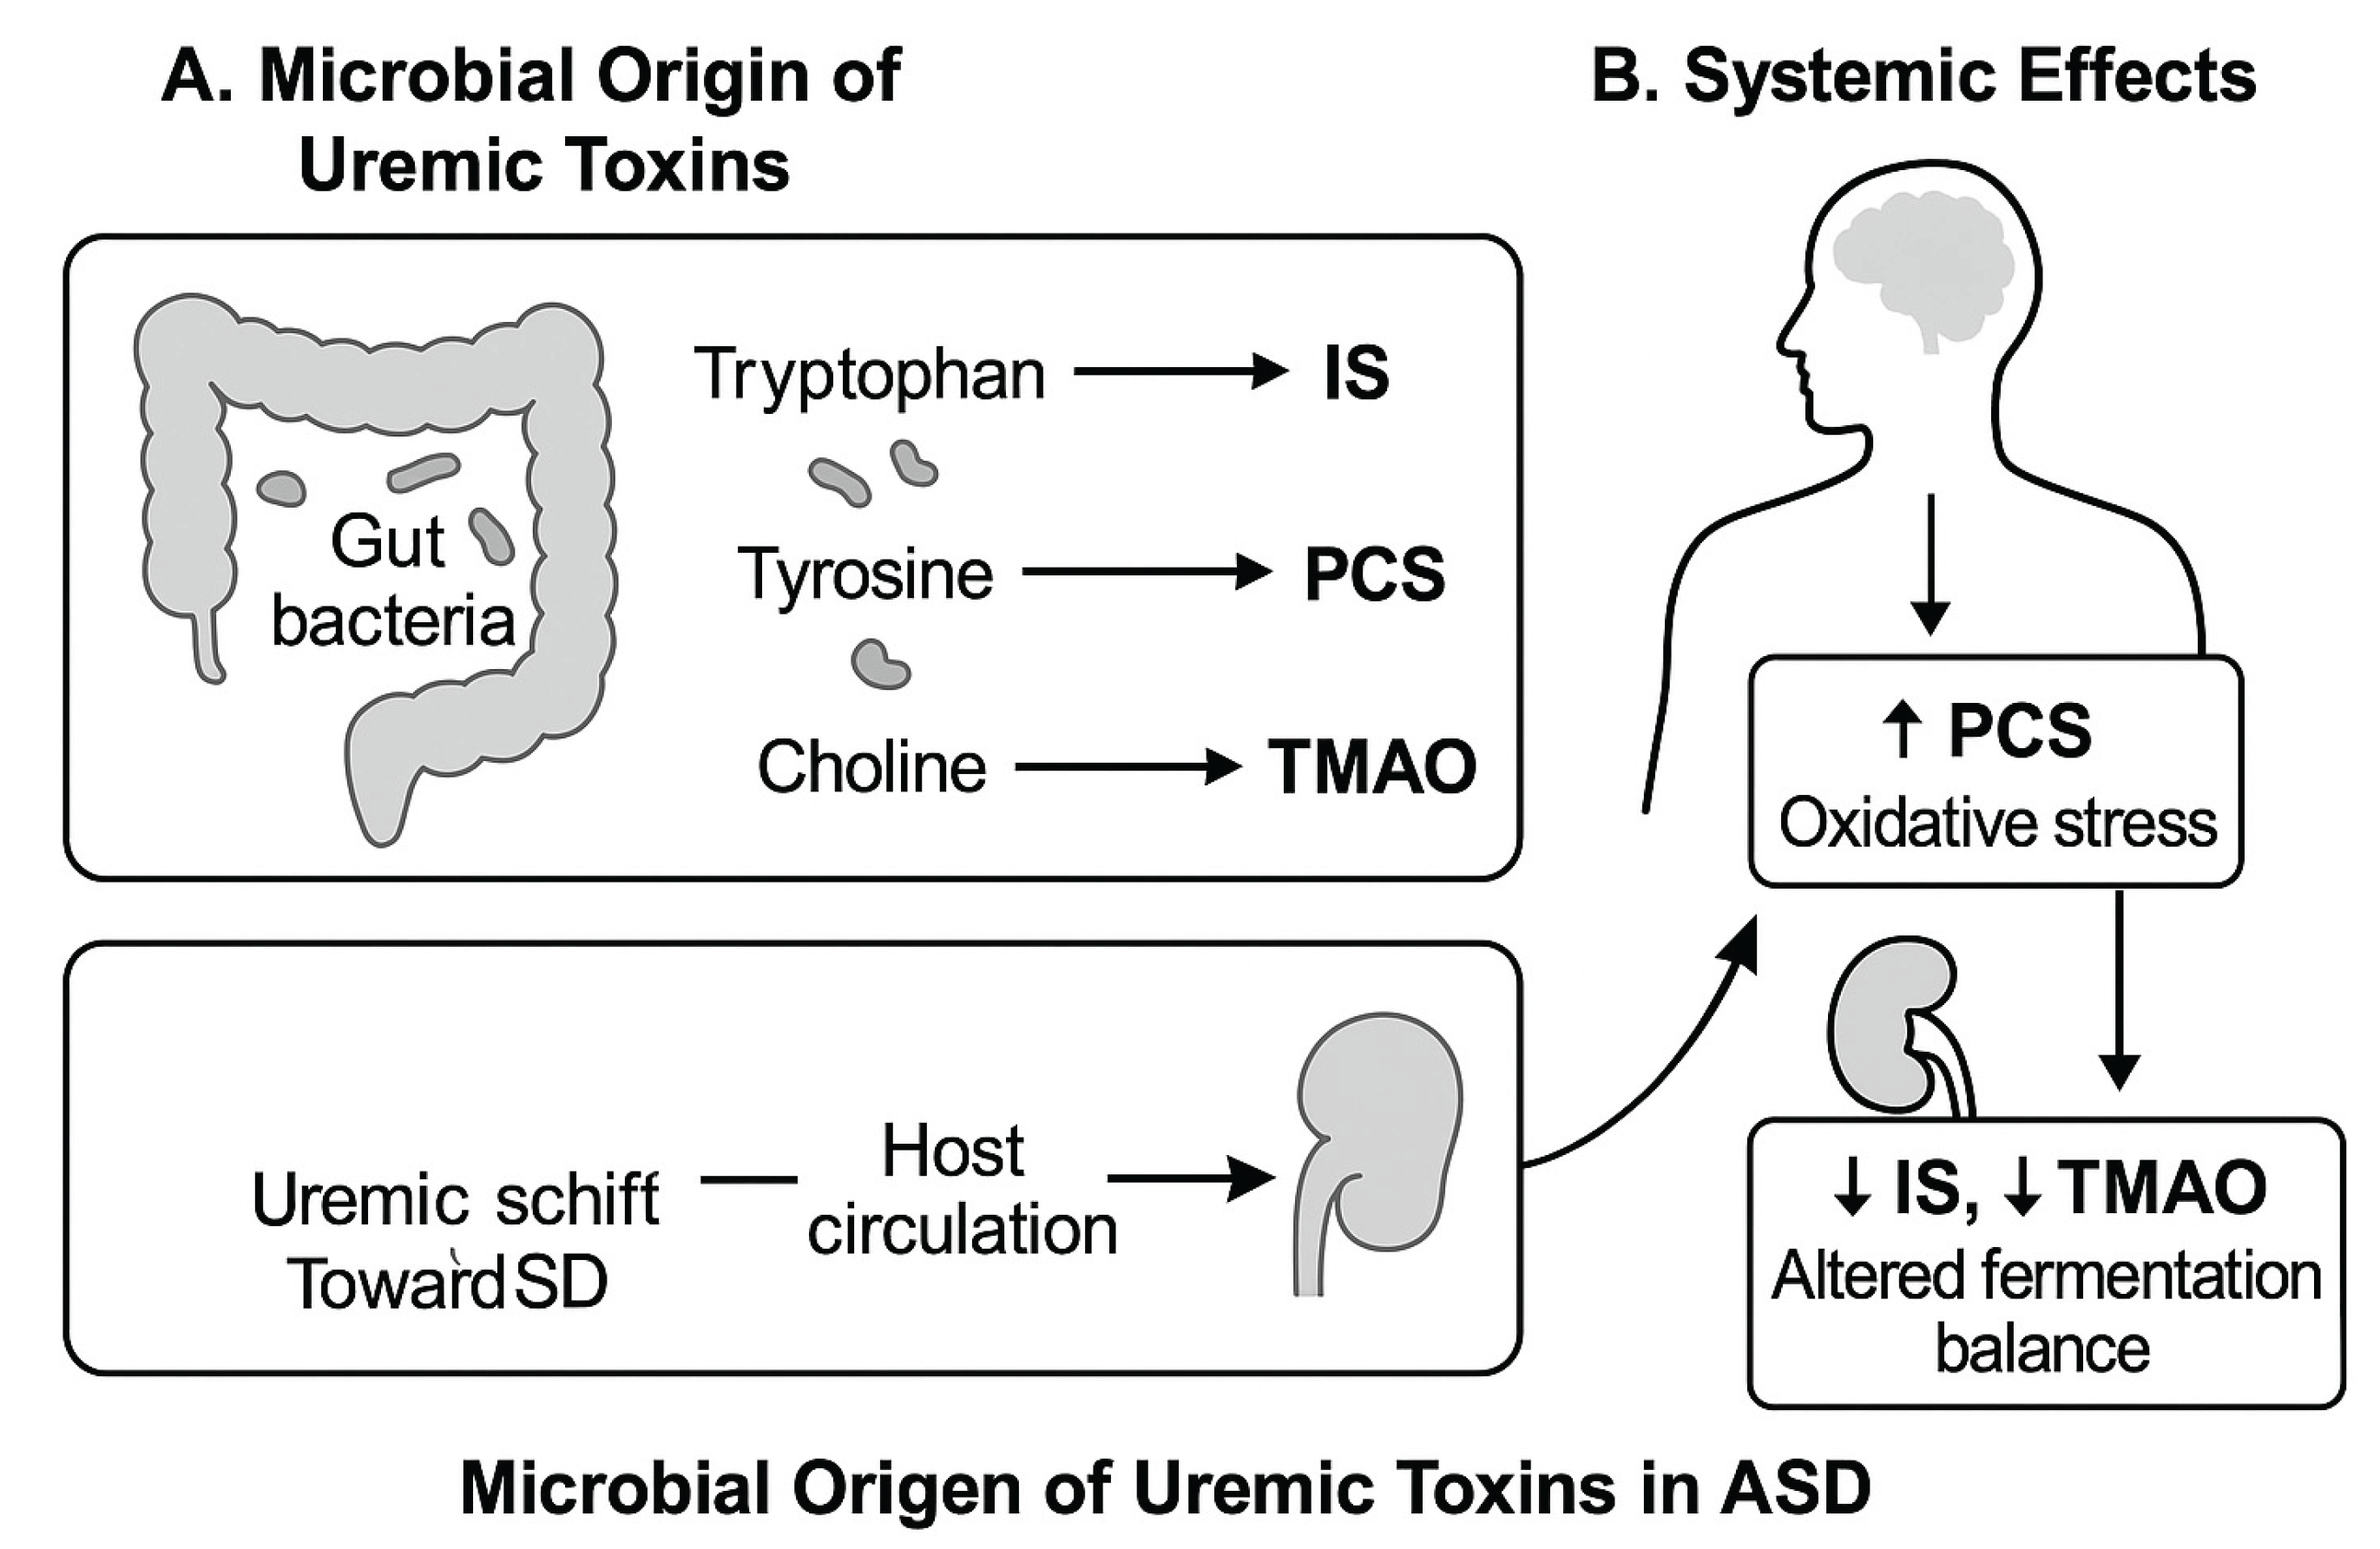
Figure 2.
Relative Contribution of Uremic Toxins to Total Burden by ASD Severity. Stacked bar graph showing the percentage contribution of five urinary uremic toxins—IS, PCS, TMAO, ADMA, and SDMA—to the total burden in controls and ASD subgroups stratified by severity (CARS <36 and CARS >36.5). With increasing ASD severity, the relative contribution of PCS increased, while IS declined, indicating a compositional shift toward phenolic toxin dominance. TMAO remained low across groups, and proportions of methylarginines were relatively stable.
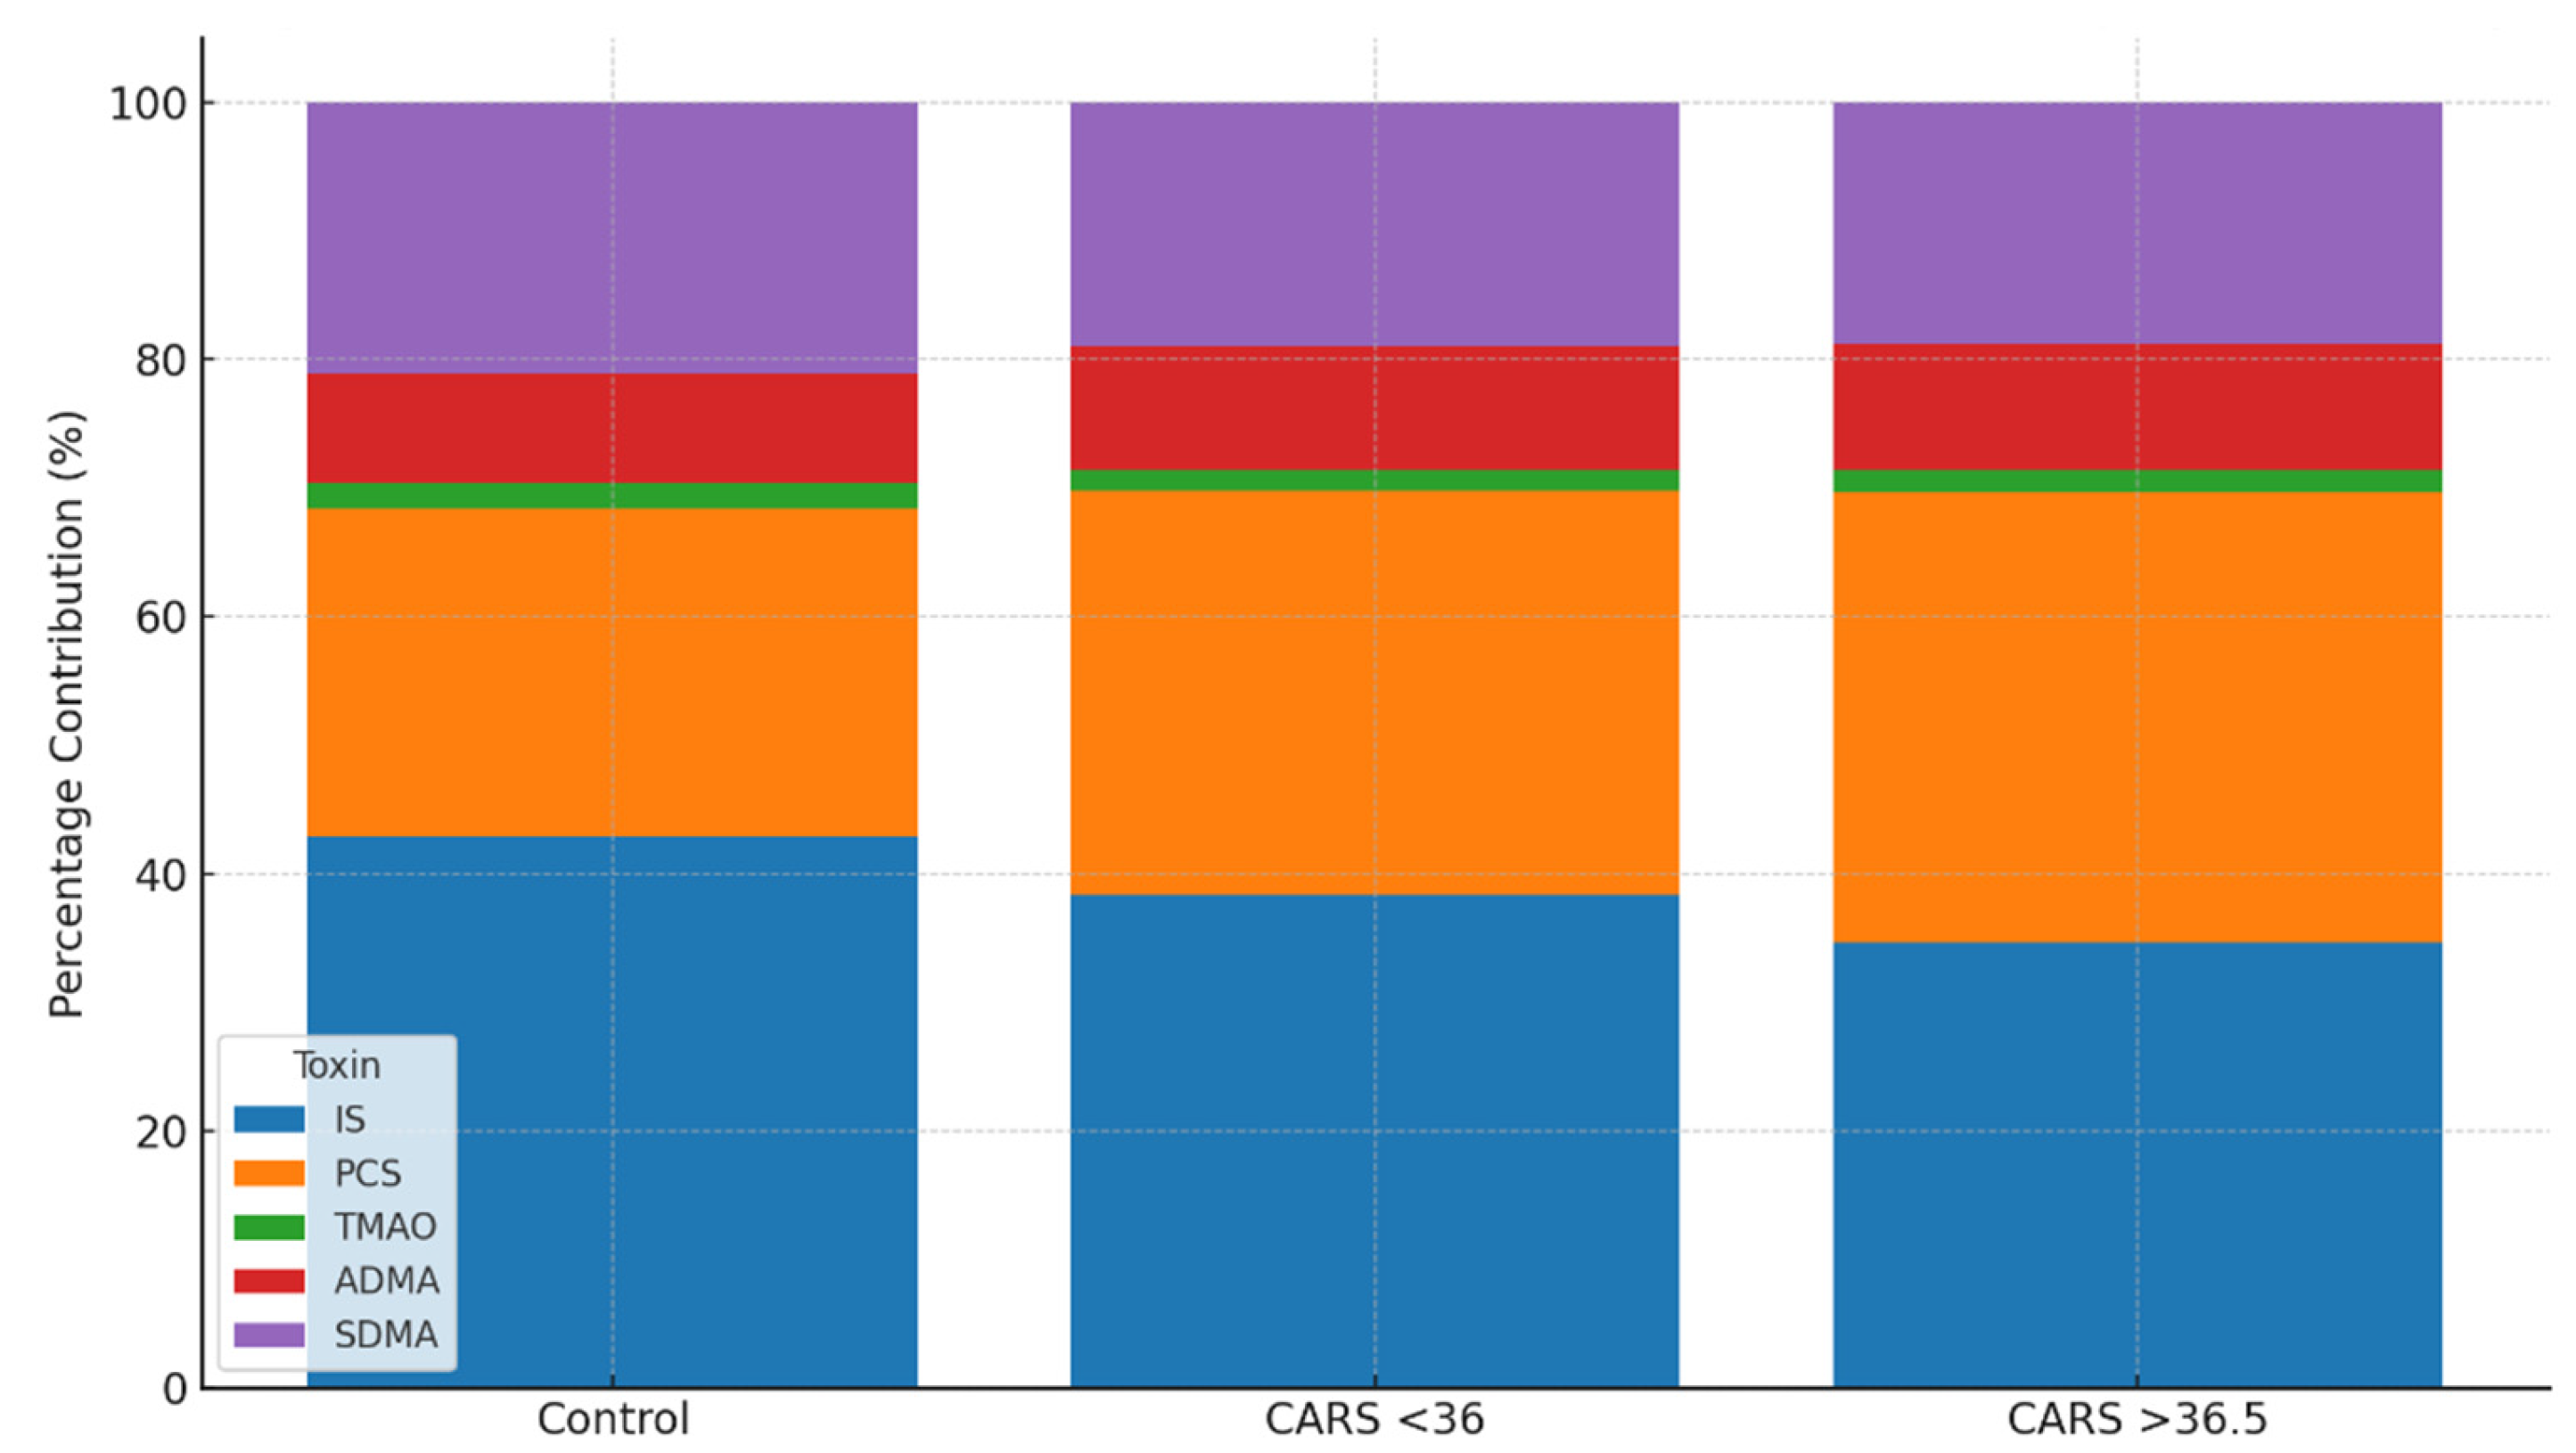
Figure 3.
Functional Uremic Toxin Ratios by ASD Severity. Bar chart showing three derived urinary toxin ratios—IS/PCS, PCS/TMAO, and IS/ADMA—in healthy controls, children with mild/moderate ASD (CARS <36), and those with more severe ASD (CARS >36.5). With increasing ASD severity, the IS/PCS and IS/ADMA ratios progressively declined, while the PCS/TMAO ratio increased, indicating a phenolic-dominant microbial shift and reduced methylamine metabolism. These ratio-based changes provide deeper insight into functional metabolic imbalance than absolute toxin concentrations alone (see also Table 6).
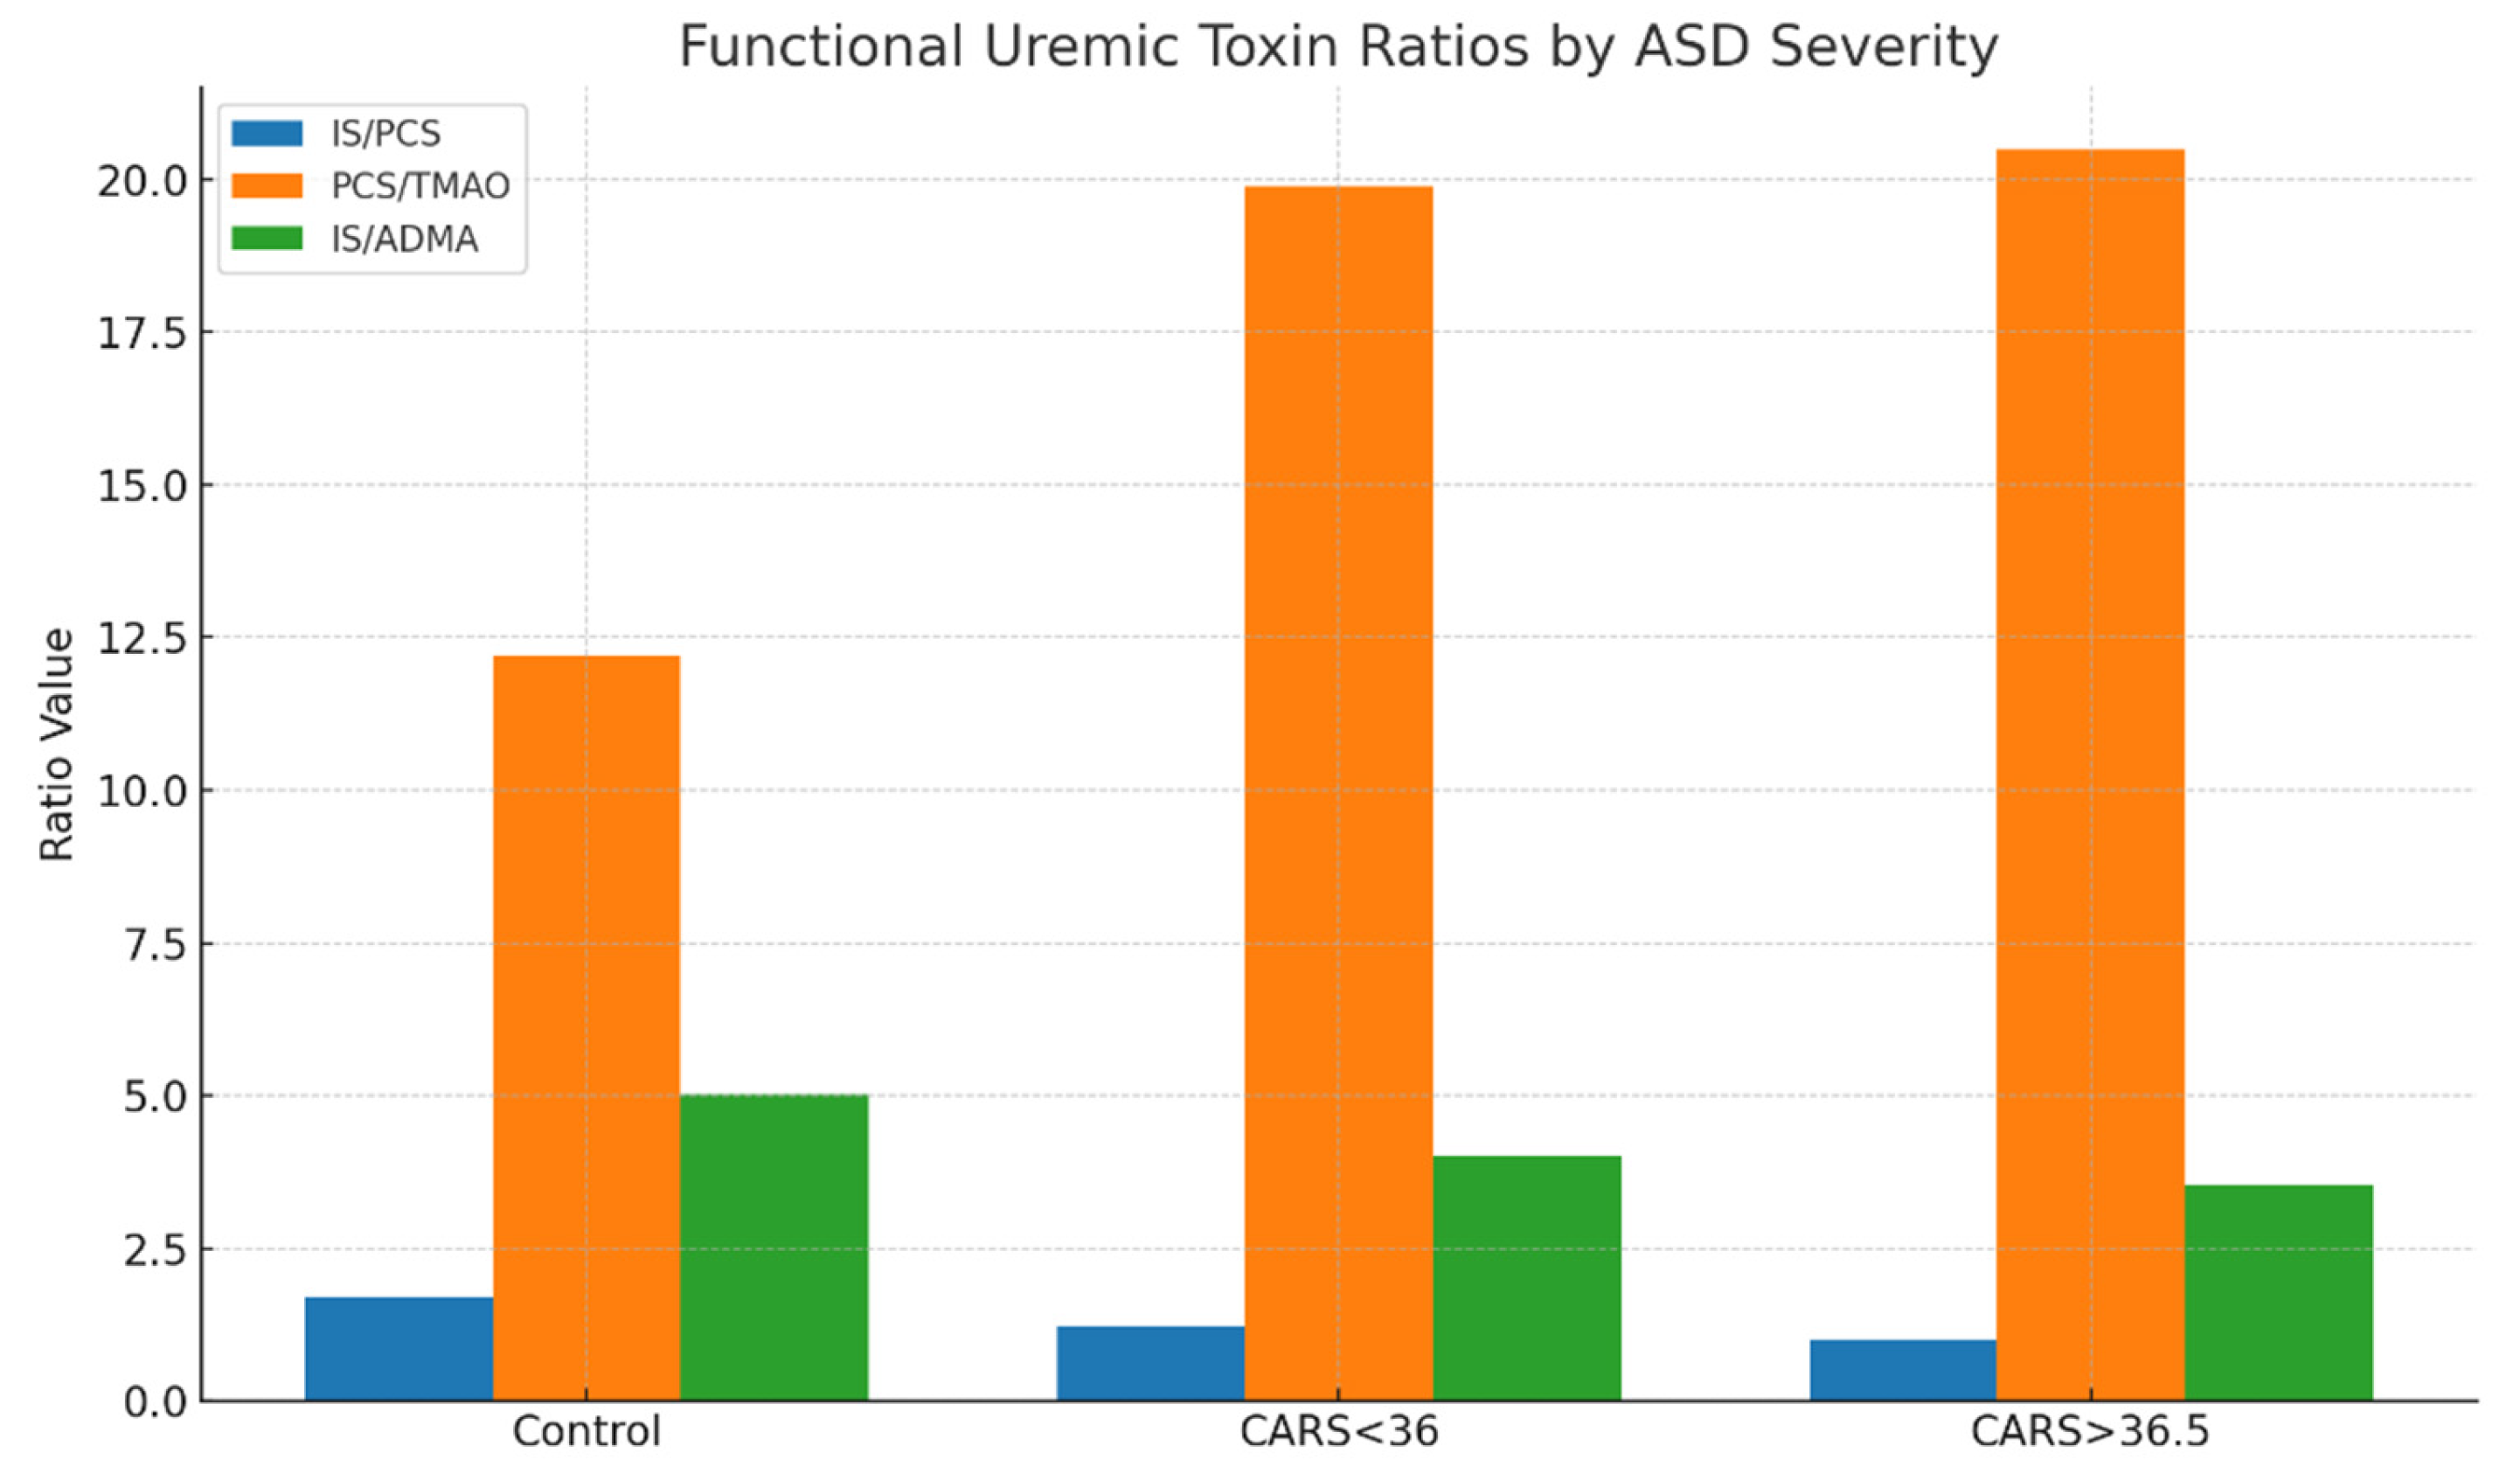

Table 1.
Description of uremic toxins with potential implications in ASD.
| Uremic Toxin | Description | Potential Implications in ASD |
| ADMA (Asymmetric Dimethylarginine) | Endogenous inhibitor of nitric oxide synthase (NOS); associated with endothelial dysfunction and cardiovascular complications in CKD | Elevated levels may contribute to endothelial dysfunction and impaired nitric oxide signaling; potential impact on neurodevelopmental processes in ASD |
| SDMA (Symmetric Dimethylarginine) | Related to ADMA; accumulates in CKD and associated with endothelial dysfunction and cardiovascular disease | Limited specific research linking SDMA to ASD; potential role in endothelial dysfunction and cerebral blood flow |
| TMAO (Trimethylamine N-Oxide) | Derived from gut microbial metabolism of dietary choline, phosphatidylcholine, and carnitine; associated with cardiovascular disease and altered gut microbiota | Limited direct evidence linking TMAO to ASD; dysregulation of gut microbiota and neuroinflammation could be relevant |
| IS (Indoxyl Sulfate) | Metabolite of tryptophan produced by gut bacteria; accumulates in CKD and excreted in urine | Elevated levels of IS may impact behavior and cognition; potential association with ASD symptoms |
| PCS (P-Cresol Sulfate) | Metabolite of tyrosine and phenylalanine produced by gut bacteria; accumulates in CKD and excreted in urine | Some evidence suggests a potential link between elevated PCS levels and ASD-like behaviors; further research needed to establish causality |
Table 2.
Concentrations of uremic toxins normalized on creatinine in the whole group of ASD and healthy children.
Table 2.
Concentrations of uremic toxins normalized on creatinine in the whole group of ASD and healthy children.
| Control (N=71) | ASD (N=161) | ASD/Control ratio | p value | |
| ADMA | 0.19 | |||
| Mean (SD) | 14.23 (7.03) | 15.56 (6.93) | 1.09 | |
| Median (Q1, Q3) | 12.70 (9.73, 18.74) | 14.72 (11.19, 19.24) | 1.15 | |
| Min - Max | 1.67 - 33.16 | 2.50 - 34.36 | ||
| SDMA | 0.93 | |||
| Mean (SD) | 33.00 (14.98) | 34.01 (16.11) | 1.03 | |
| Median (Q1, Q3) | 32.06 (23.46, 39.28) | 30.16 (23.66, 44.29) | 0.94 | |
| Min - Max | 7.07 - 80.21 | 4.09 - 79.83 | ||
| TMAO | 0.30 | |||
| Mean (SD) | 3.52 (2.72) | 3.05 (2.48) | 0.87 | |
| Median (Q1, Q3) | 3.09 (1.48, 5.19) | 2.65 (1.06, 4.37) | 0.86 | |
| Min - Max | 0.00 - 10.38 | 0.01 - 10.52 | ||
| IS | 0.23 | |||
| Mean (SD) | 71.04 (40.71) | 64.08 (39.90) | 0.90 | |
| Median (Q1, Q3) | 63.80 (39.77, 103.18) | 57.60 (30.19, 87.37) | 0.90 | |
| Min - Max | 3.57 - 168.60 | 3.16 - 193.60 | ||
| PCS | 0.86 | |||
| Mean (SD) | 52.82 (43.65) | 56.68 (47.56) | 1.07 | |
| Median (Q1, Q3) | 37.74 (20.02, 80.02) | 44.11 (15.73, 84.23) | 1.17 | |
| Min - Max | 1.27 - 195.67 | 0.13 - 188.20 |
The results are in µmol/mmol of creatinine.
Table 3.
Data on the proportions by sex and age separately for different CARS score.
| Control (N=71) | CARS<36 (N=58) | CARS>36.5 (N=34) | |
| SEX | |||
| Boys | 37 (52.1%) | 45 (77.6%) | 27 (79.4%) |
| Girls | 34 (47.9%) | 13 (22.4%) | 7 (20.6%) |
| AGE | |||
| Mean (SD) | 8.93 (3.82) | 9.38 (3.92) | 9.72 (3.87) |
| Median (Q1, Q3) | 8.60 (6.20, 11.25) | 8.70 (6.12, 11.82) | 9.00 (6.40, 13.00) |
| Min - Max | 2.40 - 16.70 | 2.50 - 17.00 | 3.50 - 16.70 |
Table 4.
Total Uremic Toxin Burden (Sum of Median Values).
| Group | Total Burden |
| Controls | 148.65 |
| ASD Overall | 151.95 |
| ASD 2–5.9 y | 155.11 |
| ASD 6–17 y | 153.35 |
| CARS <36 | 158.07 |
| CARS >36.5 | 151.91 |
Total burden calculated as the sum of median concentrations (µmol/mmol creatinine) of IS, PCS, TMAO, ADMA, and SDMA for control and ASD subgroups.
Table 5.
Percentage Contribution of Each Toxin to Total Burden.
| Group | IS % | PCS % | TMAO % | ADMA % | SDMA % |
| Control | 42.9 | 25.4 | 2.1 | 8.5 | 21.1 |
| CARS<36 | 38.4 | 31.4 | 1.6 | 9.6 | 19.0 |
| CARS>36.5 | 34.6 | 35.1 | 1.7 | 9.8 | 18.8 |
Relative contribution (%) of each toxin (based on medians) to the total uremic burden in control and ASD subgroups.
Table 6.
Key Ratios Between Uremic Toxins.
| Group | IS/PCS | PCS/TMAO | IS/ADMA |
| Control | 1.69 | 12.2 | 5.02 |
| CARS<36 | 1.22 | 19.9 | 4.01 |
| CARS>36.5 | 0.99 | 20.5 | 3.55 |
Calculated functional ratios based on medians of selected toxins in control and ASD subgroups.
Table 7.
Sex-Specific Total Burden and Ratios (ASD Only).
| Sex | Total Burden | IS/PCS | PCS/TMAO |
| Boys | 153.52 | 1.32 | 17.7 |
| Girls | 156.13 | 1.24 | 18.1 |
Sex-specific comparison of total toxin burden, IS/PCS and PCS/TMAO ratios in ASD children.
Table 8.
Ratios by Age Group (ASD vs. Controls).
| Group | IS/PCS | PCS/TMAO |
| Control (2–5.9 years) | 1.80 | 13.3 |
| ASD (2–5.9 years) | 1.36 | 20.0 |
| Control (6–17 years) | 1.68 | 11.7 |
| ASD (6–17 years) | 1.37 | 19.5 |
Comparison of key toxin ratios across younger (2–5.9 years) and older (6–17 years) children with ASD and matched controls.
Table 9.
Data on the proportions by sex and age.
| 2 – 17 years | Control (N=71) | ASD (N=161) | Total (N=232) |
| SEX | |||
| Boys | 37 (52.1%) | 124 (77.0%) | 161 (69.4%) |
| Girls | 34 (47.9%) | 37 (23.0%) | 71 (30.6%) |
| AGE | |||
| Mean (SD) | 8.93 (3.82) | 9.28 (3.76) | 9.17 (3.77) |
| Median (Q1, Q3) | 8.60 (6.20, 11.25) | 8.60 (6.20, 12.40) | 8.60 (6.20, 12.10) |
| Min - Max | 2.40 - 16.70 | 2.50 - 17.00 | 2.40 - 17.00 |
| 2 – 5.9 years | Control A (N = 14) | ASD A (N = 35) | Total A (N = 49) |
| SEX | |||
| Boys | 10 (71.4%) | 23 (65.7%) | 33 (67.3%) |
| Girls | 4 (28.6%) | 12 (34.3%) | 16 (32.7%) |
| AGE | |||
| Mean (SD) | 3.85 (1.15) | 4.57 (0.92) | 4.37 (1.03) |
| Median (Q1, Q3) | 4.10 (2.68, 4.65) | 4.60 (3.95, 5.40) | 4.40 (3.80, 5.40) |
| Min - Max | 2.40 – 5.50 | 2.50 – 5.90 | 2.40 – 5.90 |
| 6 -17 years | Control B (N=57) | ASD-B (N=126) | Total B (N=183) |
| SEX | |||
| Boys | 27 (47.4%) | 101 (80.2%) | 128 (69.9%) |
| Girls | 30 (52.6%) | 25 (19.8%) | 55 (30.1%) |
| AGE | |||
| Mean (SD) | 10.18 (3.15) | 10.59 (3.15) | 10.46 (3.15) |
| Median (Q1, Q3) | 10.40 (7.20, 12.40) | 10.35 (7.93, 13.00) | 10.40 (7.70, 12.95) |
| Min - Max | 6.00 - 16.70 | 6.00 - 17.00 | 6.00 - 17.00 |
Disclaimer/Publisher’s Note: The statements, opinions and data contained in all publications are solely those of the individual author(s) and contributor(s) and not of MDPI and/or the editor(s). MDPI and/or the editor(s) disclaim responsibility for any injury to people or property resulting from any ideas, methods, instructions or products referred to in the content. |
© 2025 by the authors. Licensee MDPI, Basel, Switzerland. This article is an open access article distributed under the terms and conditions of the Creative Commons Attribution (CC BY) license (http://creativecommons.org/licenses/by/4.0/).
Copyright: This open access article is published under a Creative Commons CC BY 4.0 license, which permit the free download, distribution, and reuse, provided that the author and preprint are cited in any reuse.


