Introduction
Autism Spectrum Disorder (ASD), also known as autism, is a neurodevelopmental disorder that affects behavior, speech, and social interaction. It is characterized by a broad spectrum of symptoms and degrees of impairment that vary significantly from person to person. While the precise etiology of ASD is still unknown, research suggests that it is likely caused by a complex interaction between genetic and environmental factors (Mughal et al., 2022).
Recent research has pointed to tryptophan (TRP) metabolism as a key factor in the etiopathogenesis of ASD(Santana-Coelho, 2024).
Tryptophan is an essential amino acid involved in the production of critical neuroactive compounds such as serotonin, melatonin, and kynurenine, all of which play crucial roles in brain development and function (Reuter et al., 2021).
The gut microbiota, gut-brain axis, nutrition, tryptophan metabolites, and biosynthetic gene polymorphisms are only a few of the intricate relationships that link tryptophan metabolites to autism spectrum disorders. Nevertheless, it is uncertain whether the link is causal, responsive, or a proxy, and the mechanism is unknown.
This study was carried out to fill important knowledge gaps because there haven't been many thorough investigations on tryptophan metabolites in children with ASD. We sought to shed light on metabolic changes connected to gut microbiota, immunological response, and sex-based disparities by examining metabolites and ratios such kynurenine:tryptophan and serotonin:tryptophan. This study emphasizes the need for additional investigation to confirm these results, create normative data, and examine how tryptophan pathways relate to the symptomatology of ASD.
Disruptions in the gut microbiota, frequently seen in individuals with ASD, can significantly affect TRP metabolism (Strandwitz, 2018). These microbiota disruptions can alter the balance between serotonin and kynurenine synthesis, with potential consequences for neurodevelopmental and behavioral traits (Labus et al., 2017; Liu et al., 2019). Studies have shown that beneficial bacterial species such as Lactobacillus and Bifidobacterium, which are important for maintaining gut health and regulating the gut-brain axis, are reduced in ASD (Strati et al., 2017). This reduction leads to a decrease in the production of short-chain fatty acids and other metabolites essential for neurodevelopment. An imbalance in tryptophan metabolism, driven by microbiota disruptions, can shift the metabolic pathway from serotonin production towards the kynurenine pathway, resulting in the accumulation of neuroactive metabolites. These metabolites contribute to neuroinflammation and neurotoxicity, both of which are critical components in the pathogenesis of ASD (Hou et al., 2023). This feedback loop, where gut health affects neurodevelopment, further exacerbates metabolic abnormalities seen in ASD. Disruptions in the microbiota contribute to metabolic imbalances, which in turn affect neurodevelopmental outcomes, highlighting the intertwined relationship between the gut and brain in ASD.
Polymorphisms in genes encoding enzymes like tryptophan hydroxylase and indoleamine 2,3-dioxygenase (IDO) influence tryptophan metabolism. Variations in these enzymes can alter the rates of metabolite production. Inflammatory processes, particularly those involving pro-inflammatory cytokines, can activate IDO, leading to altered tryptophan breakdown and a shift towards kynurenine pathway metabolites, which are often linked to immune dysregulation in ASD (Frye et al., 2016). Furthermore, stress and psychiatric conditions can modulate tryptophan metabolism by altering hormone levels and neurotransmitter activity, complicating the metabolic balance in ASD. Stress-induced activation of the hypothalamic-pituitary-adrenal (HPA) axis leads to elevated cortisol levels, which can shift tryptophan metabolism towards the kynurenine pathway, reducing serotonin production. This mechanism has been associated with mood disorders and ASD (Oxenkrug, 2010).There is currently no solid evidence from comparisons between healthy (unrelated) groups and ASD, and there are numerous confounders.
Variations in tryptophan metabolites (such as kynurenine, serotonin, melatonin, and indole derivatives) have been found between children with ASD and healthy controls (Kałużna-Czaplińska et al., 2019; Yap et al., 2010). Children with ASD often exhibit reduced levels of tryptophan and its metabolites, which may contribute to the symptoms of repetitive behaviors and social deficits (Almulla et al., 2023; Badawy, 2017; Esposito et al., 2024; Raghavan et al., 2022).
Tryptophan is metabolized through three main pathways: the
kynurenine pathway, the
serotonin pathway, and the
indole pathway (
Table 1;
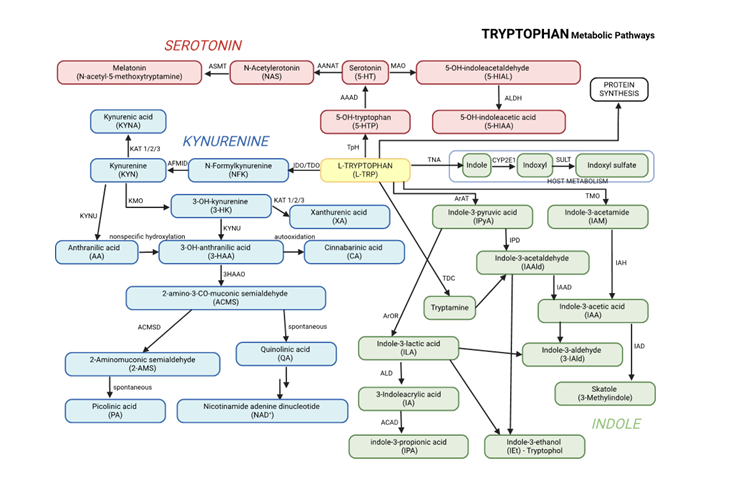
Figure 1). These pathways are central to producing neuroactive metabolites that influence behavior, immune function, and brain development , all of which are relevant to ASD (Roager & Licht, 2018; Xue et al., 2023).
Kynurenine Pathway: Enzymes such as indoleamine 2,3-dioxygenase (IDO) and tryptophan 2,3-dioxygenase (TDO) convert tryptophan into kynurenine. The pathway generates metabolites like kynurenic acid, which has neuroprotective effects, and quinolinic acid, which becomes neurotoxic when accumulated to excess.
Serotonin Pathway: Tryptophan is converted into serotonin, a neurotransmitter involved in regulating mood, sleep, and behavior. Serotonin is further broken down into 5-hydroxyindoleacetic acid (5-HIAA), a marker of serotonin turnover.
Indole Pathway: The gut microbiota plays a significant role in converting tryptophan into indole derivatives such as indole-3-acetic acid (IAA), indole-3-lactic acid (ILA), and indole-3-propionic acid (IPA). These metabolites are crucial for gut health and regulating the gut-brain axis.
Graphical presentation of the main pathways of tryptophan metabolism, including its conversion to kynurenine, melatonin, and other metabolites, is presented in
Figure 1. This figure combines all three major pathways of tryptophan metabolism, along with their key metabolites, into a unified overview.
The urinary levels of tryptophan metabolites and their ratios have been studied to investigate the possible alterations in tryptophan metabolism and gut microbiota in children with ASD compared to typically developing children (Taurines et al., 2012; Xiong et al., 2016) (
Table 2).
The assay we employed measures more intermediates, making it comparatively more comprehensive than those commonly used. As a result, more ratios can be computed than were previously possible, which could provide more precise correlations indicating that tryptophan metabolism is linked to ASD (Pavlova et al., 2017).
In our study, we wanted to determine whether the urinary concentrations of tryptophan pathway metabolites and their ratios, of children with ASD differ from those of healthy controls.
TRP/IAA (tryptophan/indole-3-acetic acid): A higher ratio would suggest that there is more tryptophan than IAA, which could be a result of the gut microbiota converting tryptophan more slowly. Since IAA is a gut-derived molecule associated with bacterial digestion of tryptophan, it may indicate decreased microbial activity or dysbiosis in ASD. A higher TRP/IAA ratio may indicate compromised gut-brain signaling pathways in ASD, which could affect behavior and neurodevelopment.
TRP/5-HIAA, is a modified ratio that shows the amount of tryptophan in relation to the serotonin turnover rate. Lower serotonin metabolism may be indicated by a larger TRP/5-HIAA ratio, which could be brought about by either less enzymatic conversion to 5-HIAA or less serotonin synthesis. Since serotonin is essential for mood control and anxiety, this imbalance may be linked to these conditions in ASD.
TRP/N-Acetyltryptophan: Tryptophan may be less efficiently transferred into other metabolic pathways if the TRP/N-Acetyltryptophan ratio is larger. This could point to a change in tryptophan's alternate metabolic pathways in ASD, which could have an impact on pathways related to neuroprotection and immunological control.
TRP/IPA and TRP/IAM: Lower conversion of tryptophan to these neuroactive and antioxidant compounds—which are frequently produced by beneficial gut bacteria—would be indicated by higher TRP/IPA and TRP/IAM ratios. Higher TRP/IPA and TRP/IAM ratios in ASD may indicate decreased antioxidant synthesis from the microbiota, which could exacerbate oxidative stress and neuroinflammation.
TRP/Methyl-IA: A higher ratio of TRP to methyl-IA may indicate a possible decrease in methylation activity, which is frequently engaged in neurotransmitter modulation and detoxification. Increased TRP/Methyl-IA ratios in ASD may be a marker of compromised methylation, which could impact gut-brain communication and have an impact on behavioral outcomes.
Materials and Methods
Subjects
The study population consisted of 88 children, 44 with ASD (36 boys/ 8 girls) and 44 healthy controls (23 boys/21 girls), who were members of the same family. In the ASD group, the subjects’ average age was 10.7 years in the range of 4.9 – 17.0 years. The control group included 44 siblings, neurotypical children without any acute or chronic illness, who were, on average, 9.4 years of age in the range of 0.9 – 16.7 years. All children were without supplementary vitamin intake or magnesium supplementation. Children in the study group were diagnosed with ASD by an expert paediatrician or a neuropsychiatrist in collaboration with a psychologist (
Supplementary Material Table S1). The diagnosis was made using a multidisciplinary approach which combined a clinical evaluation with a psychological assessment. Children were grouped according to the criteria detailed and summarized by DSM-5 (American Psychiatric Association, 2013). Additional behavioural ratings were based on a standardized classification of behaviour for children with ASD developed by the local educational authority for providing additional school support (Chawla et al., 2002; Osredkar et al., 2019; Vovk-Ornik, 2015) and on Childhood Autism Rating Scale (C.A.R.S.) (Schopler et al., 1980). The CARS questionnaire was filled out by all parents in conjunction with a psychologist. The interpretation of CARS scores in our study:
Score below 28: Typically, a score below 28 indicates that the child is not likely to have ASD. However, it's important to consider other factors and use clinical judgment in making a final diagnosis.
Score between 28 and 36: This range suggests the possibility of mild to moderate autism symptoms. Further evaluation and observation may be needed to determine if the child meets the criteria for ASD.
Score above 36.5: Scores above 36.5 indicate a higher likelihood of significant autism symptoms. It suggests a stronger possibility of the child meeting the diagnostic criteria for ASD.
Collection of Urine Samples
15 ml of morning urine samples were collected into sterile urine container and stored at -800C until analysis.
Analysis
Determination of Creatinine in Urine
Urinary creatinine was analysed on an Advia 2400 analyser (Siemens Healthcare Diagnostics, Germany Erlangen) using the Jaffe reaction. Creatinine reacts with picric acid in alkaline medium, the resulting red coloured complex is measured at 505/571 nm.
Statistical Analysis
R version 4.3.1 in conjunction with RStudio version 2023.12.0 was used for statistical analysis, using the tidyverse suite (Wickham et al., 2019) for visualisation and arsenal package (Ethan et al., 2022) to compare groups. The Shapiro-Wilk tests from stats package (Core, 2018; R Core Team, 2018) was used to evaluate the distribution of data. Results showed that all datasets had non-normal distributions and thus the non-parametric Wilcoxon signed-rank test was employed for comparisons. The Benjamini-Hochberg procedure was used to control false discovery rate, with alpha significance level of 0.05.
Results
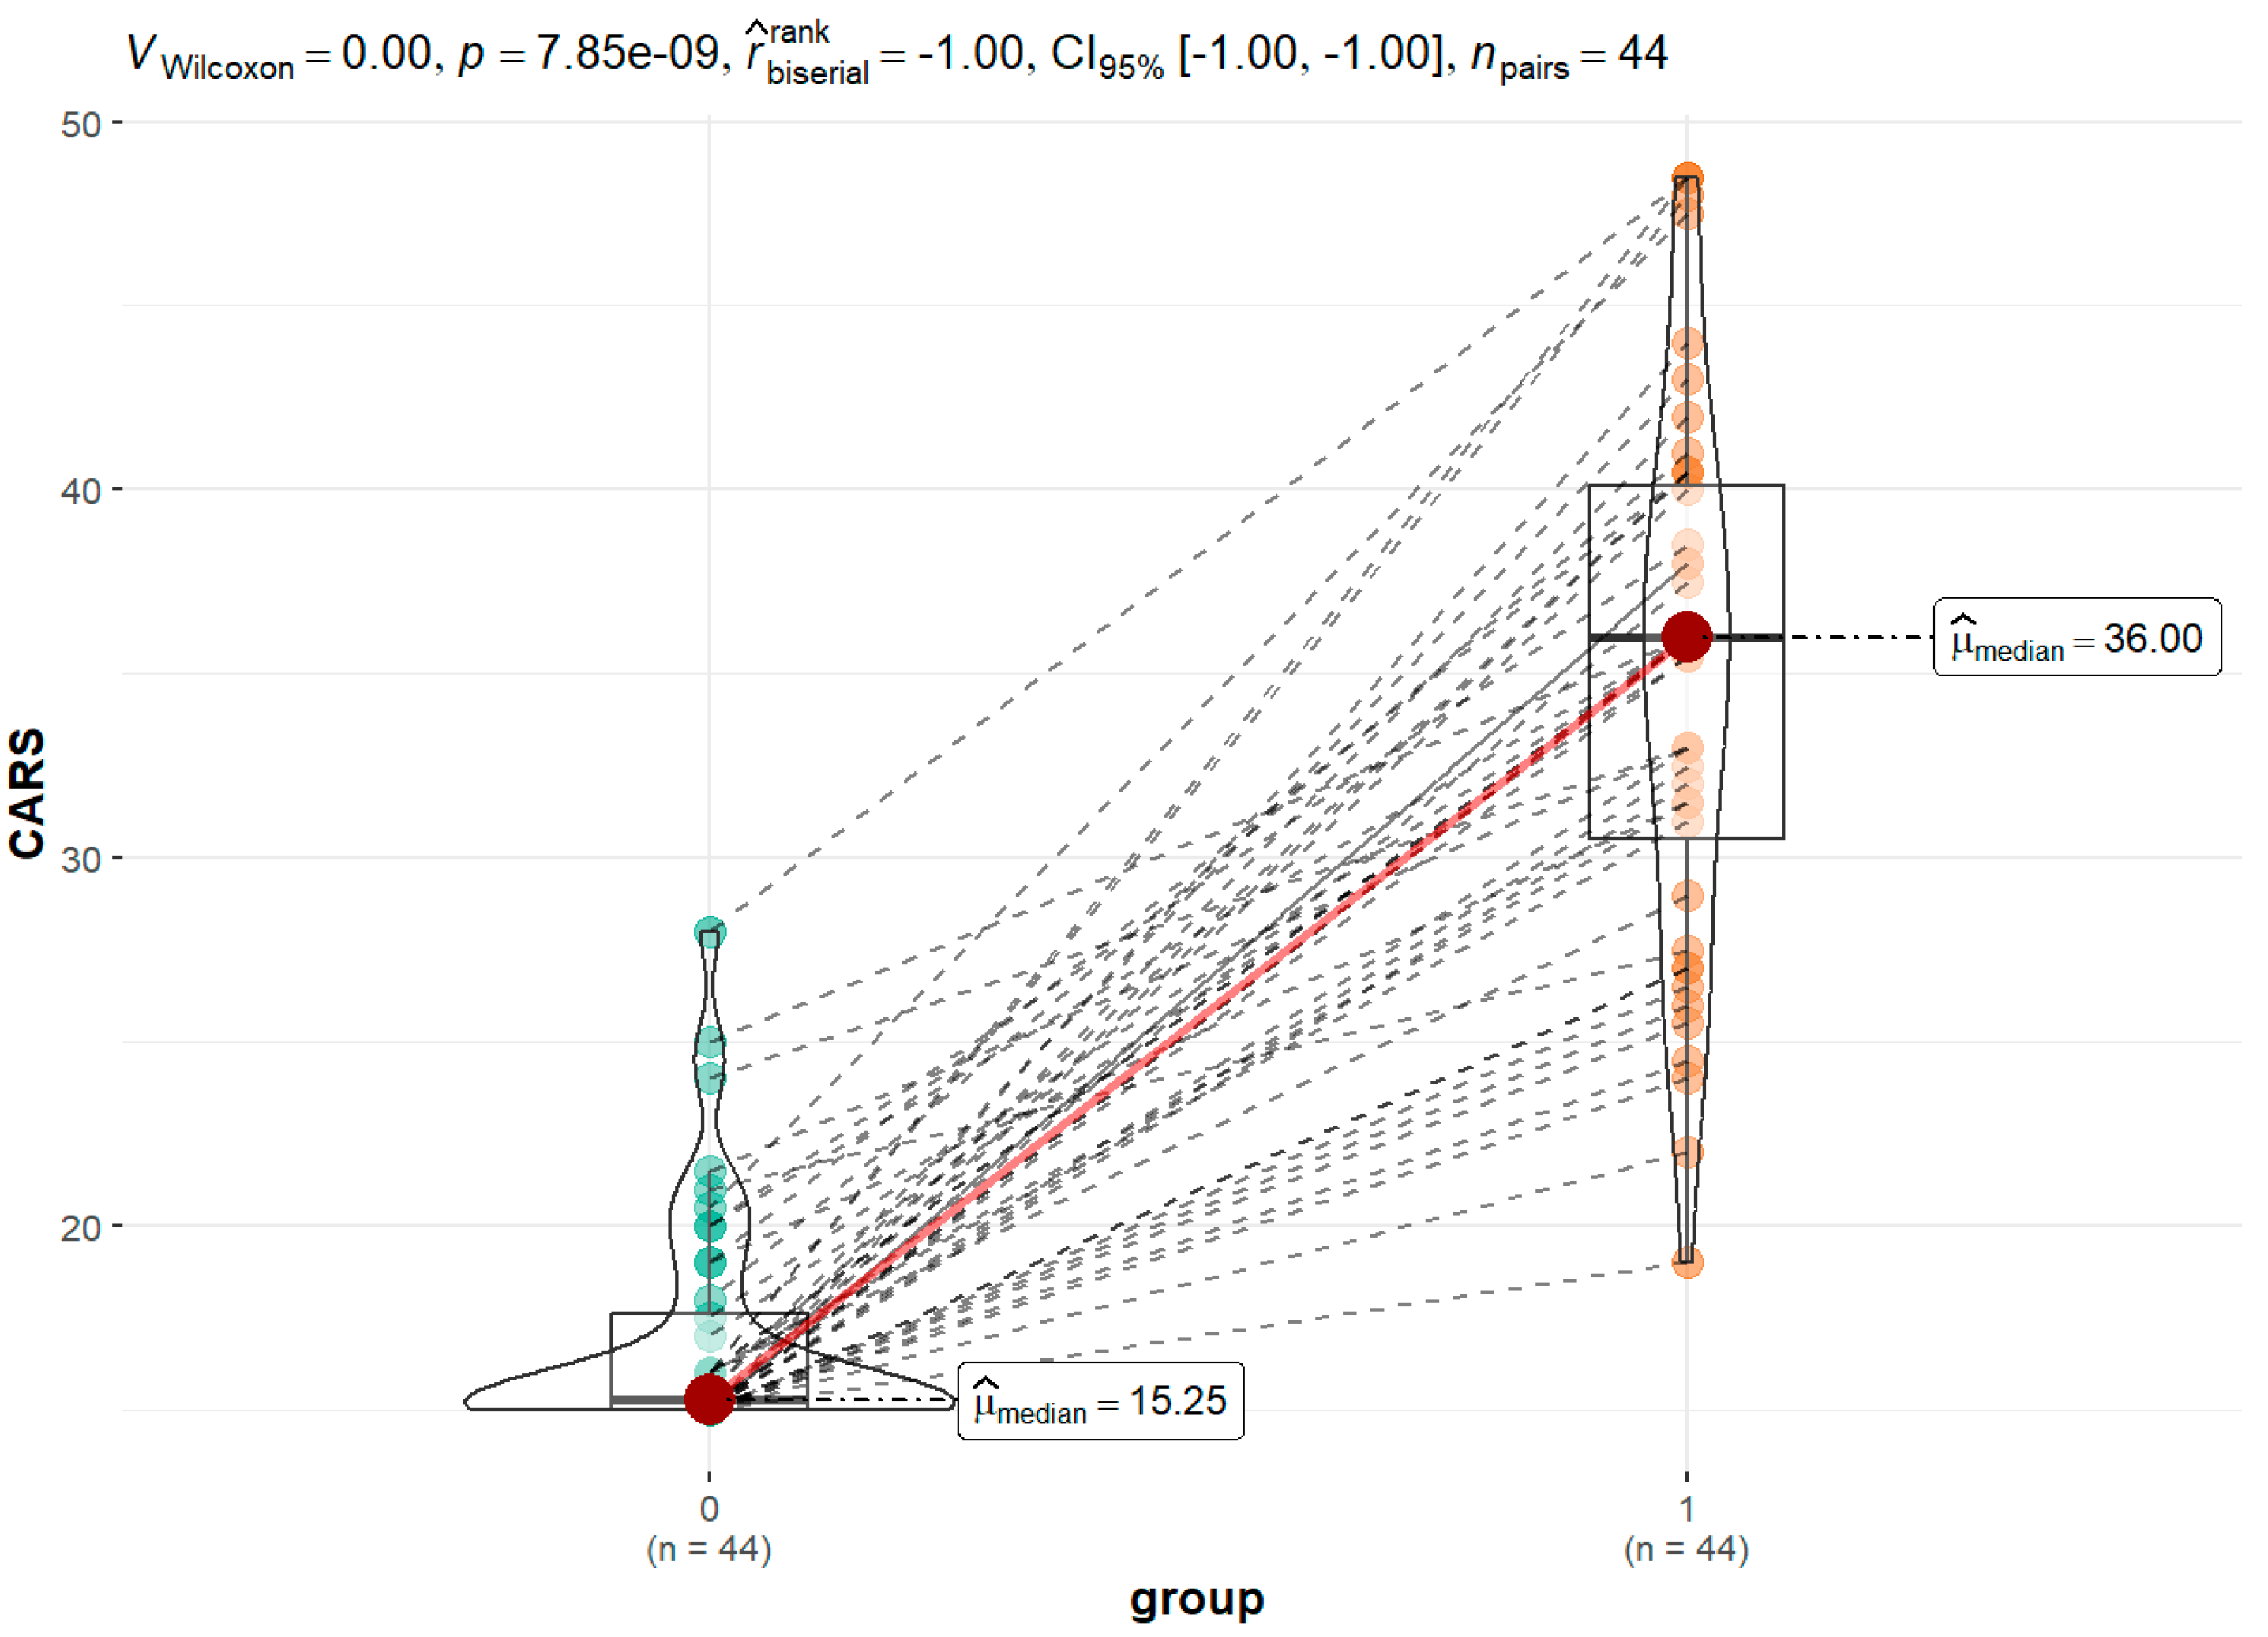
Our study's findings indicate that children with ASD have higher tryptophan concentrations (19.94 vs. 16.91; p = 0.04) than their siblings. This holds true for the 44 child pairs that belong to the same family. When dividing ASD-diagnosed children into moderate and severe categories, the observation of higher tryptophan values in severely affected children (21.37 vs 19.81; p = 0.74) suggests that different metabolic pathways may be more active in severe cases.
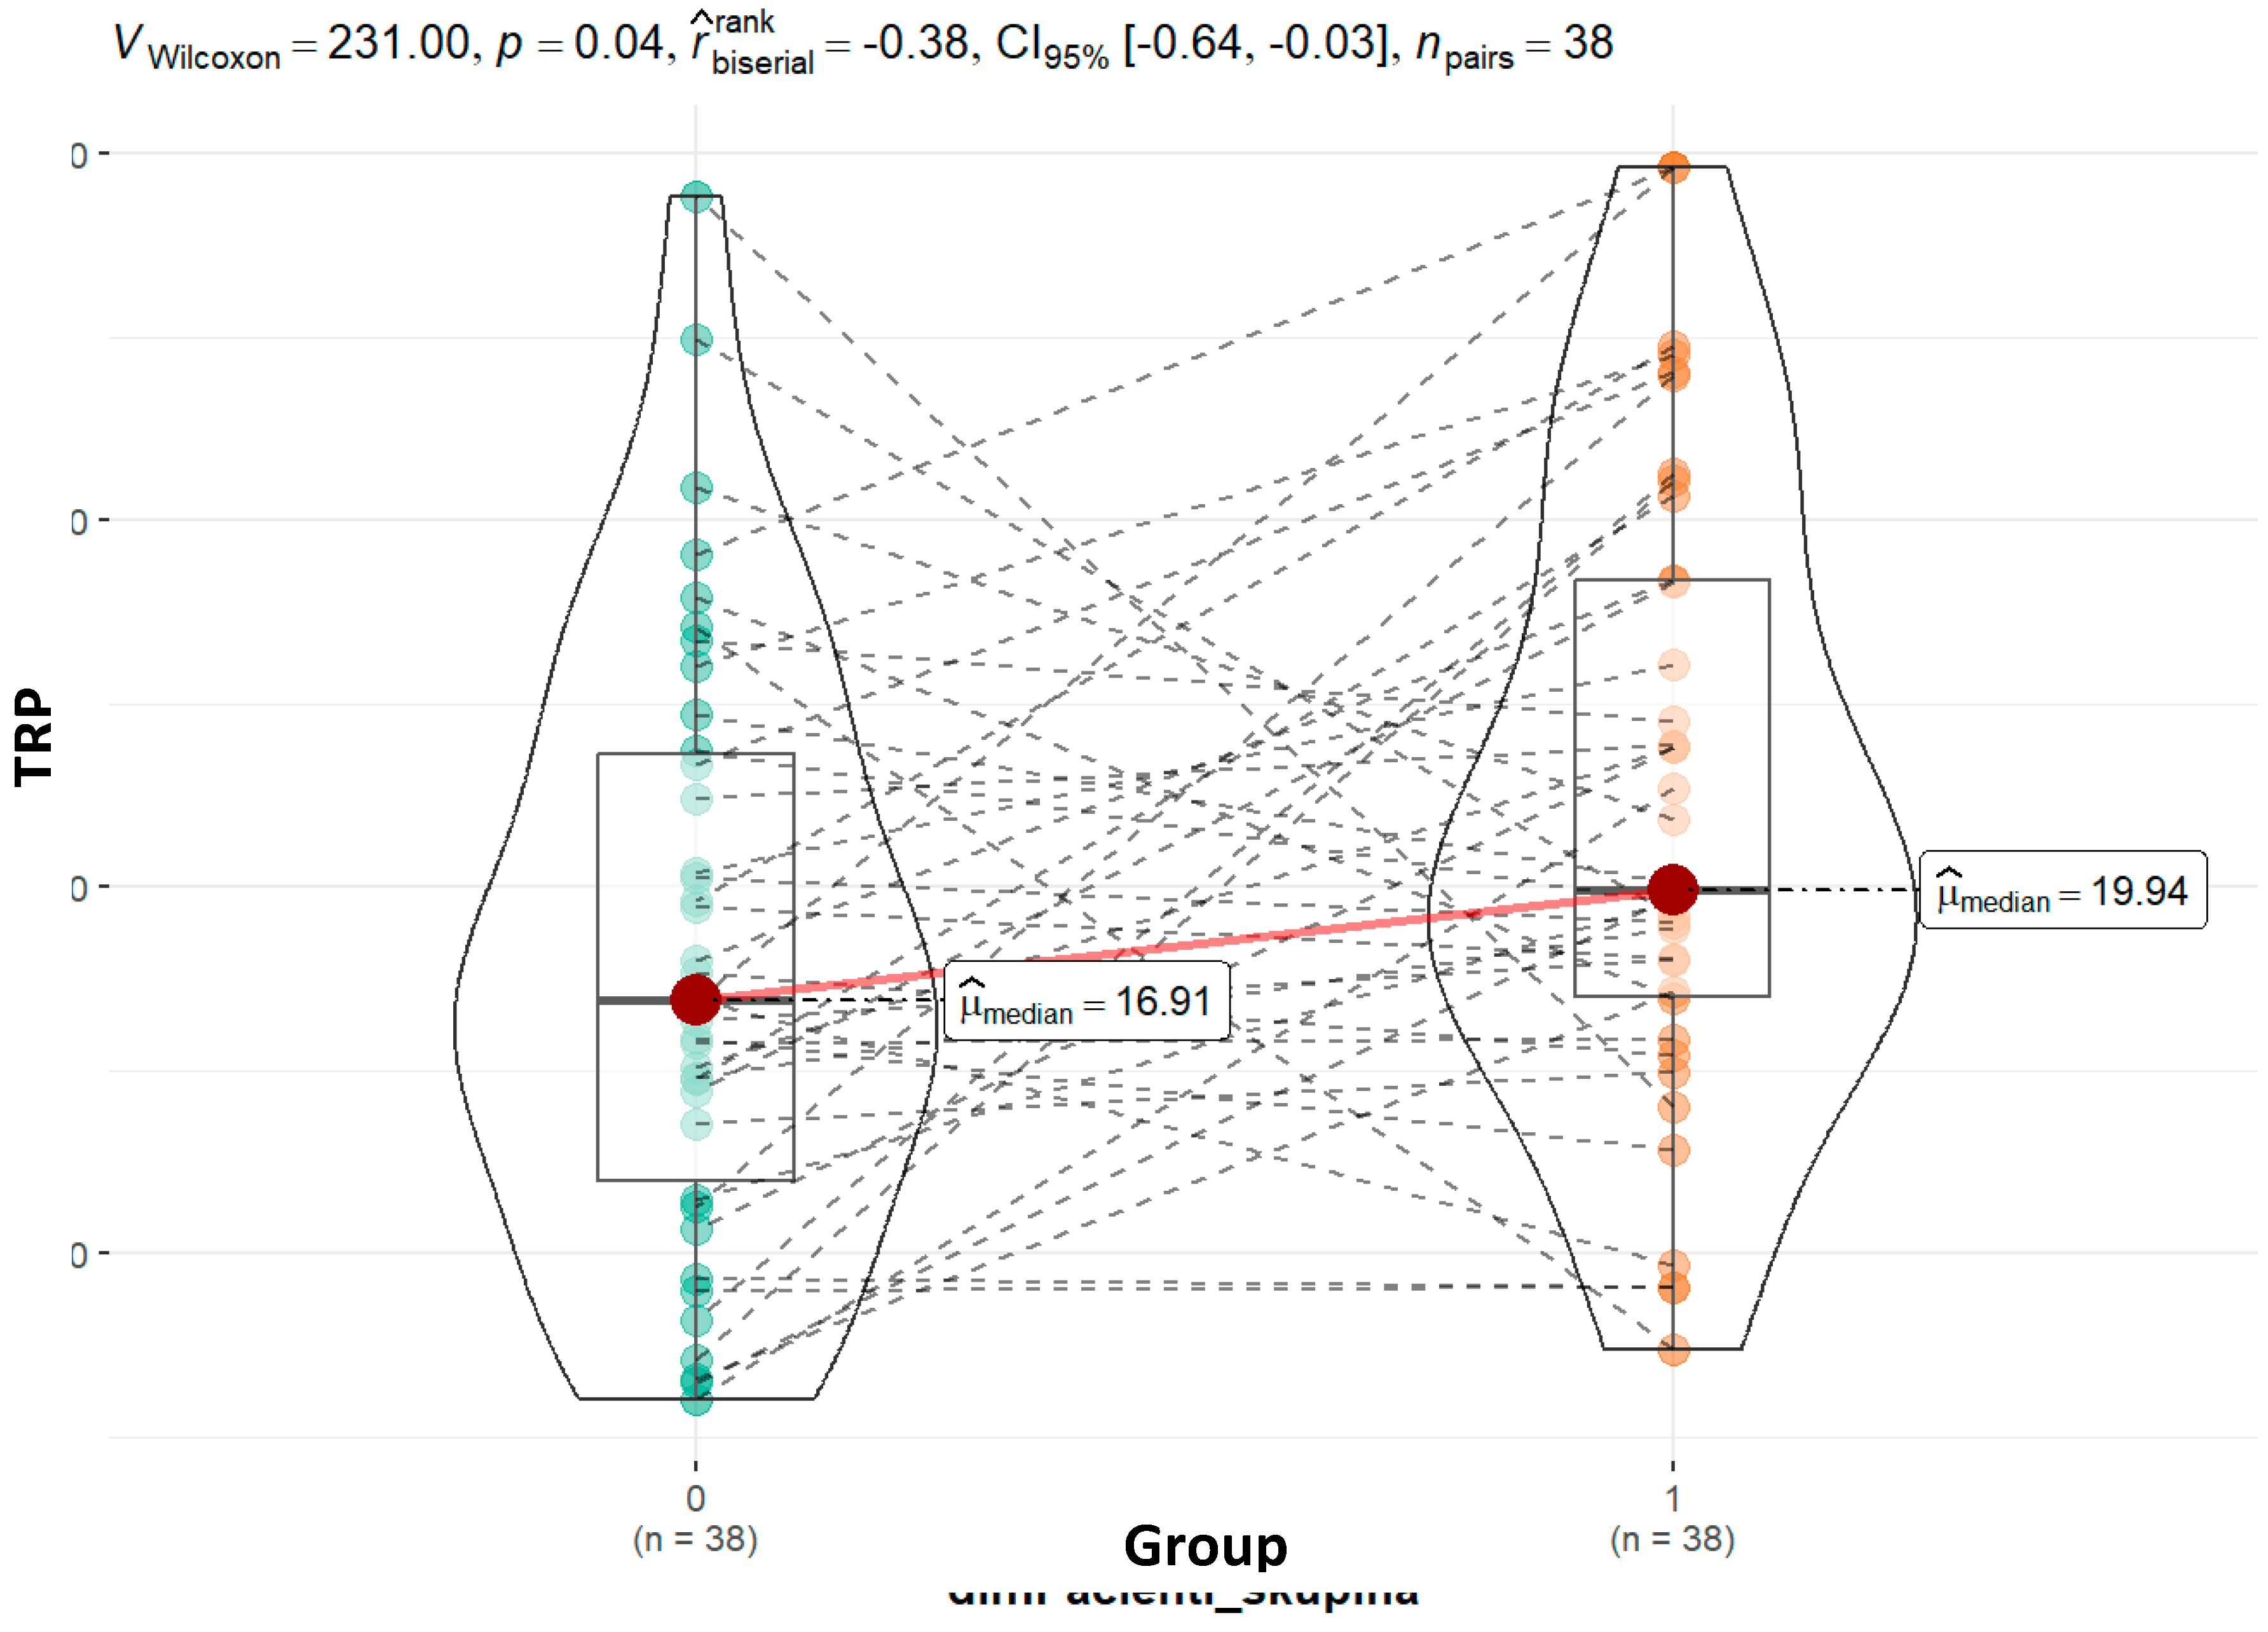
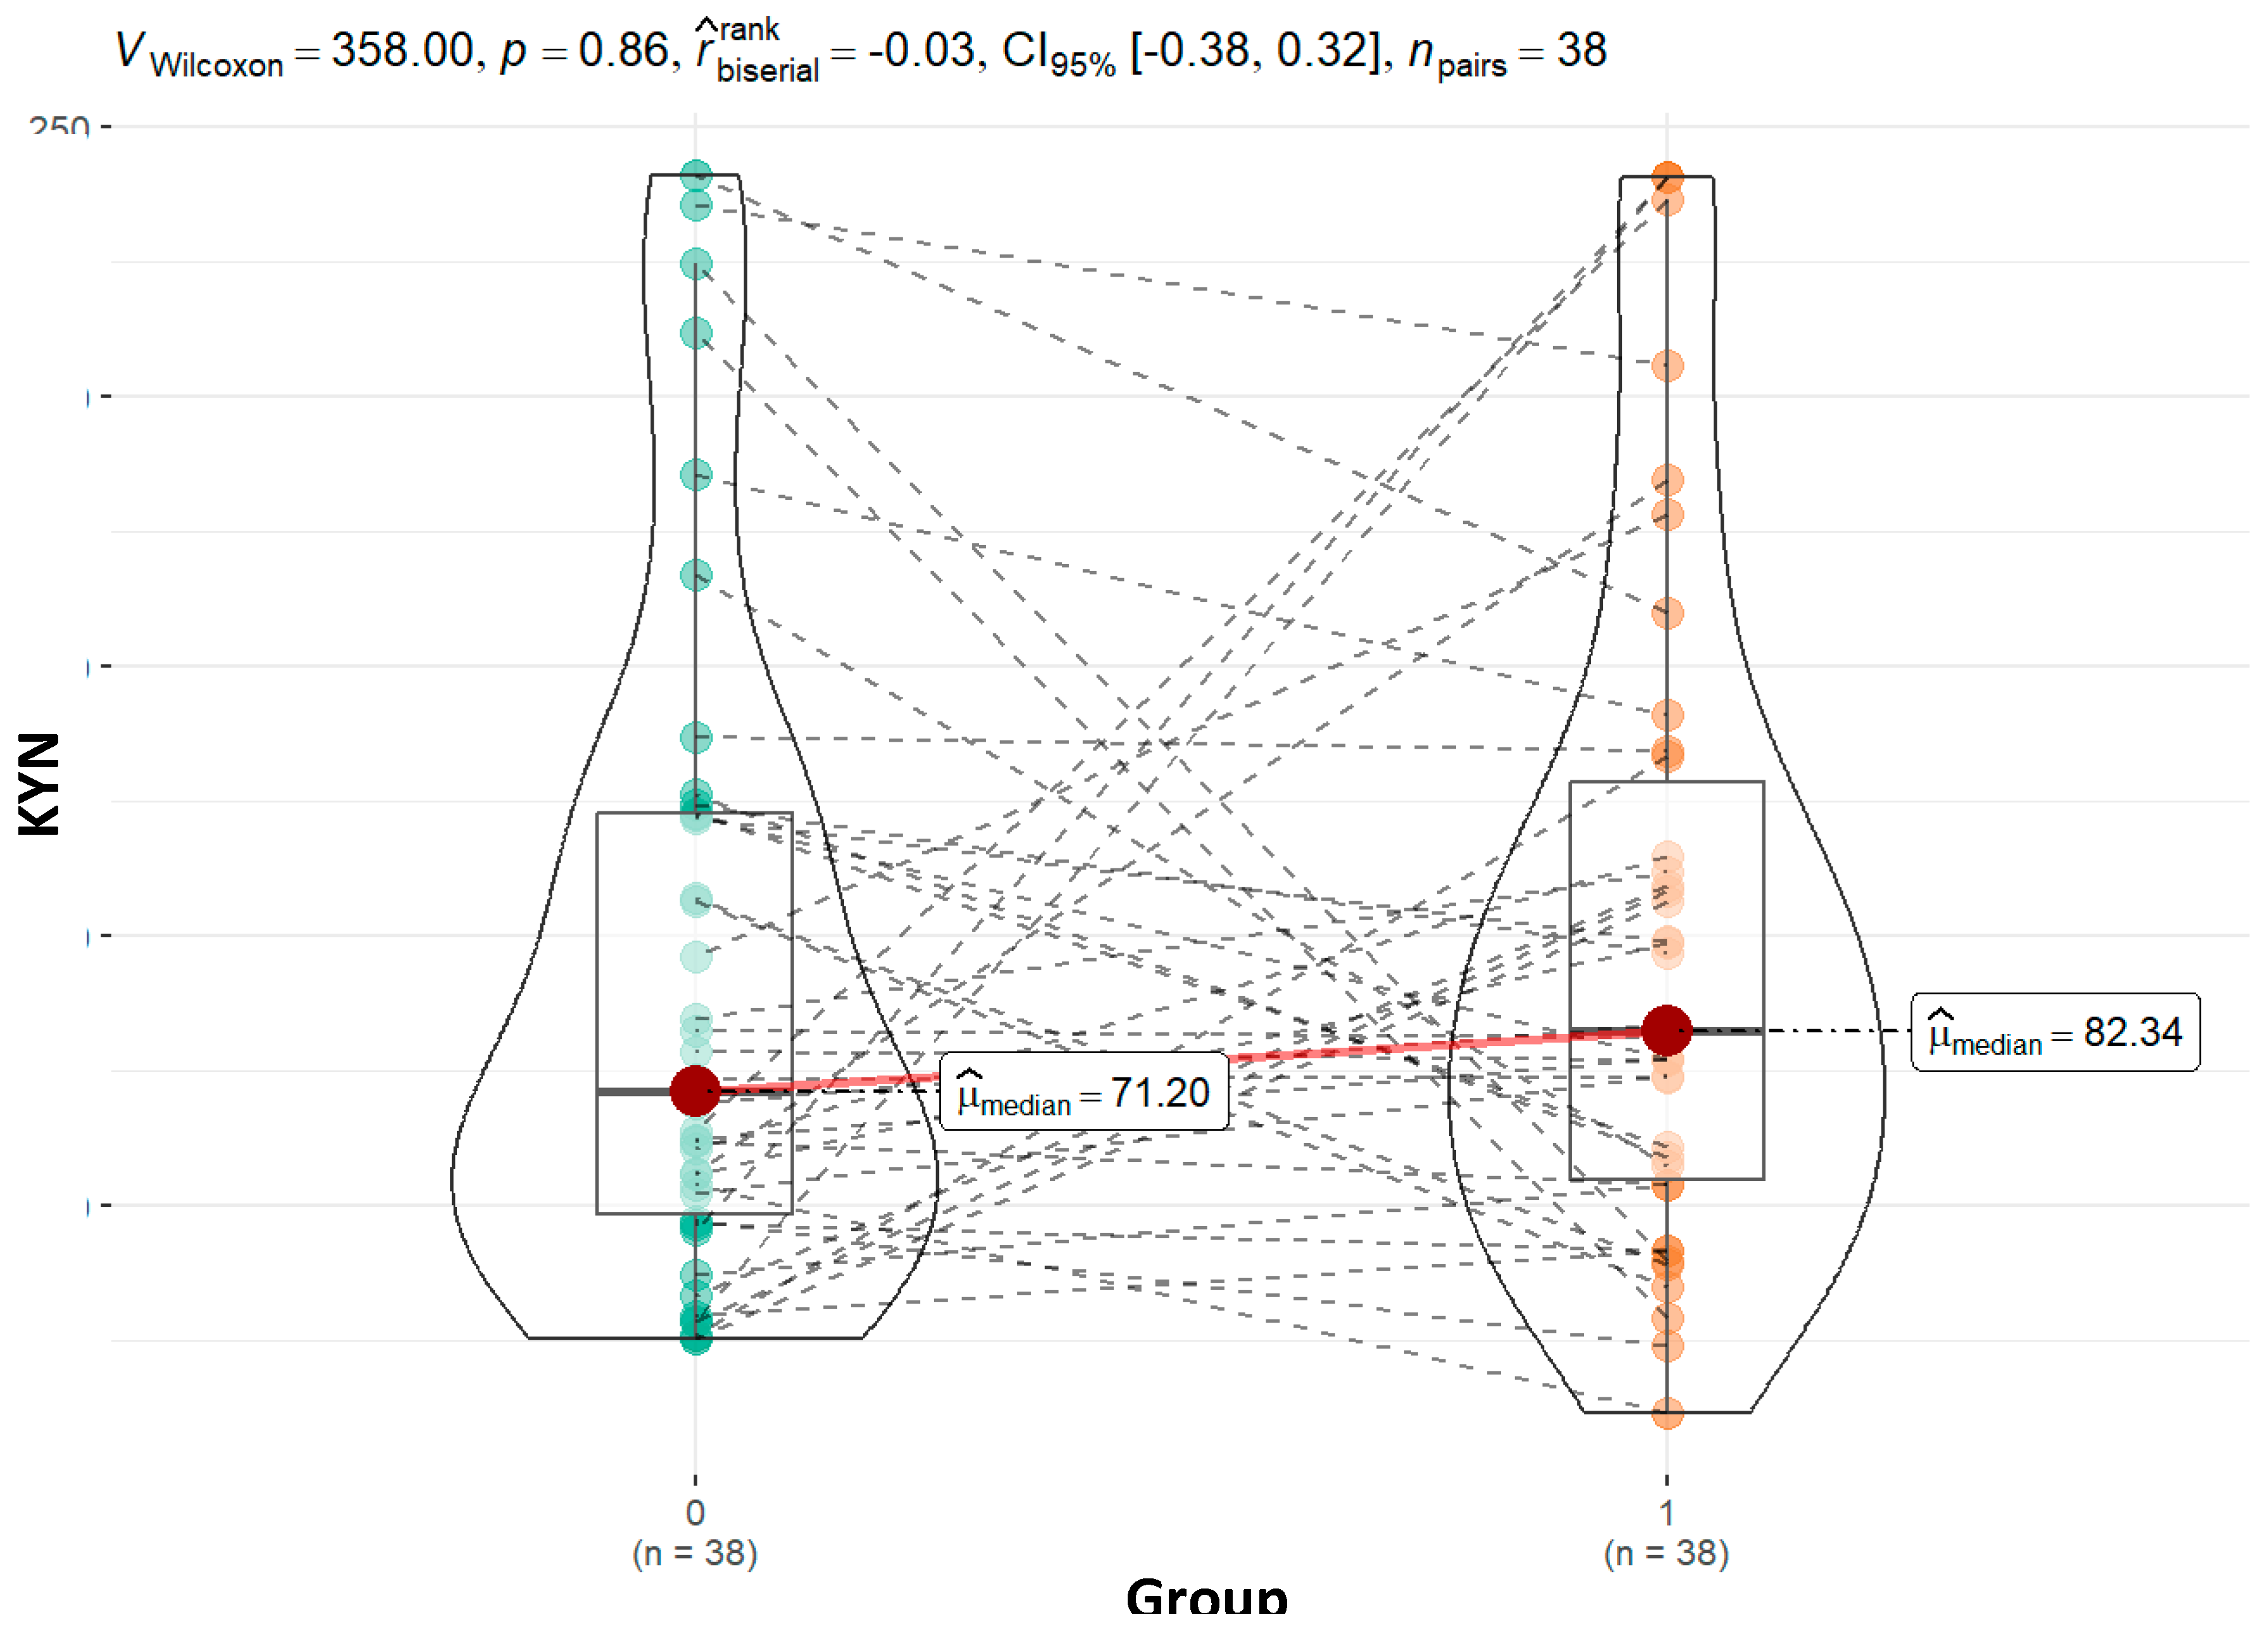
Kynurenine, a critical metabolite in the tryptophan degradation pathway, was found at higher levels in children with ASD compared to controls (82.34 vs. 71.20; p=0.86). Although not statistically significant, this pattern is consistent with previous studies showing elevated kynurenine levels in ASD, which is associated with increased neuroinflammation and immune dysregulation (Gevi et al., 2016; Masi et al., 2017). The non-significant increase in moderately affected children (77.23 vs. 71.20; p=1.00) and a more pronounced rise in severely affected children (97.70 vs. 71.21; p=0.28) could reflect greater activation of the kynurenine pathway in more severe cases, further supporting the link between severity and inflammatory responses.
In our study, children with ASD had higher urinary tryptamine concentrations compared to controls (441.1 vs. 389.1; p = 0.10), although this difference was not statistically significant. In the control group, tryptamine levels were nonsignificantly lower than in children with severe illness (389.1 vs. 391.7; p = 0.72). However, the difference was more pronounced in children with moderate illness (528.1 vs. 389.1; p = 0.13), approaching statistical significance.
Table 3.
Basic demographic data on patients and control group.
Table 3.
Basic demographic data on patients and control group.
| |
0 (N=44)
|
1 (N=44)
|
|
Control (0), Patients (1)
|
|
|
|
Male (M)
|
23 (52,3%)
|
36 (81,8%)
|
|
Female (F)
|
21 (47,7%)
|
8 (18,2%)
|
|
Age
|
|
|
|
Mean (SD)
|
9,36 (3,51)
|
10,68 (3,19)
|
|
Median (Q1, Q3)
|
9,35 (6,80, 11,38)
|
10,70 (8,38, 13,00)
|
|
Min - Max
|
0,90 - 16,70
|
4,90 - 17,00
|
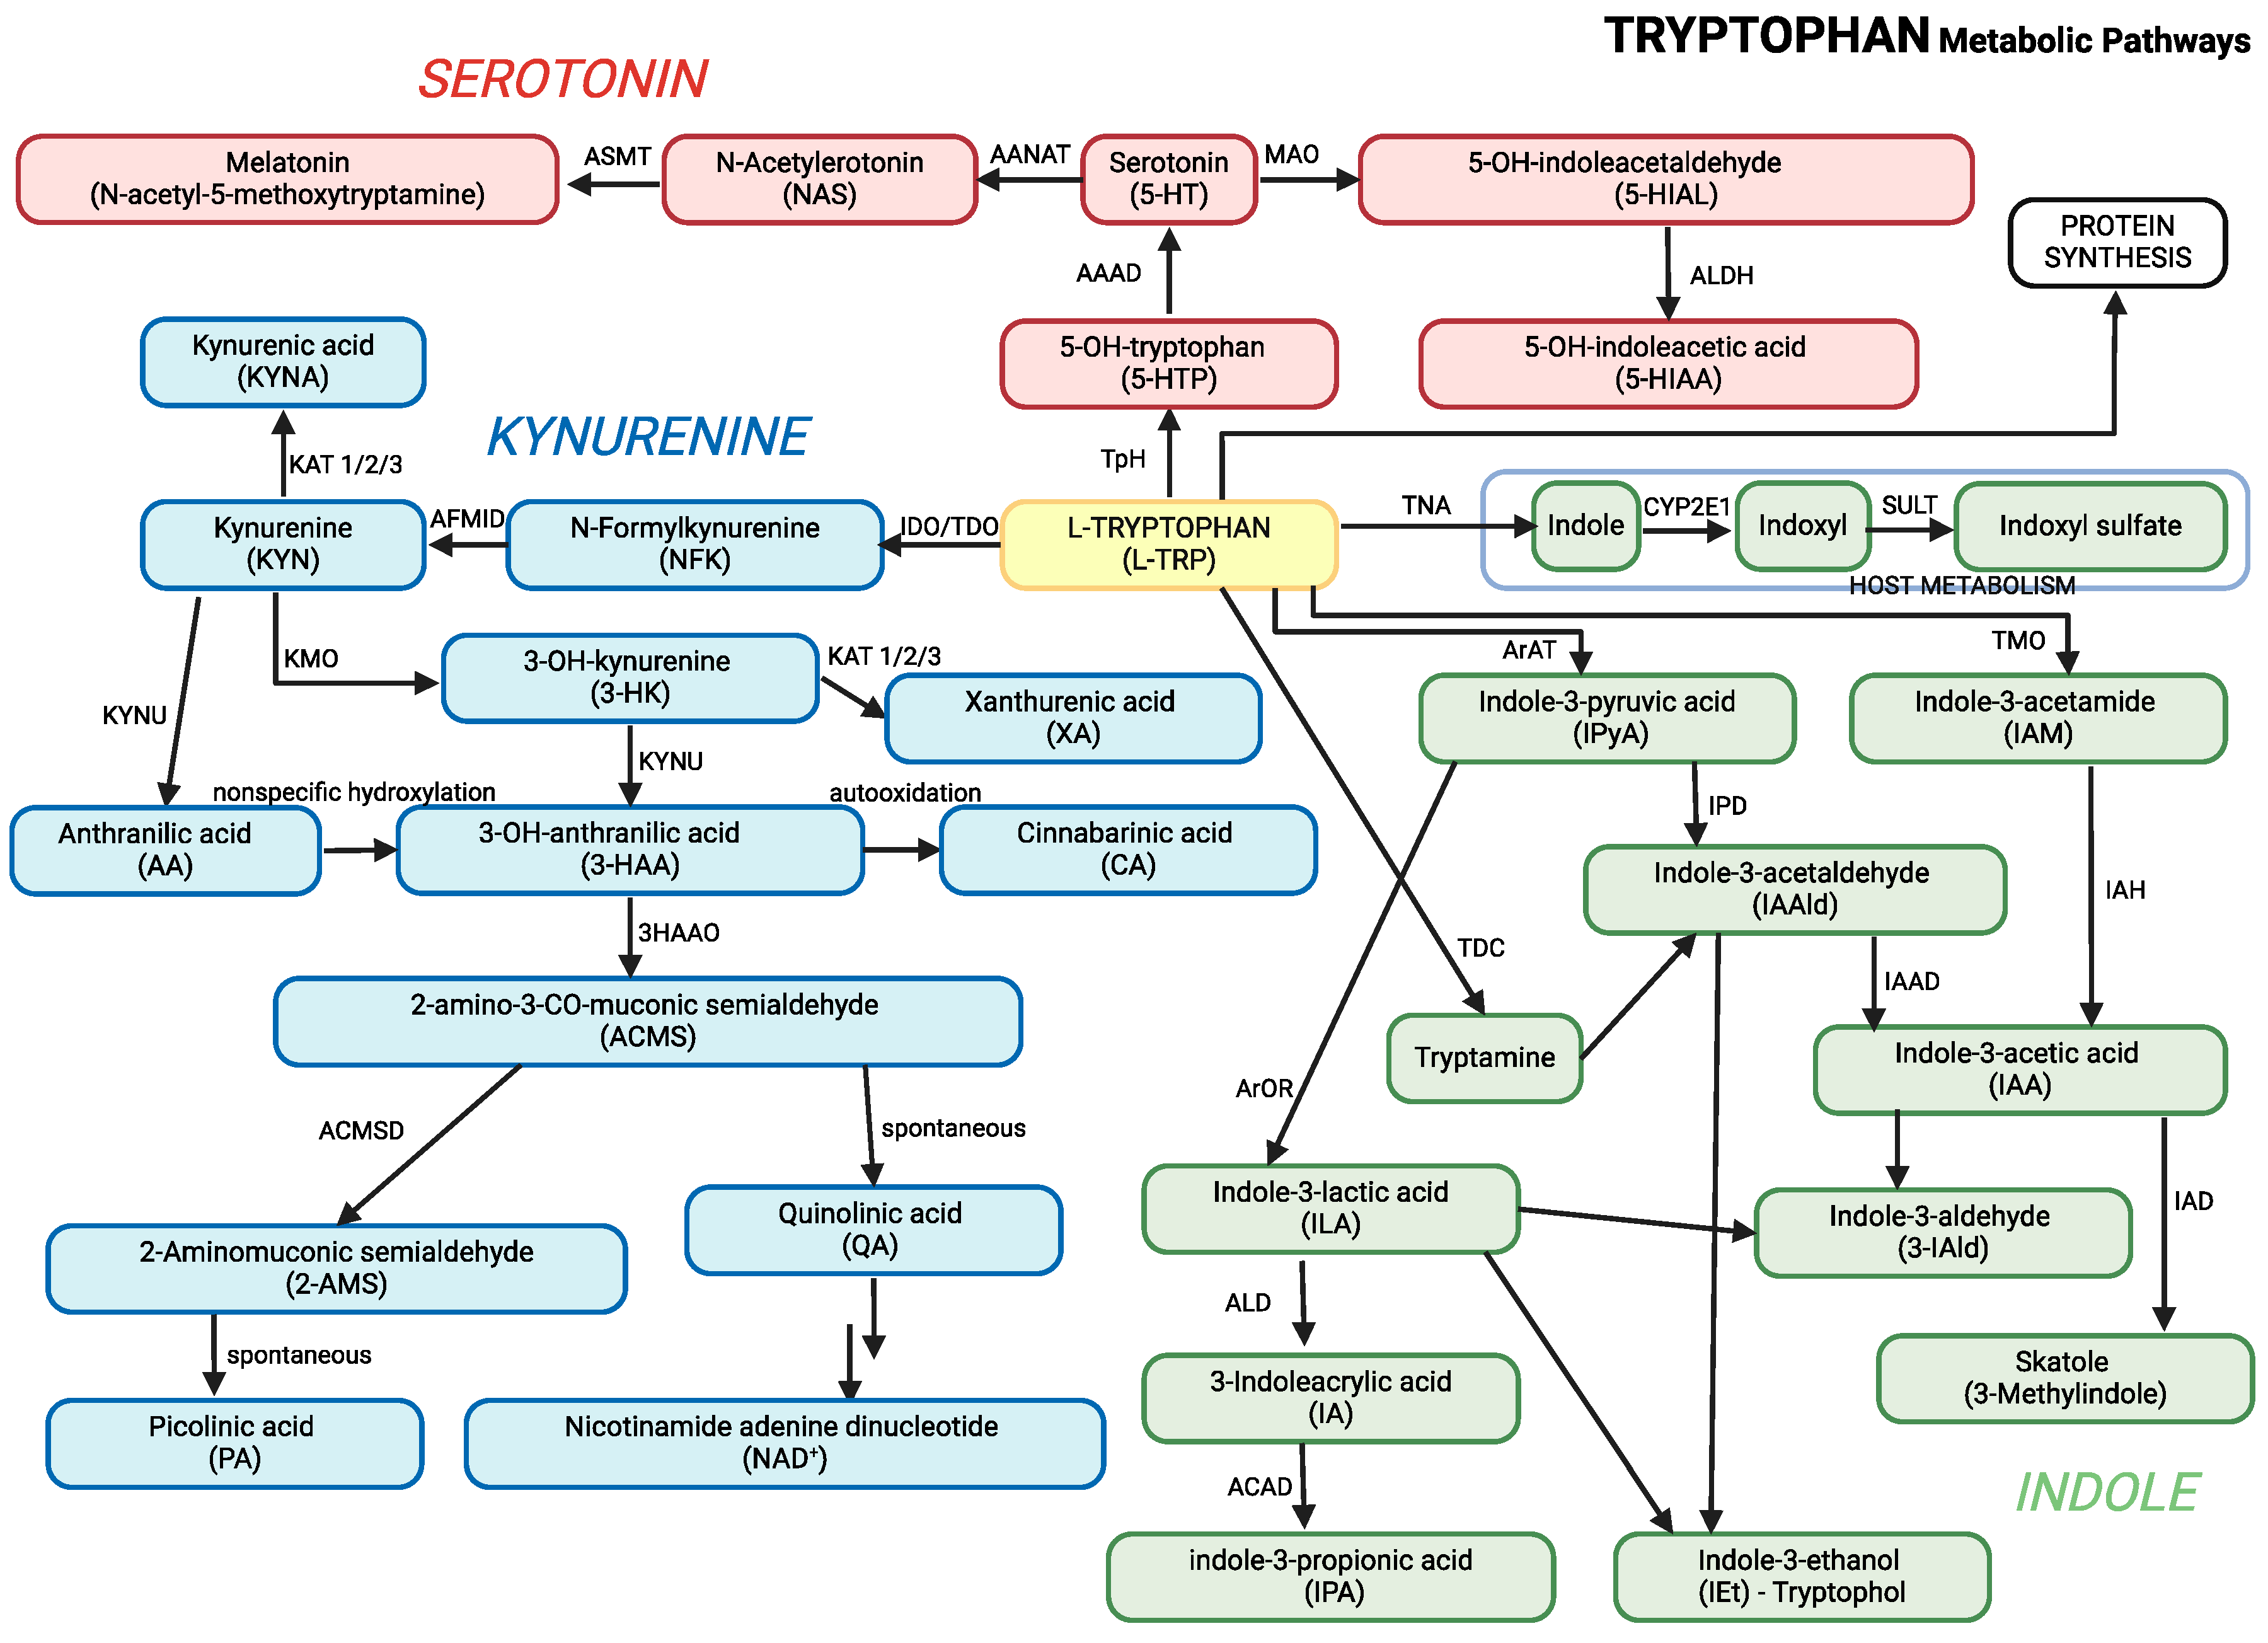
Figure 3 displays the findings of the CARS evaluations completed by the children's parents/guardians in cooperation with a psychologist for the group of children with ASD in comparison to siblings as a control group. The healthy group's median score was 15.25, whereas the ASD group's was 36.00.
For every parameter, we calculated the correlation between the outcomes. Graphical correlations with tryptophan and kynurenine are displayed. While the association for tryptophan is statistically significant, the correlation for kynurenine is not (
Figure 4 and
Figure 5).
The data for the remaining parameters can be found in the Supplementary file - data.
Other relationships mainly did not achieve statistical significance despite the trends that were seen; this could be because of sample size restrictions, data variability, or possible confounding variables.
Metabolite concentration ratios were calculated, comparing the children in the control group and the ASD group.
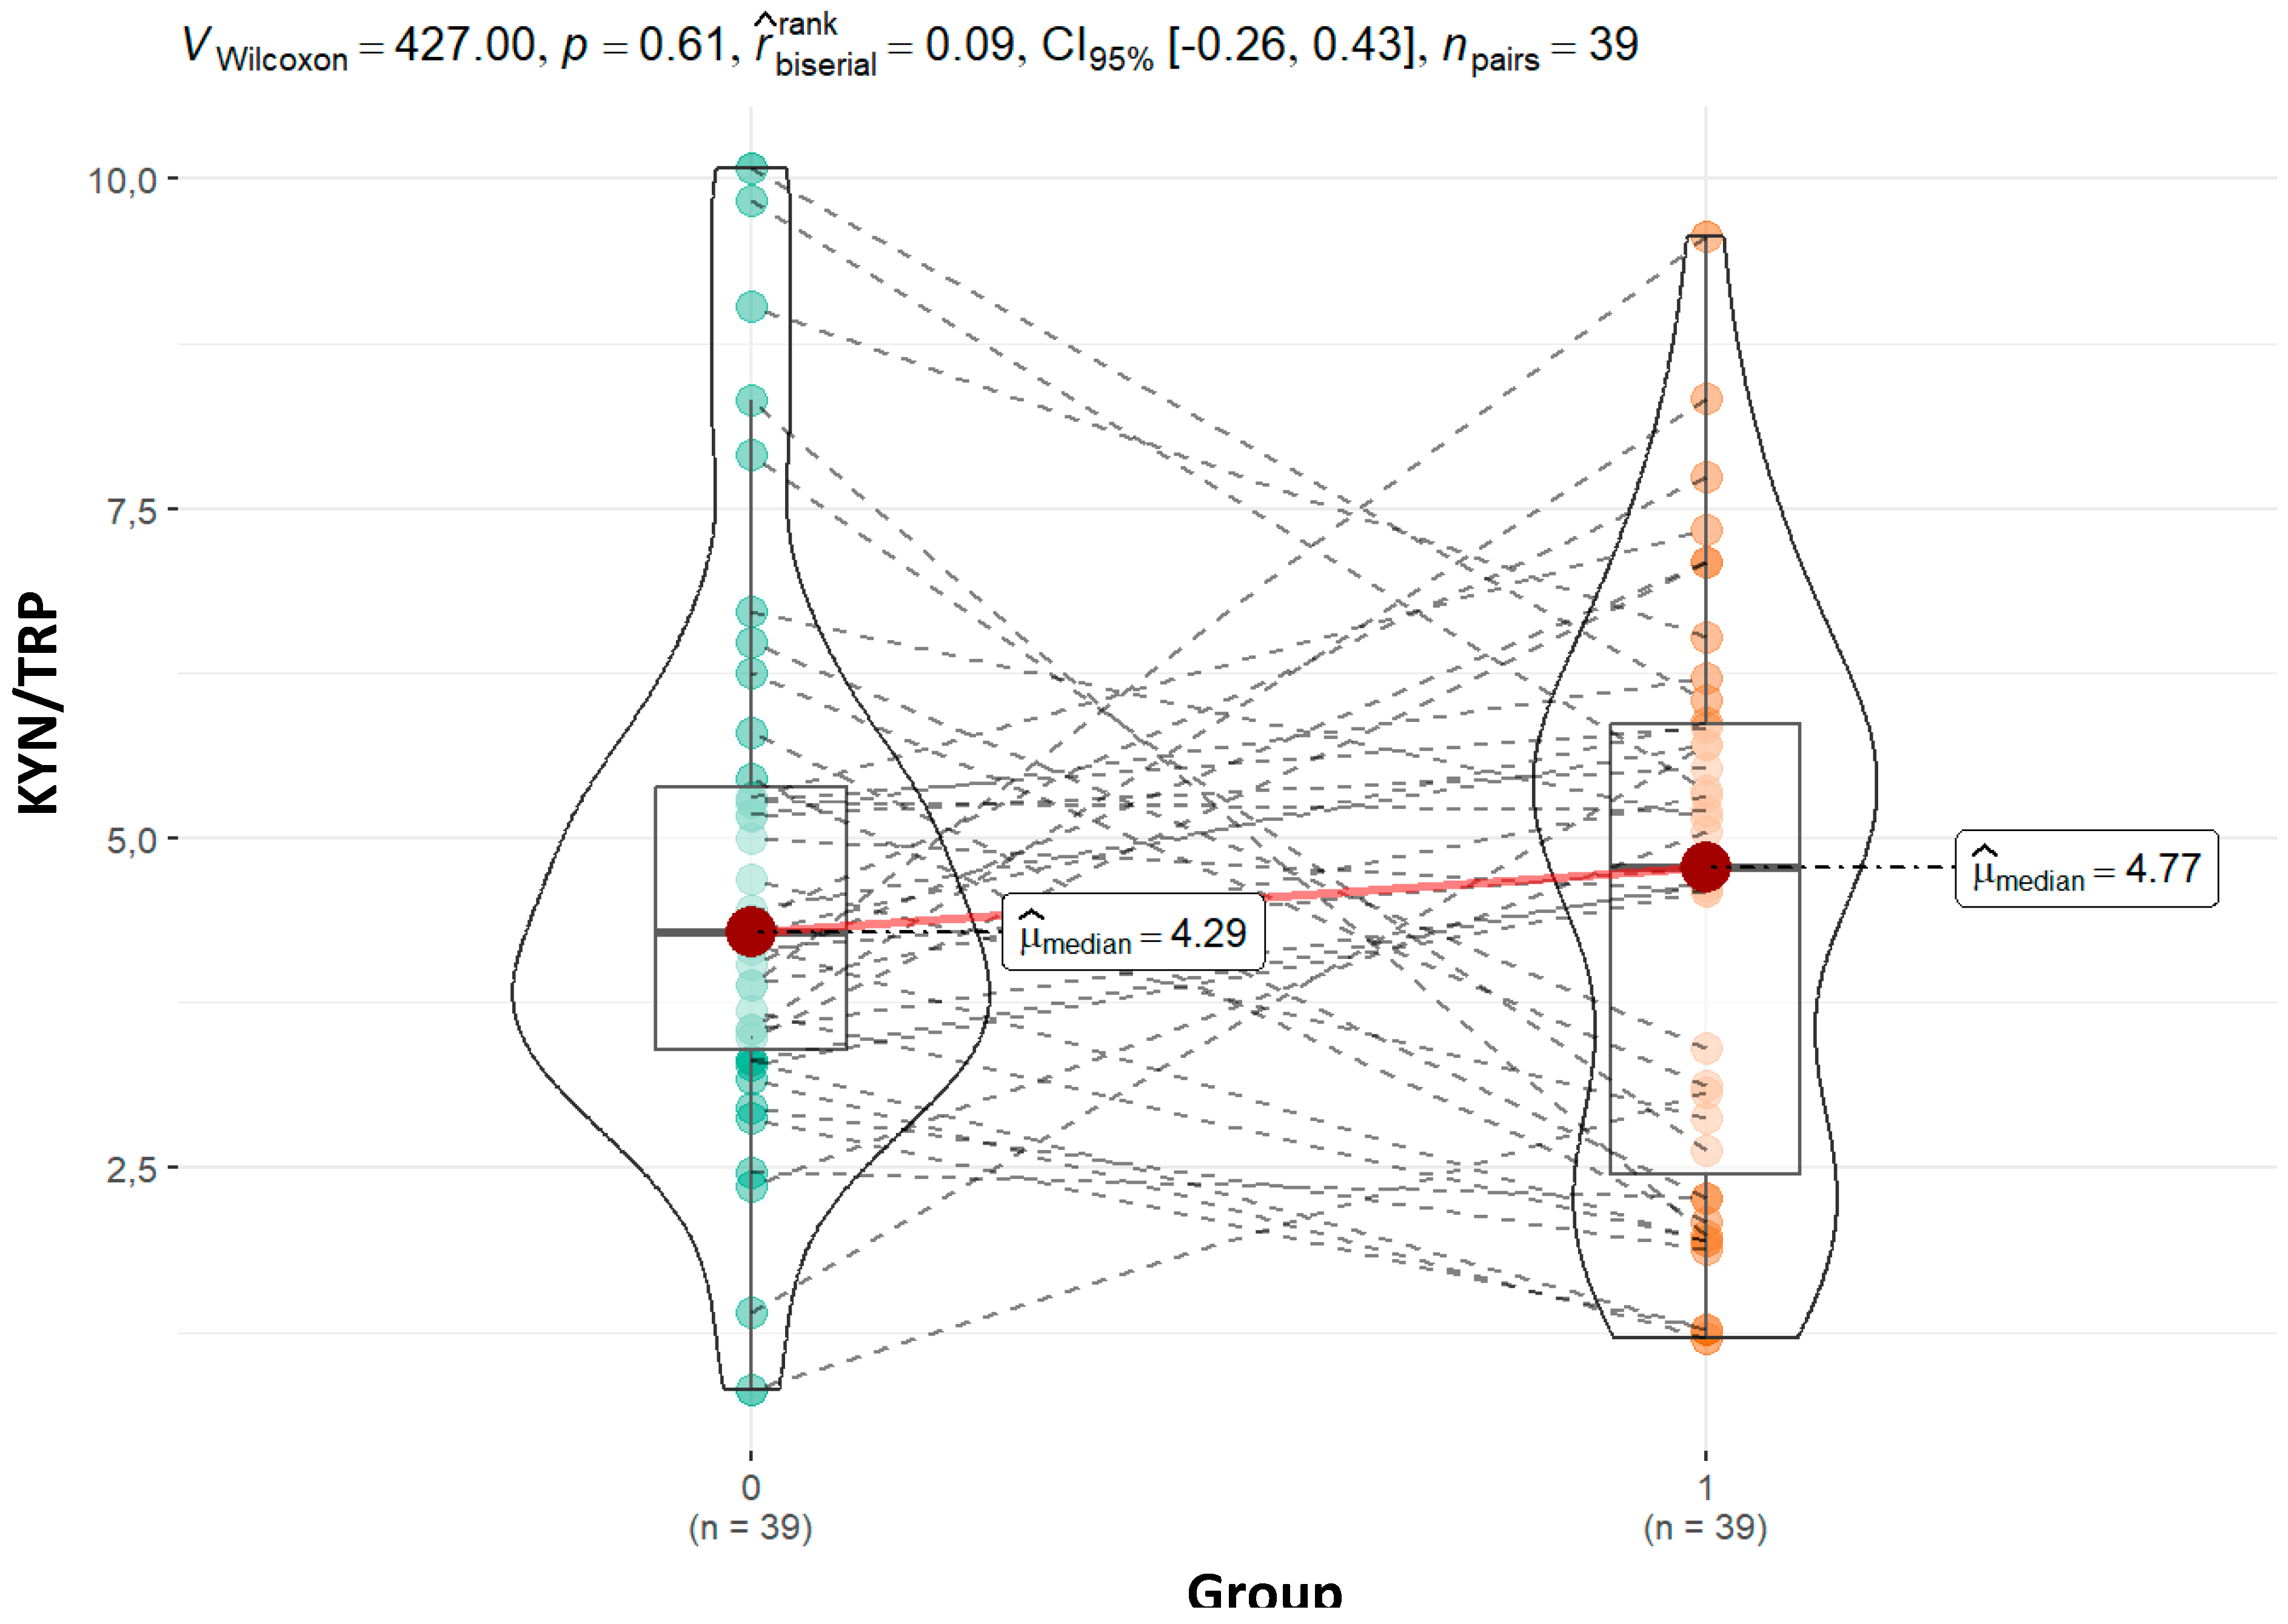
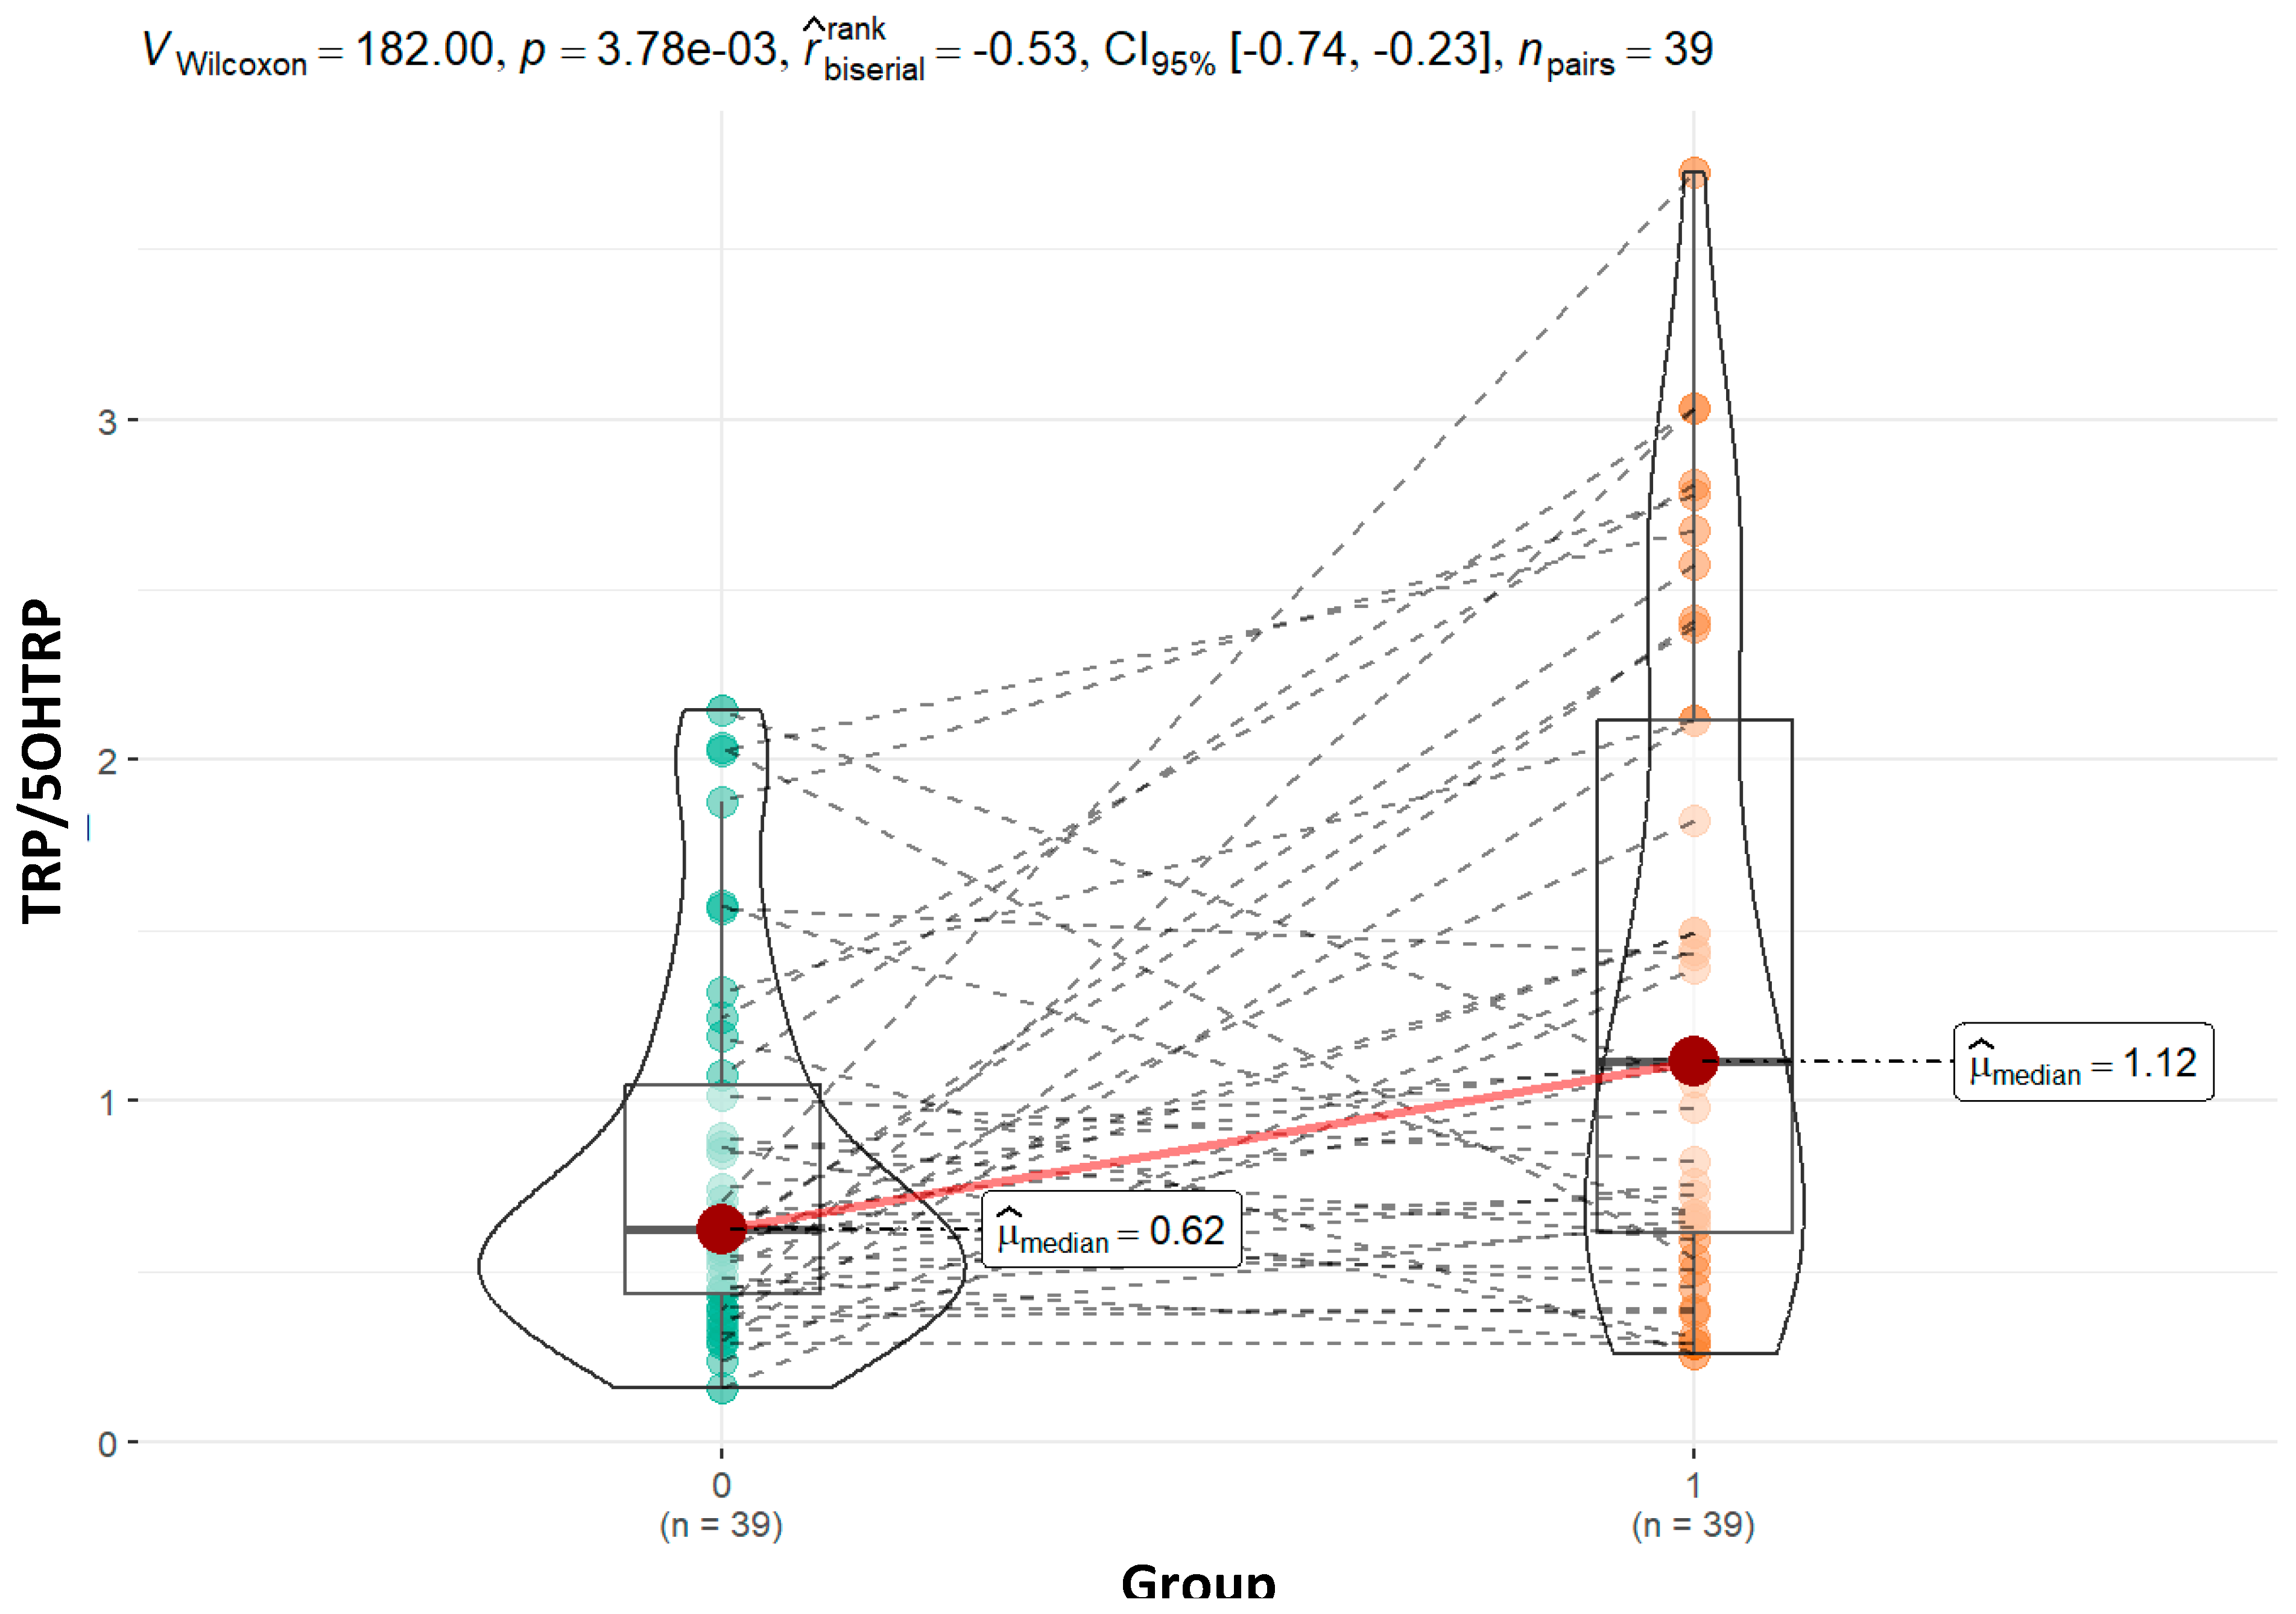
The ratios of tryptophan to 5OHTRP and kynurenin to tryptophan are displayed in the text (
Figure 6 and
Figure 7). The
Supplementary file - data contains additional graphical presentations.
Discussion
The metabolic pathways of tryptophan are complex and involve both endogenous (host-microbial) and exogenous (dietary) components. Potential disturbances in these pathways are indicated by variations in metabolite levels and ratios.
Studies suggest that in less severe cases, compensatory mechanisms involving serotonin or kynurenine metabolism may initially be more active, whereas in more severe cases, chronic neuroinflammation and oxidative stress dominate, leading to a plateau in enzymatic activity (Frye et al., 2016; Masi et al., 2017). Different patterns of behavior of the median values are seen for the remaining metabolites, but the changes are not statistically significant (
Table 4).
Elevated kynurenine levels may indicate enhanced indoleamine 2,3-dioxygenase (IDO) activity, triggered by pro-inflammatory cytokines, a mechanism frequently seen in ASD (Frye et al., 2016). These trends highlight the importance of kynurenine pathway dysregulation in ASD pathology, despite the lack of statistical significance in these particular comparisons. Further studies with larger cohorts may help clarify this association.
In particular, metabolite concentrations increase in tandem with rising CARS scores, may indicate increased enzymatic activity, suggesting more severe ASD symptoms. Enzymes like indoleamine 2,3-dioxygenase (IDO), which routes tryptophan metabolism into the kynurenine pathway, and tryptophan decarboxylase, which changes tryptophan into tryptamine, may be responsible for this. Research has shown that inflammation and neurological abnormalities in ASD are correlated with increased kynurenine pathway activity (Badawy, 2017; Masi et al., 2017). These changes may reflect adaptive responses in tryptophan metabolism depending on the severity of the disorder, as higher activity could exacerbate neurotoxic effects in more severely affected individuals. These findings suggest that tryptophan decarboxylase activity may vary depending on the severity of ASD. Further studies are needed to clarify these enzyme dynamics and their implications for ASD pathophysiology..
Explanation of Ratios of Our Metabolomic Study Presented in Table 5
The KYN/TRP (kynurenine/tryptophan) ratio is a widely recognized marker of tryptophan metabolism and immune activation, as elevated kynurenine levels are often triggered by inflammation-induced indoleamine 2,3-dioxygenase (IDO) activity (Frye et al., 2016). In our study, the KYN/TRP ratio was nonsignificantly higher in ASD group (4.21 vs. 4.67; p = 0.96). Although the difference was not statistically significant, this trend aligns with prior studies reporting increased kynurenine pathway activation in ASD (Gevi et al. 2016). Therefore, our findings are consistent with the general pattern observed in ASD research, even though the lack of statistical significance limits the strength of this conclusion. Similarly, the ratio remained stable in the moderate group (4.21 vs. 4.60; p = 0.647) but increased slightly more in the severe group (4.21 vs. 5.53; p = 0.27). Although these changes are not statistically significant, the higher ratio in the severe group could indicate heightened immune activation and neuroinflammation, which has been linked to greater severity of ASD symptoms (Masi et al., 2017). The KYN/TRP ratio’s rise with increasing severity may point to an inflammation-driven shift in tryptophan metabolism toward the kynurenine pathway, reinforcing the role of immune dysregulation in ASD pathology.
The significantly higher tryptophan to 5-hydroxytryptophan (5-HTP) ratio in our ASD group (0.62 vs 1.06; p = 0.01) may suggests reduced tryptophan hydroxylase activity, leading to reduced 5-HTP concentrations (19.13 vs. 22.79; p = 0.15), and potentially resulting in lower serotonin synthesis, a finding consistent with prior research indicating serotonin dysregulation in ASD (Adams et al., 2011; Frye et al., 2016). Although not statistically significant, the tryptophan to 5-HTP ratio is slightly higher in the moderate subgroup (0.69 vs. 0.62; p = 0.68) and shows a statistically significant increase in the severe group (01.83 vs. 0.62; p = 0.001). This trend aligns with the broader hypothesis that serotonin synthesis deficits contribute to ASD-related behaviors, particularly in individuals with more severe forms of the disorder (Masi et al., 2017). The pattern of 5-hydroxytryptophan (5-HTP) concentrations has different trend, with non significant higher values in the control group compared to the moderate (22.21 vs. 21.52; p = 0.40), while significant difference in severe ASD group (22.21 vs. 12.46; p = 0.01). This decreasing trend in 5-HTP concentrations with increasing severity suggests a more pronounced disruption in the serotonin synthesis pathway as symptom severity worsens. Lower 5-HTP levels, particularly in severe cases, may reflect reduced tryptophan hydroxylase activity, a key enzyme that converts tryptophan to 5-HTP. Such deficits in serotonin synthesis are linked to behavioral and cognitive challenges in ASD, particularly those associated with mood and social interaction deficits (Adams et al., 2011; Frye et al., 2016). Marked decrease in 5-HTP concentrations in the severe group warrants further investigation to clarify the role of serotonin dysregulation in more severe forms of ASD.
The ratio of tryptophan to 5-methoxy-3-indolacetic acid (TRP-5MIAA) is significantly higher in the ASD group compared to controls (1.57 vs 1.10; p = 0.04), indicating a disruption in serotonin degradation pathways, as 5-MIAA is a major metabolite of serotonin. In the moderate group, this ratio is higher compared to controls (1.69 vs 1.10; p = 0.03), while it is not changed in the severe group (1.09 vs 1.10; p = 0.52). This suggests that in severe ASD cases, serotonin metabolism might be altered, leading to higher 5-MIAA levels in the severe group (16.73 vs 15.11; p = 0.637), and lower 5-MIAA levels in the moderate group (9.05 vs 15.11; p = 0.13), though not statistically significant (Frye et al., 2016). These results support the notion that serotonin metabolism disruptions play a role in ASD symptom severity.
Comparing the entire group yields slightly different findings than dividing our group of children into those with moderate disorder and those with severe disorder, and then adding a sibling to each group. We can still make some inferences even though there are only 16 examples in the group of children with a severe degree. The Supplementary file – data contains the comparison results for tryptophan and the various metabolites. In the group with moderate impairment, tryptophan differs from that of healthy siblings in an amount that is statistically significant (19.32 vs 16.13; p = 0.04), whereas in the group with severe impairment, the difference is statistically negligible (21.37 vs 19.95; 0.57).
We did not find a statistically significant difference for any of the other metabolites. However, we did find an almost significant difference for tryptamine, with an increase in moderate impairment (385.01 vs. 573.42; p = 0.07) and a decrease in children with severe impairment (251.39 vs. 134.39; p = 0.09). The changes in median values based on the severity of the form are displayed in
Table 6.
A less varied pattern of these ratios, which are shown in
Table 7, is obtained when we examine the computed ratios between particular metabolites.
In some cases we find significant variations between the two (↑↓,↓↑), the statuses are displayed in column (3–4) of Tables A and B in the Supplementary file - data.
Table 6 and
Table 7 illustrate the differences in metabolite and dimensional change patterns between mild and severe disorders. This indicates that moderate and severe diseases entail distinct pathways.
Conclusions
The metabolism of tryptophan is a complex process that involves multiple pathways and enzymes, and the balance between these pathways may play a role in various physiological and pathological conditions, including autism spectrum disorder (ASD). However, the proportion of each pathway in healthy individuals and individuals with ASD may vary depending on various factors such as age, sex, diet, and genetic background.
Our findings suggest that dysregulation of the kynurenine pathway and the resulting increase in kynurenine levels may be a common feature of ASD. However, our results show that the dysregulation of other tryptophan metabolites may also contribute to the pathophysiology of ASD and that further research is needed to fully understand the role of tryptophan metabolism in this disorder.
The most common way to express the results of studies investigating tryptophan metabolism in healthy individuals versus those with autism spectrum disorder (ASD) is through the use of ratios. Ratios are a useful way to compare the levels of different metabolites because they take into account variations in the total amount of tryptophan available for metabolism.
The most commonly used ratio in these studies is the KYN/TRP ratio, which is the ratio of kynurenine to tryptophan levels in blood, plasma, or urine. This ratio is thought to reflect the activity of the kynurenine pathway, which is one of the major pathways of tryptophan metabolism. In addition to the kynurenine/tryptophan (KYN/TRY) ratio, in our study other ratios involving tryptophan metabolites have been presented in urine samples from individuals with autism spectrum disorder (ASD).
We have to be aware that while ratios are a useful way to compare the levels of different metabolites, they do not provide information about the absolute levels of these metabolites. Therefore, it is important to interpret ratios in conjunction with absolute metabolite levels to gain a more complete understanding of the metabolic changes associated with ASD.
The following is crucial to our study: as a control group, we employed the siblings of a group of children with ASD. Given the sufficient number of participants in the group, any individual variations in parameters are likely to be captured and reflected in the overall findings. Nevertheless, the number of cases and the ability to interpret power decline when we split the group into individuals with mild and severe ASD.
Although the calculated ratios, like kynurenine:tryptophan and serotonin:tryptophan, are helpful markers of metabolic changes in tryptophan pathways, there is still a lack of research on how they might be directly applied to ASD. Because there are no defined baseline values for these ratios in children with ASD compared to healthy children, interpretation becomes more difficult. To put these findings in context, confirm their clinical value, and create normative data, more research is needed.
Our study underscores the need for comprehensive research into tryptophan metabolites and their ratios to establish reliable biomarkers for ASD. Future studies should aim to systematically measure a broader spectrum of tryptophan metabolites across larger cohorts, both in ASD and control groups, to better understand the role of these metabolic pathways and validate their clinical relevance.
Supplementary Materials
The following supporting information can be downloaded at the website of this paper posted on Preprints.org
References
- Adams, J. B., Johansen, L. J., Powell, L. D., Quig, D., & Rubin, R. A. (2011). Gastrointestinal flora and gastrointestinal status in children with autism--comparisons to typical children and correlation with autism severity. BMC Gastroenterology, 11. [CrossRef]
- Almulla, A. F., Thipakorn, Y., Tunvirachaisakul, C., & Maes, M. (2023). The tryptophan catabolite or kynurenine pathway in autism spectrum disorder; a systematic review and meta-analysis. Autism Research, 16(12), 2302–2315. [CrossRef]
- American Psychiatric Association. (2013). Diagnostic and Statistical Manual of Mental Disorders 5. American Psychiatric Association. [CrossRef]
- Badawy, A. A. B. (2017). Kynurenine Pathway of Tryptophan Metabolism: Regulatory and Functional Aspects. International Journal of Tryptophan Research : IJTR, 10(1). [CrossRef]
- Chang, H.-M., Klausen, C., & Leung, P. C. K. (2013). Antimüllerian hormone inhibits follicle-stimulating hormone-induced adenylyl cyclase activation, aromatase expression, and estradiol production in human granulosa-lutein cells. Fertility and Sterility, 100(2), 585-92.e1. [CrossRef]
- Chawla, N. V., Bowyer, K. W., Hall, L. O., & Kegelmeyer, W. P. (2002). SMOTE: Synthetic minority over-sampling technique. Journal of Artificial Intelligence Research. [CrossRef]
- Core, T. R. D. (2018). A Language and Environment for Statistical Computing. In R Foundation for Statistical Computing (Vol. 2).
- Daly, E., Tricklebank, M. D., & Wichers, R. (2019). Neurodevelopmental roles and the serotonin hypothesis of autism spectrum disorder. The Serotonin System: History, Neuropharmacology, and Pathology, 23–44. [CrossRef]
- Esposito, D., Cruciani, G., Zaccaro, L., Di Carlo, E., Spitoni, G. F., Manti, F., Carducci, C., Fiori, E., Leuzzi, V., & Pascucci, T. (2024). A Systematic Review on Autism and Hyperserotonemia: State-of-the-Art, Limitations, and Future Directions. Brain Sciences, 14(5), 481. [CrossRef]
- Ethan, A., Atkinson, E., Dougherty, G., Lennon, R., Hanson, A., Goergen, K., Lundt, E., Broderick, B., Mccullough, M., & Heinzen, M. E. (2022). Package ‘ arsenal ’ R topics documented : 1.
- Frye, R. E., Casanova, M. F., Fatemi, S. H., Folsom, T. D., Reutiman, T. J., Brown, G. L., Edelson, S. M., Slattery, J. C., & Adams, J. B. (2016). Neuropathological mechanisms of seizures in autism spectrum disorder. Frontiers in Neuroscience, 10(MAY), 198043. [CrossRef]
- Gabriele, S., Sacco, R., & Persico, A. M. (2014). Blood serotonin levels in autism spectrum disorder: A systematic review and meta-analysis. European Neuropsychopharmacology, 24(6), 919–929. [CrossRef]
- Gevi, F., Zolla, L., Gabriele, S., & Persico, A. M. (2016). Urinary metabolomics of young Italian autistic children supports abnormal tryptophan and purine metabolism. Molecular Autism, 7, 47. [CrossRef]
- Hou, Y., Li, J., & Ying, S. (2023). Tryptophan Metabolism and Gut Microbiota: A Novel Regulatory Axis Integrating the Microbiome, Immunity, and Cancer. Metabolites, 13(11). [CrossRef]
- Kałużna-Czaplińska, J., Gątarek, P., Chirumbolo, S., Chartrand, M. S., & Bjørklund, G. (2019). How important is tryptophan in human health? Critical Reviews in Food Science and Nutrition, 59(1), 72–88. [CrossRef]
- Labus, J. S., Hollister, E. B., Jacobs, J., Kirbach, K., Oezguen, N., Gupta, A., Acosta, J., Luna, R. A., Aagaard, K., Versalovic, J., Savidge, T., Hsiao, E., Tillisch, K., & Mayer, E. A. (2017). Differences in gut microbial composition correlate with regional brain volumes in irritable bowel syndrome. Microbiome, 5(1), 1–17. [CrossRef]
- Likhitweerawong, N., Thonusin, C., Boonchooduang, N., Louthrenoo, O., Nookaew, I., Chattipakorn, N., & Chattipakorn, S. C. (2021). Profiles of urine and blood metabolomics in autism spectrum disorders. Metabolic Brain Disease, 36(7), 1641–1671. [CrossRef]
- Liu, A., Zhou, W., Qu, L., He, F., Wang, H., Wang, Y., Cai, C., Li, X., Zhou, W., & Wang, M. (2019). Altered Urinary Amino Acids in Children With Autism Spectrum Disorders. Frontiers in Cellular Neuroscience, 13. [CrossRef]
- Masi, A., Breen, E. J., Alvares, G. A., Glozier, N., Hickie, I. B., Hunt, A., Hui, J., Beilby, J., Ravine, D., Wray, J., Whitehouse, A. J. O., & Guastella, A. J. (2017). Cytokine levels and associations with symptom severity in male and female children with autism spectrum disorder. Molecular Autism, 8(1), 1–11. [CrossRef]
- Morton, J. T., Jin, D. M., Mills, R. H., Shao, Y., Rahman, G., McDonald, D., Zhu, Q., Balaban, M., Jiang, Y., Cantrell, K., Gonzalez, A., Carmel, J., Frankiensztajn, L. M., Martin-Brevet, S., Berding, K., Needham, B. D., Zurita, M. F., David, M., Averina, O. V., … Taroncher-Oldenburg, G. (2023). Multi-level analysis of the gut–brain axis shows autism spectrum disorder-associated molecular and microbial profiles. Nature Neuroscience 2023 26:7, 26(7), 1208–1217. [CrossRef]
- Mughal, S., Faizy, R. M., & Saadabadi, A. (2022). Autism Spectrum Disorder. StatPearls. https://www.ncbi.nlm.nih.gov/books/NBK525976/.
- Muller, C. L., Anacker, A. M. J., & Veenstra-VanderWeele, J. (2016). The serotonin system in autism spectrum disorder: From biomarker to animal models. Neuroscience, 321, 24–41. [CrossRef]
- Osredkar, J., Gosar, D., Maček, J., Kumer, K., Fabjan, T., Finderle, P., Šterpin, S., Zupan, M., & Vrhovšek, M. J. (2019). Urinary markers of oxidative stress in children with autism spectrum disorder (ASD). Antioxidants, 8(6). [CrossRef]
- Oxenkrug, G. F. (2010). Tryptophan–Kynurenine Metabolism as a Common Mediator of Genetic and Environmental Impacts in Major Depressive Disorder: The Serotonin Hypothesis Revisited 40 Years Later. The Israel Journal of Psychiatry and Related Sciences, 47(1), 56. /pmc/articles/PMC3021918/.
- Pavlova, T., Vidova, V., Bienertova-Vasku, J., Janku, P., Almasi, M., Klanova, J., & Spacil, Z. (2017). Urinary intermediates of tryptophan as indicators of the gut microbial metabolism. Analytica Chimica Acta, 987, 72–80. [CrossRef]
- R Core Team. (2018). R: The R Project for Statistical Computing. https://www.r-project.org/.
- Raghavan, R., Anand, N. S., Wang, G., Hong, X., Pearson, C., Zuckerman, B., Xie, H., & Wang, X. (2022). Association between cord blood metabolites in tryptophan pathway and childhood risk of autism spectrum disorder and attention-deficit hyperactivity disorder. Translational Psychiatry, 12(1). [CrossRef]
- Reuter, M., Zamoscik, V., Plieger, T., Bravo, R., Ugartemendia, L., Rodriguez, A. B., & Kirsch, P. (2021). Tryptophan-rich diet is negatively associated with depression and positively linked to social cognition. Nutrition Research, 85, 14–20. [CrossRef]
- Roager, H. M., & Licht, T. R. (2018). Microbial tryptophan catabolites in health and disease. Nature Communications, 9(1), 1–10. [CrossRef]
- Rossignol, D. A., & Frye, R. E. (2012). A review of research trends in physiological abnormalities in autism spectrum disorders: immune dysregulation, inflammation, oxidative stress, mitochondrial dysfunction and environmental toxicant exposures. Molecular Psychiatry, 17(4), 389–401. [CrossRef]
- Santana-Coelho, D. (2024). Does the kynurenine pathway play a pathogenic role in autism spectrum disorder? Brain, Behavior, & Immunity - Health, 40, 100839. [CrossRef]
- Schopler, E., Reichler, R. J., DeVellis, R. F., & Daly, K. (1980). Toward objective classification of childhood autism: Childhood Autism Rating Scale (CARS). Journal of Autism and Developmental Disorders, 10(1), 91–103. [CrossRef]
- Strandwitz, P. (2018). Neurotransmitter modulation by the gut microbiota. Brain Research, 1693, 128–133. [CrossRef]
- Strati, F., Cavalieri, D., Albanese, D., De Felice, C., Donati, C., Hayek, J., Jousson, O., Leoncini, S., Renzi, D., Calabrò, A., & De Filippo, C. (2017). New evidences on the altered gut microbiota in autism spectrum disorders. Microbiome, 5(1). [CrossRef]
- Taurines, R., Schwenck, C., Westerwald, E., Sachse, M., Siniatchkin, M., & Freitag, C. (2012). ADHD and autism: differential diagnosis or overlapping traits? A selective review. ADHD Attention Deficit and Hyperactivity Disorders 2012 4:3, 4(3), 115–139. [CrossRef]
- Vovk-Ornik, N. (2015). Kriteriji za opredelitev vrste in stopnje primanjkljajev, ovir oz. motenj otrok s posebnimi potrebami. In Zavod RS za šolstvo (Issue 2).
- Wickham, H., Averick, M., Bryan, J., Chang, W., McGowan, L., François, R., Grolemund, G., Hayes, A., Henry, L., Hester, J., Kuhn, M., Pedersen, T., Miller, E., Bache, S., Müller, K., Ooms, J., Robinson, D., Seidel, D., Spinu, V., … Yutani, H. (2019). Welcome to the Tidyverse. Journal of Open Source Software, 4(43), 1686. [CrossRef]
- Xiong, X., Liu, D., Wang, Y., Zeng, T., & Peng, Y. (2016). Urinary 3-(3-Hydroxyphenyl)-3-hydroxypropionic Acid, 3-Hydroxyphenylacetic Acid, and 3-Hydroxyhippuric Acid Are Elevated in Children with Autism Spectrum Disorders. BioMed Research International, 2016. [CrossRef]
- Xue, C., Li, G., Zheng, Q., Gu, X., Shi, Q., Su, Y., Chu, Q., Yuan, X., Bao, Z., Lu, J., & Li, L. (2023). Tryptophan metabolism in health and disease. Cell Metabolism, 35(8), 1304–1326. [CrossRef]
- Yap, I. K. S., Angley, M., Veselkov, K. A., Holmes, E., Lindon, J. C., & Nicholson, J. K. (2010). Urinary metabolic phenotyping differentiates children with autism from their unaffected siblings and age-matched controls. Journal of Proteome Research, 9(6), 2996–3004. [CrossRef]
Figure 1.
Main pathways of tryptophan metabolism. 3-HAAO: 3-Hydroxyanthranilic acid 3,4-dioxygenase, AAAD: Aromatic Amino Acid Decarboxylase, AANAT: Aralkylamine N-Acetyltransferase, ACD: Acyl-CoA dehydrogenase, ACMSD: 2-amino-3-carboxymuconate-6-semialdehyde decarboxylase, AFMID - Kynurenine formamidase, ALD: (R)-3-(aryl)lactoyl-CoA dehydratase, ALDH: Aldehyde dehydrogenase, ArAT: Aromatic amino acid aminotransferase, ArOR: Aromatic 2-oxoacid reductase, ASMT: Acetylserotonin O-Methyltransferase, CYP2E1: Cytochrome P450 2E1, IAH: Indolacetamide hydrolase, IAAD: Indoleacetaldehyde oxidase, IAD: Indoleacetate decarboxylase, IDO: Indoleamine 2,3-Dioxygenase, IPD: Indolepyruvic decarboxylase, KAT: Kynurenine aminotransferases 1/2/3, KMO: Kynurenine 3-Monooxygenase, KYNU: Kynureninase, MAO: Monoamine Oxydase, SULT: Sulfotransferase, TDO: Tryptophan 2,3-Dioxygenase, TMO: Tryptophan 2-Monooxygenase, TNA: Tryptophanase, TpH: Tryptophan Hydroxylase, TDC: Tryptophan Decarboxylase.
Figure 3.
CARS scores for a group of children with ASD compared to siblings as a control group.
Figure 3.
CARS scores for a group of children with ASD compared to siblings as a control group.
Figure 4.
Graphical presentation of the results for urinary tryptophan. Median values and calculated p value are presented for both groups.
Figure 4.
Graphical presentation of the results for urinary tryptophan. Median values and calculated p value are presented for both groups.
Figure 5.
Graphical presentation of the results for urinary kynurenine. Median values and calculated p value are presented for both groups.
Figure 5.
Graphical presentation of the results for urinary kynurenine. Median values and calculated p value are presented for both groups.
Figure 6.
Graphical presentation of the results for urinary kynurenine to tryptohan ratio. Median values and calculated p value are presented for both groups.
Figure 6.
Graphical presentation of the results for urinary kynurenine to tryptohan ratio. Median values and calculated p value are presented for both groups.
Figure 7.
Graphical presentation of the results for urinary tryptophan to 5-OH-tryptamine ratio. Median values and calculated p value are presented for both groups.
Figure 7.
Graphical presentation of the results for urinary tryptophan to 5-OH-tryptamine ratio. Median values and calculated p value are presented for both groups.
Table 1.
Key Metabolite Pathways.
Table 1.
Key Metabolite Pathways.
| Pathway |
Key Enzymes |
Key Metabolites |
Function |
Relevance to ASD |
| Kynurenine Pathway |
Tryptophan 2,3-Dioxygenase (TDO), Indoleamine 2,3-Dioxygenase (IDO) |
- Kynurenine
- Kynurenic Acid
- Quinolinic Acid |
- Neuroactive metabolites, immune regulation, neuroinflammation |
Increased kynurenine and quinolinic acid lead to neuroinflammation and oxidative stress, contributing to ASD symptoms (Santana-Coelho, 2024). |
| Serotonin Pathway |
Tryptophan Hydroxylase |
- Serotonin (5-HT)
- 5-Hydroxyindoleacetic Acid (5-HIAA) |
- Mood regulation, behavior, sleep |
Lower serotonin levels and decreased 5-HIAA/serotonin ratios in ASD contribute to mood and behavioral issues (Chang et al., 2013; Daly et al., 2019; Gabriele et al., 2014; Muller et al., 2016) |
| Indole Pathway |
Gut Microbiota |
- Indole-3-Acetic Acid (IAA)
- Indole-3-Lactic Acid (ILA)
- Indole-3-Propionic Acid (IPA) |
- Gut health, antioxidant properties, immune modulation |
Altered gut microbiota in ASD affects indole production, impacting gut-brain interactions and neurodevelopment (Morton et al., 2023). |
Table 2.
Some commonly calculated ratios and their relevance to ASD.
Table 2.
Some commonly calculated ratios and their relevance to ASD.
| Ratio |
Description |
Relevance to ASD |
References |
| KYN/TRP (Kynurenine/Tryptophan) |
Reflects the activity of the kynurenine pathway. |
Elevated KYN/TRP ratios in ASD suggest increased kynurenine pathway activity, linked to neuroinflammation. |
(Gevi et al., 2016; Rossignol & Frye, 2012) |
| IAA/TRP (Indole-3-Acetic Acid/Tryptophan) |
Indicates the activity of the indole pathway. |
Reduced indole derivatives in ASD reflect gut microbiota alterations, affecting gut-brain axis signaling. |
(Strati et al., 2017) |
| 5-HIAA/5-HTP (5-Hydroxyindoleacetic Acid/5-Hydroxytryptophan) |
Reflects serotonin turnover and synthesis efficiency. |
Decreased serotonin turnover in ASD is linked to behavioral and mood disturbances. |
(Adams et al., 2011) |
| IPA/TRP (Indole-3-Propionic Acid/Tryptophan) |
Reflects antioxidant production via the gut microbiota. |
Decreased IPA in ASD indicates reduced antioxidant defense and gut dysbiosis. |
(Strati et al., 2017) |
| TRPN/TRP |
Reflects serotonin and melatonin precursor production. |
Lower tryptamine levels in ASD suggest impaired serotonin and melatonin synthesis. |
(Likhitweerawong et al., 2021) |
Table 4.
Tryptophan metabolites in the urine of the control group (1) and the ASD group (2), a group wth CARS up to 36 (3) and with CARS > 36.5 (4), along with p values; all values are in nM/mmol of creatinine.
Table 4.
Tryptophan metabolites in the urine of the control group (1) and the ASD group (2), a group wth CARS up to 36 (3) and with CARS > 36.5 (4), along with p values; all values are in nM/mmol of creatinine.
| Metabolite |
Control (N=44) |
ASD (N=44) |
CARS<36 (N=28) |
CARS>36.5 (N=15) |
p value |
| |
1 |
2 |
3 |
4 |
1-2 |
1-3 |
1-4 |
3-4 |
|
Tryptophan - TRP
|
|
|
|
|
0.04 |
0.06 |
0.09 |
0.74 |
|
Mean (SD)
|
18.20 (8.17) |
22.30 (8.53) |
22.96 (9.51) |
21.74 (6.52) |
|
|
|
|
|
Median (Q1, Q3)
|
16.91
(11.97, 23.63) |
19.94
(16.99, 28.36) |
19.81 (16.16, 33.22) |
21.37 (19.29, 25.67) |
|
|
|
|
|
Min - Max
|
6.03 - 38.83 |
7.38 - 39.65 |
9.07 - 39.65 |
7.38 - 31.30 |
|
|
|
|
|
Anthranilate - ATA
|
|
|
|
|
0.99 |
0.50 |
0.22 |
0.40 |
|
Mean (SD)
|
21.21 (9.43) |
21.09 (10.78) |
23.78 (13.10) |
17.34 (7.61) |
|
|
|
|
|
Median (Q1, Q3)
|
21.44 (14.95, 25.43) |
19.86 (13.90, 28.61) |
20.55 (13.97, 32.92) |
19.29 (10.24, 21.16) |
|
|
|
|
|
Min - Max
|
5.52 - 50.67 |
4.52 - 50.73 |
5.04 - 53.00 |
4.52 - 29.51 |
|
|
|
|
|
Indole-3-acetic acid - IAA
|
|
|
|
|
0.78 |
0.75 |
0.74 |
0.83 |
|
Mean (SD)
|
1.79 (1.48) |
1.86 (1.37) |
1.97 (1.49) |
1.57 (1.07) |
|
|
|
|
|
Median (Q1, Q3)
|
1.32 (0.70, 2.28) |
1.67 (0.88, 2.61) |
1.68 (0.83, 2.76) |
1.18 (0.88, 2.37) |
|
|
|
|
|
Min - Max
|
0.11 - 5.84 |
0.20 - 5.80 |
0.20 - 5.80 |
0.22 - 3.53 |
|
|
|
|
|
Indole-3-aldehyde - IALD
|
|
|
|
|
0.10 |
0.45 |
0.19 |
0.50 |
|
Mean (SD)
|
200.29 (119.30) |
165.20 (83.91) |
172.01 (88.14) |
152.50 (76.64) |
|
|
|
|
|
Median (Q1, Q3)
|
174.38 (102.35, 287.53) |
147.13 (104.24, 223.62) |
147.13 (111.80, 226.26) |
134.39 (91.37, 188.69) |
|
|
|
|
|
Min - Max
|
17.43 - 455.15 |
30.44 - 358.36 |
30.44 - 358.36 |
62.03 - 313.85 |
|
|
|
|
|
Indole-3-acetamide - IAM
|
|
|
|
|
1.00 |
0.91 |
0.96 |
0.78 |
|
Mean (SD)
|
61.77 (37.16) |
61.78 (36.77) |
65.64 (41.31) |
57.77 (28.18) |
|
|
|
|
|
Median (Q1, Q3)
|
55.71 (31.43, 79.18) |
57.14 (30.33, 79.70) |
57.14 (32.71, 85.72) |
58.03 (32.09, 79.70) |
|
|
|
|
|
Min - Max
|
10.43 - 160.04 |
12.85 - 160.99 |
18.11 - 160.99 |
12.85 - 100.63 |
|
|
|
|
|
Indole-3-butyric acid - IBA*
|
|
|
|
|
0.98 |
0.89 |
0.57 |
0.95 |
|
Mean (SD)
|
20.13 (17.40) |
20.53 (18.82) |
21.76 (20.33) |
15.77 (13.97) |
|
|
|
|
|
Median (Q1, Q3)
|
17.20 (8.71, 23.79) |
12.97 (8.10, 33.69) |
12.51 (7.00, 37.91) |
12.21 (8.17, 18.71) |
|
|
|
|
|
Min - Max
|
0.81 - 75.60 |
0.03 - 68.17 |
0.03 - 68.17 |
0.40 - 44.33 |
|
|
|
|
|
Indole-3-lactic acid - ILA
|
|
|
|
|
0.53 |
0.19 |
0.47 |
0.96 |
|
Mean (SD)
|
1.08 (0.58) |
0.99 (0.58) |
0.94 (0.52) |
0.94 (0.51) |
|
|
|
|
|
Median (Q1, Q3)
|
1.01 (0.61, 1.40) |
0.75 (0.59, 1.13) |
0.74 (0.67, 1.02) |
0.83 (0.52, 1.40) |
|
|
|
|
|
Min - Max
|
0.18 - 2.41 |
0.27 - 2.67 |
0.28 - 2.39 |
0.27 - 1.80 |
|
|
|
|
|
Indole-3-propionic acid - IPA
|
|
|
|
|
0.27 |
0.35 |
0.16 |
0.94 |
|
Mean (SD)
|
5.13 (3.04) |
4.16 (3.11) |
4.40 (3.60) |
3.57 (1.28) |
|
|
|
|
|
Median (Q1, Q3)
|
4.53 (3.42, 6.86) |
3.16 (2.08, 5.15) |
3.64 (1.91, 5.54) |
3.16 (2.75, 4.50) |
|
|
|
|
|
Min - Max
|
0.20 - 13.98 |
0.00 - 13.11 |
0.00 - 13.11 |
1.27 - 5.71 |
|
|
|
|
|
Kynurenine - KYN
|
|
|
|
|
0.86 |
1.00 |
0.28 |
0.62 |
|
Mean (SD)
|
92.94 (61.63) |
99.77 (61.68) |
80.67 (45.97) |
99.77 (46.39) |
|
|
|
|
|
Median (Q1, Q3)
|
71.20 (48.30, 122.81) |
82.34 (54.76, 128.66) |
77.23 (47.82, 105.30) |
97.70 (64.36, 134.02) |
|
|
|
|
|
Min - Max
|
25.41 - 241.15 |
11.62 - 240.85 |
11.62 - 205.89 |
29.30 - 184.66 |
|
|
|
|
|
Methyl indole-3-acetate - MIA*
|
|
|
|
|
0.80 |
0.64 |
0.86 |
0.13 |
|
Mean (SD)
|
0.07 (0.04) |
0.08 (0.06) |
0.08 (0.05) |
0.06 (0.04) |
|
|
|
|
|
Median (Q1, Q3)
|
0.06 (0.04, 0.10) |
0.07 (0.04, 0.11) |
0.07 (0.03, 0.11) |
0.06 (0.04, 0.07) |
|
|
|
|
|
Min - Max
|
0.01 - 0.21 |
0.00 - 0.23 |
0.00 - 0.20 |
0.00 - 0.14 |
|
|
|
|
|
N-acetyl-tryptophan - NAcTRP
|
|
|
|
|
0.92 |
0.54 |
0.75 |
0.26 |
|
Mean (SD)
|
206.05 (118.34) |
200.64 (83.98) |
212.55 (87.76) |
178.41 (74.11) |
|
|
|
|
|
Median (Q1, Q3)
|
185.08 (95.68, 279.38) |
185.54 (149.26, 252.54) |
225.92 (159.52, 265.84) |
184.49 (112.53, 217.93) |
|
|
|
|
|
Min - Max
|
35.88 - 488.19 |
56.47 - 363.64 |
56.47 - 344.29 |
80.06 - 363.64 |
|
|
|
|
|
Tryptamine - TRPN
|
|
|
|
|
0.10 |
0.13 |
0.72 |
0.11 |
|
Mean (SD)
|
389.89 (209.89) |
456.33 (257.72) |
518.74 (278.95) |
365.38 (173.84) |
|
|
|
|
|
Median (Q1, Q3)
|
389.13 (246.22, 483.64) |
441.10 (230.08, 649.44) |
528.14 (281.69, 763.43) |
391.67 (238.62, 451.97) |
|
|
|
|
|
Min - Max
|
56.29 - 1041.14 |
63.19 - 1075.56 |
63.19 - 1075.56 |
125.02 - 653.10 |
|
|
|
|
|
5-hydroxyindoleacetic acid - 5HIAA
|
|
|
|
|
0.61 |
0.28 |
0.63 |
0.17 |
|
Mean (SD)
|
48.77 (27.63) |
50.76 (25.04) |
53.62 (23.03) |
44.82 (28.83) |
|
|
|
|
|
Median (Q1, Q3)
|
39.12 (31.35, 61.84) |
48.64 (31.03, 61.78) |
48.64 (33.60, 63.86) |
42.98 (23.75, 49.14) |
|
|
|
|
|
Min - Max
|
17.96 - 116.40 |
9.74 - 116.26 |
24.96 - 101.83 |
9.74 - 116.26 |
|
|
|
|
|
5-hydroxy-L-tryptophan - 5OHTRP
|
|
|
|
|
0.15 |
0.40 |
0.01 |
0.14 |
|
Mean (SD)
|
22.79 (12.56) |
19.13 (12.76) |
21.98 (14.30) |
14.24 (7.92) |
|
|
|
|
|
Median (Q1, Q3)
|
22.21 (11.71, 30.28) |
18.39 (10.09, 24.31) |
21.52 (12.10, 26.27) |
12.46 (9.79, 19.67) |
|
|
|
|
|
Min - Max
|
0.71 - 49.81 |
0.79 - 54.70 |
3.48 - 54.70 |
0.79 - 28.73 |
|
|
|
|
|
5-Methoxyindoleacetate - 5MIAA*
|
|
|
|
|
0.89 |
0.13 |
0.37 |
0.19 |
|
Mean (SD)
|
15.12 (9.89) |
16.40 (13.23) |
11.43 (9.37) |
19.68 (13.52) |
|
|
|
|
|
Median (Q1, Q3)
|
15.11 (6.53, 22.07) |
10.93 (7.69, 22.06) |
9.05 (6.86, 11.35) |
16.73 (7.84, 31.74) |
|
|
|
|
|
Min - Max
|
0.79 - 45.27 |
1.12 - 52.02 |
0.90 - 38.93 |
4.06 - 44.47 |
|
|
|
|
|
U-Creatinine
|
|
|
|
|
0.43 |
0.68 |
0.50 |
0.99 |
|
Mean (SD)
|
7.58 (4.27) |
8.36 (4.76) |
8.40 (5.06) |
8.29 (4.33) |
|
|
|
|
|
Median (Q1, Q3)
|
6.55 (4.62, 9.93) |
7.70 (4.55, 10.88) |
7.10 (4.40, 10.65) |
8.40 (5.25, 11.00) |
|
|
|
|
|
Min - Max
|
0.10 - 18.30 |
0.70 - 18.20 |
2.30 - 18.20 |
0.70 - 15.90 |
|
|
|
|
Table 5.
Variations of the tryptohan metabolite ratios in the urine of the control group (1) and the ASD group (2), a group wth CARS up to 36 (3) and with CARS > 36.5 (4), along with p values.
Table 5.
Variations of the tryptohan metabolite ratios in the urine of the control group (1) and the ASD group (2), a group wth CARS up to 36 (3) and with CARS > 36.5 (4), along with p values.
| Metabolite ratios |
Control (N=43) |
ASD (N=43) |
CARS<36 (N=28) |
CARS>36.5 (N=16) |
p value |
| |
1 |
2 |
3 |
4 |
1-2 |
1-3 |
1-4 |
3-4 |
| KYN_TRP |
|
|
|
|
0.96 |
0.47 |
0.27 |
0.17 |
| Mean (SD) |
4.47 (1.76) |
4.48 (2.20) |
4.20 (1.93) |
5.39 (2.81) |
|
|
|
|
| Median (Q1, Q3) |
4.21 (3.32, 5.28) |
4.67 (2.27, 5.84) |
4.60 (2.53, 5.42) |
5.53 (3.57, 6.93) |
|
|
|
|
| Min - Max |
0.82 - 9.03 |
1.20 - 9.56 |
1.20 - 8.34 |
1.27 - 10.41 |
|
|
|
|
| KYN_ATA |
|
|
|
|
0.22 |
0.54 |
0.14 |
0.82 |
| Mean (SD) |
4.07 (3.14) |
4.72 (2.69) |
4.34 (2.46) |
6.93 (4.63) |
|
|
|
|
| Median (Q1, Q3) |
2.71 (1.98, 5.61) |
4.53 (2.83, 5.59) |
4.46 (2.83, 5.41) |
5.30 (3.41, 8.66) |
|
|
|
|
| Min - Max |
0.30 - 12.54 |
0.57 - 12.81 |
0.57 - 9.85 |
2.34 - 17.01 |
|
|
|
|
| TRP_IAA |
|
|
|
|
0.34 |
0.86 |
0.50 |
0.29 |
| Mean (SD) |
15.32 (10.77) |
13.71 (8.80) |
13.14 (5.82) |
20.60 (19.27) |
|
|
|
|
| Median (Q1, Q3) |
11.63 (6.73, 22.28) |
11.85 (7.14, 17.96) |
11.85 (9.19, 18.12) |
13.19 (6.16, 32.42) |
|
|
|
|
| Min - Max |
2.12 - 40.36 |
3.09 - 44.43 |
3.09 - 22.02 |
3.44 - 63.91 |
|
|
|
|
| IAA_IALD |
|
|
|
|
0.36 |
0.60 |
0.70 |
1.00 |
| Mean (SD) |
0.01 (0.01) |
0.01 (0.01) |
0.01 (0.01) |
0.01 (0.00) |
|
|
|
|
| Median (Q1, Q3) |
0.01 (0.00, 0.01) |
0.01 (0.01, 0.01) |
0.01 (0.01, 0.01) |
0.01 (0.01, 0.01) |
|
|
|
|
| Min - Max |
0.00 - 0.03 |
0.00 - 0.02 |
0.00 - 0.03 |
0.00 - 0.02 |
|
|
|
|
| TRP_IAM |
|
|
|
|
0.42 |
0.86 |
0.28 |
0.27 |
| Mean (SD) |
0.39 (0.22) |
0.45 (0.32) |
0.42 (0.33) |
0.53 (0.30) |
|
|
|
|
| Median (Q1, Q3) |
0.34 (0.23, 0.50) |
0.31 (0.20, 0.76) |
0.27 (0.17, 0.73) |
0.44 (0.29, 0.79) |
|
|
|
|
| Min - Max |
0.10 - 1.03 |
0.02 - 1.08 |
0.02 - 1.05 |
0.19 - 1.08 |
|
|
|
|
| TRP_ILA |
|
|
|
|
0.24 |
0.06 |
0.56 |
0.81 |
| Mean (SD) |
21.16 (13.25) |
25.38 (14.16) |
26.08 (14.03) |
23.81 (14.36) |
|
|
|
|
| Median (Q1, Q3) |
17.41 (13.06, 27.07) |
22.58 (14.49, 32.35) |
25.71 (14.21, 32.35) |
19.01 (15.41, 29.69) |
|
|
|
|
| Min - Max |
4.32 - 57.27 |
0.79 - 56.88 |
0.79 - 56.88 |
5.88 - 54.20 |
|
|
|
|
| TRP_NAcTRP |
|
|
|
|
0.31 |
0.07 |
0.04 |
0.43 |
| Mean (SD) |
0.11 (0.07) |
0.12 (0.04) |
0.12 (0.04) |
0.13 (0.07) |
|
|
|
|
| Median (Q1, Q3) |
0.09 (0.07, 0.15) |
0.12 (0.10, 0.15) |
0.13 (0.10, 0.15) |
0.11 (0.09, 0.16) |
|
|
|
|
| Min - Max |
0.02 - 0.26 |
0.05 - 0.25 |
0.05 - 0.22 |
0.06 - 0.31 |
|
|
|
|
| TRP_TRPN |
|
|
|
|
0.46 |
0.39 |
0.37 |
0.03 |
| Mean (SD) |
0.05 (0.03) |
0.05 (0.02) |
0.04 (0.02) |
0.05 (0.02) |
|
|
|
|
| Median (Q1, Q3) |
0.04 (0.03, 0.07) |
0.05 (0.03, 0.06) |
0.04 (0.03, 0.05) |
0.06 (0.05, 0.06) |
|
|
|
|
| Min - Max |
0.01 - 0.13 |
0.01 - 0.09 |
0.02 - 0.09 |
0.01 - 0.09 |
|
|
|
|
| TRP_5HIAA |
|
|
|
|
0.98 |
0.44 |
0.92 |
0.82 |
| Mean (SD) |
0.46 (0.27) |
0.48 (0.33) |
0.39 (0.21) |
0.62 (0.48) |
|
|
|
|
| Median (Q1, Q3) |
0.37 (0.27, 0.63) |
0.33 (0.22, 0.57) |
0.33 (0.23, 0.54) |
0.41 (0.21, 1.01) |
|
|
|
|
| Min - Max |
0.06 - 1.17 |
0.13 - 1.32 |
0.13 - 0.98 |
0.17 - 1.72 |
|
|
|
|
| TRP_5OHTRP |
|
|
|
|
0.01 |
0.68 |
0.001 |
0.08 |
| Mean (SD) |
0.83 (0.55) |
1.28 (0.89) |
0.84 (0.54) |
1.69 (0.83) |
|
|
|
|
| Median (Q1, Q3) |
0.62 (0.44, 1.07) |
1.06 (0.59, 1.83) |
0.69 (0.40, 1.12) |
1.83 (1.06, 2.39) |
|
|
|
|
| Min - Max |
0.16 - 2.14 |
0.26 - 3.03 |
0.26 - 2.41 |
0.54 - 2.81 |
|
|
|
|
| TRP_5MIAA |
|
|
|
|
0.04 |
0.04 |
0.52 |
0.34 |
| Mean (SD) |
1.36 (0.96) |
2.25 (1.79) |
2.32 (1.76) |
1.45 (1.12) |
|
|
|
|
| Median (Q1, Q3) |
1.10 (0.56, 2.11) |
1.57 (0.83, 3.84) |
1.69 (0.85, 4.01) |
1.09 (0.69, 1.95) |
|
|
|
|
| Min - Max |
0.11 - 3.52 |
0.27 - 6.42 |
0.23 - 5.54 |
0.27 - 3.76 |
|
|
|
|
| TRP_IPA |
|
|
|
|
0.41 |
0.74 |
0.43 |
0.67 |
| Mean (SD) |
4.20 (2.86) |
4.86 (3.38) |
4.81 (3.50)
|
1.41 (1.09) |
|
|
|
|
| Median (Q1, Q3) |
3.83 (2.06, 5.91) |
3.81 (1.99, 6.89) |
3.73 (1.89, 6.86)
|
1.15 (0.64, 1.82) |
|
|
|
|
| Min - Max |
0.09 - 10.29 |
0.64 - 13.18 |
0.72 - 13.18
|
0.27 - 4.05 |
|
|
|
|
| TRP_IBA |
|
|
|
|
0.49 |
0.30 |
0.63 |
0.62 |
| Mean (SD) |
1.40 (1.22) |
1.53 (1.08) |
2.00 (1.67) |
4.96 (3.28)
|
|
|
|
|
| Median (Q1, Q3) |
0.98 (0.44, 2.08) |
1.40 (0.57, 2.32) |
1.78 (0.65, 2.71) |
4.41 (3.09, 6.48)
|
|
|
|
|
| Min - Max |
0.09 - 4.62 |
0.27 - 4.08 |
0.29 - 6.17 |
0.64 - 11.28
|
|
|
|
|
|
TRY_MIA
|
|
|
|
|
0.29 |
0.50 |
0.10 |
0.19 |
|
Mean (SD)
|
258.65 (128.65) |
307.21 (219.11) |
248.60 (165.80)
|
404.21 (252.53)
|
|
|
|
|
|
Median (Q1, Q3)
|
229.38 (173.32, 344.60) |
235.91 (140.82, 456.88) |
221.01 (140.82, 329.70)
|
456.88 (178.25, 604.11)
|
|
|
|
|
|
Min - Max
|
50.51 - 518.99 |
25.69 - 763.72 |
25.69 - 614.63
|
49.48 - 723.93
|
|
|
|
|
|
IAA_KYN
|
|
|
|
|
0.81 |
0.61 |
0.67 |
0.67 |
|
Mean (SD)
|
0.02 (0.01) |
0.02 (0.02) |
0.02 (0.02)
|
0.02 (0.01)
|
|
|
|
|
|
Median (Q1, Q3)
|
0.02 (0.01, 0.03) |
0.02 (0.01, 0.03) |
0.02 (0.01, 0.03)
|
0.02 (0.00, 0.02)
|
|
|
|
|
|
Min - Max
|
0.00 - 0.06 |
0.00 - 0.06 |
0.00 - 0.06
|
0.00 - 0.05
|
|
|
|
|
|
KYN_IALD
|
|
|
|
|
0.19 |
0.12 |
0.44 |
0.93 |
|
Mean (SD)
|
0.55 (0.44) |
0.68 (0.45) |
0.74 (0.49)
|
0.68 (0.51)
|
|
|
|
|
|
Median (Q1, Q3)
|
0.38 (0.28, 0.72) |
0.60 (0.40, 0.77) |
0.61 (0.40, 0.93)
|
0.60 (0.45, 0.65)
|
|
|
|
|
|
Min - Max
|
0.06 - 1.73 |
0.05 - 1.66 |
0.05 - 1.66
|
0.13 - 1.93
|
|
|
|
|
Table 6.
Tryptophan and metabolite alterations by degree of impairment in comparison to siblings.
Table 6.
Tryptophan and metabolite alterations by degree of impairment in comparison to siblings.
| Moderate |
Severe |
Metabolite |
|
|
TRP, MIA, 5HIAA, Creatinin |
|
|
IAA, IAM, NAcTRP, TRPN |
|
|
ATA, ILA, IPA, KYN, 5MIAA |
|
|
IALD, IBA, 5OHTRP |
Table 7.
Tryptophan and metabolite ratios alternations by degree of impairment in comparison to siblings.
Table 7.
Tryptophan and metabolite ratios alternations by degree of impairment in comparison to siblings.
| Moderate |
Severe |
Metabolite |
|
|
KYN-TRP, KYN-ATA, TRP-IAA, TRP-NAcTRP, TRP-5OHTRP, TRP-IPA, TRP-IBA, TRP-MIA, KYN-IALD, Creatinin |
|
|
TRP-ILA |
|
|
TRP-IAM, TRP-5MIAA |
|
|
TRP-5HIAA |
|
Disclaimer/Publisher’s Note: The statements, opinions and data contained in all publications are solely those of the individual author(s) and contributor(s) and not of MDPI and/or the editor(s). MDPI and/or the editor(s) disclaim responsibility for any injury to people or property resulting from any ideas, methods, instructions or products referred to in the content. |
© 2024 by the authors. Licensee MDPI, Basel, Switzerland. This article is an open access article distributed under the terms and conditions of the Creative Commons Attribution (CC BY) license (http://creativecommons.org/licenses/by/4.0/).