
Submitted:
17 June 2025
Posted:
19 June 2025
You are already at the latest version
Abstract
Natural sunlight driven photocatalytic degradation of organic pollutants is a sustainable solution for water purification. Use of heterojunction nanocomposites in this process shows promise for improved photodegradation efficiency. In this work nanocrystalline Zn2SnO4/SnO2 obtained by the solid-state synthesis method was tested as a heterojunction photocatalyst material for the degradation of Methylene Blue (MB) and Rhodamine B (RhB) dyes as single and multicomponent systems in natural sunlight. Characterization of the structure and morphology of the synthesized nanocomposite using X-ray diffraction (XRD), Fourier transform infrared spectroscopy (FTIR), Field emission scanning electron microscopy (FESEM), Transmission electron microscopy (TEM) combined with Energy dispersive X-ray spectroscopy (EDS) confirmed formation of Zn2SnO4/SnO2 and heterojunctions between Zn2SnO4 and SnO2 nanoparticles. Photodegradation efficiency of 99.1% was achieved in 120 minutes with 50 mg of the photocatalyst for degradation of MB and 70.58% for degradation of RhB in the same conditions. In the multicomponent system the degradation efficiency of 97.87% for MB and 53.19% for RhB was obtained with only 15 mg of the photocatalyst. Degradation of MB occurred through N-demethylation and the formation of azure intermediates and degradation of RhB occurred through sequential deethylation and fragmentation of the xanthene ring both in single and multicomponent systems.
Keywords:
Zn2SnO4
; SnO2
; heterojunction
; photocatalysis
; Methylene Blue
; Rhodamine B
; natural sunlight
1. Introduction
Photocatalysis, an advanced oxidation process involving photocatalytic degradation of pollutants in waste water into harmless products such as CO2 and water has been the focus of much scientific research due to the continuous and increasing pollution of water and demand for clean water supply [1,2]. Organic dyes applied for coloring different industrial processes are a common pollutant [3,4]. The photocatalysis process involves a chemical reaction accelerated by light in the presence of a catalyst material [2]. Photocatalysis degrades organic pollutants into water and carbon dioxide and other inorganic substances that are commonly regarded as safe [4].
The photocatalysis process depends on the used catalyst material and the light source. Semiconducting metal oxides have been widely investigated as catalysts in photocatalysis due to their suitable band gap, abundance, versatility, non-toxicity, stability and photocatalytic activity [5]. Metal oxides commonly investigated and applied for photocatalytic degradation of organic dyes include TiO2 [1] and ZnO [6]. When the surface of a semiconducting catalyst material dispersed in polluted waste water is illuminated with a light source with an energy equivalent or higher than the band gap energy of the semiconducting metal oxide catalyst this leads to activation of electrons from the valence band (VB) and their migration to the conduction band (CB) [2]. Positive holes remaining in the VB react with water molecules to form hydroxyl radicals. These radicals degrade the molecules of the organic dye pollutants into intermediates and in some cases into carbon dioxide (CO2) and water (H2O). Excited electrons in the VB can react with dissolved oxygen species leading to the formation of superoxide radicals that also decompose pollutant species adsorbed on the catalyst semiconductor into intermediate products. Over the years, research has focused on improving the photocatalytic efficiency of metal oxide catalyst materials by modifying them with dopants, forming composites and heterostructures [3,5,7]. Thus, ZnO has been combined with SnO2 and shown improved degradation efficiency of Methylene blue (MB) and Rhodamine B (RhB) organic dyes under UV light [8]. Semiconductor heterojunction catalysis can combine semiconductors with other semiconductors, metals, carbon or form multicomponent heterojunctions in order to improve photocatalytic performance especially in the visible light region [9]. Semiconductor-semiconductor heterojunctions as heterostructure catalysts represent a combination of two metal semiconductors with different properties (including ionization potential and electron affinity) [10,11]. When a heterostructure is irradiated by light, electrons are excited from VBs to CBs of both catalysts. Photogenerated electrons then are injected from the catalyst with a higher CB edge to the catalyst with the lower CB edge, with simultaneous holes injection in the opposite direction, leading to increased charge separation and reduced electron-hole pair recombination [11]. Thus, ZnO/SnO2 heterostructures treated by mechanical milling showed improved photocatalytic degradation of MB in both UV and natural sunlight due to increase in surface defects and their synergy with heterojunction ZnO/SnO2 particles [12]. ZnO/Zn2SnO4 nanocomposites have shown improved photodegradation efficiency of MB and RhB in visible light, as the synergist effect of the ZnO and Zn2SnO4 resulted in improved lifetime of the photogenerated charge carriers and recombination reduction photogenerated electron-hole pairs [13].
Wide band-gap semiconductors such as ZnO, SnO2 and TiO2 have shown good photocatalytic activity in ultraviolet (UV) light irradiation [2]. However, recent research focus has been on achieving good photocatalytic properties in visible light that represents a higher percentage of the solar spectrum. Research has also focused on applying metal oxide nanostructures for photocatalysis of organic dyes such as MB in natural sunlight [12,14].
Zinc-tin-oxide is an environmentally friendly multicomponent oxide that can have two forms: rhombohedral perovskite ZnSnO3 and n-type inverse spinel orthorhombic Zn2SnO4 [15]. Zn2SnO4 has high electron mobility, good stability, a wide bandgap, but relatively unfavorable recombination rate for achieving efficient photocatalysis [16]. The composition, structure and morphology have an influence on resulting properties of zinc tin oxides, including photocatalytic degradation of organic polluting dyes such as MB and RB [17]. Thus, high porosity was achieved in Zn2SnO4 synthesized with the aid of different carbon-based templates achieving 96% degradation of MB in 25 minutes [18]. The optical bandgap value of zinc tin oxides depends on the particle size and morphology of the synthesized particles. An interesting feature is that photoluminescence studies of zinc tin oxides have shown the presence of energy levels that can be associated with oxygen vacancies. These sub-gap states enable absorption of photons whose energy is lower than the measured optical bandgap and enable photocatalytic activity in visible light besides photocatalytic activity in the UV light region. Urbach energies have been determined for different zinc tin oxide morphology and composition and they also infer possible absorption below the optical bandgap [17].
Both Zn2SnO4 and SnO2 are wide band gap semiconductors. Improved photocatalytic degradation of MB in UV light was achieved by Zn2SnO4/SnO2 nanocomposites obtained by sonochemical synthesis combined with high temperature calcination [19]. The CB edge of Zn2SnO4 is more negative that the CB edge of SnO2 making SnO2 a better electron acceptor. At the same time the VB edge of SnO2 is more positive than the VB edge of Zn2SnO4 leading to a more effective separation of photogenerated electron-holes and smaller electron-hole recombination [20]. A one pot hydrothermal method applied for synthesis of the Zn2SnO4/SnOx composite achieved improved photocatalytic degradation methyl orange (MO) organic dye under UV light irradiation [21], while a hydrothermally synthesized of Zn2SnO4/SnO2 nanocomposite achieved enhanced and stable photocatalytic degradation of RhB under UV light irradiation [22]. The molar ratio of Zn:Sn also influenced the resulting photocatalytic activity towards MB degradation under UV light irradiation [23]. Different composite Zn2SnO4/SnO2 microstructures obtained using varied synthesis procedures have been analyzed, and they include multi-shelled and hybrid structures [24] and hollow engineered microboxes [25] achieving improved photocatalytic degradation of RhB under simulated sunlight. Hollow cubes of Zn2SnO4/SnO2 showed better photocatalytic degradation of MB and MO than solid ones in simulated sunlight [26].
The aim of this work was to analyze the use of nanocrystalline Zn2SnO4/SnO2 obtained by a simple method of solid-state synthesis as a heterojunction photocatalyst material for degradation of single and multicomponent systems of organic dyes in aqueous medium in natural sunlight. Multicomponent systems containing a mixture of dyes or other active components may have different effects than single-component systems [8]. They can show the competitive effects of the different dyes in the mixtures [27]. Analysis of these differences is significant from the viewpoint of textile industry wastewater treatment processes, especially under natural sunlight [28]. The purpose is to analyze and elucidate the dye decomposition process and degradation mechanism in single component systems of MB and RhB and interaction of degradation and nanoparticle components in a multicomponent system of MB and RhB organic dyes in the simplest conditions of natural sunlight.
2. Materials and Methods
Nanocrystalline Zn2SnO4/SnO2 was obtained by solid state synthesis of starting ZnO and SnO2 nanopowders (both from Sigma Aldrich, particle size < 100 nm) consisting of mixing/homogenizing the two powders in the 1:1 M ratio with an agate mortar and pestle. Subsequent calcination was performed at 1050 °C for 5 hours in a chamber furnace in air followed by grinding with agate mortar and pestle. This calcination temperature was selected to ensure Zn2SnO4 formation in line with previous TG/DTA analysis [29]. The structure of obtained Zn2SnO4/SnO2 nanocrystalline composite powder was analyzed using X-ray diffraction (XRD) spectroscopy on a Rigaku Ultima IV diffractometer (Tokyo, Japan) in the range 10-90°, step 0.02° and Fourier Transform Infrared Spectroscopy (FTIR) measured on a Perkin Elmer Spectrum Two (Waltham MA, USA) in the range 400-4000 cm-1 with a resolution of 8 cm-1. A Shimadzu UV-2600 device with an ISR2600 Plus Integrating sphere attachment (Kyoto, Japan) was used to measure the UV-vis diffuse reflectance spectrum. The morphology was observed by Field Emission Scanning Electron Microscopy (FESEM) on a Tescan MIRA3 XM (Brno, Czech Republic) and Transmission Electron Microscopy (TEM) on a FEI Talos F200X microscope (Thermo Fischer Scientific, Waltham, MA, USA) combined with an energy dispersive X-ray spectroscopy (EDS) system.
The photocatalytic activity of Zn2SnO4/SnO2 was evaluated by monitoring photodegradation of aqueous solutions of methylene blue (MB), rhodamine B (RhB) individually and combined in binary dye mixtures under direct natural sunlight in July and August 2022 between 11.00 and 14.00 (average daily temperature 30±2 °C). We varied the photocatalyst amount: 10-50 mg and applied to 50 ml 10 ppm aqueous solutions of MB, RhB or a 50 ml equimolar mixture of 10 ppm MB and RhB. Before irradiation the solutions were mixed in the dark on a magnetic mixer for 60 min to achieve adsorption and desorption equilibrium between the photocatalyst and pollutant. Photolysis of the solutions was also analyzed in the same conditions. Absorption was monitored on a Shimadzu UV-2600 spectrophotometer (Kyoto, Japan) at 663 nm (MB) and 554 nm (RhB).
The degradation efficiency was determined as:
where C0 is the concentration of the dye solution at the start of exposure to natural sunlight (t = 0) and Ct is the concentration of the dye solution at time t.
Kinetic analysis of the dye degradation process was performed using the simplified Langmuir – Hinshelwood (L-H) kinetic model [14,24,27]:
where the normalized temporal concentration changes of the dye during the photocatalytic process can be assumed to be proportional to the normalized maximum absorbance change of the dye at time t (At) and 0 (A0) derived from the change in the absorption profile at irradiation time t. The pseudo-first order kinetic constant (k) can be determined from the fitted linear relation.
Mass spectrometry (MS) analysis was performed on a TSQ Quantum Access Max mass spectrometer equipped with a HESI source (Thermo Fisher Scientific, Waltham, MA, USA). Ion source settings were: spray voltage, 3500 V; vaporizer temperature, 300 °C; sheath gas, N2; pressure, 27 AU; ion sweep gas pressure, 1.0 AU; auxiliary gas (N2) pressure, 10 AU; capillary temperature, 275 °C; skimmer offset, 0 V. Data was acquired in positive mode, including full scanning in m/z range from 100 to 1000 for qualitative analysis and product ion scanning mode for the quantitative analysis. Collision-induced fragmentation experiments were performed using Ar as the collision gas, with collision energy set at 10 eV. Samples were introduced into the mass spectrometer with a syringe pump and continuous flow injection at a flow rate of 10 μL min−1 for a period of 3 min. Xcalibur software Analyst version 1.4 (Thermo Fisher Scientific) was used for data acquisition and processing.
3. Results and Discussion
3.1. Structure, Morphology and Optical Properties
The measured XRD pattern of synthesized Zn2SnO4/SnO2 powder is shown in Figure 1a and confirms formation of two phases: cubic spinel Zn2SnO4 (JCPDS 24-1470) and tetragonal SnO2 (JCPDS 88-0287). The FESEM image of the Zn2SnO4/SnO2 powder (Figure 1b) shows relatively uniform nanoparticles of Zn2SnO4 and SnO2 with a similar shape and size. The average particle size was estimated as ~ 150 nm. Rietveld refinement of the measured XRD pattern using the GSAS II software package [30] showed good agreement between the measured and refined patterns (Figure 1a) and enabled determination of structural parameters (unit cell parameters, atomic positions, crystallite size and microstrain) as shown in Figure 1c. The crystal structures drawn using the determined crystalline lattice parameters for Zn2SnO4 () and SnO2 (P42/mnm) using the VESTA software package [31] are shown in Figure 1d. The Zn ions are pale grey and Sn ions are pale purple, while the oxygen ions are shown as red balls. For Zn2SnO4 we obtained the inversion parameter of 0.81 that is in the range previously determined for zinc stannate [29,32,33] and confirms the presence of randomly distributed Zn2+ and Sn4+ ions on both tetrahedral and octahedral sites in the cubic spinel lattice (as shown in Figure 1d). The ideal cation symmetry for the cubic spinel space groups of Zn2SnO4 is distorted, as the oxygen parameter was determined as 0.2591 (rather than 0.25), as noted before for zinc stannate with larger tetrahedra and smaller octahedra [29]. The crystallite size of 108 nm for Zn2SnO4 and 88 nm for SnO2 is similar to values previously obtained for this composite [29].
The measured FTIR spectrum of Zn2SnO4/SnO2 shown in Figure 2 confirms the presence of metal-oxide bonds in the nanocomposite. Thus, Sn−O stretching vibrations can be noted in the range 430-620 cm-1 (501 and 553 cm-1) and Sn−O−Sn band vibrations are present in the range 645-700 cm-1 (645 and 698 cm-1), as noted before for Sn present in both SnO2 and Zn2SnO4 [29]. Zn-O vibration bands are anticipated in the range 150-420 cm-1 and the tail of one peak is possibly present (marked in Figure 2) as noted before [29].
The Zn2SnO4/SnO2 powder morphology and structure was further analyzed by TEM, high resolution TEM (HRTEM), high-angle annular dark-field scanning (HADDF) TEM and EDS. The TEM images shown in Figure 3a and b enable a closer look at the powder particles, confirming that the SnO2 and Zn2SnO4 nanoparticles are similar in size and shape. HADDF combined with EDS mapping, as shown in Figure 3c further confirmed the presence of a homogenous mixture of the two components of the nanocomposite powder. Analysis of the periodic lattice fringes for the two particles shown in the HRTEM image in Figure 3d using fast Fourier transform (FFT) enabled determination of the lattice spacing of 0.24 nm for the (200) plane of tetragonal SnO2 and 0.50 nm for the (111) plane of cubic spinel Zn2SnO4 with corresponding FFT images for SnO2 (Figure 3e) and Zn2SnO4 (Figure 3f) confirming the presence of heterojunctions of Zn2SnO4 and SnO2. Combining two individual oxides in a nanocomposite that form heterojunctions between SnO2 and Zn2SnO4 have been noted before for this type of nanocomposite and have led to improved sensing and photocatalytic properties [34,35,36].
Kubelka-Munk transformation of the measured diffuse reflectance spectrum of the Zn2SnO4/SnO2 powder enabled calculation of the equivalent absorption coefficient used for estimation of the optical band gap as shown in Figure 4 [37]. The direct band gap of the analyzed Zn2SnO4/SnO2 powder was estimated from the Tauc plot to be 3.87 eV (inset in Figure 4a). A direct band gap was assumed taking into account that SnO2 has a direct optical energy gap estimated to be 3.68 eV [38], though for nanoparticles and thin films it has been found to be between 3.4 and 4.6 eV [39,40]. Zn2SnO4 also has a direct optical energy gap that has been found to be between 3.2 and 4.1, with 3.6 eV determined for bulk samples, but both higher and lower for nanoparticles and films with different morphologies [17,21,41,42]. The absorption edge was estimated to be at 337 nm (3.68 eV) as shown in Figure 4a. The estimated direct band gap value is relatively high, and higher than the value estimated from the absorption edge. This has been noted before by Wang et al. [21], who estimated a band gap of 3.5 eV for one-pot hydrothermally synthesized SnOx/Zn2SnO4 heterojunction composite powder from the absorption edge, and higher values from Tauc plots. The estimated band gap value of 3.68 eV is slightly higher than the value of 3.63 eV determined by Li et al. [20] for cube shaped Zn2SnO4/SnO2 heterojunction composite powder. The first derivative of the measured reflectance (dR/dλ) has been used to enable identification of additional transition energies and also estimate the band gap [37,44]. In our case there is one prominent peak at 337 nm accompanied with a smaller but noticeable shoulder at 379 nm showing a significant effect of the occurrence of heterojunctions between SnO2 and Zn2SnO4 nanoparticles (Figure 4b). Wang et al. [21] have found that heterojunctions formed at the interface between SnO2 and Zn2SnO4 have promoted a better separation of photoinduced electrons (e−) and holes (h+), leading to an extended absorption range and improved photocatalytic activity.
3.2. Photodegradation of Dye in Natural Sunlight
3.2.1. Photodegradation of MB
Figure 5a shows that the degradation of MB dye (10 ppm = 10 mg/l) under natural sunlight irradiation using 50 mg of the photocatalyst resulted in noticeable and significant reduction of the absorption peaks of MB and in an almost white solution (as shown in the inset) indicating almost complete degradation of the dye after 120 min (2 h) of irradiation in natural sunlight. MB is a blue cationic thiazine dye with absorption peaks at 246 nm, 291 nm and 663 nm and a shoulder at 615 nm, three mesomeric structures where the positive charge is located either on nitrogen or sulfur atoms [45]. The reduced forms (Leuco-methylene blue and MBH2+) obtained using reducing agents are colorless and stable in aqueous solutions. With increase in the irradiation time we can also note a slight blueshift of the strongest absorption band at starting at 663 nm, reducing to 636 nm after 120 min. The occurrence of a blueshift has been noted before for photocatalytic MB degradation with other photocatalysts, such as PANI/TiO2 composite [46]. It is associated with the occurrence of N-demethylated derivatives of MB during the degradation process. Variation of the Zn2SnO4/SnO2 concentration from 10 to 50 mg (Figure 5b) showed that decrease in the number of active sites on the catalyst surface reduced the photocatalytic activity and the characteristic absorption peak at 663 nm. The blueshift remained, but was less with decrease in catalyst load (650 nm – 10 mg, 649 nm – 20 mg and 638 nm– 50 mg). The degradation efficiency of 99.10% was achieved after 120 min of irradiation in natural sunlight for 50 mg of the photocatalyst, reducing to 91.13% for 30 mg, 80.75% for 20 mg and 74.85% for 10 mg of the photocatalyst, as shown in Figure 5c. The photodegradation rate follows the pseudo-first order kinetic model (Eq. 2) as shown in Figure 5d with R2 values between 0.91 and 0.96. The determined pseudo-first order kinetic constant k values increase with increase in catalyst load with 0.01151 for 10 mg and 0.03828 for 50 mg.
Methylene blue (MB) degradation has been achieved previously by this type of composite, but mostly in UV light as shown in Table 1. It shows a significant influence of the composite morphology on the degradation efficiency and pseudo-kinetic constant. Rovisco et al [17] also showed that the morphology and phase had a significant influence on the photocatalytic activity of zinc-stannate in both UV and visible light for the degradation of MB. Li et al [26] attributed the improved photocatalytic activity of Zn2SnO4/SnO2 hollow cubes compared to solid ones to the presence of cavities within the cubes enabling higher light absorption, lower recombination rate of photogenerated electrons and highly efficient separation of photoelectrons from vacancies. In this case the presence of heterojunctions between Zn2SnO4 and SnO2 nanoparticles can bring about improved photocatalytic activity due to improved separation of photoinduced electrons and holes [21]. This is reflected in the high value obtained for the pseudo-kinetic constant for 50 mg of photocatalyst, and also relatively high values for lower catalyst loads showing that complete degradation of MB would occur for longer durations than 120 min, but comparable with the results shown in Table 1.
3.2.2. Photodegradation of RhB
Degradation of RhB in natural sunlight using the Zn2SnO4/SnO2 heterojunction nannocomposite was less efficient that degradation of MB in the same conditions. Though they are both cationic dyes, MB is a blue cationic thiazine dye, while RhB is a pink dye part of the triphenylmethane family. Figure 6a shows the absorption spectra measured for RhB degradation in natural sunlight using 50 mg of Zn2SnO4/SnO2 as the photocatalyst. Though there is discoloration of the solution that changes from bright pink to a lighter more milky pink, as shown in the inset, 120 minutes were not enough for complete degradation of RhB. We can also note a slight blueshift of the characteristic peak at 554 nm that shifts to 547 nm after 120 min of natural sunlight irradiation. This blueshift is attributed to the formation of N-deethylated intermediates of RhB and has been noted before for both Zn2SnO4/SnO2 nanocomposite [22] and other photocatalysts, such as NaBiO3 [48]. The photocatalytic activity was lower for smaller catalyst loads, as shown in Figure 6b. The highest degradation efficiency of 70.58% was obtained for the highest catalyst load of 50 mg, and it decreased with decrease in catalyst load, with 10 mg achieving degradation efficiency of only 22.57% after 120 min in natural sunlight, as shown in Figure 6c. The photodegradation rate also followed the pseudo-first order kinetic model (Eq. 2) as shown in Figure 5d with R2 values between 0.92 and 0.99. The determined pseudo-first order kinetic constant k values increase with increase in catalyst load with 0.00216 for 10 mg and 0.01018 for 50 mg. Table 2 shows a comparison between the results obtained in this work for Zn2SnO4/SnO2 nanocomposite heterojunctions with literature data obtained for different Zn2SnO4/SnO2 nanocomposite morphologies and light sources (simulated UV or UV-vis light). The kinetic rate we obtained is not the highest, but also not the lowest, indicating that for a longer irradiation time in natural sunlight we could expect complete degradation of RhB, possibly after 240 min.
3.2.3. Photodegradation of MB+RhB
Measured absorption curves showing degradation of MB+RhB under natural sunlight using 50 mg of Zn2SnO4/SnO2 are presented in Figure 7a indicating complete degradation of MB and significant degradation of RhB. Blueshift of both characteristic peaks for MB and RhB (at 663 and 554 nm) was also noted, indicating the presence of both N-demethylated N-deethylated intermediates of MB and RhB, respectively in the mixed dye solution. Widening of the absorption bands is also noticeable after longer irradiation times. As expected from the results obtained for degradation of MB and RhB as single dye aqueous solutions, MB degraded faster compared to RhB. The starting purple solution completely changed color after 120 min of irradiation resulting in a milky pale pink color, as shown in Figure 7b. Change of the catalysts amount (10 and 30 mg) showed a paler purple for 10 mg and a darker shade of pink after 120 min for 30 mg of Zn2SnO4/SnO2. Figure 7 c,e and d,f show the change in dye concentration ratios and the degradation efficiency of MB and RhB in MB+RhB, respectively, with catalyst load varying between 5 and 50 mg. The degradation efficiency of MB was higher achieving 97.87% with only 15 mg of photocatalyst. The degradation efficiency of 84.12% was obtained for RhB in MB+ RhB with 50 mg of the photocatalyst. Analysis of the first-order reaction kinetics showed that the determined pseudo-first order kinetic constant k values are overall higher for the same catalyst load applied to the single dye solutions (Figure 7 g and h). Thus, 30 mg of Zn2SnO4/SnO2 degrades RhB and 20 mg of Zn2SnO4/SnO2 degrades MB with a similar kinetic rate to 50 mg of Zn2SnO4/SnO2 in single dye solutions. Thus, we can conclude that Zn2SnO4/SnO2 nanocomposite heterojunctions perform better in a mixed MB+RhB dye solution. Dlugosz et al [8] studied the degradation of single, bi and multiple mixed dye solutions using ZnO-SnO2 nanocomposite and determined that the presence of components of the same nature did not affect the dye decomposition rate, except for quinolone yellow (dye with a neutral character), while Tang et al [27] noted a 5% reduction in degradation rate for malachite green (cationic dye). MB and RhB degradation did not change in mixed dye solutions.
3.2.4. Zn2SnO4/SnO2 Pollutant Degradation Mechanism
Irradiation of the Zn2SnO4/SnO2 nanocomposite with natural sunlight initiates electron excitation from valence bands (VB) to conduction bands (CB) for both components. Then electron (e−) transfer occurs from Zn2SnO4 with a higher CB edge to SnO2 with the lower CB edge (as shown in Figure 8). Simultaneous hole (h+) transfer also occurs from SnO2 to Zn2SnO4 and this leads to more effective charge carrier separation so reduced charge carrier recombination increases the carrier lifetime [11,22]. Photogenerated electrons in the CBs can react with O2 absorbed on the catalyst (Zn2SnO4/SnO2 nanocomposite) surface or dissolved in water and create superoxide anion radicals (O2·−). At the same time photogenerated holes can interact with OH− or H2O and create hydroxyl radicals (OH·) [22]. Both superoxide anion and hydroxide radicals are responsible for the degradation of organic pollutants (MB, RhB, MB+RhB) into CO2 and H2O [17]. The proposed degradation mechanism scheme is shown in Figure 8.
3.3. MS Analysis - Degradation Mechanism
In order to elucidate in greater detail the degradation pathways of MB, RhB, and their mixture under photocatalytic conditions, an electrospray ionization mass spectrometry (ESI-MS) analysis was carried out in positive mode. The obtained spectra indicate a stepwise degradation process that occurs through the formation of intermediate products and can be classified into three main mechanisms: N-demethylation, ring opening, and complete fragmentation into smaller organic residues. The degradation process was monitored at time intervals of 0, 15, 30, 60, 90, and 120 minutes, which allowed for the observation of the kinetics and progressive fragmentation of the dye molecules. The results provide deeper insight into the individual stages of degradation, simultaneously confirming spectral shifts and changes in absorption observed in UV-vis analysis, thereby further contributing to the understanding of the photocatalytic degradation mechanism of these dyes and their mixture.
3.3.1. MB Degradation Pathway
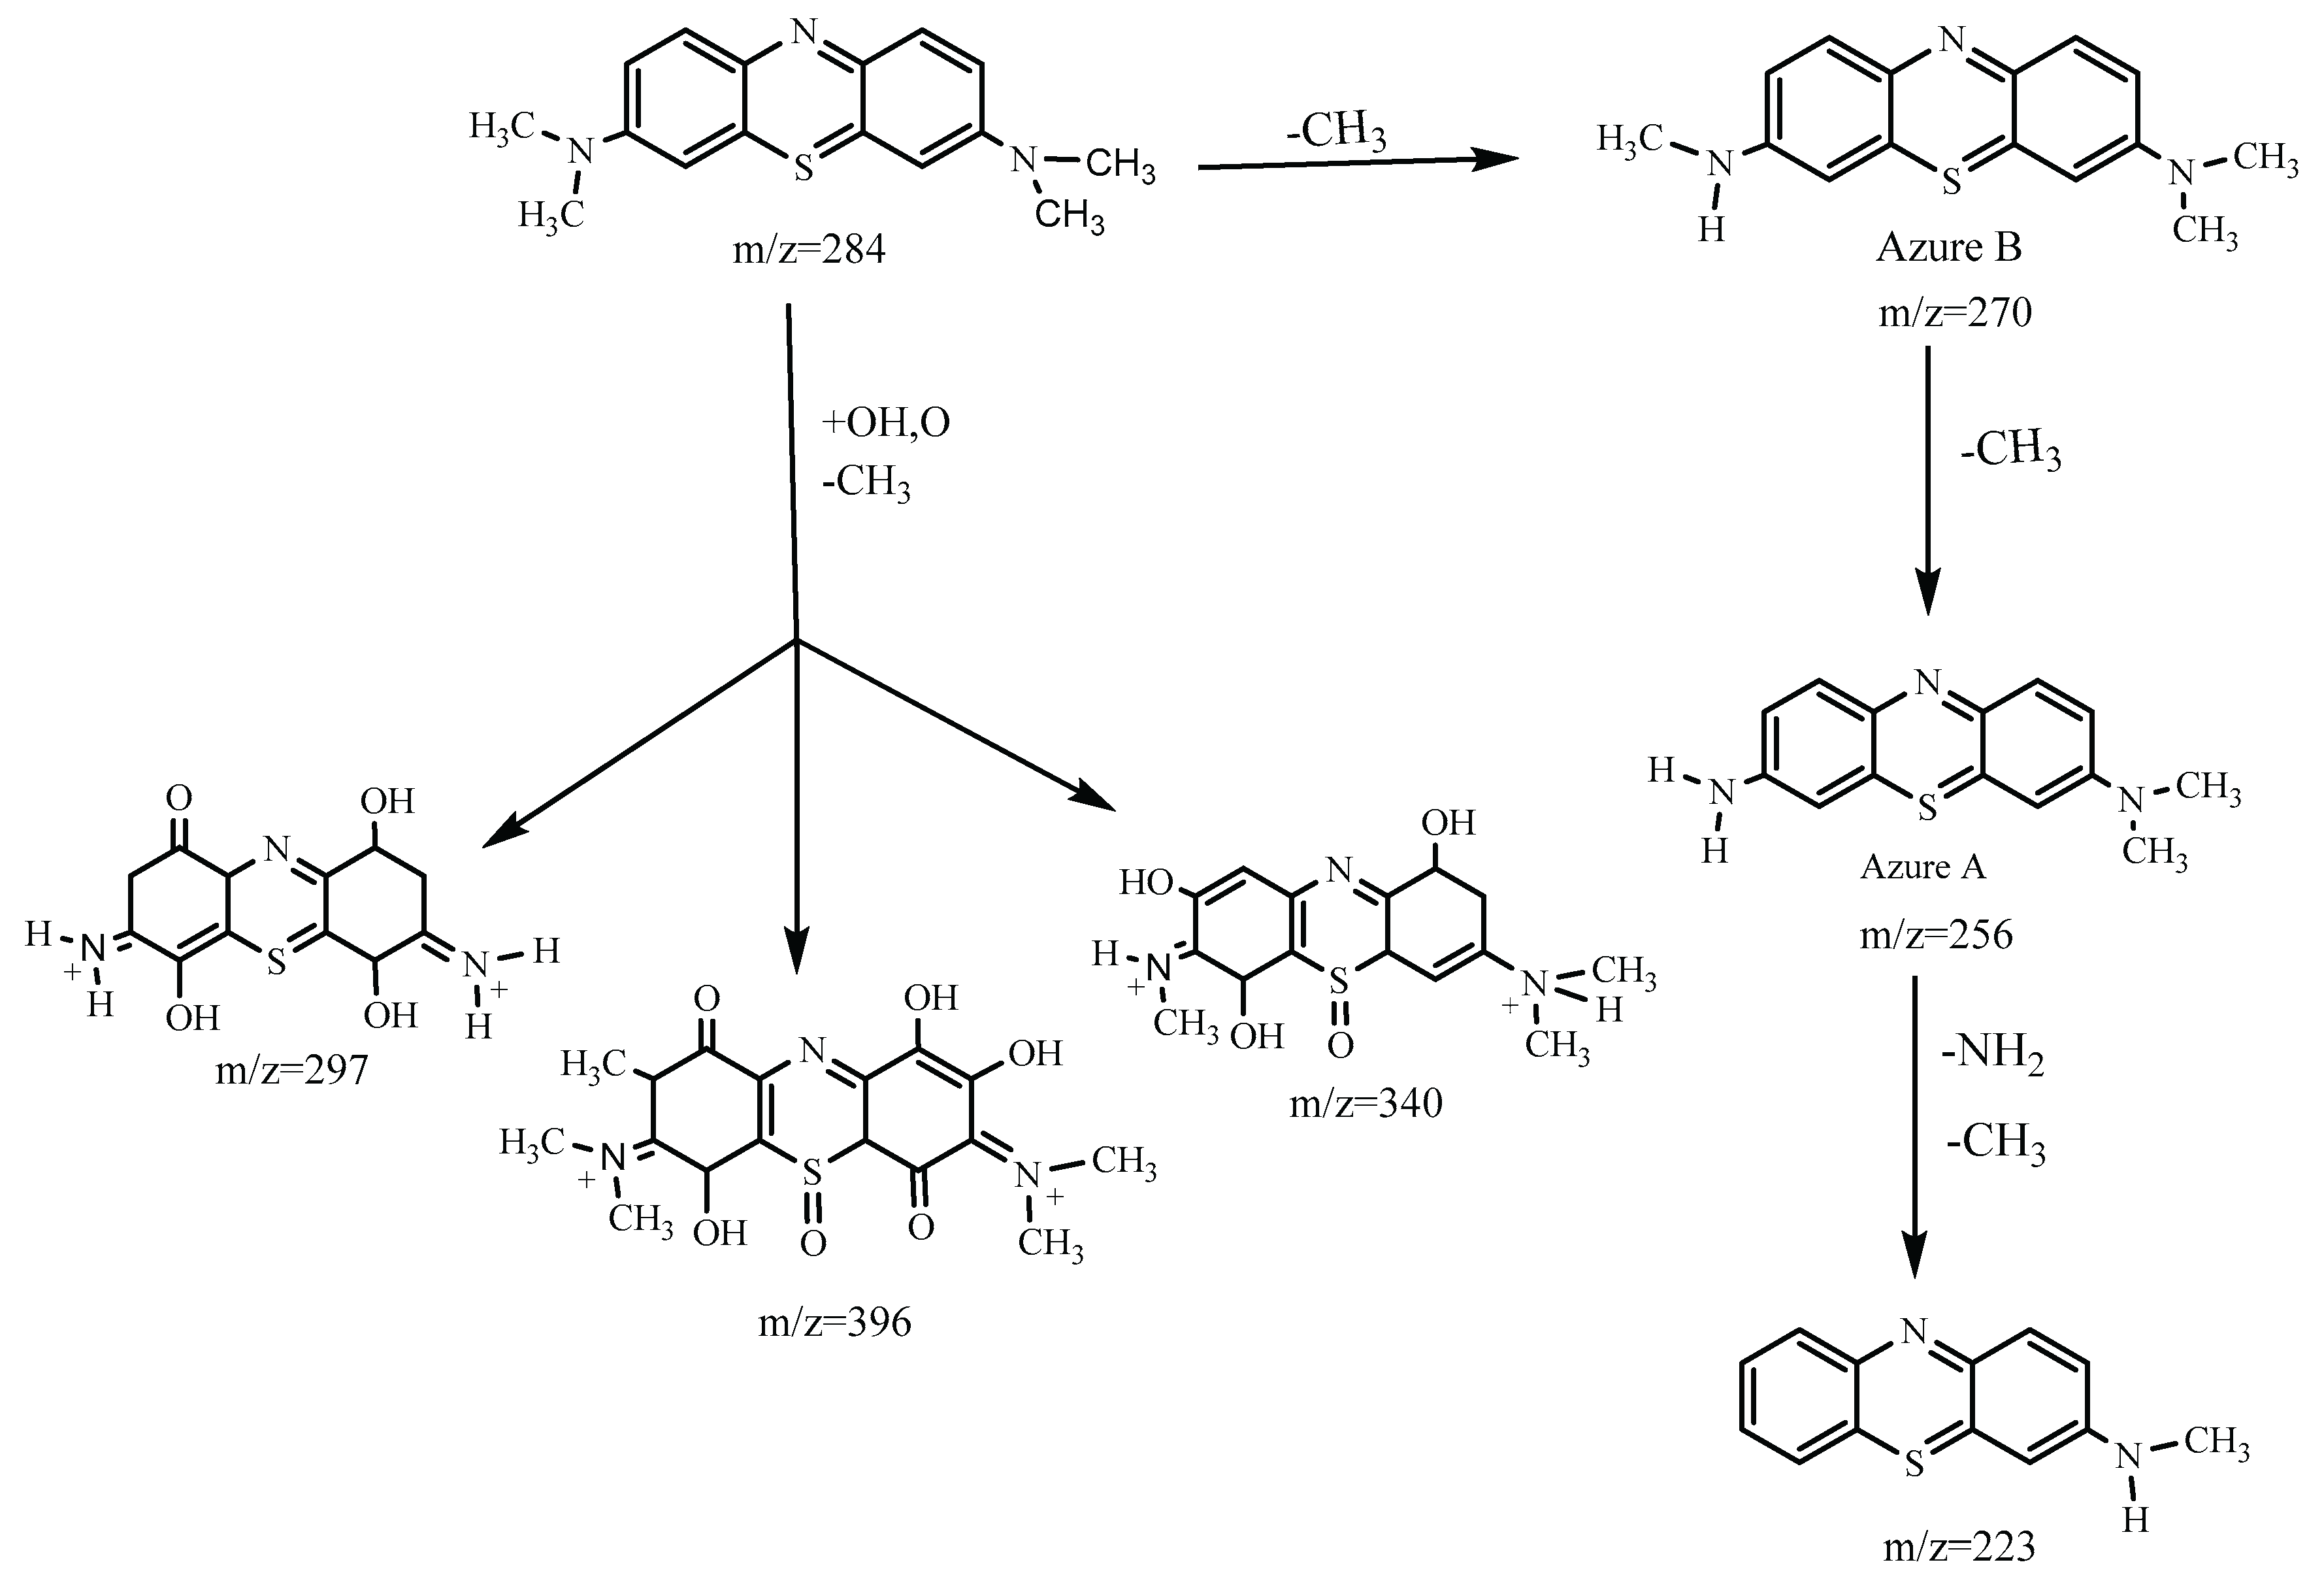
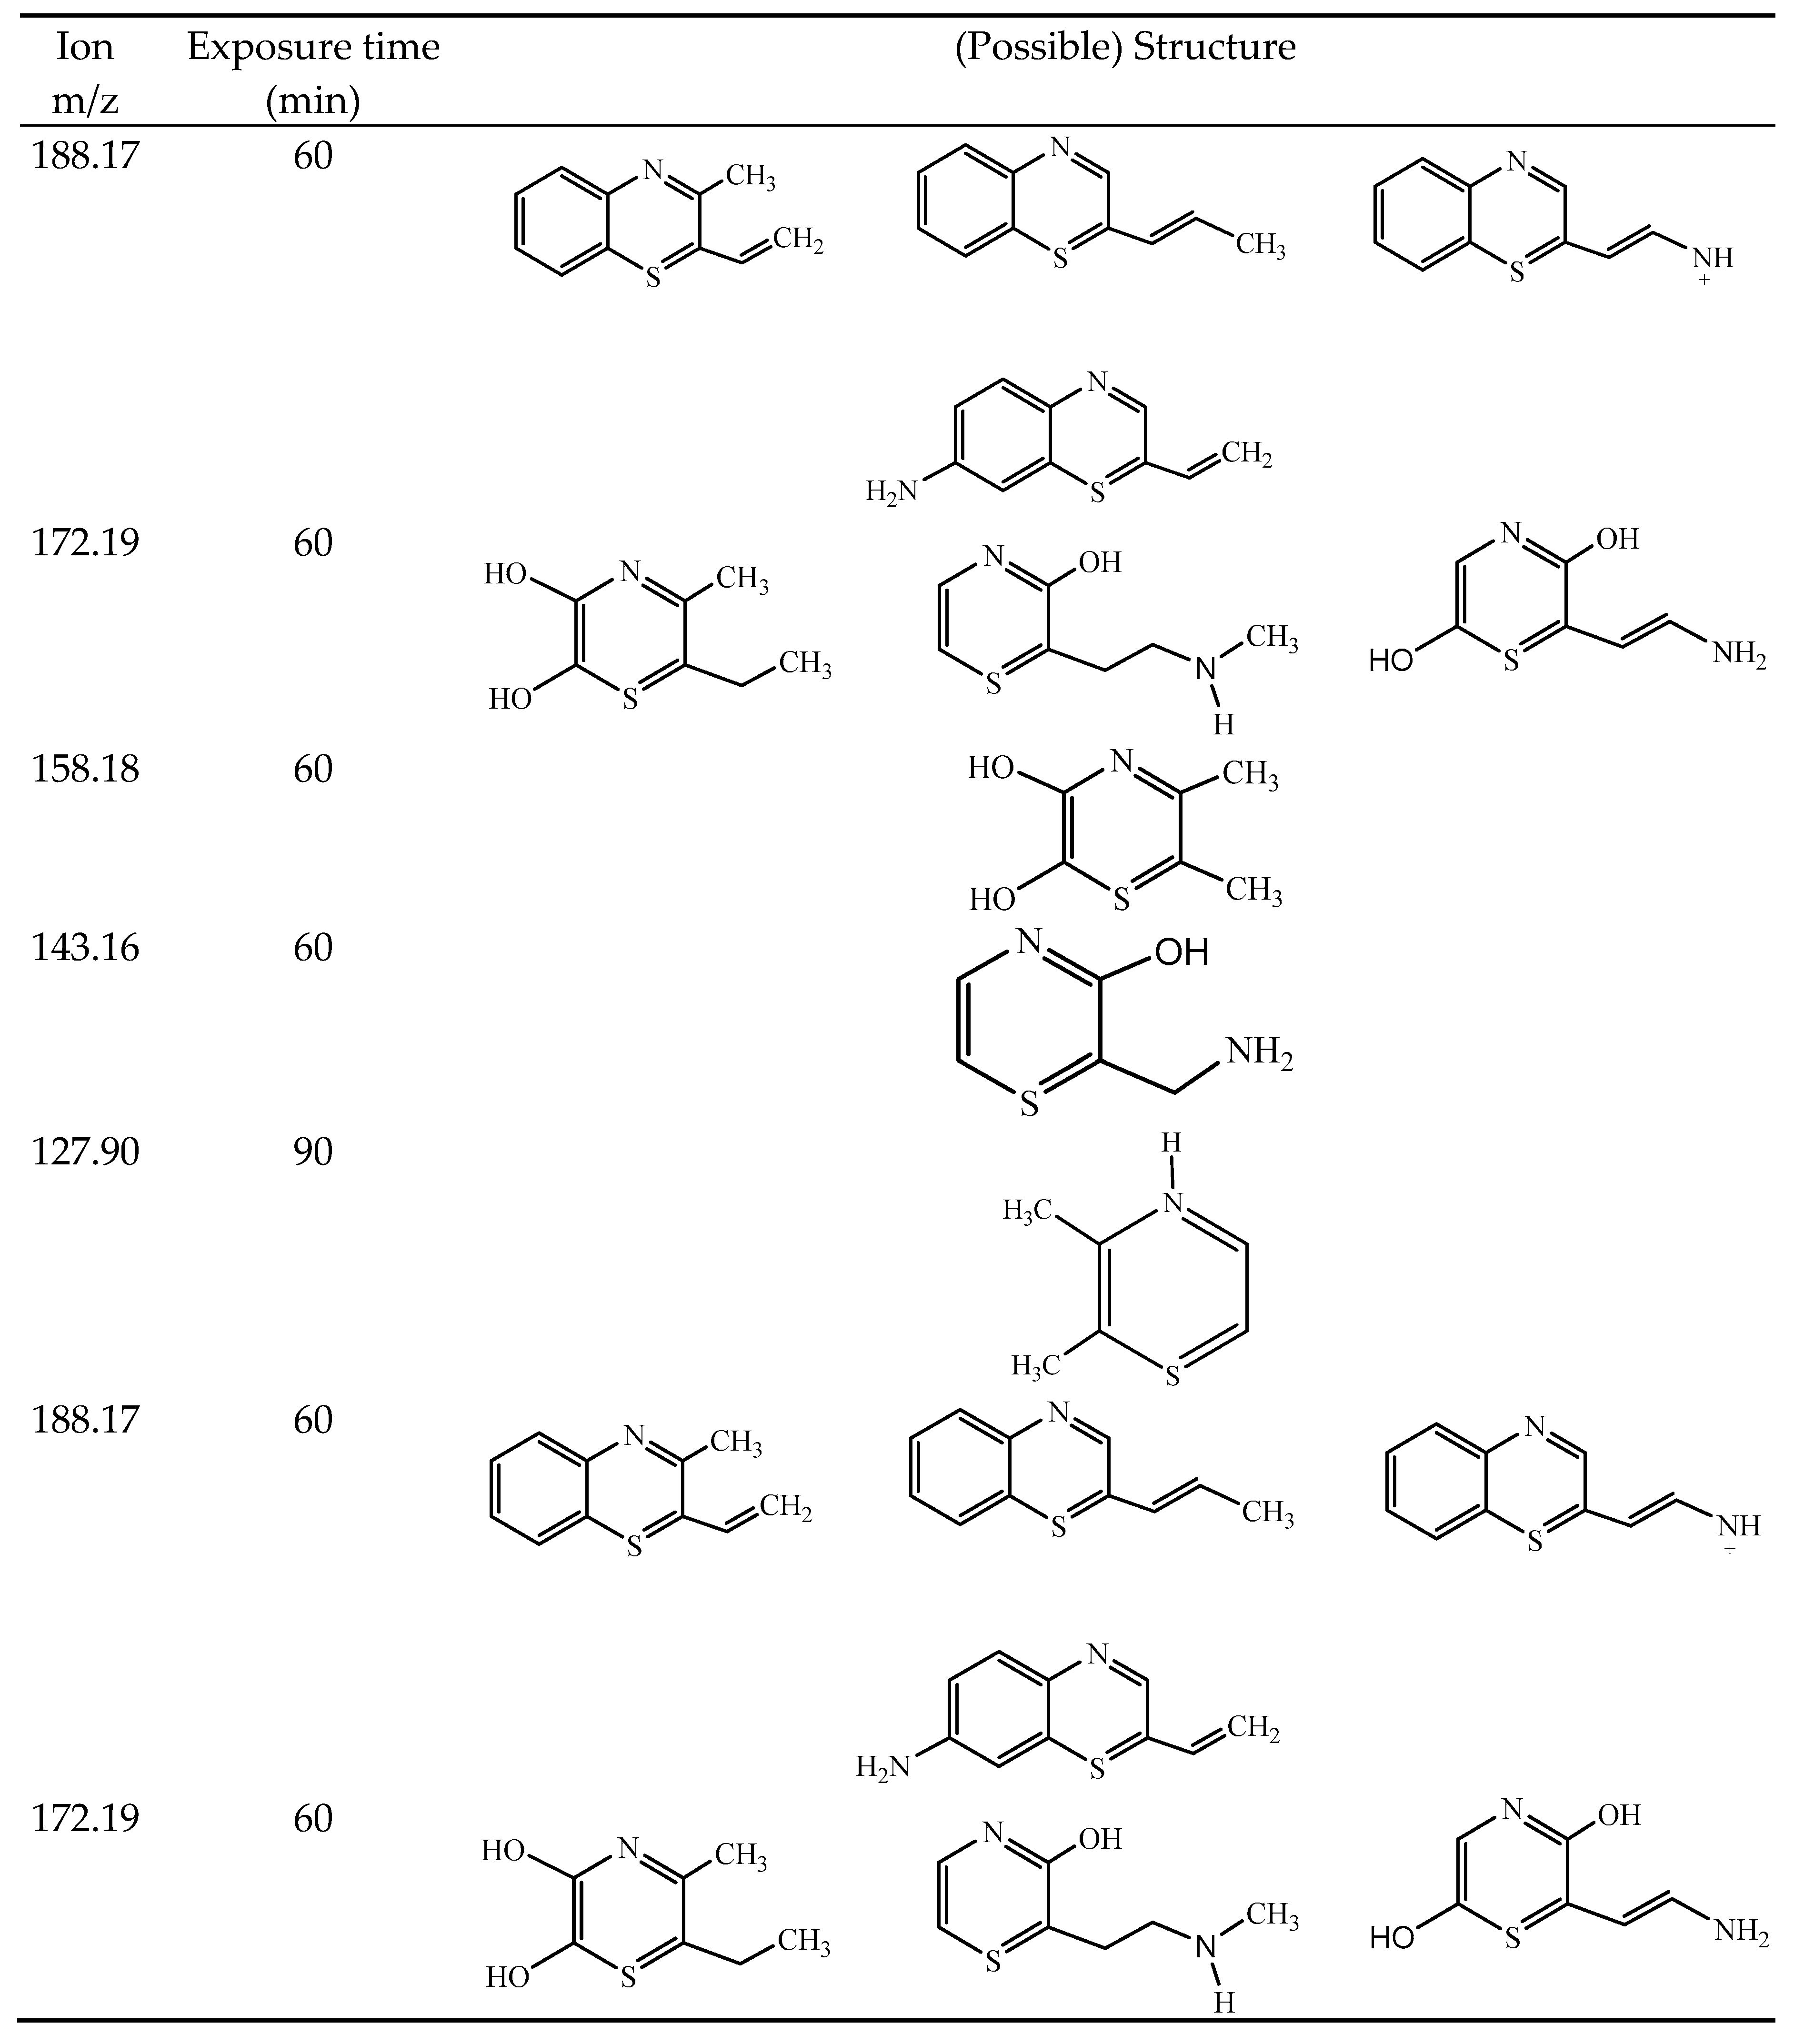
The ESI-MS spectrum of the initial MB solution (MB 0) showed a dominant molecular ion peak at m/z 284 [50,51,52,53,54,55], confirming the presence of intact MB. After 15 minutes of irradiation (MB 15), peaks mainly appear at m/z 256 and m/z 270 corresponding to Azure A, and Azure B, respectively [51]. The peak at m/z 223 corresponds to the N-demethylation products, as suggested by the observed blue shift in the UV-vis spectrum (Figure 4). The peak at m/z 297 can be explained by multiple hydroxylation of the MB molecule [52,54]. The spectrum after 30 minutes of irradiation does not show any significant changes, but as the irradiation continued (MB 60), the formation of peaks at m/z 188, 172, and 158 [53] revealed oxidative fragmentation and ring-opening processes, aligning with the diminishing absorption intensity in UV-vis measurements. The increase in the intensity of products formed by oxidation and hydroxylation of MB molecule, particularly in the final stages (MB 90 and MB 120), leads to the conclusion that MB has been completely degraded. Scheme 1 presents the presumed degradation mechanism of MB during photodegradation in the presence of Zn₂SnO₄/SnO₂, while the possible structures of degradation products detected at various UV exposure times are provided in Table 3. Heatmaps 1 and 2, which track the relative intensities of the peaks in the mass spectra over time (up to 30 minutes, and from 60 minutes onward), illustrate the variation in the abundance of intermediates during MB photodegradation. These data demonstrate that as the initial intensity of intact MB (m/z 284) gradually decreases, early intermediates, such as N-demethylation products (m/z 223), Azure A (m/z 256), and Azure B (m/z 270), form rapidly, but their intensity decreases as the reaction progresses, confirming that they are transient degradation products [53]. The intermediate product at m/z 277 exhibits oscillatory dynamics, suggesting a continuous transformation. The formation of oxidative products, especially the peaks at m/z 340 and m/z 396, becomes more pronounced in the later stages, supporting the hypothesis that MB does not degrade solely via demethylation but also through advanced oxidative transformations that lead to final fragmentation and eventual mineralization of the initial molecule. However, additional validation is required. The observed evolution of peak intensities indicates that MB degradation occurs through a sequence of interconnected reactions-from initial demethylation and hydroxylation processes, through the formation of intermediate oxidized products, to complete fragmentation and mineralization.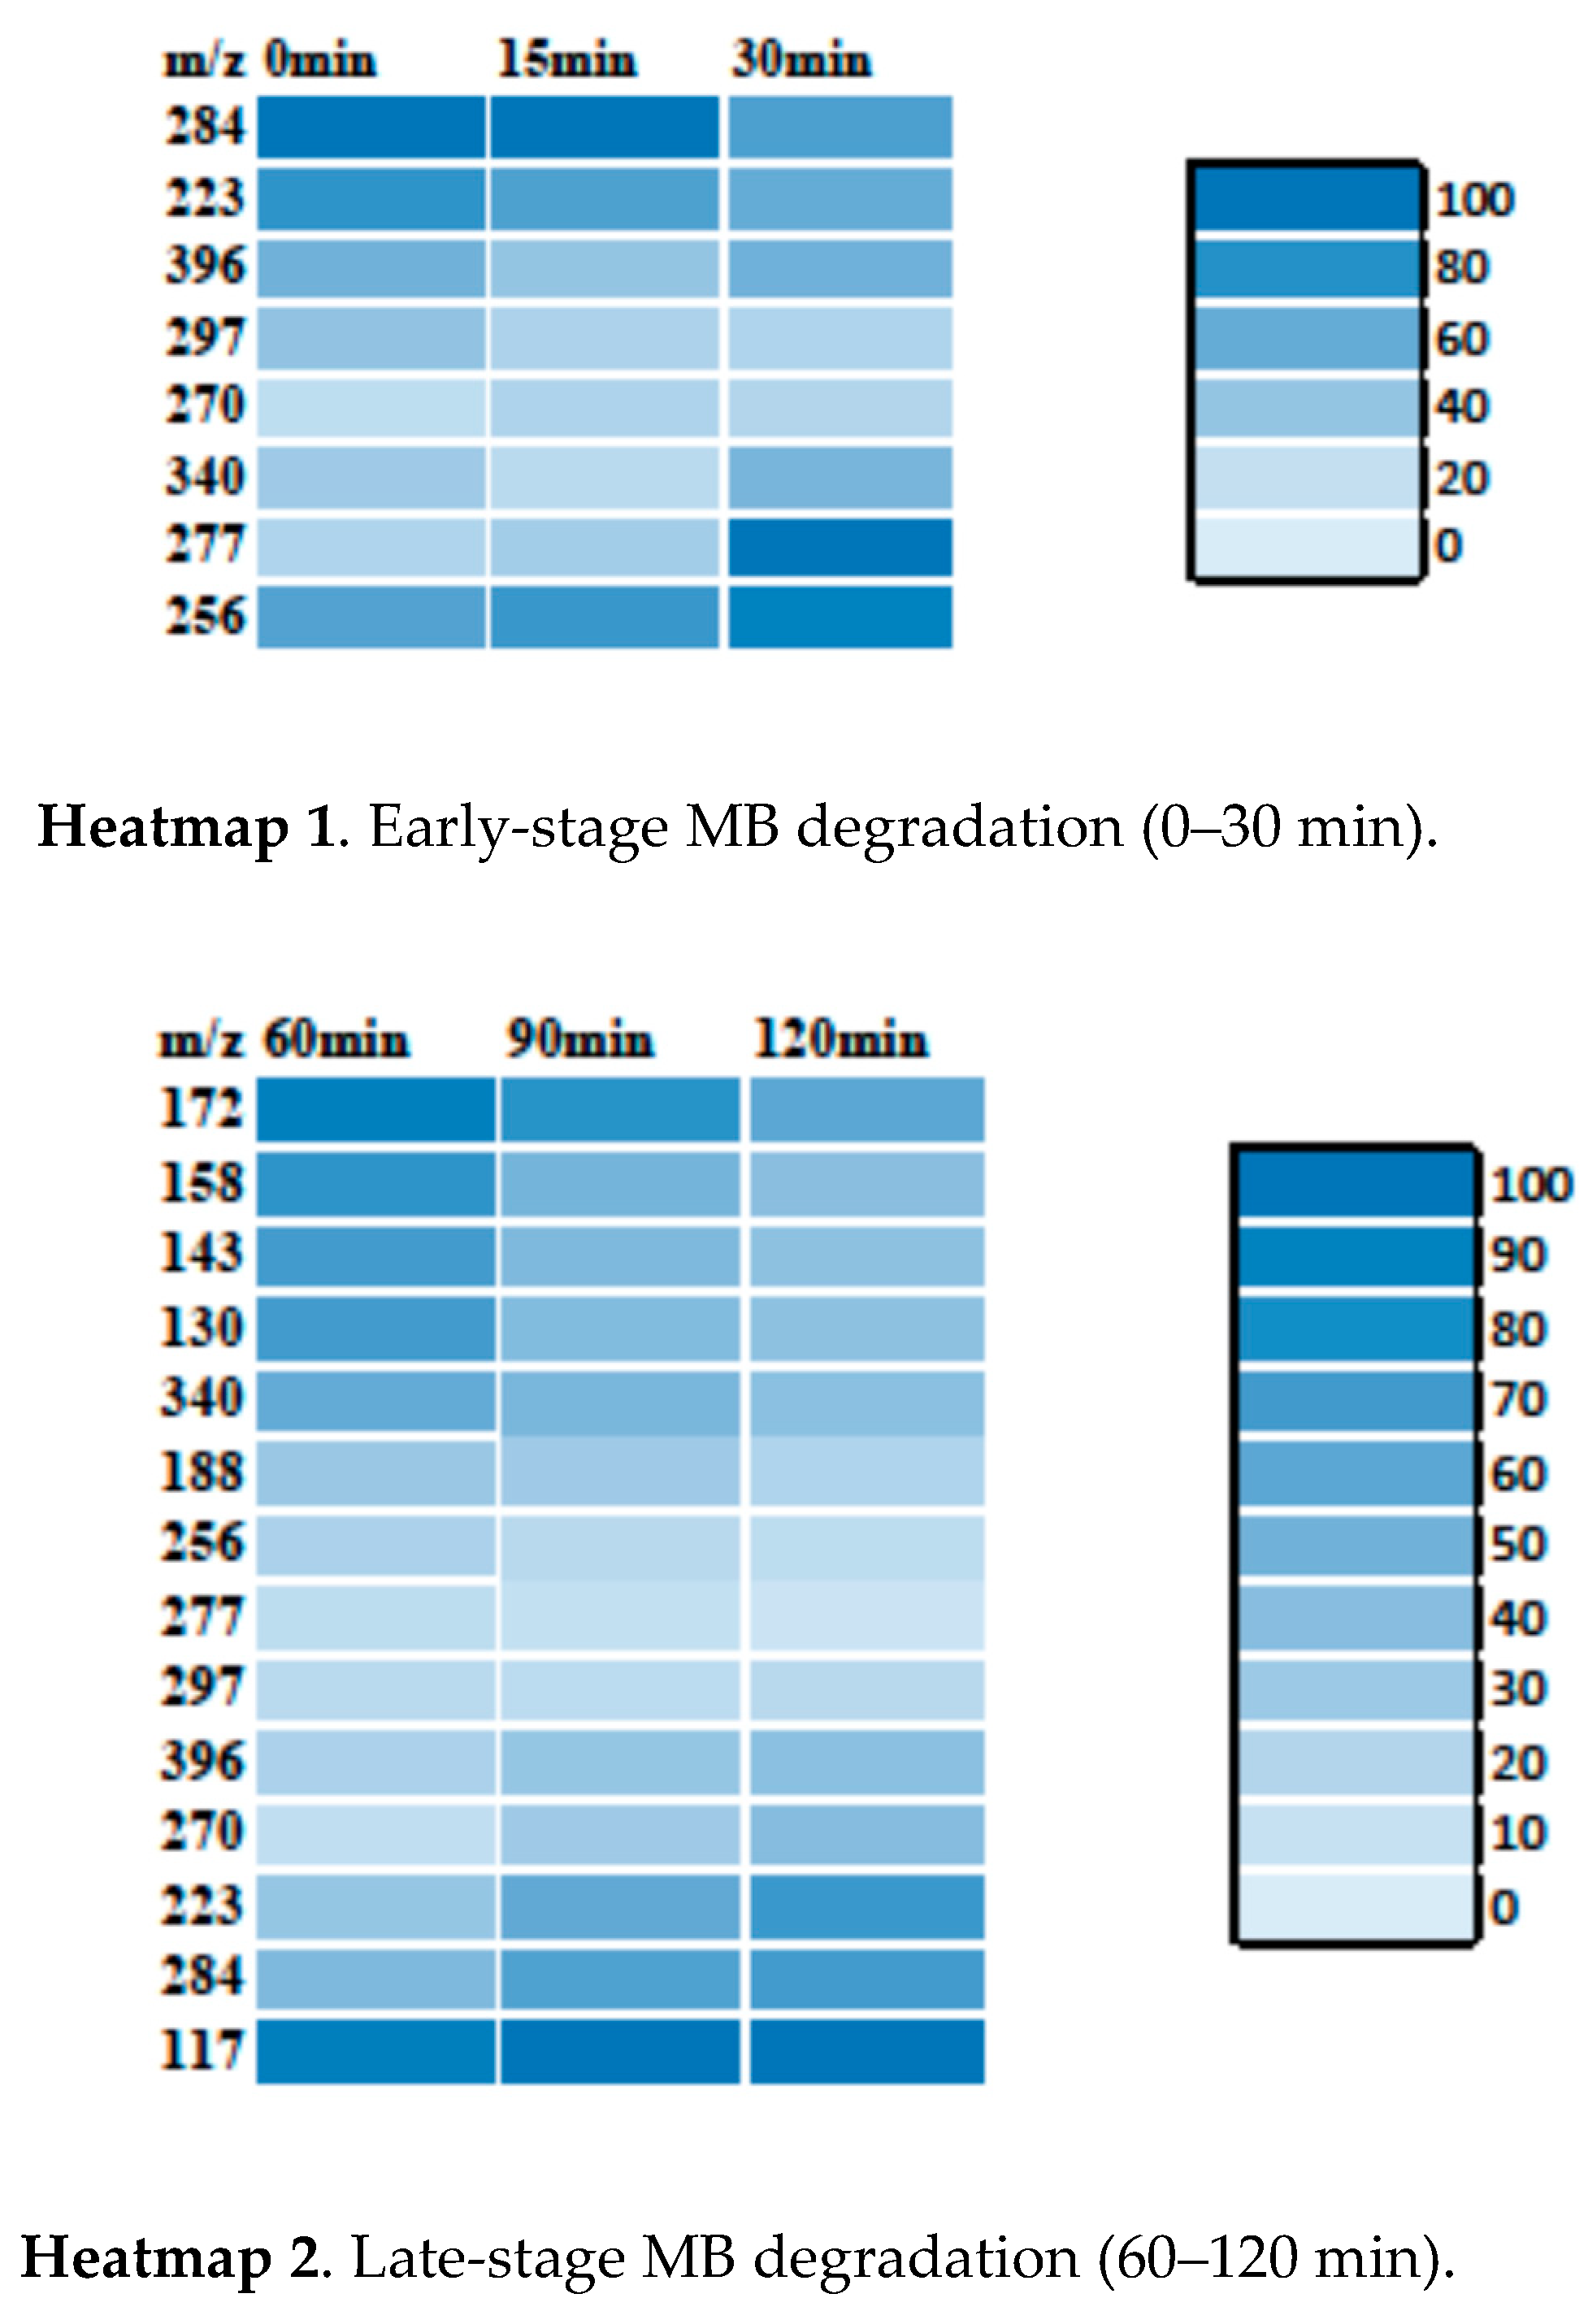
Scheme 1.
Presumed degradation mechanism of MB during photodegradation in the presence of Zn2SnO4/SnO2.
Scheme 1.
Presumed degradation mechanism of MB during photodegradation in the presence of Zn2SnO4/SnO2.
3.3.2. RhB Degradation Pathway
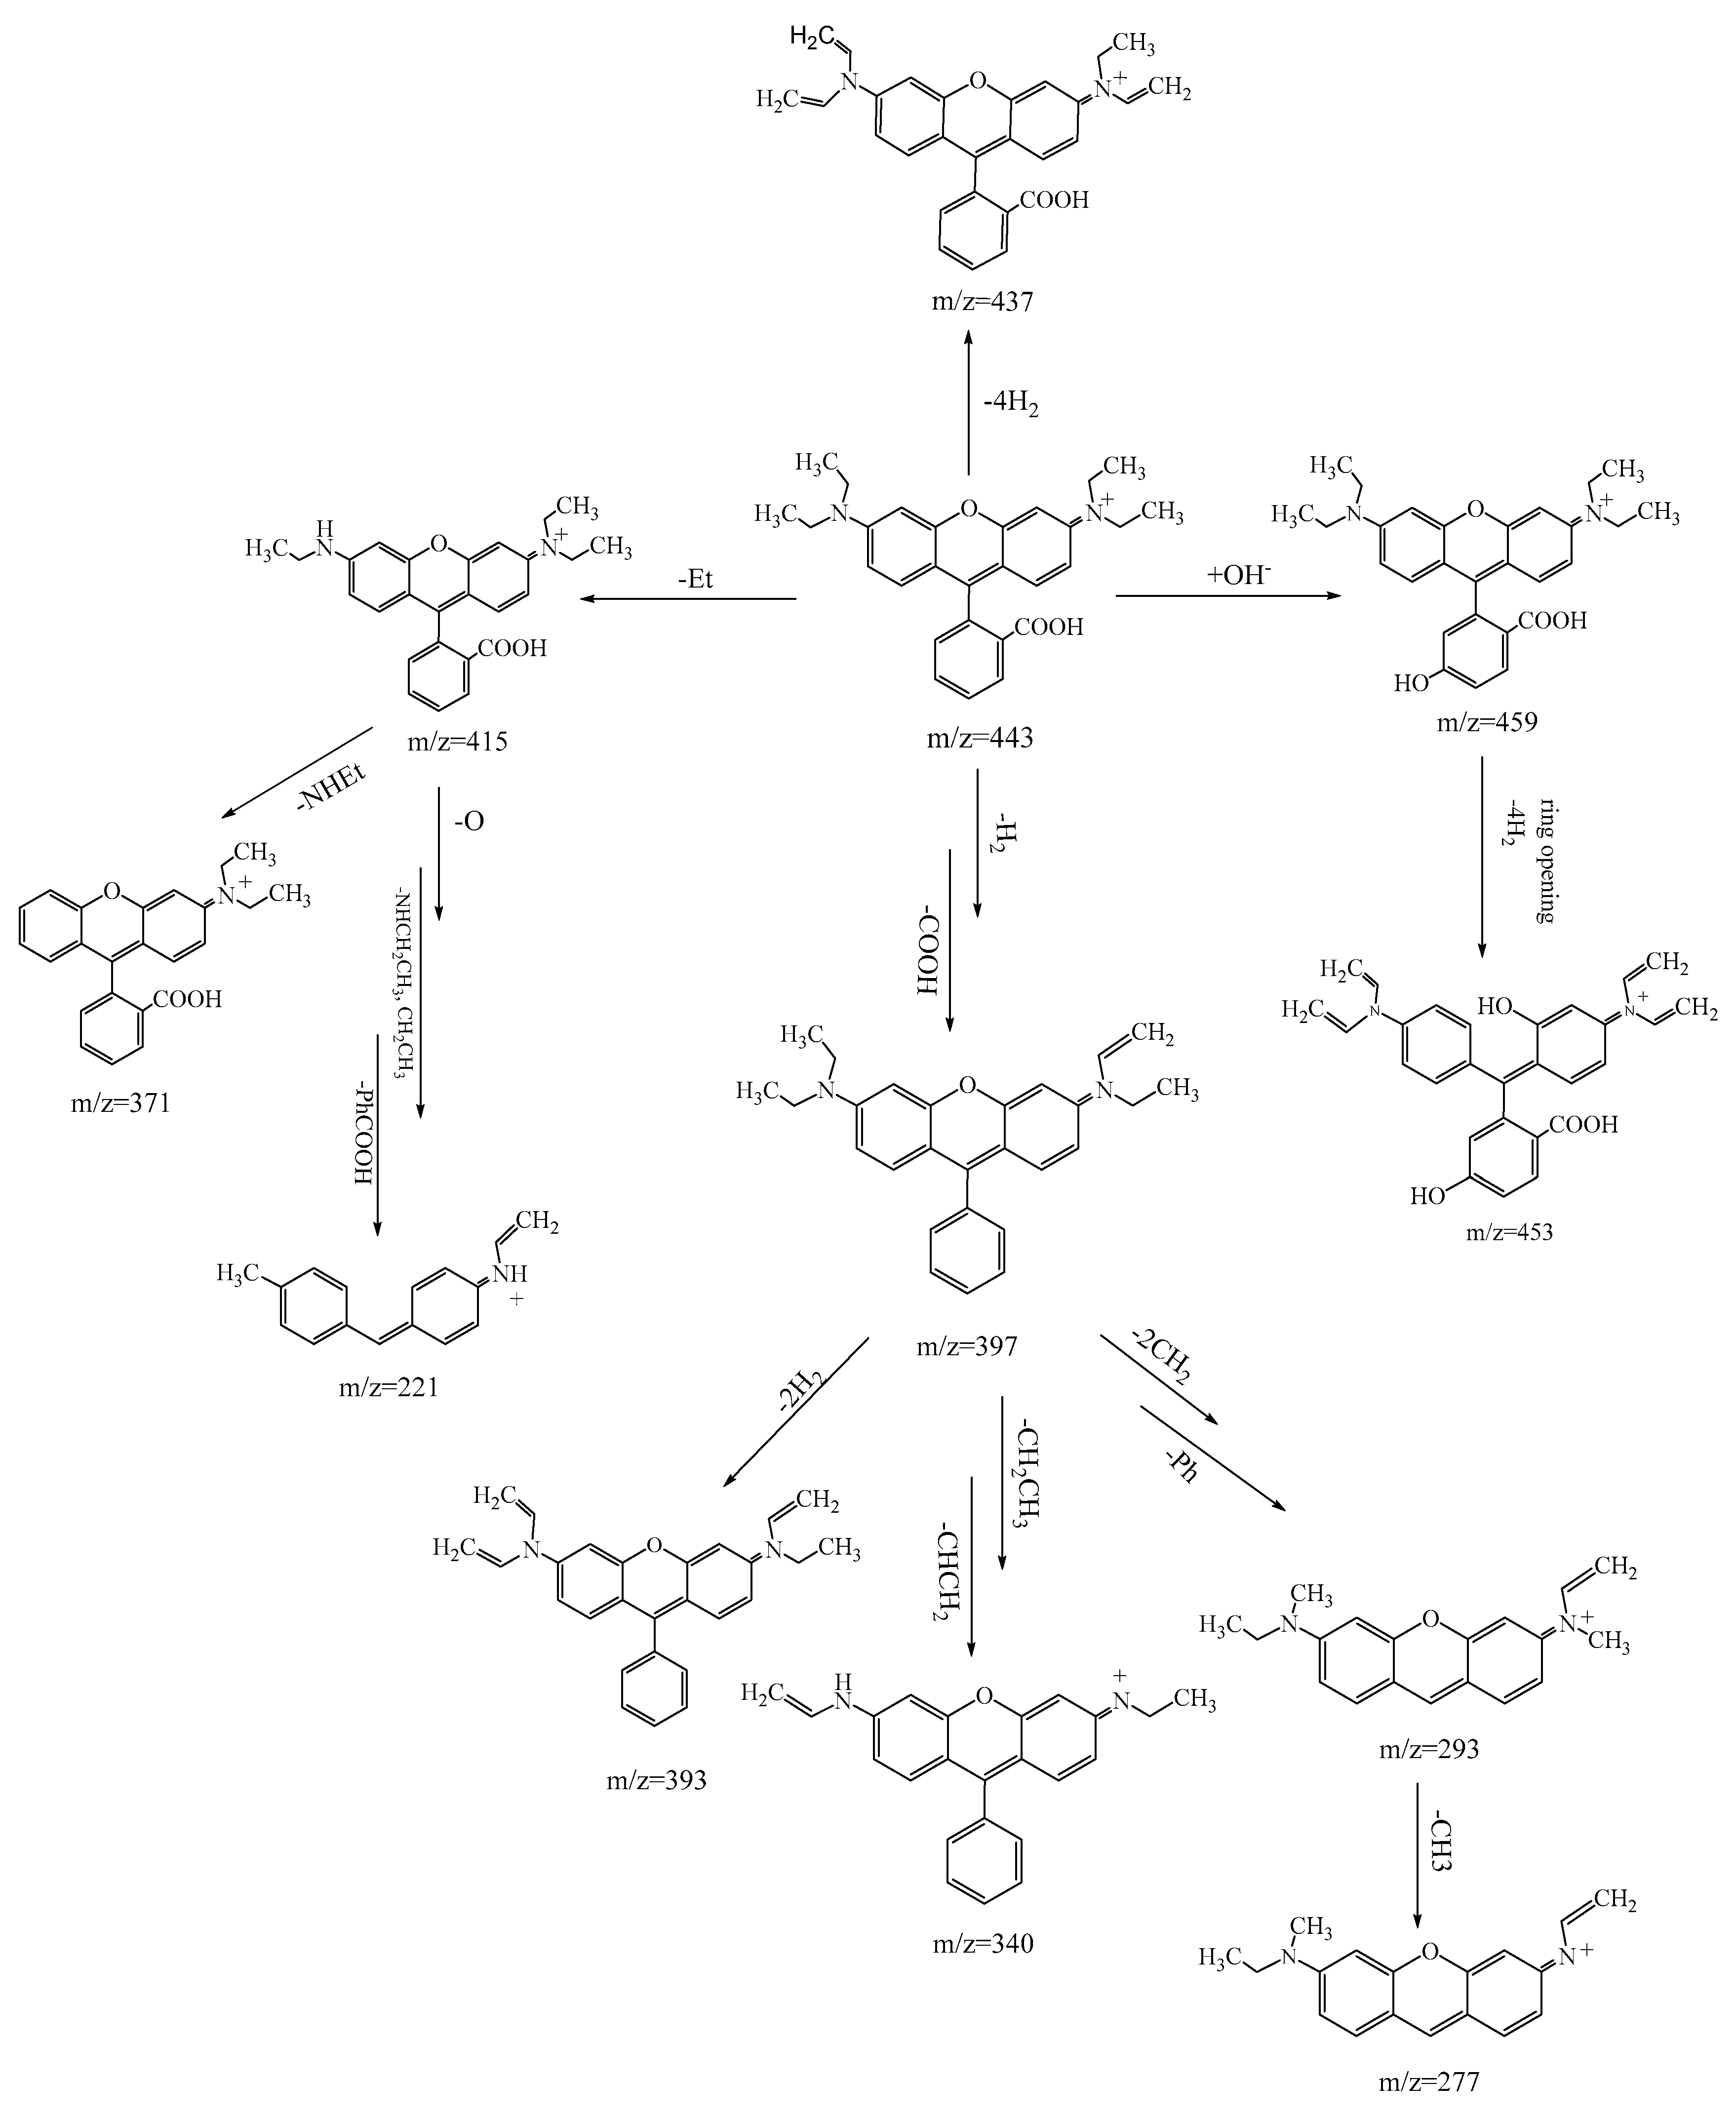
Based on the Heatmap 3 of m/z intensity values from the MS spectra of RhB photodegradation (time intervals: 0, 15, 30, 60, 90, and 120 minutes), it is possible to hypothesize a photodegradation pathway for rhodamine B that essentially consists of two notable processes: sequential N deethylation [48,55,56,57] and fragmentation of the xanthene ring [48]. In addition to these two mechanisms, dealkylation, deamination, decarboxylation, dehydration, chromophore cleavage or disruption of conjugation, and rupture of the cyclic structure are also observed. The molecular ion (Rhb0) at m/z 443 [48,55,56,57,58] increases during the first 15 minutes and then decreases significantly by 60 minutes, eventually being present at less than approximately 6%. This trend indicates that the main molecular ion of RhB is rapidly consumed, thereby initiating the degradation process. It is observed that the main photodegradation products are the N deethylated intermediates at m/z 415 [48,55,56,57] and m/z 397 (the 28 mass unit difference between m/z 443 and m/z 415 corresponds to the loss of one ethyl group, which is characteristic of the first step of N deethylation). The subsequent transition to the ion at m/z 397 indicates an additional transformation via a decarboxylation mechanism [59]. The subsequent deethylation step, which leads to the formation of more stable products, is presumed to be responsible for the ions observed at m/z 340, which display a continuous increase (rising during the first 30 minutes and maintaining high values up to 120 minutes), indicating the formation of a more stable fragment resulting from further degradation of the preceding intermediates. Lower fragments, m/z 221, likely arise as a consequence of further cleavage of the aromatic system [59]. These peaks confirm a gradual fragmentation toward smaller molecules. We hypothesize that the ions at m/z 453, m/z 459 [58] and m/z 481 are predominantly transient signals in the early stages of degradation characteristic of short-lived intermediates that rapidly transform or may represent the presence of an impurity. The changes in the MS peak intensities clearly indicate that the photodegradation of rhodamine B follows a mechanism in which the initial rapid decrease of the parent ion (m/z 443) is accompanied by the simultaneous formation of N deethylation intermediates (m/z 415 and m/z 397) along with further deethylation step (m/z 340 and lower fragments). This pattern, confirmed by the temporal changes in intensity, is largely consistent with the results presented in previous studies [48,55,56,57,58,59]. Based on the current mass spectrum analysis, the possible photodegradation mechanism of RhB is proposed in Scheme 2.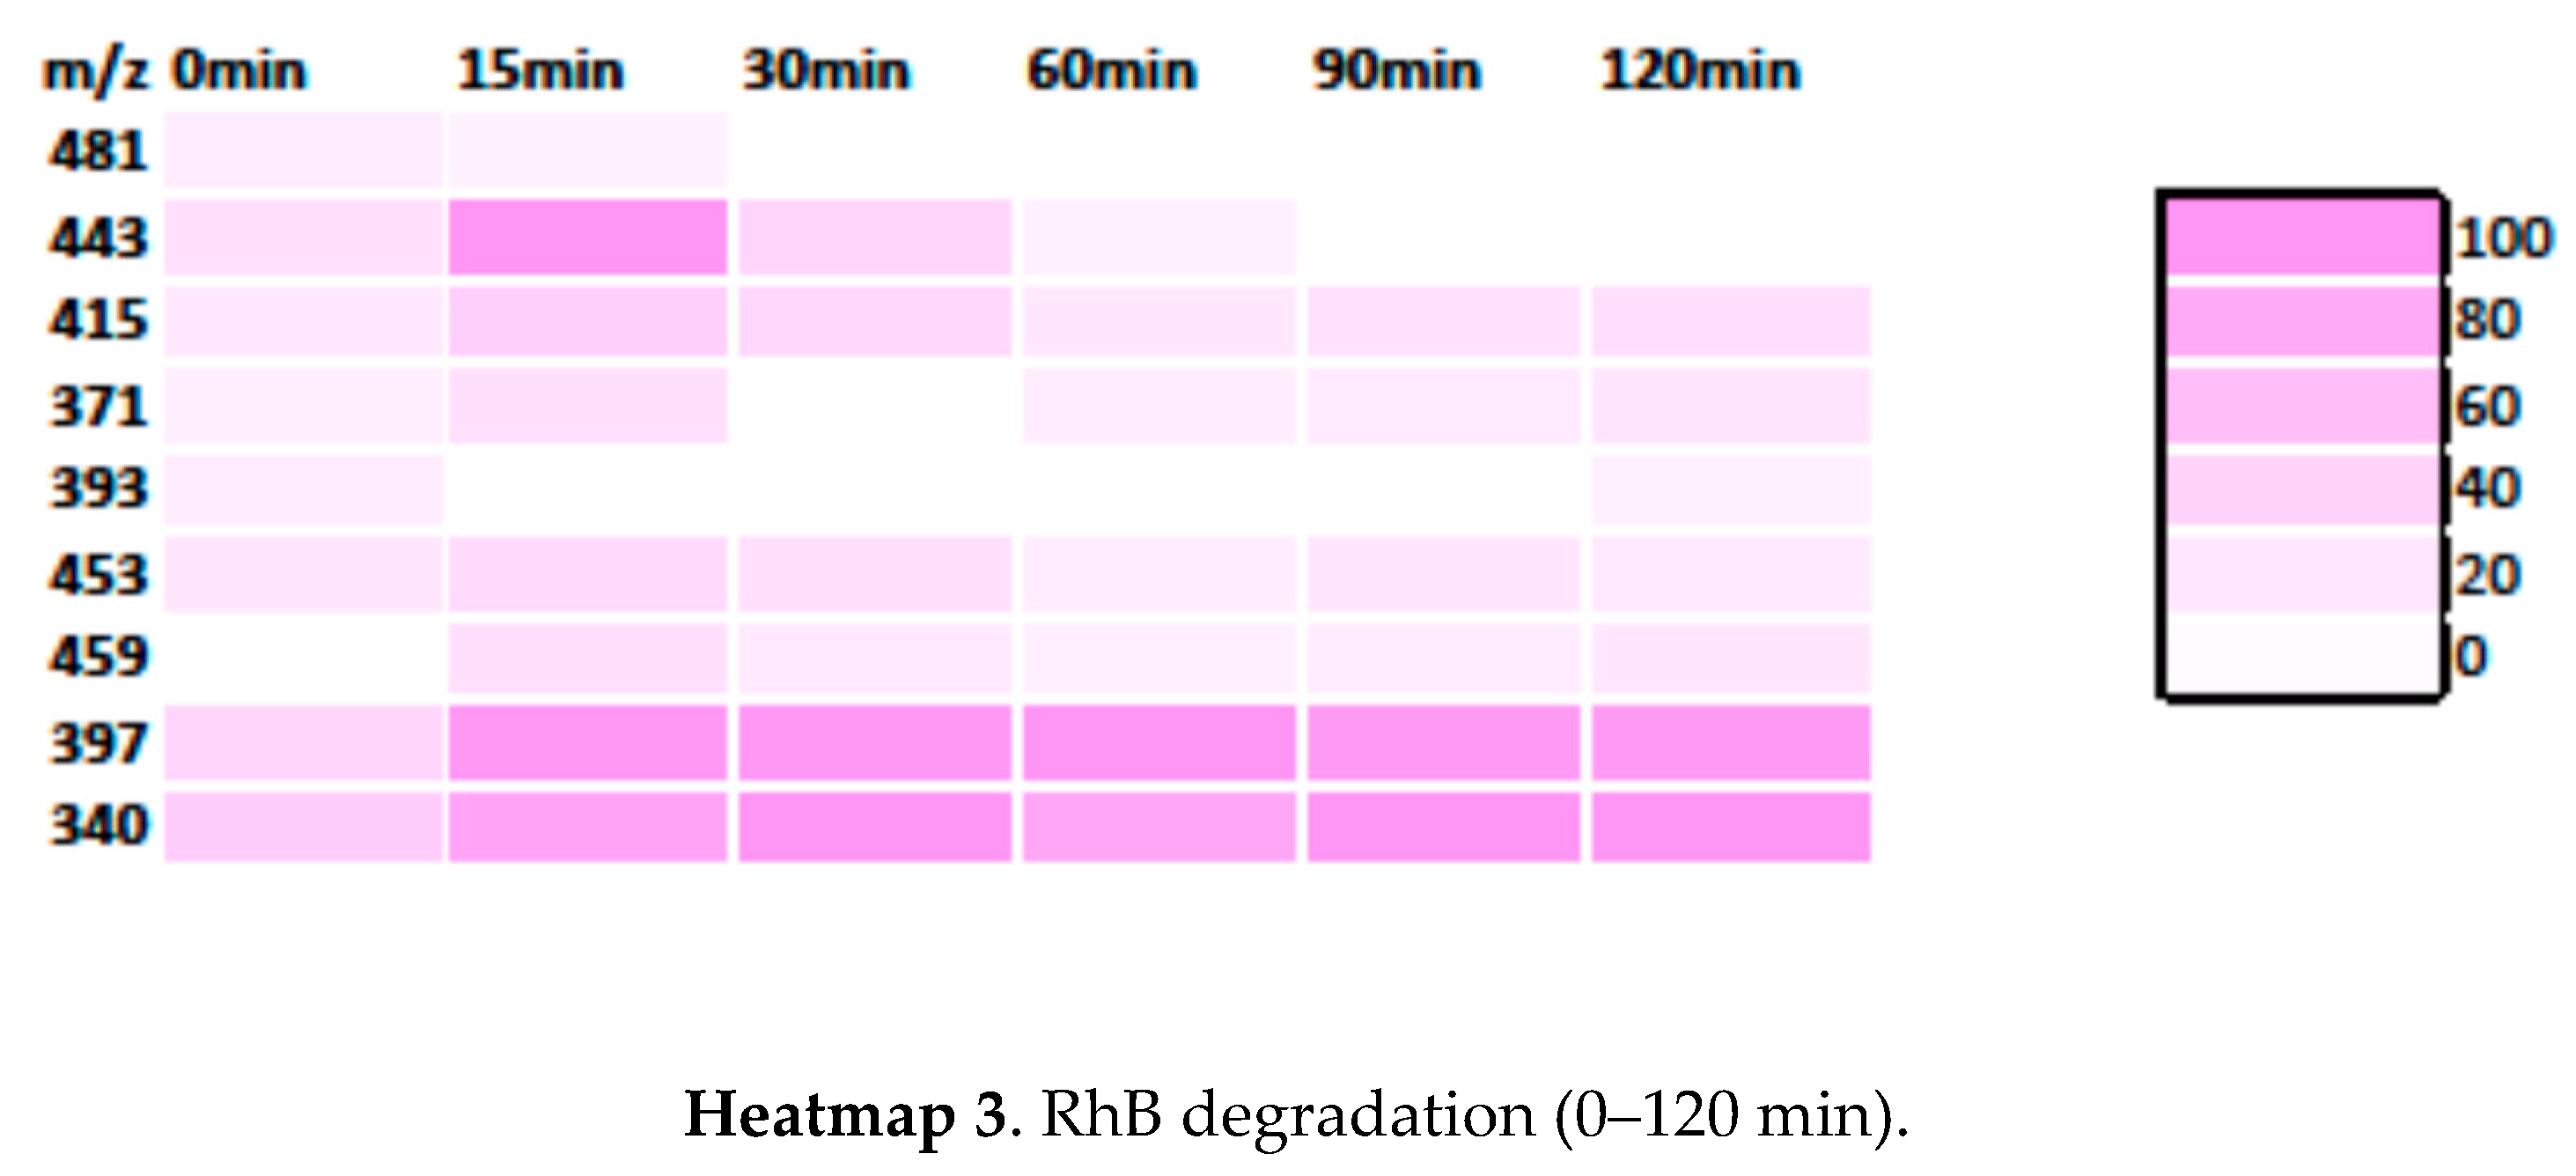
Scheme 2.
Presumed degradation mechanism of RhB during the photodegradation in the presence of Zn2SO4/SnO2.
Scheme 2.
Presumed degradation mechanism of RhB during the photodegradation in the presence of Zn2SO4/SnO2.
3.3.3. Degradation Pathway MB/RhB Mixture
Based on Heatmap 4, we assume that both dyes degrade through characteristic pathways: MB primarily via N-demethylation and the formation of “azure” intermediates, and RhB predominantly through sequential N-deethylation followed by fragmentation of the xanthene ring. More stable ions (e.g., m/z 340 for RhB and m/z 223/256 for MB) initially dominate and then gradually decrease as photodegradation proceeds toward smaller, final fragments. We further assume that fluctuations in the intensity of ionic peaks arise from competing reactions (oxidation, deamination, decarboxylation, and ring cleavage) as well as potential interactions between the two dyes when present together in solution. Overall, these observations lead us to assume that the photodegradation of the MB/RhB mixture occurs through a series of interconnected steps demethylation/deethylation, oxidative fragmentation, and ring cleavage resulting in the gradual loss of the characteristic chromophoric structures and the formation of smaller, potentially mineralized products.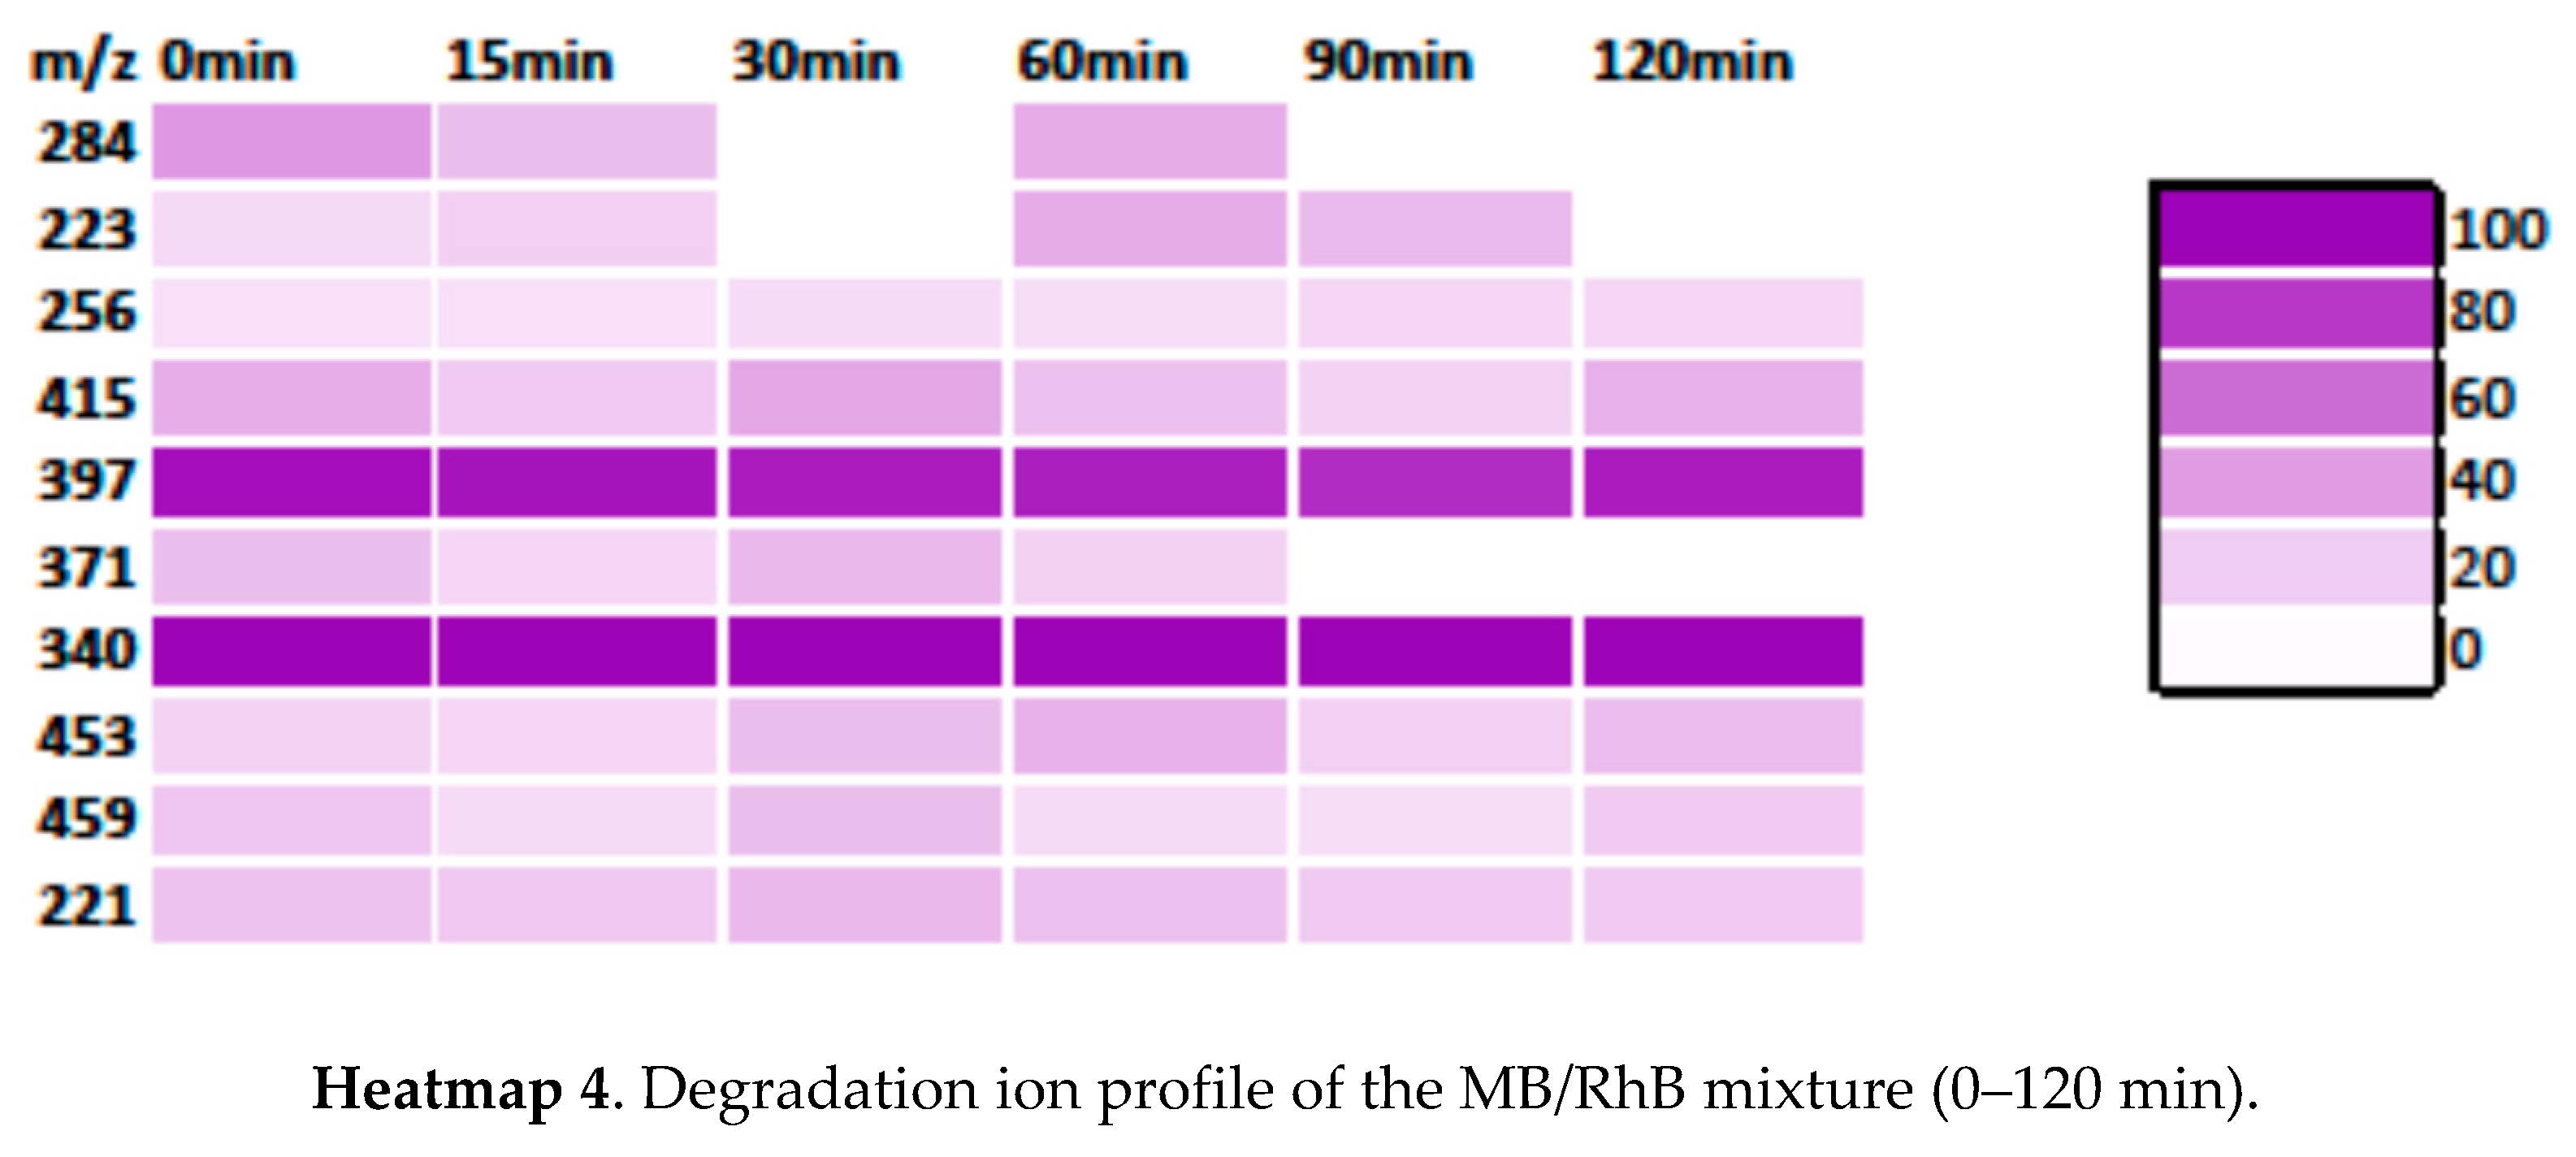
4. Conclusion
Solid-state synthesis was applied to obtain a Zn2SnO4/SnO2 nanocomposite with ~70% Zn2SnO4 and ~30% SnO2. Detailed structural and morphological characterization confirmed the formation of cubic spinel Zn2SnO4 (crystallite size 108 nm) and SnO2 (crystallite size 88 nm) heterojunction nanocomposite powder. The estimated band gap value from the absorption edge was 3.68 eV, and the first derivative of the measured reflrctance enabled identification of additional transition energy that can be attributed to the occurrence of heterojunctions between Zn2SnO4 and SnO2. The photocatalytic activity of this nanocomposite was evaluated on single component organic dyes RhB and MB and also multicomponent system containing a mixture of RhB and MB under natural sunlight irradiation. A high degradation rate of 99.1% (k = 0.03828 min-1) was achieved for MB after 120 min irradiation, while 70.58% (k = 0.01018 min-1) of RhB degraded in the same time using 50 mg of the photocatalyst material. In the case of the multicomponent system 15 mg of the photocatalysts material achieved degradation efficiency of 97.87% for MB. The degradation pathway was described for the MB, RhB and MB+RhB, showing that in the mixed (multicomponent) dye system it occurred through a series of interconnected steps consisting of demethylation/deethylation, oxidative fragmentation, and ring cleavage resulting in the gradual loss of the characteristic chromophoric structures and the formation of smaller, potentially mineralized products.
Author Contributions
Conceptualization: M.V.N; Investigation: M.V.N., Z.Z.V, M.D., N.R., J.V., M.T. and N.B.T; Methodology: M.V.N and Z.Z.V; Formal analysis: M.V.N, N.R., M.T. and M.D.; Visualization: M.V.N. and M.D.; Writing-original draft: M.V.N and M.D.; Writing-review & editing: M.V.N, Z.Z.V., M.D., N.R. and N.B.T. All authors have read and agreed with the final version of the manuscript. All authors have read and agreed to the published version of the manuscript.
Funding
This work was funded by the Ministry for Science, Innovations and Technological Development of the Republic of Serbia contracts 451-03-136/2025-03/200053 (MVN, ZZV, MD, MT), 451-030-136/2025-03/200017 (NR) and 451-030-136/2025-03/200175 (JV).
Data Availability Statement
Data available on request from authors.
Acknowledgements
UHPLC/MS2 analysis was performed at the Department of Plant Physiology of the Institute for Biological Research “Siniša Stanković” - National Institute of the Republic of Serbia, University of Belgrade. The authors thank Dr. Danijela Mišić, Dr. Uroš Gašić and Valentina Ćurić for their professional help.
Conflicts of Interest
The authors declare no conflicts of interest.
References
- Byrne, C.; Subramanian, G.; Pillai, S. C. Recent advances in photocatalysis for environmental applications. J. Environ. Chem. Eng. 2018, 6, 3531–3555. [Google Scholar] [CrossRef]
- Son, B. T.; Long, N. V.; Hang, N. T. N. Fly ash-, foundry sand-, clay- and pumice-based metal oxide nanocomposite as green photocatalysts. RSC Adv. 2021, 11, 30805. [Google Scholar] [CrossRef] [PubMed]
- Chiu, Y. H.; Chang, T. F. M.; Chen, C. Y.; Sone, M.; Hsu, Y. J. Mechanistic insights into photodegradation of organic dyes using heterostructure photocatalysts. Catalysts 2019, 9, 430. [Google Scholar] [CrossRef]
- Iqbal, M. A.; Akram, S.; Khalid, S.; Lal, B.; Mushtaq, M.; Chinibayeva, N.; Hosseini-Bandegharaei, A. Advanced photocatalysis as a viable and sustainable wastewater treatment process: A comprehensive review. Environ. Res. 2024, 253, 118947. [Google Scholar] [CrossRef] [PubMed]
- Yadav, S.; Shakya, K.; Gupta, A.; Singh, D.; Chandran, A. R.; Aanappalli, A. V.; Eoyal, K.; Rani, N.; Saini, K. A review on degradation of organic dyes by using metal oxide semiconductors. Environ. Sci. Pollut. Res. 2023, 30, 71912–71932. [Google Scholar] [CrossRef] [PubMed]
- Samadi, M.; Zirak, M.; Naseri, A.; Kheirabadi, M.; Ebrahimi, M.; Moshfegh, A. Z. Design and tailoring of one dimensional ZnO nanomaterials for photocatalytic degradation of organic dyes: a review. Res. Chem. Intermed. 2019, 45, 2197–2254. [Google Scholar] [CrossRef]
- Din, M. I.; Khalid, R.; Najeeb, J.; Hussain, Z. Fundamentals and photocatalysis of methylene blue dye using various nanocatalytic assemblies – a critical review. J. Cleaner Prod. 2021, 298, 126567. [Google Scholar] [CrossRef]
- Dlugosz, O.; Staron, A.; Brzoza, P.; Banach, M. Synergistic effect of sorption and photocatalysis on the degree of dye removal in single and multicomponent systems on ZnO-SnO2. Environ. Sci. Pollut. Res. 2022, 29, 27042–27050. [Google Scholar] [CrossRef]
- Wang, H.; Zhang, L.; Chen, Z.; Hu, J.; Wang, Z.; Liu, J.; Wang, X. Semiconductor heterojunction photocatalysts: design, construction, and photocatalytic performance. Chem. Soc. Rev. 2014, 43, 5234–5244. [Google Scholar] [CrossRef]
- Tamez Uddin, Md.; Nicolas, Y.; Olivier, C.; Toupance, T.; Serrant, L.; Müller, M. M.; Kleebe, H. J.; Ziegler, J.; Jaegermann, W. Nanostructured SnO2-ZnO heterojunction photocatalysis showing enhanced photocatalytic activity degradation of organic dyes. Inorg. Chem. 2012, 51, 7764–7773. [Google Scholar] [CrossRef]
- Kumar, N.; Jung, U.; Jung, B.; Park, J.; Naushad, Mu. Zinc hydroxystannate/zinc-tin oxide heterojunctions for the UVC assisted photodegradation of methyl orange and tetracycline. Environ. Pollut. 2023, 316, 120353. [Google Scholar] [CrossRef] [PubMed]
- Markovic, S.; Stankovic, A.; Dostanic, J.; Veselinovic, Lj.; Mancic, L.; Skapin, S. D.; Drazic, G.; Jankovic-Castvan, I.; Uskokovic, D. Simultaneous enhancement of natural sunlight and artificial UV-driven photocatalytic activity of a mechanically activated ZnO/SnO2 composite. RSC Adv. 2017, 7, 42725–42737. [Google Scholar] [CrossRef]
- Le, T. H.; Tran, N. K.; Quynh, H. T. T.; Tvan, P. V. Effect of the composition ratio of ZnO/Zn 2SnO4 composite on its visible photocatalytic activities in the photodegracation of methylene blue and rhodamine B organic dyes. Physica Scripta 2025, 100, 1065986. [Google Scholar] [CrossRef]
- Vasiljevic, Z. Z.; Dojcinovic, M. P.; Vujancevic, J. D.; Jankovic-Castvan, I.; Ognjanovic, M.; Tadic, N. B.; Stojadinovic, S.; Brankovic, G. O.; Nikolic, M. V. Photocatalytic degradation of methylene blue under natural sunlight using iron titanate nanoparticles prepared by a modified sol-gel method. R. Soc. Open Sci. 2020, 7, 200708. [Google Scholar] [CrossRef] [PubMed]
- Rovisco, A.; Branquinho, R.; Martins, J.; Oliveira, M. J.; Nunes, D.; Fortunato, E.; Martins, R.; Barquinha, P. Seed-layer free zinc tin oxide tailored nanostructures for nanoelectronic applications: effect of chemical parameters. ACS Appl. Nano Mater. 2018, 1, 3986–3997. [Google Scholar] [CrossRef]
- Jia, T.; An, J.; Yu, D.; Li, J.; Fu, F.; Wang, K.; Wang, W. Continuously improved photocatalytic performance of Zn2SnO4/SnO2/Cu2O composites by structural modification. Nanomaterials 2019, 9, 1390. [Google Scholar] [CrossRef]
- Rovisco, A.; Branquinhlo, R.; Denermeier, J.; Freire, T.; Fortunato, E.; Martins, R.; Barquinha, P. Shape effect of zinc tin oxide nanostructures on photodegradation of methylene blue and rhodamine B under UV and visible light. ACS Appl. Nano Mater. 2021, 4, 1149. [Google Scholar] [CrossRef]
- Silvestri, S.; Facco de Oliviera, J.; Foletto, E.L. Degradation of methylene blue using Zn2SnO4 catalysts prepared with pore-forming agents. Mater. Res. Bull. 2019, 117, 56–62. [Google Scholar] [CrossRef]
- Junploy, P.; Thongtem, S.; Thongtem, T.; Phurnangrat, A. Photocatalytic activity of Zn2SnO4-SnO2 nanocomposites produced by sonochemistry in combination with high temperature calcination. Superlattice. Microst. 2014, 74, 173–183. [Google Scholar] [CrossRef]
- Li, B.; Luo, L.; Xiao, T.; Hu, X.; Lu, L.; Wang, J.; Tang, Y. Zn2SnO4-SnO2 heterojunction nanocomposites for dye sensitized solar cells. J. Alloys Compd. 2011, 509, 2186–2191. [Google Scholar] [CrossRef]
- Wang, J.; Li, H.; Meng, S.; Zhang, L.; Fu, X.; Chen, S. One-pot hydrothermal synthesis of highly efficient SnOx/Zn2SnO4 composite photocatalyst for the degradation of methyl orange and gaseous benzene. Appl. Catal. B 2017, 200, 19–30. [Google Scholar] [CrossRef]
- Keles, E.; Yildirim, M.; Öztürk, T.; Yildirim, O. A. Hydrothermally synthesized UV light active zinc stannate: tin oxide (ZTO: SnO2) nanocomposite photocatalysts for photocatalytic applications. Mater. Sci. Semicond. Proc. 2020, 110, 104959. [Google Scholar] [CrossRef]
- Junploy, P.; Phurvangrat, A.; Plubphon, N.; Thonglem, S. Photocatalytic degradation of methylene blue by Zn2SnO4-SnO2 system under UV visible radiation. Mater. Sci. Semicond. Proc. 2017, 66, 56–61. [Google Scholar] [CrossRef]
- Sun, L.; Han, X.; Jiang, Z.; Ye, T.; Li, R.; Zhao, X.; Han, X. Fabrication of cubic Zn2SnO4/SnO2 complex hollow structures and their sunlight-driven photocatalytic activity. Nanoscale 2016, 8, 12858. [Google Scholar] [CrossRef] [PubMed]
- Sun, L.; Li, S.; Su, Y.; He, D.; Zhang, Z. Surface-driven disorder engineered Zn2SnO4/SnO2 hollow microboxes with enhanced solar-driven photocatalytic activity. Appl. Surf. Sci. 2019, 463, 474–480. [Google Scholar] [CrossRef]
- Li, Z.; Zhao, Y.; Hua, L.; Xie, J.; Zhou, Y. Hollow SnO2/Zn2SnO4 cubes with porous shells towards n-butylamine sensing and photocatalytic applications. Vacuum 2020, 182, 109693. [Google Scholar] [CrossRef]
- Tang, M.; Snoussi, Y.; Bhakta, A. K.; El Garah, M.; Khalil, A. M.; Ammar, S.; Chehimi, M. M. Unusual, hierarchically structured composite of sugarcane pulp bagasse biochar loaded with Cu/Ni bimetallic nanoparticles for dye removal, Environ. Res. 2023, 232, 116232. [Google Scholar] [CrossRef]
- Yusuff, A. S.; Popoola, L. T.; Aderibigde, E. I. Solar photocatalytic degradation of organic pollutants in textile industry wastewater by ZnO/pumice composite photocatalyst. J. Environ. Chem. Eng. 2020, 8, 103907. [Google Scholar] [CrossRef]
- Nikolic, M. V.; Labus, N.; Pavlovic, V. P.; Markovic, S.; Lukovic, M. D.; Tadic, N.; Vujancevic, J.; Vlahovic, B.; Pavlovic, V. B. Nanocrystalline Zn2SnO4/SnO2: Crystal structure and humidity influence on complex impedance. J. Electroceram. 2020, 45, 135–147. [Google Scholar] [CrossRef]
- Toby, B. H.; Von Dreele, R. B. GSAS II the genesis of an open-source all-purpose crystallography software package. J. Appl. Crystallogr. 2013, 46, 544–549. [Google Scholar] [CrossRef]
- Momma, K.; Izumi, F. VESTA 3 for three dimensional visualization of crystal, volumetric and morphology data. J. Appl. Crystallogr. 2011, 44, 1271–1276. [Google Scholar] [CrossRef]
- Gracia, L.; Beltran, A.; Andres, J. A theoretical study on the pressure induced phase transitions in the inverse spinel structure Zn2SnO4. J. Phys. Chem. C 2011, 115, 7740–7746. [Google Scholar] [CrossRef]
- Bao, L.; Zang, J.; Wang, G.; Li, X. Atomic-scale imaging of cation ordering in inverse spinel Zn2SnO4 nanowires. Nano. Lett. 2014, 14, 6505–6509. [Google Scholar] [CrossRef]
- Li, H.; Ma, Q.; Guo, J.; Zhang, Q.; Wang, X.; Wang, Y. Enhanced surface electron migration of porous and hollow SnO2/Zn2SnO4 heterostructures for efficient triethylamine sensing performance. Appl. Surf. Sci. 2022, 597, 153752. [Google Scholar] [CrossRef]
- Hu, J.; Xiong, X.; Guan, W.; Tan, C. Hollow mesoporous SnO2/Zn2SnO4 heterojunction and RGO decoration for high-performance detection of acetone. ACS Appl. Mater. Interfaces 2022, 14, 55249–55263. [Google Scholar] [CrossRef]
- Dong, S.; Cui, L.; Tian, Y.; Xia, L.; Wu, Y.; Yu, J.; Bagley, D. M.; Sun, J.; Fan, M. A novel and high-performance double Z-scheme photocatalyst ZnO-SnO2-Zn2SnO4 for effective removal of the biological toxicity of antibiotics. J. Hazardous Mater. 2020, 399, 123017. [Google Scholar] [CrossRef]
- Vasiljevic, Z. Z.; Lukovic, M. D.; Nikolic, M. V.; Tasic, N. B.; Mitric, M.; Aleksic, O. S. Nanostructured Fe2O3/TiO2 thick films: Analysis of structural and electronic properties. Ceram. Int. 2015, 41, 6889–6897. [Google Scholar] [CrossRef]
- Arlinghouse, F. Energy bands in stannic oxide (SnO2). J. Phys. Chem. Solids 1974, 35, 931–935. [Google Scholar] [CrossRef]
- Akgul, F. A.; Gumus, C.; Er, A. O.; Farha, A. H.; Akgul, G.; Ufuktepe, Y.; Liu, Z. Structural and electronic properties of SnO2. J. Alloys Compd. 2013, 579, 50–56. [Google Scholar] [CrossRef]
- Ahmed, A. S.; Azam, A.; Shafeq, M. , Chaman, M.; Tabassum, S. Temperature dependent structural and optical properties of tin oxide nanoparticles. J. Phys. Chem. Solids 2012, 73, 943–947. [Google Scholar] [CrossRef]
- Alpuche Aviles, M. A.; Wu, J. Photoelectrochemical study of the band structure of Zn2SnO4 prepared by the hydrothermal method. J. Am. Chem. Soc. 2009, 131, 3216–3224. [Google Scholar] [CrossRef]
- Jaculine, M. M.; Raj, C. J.; Das, S. J. Hydrothermal synthesis of highly crystalline Zn2SnO4 nanoflowers and their optical properties. J. Alloys Compd. 2013, 577, 131–137. [Google Scholar] [CrossRef]
- Lu, J.; Xie, Y.; Luo, F.; Fu, H.; Huang, X.; Liu, Y.; Liu, H. Heterostructures of mesoporous hollow Zn2SnO4/SnO2 microboxes for high-performance acetone sensors. J. Alloys Compd. 2020, 844, 155788. [Google Scholar] [CrossRef]
- Marotti, R. E.; Giorgi, P.; Machado, G.; Dalchielo, E. A. Crystallite size dependence of band gap energy for electrodeposited ZnO grown at different temperatures. Sol. Energy Mater. Sol. Cells 2006, 90, 2356–2361. [Google Scholar] [CrossRef]
- Soltani, T.; Entezari, M. H. Photolysis and photocatalysis of methylene blue by ferrite bismuth nanoparticles under sunlight irradiation. J. Mol. Catal. A Chem. 2013, 377, 197–203. [Google Scholar] [CrossRef]
- Wang, F.; Min, S.; Han, Y.; Feng, L. Visible-light-induced photocatalytic degradation of methylene blue with polyaniline-sensitized composite photocatalysts. Superlattice. Microst. 2010, 48, 170–180. [Google Scholar] [CrossRef]
- Lee, J. W.; Nam, S. H.; Yu, J. H.; Kim, D. I.; Jeong, R. H.; Boo, J. H. Morphological modulation of urchin-line Zn2SnO4/SnO2 hollow spheres and their applications as photocatalysts and quartz crystal microbalance measurements. Appl. Surf. Sci. 2019, 474, 78–84. [Google Scholar] [CrossRef]
- Yu, K.; Yang, S.; He, H.; Sun, C.; Gu, C.; Ju, Y. Visible light-driven photocatalytic degradation of Rhodamine B over NaBiO3: pathways and mechanism. J. Phys. Chem. A 2020, 113, 10024–10032. [Google Scholar] [CrossRef]
- Li, Z.; Yang, H.; Zhang, L.; Liu, R.; Zhou, Y. Stainless steel mesh-supported three-dimensional hierarchical SnO2/Zn2SnO4 composite for the applications in solar cell, gas sensor and photocatalysis. Appl. Surf. Sci. 2020, 502, 144113. [Google Scholar] [CrossRef]
- Small, J. M.; Hintelmann, H. Methylene blue derivatization then LC–MS analysis for measurement of trace levels of sulfide in aquatic samples. Anal. Bioanal. Chem. 2007, 387, 2881–2886. [Google Scholar] [CrossRef]
- Molla, A.; Sahu, M.; Hussain, S. Under dark and visible light: fast degradation of methylene blue in the presence of Ag–In–Ni–S nanocomposites. J. Mater. Chem. A, 2015, 3, 15616–15625. [Google Scholar] [CrossRef]
- Martin, N.; Leprince-Wang, Y. HPLC-MS and UV–Visible coupled analysis of methylene blue photodegradation by hydrothermally grown ZnO nanowires. Phys. Status Solidi 2021, 218, 2100532. [Google Scholar] [CrossRef]
- Gupta, V. K.; Manisha, S.; Raj, K. V. Hydrothermal modification and characterization of bentonite for reactive adsorption of methylene blue: an ESI-MS study. J. Environ. Chem. Eng. 2015, 3, 2172–2179. [Google Scholar] [CrossRef]
- Nguyen, T. B.; Doong, R. A.; Huang, C. P.; Chen, C. W.; Dong, C. D. Activation of persulfate by CoO nanoparticles loaded on 3D mesoporous carbon nitride (CoO@ meso-CN) for the degradation of methylene blue (MB). Sci. Total Environ. 2019, 675, 531–541. [Google Scholar] [CrossRef]
- Rovisco, A.; Morais, M.; Branquinho, R.; Fortunato, E.; Martins, R.; Barquinha, P. Microwave-assisted synthesis of Zn2SnO4 nanostructures for photodegradation of Rhodamine B under UV and sunlight. Nanomaterials 2022, 12, 2119. [Google Scholar] [CrossRef] [PubMed]
- Rasalingam, S.; Wu, C. M.; Koodali, R. T. Modulation of pore sizes of titanium dioxide photocatalysts by a facile template free hydrothermal synthesis method: implications for photocatalytic degradation of rhodamine B. ACS Appl. Mater. Interfaces 2015, 7, 4368–4380. [Google Scholar] [CrossRef] [PubMed]
- Zhong, H. E.; Shaogui, Y. A. N. G.; Yongming, J. U.; Cheng, S. U. N. Microwave photocatalytic degradation of Rhodamine B using TiO2 supported on activated carbon: Mechanism implication. J. Environ. Sci. 2009, 21, 268–272. [Google Scholar] [CrossRef]
- Siwinska-Ciesielczyk, K.; Swigon, D.; Rychtowski, P.; Moszynska, D.; Zgola-Grzieskowiak, A.; Jesionowski, T. The performance of multicomponent oxide systems based on TiO2, ZrO2 and SiO2 in the photocatalytic degradation of Rhodamine B: mechanism and kinetic studies. Colloids Surf. A 2020, 586, 124272. [Google Scholar] [CrossRef]
- Wang, G. L.; Wang, J.; Zhou, L. P.; Cai, X.; Xu, M.; Lin, J.; Muddassir, M.; Sakiyama, H. A multi-functional Cd (II)-based coordination polymer for the highly sensitive detection of nitrofurazone and photocatalytic efficiency of Rhodamine B. Inorg. Chim. Acta 2021, 527, 120566. [Google Scholar] [CrossRef]
Figure 1.
XRD pattern (points) measured for Zn2SnO4/SnO2 powder and Rietveld refinement (pale blue line) with the identified phases marked with green - Zn2SnO4 and red - SnO2 (a), FESEM image of the Zn2SnO4/SnO2 powder (b), Structural parameters determined from the Rietveld refinement (c) and crystal structure drawn by VESTA [31] for Zn2SnO4 and SnO2 (d).
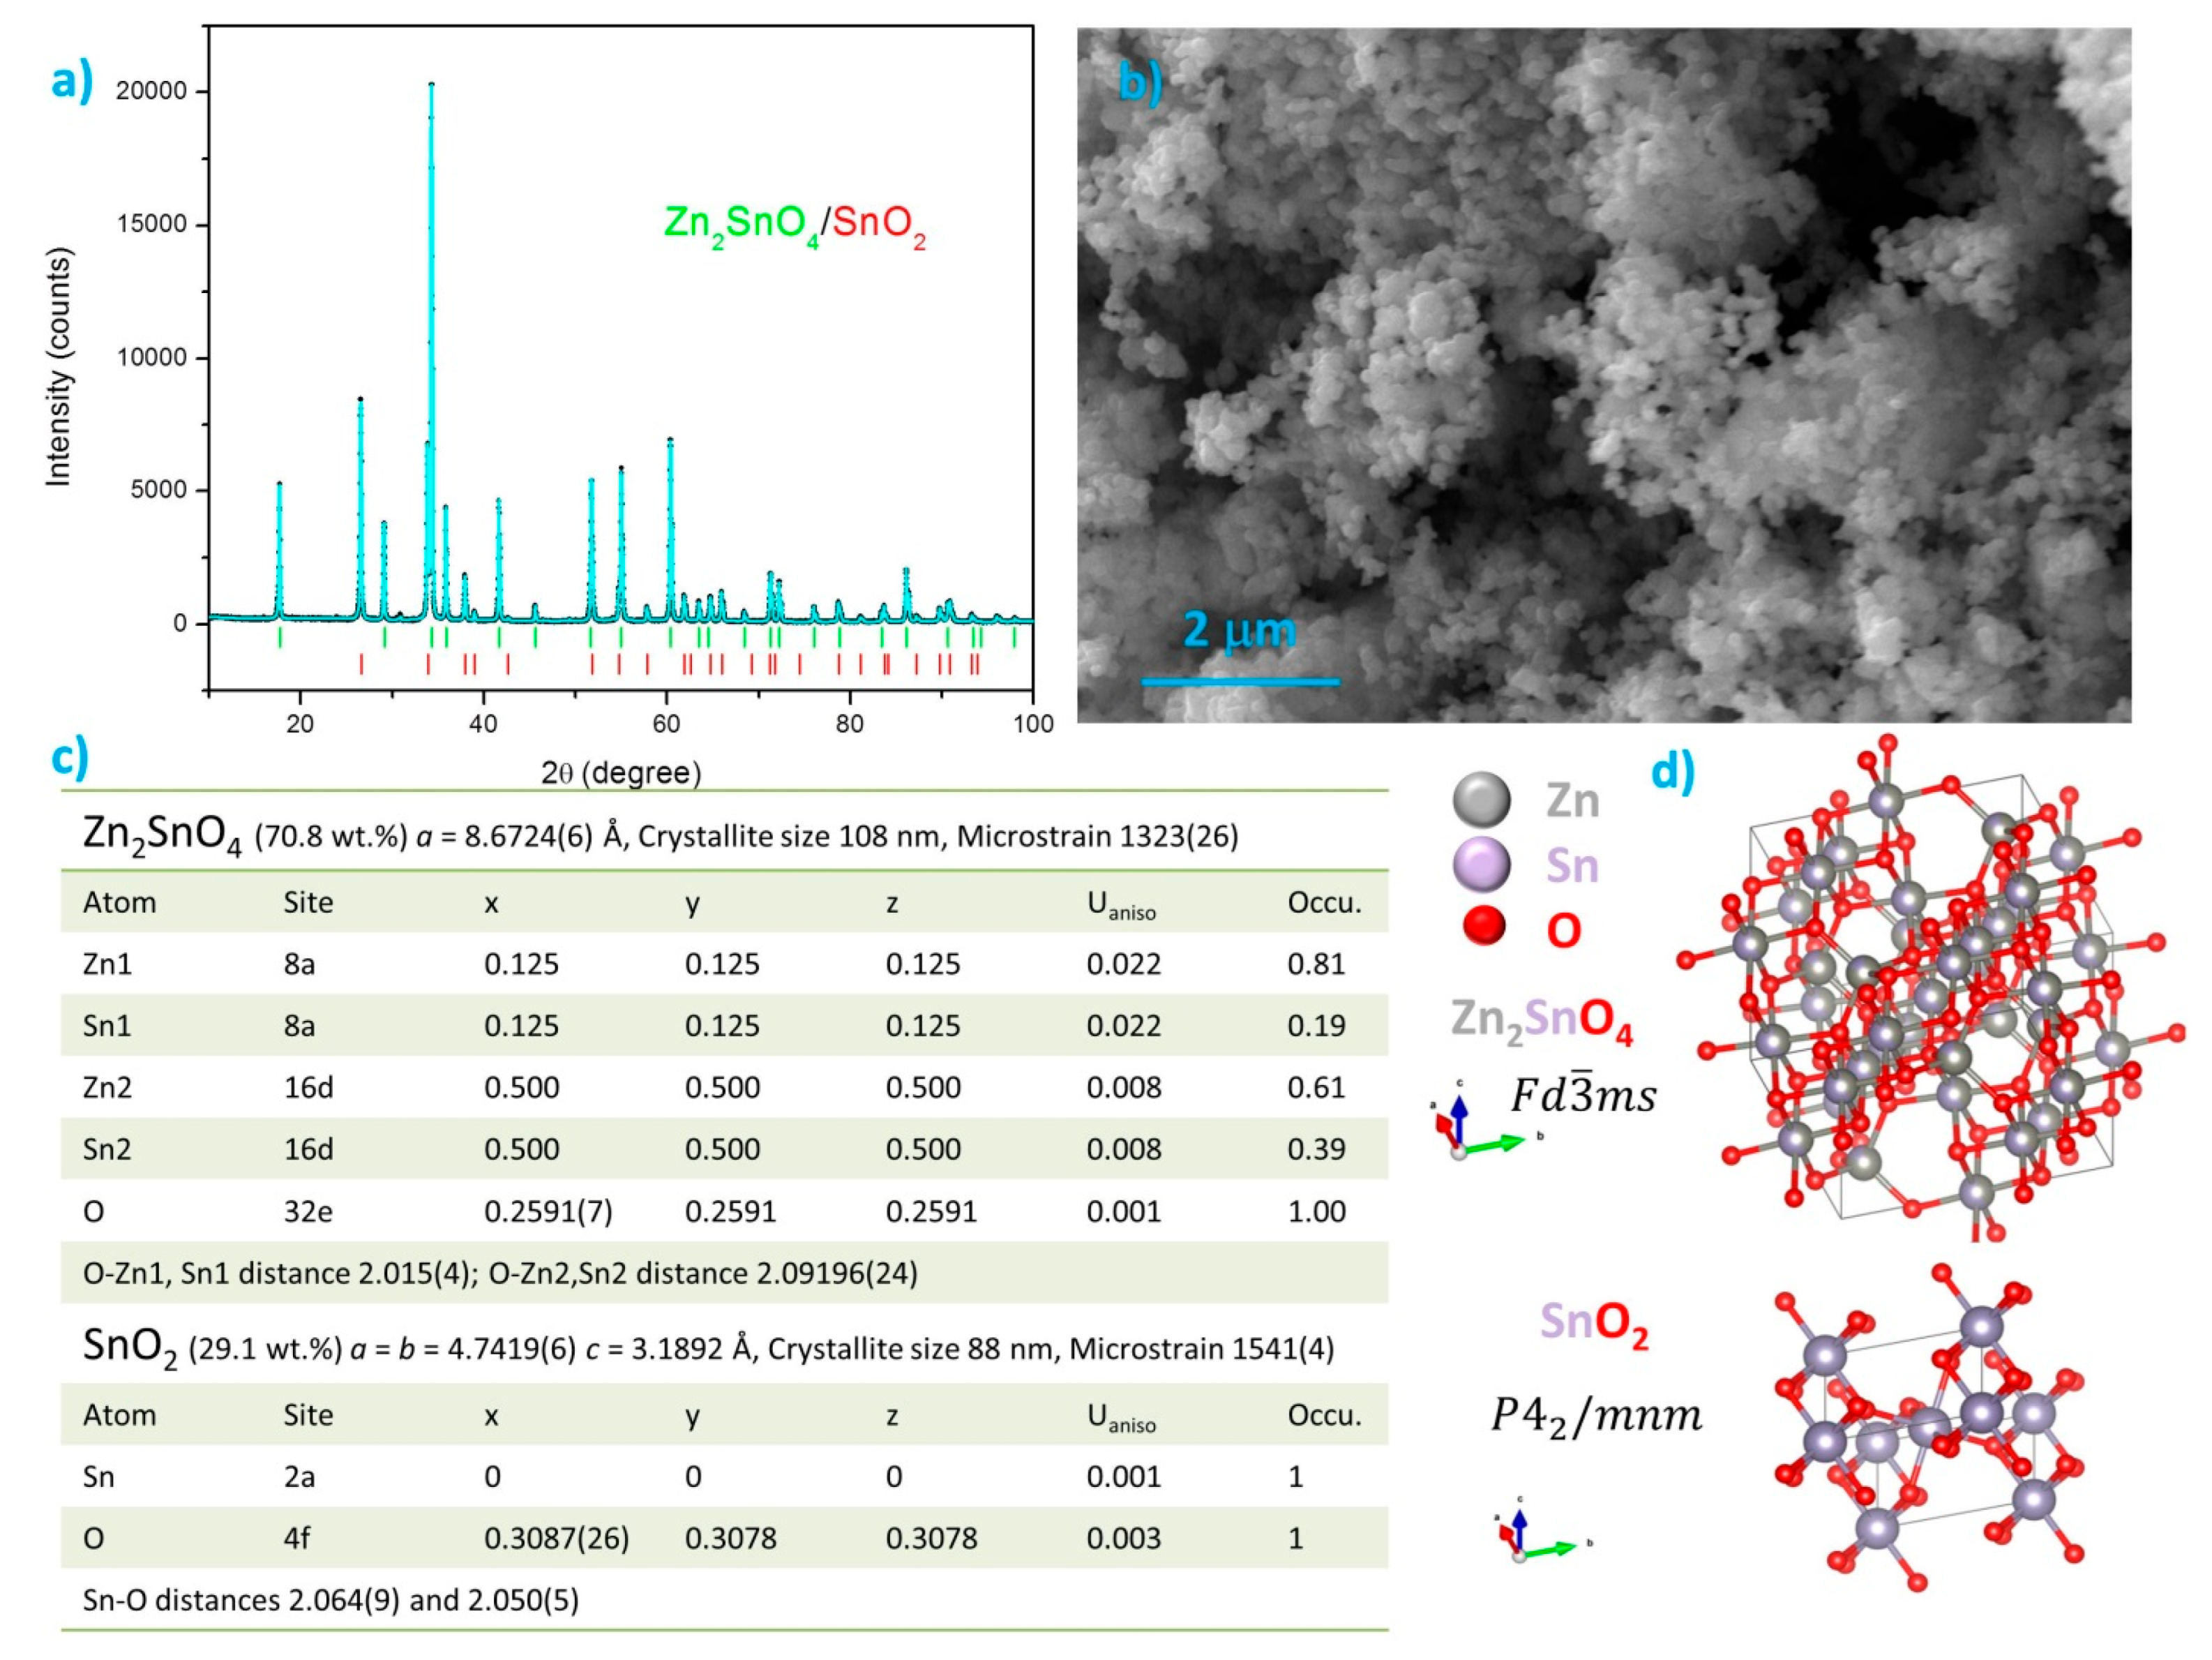
Figure 2.
FTIR spectrum measured for Zn2SnO4/SnO2 powder.
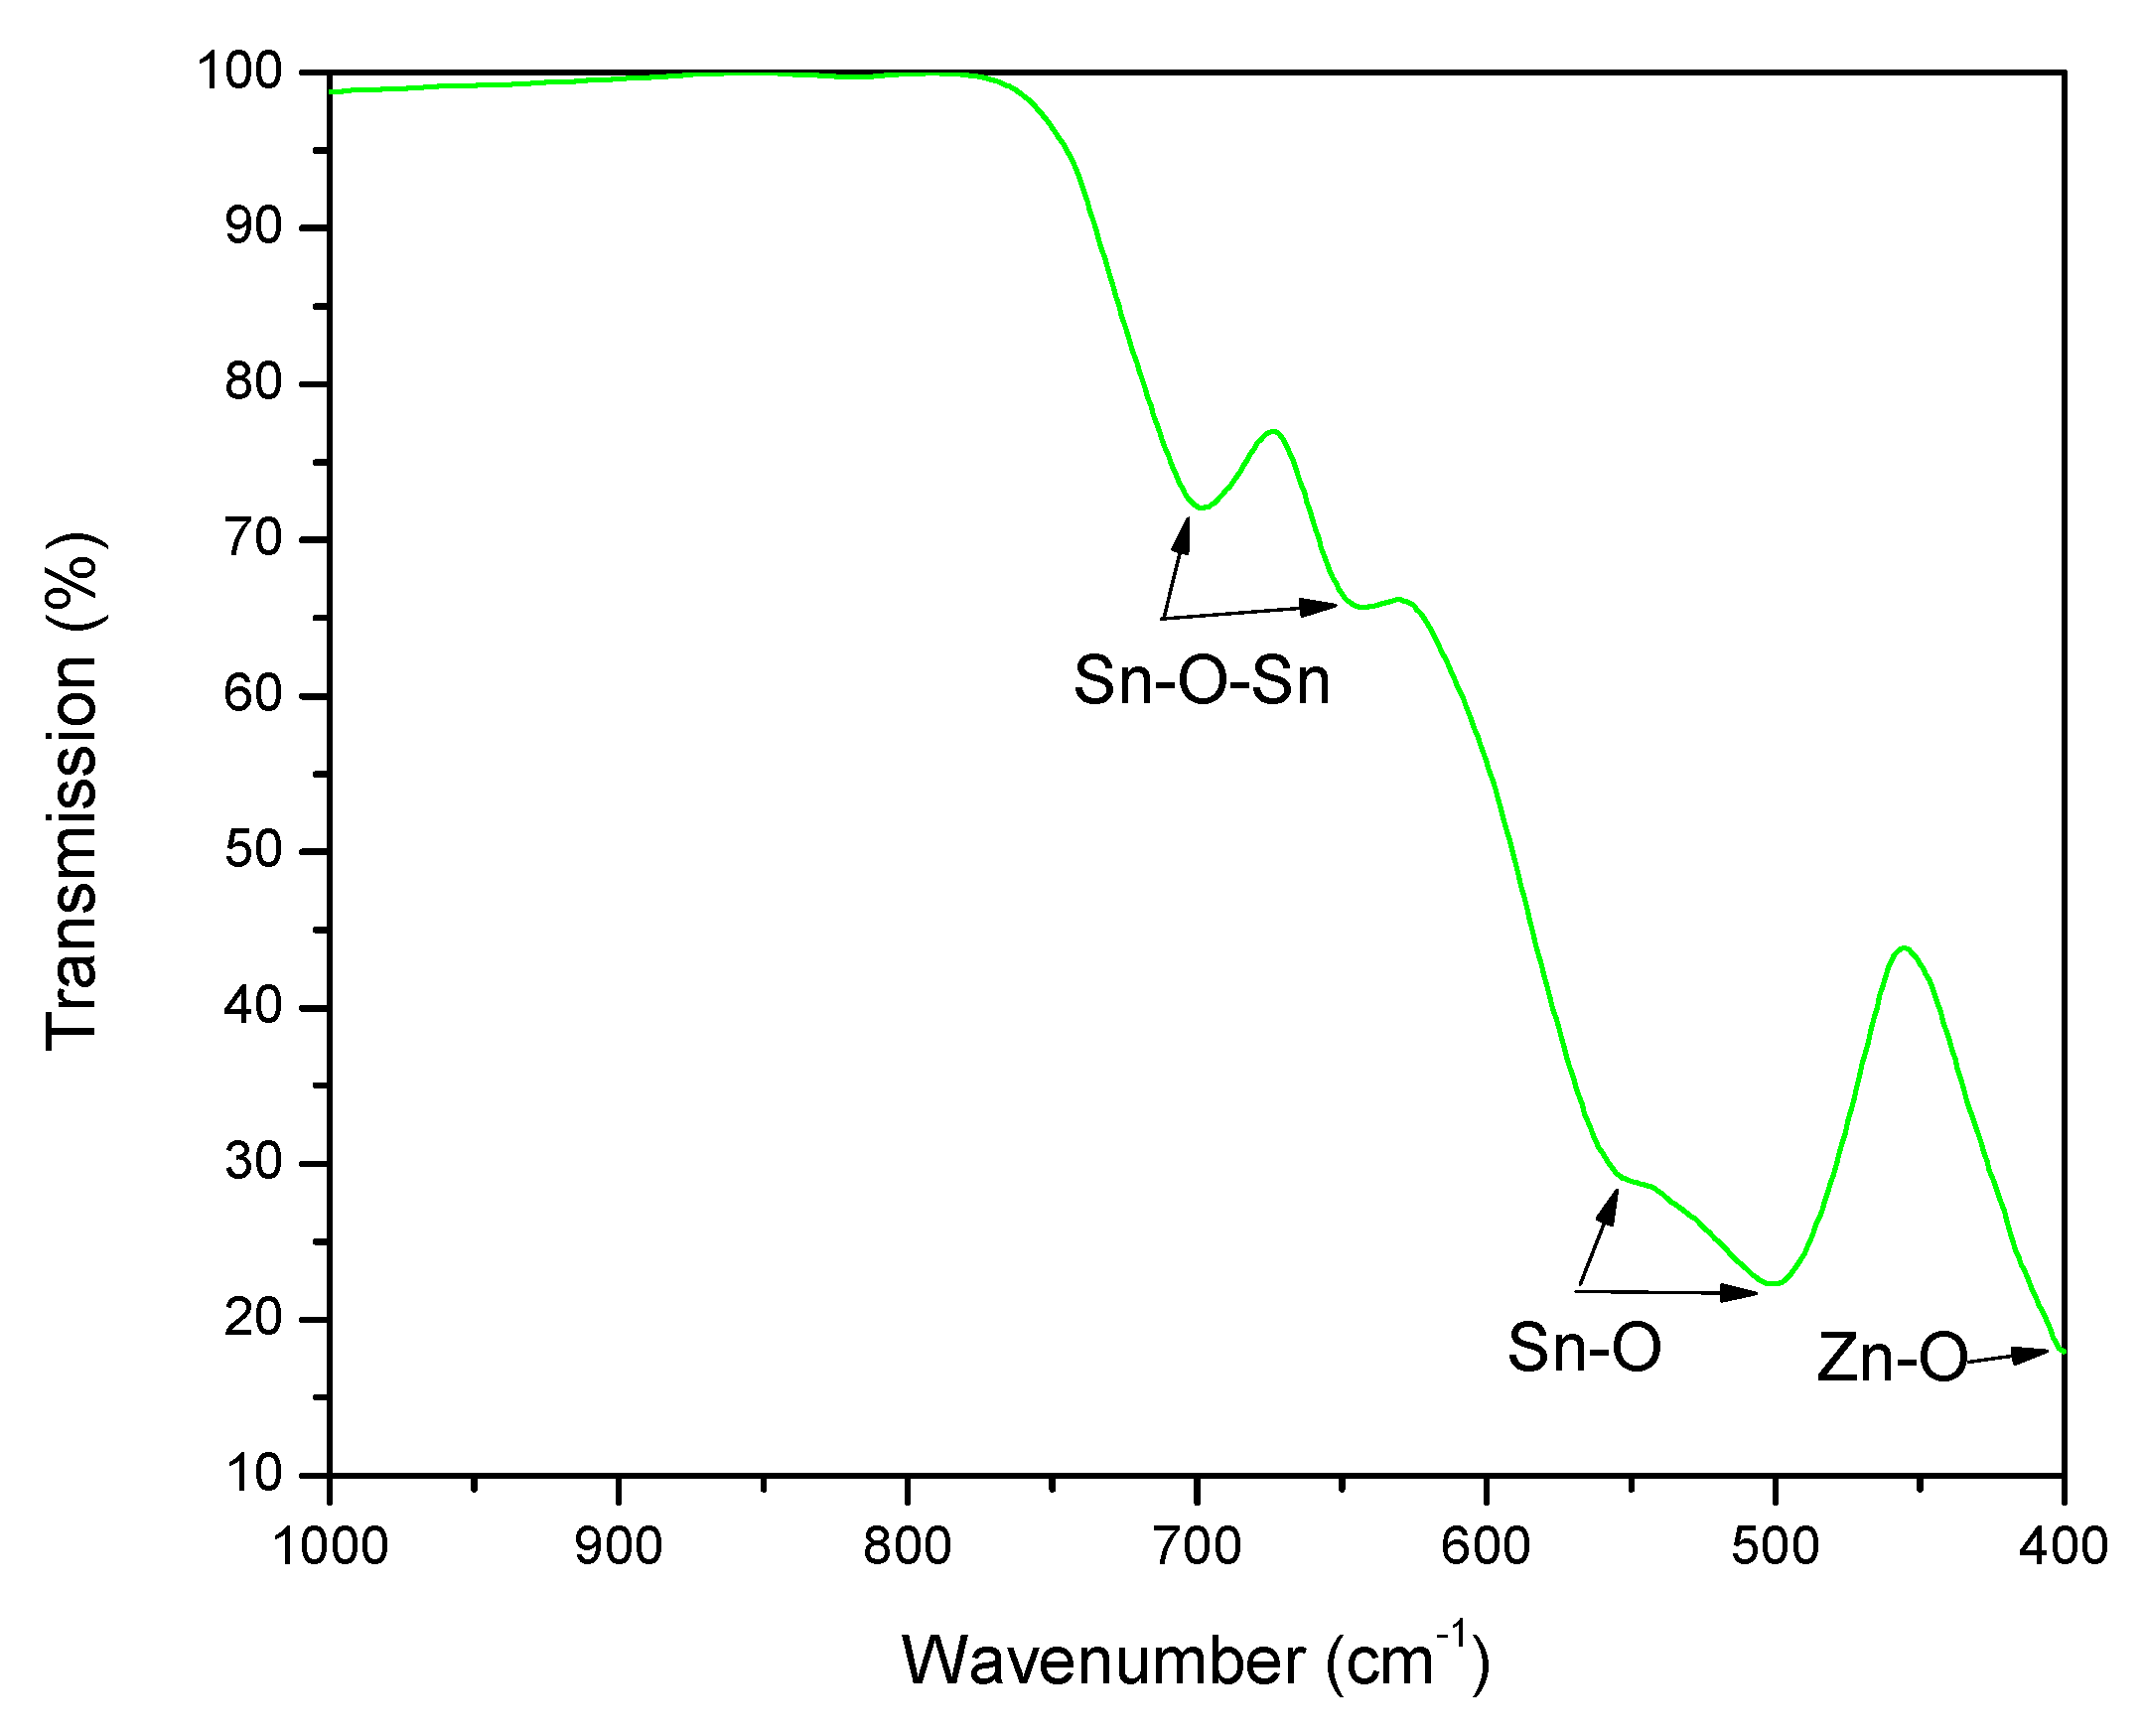
Figure 3.
TEM (a,b), HAADF TEM (c), HRTEM (d) and FFT (e,f) images for Zn2SnO4/SnO2 powder; blue rectangles mark magnified areas, while the red squares mark the areas used for FFT analysis.
Figure 3.
TEM (a,b), HAADF TEM (c), HRTEM (d) and FFT (e,f) images for Zn2SnO4/SnO2 powder; blue rectangles mark magnified areas, while the red squares mark the areas used for FFT analysis.
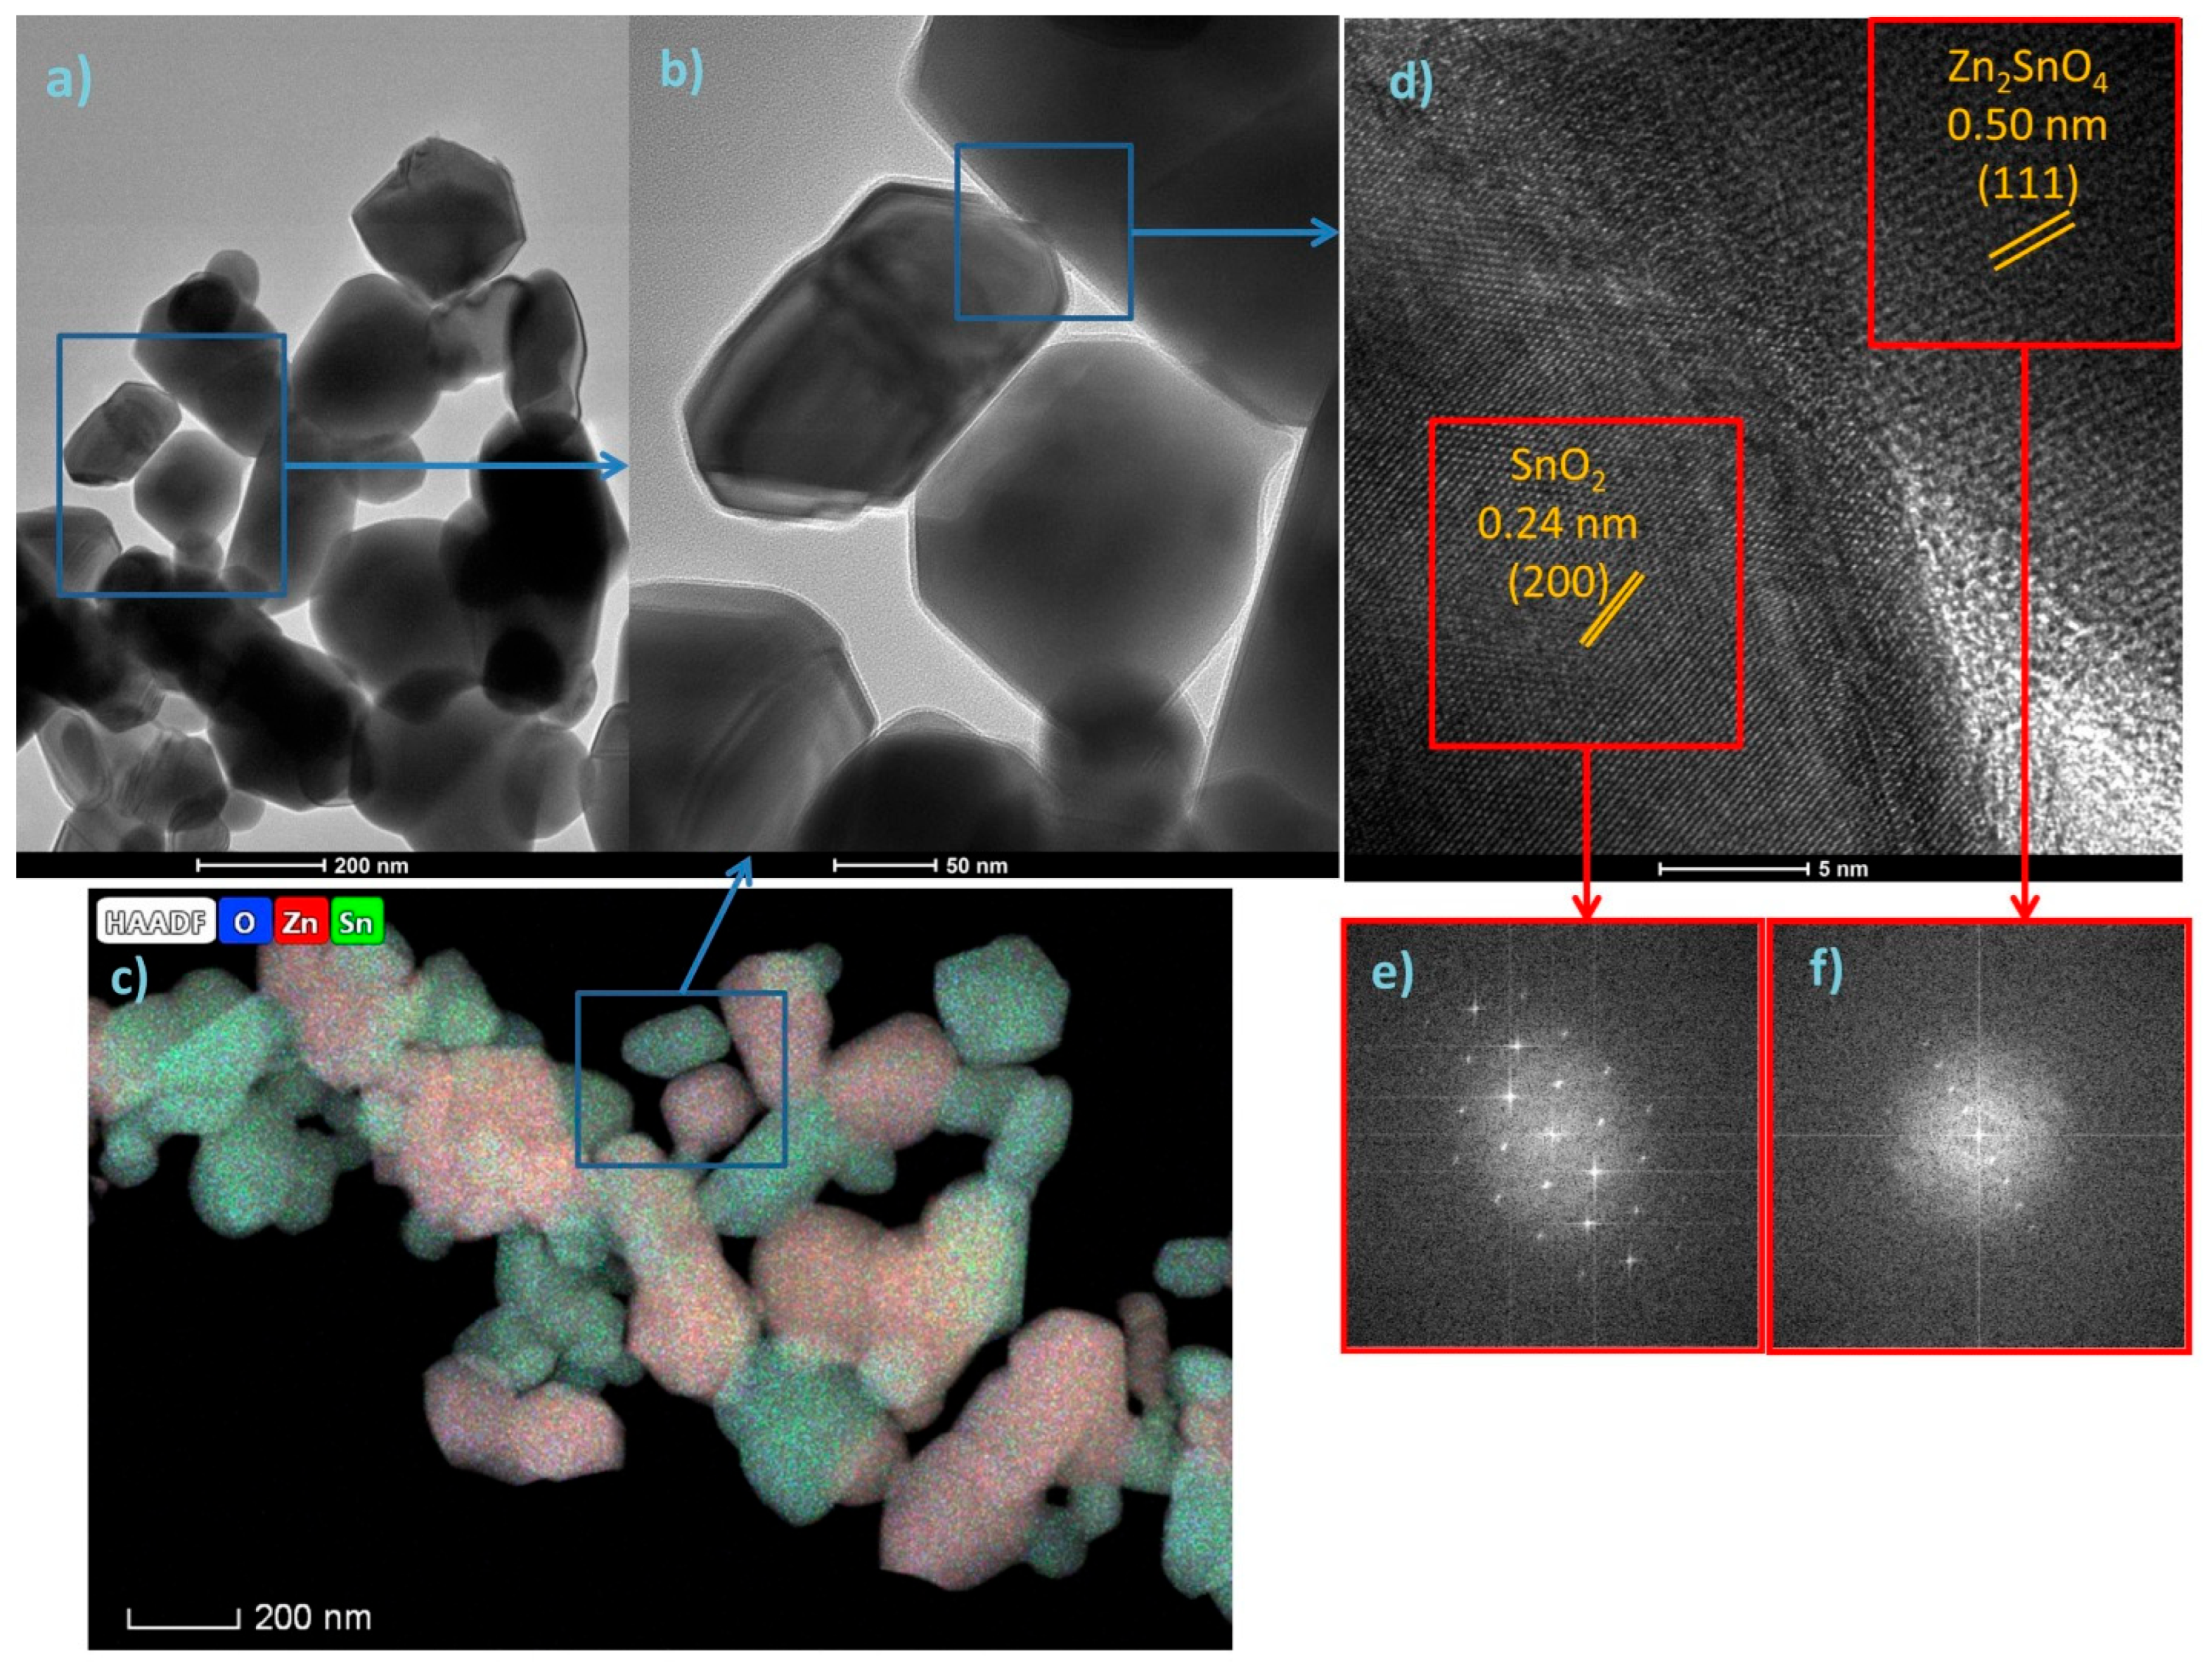
Figure 4.
Zn2SnO4/SnO2 powder absorbance obtained by Kubelka-Munk approximation (a) from measured diffuse reflectance spectra (b), insets (a) – Tauc plot for estimation of direct band gap and (b) – first derivative of the measured diffuse reflectance spectra and calculated transition energy values.
Figure 4.
Zn2SnO4/SnO2 powder absorbance obtained by Kubelka-Munk approximation (a) from measured diffuse reflectance spectra (b), insets (a) – Tauc plot for estimation of direct band gap and (b) – first derivative of the measured diffuse reflectance spectra and calculated transition energy values.
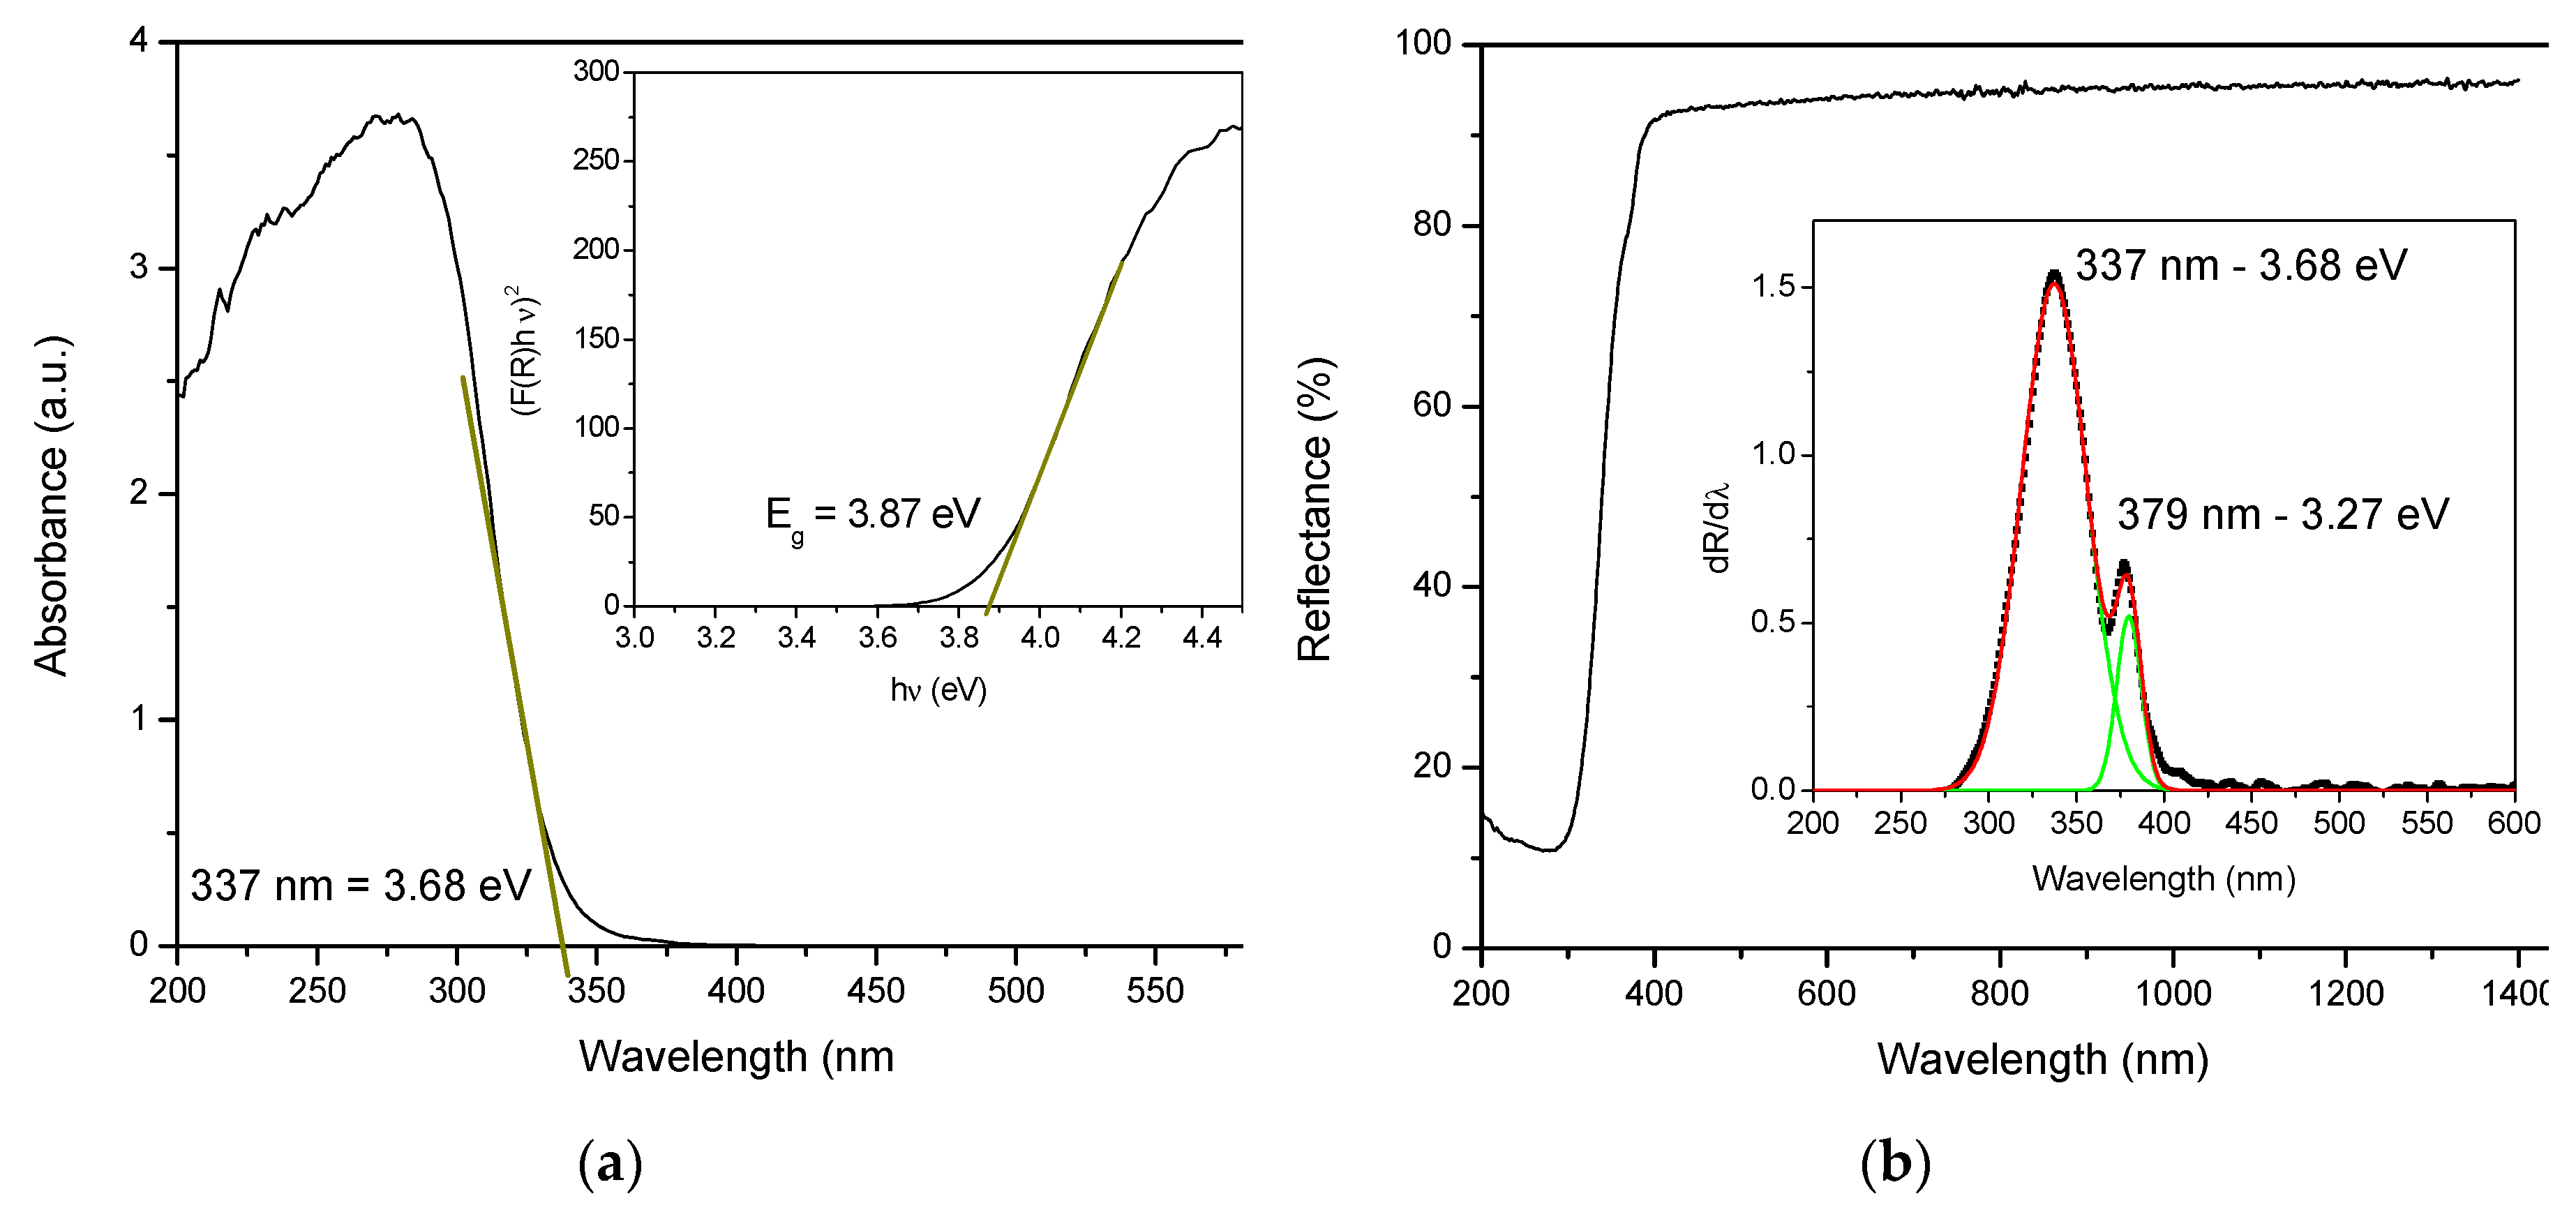
Figure 5.
UV-vis absorption spectra of the photocatalytic degradation of MB (10 ppm) under natural sunlight irradiation in the presence of 50 mg of Zn2SnO4/SnO2 (a), C/C0 at different time intervals (b), degradation efficiency (c) and pseudo first order kinetic model (d) for different photocatalyst loads (10, 20, 30 and 50 mg).
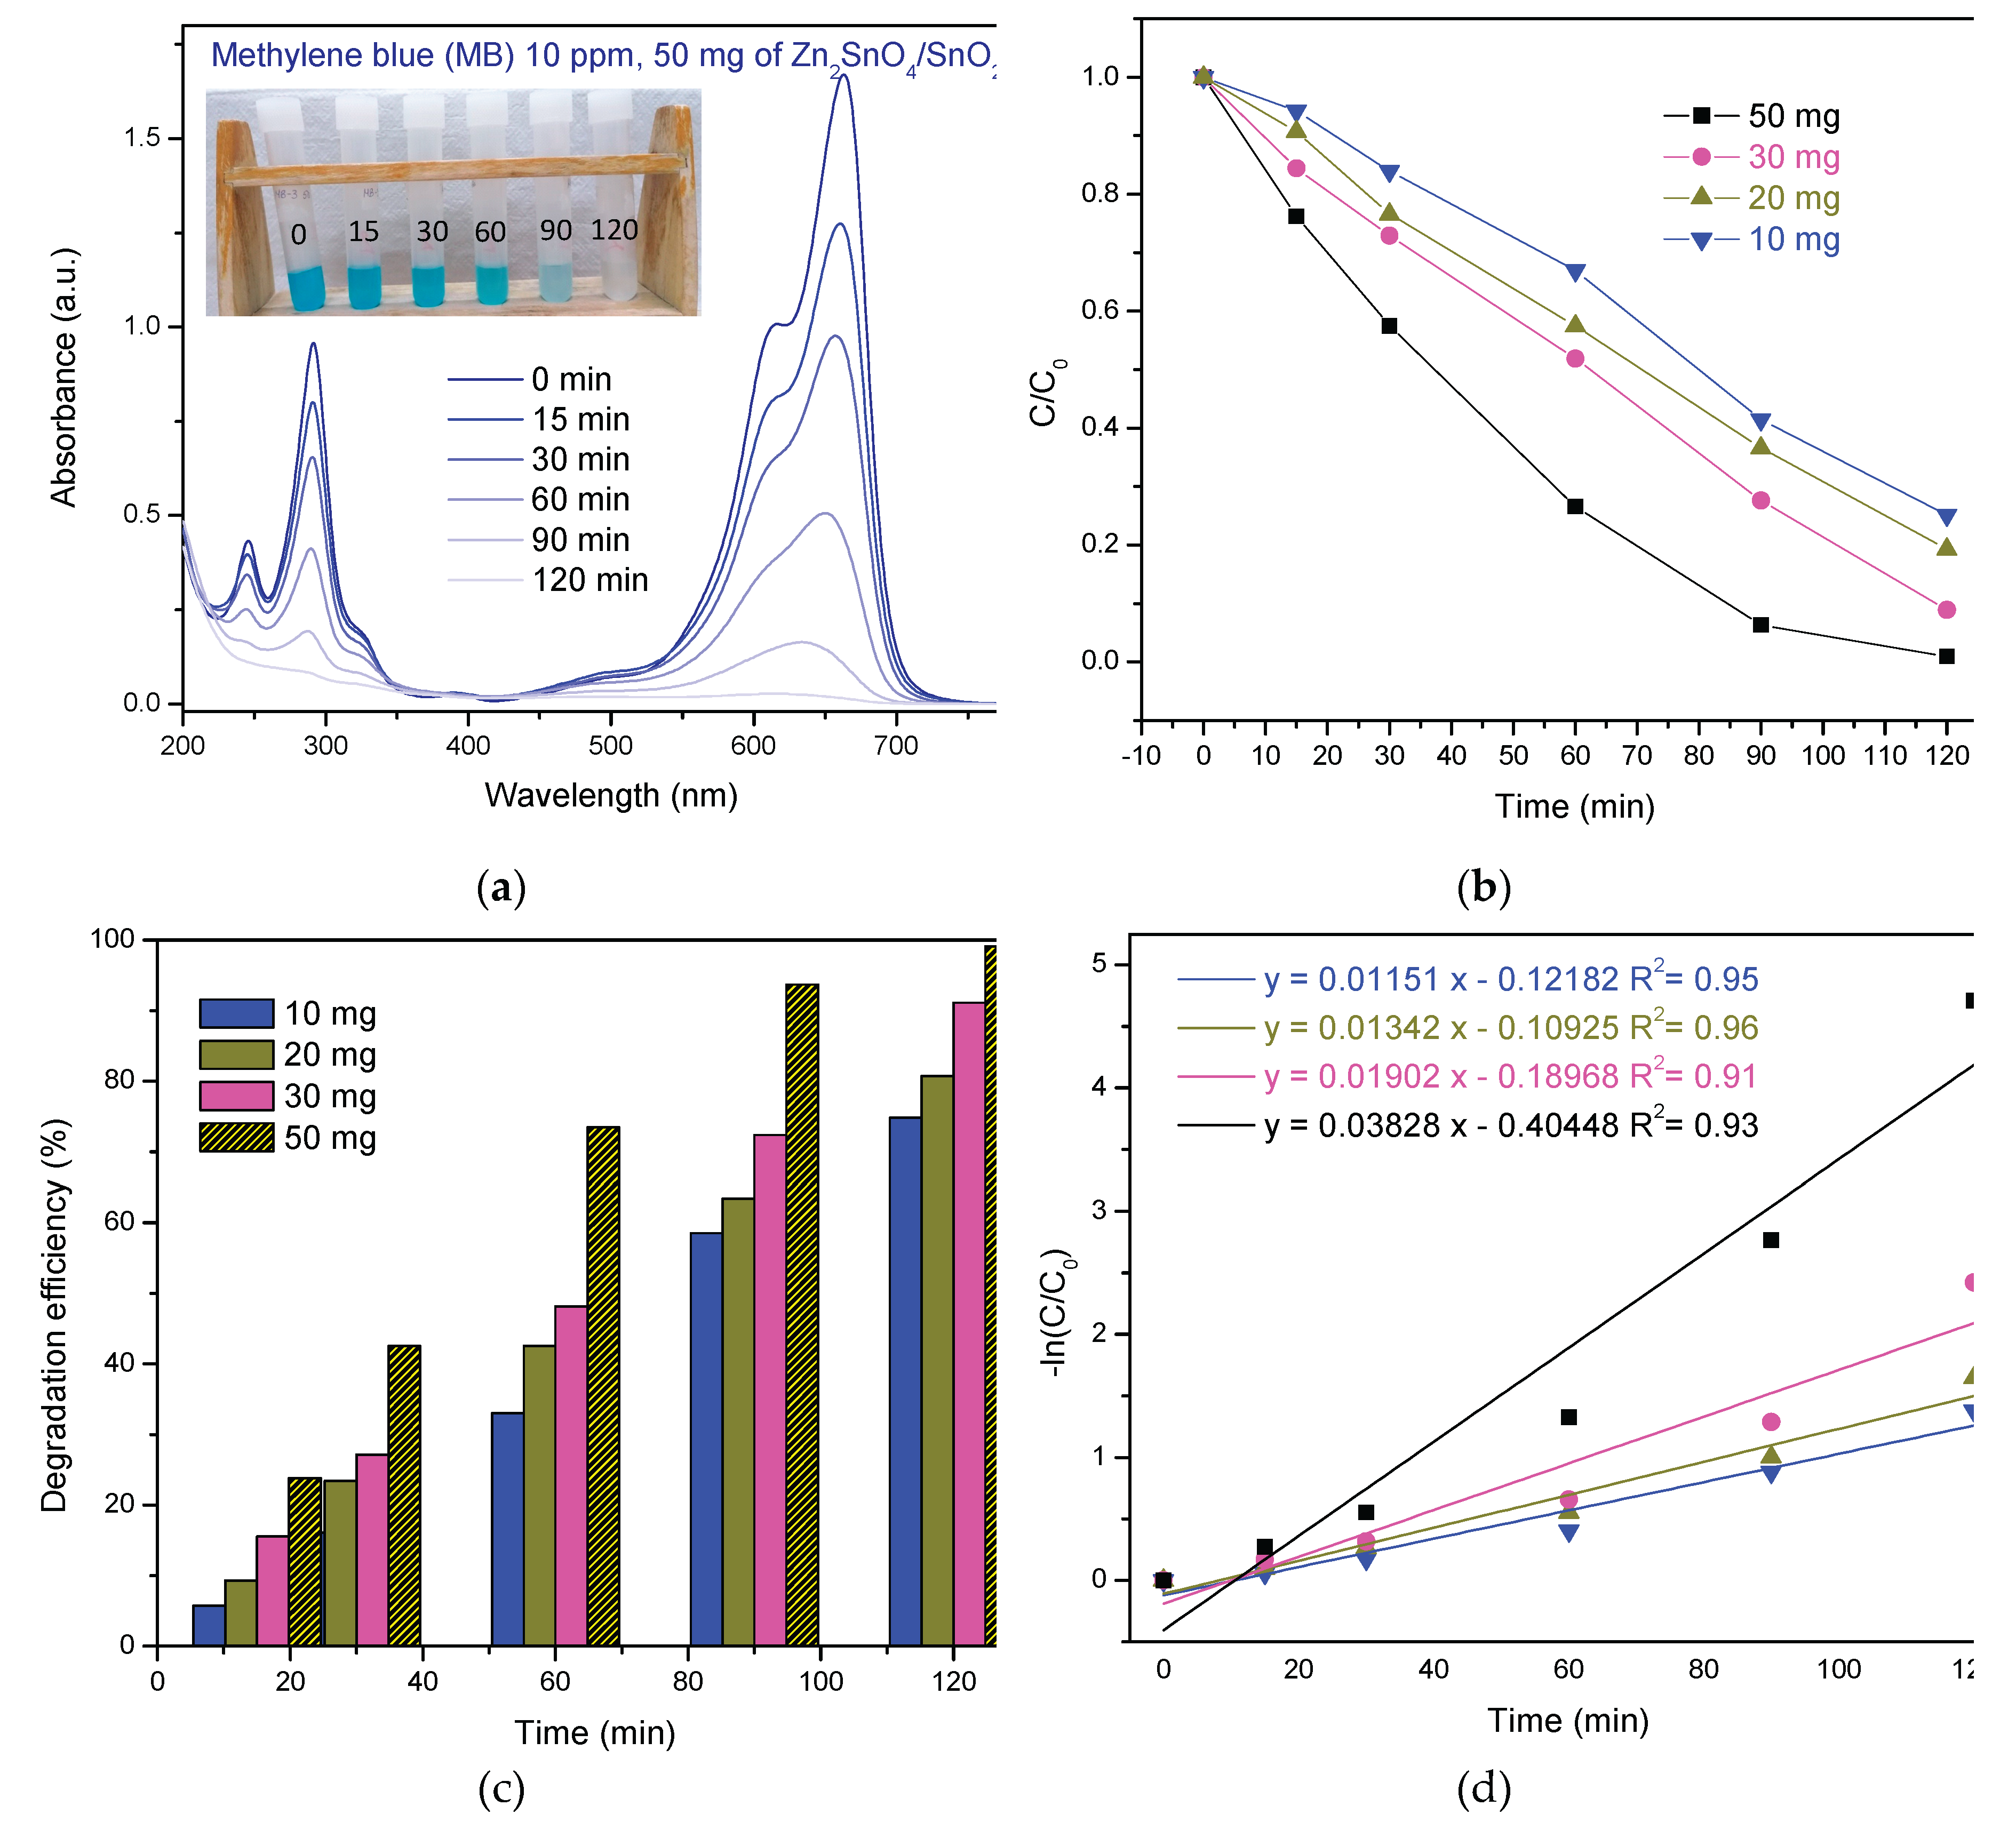
Figure 6.
UV-vis absorption spectra of the photocatalytic degradation of RhB (10 ppm) under natural sunlight irradiation in the presence of 50 mg of Zn2SnO4/SnO2 (a), C/C0 at different time intervals (b), degradation efficiency (c) and pseudo first order kinetic model (d) for different photocatalyst loads (10, 20, 30 and 50 mg).
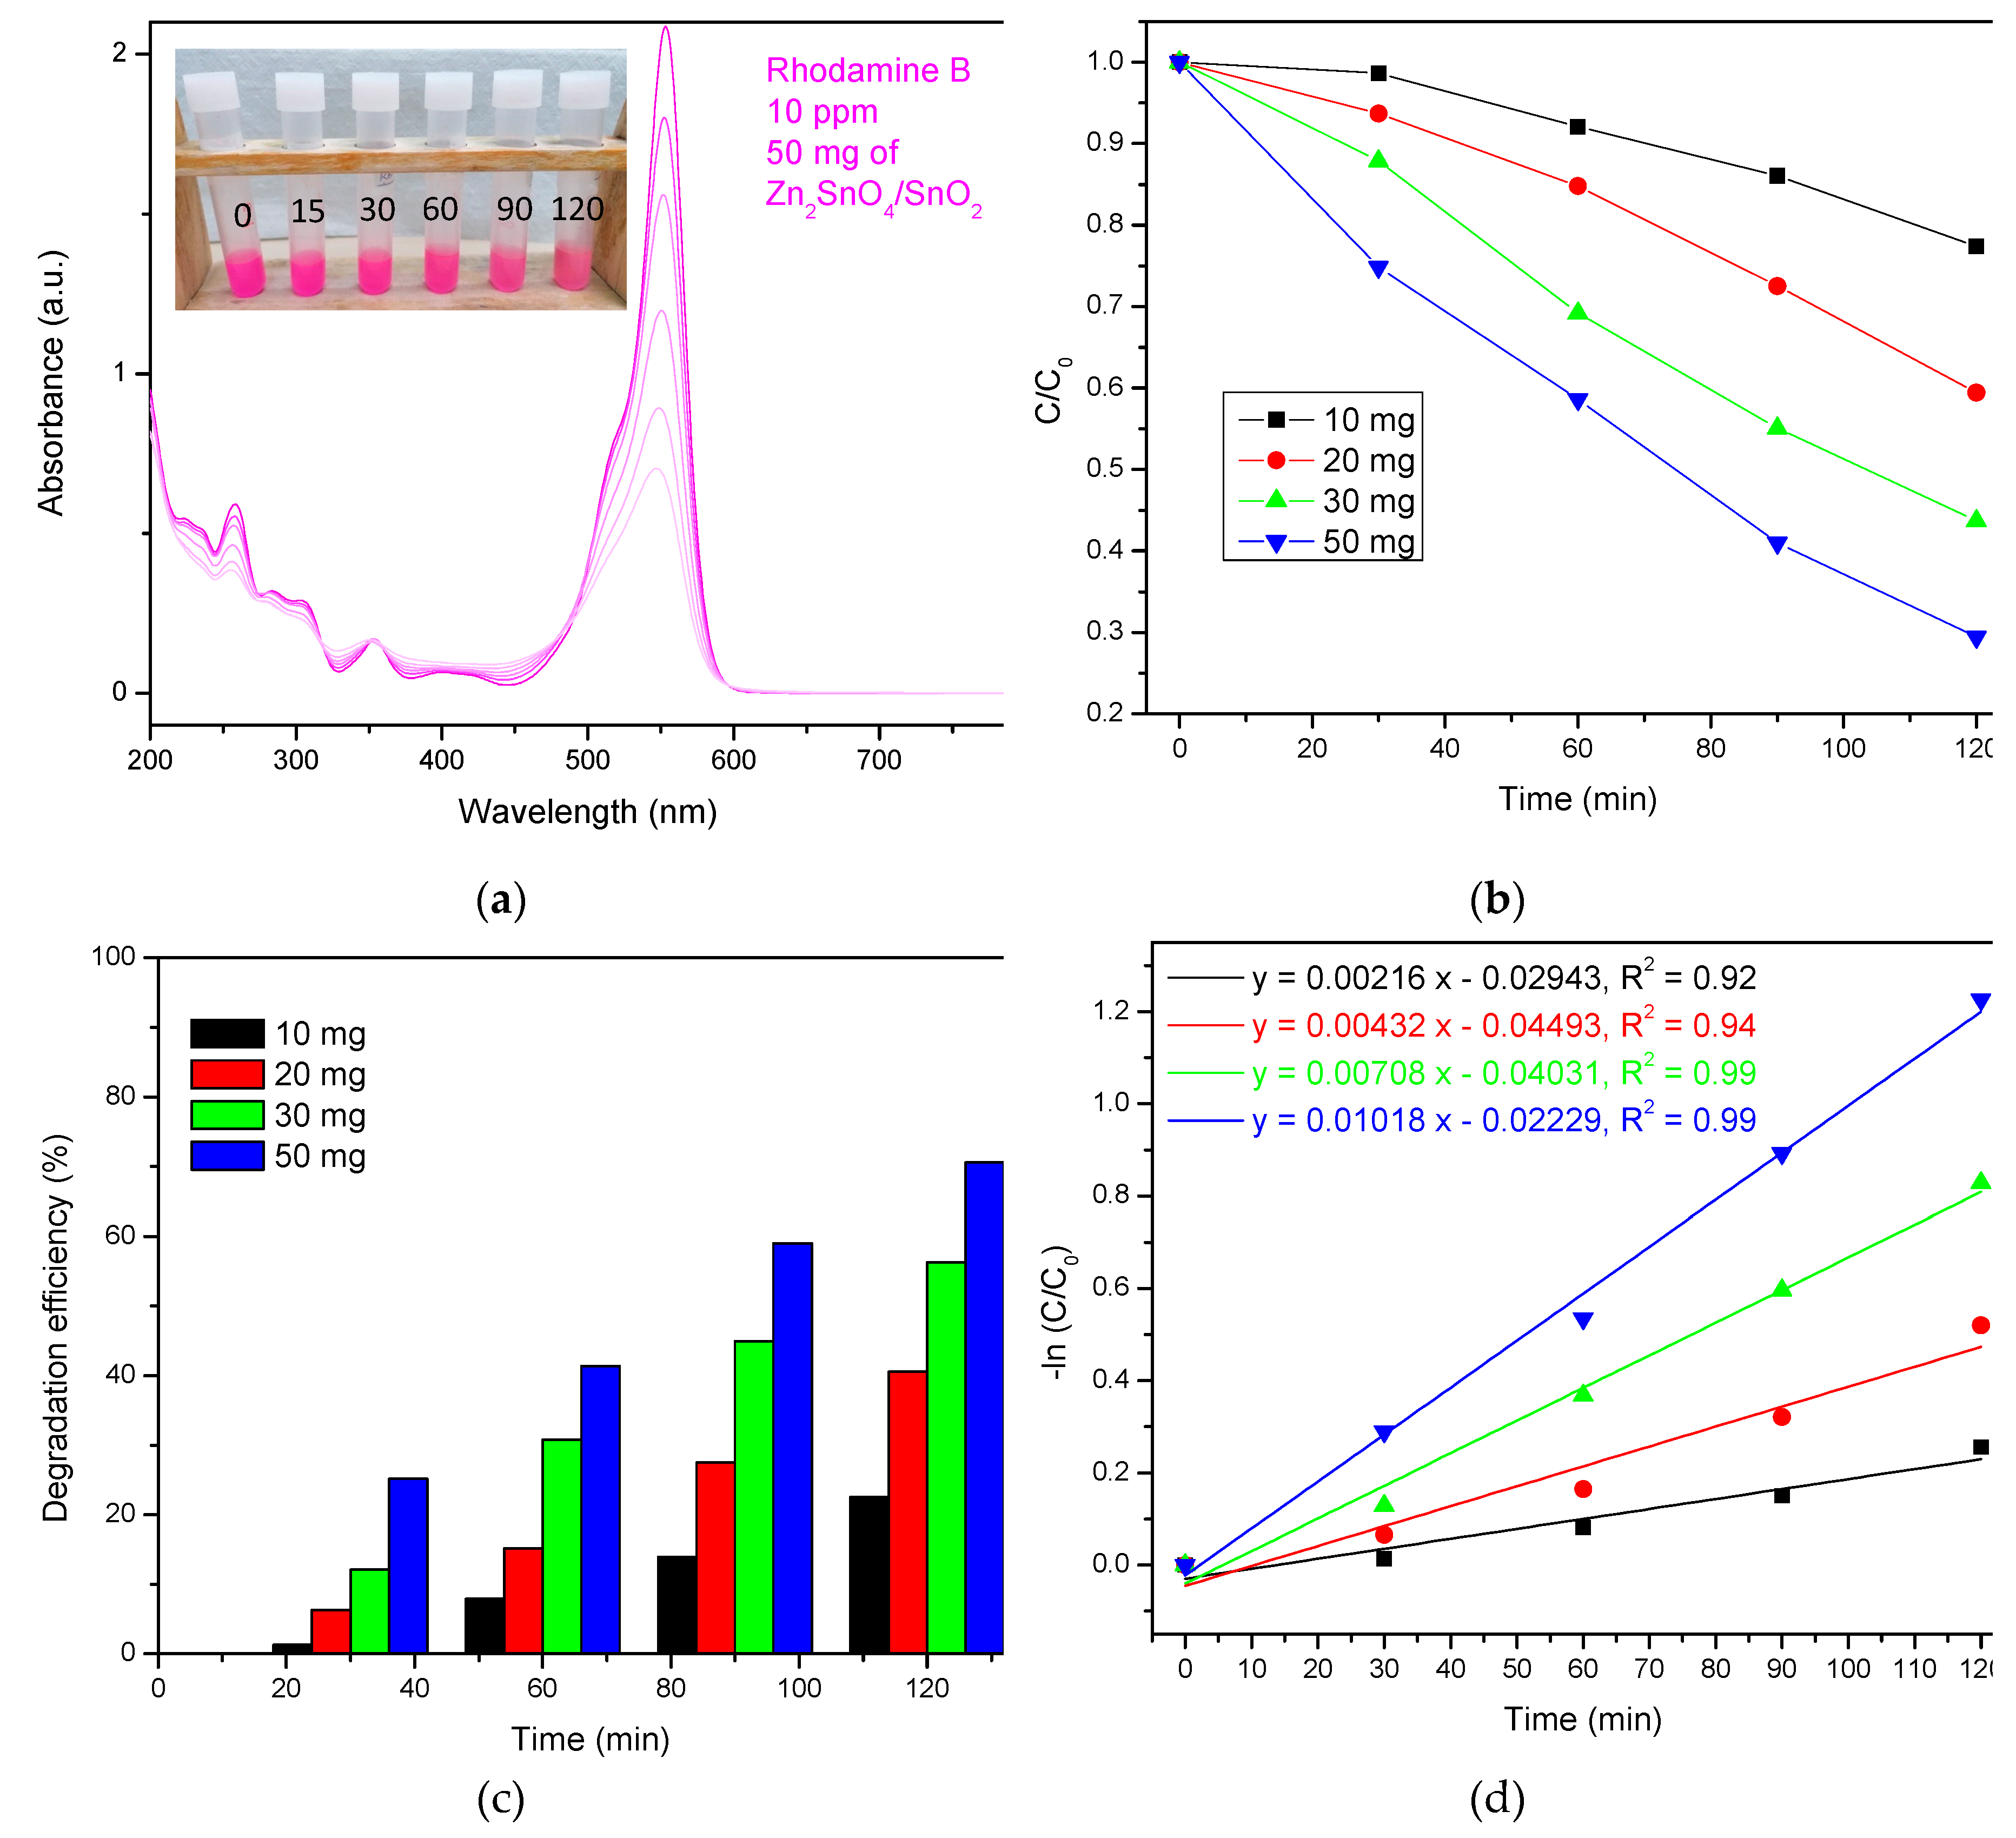
Figure 7.
UV-vis absorption spectra of the photocatalytic degradation of MB + RhB (10 ppm) under natural sunlight irradiation in the presence of 50 mg of Zn2SnO4/SnO2 (a), color change of the solution after 120 min using 50 mg of Zn2SnO4/SnO2 and final solutions after irradiation for 120 min using 10, 30 and 50 mg Zn2SnO4/SnO2 (b), C/C0 at different time intervals for MB (c) and RhB (e) and degradation efficiency for MB (c) and RhB (f) in MB+RhB, and pseudo first order kinetic model for MB (g) and RhB (h) in MB+RhB for different photocatalyst loads (5-50 mg).
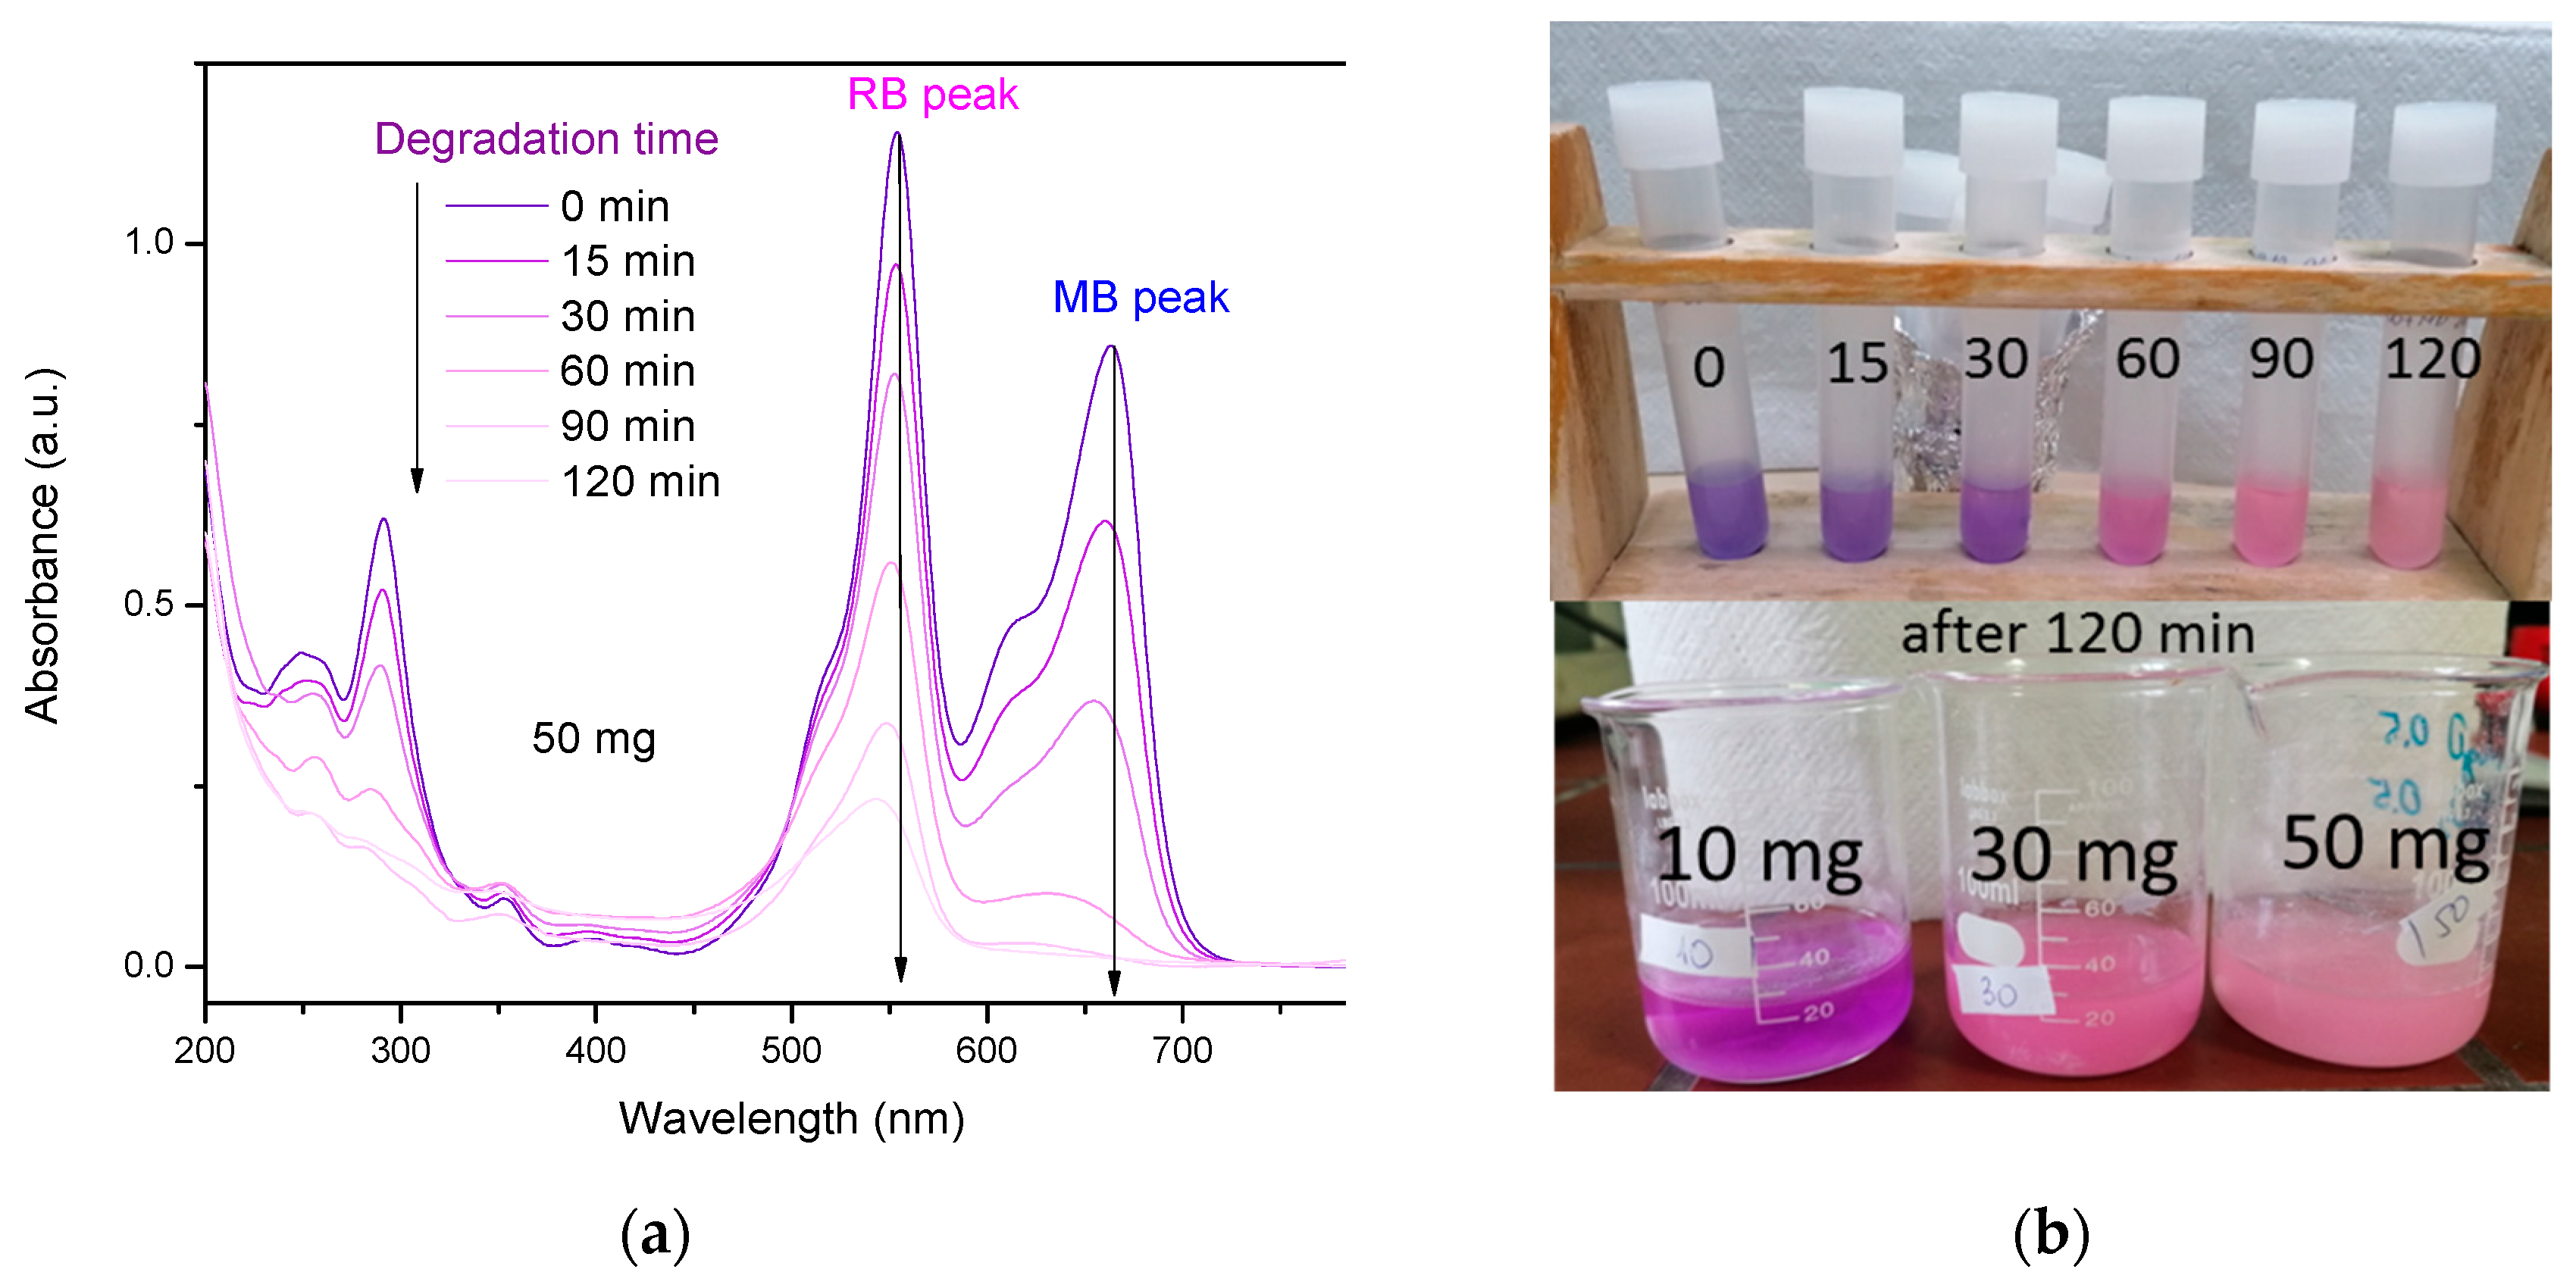
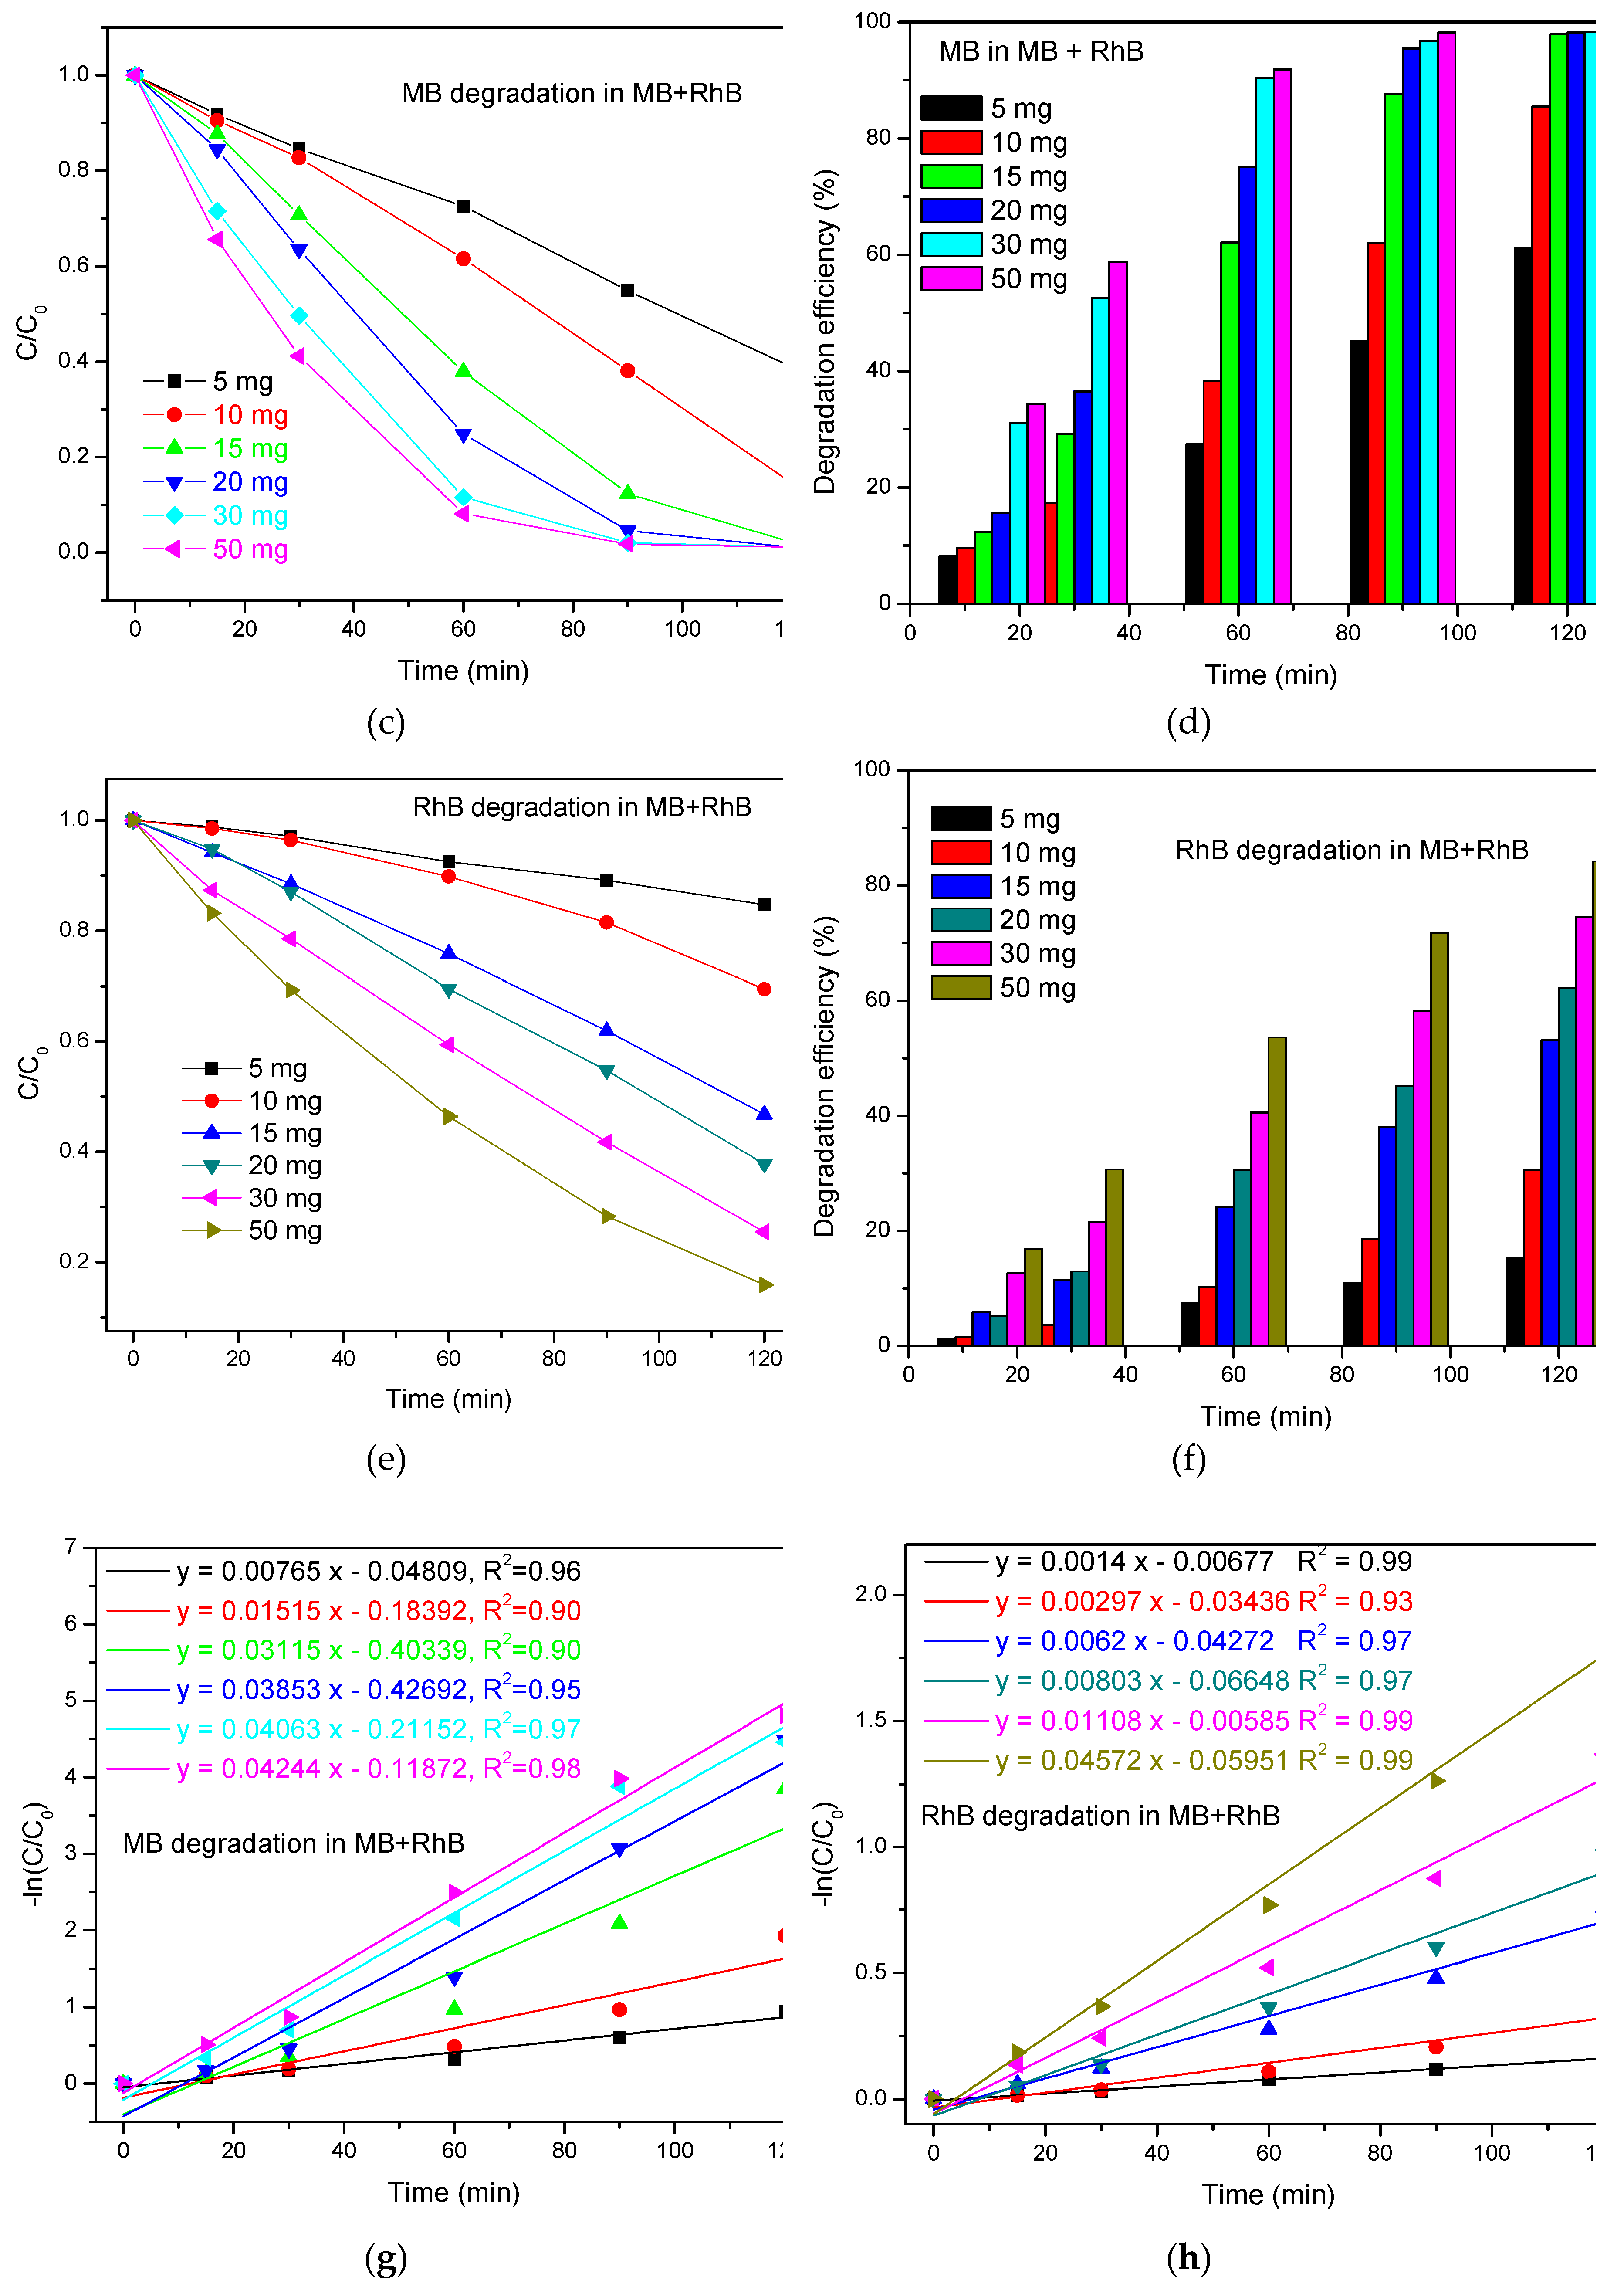
Figure 8.
Degradation mechanism scheme for MB, RhB and MB+RhB degradation under natural sunlight by Zn2SnO4/SnO2.
Figure 8.
Degradation mechanism scheme for MB, RhB and MB+RhB degradation under natural sunlight by Zn2SnO4/SnO2.
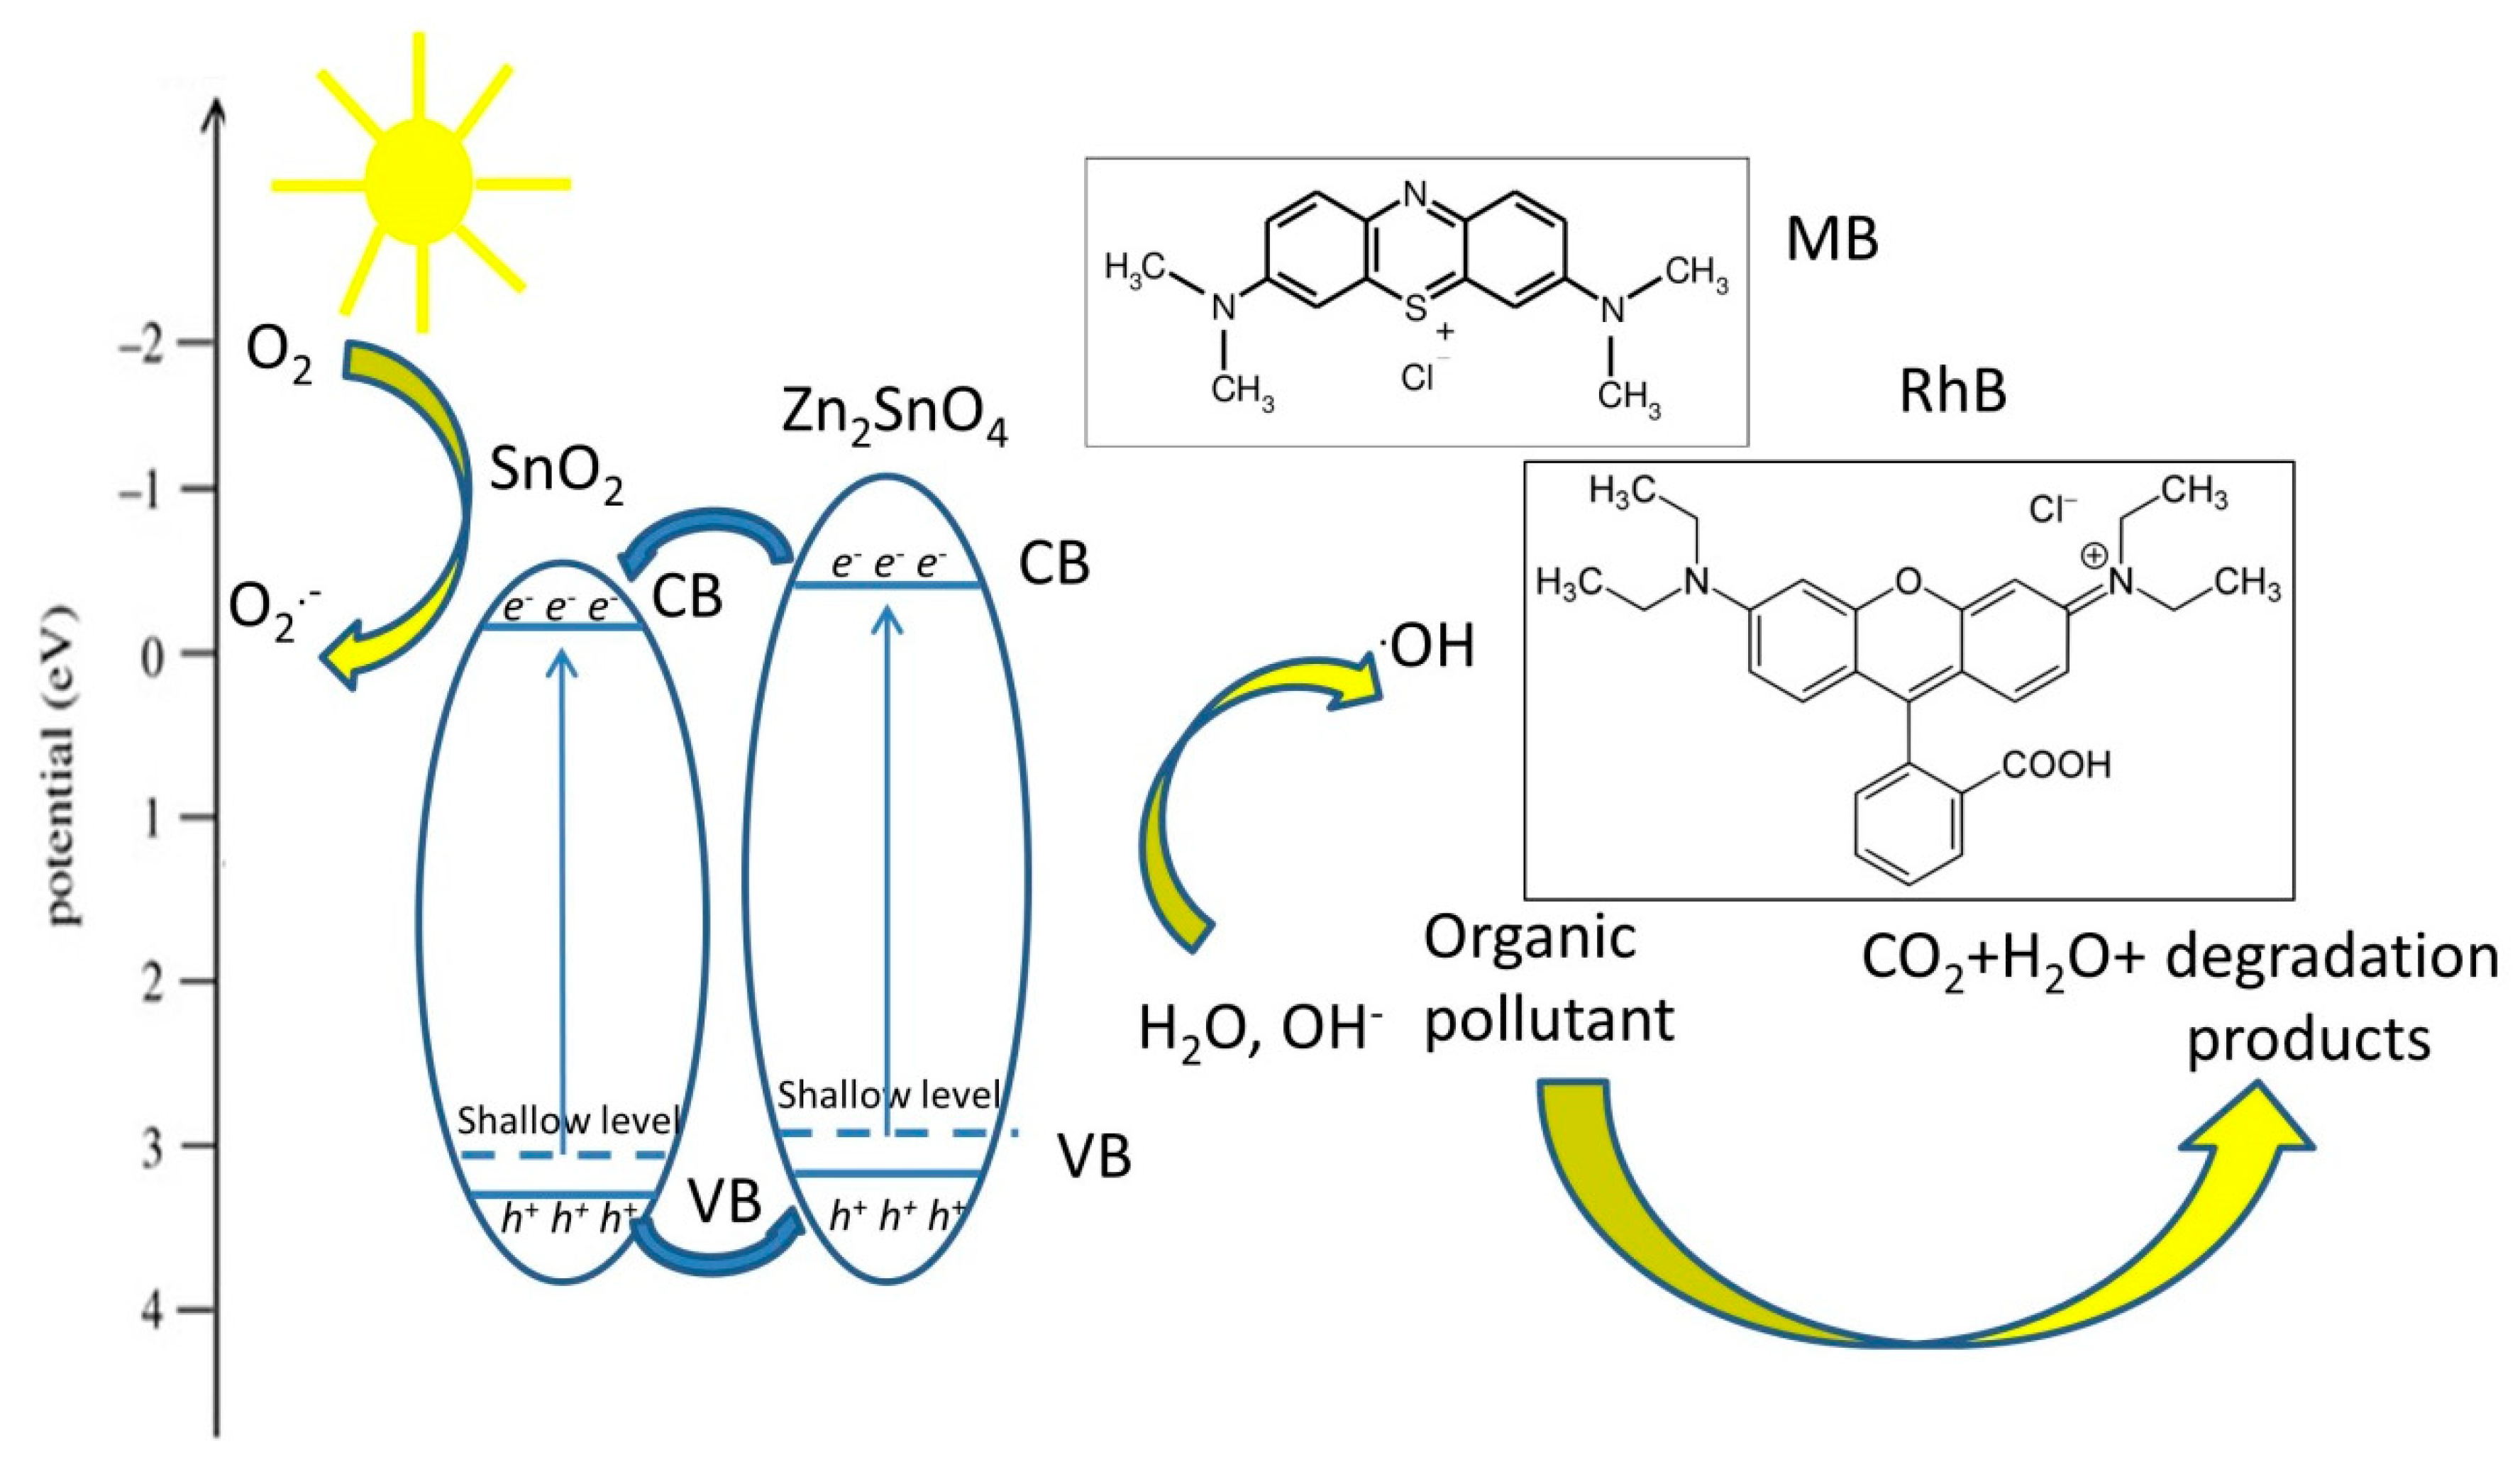

Table 1.
Photocatalytic degradation efficiency (DE) and pseudo-first order kinetic constant (k) determined for different Zn2SnO4/SnO2 nanocomposite morphologies applied as photocatalysts for MB.
Table 1.
Photocatalytic degradation efficiency (DE) and pseudo-first order kinetic constant (k) determined for different Zn2SnO4/SnO2 nanocomposite morphologies applied as photocatalysts for MB.
| Sample | Conditions | DE (%) | k (min-1) | Ref. |
|---|---|---|---|---|
| Zn2SnO4/SnO2 nanocubes Zn:Sn=1:1 | 100 mg-100 ml 2.5 ppm, UV-light |
91.6% 360 min | 0.007236 | [23] |
| Zn2SnO4/SnO2 nanocubes Zn:Sn=3:2 | 100 mg-100 ml 2.5 ppm, UV-light |
99.4% 360 min | 0.012244 | [23] |
| Zn2SnO4/SnO2 nanoparticles | 100 mg-100ml 2 ppm UV-light |
98.6% 220 min | 0.01763 | [19] |
| Zn2SnO4/SnO2 nanocubes | 100 mg-100ml 2 ppm UV-light |
85.1% 220 min | 0.008893 | [19] |
| Zn2SnO4/SnO2 spheres | 5 mg – 50 ml 10 ppm UV light |
60% 140 min | 0.0049 | [47] |
| Zn2SnO4/SnO2 urchin-like hollow spheres | 5 mg – 50 ml 10 ppm UV light |
97% 140 min | 0.0209 | [47] |
| Zn2SnO4/SnO2 hollow cubes | 100 mg – 100 ml, 10 ppm sim. sunlight |
97.1% 150 min | 0.0241 | [26] |
| Zn2SnO4/SnO2 solid cubes | 100 mg – 100 ml 10 ppm sim. sunlight |
83.2% 150 min | 0.0114 | [26] |
| Zn2SnO4/SnO2 heterojunctions | 50 mg – 50 ml 10 ppm natural sunlight |
99.1% 120 min | 0.03828 | This work |
Table 2.
Photocatalytic degradation efficiency (DE) and pseudo-first order kinetic constant (k) determined for different Zn2SnO4/SnO2 nanocomposite morphologies applied as photocatalysts for RhB.
Table 2.
Photocatalytic degradation efficiency (DE) and pseudo-first order kinetic constant (k) determined for different Zn2SnO4/SnO2 nanocomposite morphologies applied as photocatalysts for RhB.
| Sample | Conditions | DE (%) | k (min-1) | Ref. |
|---|---|---|---|---|
| Zn2SnO4/SnO2 double shell nanocubes |
50 mg – 50 ml 6.4 ppm, simulated sunlight |
95%, 120 min | 0.0214 | [24] |
| Zn2SnO4/SnO2 yolk shell nanocubes |
50 mg – 50 ml 6.4 ppm, simulated sunlight |
85%, 240 min | 0.0074 | [24] |
| Zn2SnO4/SnO2 hollow microbox |
20 mg – 50 ml 10 ppm simulated sunlight |
83%, 45 min | - | [25] |
| Zn2SnO4/SnO2 nanocomposite |
40 mg – 100 ml 5 ppm, UV-C light |
62% 60 min94.5%, 240 min | 0.0111 | [22] |
| Zn2SnO4/SnO2 microspheres consisting of nanobelts |
80 mg on stainless steel mesh 100 ml, 10 ppm, simulated UV-vis light | 93.4% 100 min | 0.028 | [49] |
| Zn2SnO4/SnO2 microspheres - nanoparticle-based nanosheets |
80 mg on stainless steel mesh 100 ml, 10 ppm simulated UV-vis light | 99.9% 100 min | 0.036 | [49] |
| Zn2SnO4/SnO2 heterojunctions | 50 mg – 50 ml 10 ppm natural sunlight |
70.58%, 120 min | 0.0108 | This work |
Table 3.
Exposure time and ion masses of degradation products of MB and their possible structures.
 |
Disclaimer/Publisher’s Note: The statements, opinions and data contained in all publications are solely those of the individual author(s) and contributor(s) and not of MDPI and/or the editor(s). MDPI and/or the editor(s) disclaim responsibility for any injury to people or property resulting from any ideas, methods, instructions or products referred to in the content. |
© 2025 by the authors. Licensee MDPI, Basel, Switzerland. This article is an open access article distributed under the terms and conditions of the Creative Commons Attribution (CC BY) license (http://creativecommons.org/licenses/by/4.0/).
Copyright: This open access article is published under a Creative Commons CC BY 4.0 license, which permit the free download, distribution, and reuse, provided that the author and preprint are cited in any reuse.


