
Submitted:
18 June 2025
Posted:
19 June 2025
You are already at the latest version
Abstract
This study examines the psychometric properties of the School Wellbeing Scale, designed to assess wellbeing among adolescents in socially vulnerable educational contexts. A cross-sectional, quantitative design was employed, administering the 10-item instrument to a sample of 949 secondary school students. The scale evaluates four key dimensions: emotional attachment to school, engagement in school life, perceived social support, and recognition within the educational environment. Exploratory and confirmatory factor analyses confirmed a bifactorial structure comprising two latent constructs: Emotional Bond and School Participation and Perceived Support and Social Appreciation. The model yielded acceptable fit indices (CFI = 0.906; RMSEA = 0.091), and internal consistency coefficients (Cronbach’s α and McDonald’s ω) exceeded the 0.77 threshold, providing evidence of structural reliability and internal validity. These results support the scale’s utility as a valid and reliable instrument for the assessment of school wellbeing. Its application may contribute to the early detection of socio-emotional vulnerabilities, the design of inclusive intervention strategies, and the promotion of equitable, supportive educational environments that enhance both academic outcomes and student flourishing.
Keywords:
school wellbeing
; psychometric validation
; inclusion
; critical thinking
; educational performance
1. Introduction
School well-being has been consolidated as a priority line in contemporary educational research, especially in contexts of social vulnerability, where schools act as agents of protection, development and socialisation of students (Allen et al., 2018; Allen et al., 2024; López Cassà & Bisquerra Alzina, 2024). In these contexts, ensuring conditions that promote the subjective well-being of students constitutes an essential ethical responsibility, as well as a key strategy for addressing structural inequalities and fostering more equitable, stable and successful educational trajectories.
In this framework, the availability of psychometrically sound instruments for the assessment of school well-being is essential. These tools can identify the specific needs of individual students, guide the design of context-specific educational interventions and support the evaluation of programmes and policies aimed at improving the quality and equity of the education system (Gülşen Uslu, 2024; Muñiz & Fonseca-Pedrero, 2019). Furthermore, the use of validated and contextually appropriate scales, especially in disadvantaged populations, contributes to evidence-based decision-making and facilitates the collection of comparable and representative data in more complex school settings.
The validation of measurement instruments adapted to these contexts (Medina Manrique & Alonso-Tapia, 2022; Olmedo-Moreno et al., 2021) is particularly relevant in an educational landscape increasingly characterised by cultural, social and emotional diversity. Hence, far from being a merely technical task, the assessment of school well-being requires a holistic approach that takes into account the subjective experiences of students in the school environment (Losada-Puente et al., 2024). In this regard, previous research has consistently shown that perceived well-being is closely related to academic achievement, school retention and the development of protective factors such as resilience, especially relevant for students at risk of social exclusion (Allen et al., 2023; Barrance & May Hampton, 2023).
The scale presented in this study was specifically designed to capture the school experiences of students in vulnerable contexts, using a multidimensional approach. It incorporates key dimensions widely supported in the scientific literature, including perceived social support, active participation, recognition and sense of belonging to the educational community. Its development is based on a rigorous theoretical and empirical review of the main conceptual models of school well-being and builds on a consolidated line of research developed by the authors' team (Arenas-Carranza et al., 2025; Chacón-Cuberos et al., 2025; Martínez-Martínez, 2021; Serrano-García et al., 2024; Tomé-Fernández et al., 2020). These studies have highlighted the urgent need for context-sensitive tools capable of capturing the complexity inherent in socially disadvantaged educational settings.
The instrument is structured around two core dimensions: (1) Emotional Bond and School Participation, which refers to students’ engagement, interpersonal trust, and their sense of belonging to the school community and (2) Perceived Support and Social Recognition, encompassing students’ perception of being respected, listened to, and valued by teachers and peers, as well as the existence of support networks within the school environment. The relevance of these components is widely supported in the literature. Studies such as those by Jose et al. (2012), Allen et al. (2018), Beckman (2023), and Allen et al. (2024) underline the decisive role of social recognition and interpersonal trust in fostering pupils’ self-esteem, psychological wellbeing, and emotional safety.
The findings obtained in this study confirm the psychometric soundness of the instrument. Exploratory and confirmatory factor analyses validated a stable bifactorial structure, with appropriate model fit indices, high internal consistency, and strong conceptual coherence among the items. These results support the construct validity of the scale and its applicability for the rigorous assessment of school wellbeing in secondary education settings, particularly in disadvantaged contexts.
Consequently, the validation of this scale constitutes a significant contribution to the field of educational psychometrics, providing a reliable and context-sensitive tool aligned with current demands for assessment in socially vulnerable settings. Its implementation can promote educational research focused on populations at risk of exclusion, improve the design of targeted interventions and generate valuable evidence to inform public policies aimed at equity, inclusion and the comprehensive well-being of students (Organic Law 3/2020). Moreover, this proposal aligns with the international commitments established in the framework of the 2030 Agenda, contributing directly to Sustainable Development Goal 4, which promotes inclusive, equitable and quality education and lifelong learning opportunities for all (United Nations, n.d.). Consequently, this scale represents a valuable resource for both the scientific community and education practitioners committed to the continuous improvement of school environments.
2. Materials and Methods
2.1. Methodological Design
This study adopted a quantitative, cross-sectional, and descriptive research design with the objective of analysing the psychometric properties of a scale designed to assess perceived school wellbeing among adolescents, in order to validate its effectiveness as a measurement instrument.
2.2. Sample, Participants and Procedure
The sample consisted of 949 students enrolled in public secondary schools across Andalusia, selected through non-probabilistic convenience sampling. In terms of gender distribution, 402 participants identified as male (42.4%), 525 as female (55.3%), and 22 as non-binary or other (2.4%). Regarding educational level, 246 students were enrolled in Compulsory Secondary Education (25.9%), 456 in Vocational Training programmes (48.1%), and 247 in Baccalaureate programmes (26.0%).
All participants attended public schools during the 2023/2024 academic year and were located in areas targeted by the Andalusian Regional Strategy for Social Cohesion and Inclusion (ERACIS), which focuses on municipalities facing severe conditions of social exclusion and/or significant risk factors associated with such exclusion.
Anonymity and confidentiality were guaranteed throughout the process, in line with the ethical approval granted by the Ethics Committee of the University of Granada (approval number: 2598/CEIH/2022).
The instrument under validation was an auto-administered questionnaire consisting of ten items, designed to measure different dimensions of school wellbeing, including perceived support, interpersonal connection, and participation in the school environment. Responses were recorded using a six-point Likert scale (ranging from 1 to 6), which enabled the analysis of central tendency, variability, and normality of the response distribution.
Prior to the administration of the questionnaire, participants were informed of the study’s objectives and the procedures involved, and their informed consent was obtained. The questionnaire was administered collectively in classroom settings, under the supervision of the research team and with the support of the schools’ teaching staff. Once data collection was completed, the responses were cleaned and subjected to statistical analysis to assess the psychometric adequacy of the instrument.
3. Results
In the initial phase of the analysis, descriptive statistics were computed for the ten items comprising the Perceived School Wellbeing Scale. Measures of central tendency (means), dispersion (standard deviations and variances), and distributional shape (skewness and kurtosis) were examined to assess the response patterns and evaluate the suitability of the data for subsequent factor analyses.
The mean scores suggested that students reported moderately high levels of perceived support and connectedness within the school environment. Notably, the item referring to the availability of help obtained the highest mean (M = 4.71; SD = 1.35), indicating strong perceived access to support.
To assess univariate normality, skewness and kurtosis values were inspected following the criteria proposed by Schmitt et al. (2011), Kline (2016) and Hu and Bentler (1998), which recommend acceptable thresholds within the ±2 range. All items conformed to these parameters, and consequently, none were excluded from further analysis.
These preliminary results confirmed that the data met the assumptions of normality, allowing the researchers to proceed with the exploratory factor analysis (EFA) with statistical validity. All items were retained in the initial model, enabling a comprehensive examination of the scale’s structure.
Table 1 presents the basic descriptive statistics for each of the ten items. This includes measures of central tendency and dispersion (mean, standard deviation, variance), as well as skewness (S) and kurtosis (K) values, in order to verify the suitability of the dataset for factor analysis. Item means ranged from 2.57 to 4.71, suggesting a moderately high perception of support and connection with the school environment, particularly for Item 1 (“When I need help, there is someone willing to support me”), which reported the highest average (M = 4.71; SD = 1.35).
Regarding data normality, all items complied with the reference ranges set by Schmitt et al. (2011) and Hu & Bentler (1998). Although some items displayed moderate negative kurtosis - such as Item 2 (K = -1.073) and Item 9 (K = -1.218) - this indicated greater dispersion in the responses and was taken into account in the subsequent factor interpretation (George & Mallery, 2019; Kline, 2016; Byrne, 2016). Overall, these preliminary findings supported the continuation of the exploratory factor analysis, ensuring a statistically appropriate foundation while retaining all items in the model.
The scree plot presented in Figure 1 shows the distribution of eigenvalues for the components extracted during the exploratory factor analysis. As illustrated, the first component presents a markedly higher eigenvalue (approximately 4.5), followed by a sharp decline between the second and third components. Beyond this point, the eigenvalues stabilise at clearly subunitary levels. This pattern indicates the presence of a dominant initial component and suggests the appropriateness of retaining two main factors, following both Kaiser’s criterion (eigenvalues > 1) and the elbow criterion (visible point of inflection in the descending curve).
Figure 2 presents the graphical representation of the items in a two-dimensional space following orthogonal (Varimax) rotation. The distribution reveals that the items cluster around two clearly defined axes, forming relatively consistent groupings. Items BIS5, BIS6, and BIS7 are located in the upper right quadrant, with BIS1 and BIS10 positioned nearby - suggesting the existence of a first component centred on aspects of social support or perceived backing.
Conversely, items BIS2, BIS3, BIS4, and BIS8 are more dispersed along the horizontal axis, indicating a second, more heterogeneous dimension, possibly associated with participation or recognition within the school context. Taken together, the interpretation of both figures supports the bifactorial solution as the most appropriate for this school wellbeing questionnaire, offering a structure that is both conceptually coherent and statistically sound.
The rotated factor matrix presented in Table 2 was obtained through Exploratory Factor Analysis (EFA), using the maximum likelihood method with Varimax orthogonal rotation. This matrix illustrates the distribution of the items across the extracted factors and the degree of saturation of each item within its corresponding dimension.
The suitability of the data for EFA was verified through Bartlett’s test of sphericity (χ² = 3460.30; df = 45; p < .001), which rejected the null hypothesis of an identity matrix, and through the Kaiser-Meyer-Olkin (KMO) measure of sampling adequacy, which yielded an excellent value of 0.880. These indices confirm strong partial correlations among the items and the appropriateness of the data for factorial analysis.
The exploratory factor analysis yielded two factors with eigenvalues greater than 1, in accordance with Kaiser’s criterion. Factor 1 recorded an eigenvalue of 4.390, explaining 39.1% of the total variance in the unrotated solution, while Factor 2 had an eigenvalue of 1.340, accounting for an additional 7.4%. The cumulative variance explained reached 46.5%.
After applying Varimax rotation, the distribution of variance became more balanced: Factor 1 explained 24.60% and Factor 2 explained 21.59% of the variance, resulting in a total of 46.20%. This redistribution enhanced the interpretability of the factors and supported their conceptual stability, allowing for the identification of two distinct psychological dimensions of perceived school wellbeing.
In relation to the factor determination indices (FDI) we can see that in the 2 factors (factors: 1 and 2) these indices are above 0.80, which indicates that the factor scores can be considered quite reliable (Ferrando & Lorenzo-Seva ,2016).
On the other hand, factor loadings show high and stable values in both factors. In fact, we have calculated Bentler's Simplicity Index (S) = 0.81730 (Percentile 78) associated with a BC Bootstrap 95% confidence interval = (0.722 - 0.863). This index assesses how simple the factor structure is, i.e. whether the variables have high loadings on a single factor and rather low loadings on the others. With Bentler (1977) and Lorenzo-Seva (2003) we can conclude that, indeed, the value obtained (BSI = 0.817) is quite good, since values close to 1 indicate greater simplicity. On the other hand, being located at the 78th percentile we can conclude that our factorial solution is simpler than 78% of the solutions in comparable distributions.
The factor loadings revealed strong and stable values across both factors. In Factor 1, the most salient items were I-3 (0.930), I-4 (0.598), and I-2 (0.583), indicating high internal coherence, likely associated with a dimension linked to perceived belonging or interpersonal trust. In Factor 2, the items with the highest loadings were I-6 (0.723), I-5 (0.704), and I-10 (0.566), suggesting a dimension more focused on participatory interaction and communicative dynamics within the school setting.
The table also presents uniqueness values, which indicate the proportion of variance in each item not explained by the common factors. All items had uniqueness values below 0.80, which is considered desirable, as it implies that most of the variance is accounted for by the retained factor structure.
Factor 1 was identified as Emotional Bond and School Participation, comprising items [I-3; I-4; I-2; I-8; I-9]. This dimension captures key aspects of students’ affective integration within the school environment, including interpersonal trust, emotional expressiveness, and active engagement in school life. The items reflect students’ comfort in sharing personal concerns with teachers and peers, as well as their perception of being involved and acknowledged in everyday school dynamics. Overall, this factor denotes a positive emotional affiliation with the school context, underpinned by open communication, mutual respect, and participatory inclusion.
Factor 2 was labelled Perceived Support and Social Recognition, including items [I-6; I-5; I-10; I-7; I-1]. This construct relates to students’ subjective perception of receiving emotional support, being recognised, and experiencing meaningful connections within their school community. It encompasses feelings of being listened to, valued, accompanied, and emotionally supported by both peers and educators. In this regard, the factor reflects the degree to which the educational environment responds to students’ affective and relational needs, thereby strengthening their sense of self-worth and overall wellbeing.
In addition, it is worth highlighting that the reliability indices obtained show suitable values for both dimensions identified in the model. Factor 2 demonstrates slightly higher internal consistency (α = 0.783; ω = 0.783), closely followed by Factor 1 (α = 0.777; ω = 0.780), indicating solid homogeneity among the items comprising each factor. Overall, the full scale achieves high internal reliability (α = 0.844; ω = 0.841), supporting its internal coherence and utility as a valid instrument for assessing perceived school wellbeing.
Subsequently, a Confirmatory Factor Analysis (CFA) was conducted to test the consistency of the scale structure established during the Exploratory Factor Analysis (EFA). A structural model was developed, consisting of the previously identified factors and the corresponding items grouped under each one. The model includes two latent variables representing the obtained dimensions and a total of 10 observed variables referring to the final scale items.
Initially, the model fit indices were reported, yielding a statistically significant Chi-square test value [χ² = 356.81; df = 45; p < 0.001]. However, it is important to note that the Chi-square test is highly sensitive to sample size (Byrne, 2016; Hu & Bentler, 1999; Kline, 2016), which is why alternative fit indices were also used. Several complementary fit indices were included to assess the adequacy of the model, specifically the Incremental Fit Index (IFI), the Normed Fit Index (NFI), the Comparative Fit Index (CFI), the Tucker-Lewis Index (TLI), and the Goodness of Fit Index (GFI). The values obtained for these indicators were satisfactory [IFI = 0.906; NFI = 0.897; CFI = 0.906; TLI = 0.876; GFI = 0.985], and fell within the thresholds considered acceptable in methodological literature, as established by Byrne (2016) and Kline (2016).
Additionally, the Root Mean Square Error of Approximation (RMSEA) presented a value of 0.091, considered acceptable though slightly elevated, and the Standardised Root Mean Square Residual (SRMR) was 0.056, indicating a satisfactory level of model fit.
Table 3 displays the standardised factor loadings from the model, all of which are statistically significant (p < 0.001), with values exceeding the recommended threshold of 0.30 and, in most cases, above 0.50. These results indicate good convergent validity of the items with respect to their corresponding factors.
In Factor 1 (Emotional Bond and School Participation), the highest standardised loading is observed for Item I-8 ("I feel that my opinion matters in my school") with a value of 0.728, followed by Item I-3 ("I feel comfortable talking about my problems with my teachers") at 0.692. Items I-2, I-4, and I-9 also show acceptable loadings (ranging from 0.473 to 0.667), confirming their meaningful contribution to the proposed dimension. It is worth noting that although Item I-9 ("I take part in planning school activities") has the lowest loading within this factor (0.473), it maintains a valid saturation level that justifies its inclusion.
In Factor 2 (Perceived Support and Social Appreciation), Items I-6 and I-5 stand out due to their high standardised loadings (0.828 and 0.826, respectively), demonstrating a strong relationship with the latent variable. These are followed by Items I-7 (0.686) and I-1 (0.570), which also show consistent loadings that reinforce the internal coherence of the factor. Lastly, Item I-10 ("I usually do not feel alone") presents a more modest loading (0.359), yet still falls within the acceptable range for confirmatory analysis in social sciences.
Taken together, the results of the CFA empirically support the proposed bifactorial structure, with high and consistent factor loadings reinforcing the structural validity of the developed instrument. This evidence underpins the robustness of the model and its suitability for reliably and distinctly measuring two key components of students' perceived school wellbeing.
The visual representation of the structural model confirms the adequacy and internal coherence of the proposed bifactorial structure (Figure 3). The paths (arrows) linking the items to their respective factors display clearly differentiated and consistent loadings, reinforcing the conceptual organisation established through the confirmatory factor analysis. Items 2, 3, 4, 8, and 9 are grouped under Factor 1, while items 1, 5, 6, 7, and 10 are associated with Factor 2, with no evidence of cross-loadings or dimensional overlap.
The model layout reveals a balanced internal structure, with well-defined relationships between the observed variables and their latent constructs. Furthermore, the correlation between the two factors (r = 0.77) is statistically significant and reflects a theoretically expected relationship, consistent with existing literature on school wellbeing, where emotional bonding and perceived social support are closely interconnected. Overall, the model not only demonstrates a good statistical fit but also presents a solid theoretical and visual structure, reinforcing the structural validity of the instrument and its utility as a multidimensional psychometric evaluation tool. This visualisation supports the coherence of the adopted theoretical framework and confirms the functional distinction between the two proposed dimensions.
4. Discussion
This study offers robust empirical evidence supporting the validity and reliability of the Perceived School Wellbeing Scale, revealing a coherent and theoretically grounded bifactorial structure. The two core dimensions identified - Emotional Bond and School Participation and Perceived Support and Social Appreciation - are consistent with existing theoretical frameworks (Trianes et al., 2006), which underscore the necessity of conceptualising school wellbeing as a multidimensional construct that integrates both relational and emotional components.
The stability of the factorial structure, confirmed through both exploratory and confirmatory analyses, reinforces the instrument’s applicability across diverse educational settings, particularly in populations exposed to social vulnerability. As noted by Muñiz and Fonseca-Pedrero (2019), ensuring structural validity and internal consistency is a fundamental requirement for the adoption of psychometric instruments in educational research and practice. The scale’s performance - demonstrated through adequate model fit indices and strong internal consistency coefficients (α and ω > 0.77 for both factors) - supports its use as a reliable diagnostic tool.
Furthermore, the findings highlight the protective function of perceived social support and active participation in reducing emotional distress and mitigating the risk of social exclusion. These outcomes are aligned with previous research (Marsh et al., 2009; Byrne, 2012), which emphasises the influence of a supportive and inclusive school climate on students’ personal development and academic engagement. The significant interrelation between the two dimensions suggests that school wellbeing is a dynamic construct, shaped by the reciprocal reinforcement of emotional connectedness and perceived support.
From a practical standpoint, the validation of this scale represents a meaningful contribution to the identification of student needs, the design of targeted interventions, and the evaluation of inclusive educational strategies. Notably, the scale demonstrated solid psychometric performance in a sample drawn from socioeconomically disadvantaged contexts, thus highlighting its potential for application in schools characterised by high levels of social and cultural diversity.
In sum, the present study advances the field of educational psychometrics and school wellbeing research by providing a validated, context-sensitive instrument capable of capturing the multifaceted nature of students’ school experiences. Future research may build on these findings by examining the relationship between school wellbeing and additional variables such as academic achievement, resilience, and subjective wellbeing, thereby deepening our understanding of the mechanisms that promote positive developmental outcomes.
5. Conclusions
The results of this study confirm the factorial validity and internal reliability of the Perceived School Wellbeing Scale for adolescent learners. The scale comprises two theoretically and empirically supported dimensions - Emotional Bond and School Participation and Perceived Support and Social Appreciation - both of which demonstrated strong factor loadings, satisfactory model fit indices, and internal consistency coefficients above the recommended thresholds (α and ω > 0.77).
These findings align with previous literature advocating for a multidimensional approach to school wellbeing that integrates emotional, relational, and participatory factors (Trianes et al., 2006; Marsh et al., 2009). International research has consistently shown that perceived social support and engagement in school life are critical determinants of socio-emotional development, particularly in settings marked by social disadvantage.
The validated scale thus represents a significant contribution to educational measurement, offering researchers and practitioners a reliable and contextually appropriate tool for assessing student wellbeing. Its application can inform data - driven decisions, support the tailoring of interventions to student needs, and ultimately contribute to the enhancement of educational quality, equity, and inclusion. In doing so, it reinforces the role of schools as key agents in promoting protection, integration, and holistic student development.
Looking ahead, the availability of this instrument opens new avenues for research and practice. It enables the longitudinal monitoring of school wellbeing and its relationship to academic performance, resilience, and school retention. Additionally, it provides a solid basis for evaluating the effectiveness of programmes and policies aimed at cultivating inclusive, participatory, and wellbeing-oriented educational environments. Overall, this study lays the groundwork for advancing the measurement and promotion of school wellbeing, particularly in support of more just, healthy, and inclusive educational experiences for all learners - especially those exposed to structural vulnerabilities.
Informed Consent Statement
Informed consent was obtained from all subjects involved in the study.
Data Availability Statement
Data are contained within the article.
Conflicts of Interest
The authors declare no conflicts of interest.
References
- Allen, K. A., Kern, M. L., Vella-Brodrick, D., Hattie, J., & Waters, L. (2018). What schools need to know about fostering school belonging: A meta-analysis. Educational Psychology Review, 30, (1), 1–37. [CrossRef]
- Allen, K. A. , Greenwood, C. J., Berger, E., Patlamazoglou, L., Reupert, A., Wurf, G., May, F., O`Connor, M., Sanson, A., Olsson, C.A., & Letcher. (2024). Adolescent School Belonging and Mental Health Outcomes in Young Adulthood: Findings from a Multi-wave Prospective Cohort Study. School Mental Health, 16, 149–160. [CrossRef]
- Arenas-Carranza, S. , Olmedo-Moreno, E., & Expósito-López, J. (2025). Neuroeducational Factors Influencing Cognitive and Emotional Development in Unaccompanied Foreign Minors: The Impact of Migration Trauma. Future, 3(2), 5. [CrossRef]
- Barrance, R. M. , & May Hampton, J. M. (2023). The relationship between subjective well-being in school and children’s participation rights: international evidence from the Children’s Wo Worlds survey. Children and Youth Services Review, 151, 107038. [CrossRef]
- Beckman, P. (2023). El índice de experiencia de diversidad informa el sentido de pertenencia. RELIEVE - Revista Electrónica De Investigación Y Evaluación Educativa, 29(1). [CrossRef]
- Bentler, P.M. (1977). Factor simplicity index and transformations. Psychometrika, 42(2), 277 - 295. [CrossRef]
- Byrne, B. M. (2012). Structural Equation Modeling with Mplus: Basic Concepts, Applications, and Programming, (1st ed.). Routledge. [CrossRef]
- Byrne, B. M. (2016). Structural equation modeling with AMOS: Basic concepts, applications, and programming, (3rd ed.). Routledge. [CrossRef]
- Chacón-Cuberos, R. , Rodríguez-Sabiote, C., Expósito-López, J., Olmedo-Moreno, E., Serrano-García, J., & Hortas-Aliaga, O. (2025). Development of an Employability Thinking Scale for Use with Young People in Training: Exploratory and Confirmatory Factor Analysis. Systems, 13(6), 479. [CrossRef]
- Ferrando, P. J. , & Lorenzo-Seva U. (2016). A note on improving EAP trait estimation in oblique factor-analytic and item response theory models. Psicologica, 37, 235-247.
- George, D. , & Mallery, P. (2019). IBM SPSS statistics 26 step by step: A simple guide and reference, (16th ed.). Routledge. [CrossRef]
- Gülşen Uslu, F. (2024). The effect of a sense of school belonging on academic achievement: A metaanalytical review. e-Kafkas Journal of Educational Research, 11, 673-687. [CrossRef]
- Hu, L. T. , & Bentler, P. M. (1998). Fit indices in the modeling of covariance structures: Sensitivity to incorrect specification of the subparameterized model. Psychological Methods, 3, 424–53. [CrossRef]
- Hu, L. T. , & Bentler, P. M. (1999). Cutoff criteria for fit indexes in covariance structure analysis: Conventional criteria versus new alternatives. Structural Equation Modeling: A Multidisciplinary Journal, 6, (1), 1–55. [CrossRef]
- Jose, P. E., Ryan, N., & Pryor, J. (2012). Does social connectedness promote a greater sense of well-being in adolescence over time? Journal of Research on Adolescence, 22, (2), 235–251. [CrossRef]
- Kline, R. B. (2016). Principles and Practice of Structural Equation Modeling (4th ed.). Guilford Press.
- López Cassà, E. , & Bisquerra Alzina, R. (2024). Educar en las emociones en tiempos de crisis. RELIEVE - Revista Electrónica De Investigación Y Evaluación Educativa, 30(1). [CrossRef]
- Lorenzo-Seva, U. (2003). A factor simplicity index. Psychometrika, 68, 49-60. [CrossRef]
- Losada-Puente, L. , Mendiri, P., Rebollo-Quintela, N., & Fraguela-Vale, R. (2024). Diseño y validación de un cuestionario de Bienestar Escolar en Educación Primaria. Aula Abierta, 53(3), 267–276. [CrossRef]
- Marsh, H. W., Hau, K. T., & Wen, Z. (2009). In search of golden rules: Comment on hypothesis-testing approaches to setting cutoff values for fit indexes and dangers in overgeneralizing Hu and Bentler’s findings. Structural Equation Modeling, 11, (3), 320–341. [CrossRef]
- Martínez-Martínez, A. , Tomé-Fernández, M., García-Garnica, M., & Olmedo-Moreno, E. Mª. (2021)Explanatory Model of the Relationships Between Self-Efficacy and Personal Learning Environments in Immigrant Minors Without a Legal Guardian, Journal of Refugee Studies, 34(4), 4225–4241. [CrossRef]
- Medina Manrique, M. I. , & Alonso-Tapia, J. (2022). Measuring subjective resilience in Colombian students in the horizon of social adversity. International Journal of Sociology of Education, 11(1), 25–57. [CrossRef]
- Muñiz, J. , & Fonseca-Pedrero, E. (2019). Diez pasos para la construcción de un test. Psicothema, 31, (1), 7–16. [CrossRef]
- Olmedo-Moreno, E. M. , Expósito López, J., Romero-Díaz de la Guardia, J. J., Olmos-Gómez, M. del C., Sánchez-Martín, M., & Chacón-Cuberos, R. (2021). Academic self-efficacy and future work skills in unaccompanied foreign minors: structural equation analysis according to residence time. European Journal of Social Work, 25(4), 681–695. [CrossRef]
- Organic Law 3/2020 of 29 December 2020, which amends Organic Law 2/2006 of 3 May on Education. Boletín Oficial del Estado, 340, 30 December 2020, pp. 122868-122953. https://www.boe.es/eli/es/lo/2020/12/29/3.
- Serrano-García, J. , Rakdani-Arif Billah, F. Z., Olmedo-Moreno, E. M., & Expósito-López, J. (2024). Scale of Perceptions of Future Primary School Teachers on Unaccompanied Foreign Minors: Exploratory and Confirmatory Analysis. Social Sciences, 13(8), 392. [CrossRef]
- Schmitt, T. A. (2011). Current methodological considerations in exploratory and confirmatory factor analysis. J. Psychoeduc. Assess. 29(4), 304–321. [CrossRef]
- Tomé-Fernández, M. , Fernández-Leyva, C., & Olmedo-Moreno, E. M. (2020). Exploratory and Confirmatory Factor Analysis of the Social Skills Scale for Young Immigrants. Sustainability, 12(17), 6897. [CrossRef]
- Trianes, M. V., Blanca, M. J., De la Morena, L., Infante, L., & Raya, S. (2006). Un cuestionario para evaluar el clima social del centro escolar. Psicothema, 18, (2), 272–277. psicothema.com+8psicothema.com+8pdfs.semanticscholar.org+8.
- United Nations. (d.n.). Sustainable Development Goals. https://www.un.org/sustainabledevelopment/es/objetivos-de-desarrollo-sostenible/.
Figure 1.
Scree plot of the eigenvalues of the extracted components.
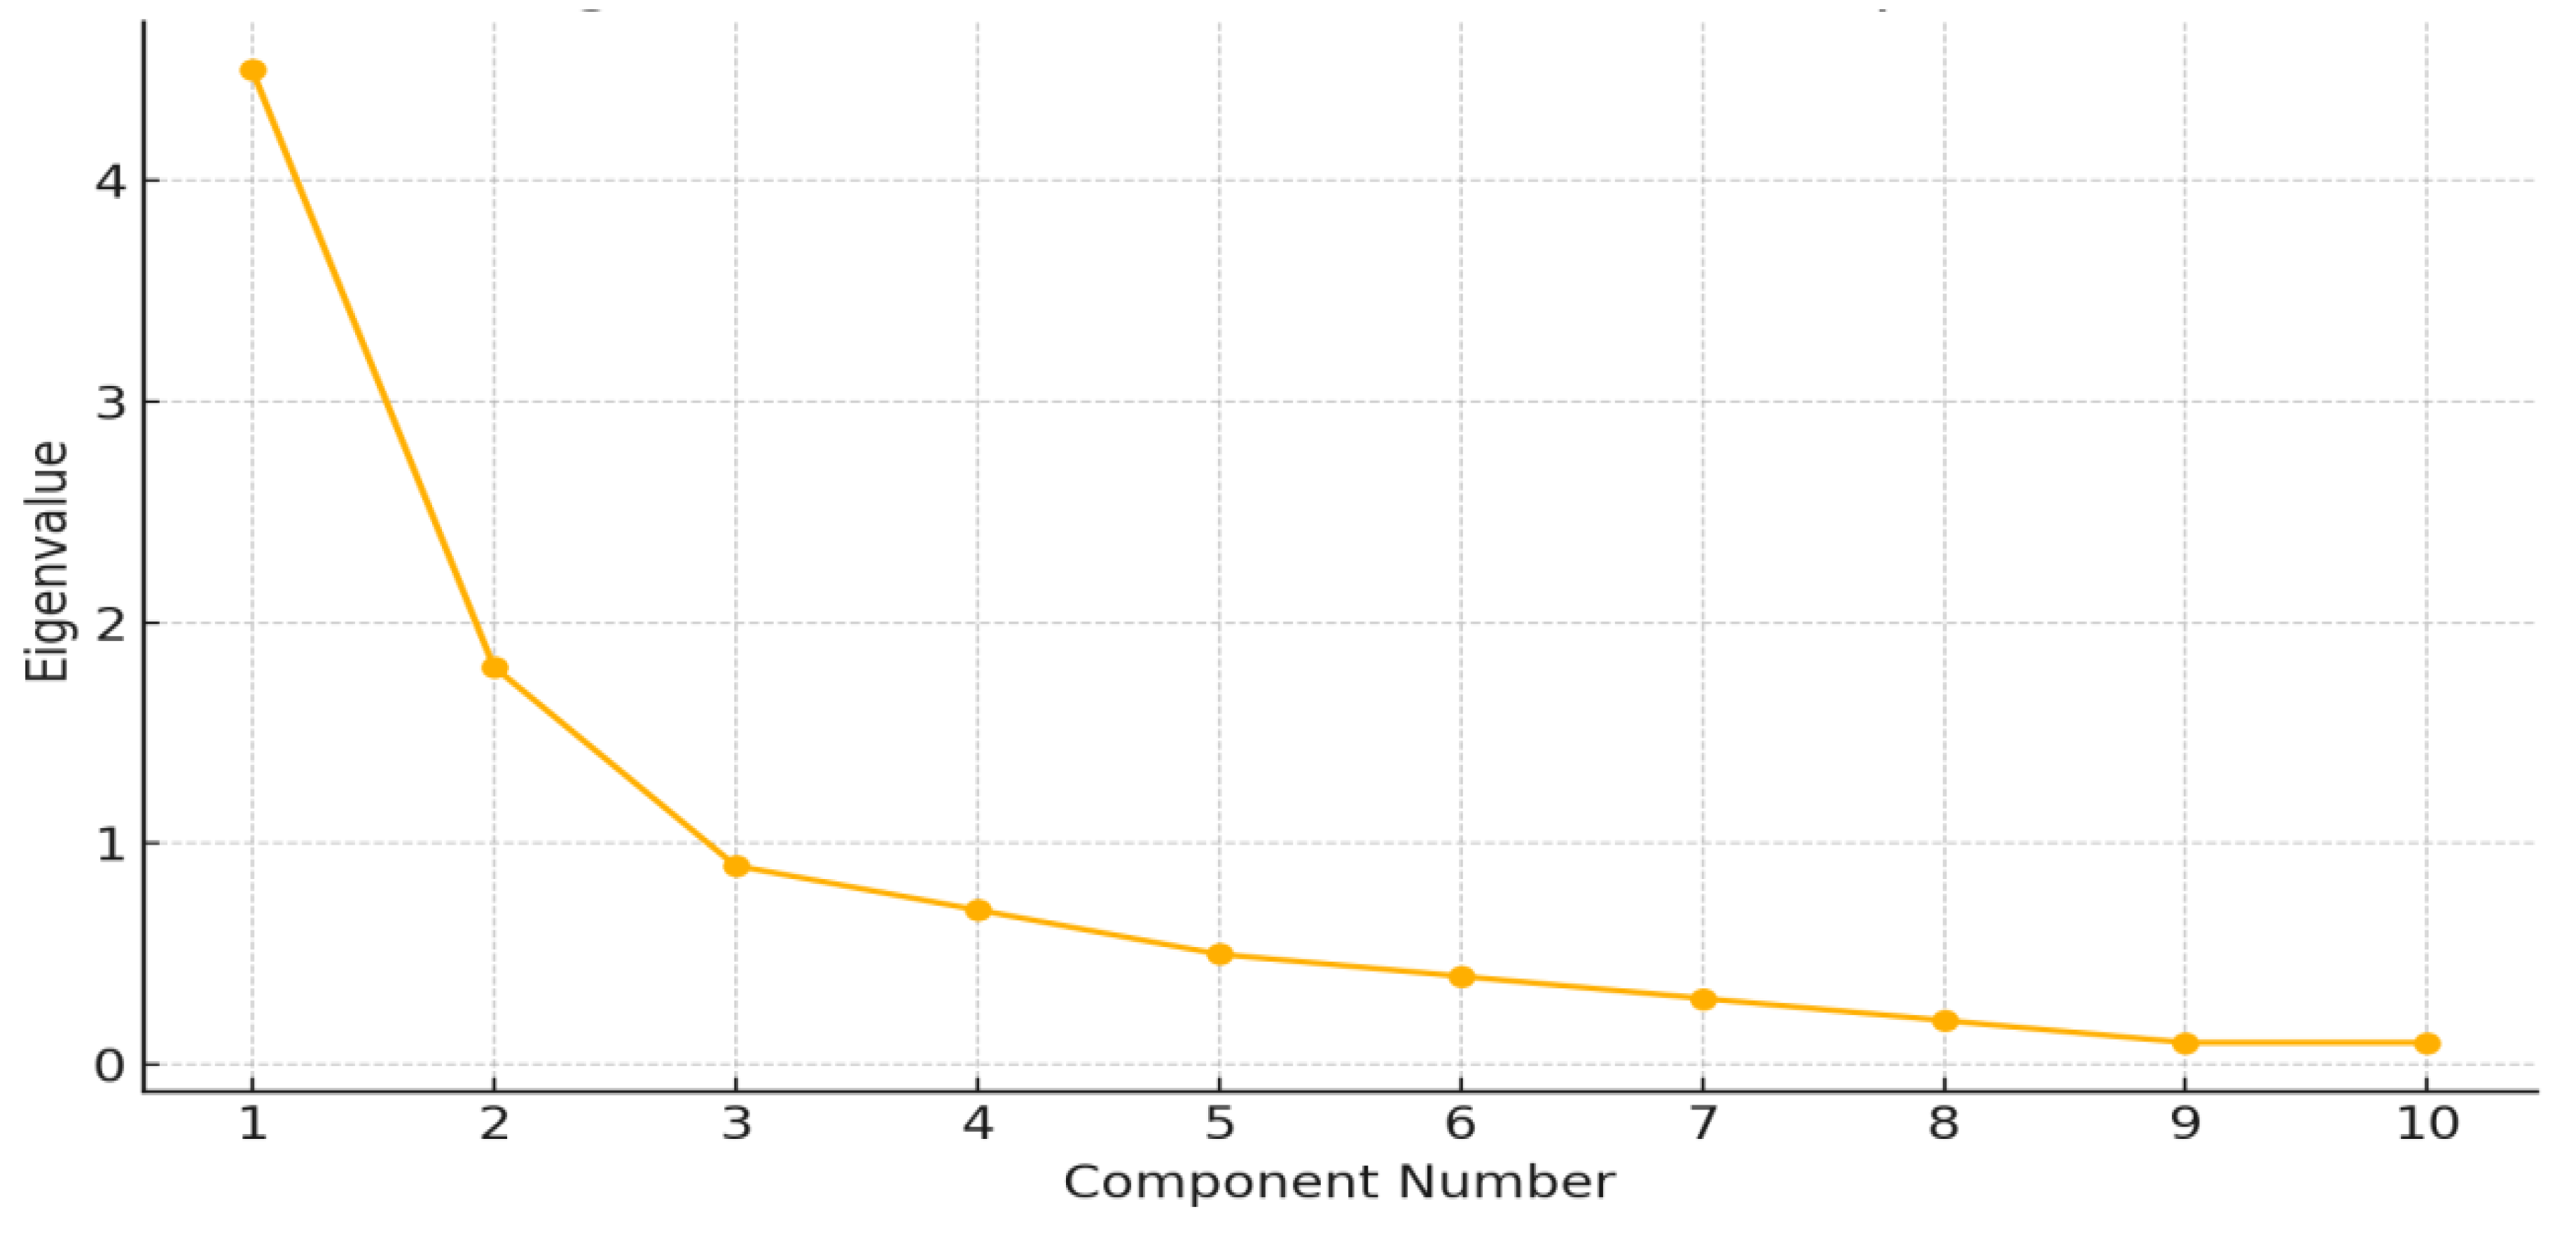
Figure 2.
This is a figure. Schemes follow the same formatting.
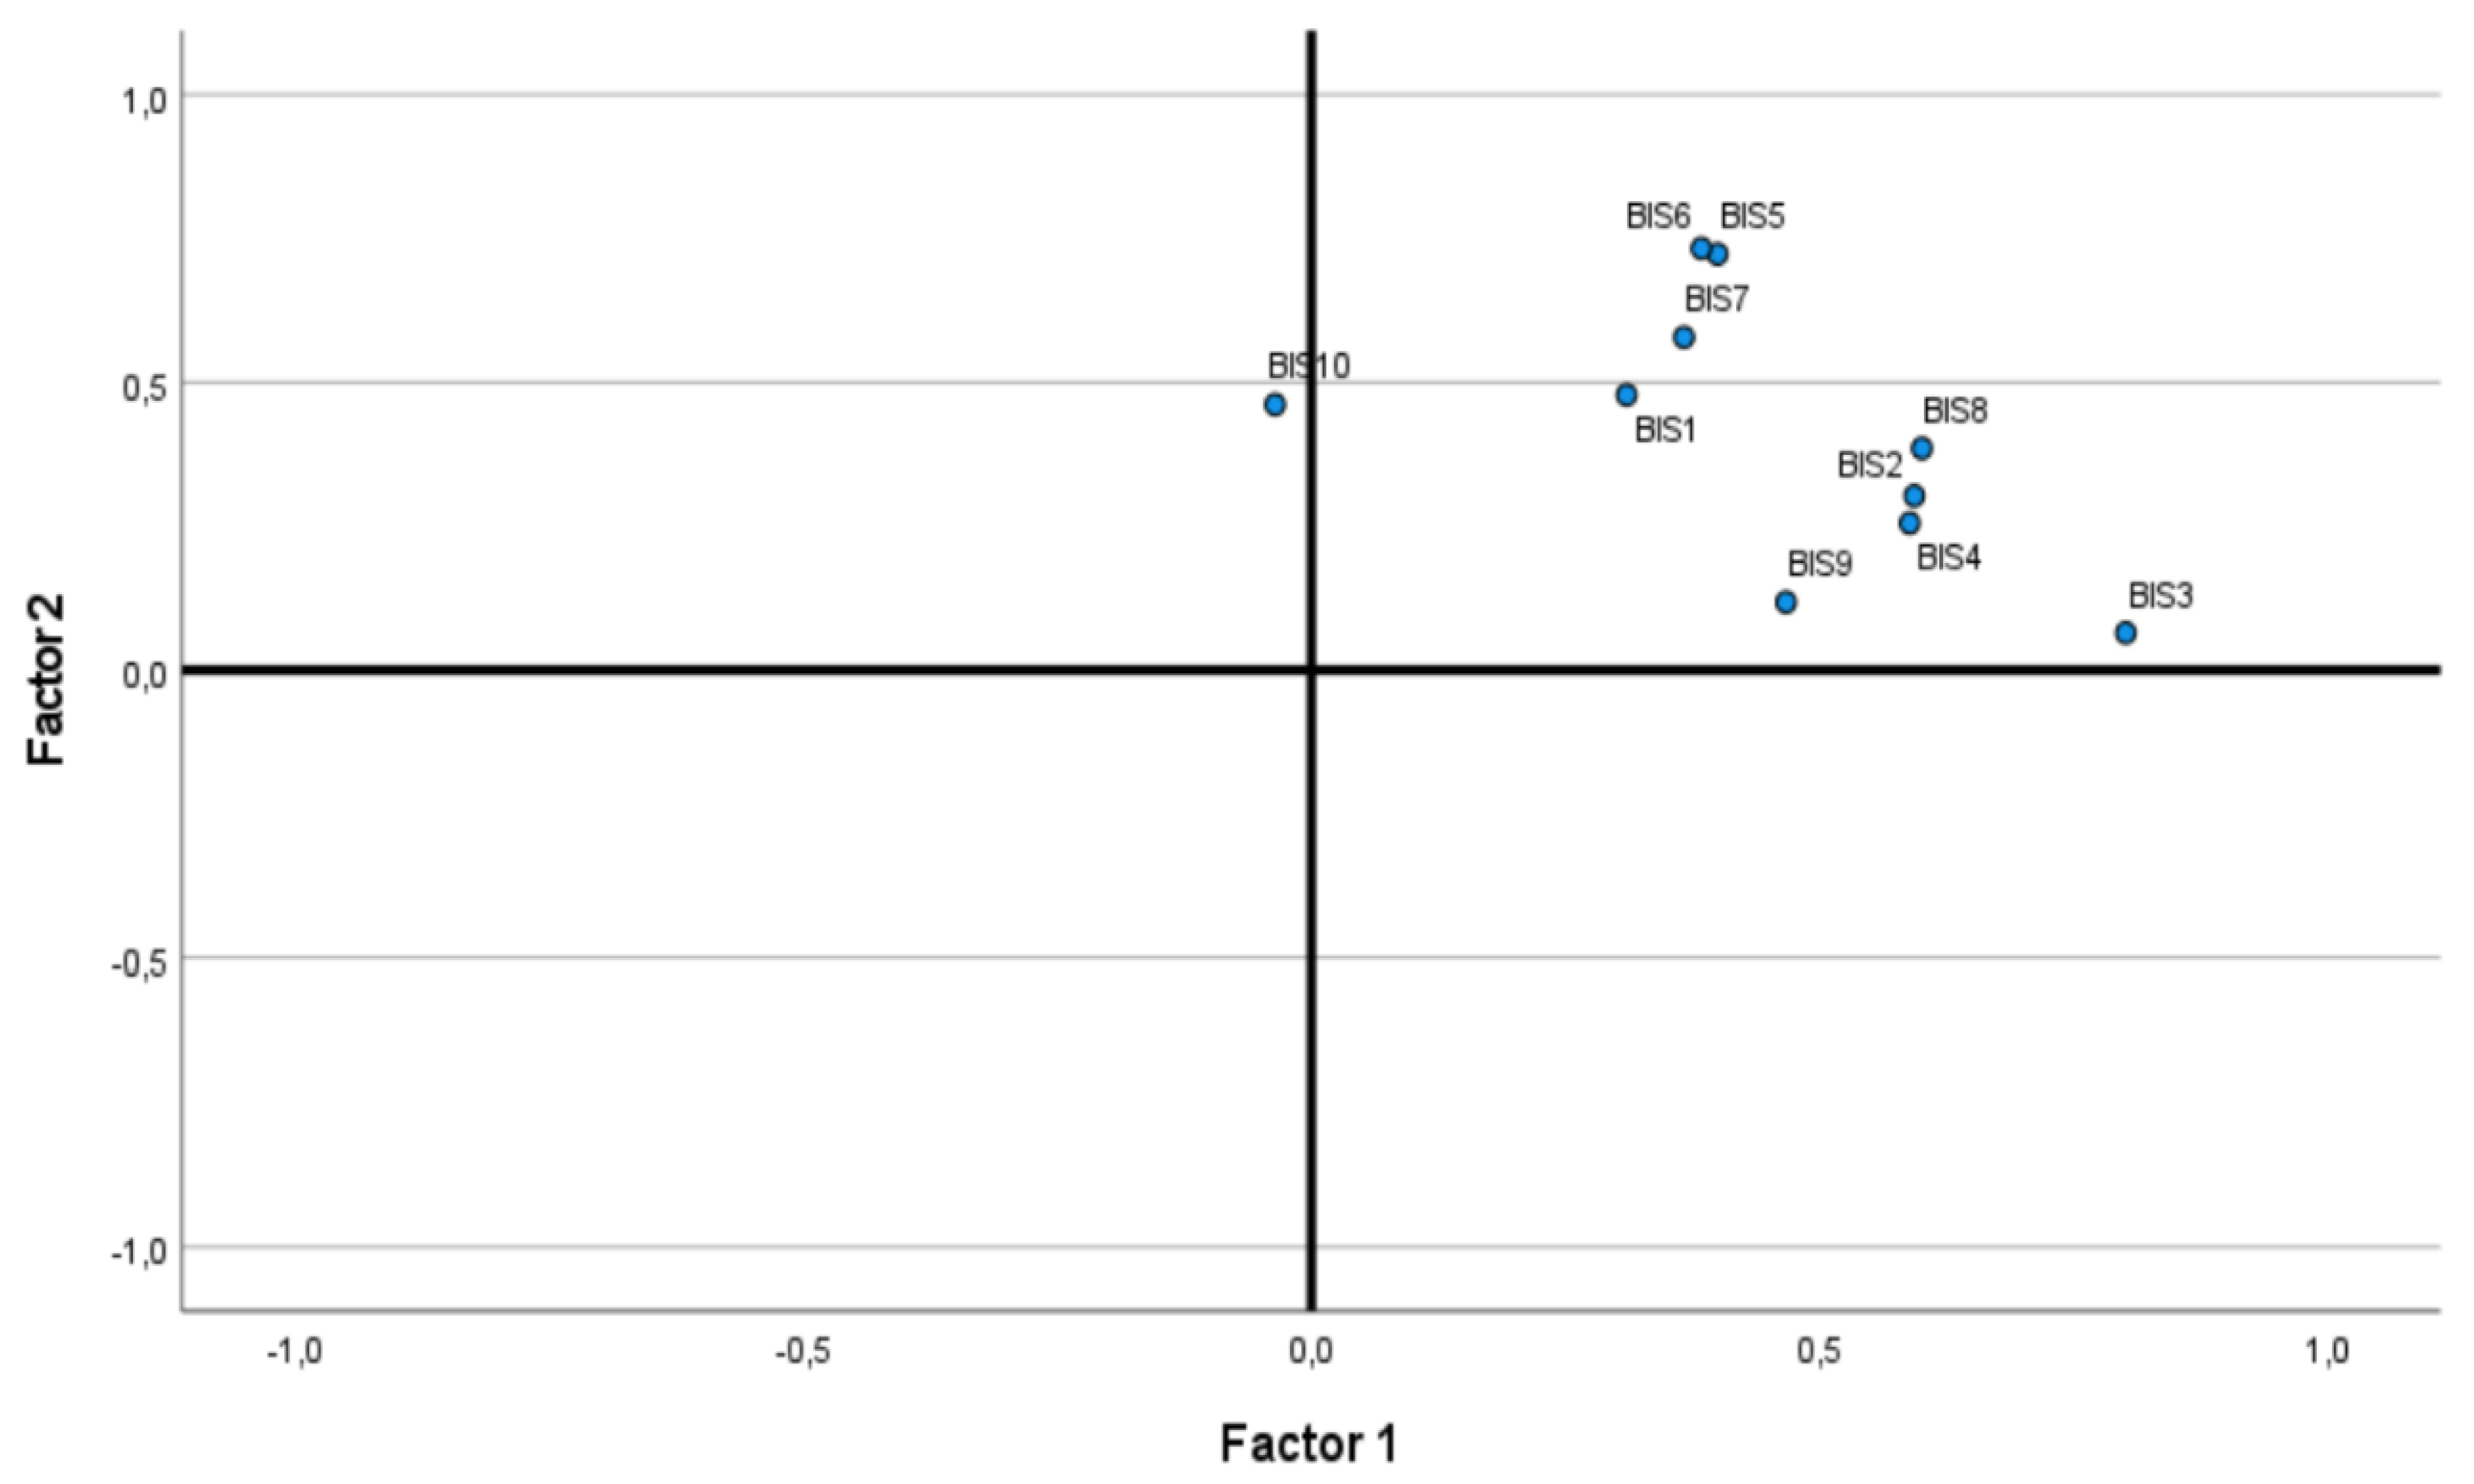
Figure 3.
Structural Model for the Confirmatory Factor Analysis.
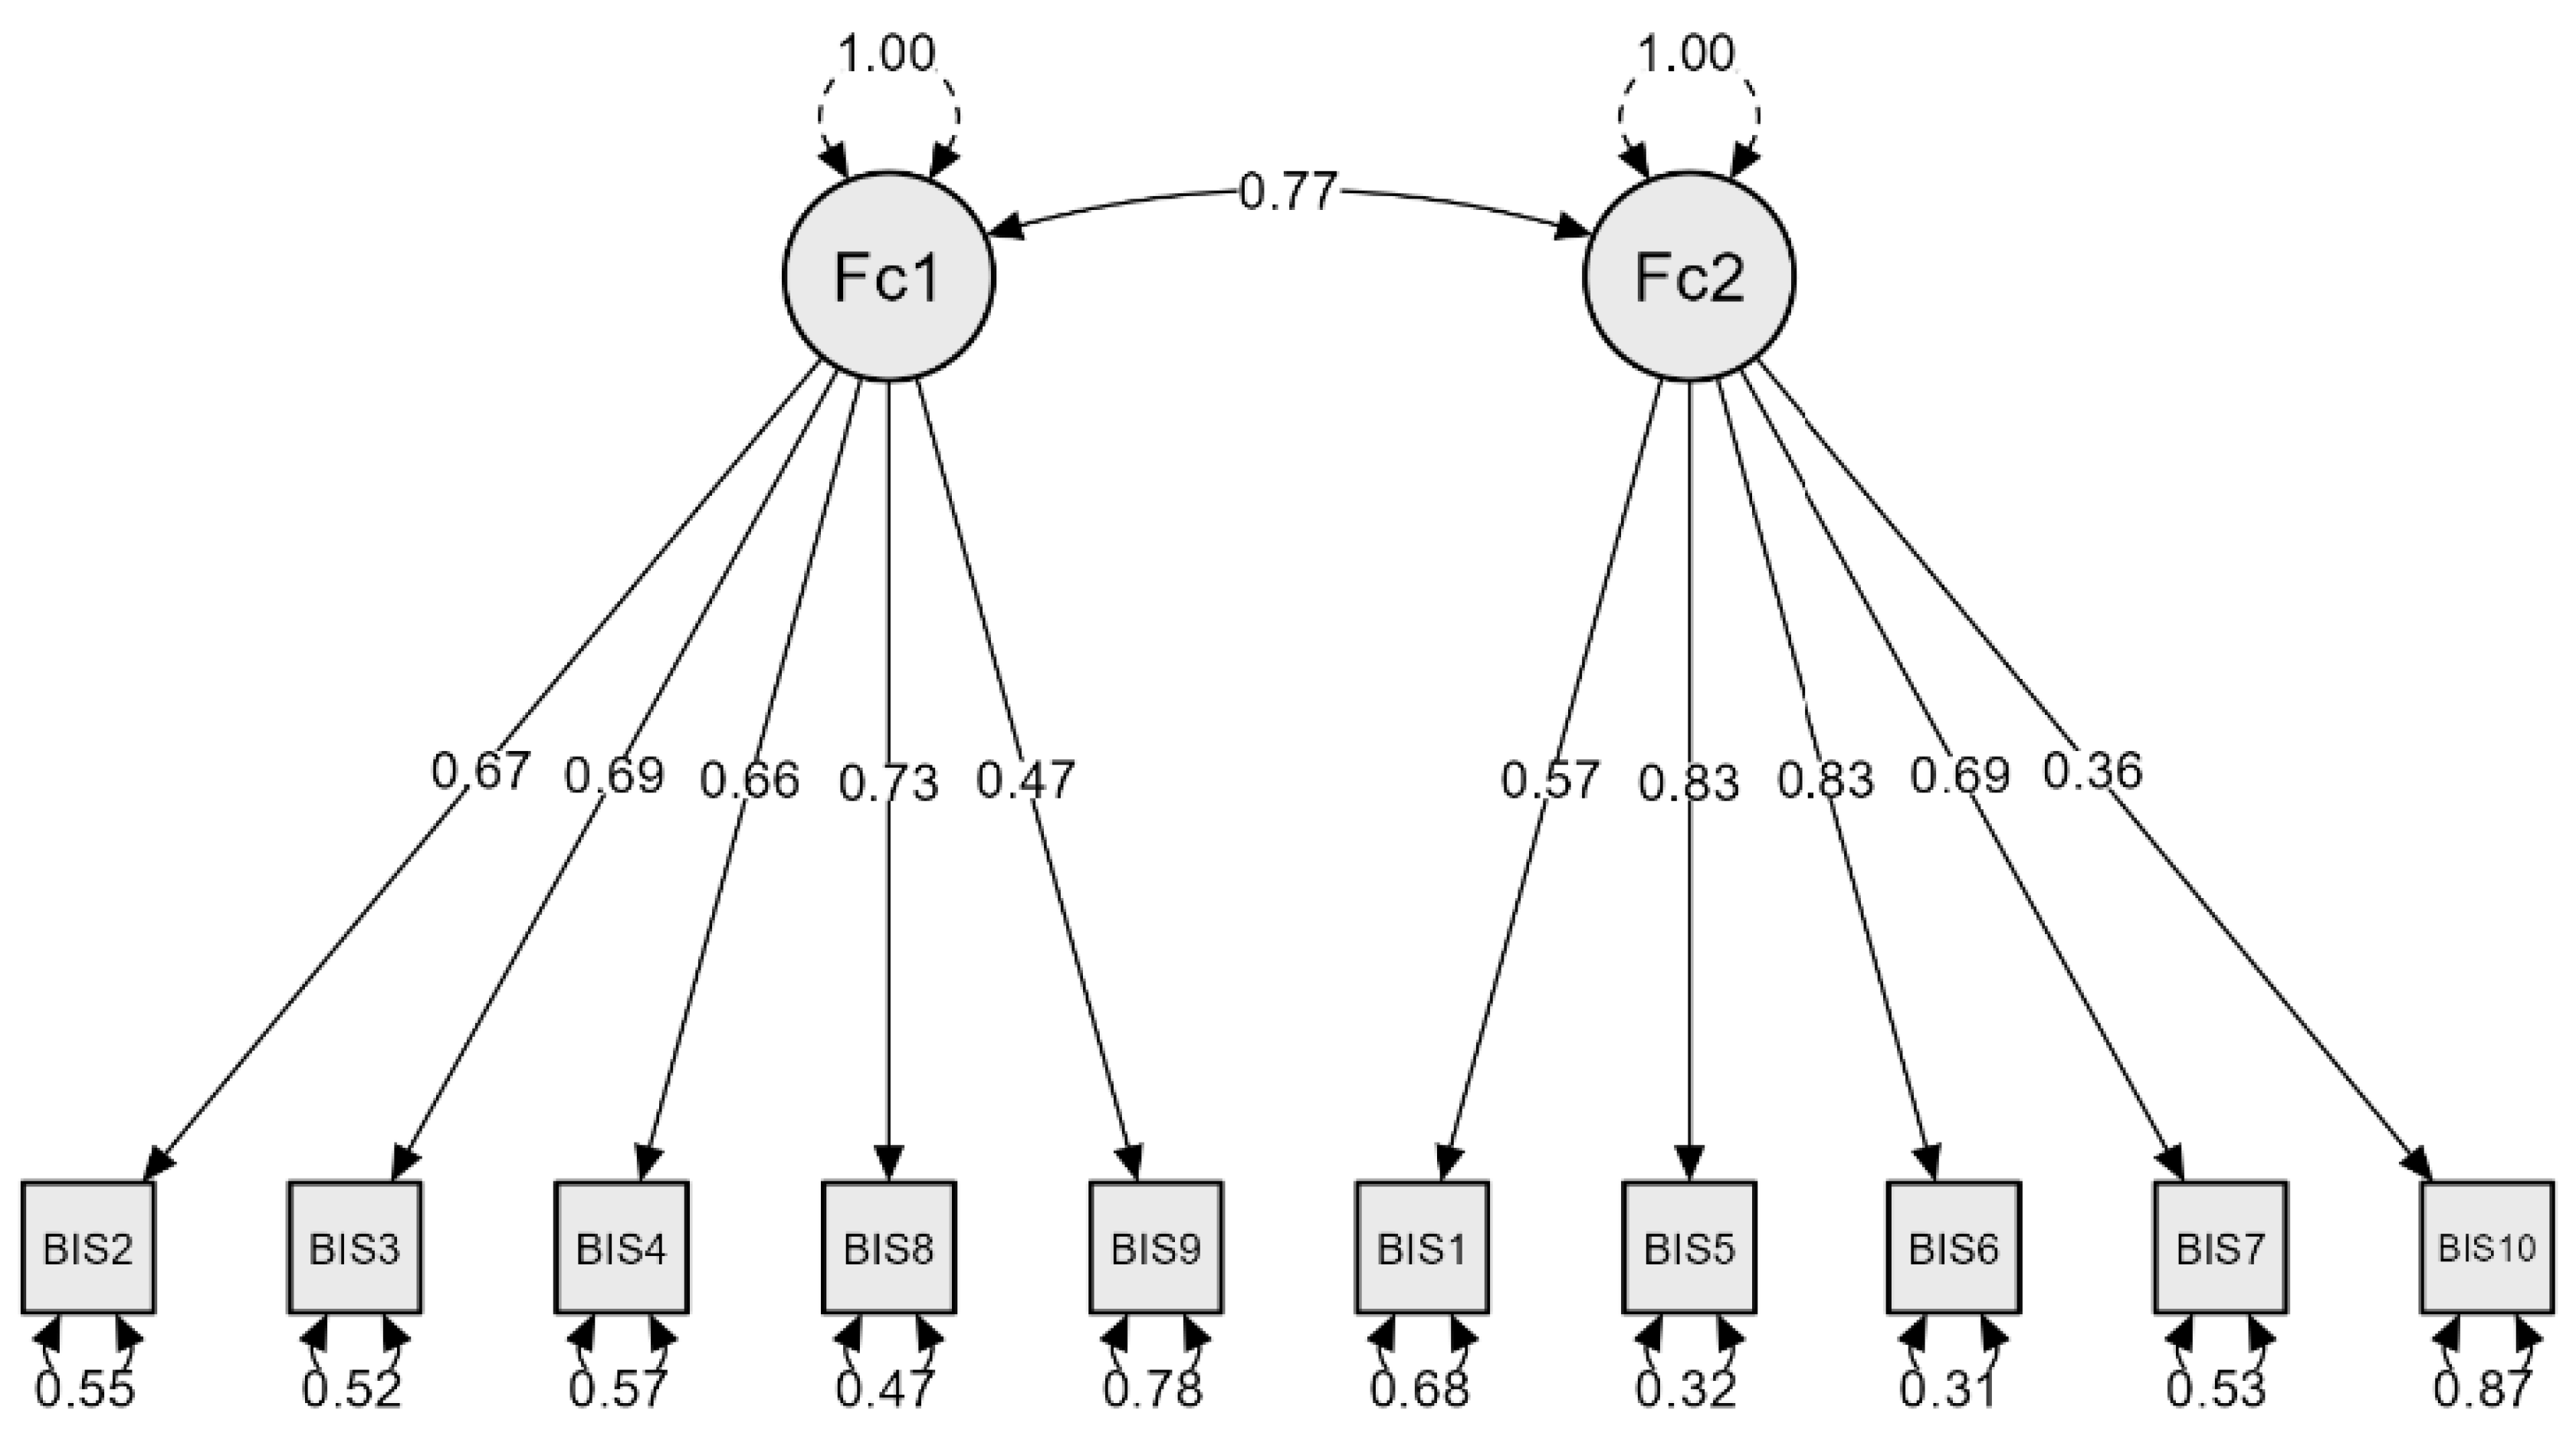

Table 1.
Descriptive statistics of the items in the perceived school wellbeing questionnaire.
| Item | M | SD | Var. | S | K |
|---|---|---|---|---|---|
| 1. When I need help, there is someone willing to support me | 4.71 | 1.35 | 1.843 | -0.968 | 0.218 |
| 2. I feel comfortable talking about my problems with my classmates | 3.69 | 1.62 | 2.649 | -0.190 | -1.073 |
| 3. I feel comfortable talking about my problems with my teachers | 3.22 | 1.62 | 2.644 | 0.158 | -1.102 |
| 4. I can trust most of the people in my class | 2.99 | 1.48 | 2.216 | 0.303 | -0.861 |
| 5. I believe others value me | 4.04 | 1.33 | 1.785 | -0.366 | -0.528 |
| 6. When I have something to say, people listen | 4.19 | 1.32 | 1.759 | -0.513 | -0.351 |
| 7. I feel close to other people | 4.50 | 1.37 | 1.889 | -0.769 | -0.168 |
| 8. I feel that my opinion matters in my school | 3.50 | 1.50 | 2.261 | -0.043 | -0.916 |
| 9. I take part in planning school activities | 3.23 | 1.71 | 2.938 | 0.150 | -1.218 |
| 10. I usually do not feel alone | 2.57 | 1.64 | 2.707 | 0.717 | -0.764 |
Note: M = Mean; SD = Standard Deviation; Var. = Variance; S = Skewness; K = Kurtosis.
Table 2.
Rotated Factor Matrix and Factor Loadings.
| F-1 | F-2 | Uniqueness | ||
|---|---|---|---|---|
| I-3 | 0,930 | 0,353 | ||
| I-4 | 0,598 | 0,588 | ||
| I-2 | 0,583 | 0,556 | ||
| I-8 | 0,558 | 0,490 | ||
| I-9 | 0,509 | 0,768 | ||
| I-6 | 0,723 | 0,315 | ||
| I-5 | 0,704 | 0,317 | ||
| I-10 | 0,566 | 0,786 | ||
| I-7 | 0,545 | 0,531 | ||
| I-1 | 0,447 | 0,675 | ||
| Eigenvalues | 4,390 | 1,340 | - | |
| Explained Variance (%) | 24,60% | 21,59% | 46,20% | |
| Factor Determinacy Index | 0,841 | 0,874 | - | |
| Internal Consitence (reliability) | Cronbach´s α | α = 0,777 | α = 0,783 | α = 0,844 |
Table 3.
Standardised Factor Loadings from the Confirmatory Factor Analysis.
| Factor | Indicator | Estimate | Std. Error | z-value | p | CI - Lower | CI - Upper | Std. Est. |
|---|---|---|---|---|---|---|---|---|
| Factor 1 – Emotional Bond and School Participation | I-2: I feel comfortable talking about my problems with classmates | 1.086 | 0.052 | 21.082 | < 0.001 | 0.985 | 1.187 | 0.667 |
| I-3: I feel comfortable talking about my problems with teachers | 1.124 | 0.051 | 22.097 | < 0.001 | 1.025 | 1.224 | 0.692 | |
| I-4: I can trust most people in my class | 0.979 | 0.047 | 20.910 | < 0.001 | 0.887 | 1.070 | 0.658 | |
| I-8: I feel that my opinion matters in my school | 1.094 | 0.046 | 23.616 | < 0.001 | 1.004 | 1.185 | 0.728 | |
| I-9: I take part in planning school activities | 0.811 | 0.057 | 14.109 | < 0.001 | 0.698 | 0.924 | 0.473 | |
| Factor 2 – Perceived Support and Social Appreciation | I-1: When I need help, there is someone willing to assist me | 0.773 | 0.043 | 17.875 | < 0.001 | 0.689 | 0.858 | 0.570 |
| I-5: I believe that people value me | 1.103 | 0.038 | 29.348 | < 0.001 | 1.029 | 1.177 | 0.826 |
Disclaimer/Publisher’s Note: The statements, opinions and data contained in all publications are solely those of the individual author(s) and contributor(s) and not of MDPI and/or the editor(s). MDPI and/or the editor(s) disclaim responsibility for any injury to people or property resulting from any ideas, methods, instructions or products referred to in the content. |
© 2025 by the authors. Licensee MDPI, Basel, Switzerland. This article is an open access article distributed under the terms and conditions of the Creative Commons Attribution (CC BY) license (http://creativecommons.org/licenses/by/4.0/).
Copyright: This open access article is published under a Creative Commons CC BY 4.0 license, which permit the free download, distribution, and reuse, provided that the author and preprint are cited in any reuse.


