Submitted:
18 June 2025
Posted:
19 June 2025
You are already at the latest version
Abstract
The Drosophilidae fauna of vineyards and forest edges or hedges on the slopes of the Leithagebirge and the Pannonian Plain around Eisenstadt was surveyed. Traps containing an attractant liquid made of wine and fermenting grape juice were used for this purpose.Over the course of two years, 60,024 individuals were captured. The subsequent identification revealed seven genera and 36 species. The species composition differed significantly between vineyard leaves and forest edges. On the slopes, both in the vineyards and at the forest edges, as well as in the hedges of the plain, D. suzukii, a commercially relevant pest of thin-skinned fruits and berries, dominated. In the flatland vineyards, however, D. melanogaster and D. simulans, two closely related species that can be harmful due to the spread of acetic acid bacteria in viticulture, were more prevalent than on the slopes. Particularly in traps from the slope locations, D. subobscura was frequently recorded. Other species were relatively rarer in vineyards than at the forest edges.The statistical analysis revealed that significantly more individuals of D. suzukii were recorded in the slope and forest edge traps than in those from the plain or vineyards. While D. melanogaster and D. simulans also prefer the forest edge, they were more frequent in the plain than on the slope. D. subobscura, which is not relevant for viticulture, was captured more frequently at the forest edge and on the slope, just like D. suzukii. The same applies to D. testacea, though the difference between slope and plain was less pronounced. D. phalerata was only occasionally found in vineyards, with no significant difference between slope and plain. D. immigrans clearly prefers the forest edge over the vineyard leaves and, similar to D. melanogaster and D. simulans, the sample sites in the plain over those on the slope.
Keywords:
Drosophilidae
; Drosophila melanogaster
; Drosophila simulans
; Drosophila suzukii
; Drosophila subobscura
; Drosophila testacea
; Drosophila phalerata
; Drosophila immigrans
Introduction
The fly family Drosophilidae (vinegar flies) is an ecologically very diverse taxon; some species, for example, develop in fungi or live as commensals in beehives and the brood cells of mason bees (Bächli & Burla 1985). Most species are found in moderately moist deciduous forests with abundant undergrowth, as well as in hedgerows, fruit trees, and meadows. Many of these species are ecologically significant because they spread microorganisms that can decompose organic matter, primarily dead plants. Most larvae feed on yeasts and bacteria, with which the female when she lays her eggs inoculates the substrate transporting them on her tarsi and mouthparts. Microorganisms as food can be found not only on fruit but also in compost heaps, rotting plant parts, decaying wood, under tree bark, sap flows, mushroom caps, etc. Therefore, Drosophila larvae can also be found in these locations. The adults also feed on yeasts and other microorganisms, but they also consume sugars.
Some species are commensals of humans, apparently for thousands of years. A well-known passage from the New Testament quotes Jesus Christ as saying to the scribes and Pharisees: "You blind guides! You strain out a gnat but swallow a camel!" (Matthew 23:24). The "gnats" likely refer primarily to species of Drosophila that had to be strained out of wine before consumption. Several species are attracted to alcoholic beverages and fruit juices in late summer and autumn, where they can contaminate and spoil the flavour. This is especially true for the most famous representative of the family, Drosophila melanogaster, which has also gained significance as a model organism. Due to its ease of breeding, short generation time, high offspring count, and a genome consisting of only four chromosomes (which form large "giant chromosomes" in the salivary glands), genetic research was greatly simplified, as recognized by T. H. Morgan. In the years since, this species has also become highly significant in other fields of research, such as neurobiology.
In viticulture, D. melanogaster is harmful due to the spread of acetic acid bacteria, the cause of vinegar rot, as the females of this species seek out injured berries for egg laying. The same applies to the closely related D. simulans, which is often more frequent in vineyards than D. melanogaster. This could be because D. simulans prefers more exposed habitats and is less sensitive to direct sunlight compared to D. melanogaster (David et al. 2004). D. simulans is considered somewhat more thermophilic and becomes rarer in Central Europe towards the north (Bächli & Burla 1985).
Another species relevant to viticulture is the invasive Drosophila suzukii, a species originally from Southeast Asia (the first reports of the fly come from Japan, where it was observed as early as 1916, according to Kanzawa 1936). It was first recorded in Spain and Italy in 2008, almost simultaneously with its first appearance in the U.S. (Hauser, 2011; Cini et al., 2014), and shortly thereafter, in 2011, in Switzerland, Germany, and Austria, where it quickly established itself and is now found in all the federal states that have been subsequently surveyed. Its wide distribution likely occurred through the import of infested fruit. The European and Mediterranean Plant Protection Organization (EPPO) has classified D. suzukii as a pest organism with significant potential for plant damage in European fruit and viticulture.
D. suzukii is a polyphagous, commercially relevant pest of thin-skinned fruits and berries, where larval development occurs. The females of D. suzukii have a strong, serrated ovipositor with which they can slit the skin of healthy, uninjured berries and fruits to lay their eggs beneath the surface. The larvae that develop from these eggs feed on the fruit flesh under the skin and cause extensive fruit decay. In addition, significant secondary damage is caused by other pests, including, as mentioned earlier, other vinegar fly species, as well as fungi and bacteria. The reproductive potential of the fly is considerable. Up to 10-15 generations can occur per year, with each female laying an average of 380 eggs, meaning that under favourable climatic conditions, very large populations can build up in a short time (Walsh et al., 2011).
The extent of the damage naturally depends on the population density of D. suzukii at the time of fruit or berry ripening. Potential antagonists, which, alongside weather conditions, influence this, include not only Wolbachia bacteria (Kaur et al. 2017), but also various species of parasitic wasps (Collatz and Knoll 2017; Green et al. 2000), earwigs, and lacewings (Köppler and Zimmermann 2018), as well as maggots of both D. suzukii and other Drosophila species (Yang 2018; Narasimha et al. 2019), since the larvae of some species are omnivorous and even cannibalistic. Other interactions, such as competition between closely related species, are also possible and may significantly influence population development. Therefore, when examining the factors influencing the individual density of an invasive species, it is advisable to also include related species, in the case of D. suzukii, all Drosophilidae (Tiefenbrunner & Tiefenbrunner 2025).
In addition to cultivated plants, many wild plant species and cultivated ornamental plants serve as food sources. The species, their varieties, and the ripening stage influence the attractiveness to flies, as well as their suitability for oviposition and larval development (Burrack et al., 2013). Tiefenbrunner & Tiefenbrunner (2017) observed a higher abundance of D. suzukii adults at forest edges compared to vineyards. Forests likely play a significant role in overwintering (Pelton et al., 2016); survival in mistletoe berries during winter and spring has already been demonstrated (Briem et al., 2016).
Observations by Saguez et al. (2013) and Van Timmeren and Isaacs (2014) suggest that the dipteran D. suzukii is capable of completing its life cycle on grapevines (wine and table grapes). According to Lee et al. (2016), the likelihood of oviposition increases as the resistance of the fruit skin to the penetration force of the ovipositor decreases and the pH value rises during ripening. Ioriatti et al. (2015) investigated the infestation potential of D. suzukii on grape berries and found that the risk of oviposition during ripening increased with rising sugar content and decreasing values of acidity, skin resistance, and, in agreement with the latter, skin hardness. Skin hardness was identified as a critical component in host selection by D. suzukii among grape varieties. The authors concluded that while grape berries are not an ideal host for D. suzukii development in most cases, the species can pose a serious threat to grape and wine production. Consistent with this finding, Entling et al. (2018) identified berry skin resistance as a key factor influencing oviposition preferences between cultivars.
The niche integration of a neozoon in a new habitat—and thereby its potential future damage—is often significantly influenced by closely related, established species. Therefore, in the present study, which covers a small area around Eisenstadt (Burgenland, Austria), all vinegar flies (Drosophilidae) in vineyards and their surroundings were examined.
In previous projects by one of the authors, Drosophila traps with an attractant liquid (Tiefenbrunner & Tiefenbrunner 2017, Tiefenbrunner & Riedle-Bauer 2021, Tiefenbrunner et al. 2024) were deployed on the southwestern slopes of the Leithagebirge near Eisenstadt in vineyards, at forest edges, near composting facilities, glass containers, and cherry trees. These catches were used to infer the population dynamics of various Drosophilidae species (in the study area, D. suzukii was first recorded in 2012). Now, sites in the surrounding Pannonian Plain were also included, allowing for a comparison between hillside and lowland.
The collections were already conducted in 2018 and 2019, but the evaluation of the results was delayed by the pandemic.
Method
- Trap Type and Capture Medium
To capture Drosophilidae, 250 ml plastic bottles (originally containing lemonade) were used. Approximately 30 holes, each around 2 mm in diameter, were drilled in the upper third of the bottles. These entry holes were kept small to minimize bycatch (Tiefenbrunner & Tiefenbrunner 2017; the referenced work also provides an image of the trap). The bottles contained approximately 50 ml of trapping liquid to attract Drosophilid individuals.
One week before the start of the experiment, grape juice (‘Weißer Burgunder’; 16°KMW grape must weight; pH 3.35) was used to prepare the standard attractant liquid by fermenting it at room temperature with a yeast mixture (Saccharomyces cerevisiae and S. bayanus). After the phase of most intense fermentation, equal parts of grape juice and wine were added again until the volume of the attractant liquid was double the original amount.
- Sampling Dates
Sampling in 2018 was conducted from the first calendar week (to potentially capture winter flights) until the 47th CW. In 2019, sampling began in the tenth CW (early March) and continued until the 46th CW (November 11–17). The traps were replaced weekly. Sampling planned for 2020 could not be conducted continuously due to pandemic-related lockdowns and had to be ultimately abandoned.
- Sampling Locations
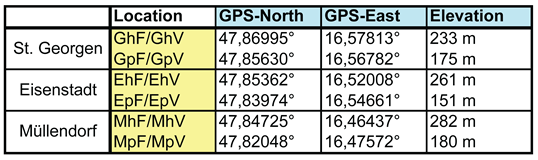
All twelve trap sites were situated near the western Leithagebirge (‘Leitha Mountains’, whereby ‘Leitha’ is the name of a nearby river. In fact, it is a range of hills with a maximum height of 484 metres) in the Eisenstadt district, from east to west: near the incorporated village of St. Georgen (G), directly at Eisenstadt (E), and near Müllendorf or Großhöflein (M). Their exact locations can be found in Table 1 and Figure 1.
Per locality or village (Table 1), four traps were deployed: two in hillside locations (h) at elevations between 282 m and 233 m above sea level, and two in the Pannonian plain (p) at elevations between 180 m and 151 m above sea level, situated some distance from the edge of the Leithagebirge. One trap was placed between the third and fourth vine-row posts in the foliage of a vineyard (V), and the other in its immediate vicinity, in a forest edge or hedgerow (F).
In the hillside locations (slopes), this was either at the edge of a low forest (St. Georgen, Müllendorf) or a tree-lined hedgerow near the Eisenstadt city park. In the plain, small wooded areas adjacent to vineyards were used as sampling sites.
- Determination of the Drosophilidae
The identification was primarily based on Bächli & Burla (1985), supplemented by Markow & O’Grady (2006). Determination was conducted using a stereomicroscope (Stemi 2000-C; Zeiss, Oberkochen, Germany). Apart from D. melanogaster and D. simulans, whose females cannot be distinguished morphologically, identification was carried out to the species level. For species of which only one individual was caught, identification in the Genus Drosophila may be uncertain in some cases. The sex of the individuals was also recorded.
- Statistical Analysis
To investigate the significance of the influencing factors "habitat" with the variants "forest edge" ("hedgerow") and "vineyard" ("vine foliage"), and "exposure," with the alternatives "hillside" and "plain," on the species abundance in the traps, tests for both paired samples (sign rank test) and independent samples (Wilcoxon-Mann-Whitney U-test) were applied. Since the samples were uniformly non-normally distributed, only this nonparametric methods were used.
For the factor "habitat" the two traps—one in the canopy of the forest edge and the other in the vineyard row foliage—are spatially very close, making their pairing obvious and indisputable. In the case of the factor "exposure" (hillside/plain), the traps are spatially separated, and their pairing is justified only by the proximity of the traps to the same location, the identical sampling time, and the comparison of either two vineyard traps or two forest-edge traps. This pairing is therefore less straightforward, which is why the test for independent samples was also performed, although it is inherently less meaningful.
The sample size varies from species to species, as only dates on which at least one individual of the species was caught were included.
The question of whether the factor "location" or “village” (St. Georgen, Eisenstadt, Müllendorf) had an influence on the number of individuals per trap was tested using the Kruskal-Wallis test, another nonparametric method. Statistical software Statgraphics Centurion Version XV (Statgraphics Technologies, Inc., Virginia, USA) was used for the analysis.
The similarity of species spectra captured by individual traps was analyzed using a multivariate method, principal component analysis (PCA). This analysis was conducted with the statistical software ViDaX from LMS-Data (Trofaiach, Austria).
Results and Discussion
- Genus and Species Spectrum; Overview
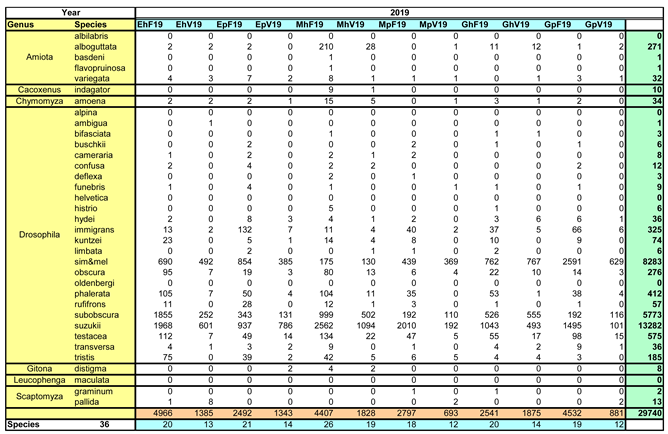
Over the two study years, a total of 60,024 Drosophilidae were captured (30,284 in 2018, and slightly fewer in the following year with 29,740). These specimens were, with a pandemic-related delay, assigned to seven genera and 36 species in subsequent years. The species spectrum and their distribution across the sampling locations are summarized in Table 2a for 2018 and Table 2b for 2019.
The genera (in alphabetical order) are: Amiota, Cacoxenus, Chymomyza, Drosophila, Gitona, Leucophenga, and Scaptomyza. Three genera (Cacoxenus, Chymomyza, and Gitona) are represented by only one species each, whereas 24 species were identified within the genus Drosophila.
The abundances varied significantly: more than 92% of individuals belonged to just four species, all within the genus Drosophila. Three of these species are relevant to viticulture: D. suzukii (a total of 27,493 individuals), D. melanogaster and D. simulans (together 15,978). However, the also very frequent D. subobscura (11,956 specimens) is not considered relevant to viticulture.
The number of species and total captures varied greatly across sampling locations. The most species-rich locations were not always the most individual-rich. For instance, the highest total number of individuals was found in EoH (Eisenstadt-Hang-Hecke) in both years, whereas the species count was highest at MhF (Müllendorf-hillside-forest edge; 29 species in 2018 and 26 in 2019).
Hedgerow (forest edge) locations had an average of 21 species, whereas vineyard sites hosted only 15 species on mean. The difference between hillside (19 species on average) and plain (17 species on mean) locations was smaller.

Table 2a.
Species spectrum and assignment to locations for the year 2018.
 |
Table 2b.
Species spectrum and assignment to locations for the year 2019.
 |
Species Composition in Relation to Exposure and Habitat
To examine the influence of the factors "exposure" (hillside/plain) and "habitat" (forest edge/vineyard) on species composition, the locations were grouped into four categories: hillside/hedgerow, hillside/vineyard, plain/hedgerow, and plain/vineyard. Each group included three traps, located near the three villages, and a sample number corresponding to the sampling dates (2018 and 2019). The results are shown in Figure 2.
The majority of individuals, 23,851, were caught in traps located at the forest edge or windbreaks on slopes, especially at the EhF site, where the trap was placed at the windbreak and not directly at the forest edge as in the other two sites in this group. However, the number of species at this location was rather low, especially in 2018. The dominant species (more than half of all individuals) was D. suzukii, while D. subobscura was identified as the second most frequent species with fewer than half as many individuals (Figure 2, top left). The third most frequent, the complex of the closely related D. simulans/D. melanogaster, was again less than half as frequent as D. subobscura. Figure 2 examines the ten most frequent species of the group (or eleven, as the species complex is treated as a unit; since not the same species are the most frequent in all groups and two species cannot be reliably distinguished, a total of 14 species must be considered). In the slope/forest edge group, the less dominant species are overall similarly frequent as D. simulans/D. melanogaster. These include D. testacea, D. phalerata, D. tristis, D. obscura, Amiota alboguttata, D. immigrans, and D. kuntzei.
In the vineyards of the Leithagebirge slopes, fewer than half as many individuals were caught as in the forest edge traps on the slope (10,045). The most common species is again D. suzukii, but its dominance is less pronounced than at the forest edge. D. subobscura and the species complex D. simulans/D. melanogaster are nearly equally frequent, and the remaining species are relatively (and also absolutely) less significant than at the forest edge; they occupy only a very small sector in the species spectrum, as shown in Figure 2, top right. Among the ten most common species is Scaptomyza pallida, but not D. kuntzei. Otherwise, the ten most frequent species in the hedge and vineyard locations on the slope are the same.
At the hedge (forest edge) sites in the plain, a slightly lower total number of individuals was found (19,701) than at those on the slope (Figure 2, bottom left). The dominant species is again D. suzukii, now followed by D. simulans/D. melanogaster. The difference between the frequencies of the two species or the complex is less pronounced than on the slope. D. subobscura, however, is caught much less frequently here. The other species form a relatively broad sector, with D. testacea, D. immigrans, and D. phalerata as still quite frequent species. D. rufifrons, equally frequent as D. kuntzei, was not among the ten most frequent species in the other two groups (the ones on the slope).
In the vineyards of the Pannonian plain south of the Leithagebirge, the species complex D. simulans/D. melanogaster dominated. D. suzukii was only the second most frequent species here, followed by D. subobscura, which was relatively more common here than in the hedges of the plain. However, it should be noted that only 6,427 individuals were caught in the vineyards of the plain, less than a third compared to the hedge traps. For the remaining species, as in the slope vineyards, only a small sector remained (Figure 2, bottom right).
Tiefenbrunner & Tiefenbrunner (2017) report a significant dominance of D. subobscura in the slope vineyards in 2015 (the plain was not sampled). According to Tiefenbrunner & Riedle-Bauer (2021), however, D. suzukii was the most common species in the vineyards of the Leithagebirge slope in the following year, and in 2017, D. simulans/D. melanogaster, D. suzukii, and D. subobscura were almost equally frequent. During the study period 2018/2019, D. suzukii dominated the slope vine-foliage traps, and thus 2018/2019 most closely resembles 2016. At the forest edge, with the exception of 2015, D. suzukii dominated as in the present study. In 2015, D. subobscura was the most frequent species at the forest edge. It is possible that D. suzukii was not as well-established at that time, since the species had only recently reached the area around Eisenstadt.
A multivariate statistical method, principal component analysis (PCA), was used to analyse the similarity of the sites with regard to the entire species spectrum, i.e. taking into account all 36 species. The result is shown in Figure 3, separated for the two study years (i.e., the identification label includes both the location and the study year).
The first principal component separates the location MhF (Müllendorf/slope/forest edge; MhF18 and MhF19) from all others. Some species, such as A. alboguttata, D. obscura, D. phalerata, D. rufifrons, D. testacea, and D. tristis, were particularly frequently caught here. PC2, on the other hand, separates the locations into three groups: MhF18 (MhF in 2018), all sampling locations in the vineyard, and a third group consisting of all trap locations at the forest edge except for MhF18. The vineyards are represented particularly uniformly. Exposure (slope vs. plain) does not have a clear effect on the species spectrum, but can of course influence individual species, which will be examined using univariate statistics for the most common species. To this purpose, a frequency comparison in advance for the twenty most common species (with a minimum of a total of twenty individuals caught) is presented (Figure 4).
Accordingly, D. suzukii was the most common overall, followed by the species complex D. simulans & D. melanogaster, then D. subobscura, D. testacea, D. phalerata, and D. immigrans. The results for these species will be presented below.
- Discussion of the most common species
With 27,493 individuals, whereby significantly more females were captured (15,921 ♀ versus 11,572 ♂), D. suzukii is the overall dominant species. The population development of this species throughout the year is shown in Figure 5.
D. suzukii is one of the Drosophilidae species that, under suitable weather conditions, can also fly in winter and can still be caught (Kaҫar et al. 2016, Shearer et al. 2016, Stephens et al. 2015). In the first calendar week (CW 1) of 2018, 103 ♀ and 51 ♂ were collected, whereas in the fourth CW only 18 ♀ and seven ♂ were caught. The species is therefore present in January, and some individuals are also caught in the following weeks and months. Regular catches, however, begin only in the 25th CW (mid-June). After that, the number of catches increases more or less rapidly depending on the weather (in 2018 more strongly than in 2019). A very high number of individuals is reached from the 36th CW to the 40th CW (early September to early October) during the fruit ripening period of, for example, grapes. Afterward, the number of catches decreases, but not necessarily continuously. For example, in 2018, there was an autumn peak around the 45th CW, and in 2019, it occurred in the 46th CW (both early to mid-November). In 2018, the summer maximum was reached about two weeks earlier than in 2019. In 2018, almost twice as many ♀ were caught as ♂ in the 29th CW, while in 2019, more males than females were recorded at the same time (end of September), which likely reflects differences between the sexes in activity rather than frequency. The cause of this difference is unknown to the authors.
To examine the influence of habitat (forest edge versus vineyard) of the trap and exposure on the catch numbers, the samples of all three villages and all dates on which at least one specimen of the species was detected were considered. The statistical analysis was carried out as described in the methods section, using only non-parametric test procedures, as the samples generally did not originate from a normally distributed population. To verify this claim, standardized skewness and standardized kurtosis were used, which in all cases deviated significantly from the normal distribution.
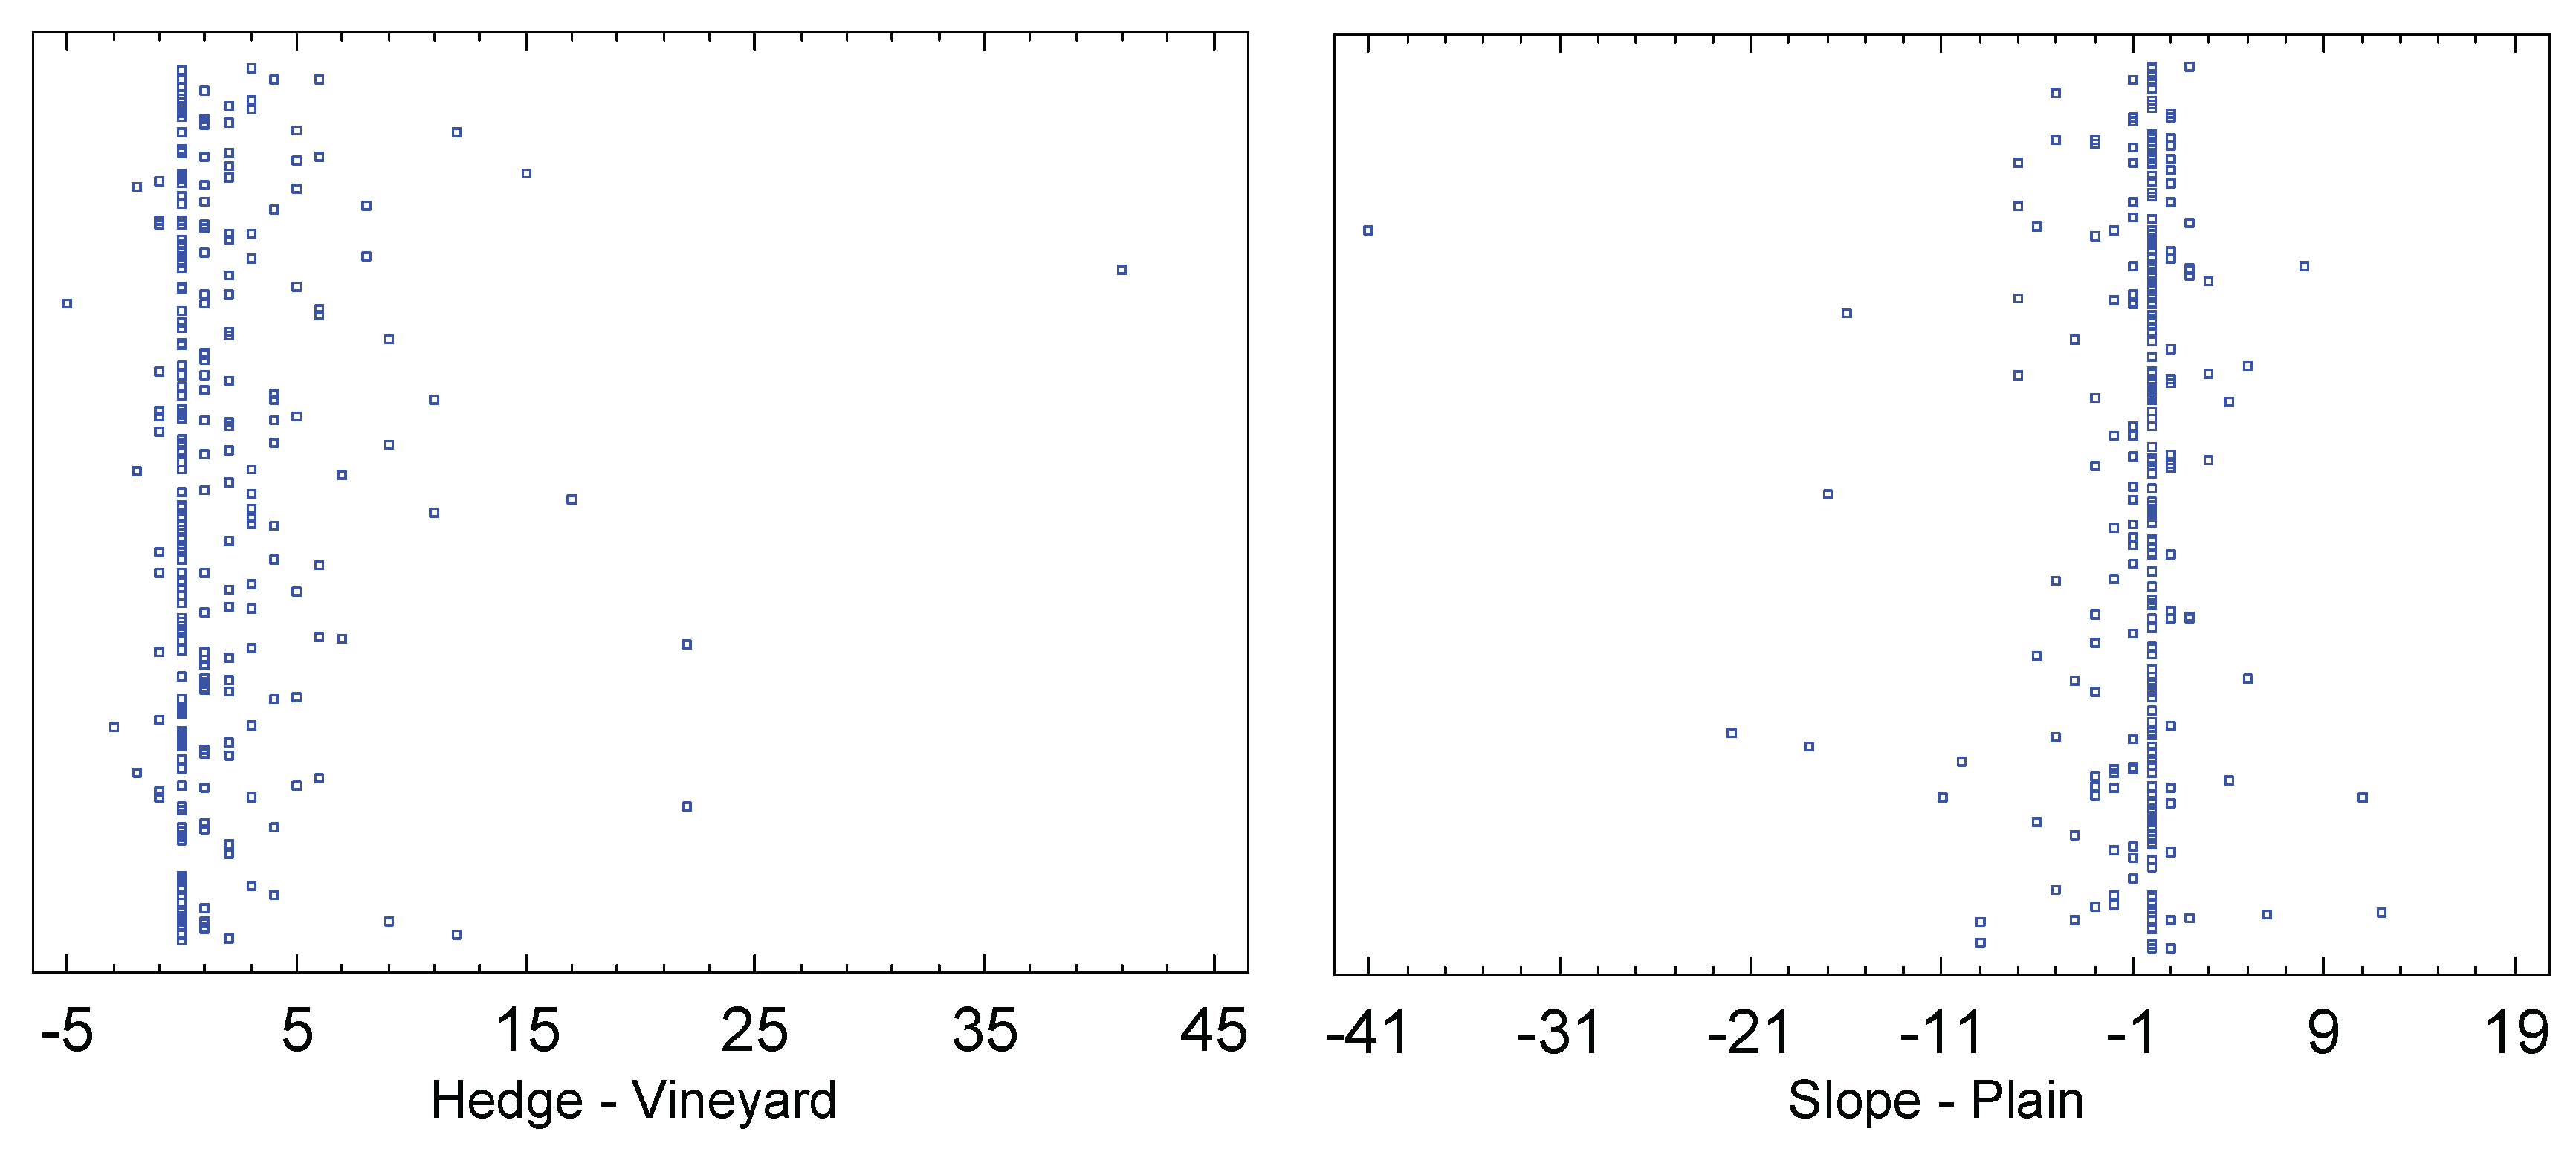
Whether the traps were applied at the forest edge or at the hedge respectively, or in the foliage of grapevines, has a significant impact on the catch numbers. The sign rank test for paired samples yields p=0.0 as the significance level for the null hypothesis that the median catch numbers of hedge minus vineyard equals zero. The sample size was 228 pairs of samples (Figure 6), and the deviation from the null hypothesis is also clearly seen in the scatter plot. On average, 93 individuals were caught per trap per week at the forest edge, whereas 27 were caught in the vineyard (only those dates where the species was actually caught are considered here). Accordingly, the Wilcoxon-Mann-Whitney test for median comparison for unpaired samples also yields p=0.0. Thus there is a significant difference between the medians of the two samples "forest edge" and "vineyard" with respect to significance levels of 0.05 and 0.01. Hence, significantly more individuals were found in the forest edge traps.
Although it can be seen in Figure 6 that the result regarding exposure is less clear than with respect to habitat, the difference is still notable: On the slope, an average of 73 individuals per sample are found, while in the plain only 47. The W-test for median comparison for unpaired samples yields p=0.00003, so the null hypothesis, which states that the medians are equal, must of course be rejected for a significance level of 0.05. The result is even more pronounced for the sign rank test for paired samples (p=0.0). Therefore, D. suzukii prefers the Leithagebirge slope over the plain.
Additionally, a Kruskal-Wallis test was used to examine if there are frequency differences related to the village. In the east, near St. Georgen, significantly fewer individuals were caught in the traps (sample size: 152 per location) than in the areas around Eisenstadt or Müllendorf (42 versus 70 and 67 as averages, respectively).
The next most common species are the complex D. simulans & D. melanogaster (15,978 individuals). The females of these two species cannot be reliably separated morphologically or eidonomically, although only the D. melanogaster individuals (♂ and ♀) display a specific dorsal marking (on the scutum, a part of the mesonotum), the “crown” (Figure 7). However, this is only clearly visible in the autumn.
7,697 female individuals of both species were caught in the study years, while 3,170 D. simulans males and 5,111 D. melanogaster males were captured. Thus, significantly more males were attracted to the traps, and D. melanogaster is likely to be more common than D. simulans. A representation of the population development throughout the year is shown in Figure 8.
The winter activity of the adults of these two species is significantly lower than that of D. suzukii, but one individual was caught in January, and a few more in March. Starting from week 25 (2018) or week 26 (2019), that is, after mid-June, the population begins to build up. However, for a long time, only relatively few individuals are present, and it is not until week 36 (early September) that the numbers significantly increase. The peak is reached later than for D. suzukii, depending on the year, between week 41 and week 45 (early October to early November). Figure 8 shows that the populations of both species develop synchronously, although this can only be stated with certainty for the males. Significantly more males than females were caught only in 2019 around week 43 (late October).
In this in Europe sympatric species complex, the males were analyzed separately by species to investigate how the main influencing factors affect them, while the females were necessarily considered together. On average, 10.4 male individuals of D. simulans were found in the forest edge traps, and 5.6 in the vineyards (sample size: 198). The difference is significant (p=0.0 for the sign rank test for paired samples and p=0.004 for the W-test for independent samples).
In contrast to D. simulans, D. melanogaster shows exceptionally high numbers of individuals (Figure 9), but only in the forest edge and hedge traps. With a sample size of 270, five samples contain more than 150 individuals, and one as many as 454 specimens. On average, 12.4 individuals were caught in the forest edge traps, while only 6.4 individuals were caught in the vineyard leaf wall ones. The difference is also significant for this species (p=0.00007 for the sign rank test for paired samples and p=0.01 for the W-test for independent samples). Thus males of both species are more frequently caught in hedge and forest edge traps.
For the investigation of the habitat effect on the females, a sample size of 282 was available. On average, 16.9 specimens were found in the forest edge traps, compared to 10.3 in the vineyard foliage traps. The difference is highly significant (sign rank test: p=0.0; W-test: p=0.009). Exceptionally high numbers of individuals can only be observed in the hedge or forest edge: in two cases, more than 200 specimens were caught. In conclusion, both species prefer the forest edge over the vineyard foliage.
The effect of exposure on both species is almost as pronounced as the habitat effect. On average, 5.8 D. simulans males were caught in the slope traps, and significantly more, 10.2, in the plain ones. The trend is opposite to that of D. suzukii, which was found more often in the hillside traps. The difference is significant (sign rank test: p=0.00001; W-test: p=0.0002). For D. melanogaster, the difference seems to be even greater – 5.2 individuals in the slope versus an average of 13.7 in the plain – but there are some samples with extremely high numbers, which affects the visibility of the difference and partly impacts the statistics.
The Wilcoxon signed-rank test for paired samples calculates p=0.0, but the W-test for independent samples yields a p-value of 0.003, which is relatively high compared to the one for D. simulans.
Even for the females of the species complex, the impact of exposure on the capture numbers is very pronounced. On average, ten individuals per trap in the slope sites contrast with 17.3 in the flat sites. The difference is highly significant according to the signed-rank test (p=0.0001), but not according to the W-test (p=0.12). However, the test for paired samples has much more statistical power here, so we will follow the signed-rank test in the conclusion. Therefore, the species complex clearly prefers the flat sites, and this tendency is likely why it dominates the vineyards in the plain (Figure 2), although it prefers hedgerows over the vineyard.
The site (village) comparison (132 samples with more than zero specimen for D. simulans ♂, 180 for D. melanogaster ♂, and 188 for females of both species) shows a significant difference for males (Kruskal-Wallis test p=0.0005 for D. simulans and p=0.007 for D. melanogaster), but not for females (Kruskal-Wallis test p=0.096). D. simulans ♂ are caught less frequently in Müllendorf (5.3 vs. more than 9), while D. melanogaster ♂ are particularly abundant in the traps at St. Georgen (18.4 vs. 6.2 in Eisenstadt and 3.8 in Müllendorf). Thus, there is an east-west gradient. This also holds for the females of the complex, but not to a statistically significant extent.
In contrast to the previously discussed species, D. subobscura is not a typical autum species and has a very dark habitus, which enables rapid warming under direct sunlight. A total of 11,956 individuals were caught, including 6,534 ♀ and 5,432 ♂. Females are thus more common in the habitats or are more easily attracted by the trapping fluid. As shown in Figure 10, the species is frequently encountered throughout the year, with abrupt peaks suggesting that many more individuals are likely present in the habitats, but they are generally harder to attract to the traps compared to the species discussed earlier.
Already in the first week of 2018, a total of 314 ♀ and 290 ♂ were caught, marking the highest catch number for the year and providing evidence of a remarkable population density and activity for the season. From week 17 to week 22 (end of April to end of May), many individuals were also caught. However, from early July to the end of August (week 27 to week 35), a low catch was observed in 2018. In contrast, in 2019, there was a peak in week 14 (early April), which only involved the males, and a maximum was reached in week 26 (end of June) for both sexes, with females being caught much more frequently. This maximum exceeded anything observed in 2018. A noticeable summer minimum was not recorded in 2019.
The number of individuals per sample varied greatly for this species, ranging from zero to 1,007 individuals in the hedge and up to 137 in the vineyard foliage. The difference between the forest edge and vineyard was generally very large. The sign rank test returned a p-value of 0.0 (sample size: 438), and the W-test returned a p-value of 0.000003. On average, a forest edge sample contained 18.5 individuals, while a vineyard sample contained only 8.8. It can be inferred that the hedge or forest edge is the preferred habitat.
Exposition also has an extremely large impact on the frequency of this Drosophila species in the traps. On average, 20.4 individuals were caught in slope traps (maximum: 1,007), but only 6.9 (about one-third) in the traps on the plain (maximum: 90). The difference is statistically highly significant, with both test procedures (whether considering the samples as paired or independent) returning p=0.0.
There is no significant difference between the locations (Kruskal-Wallis test p=0.3), with average frequencies ranging from 12.75 individuals in St. Georgen to 15.3 in Eisenstadt.
Less than one-tenth of the individuals of the previously discussed species were captured from D. testacea (1,074), a species that is highly diverse in terms of body color and pattern. 726 ♀ compared to a catch number of 348 ♂ were recorded. Females are therefore captured significantly more often. The species was not detected in winter, but it became somewhat regular from calendar week 12 (mid-March). It is more frequently caught from CW 22 (end of May) on. The population reaches its maximum in CW 26 (2019) or calendar week 30 (2018), i.e., from the end of June to the end of July. After CW 36 (early September), its capture frequency declines again, but it remains detectable until CW 47 (mid-November). No further data is available, as sampling was discontinued after this point.
On average, 2.8 individuals were found in forest edge traps (maximum: 51), and 0.37 in vineyard foliage ones (maximum: 13). A total of 336 samples were available for analysis. The difference in catch numbers as a result of the habitat is highly significant. Both tests return p=0.0. This species prefers the forest or its edge.
The effect of exposure on the catch numbers is noticeable in D. testacea, but not very large. On average, 1.9 individuals were caught in slope traps (maximum: 51), while only 1.3 were caught in the plain traps (maximum: 18). The difference is significant according to the sign rank test (p=0.02), but not according to the W-test (p=0.13), which uses less information and is less informative in this case.
No significant difference was found for the sites (Kruskal-Wallis test p=0.3).
806 individuals of D. phalerata were found over two years, with 428 ♀ and 378 ♂. Females are slightly more frequent, not necessarily in the habitats, but in the traps. The species has a distinctive pattern on the abdomen and can therefore be confused with only a few other species based on this feature alone. Although one specimen was caught in week 1 of 2018, it is not a winter species. It wasn’t until week 14 (early April) that individuals were regularly detected in the traps. In both years, the highest catches occurred in CW 26 (end of June). The catch numbers remained high until calendar week 31 (end of July), but in late summer and autumn, they often fell below ten specimens per sample. However, a few individuals were still caught until the end of the study in CW 47 (mid-November).
D. phalerata is very rarely caught in vineyard traps: While on the forest edge or in the hedges, an average of 2.3 individuals per sample was recorded, in the vineyard foliage traps it was only 0.17 (sample size: 324). The sign rank test for paired samples returns p=0.0, as does the W-test for independent samples. The difference is also evident in the maximum catches. Up to 70 individuals were caught in forest edge samples, while in vineyard samples, a maximum of five specimens was caught (Figure 11).
In contrast to the clear difference regarding habitat, no significant difference between the two exposures "slope" and "plain" was found at the 95% confidence level. On the slope, an average of 1.6 (maximum 70), and on the plain, 0.9 (maximum 22) individuals of this species were caught per sample. The sign rank test returns p=0.06, and the W-test p=0.13. There may still be some influence of exposure on the species, but it is minor, and the catch numbers are naturally much lower compared to, for example, D. suzukii.
According to the Kruskal-Wallis test, the trap site has no significant influence on the catch numbers for this species (p=0.79).
A total of 585 D. immigrans individuals were collected, with 311 ♀ and 274 ♂. As with most species, the female catches predominate. The females have a prominent ovipositor, which can be confused with that of D. suzukii females and therefore, there is a possibility of misidentification. No individuals of this species were caught in winter; detection began only from the 15th CW (early to mid-April). Two population peaks were observed throughout the year, the first appearing abruptly in both years in the 26th CW (end of June). The catch numbers remained relatively high until the 30th CW (end of July). Afterward, it took until the 39th CW (2018; end of September) or the 40th CW (2019; early October) for the catch numbers to rise again. They remained high until the end of the study in mid-November. In both years, the autumn peak was more pronounced than the early summer peak (2018: 35 vs. 29; 2019: 80 vs. 16 individuals).
This species clearly prefers the forest edge or hedge over the vine foliage. On average, 1.9 individuals (maximum: 41) were caught per sample in forest edge traps, while only 0.2 individuals (maximum: 7) were caught in vineyard ones. The sign-rank test results in a p-value of 0.0, as does the W-test (sample size: 276).
The difference between slope and plain is much more pronounced than for the previous species, with D. immigrans being the third species after D. simulans and D. melanogaster that prefers the plain. There, an average of 1.5 individuals (maximum: 41) per trap were found, while only 0.7 (maximum: 12) were found on the Leithagebirge slope. Both test methods used here reject the null hypothesis at the 95% confidence level (sign-rank test p=0.0002; Wilcoxon-Mann-Whitney-W-test: p=0.01).
Figure 12.
Scatterplots showing the influence of habitat and exposure on D. immigrans.
The affiliation to the sites (villages) has no significant influence on the catch numbers (Kruskal-Wallis test p = 0.76).
References
- Bächli, G., Burla, H. 1985: Insecta Helvetica, Diptera, Drosophildae, Schweizerische Entomologische Gesellschaft.
- Burrack, H. J., Fernandez, E.G., Spivey, T., Kraus, D.A. 2013: Variation in selection and utilization of host crops in the field and laboratory by Drosophila suzukii Matsumara (Diptera: Drosophilidae), an invasive frugivore. Pest Manag. Sci. 69, 1173–1180.
- Briem, F., Eben, A., Gross, J., and Vogt, H. 2016: An invader supported by a parasite: Mistletoe berries as a host for food and reproduction of Spotted Wing Drosophila in early spring. J Pest Sci 89, 749-759. [CrossRef]
- Cini, A., Ioriatti, C., Anfora, G. 2014: A review of the invasion of Drosophila suzukii in Europe and a draft research agenda for integrated pest management. Bull. Insectol. 65, 149-160.
- Collatz, J., Knoll, V. 2017: Einheimische Schlupfwespen als Gegenspieler der Kirschessigfliege, Schweizer Zeitschrift für Obst- und Weinbau, 15, 4-6.
- David, J.R., Allemand, R., Capy, P., Chakir, M., Gibert, P.,Petavy, G., Moreteau, B. 2004: Comparative life histories and ecophysiology of Drosophila melanogaster and D. simulans. Genetica 120, 151–163. [CrossRef]
- Entling, W.; Anslinger, S.; Jarausch, B.; Michl, G. and Hoffmann, C. 2018: Berry skin resistance explains oviposition preferences of Drosophila suzukii at the level of grape cultivars and single berries. Journal of Pest Science 92, 477-484. [CrossRef]
- Green, D.M., Kraaijeveld, A.R., Godfray, H.C.J. 2000: Evolutionary interactions between Drosophila melanogaster and its parasitoid Asobara tabida, Heredity 85, 450-458.
- Hauser, M. 2011: A historic account of the invasion of Drosophila suzukii (Matsumura) (Diptera: Drosophilidae) in the continental United States, with remarks on their identification. Pest Manag. Sci. 67, 1352–1357.
- Ioriatti, C., Guzzon, R., Anfora, G., Ghidoni, F., Mazzoni, V., Villegas, T.R., Dalton, D.T., Walton, V.M. 2018: Drosophila suzukii (Diptera: Drosophilidae) contributes to the Development of Sour Rot in Grape. J. Econ. Entomol. 111(1), 283–292. [CrossRef]
- Kaҫar, G., Wang, X., Stewart, T.J., Daane, K.M. 2016: Overwintering Survival of Drosophila suzukii (Diptera: Drosophilidae) and the Effect of Food on Adult Survival in California’s San Joaquin Valley, Environ. Entomol. 1-9. [CrossRef]
- Kanzawa, T. 1936: Studies on Drosophila suzukii Mats. J. Plant. Prot. 23, 66-191.
- Kaur, R., Siozios, S., Miller, W.J., Rota-Stabelli, O. 2017: Insertion sequenze polymorphism and genomic rearrangements uncover hidden Wolbachia diversity in Drosophila suzukii and D. subpulchrella, Scientific reports 7: 14815. [CrossRef]
- Köppler, K., Zimmermann, O. 2018: Natürliche Gegenspieler der Kirschessigfliege im Obst-und Weinbau, Landwirtschaftliches Technologiezentrum Augustenberg, Projekt „InvaProtect“, 1-8.
- Lee, J.C., Dalton, D.T., Swoboda-Bhattarai, K.A., Bruck, D.J., Burrack, H.J., Strik, B.C., Woltz, J.M., Walton, V.M. 2016: Characterization and manipulation of fruit susceptibility to Drosophila suzukii. J. Pest Sci. 89, 771–780.
- Markow, T.A., O’Grady, P.M. 2006: Drosophila. A guide to species identification and use, Elsevier Inc.
- Narasimha S, Nagornov KO, Menin L, Mucciolo A, Rohwedder A, Humbel BM, et al. 2019: Drosophila melanogaster cloak their eggs with pheromones, which prevents cannibalism. PLoS Biol 17(1): e2006012. [CrossRef]
- Pelton, E., Gratton, C.; Isaacs R., Van Timmeren S., Blanton A., Guedot C. 2016: Earlier activity of Drosophila suzukii in high woodland landscapes but relative abundance is unaffected. J. Pest Sci. 89, 725–73. [CrossRef]
- Saguez, J.; Lasnier, J. and Vincent C. 2013: First record of Drosophila suzukii in Quebec vineyards. J. Int. Sci. Vigne Vin 47, 69-72. [CrossRef]
- Shearer P.W., West, J.D., Walton, V.M., Brown, P.H., Svetec, N., Chiu, J.C. 2016: Seasonal cues induce phenotypic plasticity of Drosophila suzukii to enhance winter survival. BMC Ecol 16, 11. [CrossRef]
- Stephens, A.R., Asplen, M.K., Hutchinson, W.D., Venette, R.C. 2015: Cold Hardiness of Winter-Acclimated Drosophila suzukii (Diptera: Drosophildae) Adults, Environ. Entomol. 44(6), 1619-1626. [CrossRef]
- Tiefenbrunner, D., Tiefenbrunner, W. 2017: Einige weinbaurelevante Neozoen und verwandte indigene Arten im Umfeld der Weingärten der Südwesthänge des Leithgebirges. Teil 1: Drosophila suzukii und andere Drosophilidae, Mitteilungen Klosterneuburg 67, 97-112.
- Tiefenbrunner, W., Riedle-Bauer, M., 2021: Mehrjährige Untersuchung der Populationsentwicklung von Drosophila suzukii (Diptera: Drosophilidae) und anderen Drosophilidae im Weingarten und dessen Umgebung, Mitteilungen Klosterneuburg 71, 54-73.
- Tiefenbrunner, I., Tscheik, G., Tiefenbrunner, W. A., 2024: Comparison of the Attractiveness of Grape Juice after Different Fermentation Times for Drosophila suzukii and D. simulans in a Field Experiment. Preprints. [CrossRef]
- Tiefenbrunner, A., Tiefenbrunner, W. 2025: Pterometric Studies on Pannonian Drosophilidae—Wing Proportions and Phylogeny. International Journal of Agricultural Sciences and Technology, 5(1), 82-97. [CrossRef]
- van Timmeren, S., Isaacs, R. 2014: Drosophila suzukii in Michigan vineyards, and the first report of Zaprionus indianus from this region. Journal of Applied Entomology 138: 519-527.
- Walsh, D.B., Bolda, M.P., Goodhue, R.E., Dreves, A.J., Lee, J., Bruck, D.J., Walton, V.M., O'Neal, S.D., Zalom F.G. 2011: Drosophila suzukii (Diptera: Drosophilidae): invasive pest of ripening soft fruit expanding its geographic range and damage potential. J. Integr. Pest Manag. 2, 1–7. [CrossRef]
- Yang, D., 2018: Carnivory in the Larvae of Drosophila melanogaster and other Drosophila species, Scientific reports, 8, 15484.
Figure 1.
Sampling locations. Red points: plain; blue points: slope. The first letter of the sample designation refers to the village (St. Georgen = G, Eisenstadt = E, Müllendorf = M), the second to the exposure (hillside = h, plain = p), and the third to the habitat (F = forest edge or hedgerow, windbreak; V = vineyard foliage).
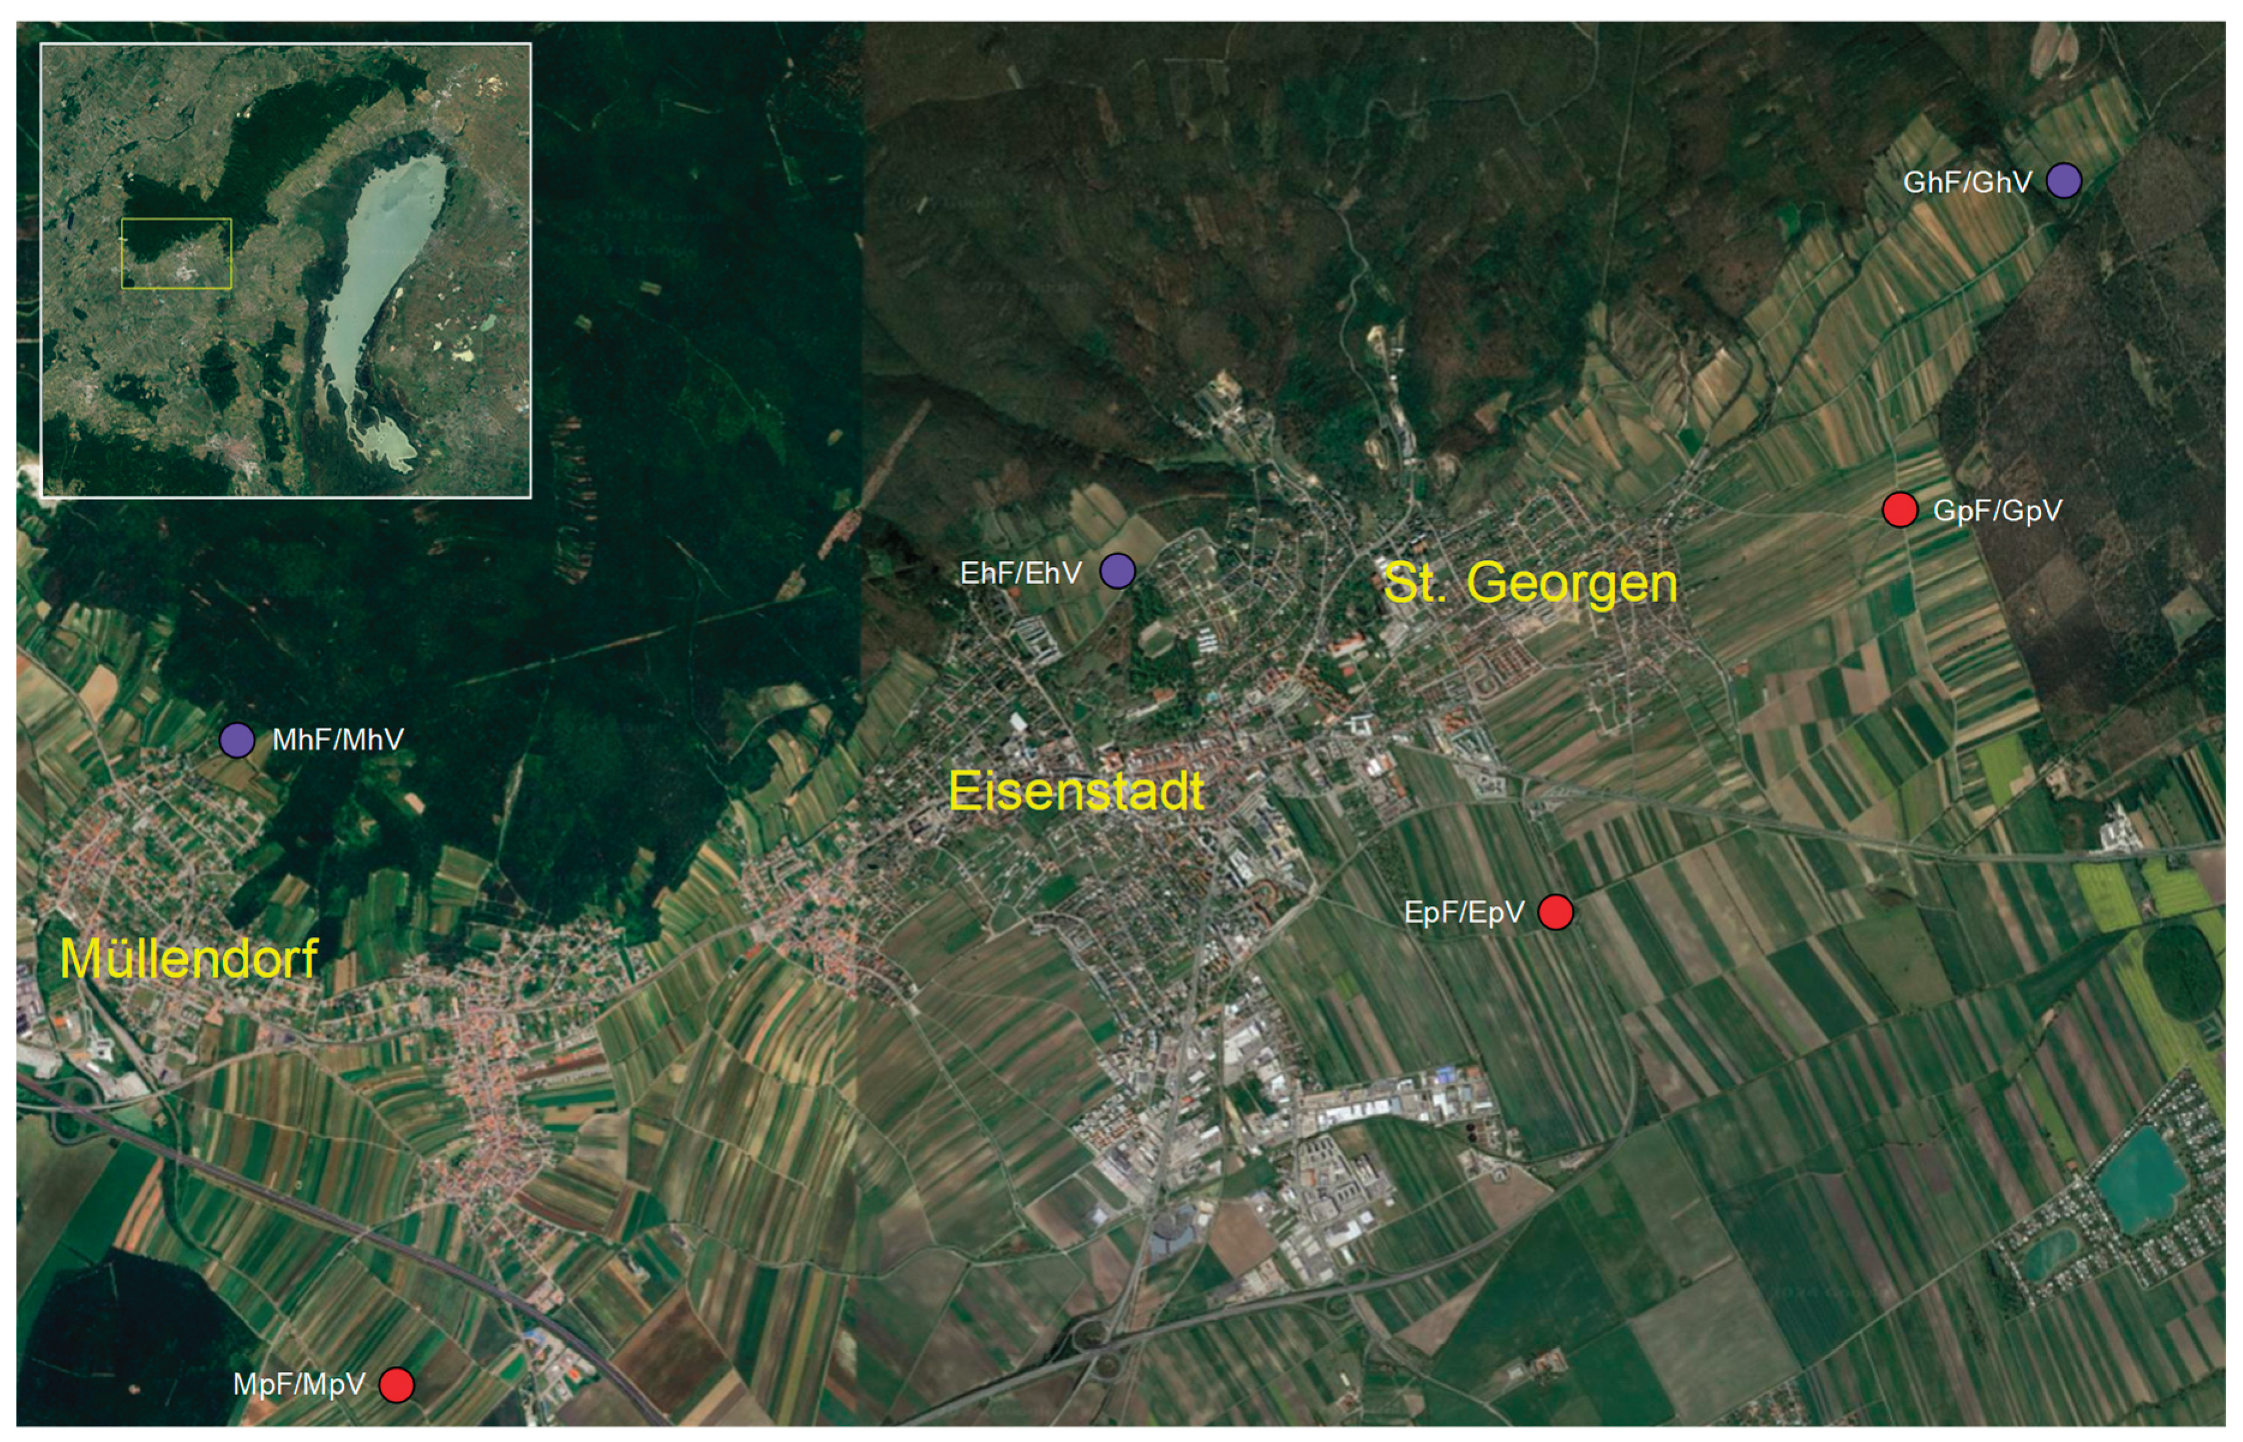
Figure 2.
The occurrence of the ten most frequent species, with locations grouped for comparison based on exposure (slope, plain) and 'habitat' (forest edge or vineyard).
Figure 2.
The occurrence of the ten most frequent species, with locations grouped for comparison based on exposure (slope, plain) and 'habitat' (forest edge or vineyard).
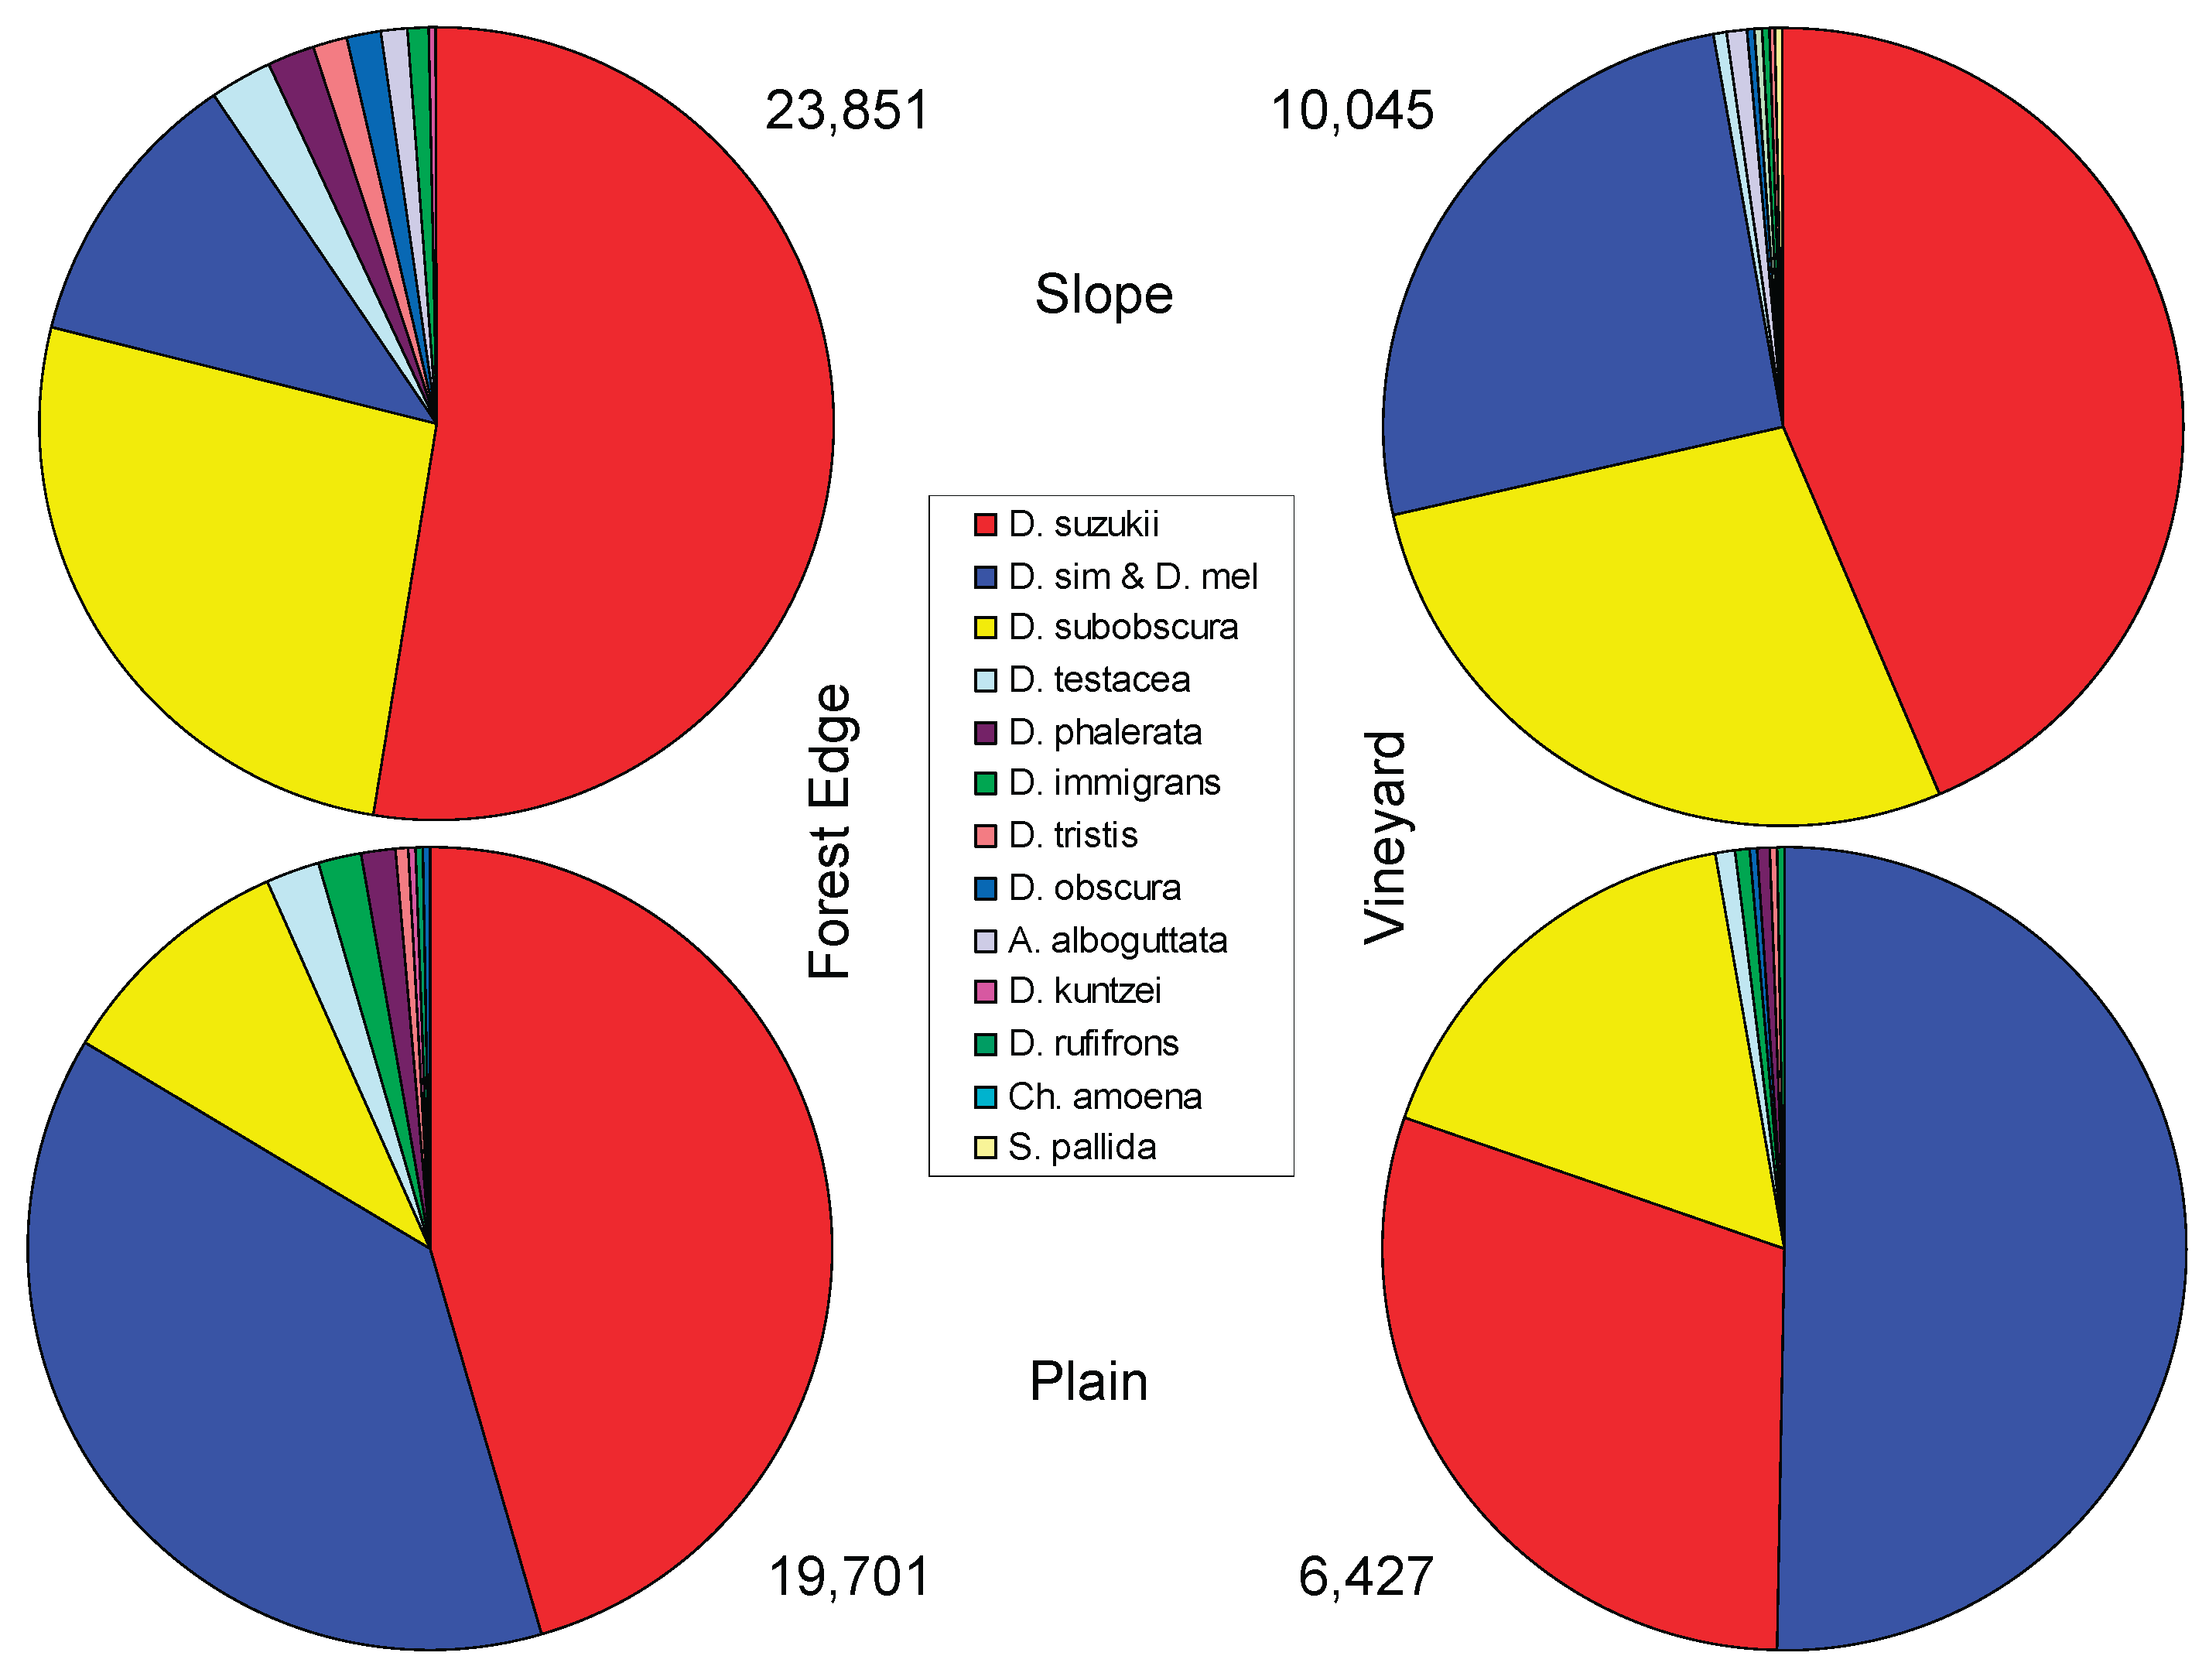
Figure 3.
Multivariate comparison (PCA) of the species spectra of the locations. The two study years were analyzed separately but are summarized in a single representation. For identification, the location and year are provided.
Figure 3.
Multivariate comparison (PCA) of the species spectra of the locations. The two study years were analyzed separately but are summarized in a single representation. For identification, the location and year are provided.
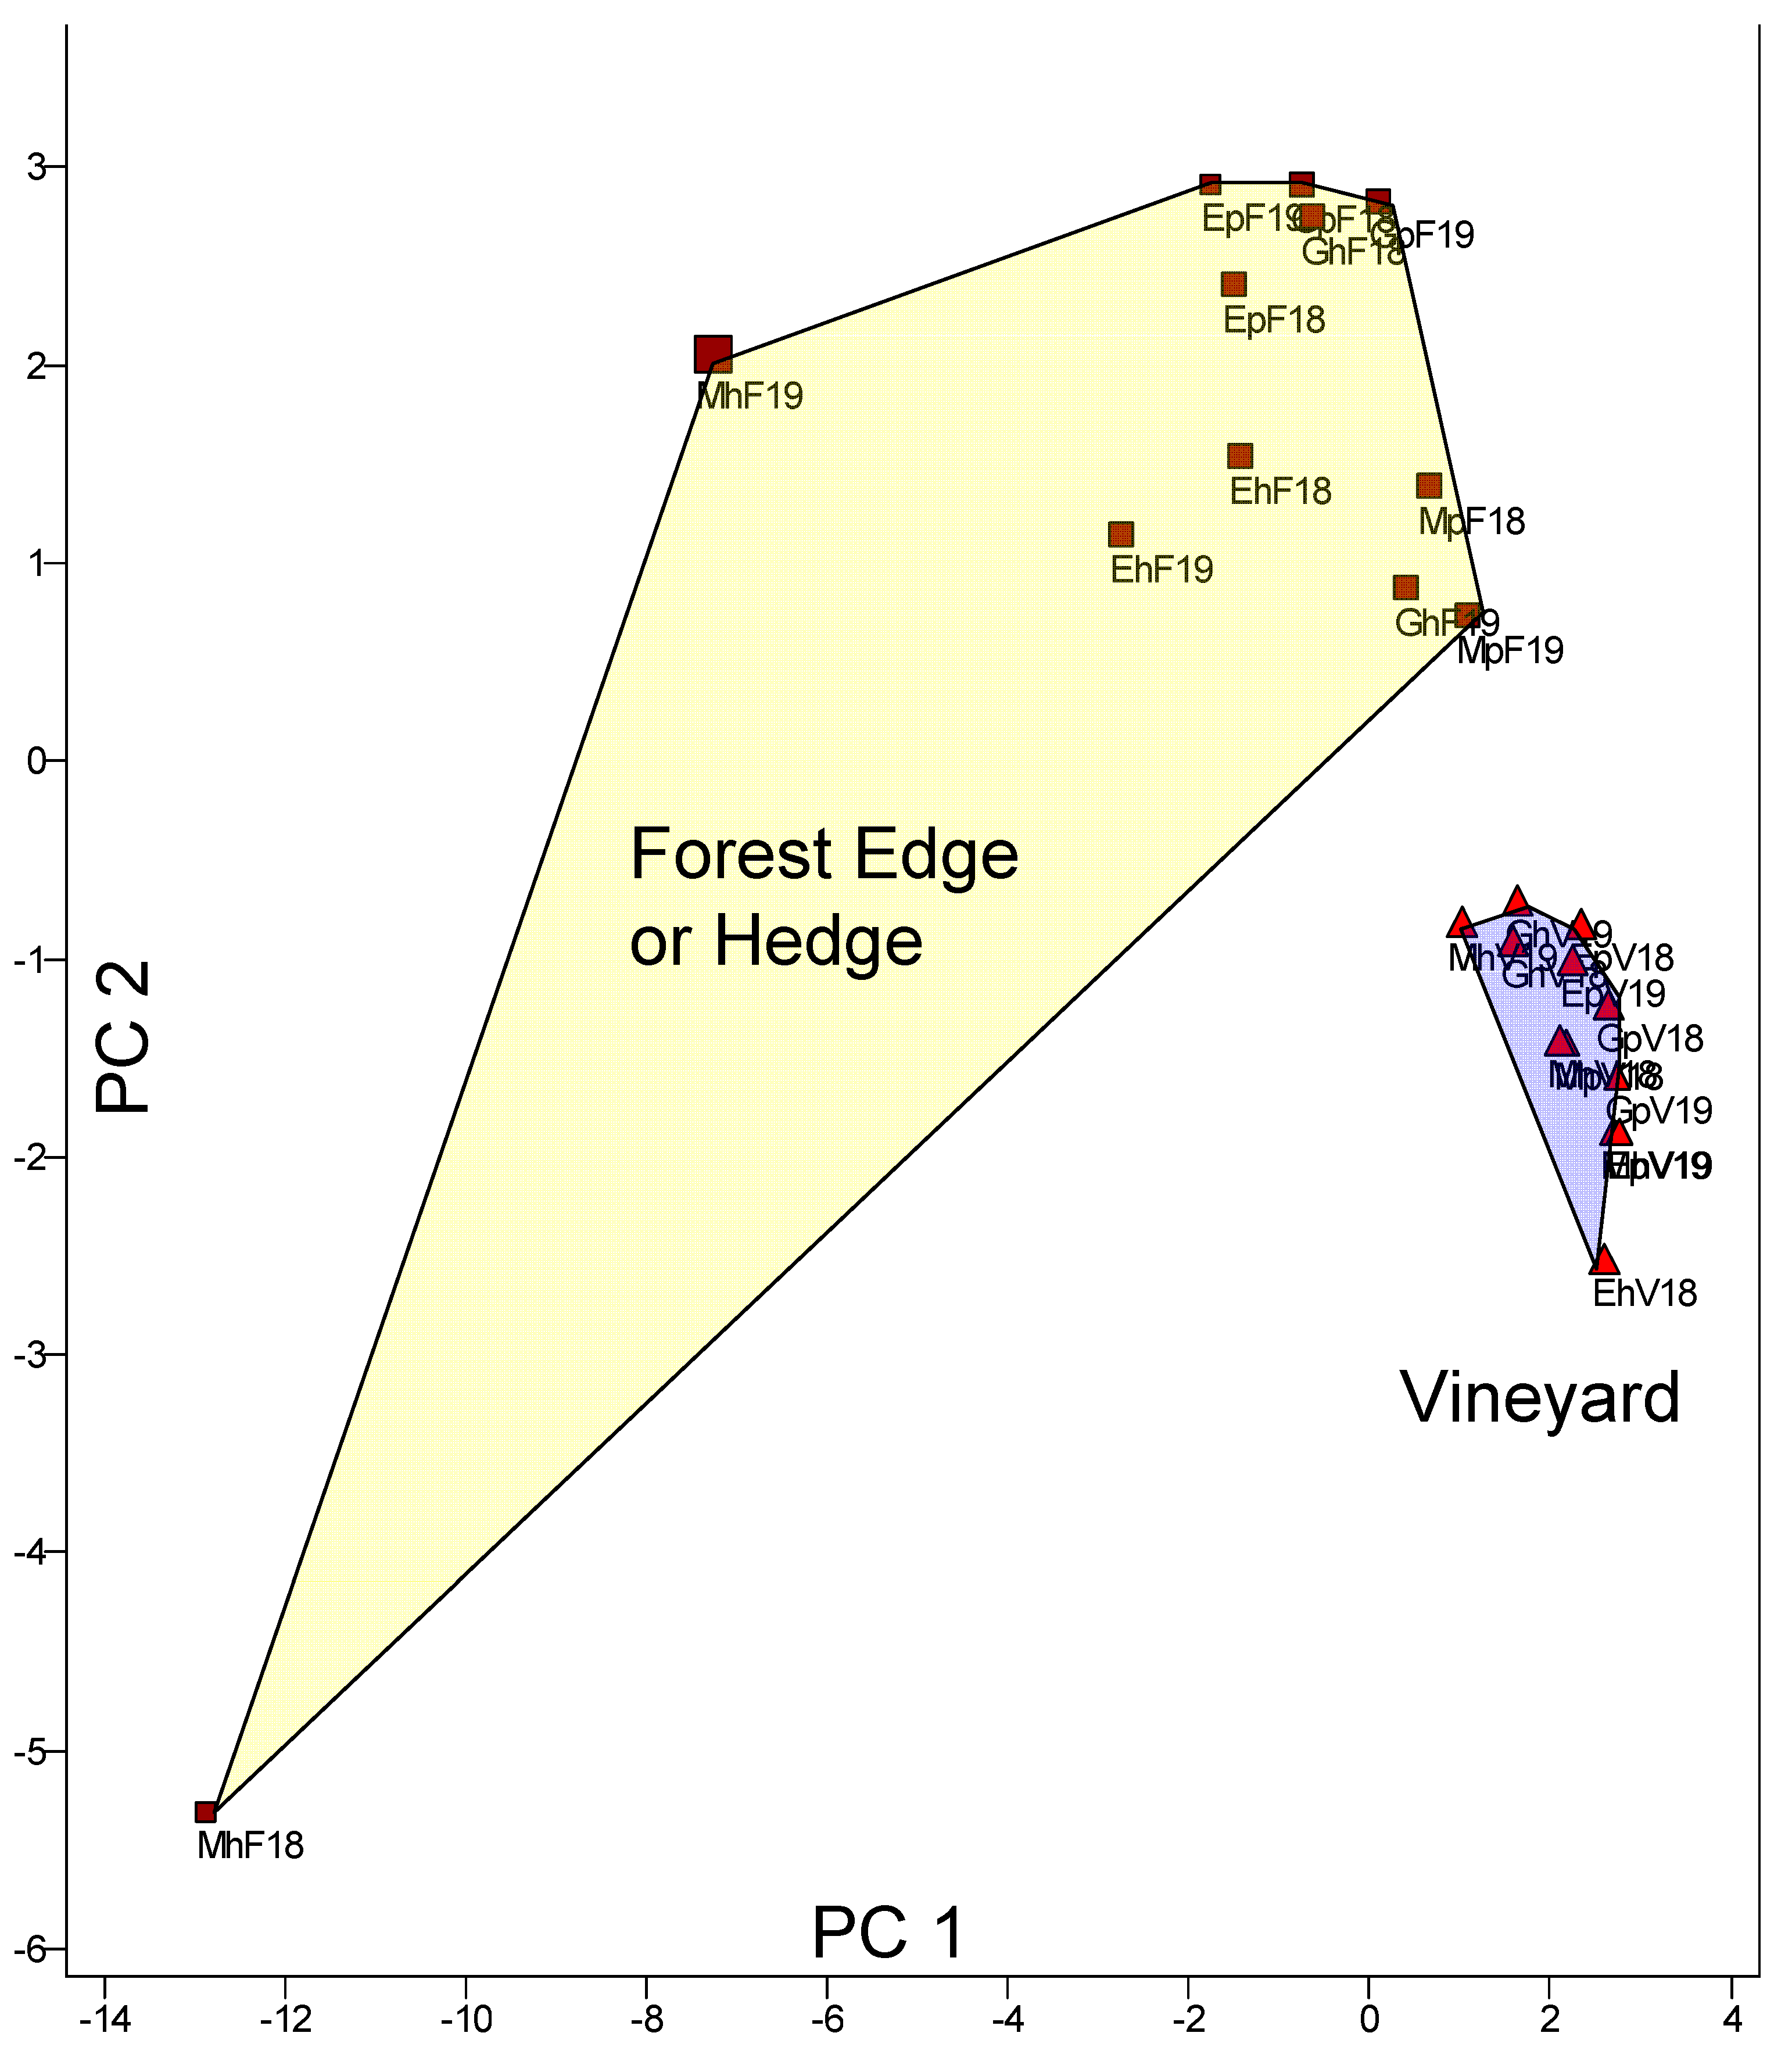
Figure 4.
Comparison of total frequencies (separately for both study years and combined for all locations). Note that the number of individuals is logarithmically scaled. Since the curves in this representation are almost linear, an approximately exponentially decreasing abundance results when the species are sorted by their frequency. D. sim & D. mel: D. simulans & D. melanogaster.
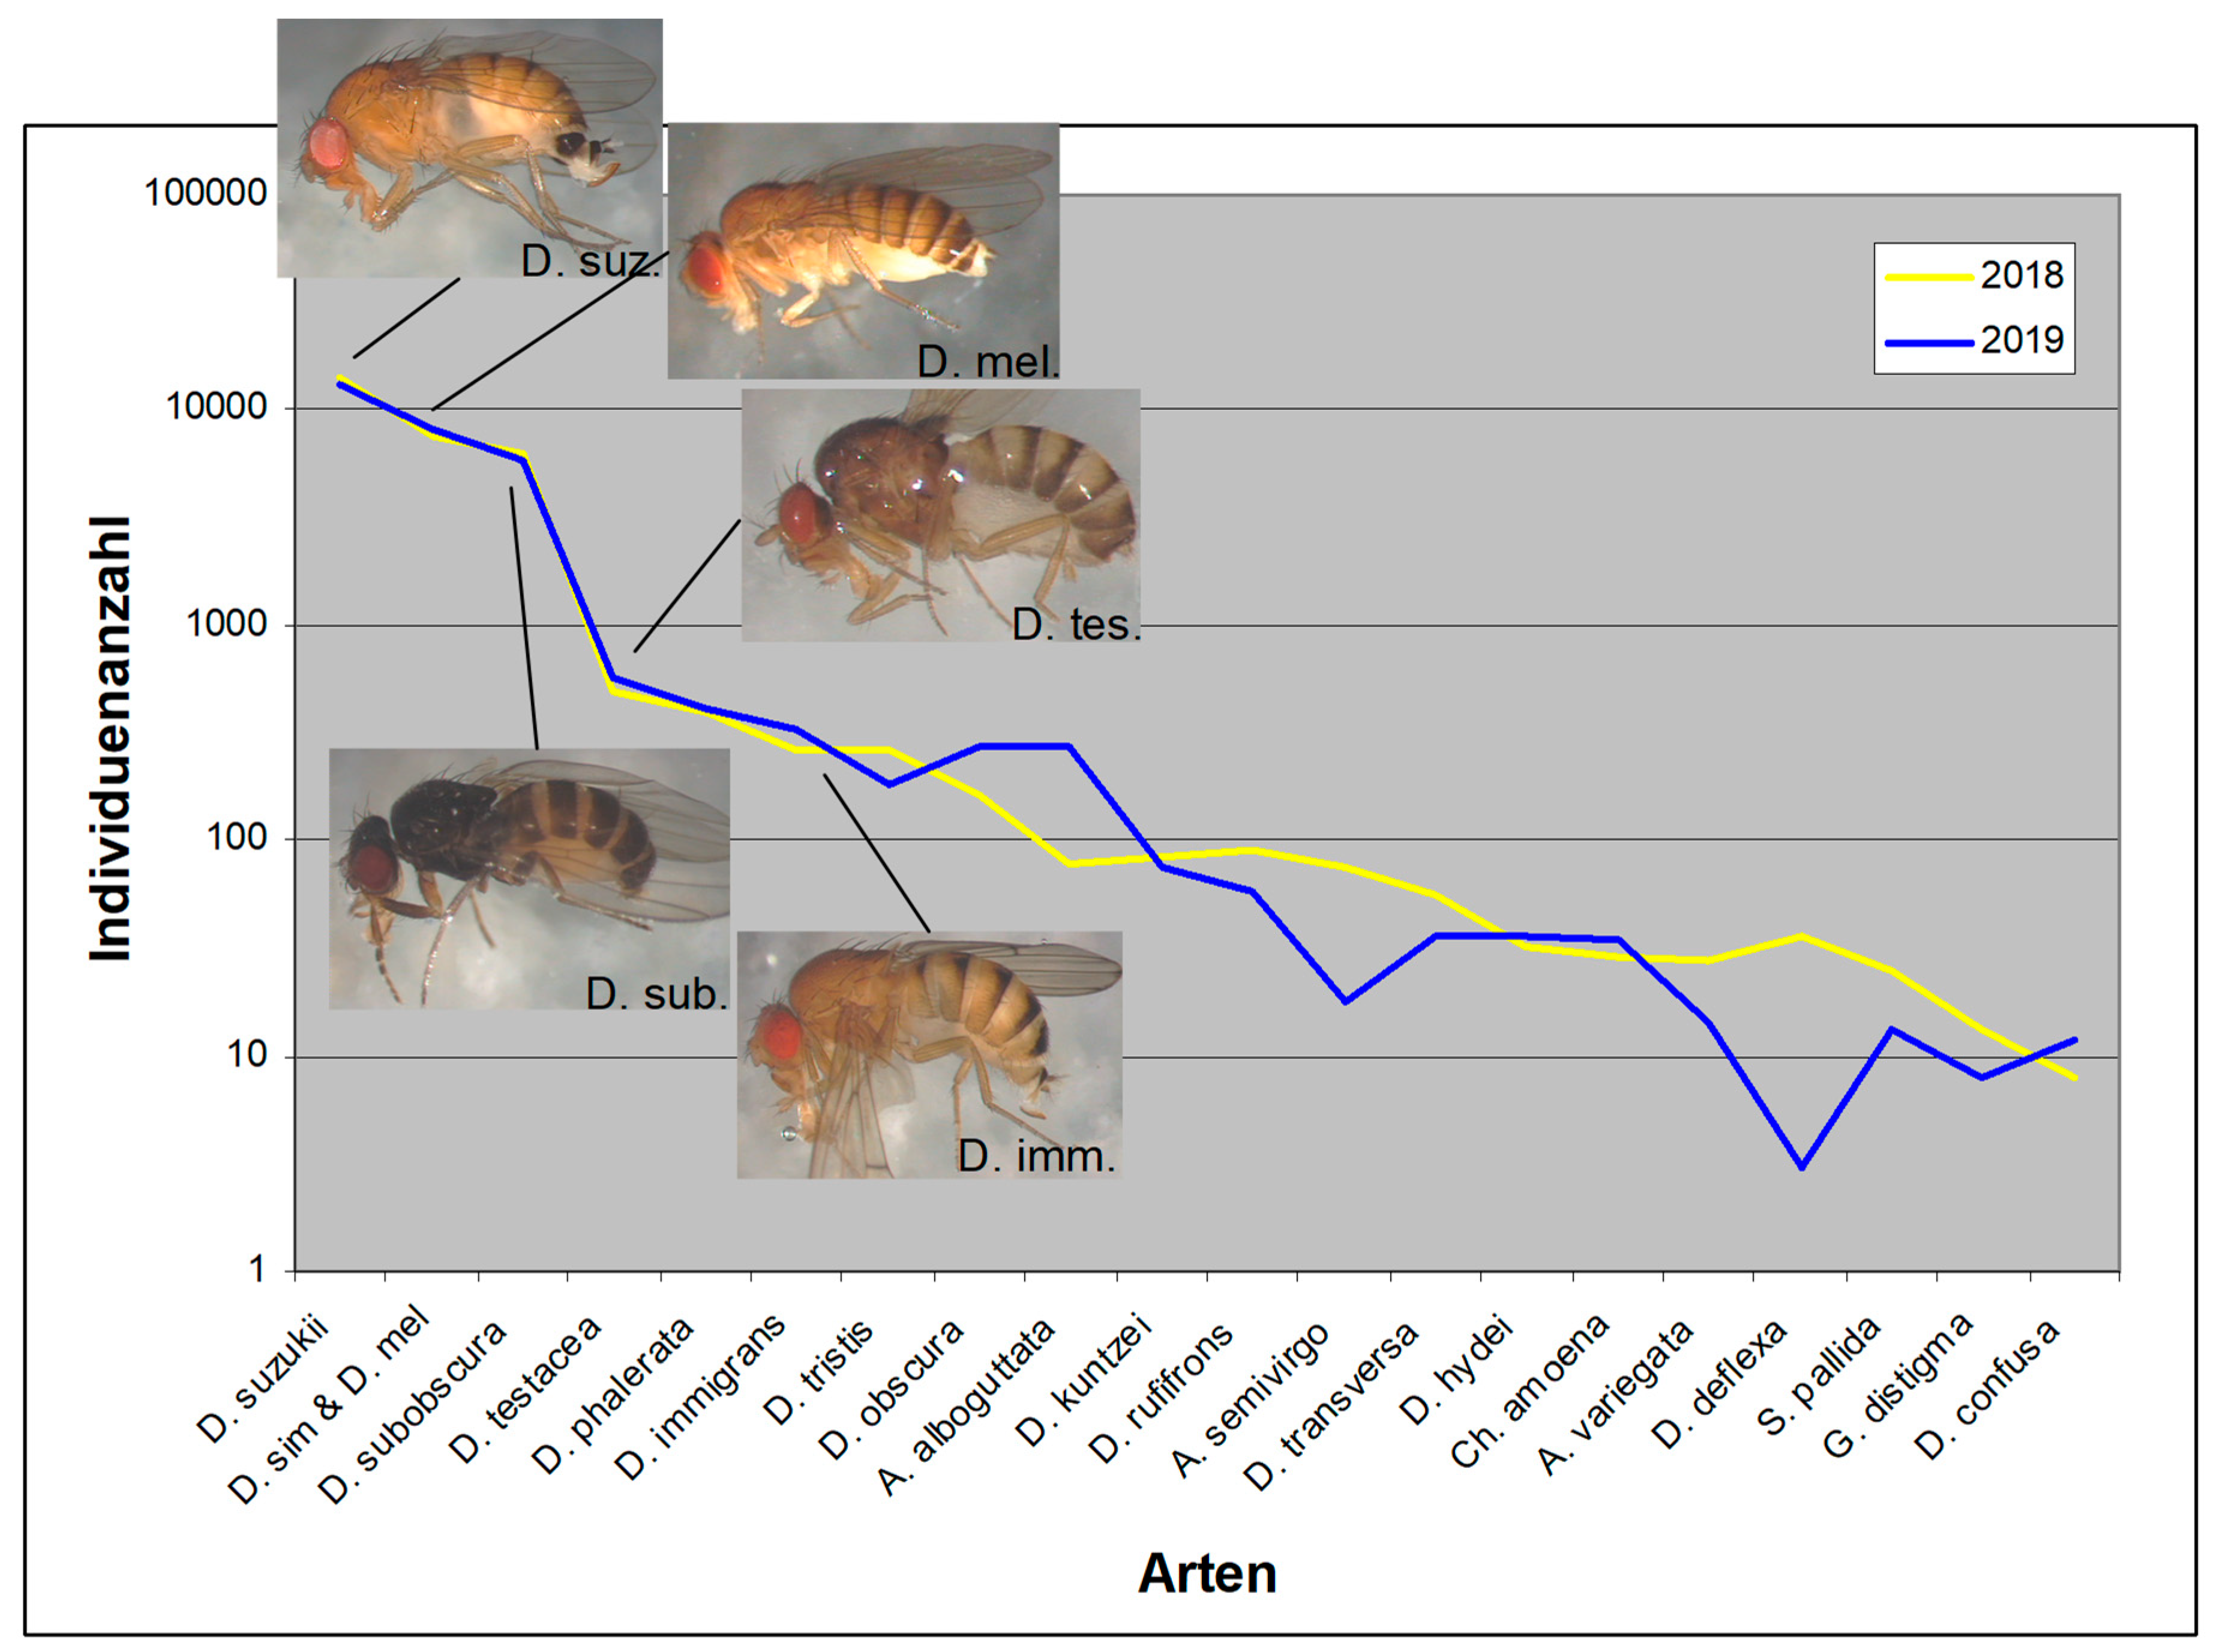
Figure 5.
Population development of D. suzukii throughout the year.
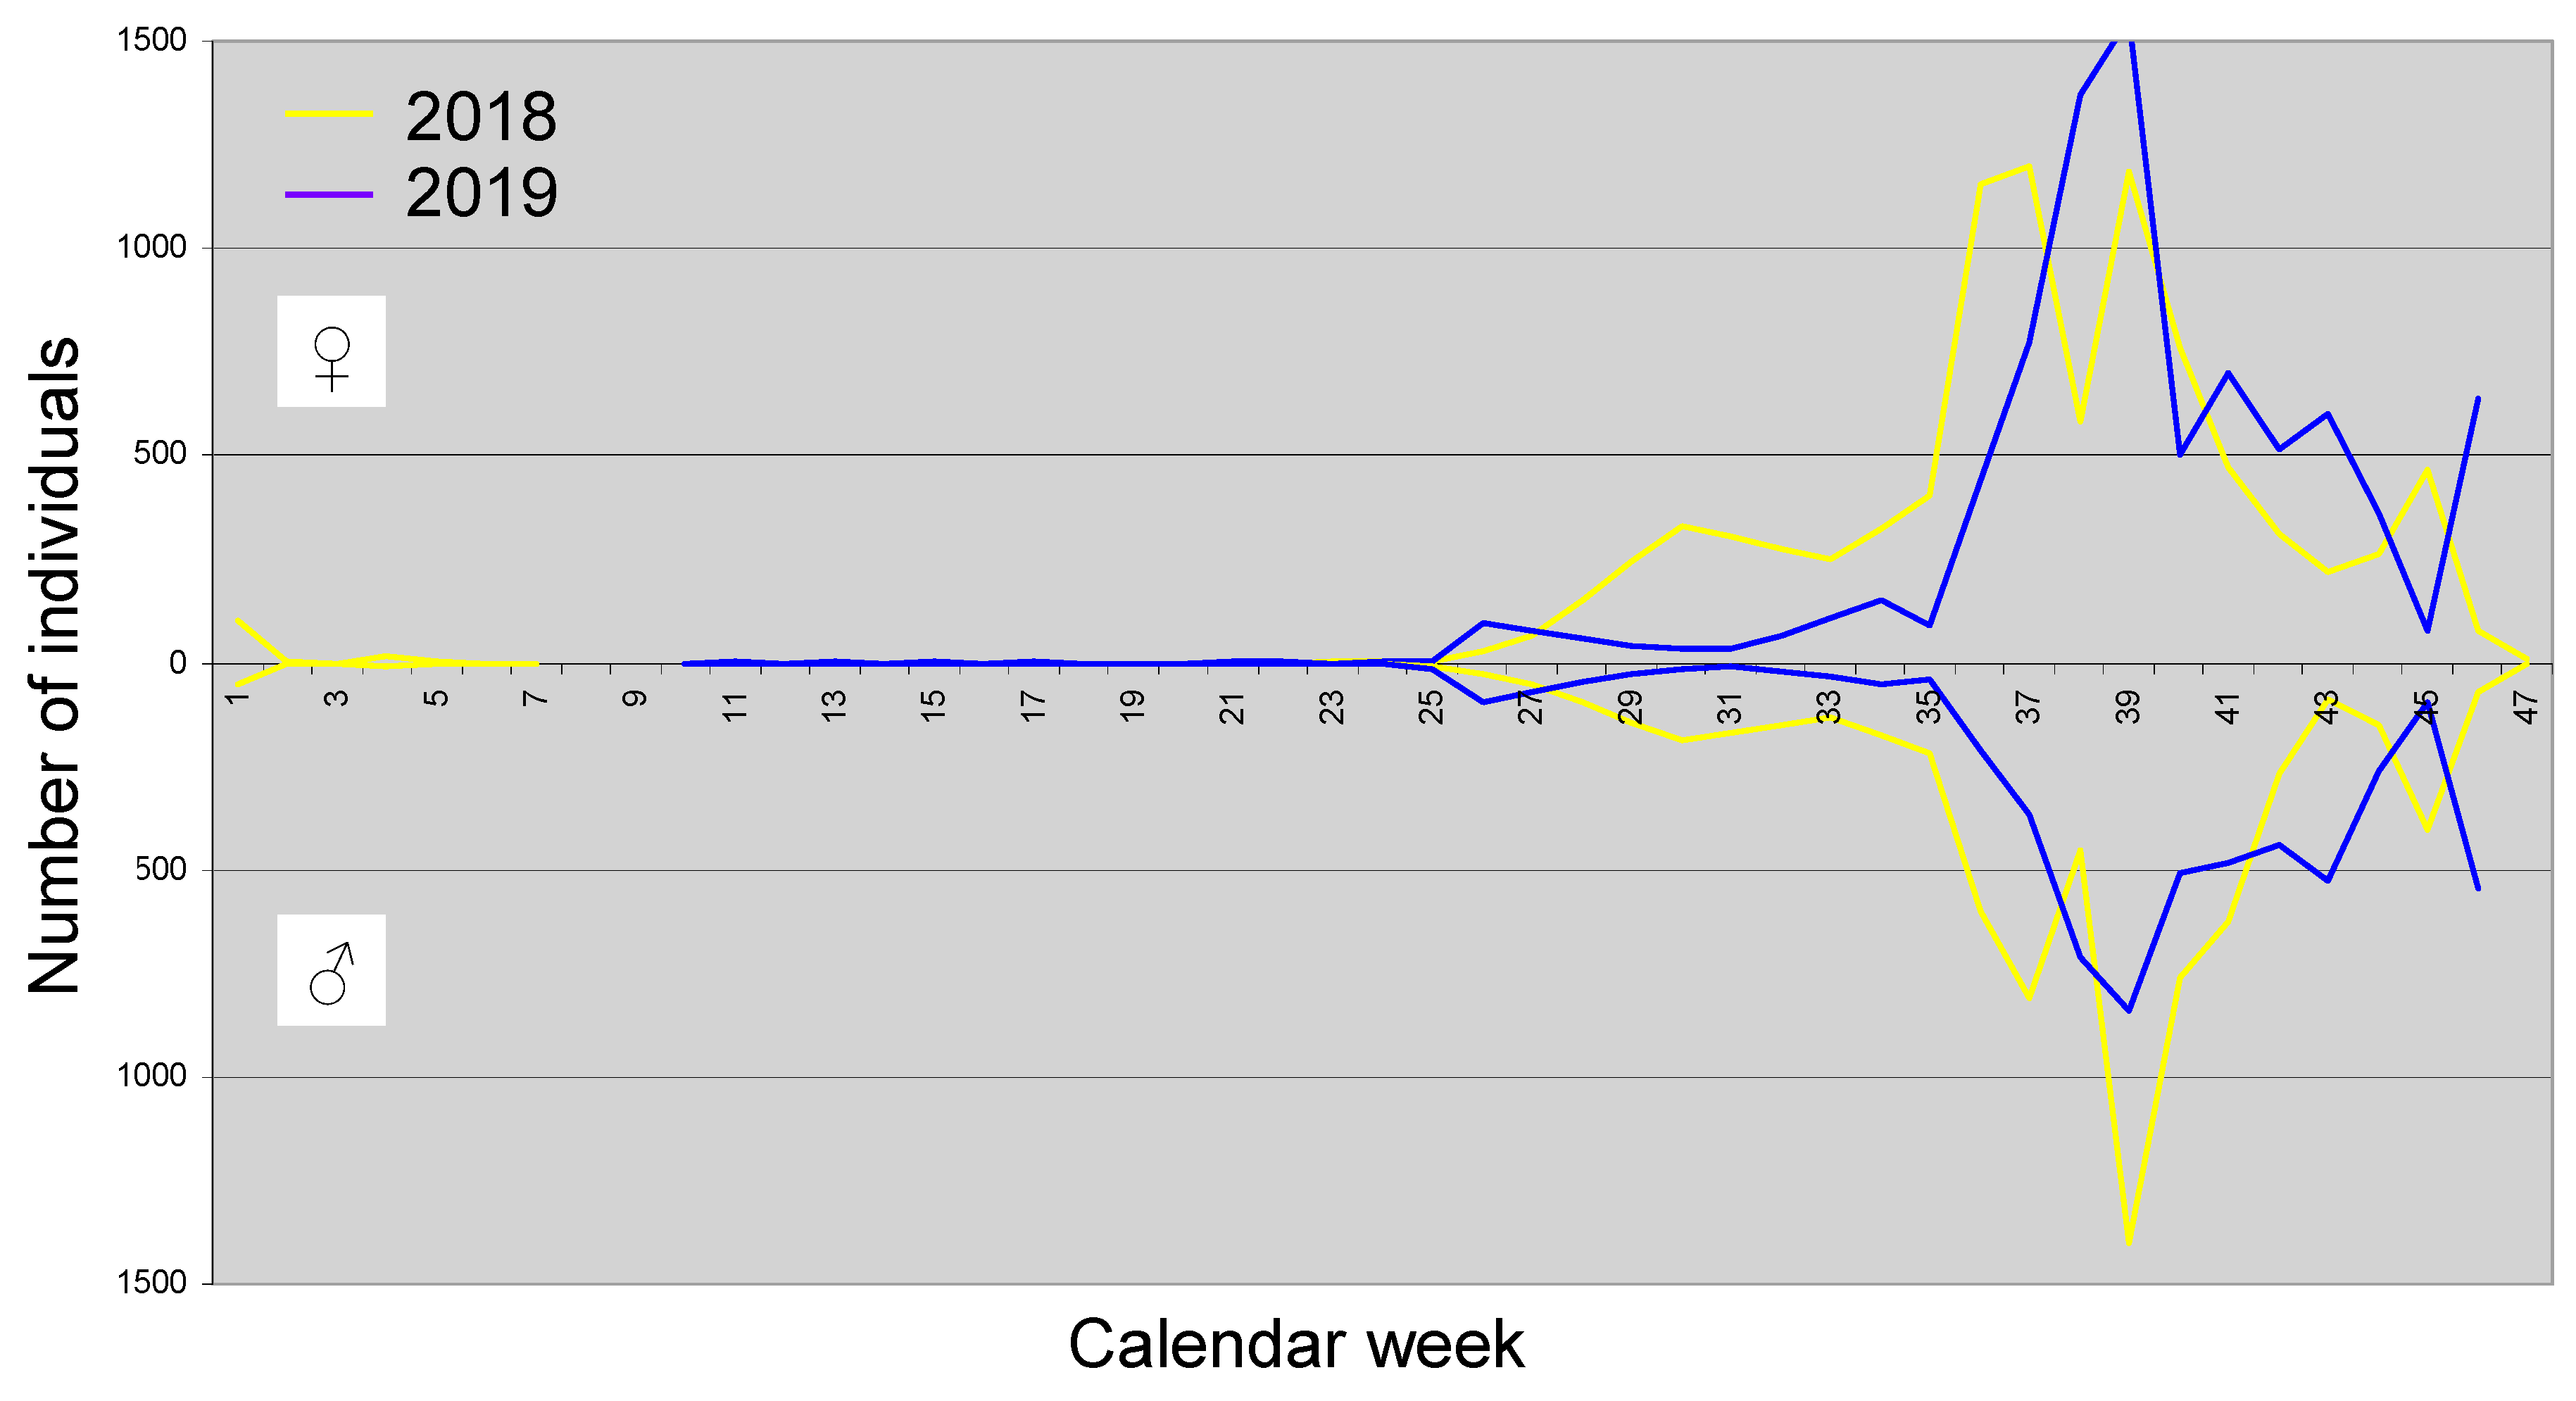
Figure 6.
Scatter plots of the influence of habitat and exposure on D. suzukii. The number of individuals per sample is shown.
Figure 6.
Scatter plots of the influence of habitat and exposure on D. suzukii. The number of individuals per sample is shown.
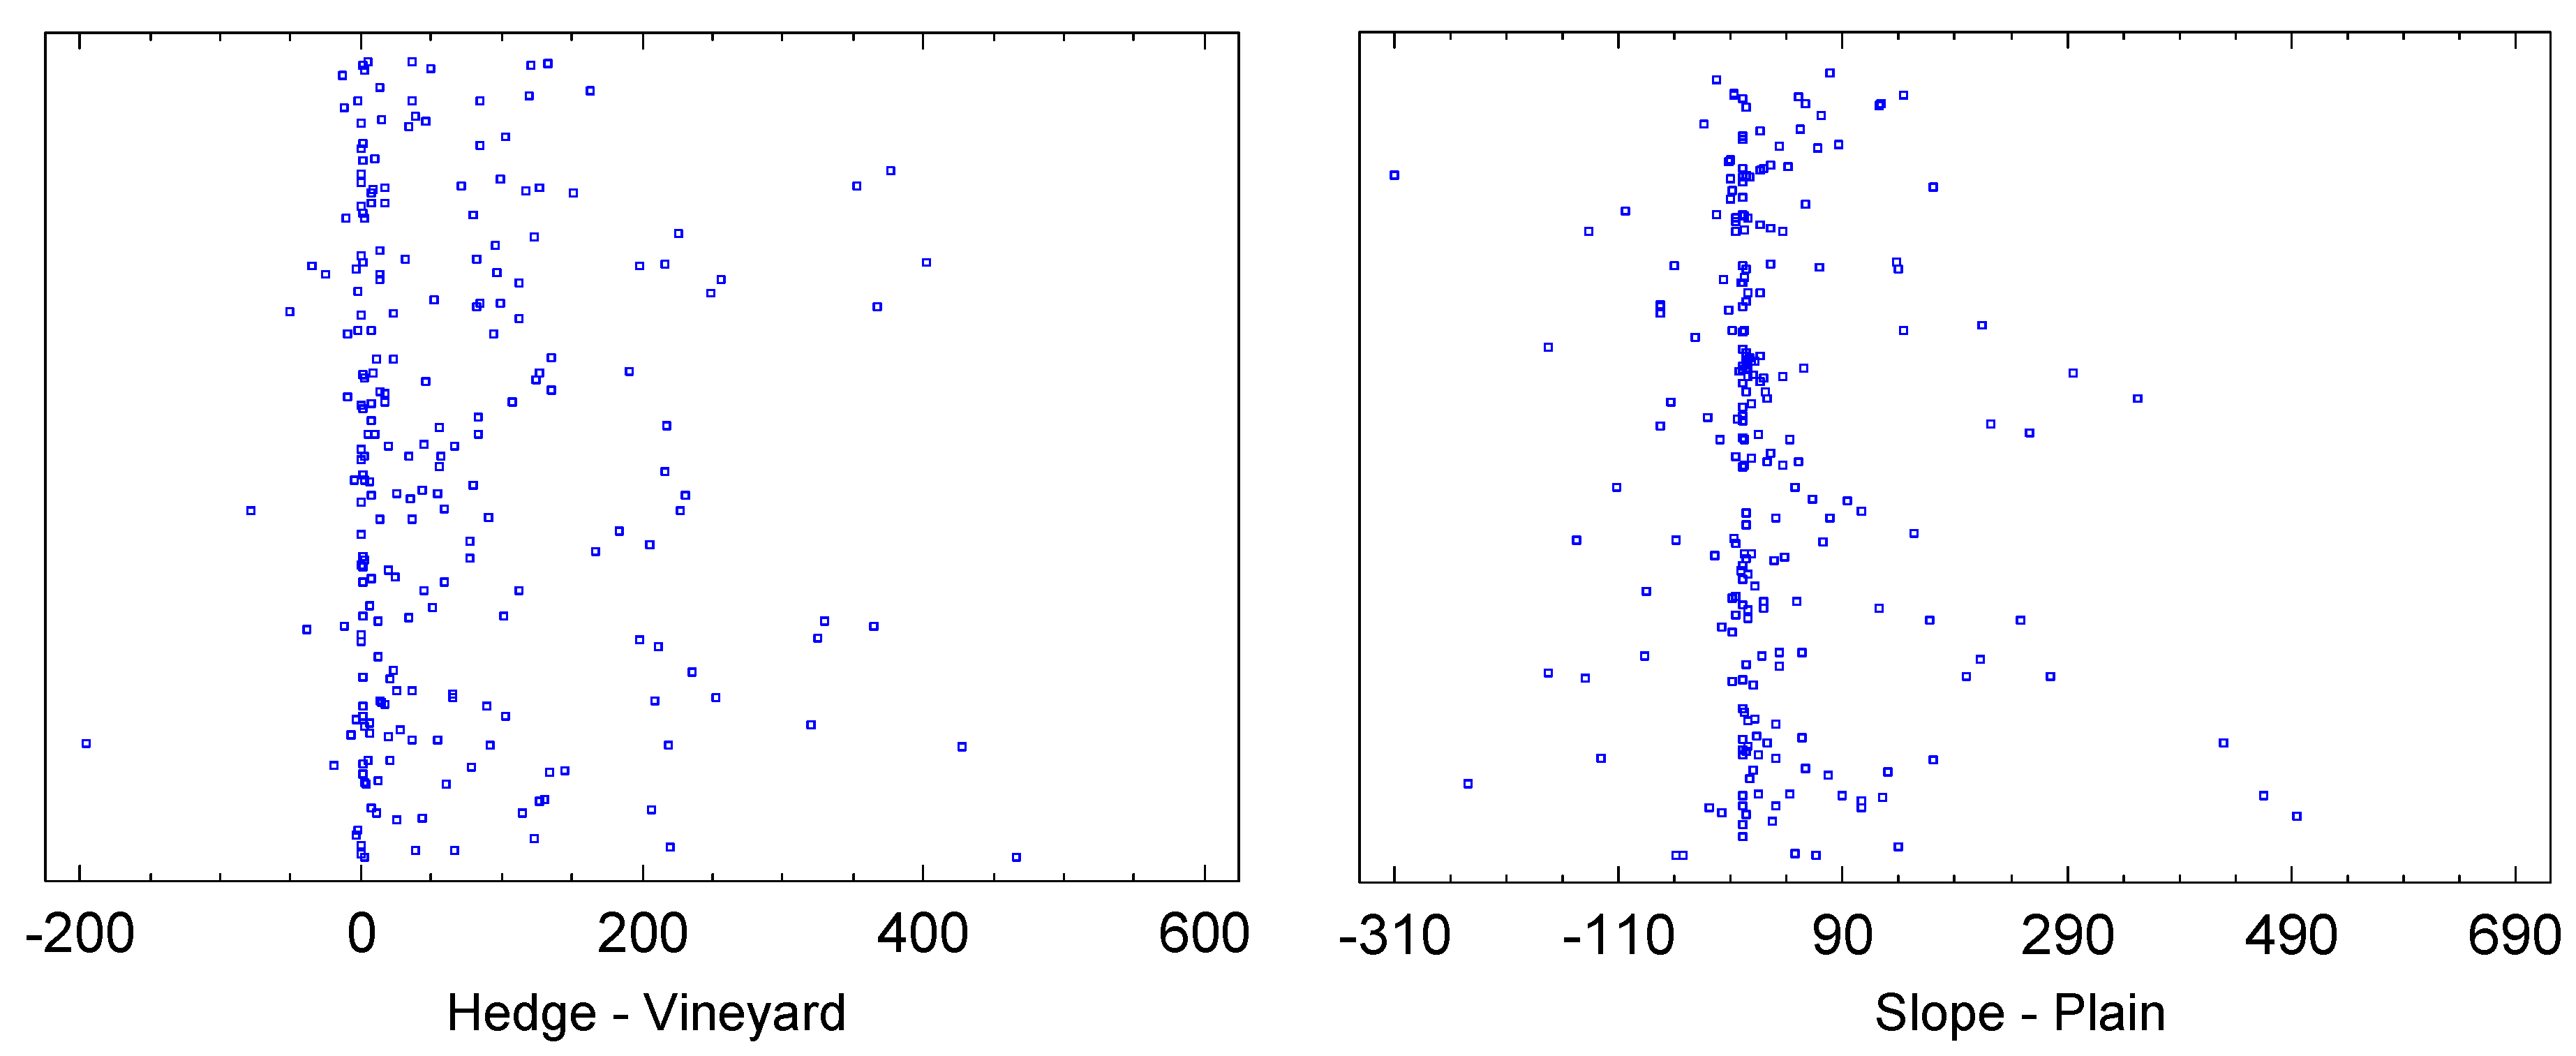
Figure 7.
The "crown" marking on the scutum of D. melanogaster. It is not found in D. simulans.
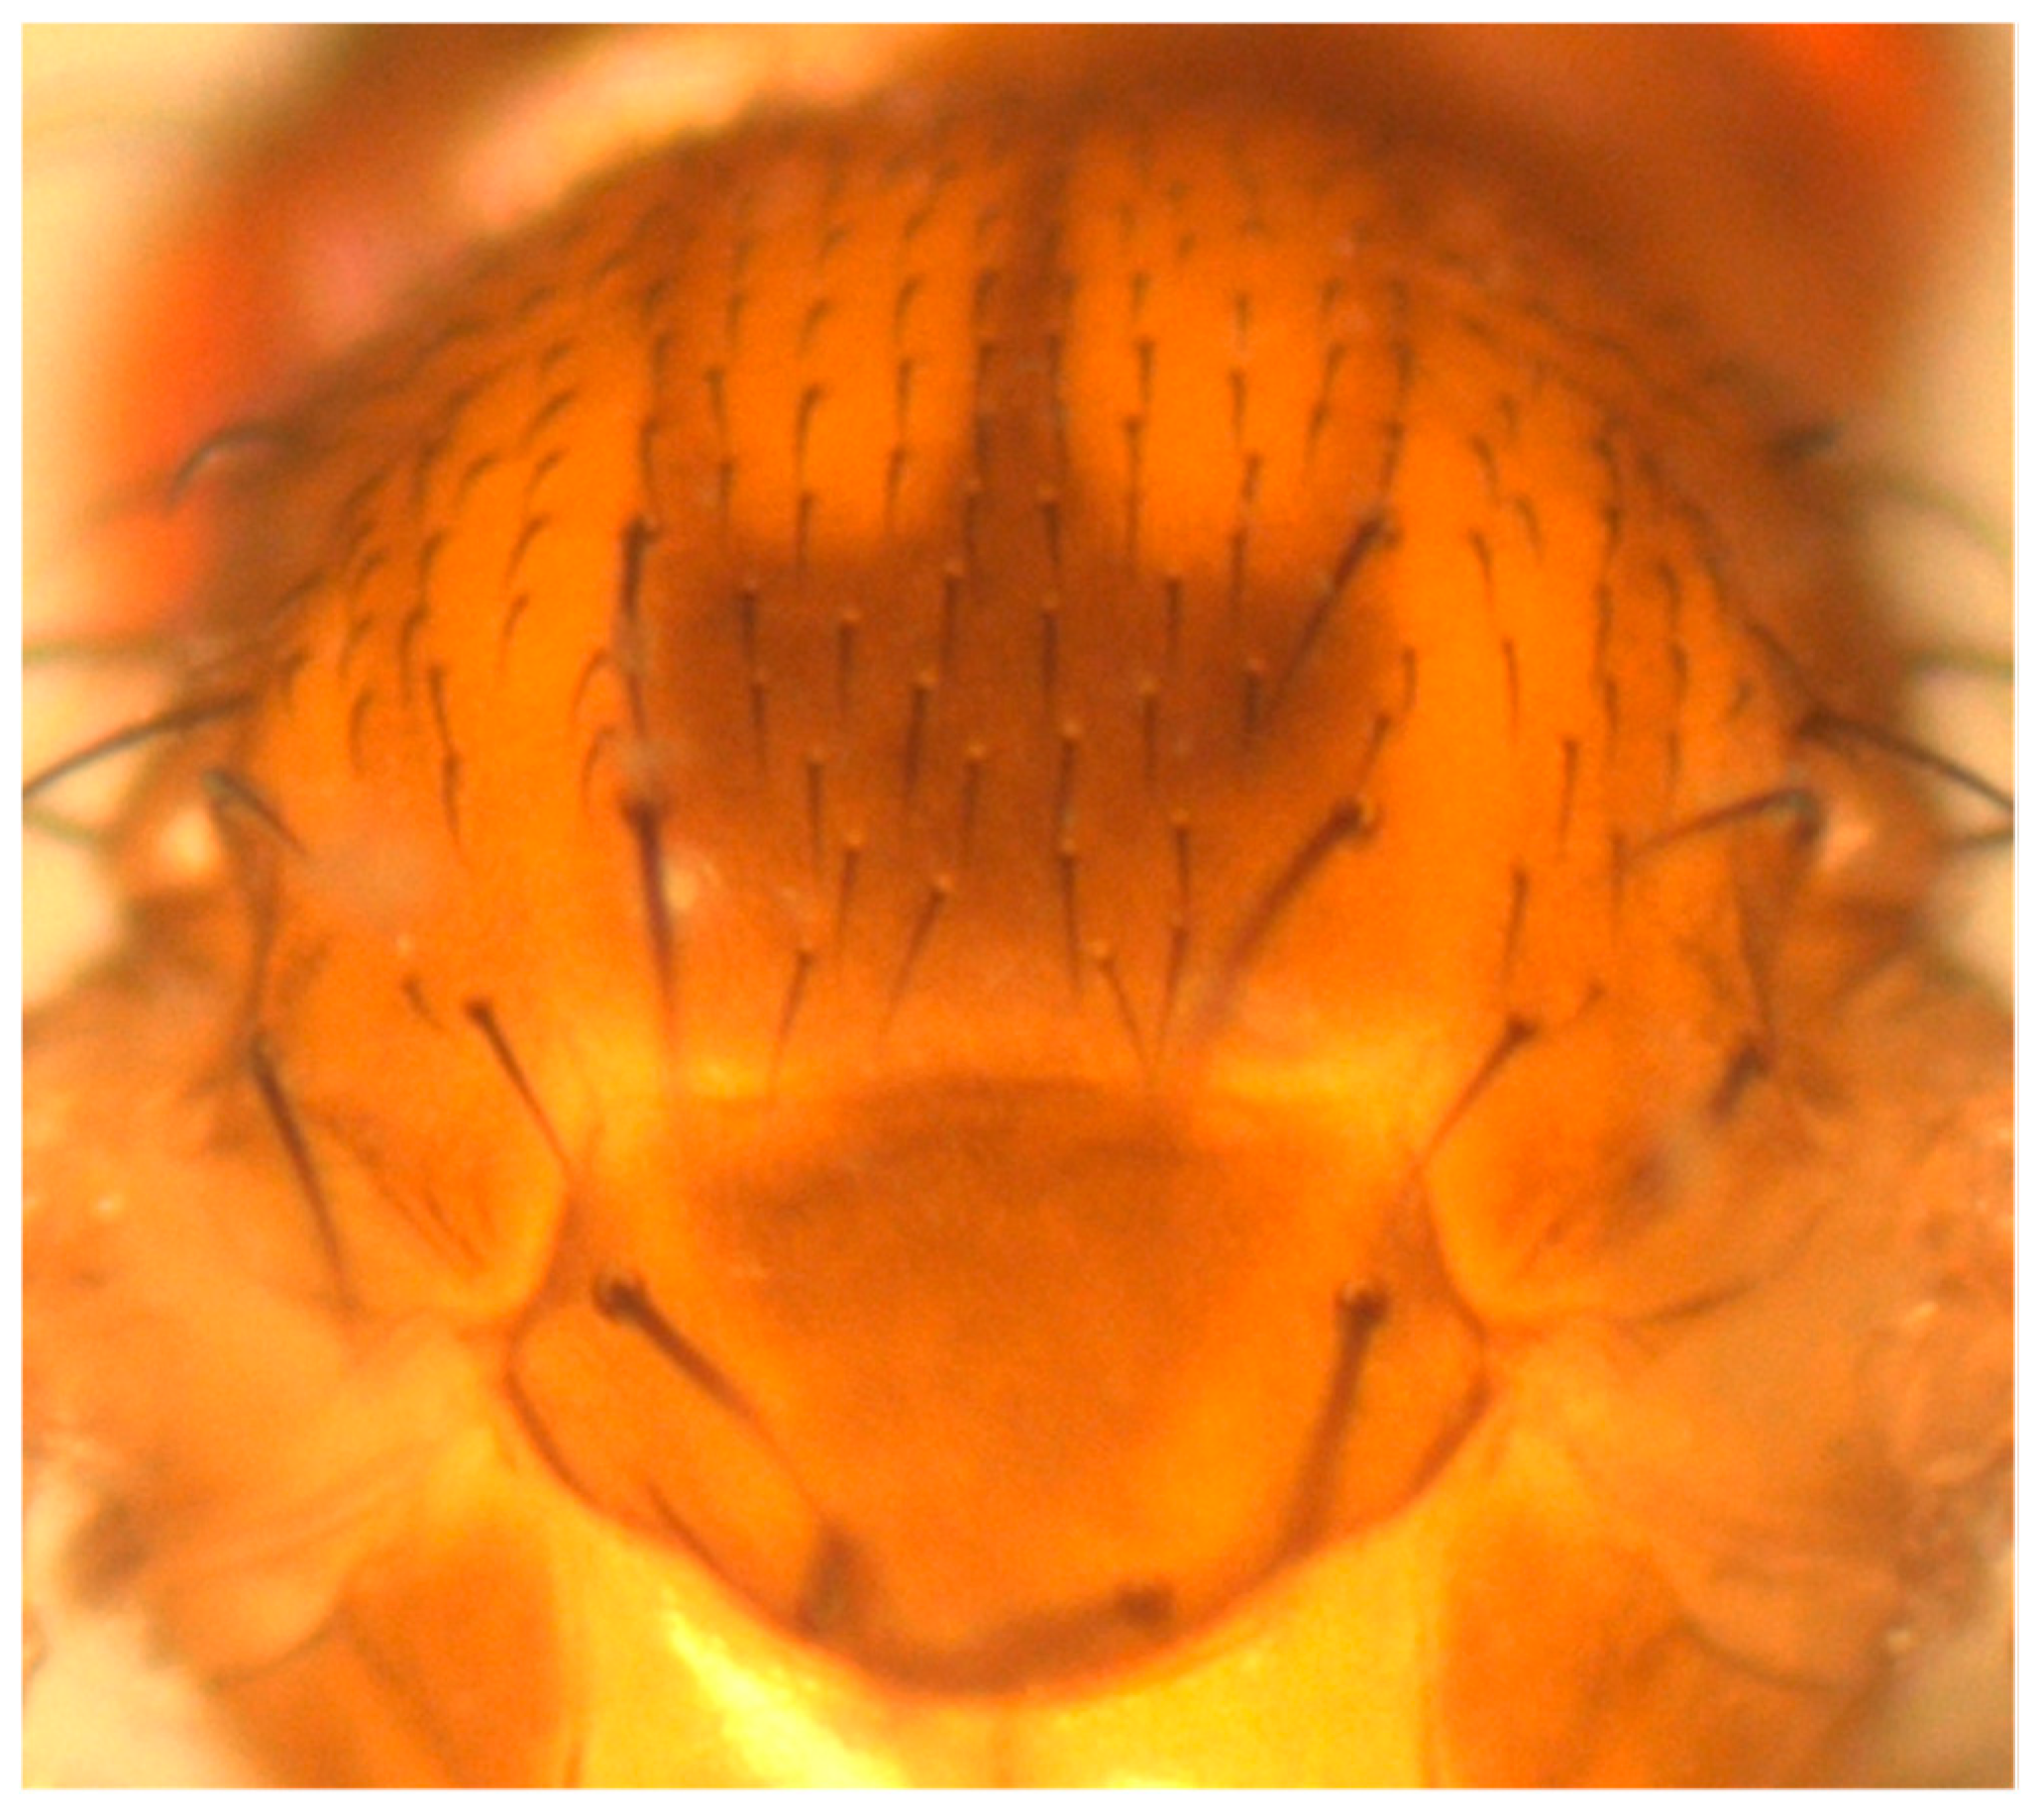
Figure 8.
Population development of the D. simulans & D. melanogaster species complex throughout the year for 2018 and 2019. For the males, the yellow and blue curves represent the cumulative yearly development (D. melanogaster plus D. simulans).
Figure 8.
Population development of the D. simulans & D. melanogaster species complex throughout the year for 2018 and 2019. For the males, the yellow and blue curves represent the cumulative yearly development (D. melanogaster plus D. simulans).
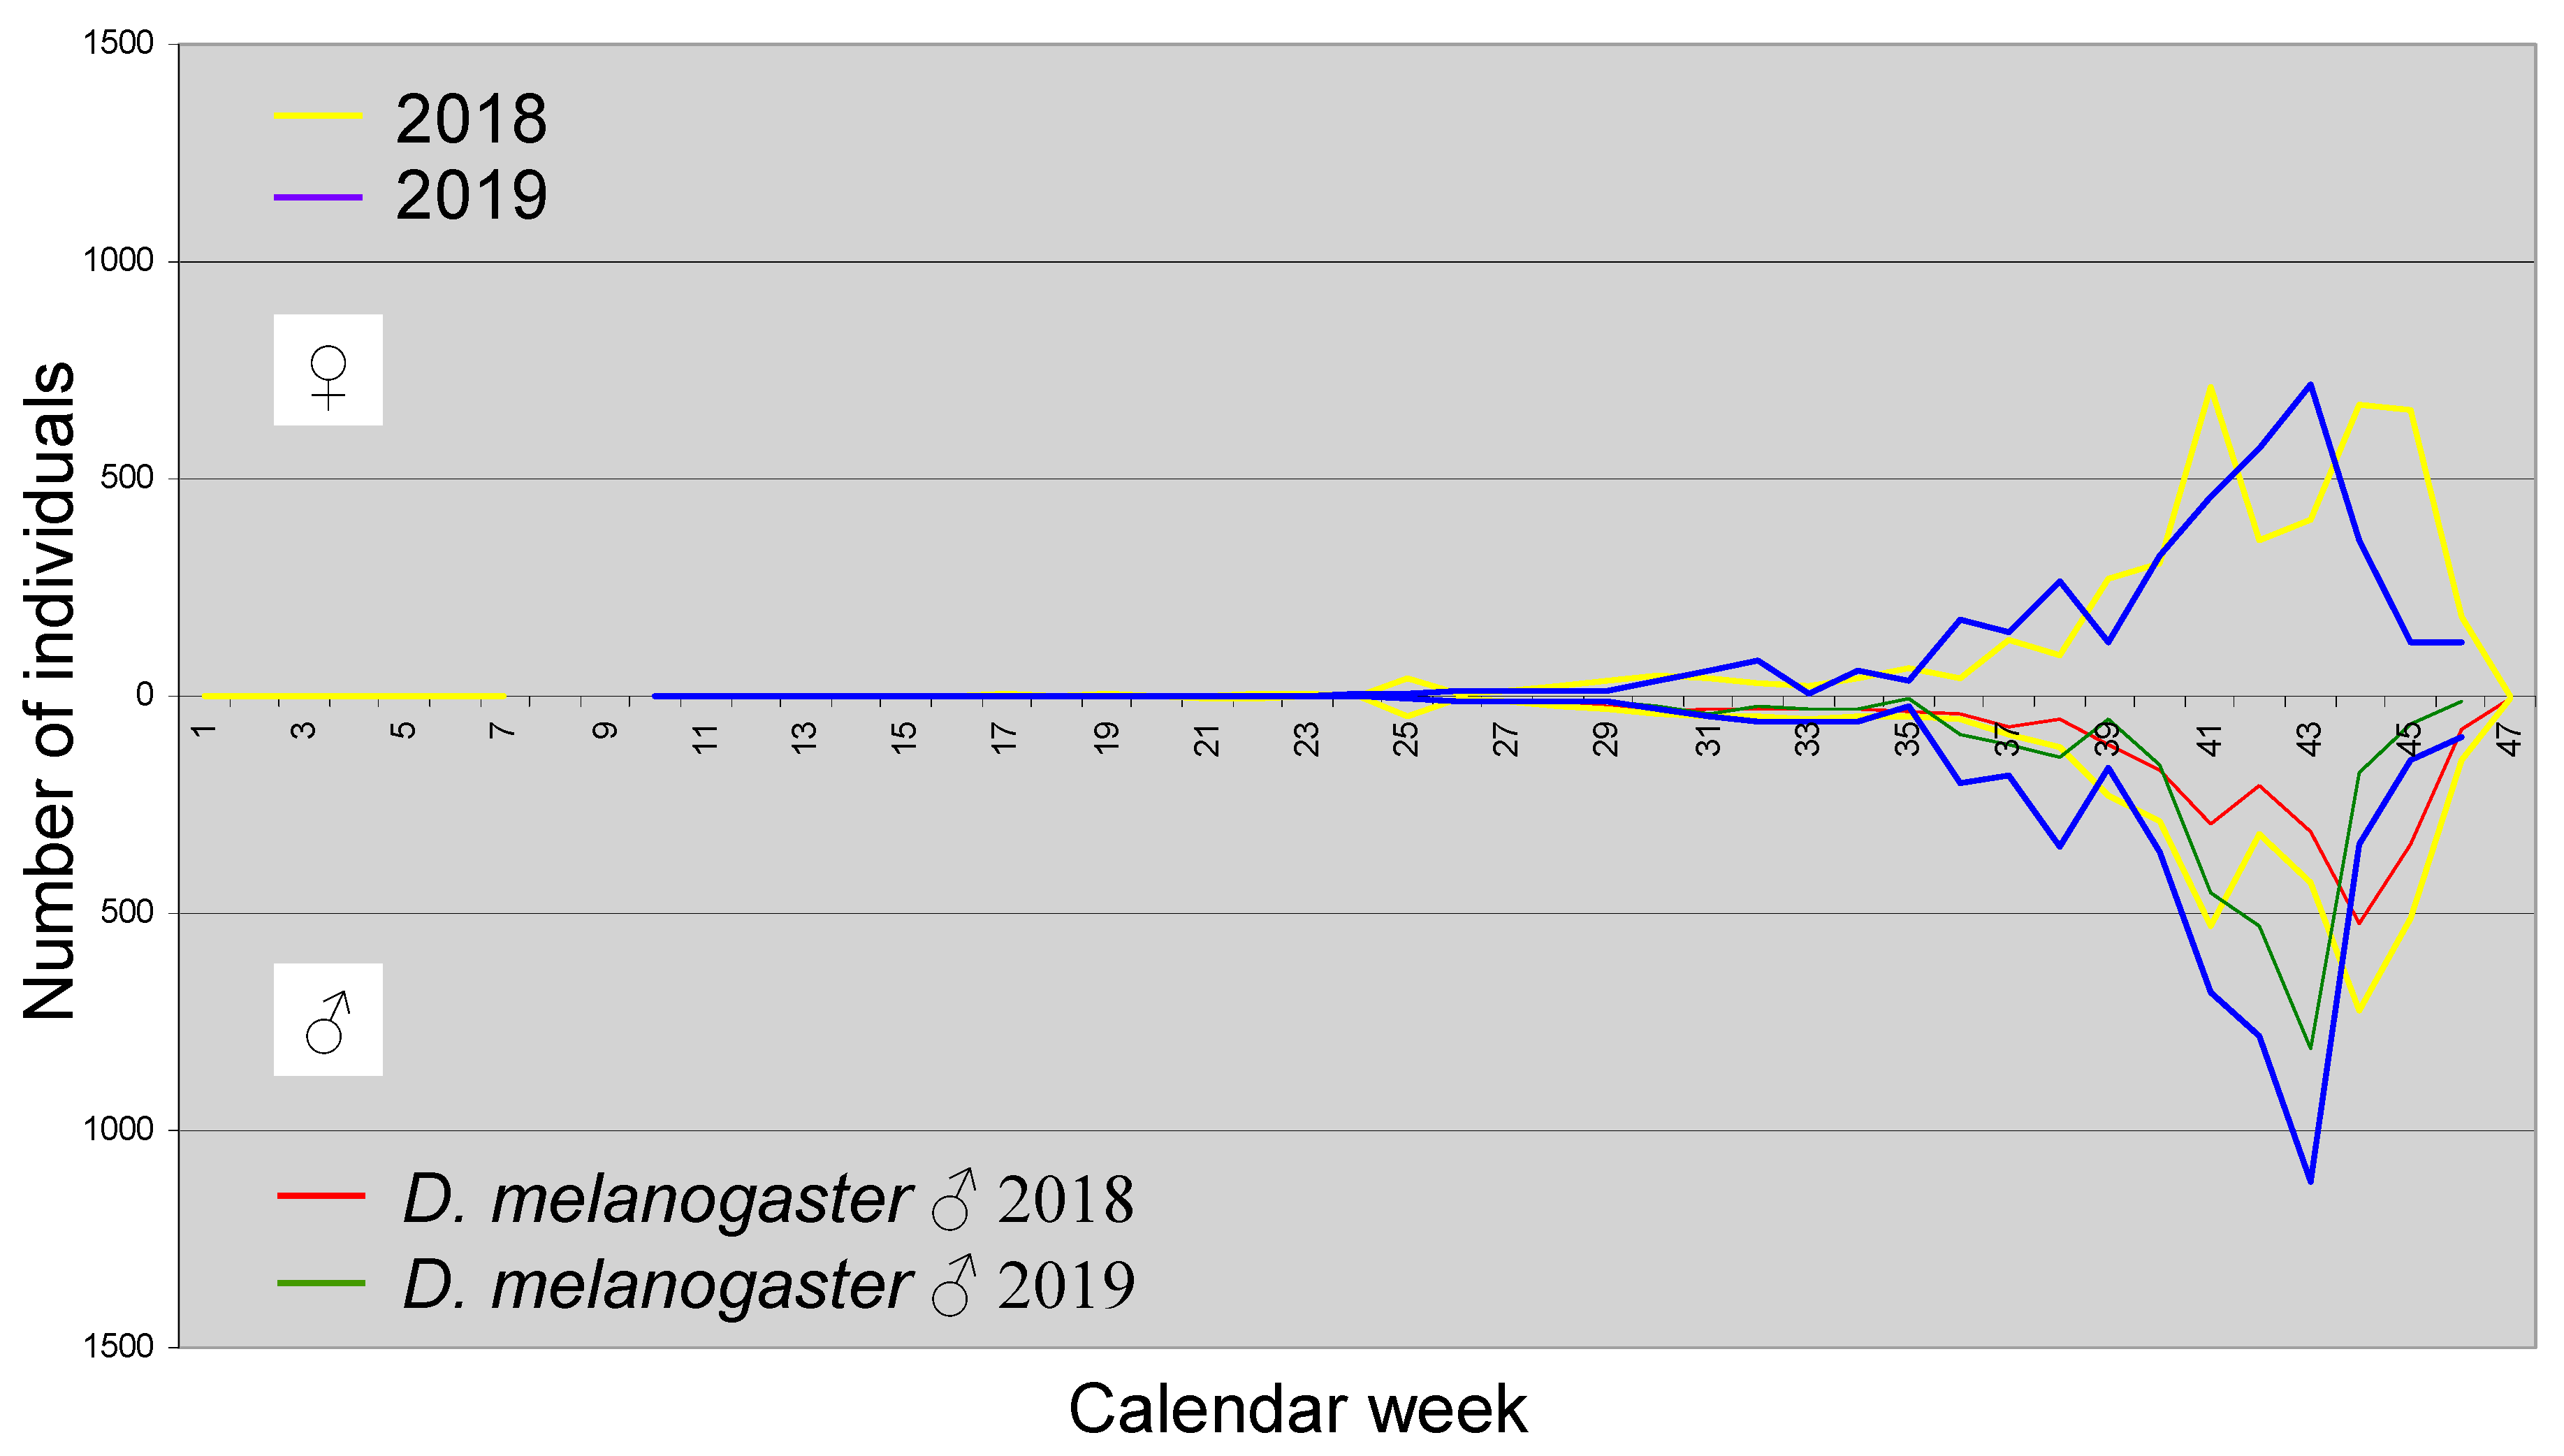
Figure 9.
Scatterplots showing the influence of habitat on the males of D. simulans and D. melanogaster.
Figure 9.
Scatterplots showing the influence of habitat on the males of D. simulans and D. melanogaster.
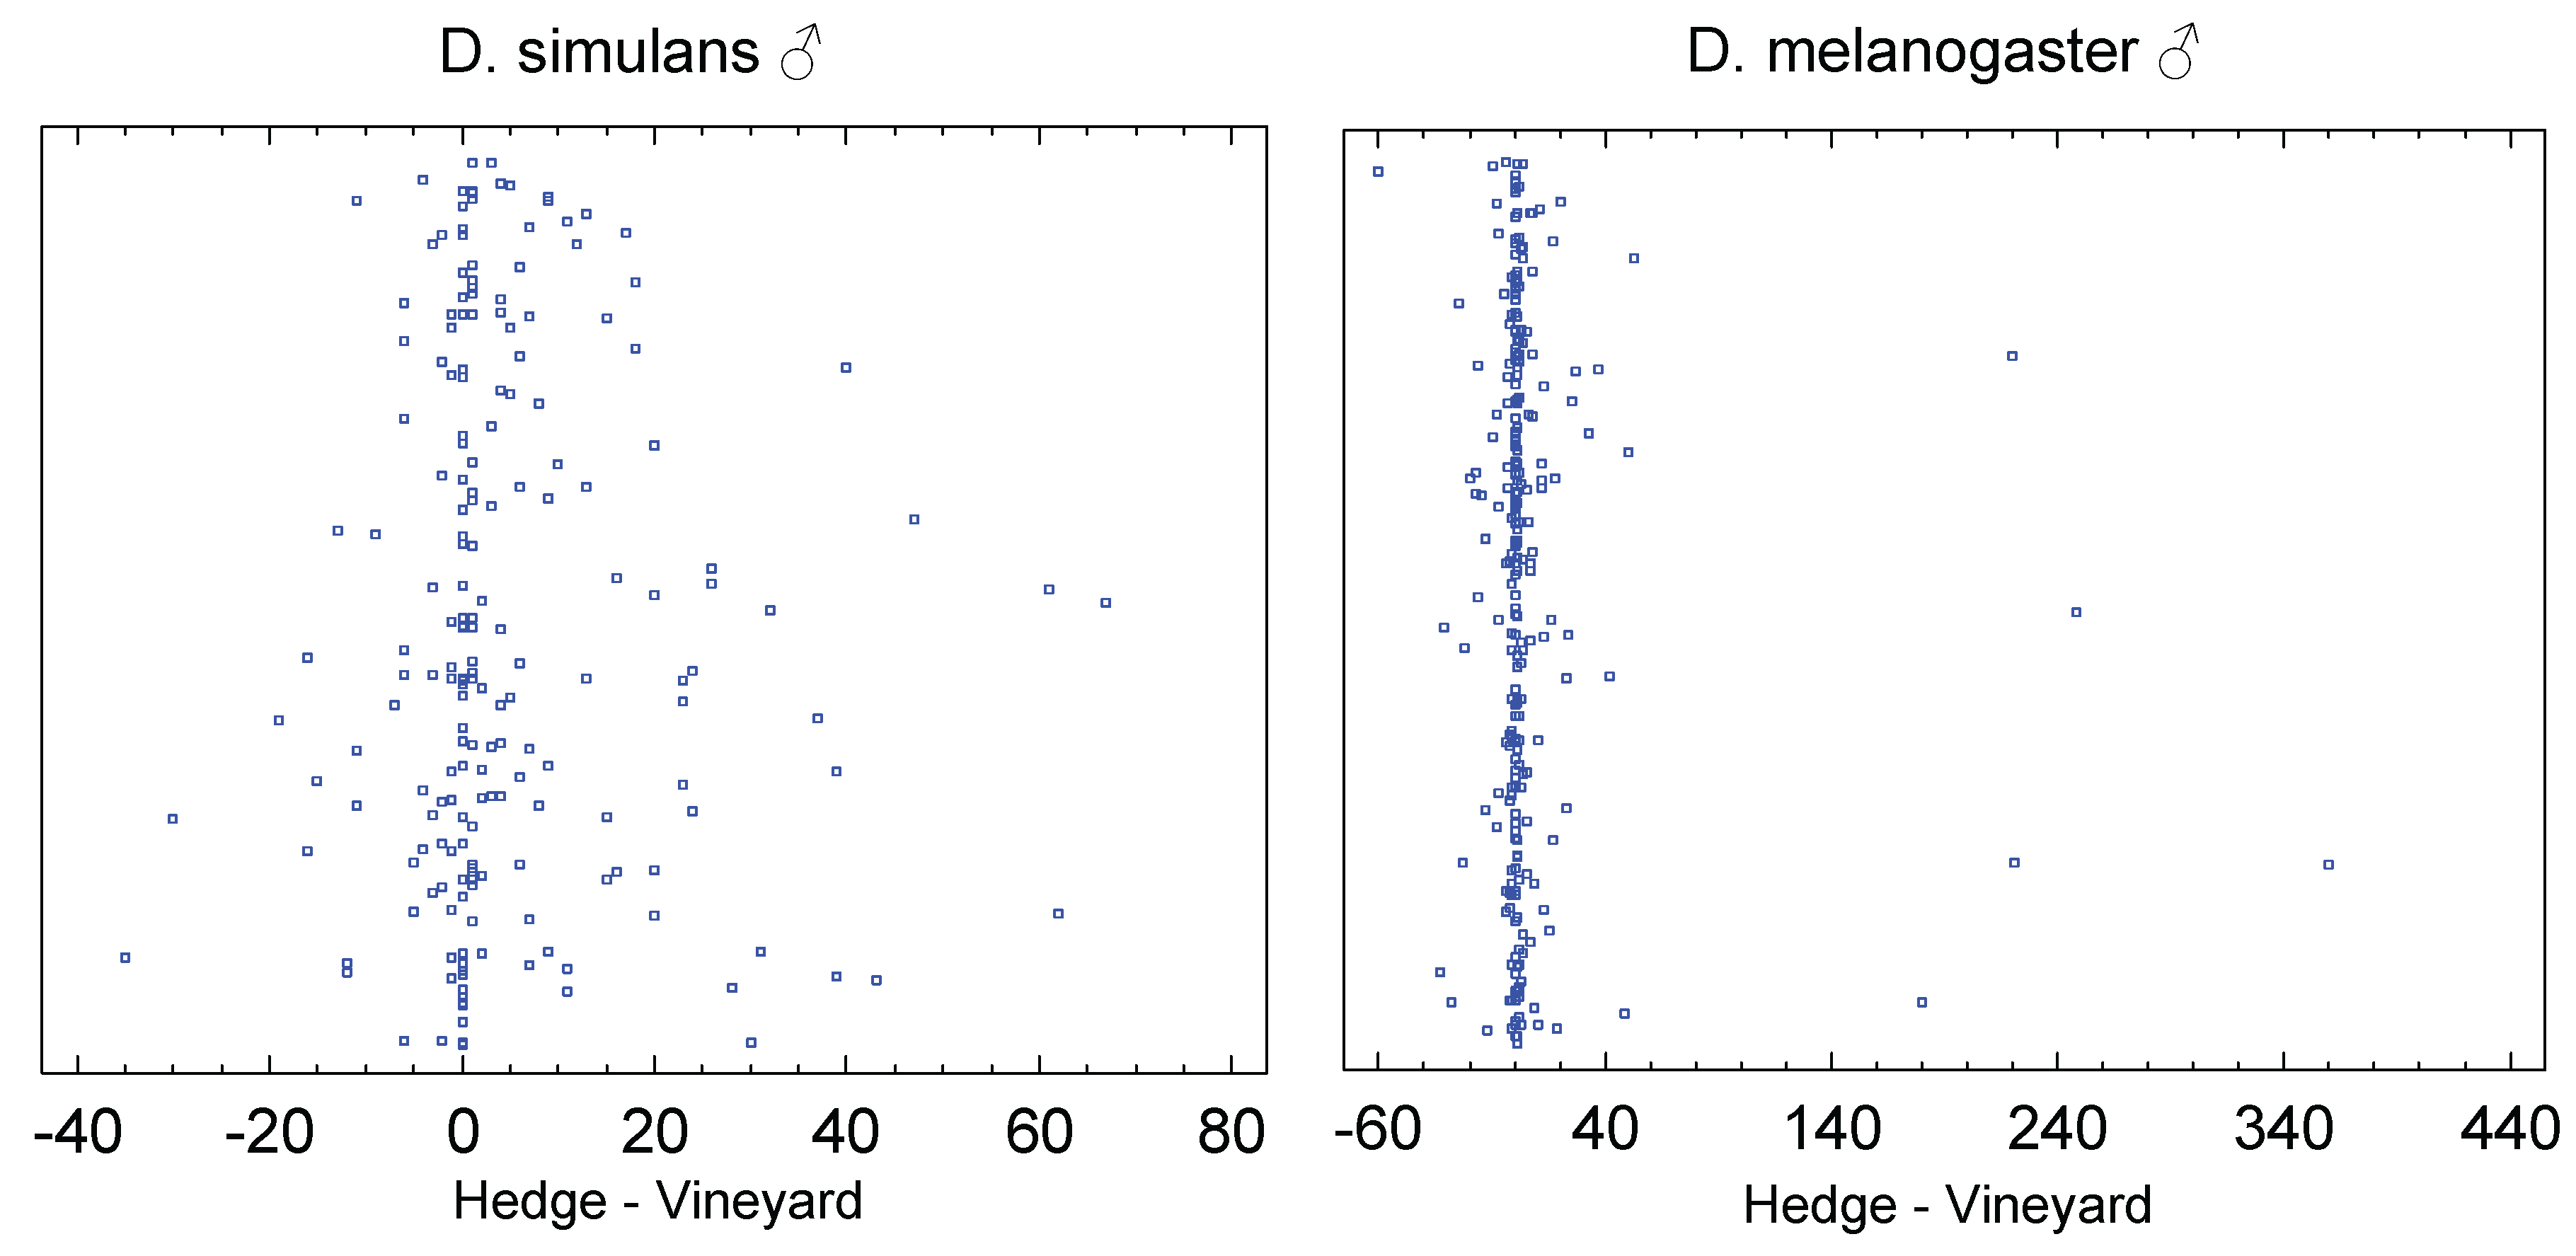
Figure 10.
Population development of D. subobscura over the course of the year (with an interruption in collection for a few weeks in late winter 2018 and for the whole winter in 2019).
Figure 10.
Population development of D. subobscura over the course of the year (with an interruption in collection for a few weeks in late winter 2018 and for the whole winter in 2019).
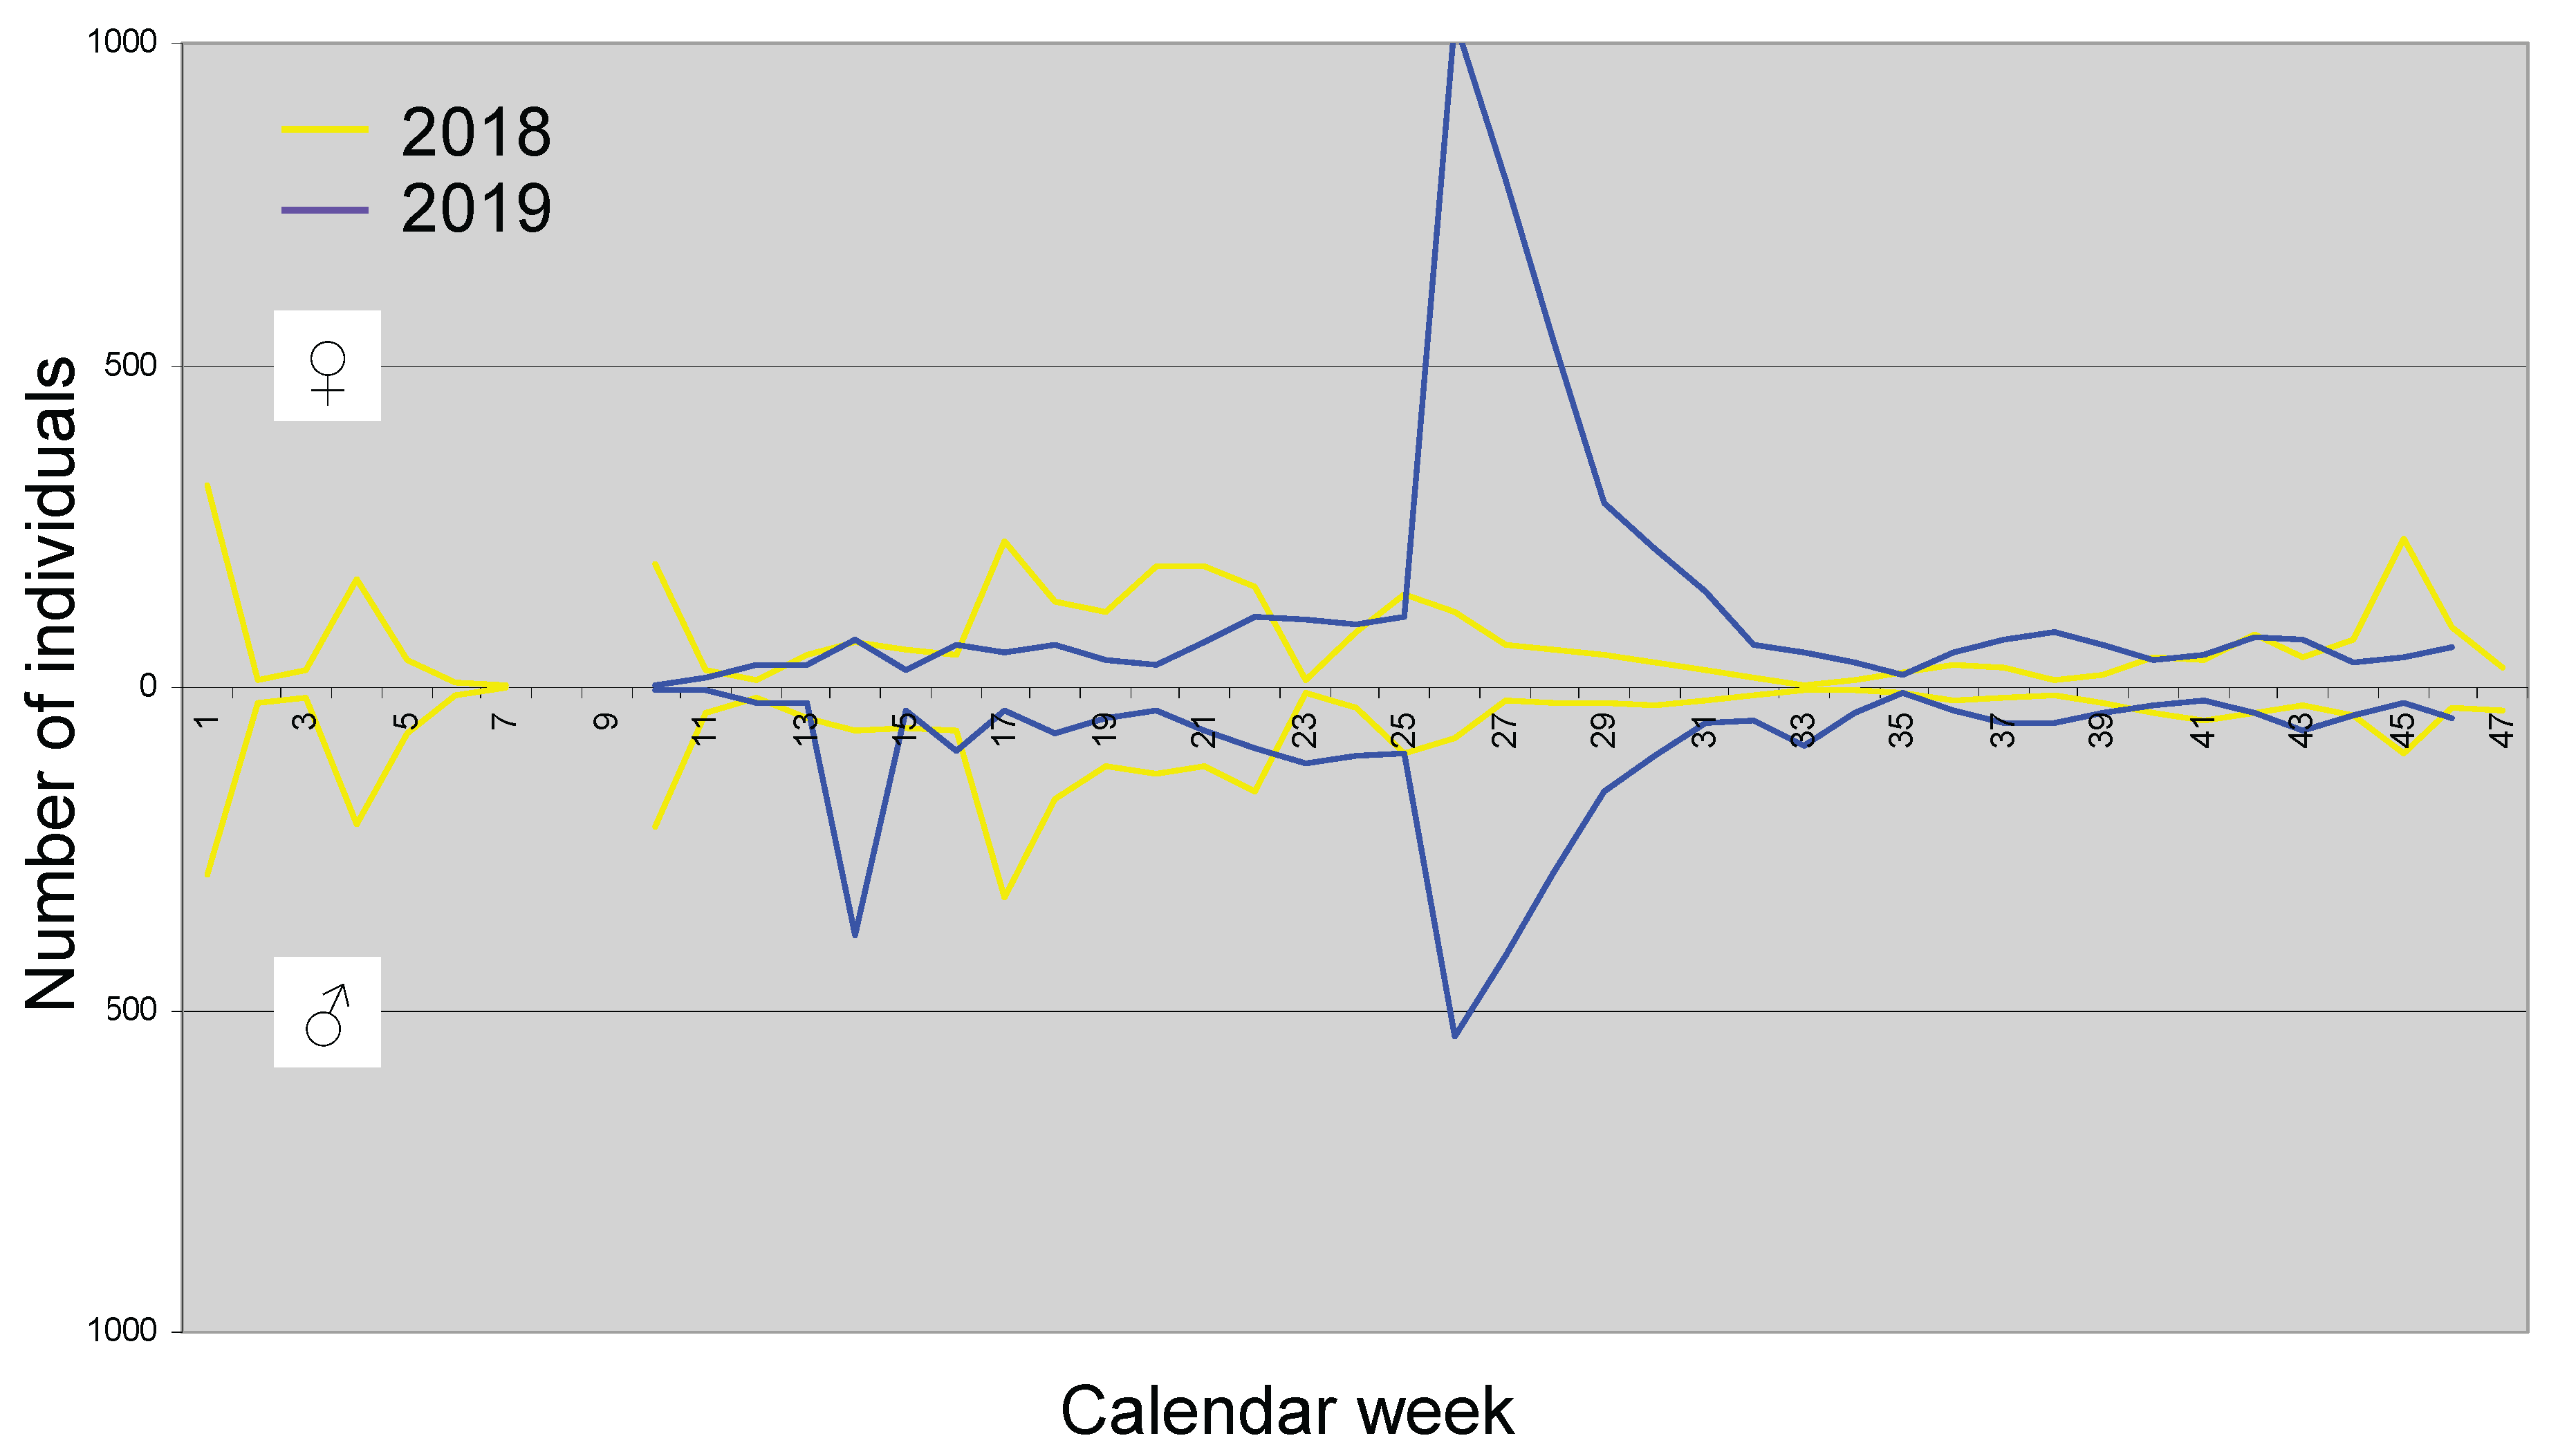
Figure 11.
Scatterplots showing the influence of habitat and exposure on D. phalerata.
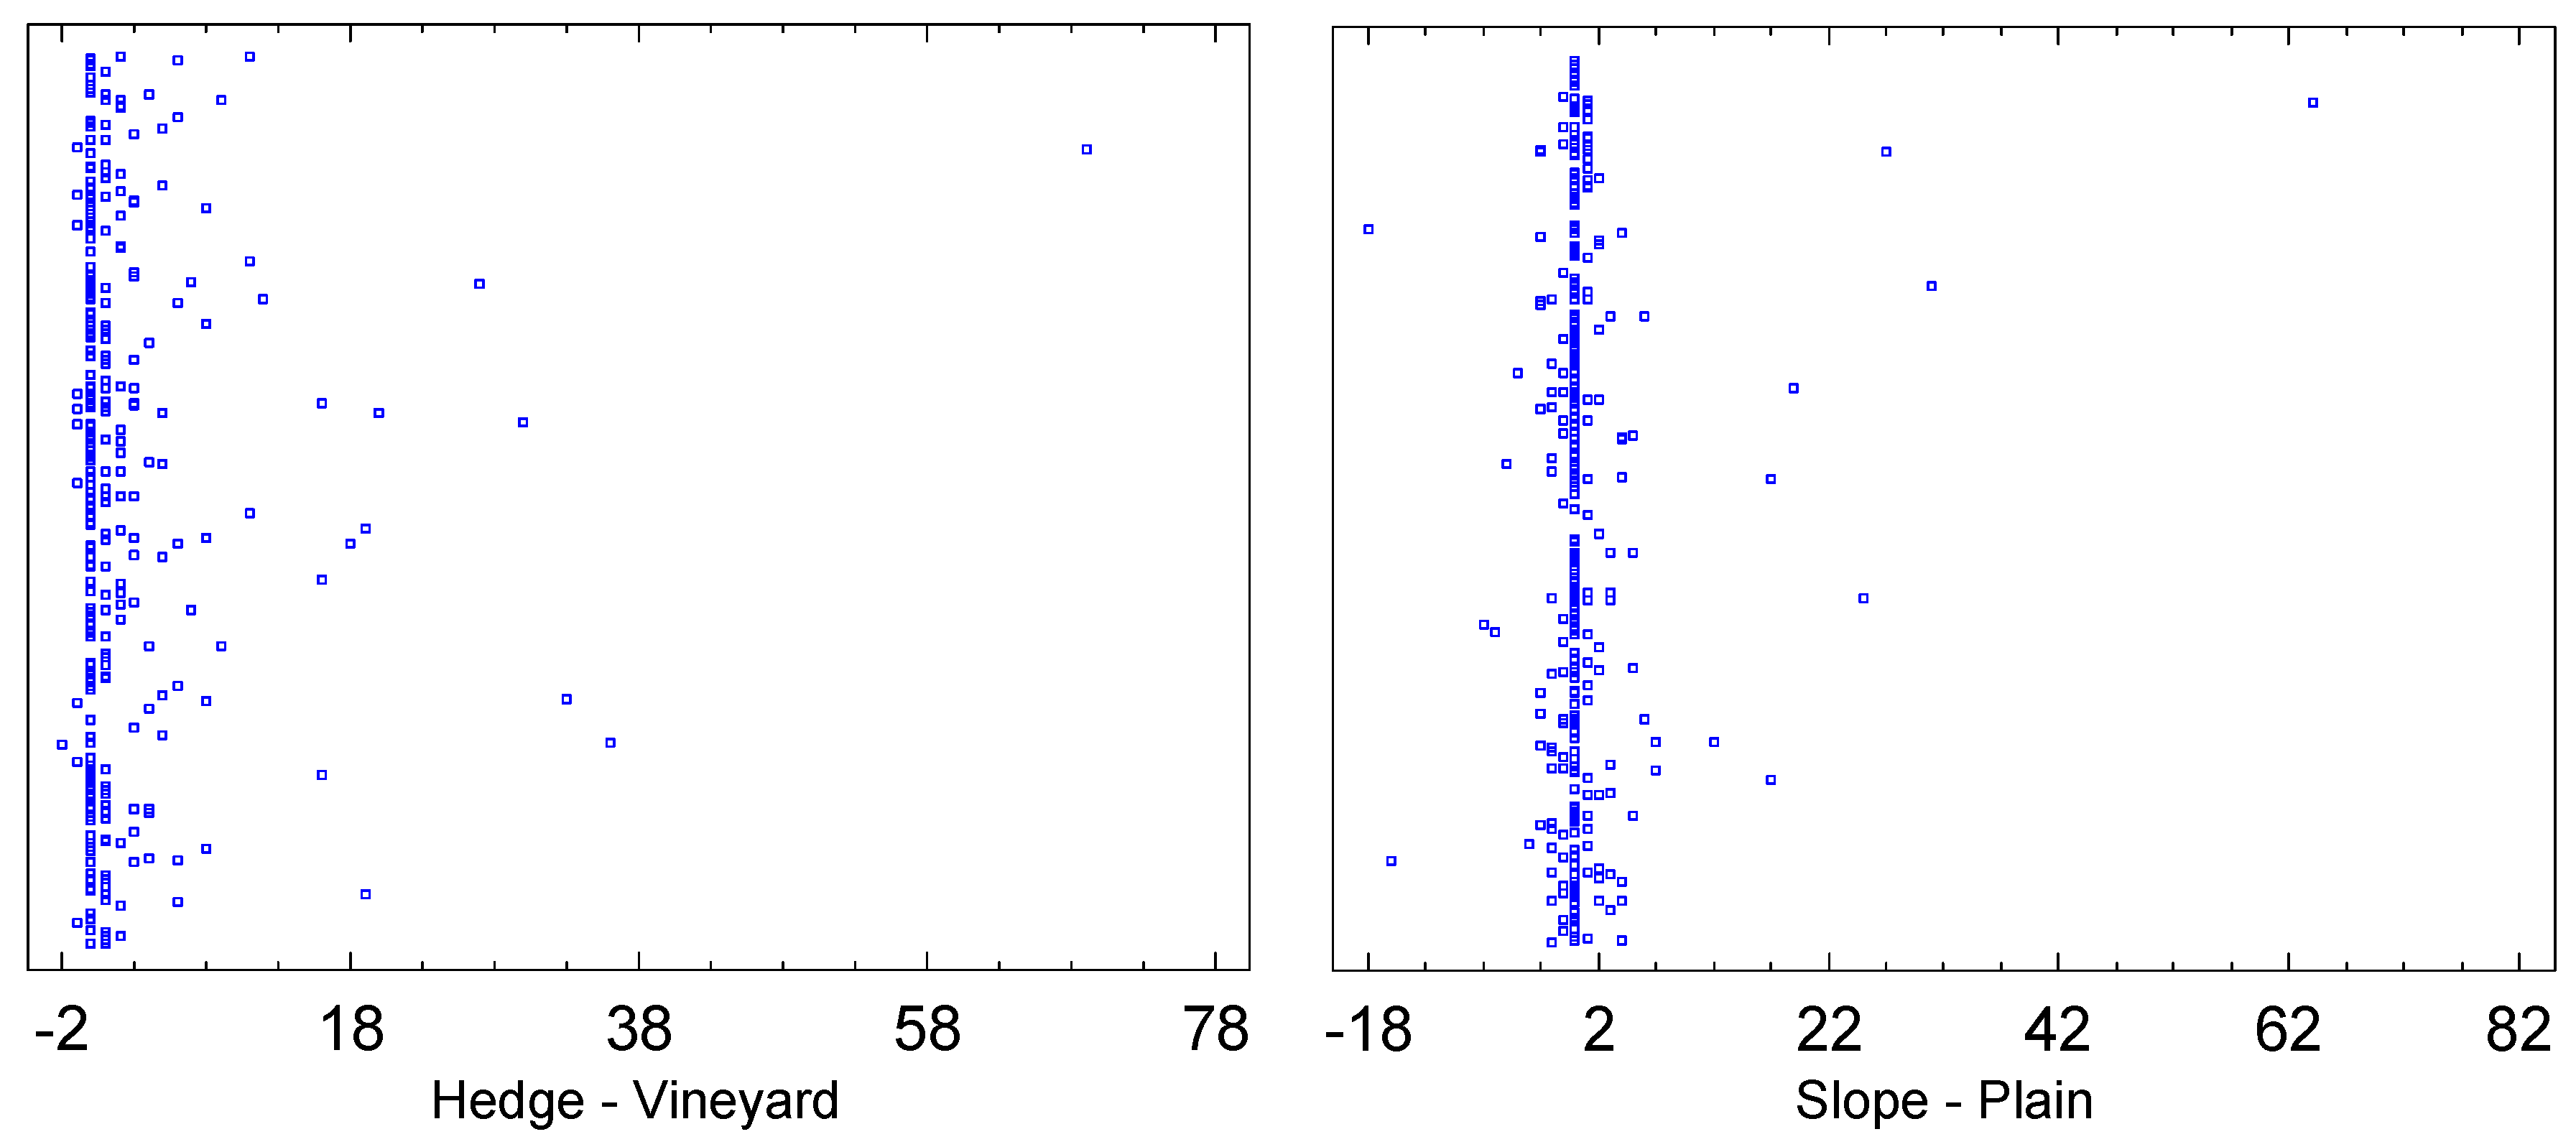
Table 1.
Sampling sites, their designations, GPS coordinates, and elevation above sea level.
 |
Disclaimer/Publisher’s Note: The statements, opinions and data contained in all publications are solely those of the individual author(s) and contributor(s) and not of MDPI and/or the editor(s). MDPI and/or the editor(s) disclaim responsibility for any injury to people or property resulting from any ideas, methods, instructions or products referred to in the content. |
© 2025 by the authors. Licensee MDPI, Basel, Switzerland. This article is an open access article distributed under the terms and conditions of the Creative Commons Attribution (CC BY) license (http://creativecommons.org/licenses/by/4.0/).
Copyright: This open access article is published under a Creative Commons CC BY 4.0 license, which permit the free download, distribution, and reuse, provided that the author and preprint are cited in any reuse.


