
Submitted:
17 June 2025
Posted:
18 June 2025
You are already at the latest version
Abstract
Remote sensing underpins significant twenty-first century technical capabilities and innovations. Thus, understanding the technical expertise and financial drivers of the field are of national and international importance, as they are inextricably linked with intellectual property generation. Using 126,479 peer-reviewed, journal papers and their affiliated funder information from 2 major publication databases, this study benchmarks current practices, documents historical shifts, and identifies emerging directions in the remote sensing industry and academic publishing. In 70 years, the field has gone from producing barely a dozen scholarly papers a year to more than 13,000 annually without an equivalent growth in publication venues but with a jump in the mean number of authors from 3 to 5 in less than 25 years. The largest contributor (research and funding) is China, which rapidly ascended since 2000 to now dominate the field with a near majority stake. China’s dominance of 47% of all remote sensing journal papers worldwide is mirrored in affiliated patents.
Keywords:
remote sensing
; photogrammetry
; journal papers
; patents
; trends
1. Introduction
From driverless vehicles to space exploration, the concept of remote sensing as a form of automated, non-contact documentation intersects nearly every field of study. In 2022, it was a $452 billion global market and expected to grow to $681 in 2025 and $1.44 trillion by 2030 [1]. The market has been driven by the trifecta of trends of hardware miniaturization, increasing affordability, improved positioning, and greater data integration opportunities. Like many other fields, the affiliated technical breakthroughs and subsequent adoptions have not been uniform across the globe. While this is seen anecdotally, neither their evolution nor their likely future trajectory has been jointly studied to establish the rate and growth distribution over the decades. To help establish such trends and to create a baseline for future monitoring, this paper uses academic journal publications as a proxy to illustrate the current state of practice and historical changes over the past 72 years, as well as patterns in intellectual property generation. Establishing current research productivity and identifying the affiliated funding may provide strong indicators for subsequent commercial dominance in the remote sensing field and other fields for which remote sensing data underpins capabilities in augmented reality, autonomous navigation, and digital twins.
2. Background
While the term “remote sensing” enters the lexicon through a patent in 1958 [2] today’s understanding of the word includes both older and newer techniques. Presently, the concept encompasses approaches as old as bathymetry (which dates back to the late 19th century) [3], photogrammetry in regard to land surveying in 1906 [4], and thermal imagery with respect to land characterization in 1934 [5]. The term is also regularly employed when discussing multispectral imaging starting in the late 1960s [6,7] and satellite imagery in 1970 [8,9]. While there is a general understanding that remote sensing sensors, data, and platforms continue to grow in availability, influence, and applications. To date, quantification of that impact has been predominantly domain specific [10,11]. A notable exception is the detailed work by Zhuang et al. [12] of all remote sensing papers for the years 1991-2010 [12] and that by Zhang et al. [13], which primarily considered papers published in the MDPI journal Remote Sensing.
The paper herein aims to take a more inclusive approach to this documentation in an effort to both provide baseline information that predates 1991 to more recent years and to determine critical trends and drivers through examination of the peer-reviewed literature, in addition to those that have been previously identified by Zhuang et al. [12]. A comparison of findings is provided in the Discussion section.
3. Methodology
This paper analyzes peer-reviewed journal publications related to remote sensing over the period 1961-2023. The publications indexed in the online resource Engineering Village [14] were examined for author affiliation by country and attributed national funding. Further investigation considered journal availability and the publication trends of selected journals for the same time period including trends in authorship. The study scope was selected to commence in 1961 as prior to this year (1) there was a paucity of publications (as will be described in the results) and (2) digital access to papers prior to this period appeared to be highly limited and inconsistent.
3.1. Data Sources
The online platform Engineering Village [14] jointly hosts two sub-databases: Compendex [15] and Inspec [15]. According to the website, Compendx includes information about individual journal and conference papers, as well as dissertations, standards, books, and some preprints and are sourced from science and engineering publishers and professional societies such as the Institute of Electrical and Electronics Engineers (IEEE), the American Society of Mechanical Engineers (ASME), the Society of Automotive Engineers (SAE) and the Association for Computing Machinery (ACM) [15]. In contrast, Inspec was created by The Institution of Engineering and Technology (IET) with the narrower focus of publications related to Physics, Electrical Engineering and Electronics, Computers and Control, and Information Technology [15].
Within Engineering Village (EV), the two sub-databases can be queried separately or jointly. Problematically, the metadata of the two databases are not identical (see Appendix A Table A1) and neither was found to be consistently populated. Thus, multiple searching strategies were devised to both find the entries and then identify and remove duplicates, while retaining the most complete metadata possible. At the time the data were initially queried, Engineering Village did not offer an automated means for duplication removal. Today, while that feature is available, when tested, the “automatically removed” duplicates were only a fraction of 90% duplication identified manually by the research team. The team’s original query returned 247,145 records. After removing duplicates, the final data set included 126,479 records.
3.2. Attribute Harmonization
Within EV, selective attributes for all entries are visible in the sidebar. These include country of origin and funder. For these two attributes, the numbers reported herein were taken directly by the selected time period, with a focus on the top 10 producers and top 10 funder sponsors for each decade. However, in the top group of sponsors, California Institute of Technology (US) appeared in 1981-1990 and the National Eye Research Center (UK) in the periods 1981-1990 and 1991-2000. As these are more institutions than funders, they are excluded as top funders and replaced with the next highest ranked entity. or the period 1981-1990, the European Space Agency and the National Oceanic and Atmospheric Administration were substituted. For the period 1991-2000, the Agenzia Spaziale Italiana was substituted.
3.3. Cleaning
For other characteristics reported, the relevant entries were downloaded and examined. However, within EV the maximum downloadable entries per query is limited to 5,000 records. Thus, a comprehensive filtering strategy was needed to find all entries that contained either the term “remote sensing” and/or “photogrammetry”. The first step in the filtering strategy employed a list of all system generated journal titles that appeared in the EV sidebar for the entire study period. This involved querying for the two controlled vocabulary terms and restricting the query to only journal articles. The resulting list included the titles of all journals that published at least one paper in which the controlled vocabulary term of “remote sensing” or “photogrammetry” appeared.
As one of the goals of the research herein was to understand publishing trends within that field, that initial list of journal titles was culled to retain only journals whose primary focus was remote sensing or photogrammetry (Appendix B); this strategy followed that previously adopted by Zhuang et al. (2013) [12] which showed that the top 20 journals contained 86% of all relevant publications. Herein, 72 journals were selected based on their stated aims (Appendix B Table B1). Queries were then made by journal title for each year 1961-2023. This was done in a joint search of Compendex and Inspec. Notably, the “language of publication” was not considered, although the vast majority of records (both current and historical are in English).
The query results were then manually inspected to create a master file per journal per decade that strove to remove duplicates and have complete metadata for the remaining records. Duplicate records exist in two forms: (1) those appearing in both the Compendex and Inspec databases, and (2) records appearing under different abbreviations of a single journal’s name. When a DOI number was available (starting in 2000), the DOI was the primary means for identifying duplicates, and verifications were done through article titles as a secondary measure. If a DOI was unavailable, titles were used as the sole means for identifying and removing duplicates. As part of this, journal names were standardized manually to reduce querying errors. The total number of authors per article was manually extracted by the research team.
The original, downloaded data contained more than 30 attributes per article (see Appendix A Table A1). The study herein employed the fields Title, Author, Source, DOI, and Database. The Publication Year field was not included due to a large number of missing values. Instead, the field was manually populated based on the querying per year results. While this may appear circular in nature, the system appears to have used record metadata that was not downloadable.
4. Results
This section examines the growth in papers, journals, and the geographic spread of remote sensing scholarship. Changes in funders and national dominance are then examined. Finally, trends in authorships and the number of publications per journal are considered.
4.1. Publication Growth
Table 1 shows a breakdown across the 7 periods [(6 with 10 years each and the seventh with only 3 years (2021-2023)]. The reported values show an exponential growth in papers per period (R2 = .96) with less than 15 papers per year in the period 1961-1970 to 13,456 per year in the period 2021-2023. This near thousand-fold increase in papers is unattributable to a growth in journals dedicated to remote sensing/photogrammetry, which only increased from 9 in the years 1961-1970 to 43 dedicated in the 2011-2023 period. Likely drivers are explored in this paper’s Discussion section.
The period from 2011-2020 saw more than a tripling of published remote sensing papers. A similar rise is seen for the next period, but with almost a further tripling in only 3 years. As the data for 2021 to 2023 only includes 12 quarters, rather than a full forty quarters for the decade; an exponential fitting through the first 12 periods produced an R-squared value of 0.96, which would imply a more than 10-fold increase for the full period 2021-2030.
4.2. Journal Publishing Trends
As noted in Table 1 and shown in Figure 1, the overall number of papers per journal has increased over time. A critical part of this is the significant growth in the number of papers being published per journal. Despite some fluctuations in the lower boundaries of the number of papers published by each journal, the upper boundaries continue to surpass those of previous periods, with some journals publishing thousands of papers per year. For further insight as to the distribution of papers across remote sensing and photogrammetry journals, the reader is referred to Zhang et al. (2019) [13] for a per publication analysis.
4.3. Authorship Trends
Not only has the number of papers per year grown but so has the number of affiliated authors showing a tendency for more collaborations on a single paper. As shown in Figure 2, the average number of authors per paper rose from 2 in the 1970s to 5 by 2020, with a clear trend toward approaching 6 authors per paper in the coming years. This group collaboration approach may be a major factor in the proliferation of publications.
Another aspect of this, is that the maximum number of authors on a single have also increased, with only 6 in 1961-1970, then 12 in 1971-1980, to 29 in 1981-1990. Both of the next two periods had a near doubling of the 1981-1990 value with 55 in 1991-2001 and 53 in 2001-2010. This then leaped to 99 in 2011-2020 and further rose to 118 in 2021-2023; these surprisingly high contribution lists were manually checked for correctness. Figure 2 shows a shift in how research in this field is being conducted that may be contributing to this high growth of papers. Specifically, despite the continued presence of single-author papers in each period, there is a clear shift in the research landscape to large-scale collaborations, leading to an overall increase in co-authorship.
4.4. Geographic Scholarship Distributions
Some of the growth in publications may be attributed to more global participation. Figure 3 shows scholarly contributions in the period 1961-1980 in North America, Russia, India, Australia, Brazil, and much of Western Europe. Over the next 20 years, there was more participation from countries in Eastern Europe, South America, Southeast Asia, the Middle East, and Africa (especially in Northern Africa). By 2020, nearly all countries were producing at least occasional remote sensing scholarship, with a final dozen publishing for the first time in the years 2021-2023. While Figure 3 shows when remote sensing scholarship began in each of these countries, the current and previous level of scholarship is not reflected. That information is shown by period in Figure 1 by the overall volume of papers.
4.5. National Production Trends
To understand the initial and evolving dominance in remote sensing, Figure 4 shows for each decadal period the percentage of papers from the top 10 contributing countries. From 1961-1970, 100% of all papers came from only 6 countries: 2 in North America; 3 in Europe, and Israel. The next decade shows a broadening of participation with Japan, the USSR, Australia, and India appearing in the top 10 producers, who now only accounted for 91.39% of that decade’s publications. In the first two decades, the US dominated – accounting for the majority of publications with overwhelming percentages (88% in the period 1961-70 and 70% in the period 1971-1980) 4(a) 4(b). Over the years 1981-1990, while the US still produced more than 50% of the publications created by the top 10 producers, other countries increased their percentages, and the USSR moved to second place with 9%, with all other countries remaining at the same level or growing slightly 4(c). Notably, only 13.80% of the papers in this period were published by other countries 4(c). Broader participation grows significantly over the next 33 years (peaking at 25.4% in the period 2011-2020 4(f). In the period 1991-2000, the US contribution dropped to 48% of those published by the top 10 producers, and the UK was second with 8% 4(d). With the dissolution of the USSR in 1991, Russia is reported at only 5%.
In this period, for the very first time, China appears in the top 10 producers with nearly 4% (the same as India), and Australia drops out of the top 10. Arguably, the next decade showed the greatest change. Over the years 2001-2010 4(e), the US dropped to only 36%, and China jumped up to 23% of the publications. Additionally, Spain pushed Russia out of the top 10 in publishing, and the contributions of the top 10 countries slipped to 77.10%. China’s ascendency continued in the period 2011-2020 to 44% 4(f), and for the first time pushed the US out of the top spot (dropping to 21%).
In the period 2011-2020, for the first time, the top 10 contributing countries represent less than three-quarters of the publications 4. That trend slightly reverses in the years 2021-23, in part as a function of China’s growing dominance in remote sensing publishing. Specifically, China now accounts for 62% of the publications from the top 10 contributing national contributors and almost half (47%) of all papers produced in the years 2021-2023. This shows a complete reversal of the US’s preeminence in the first 30 years of this study 4(g). In fact, over 60 years the US dropped from producing 88% of all publications in the period 1961-1970 to only 9.29% (12% of those from the top 10 countries) in the years 2021-2023.
4.6. National Funding Trends
To investigate drivers of this major geopolitical shift in publishing, Figure 6 shows the top 10 funders in each period starting in 1981; prior to this funder information is not available. From 1981-2023, there are 18 unique funding entities: US (6), UK (2), China (6), Canada (1), Europe (3), and Italy (1). Notably there is not a one-to-one correlation between funders in Figure 5 and countries in Figure 4, as several countries have multiple organizations appearing in the top funder group. However, there is clearly a trend of dominance in publishing aligning with the number of national funding agencies. Specifically, while the US has 6 named funders in the period 1981-1990, over the next 30 years, this drops to 2 named funders starting in the period 2011-2020. Conversely, China first appears in the top 10 producers in the period 2001-2010 with 2 funders, but grows to 6 funders in the next decade, and is currently at 5.
Consistent with the distribution of publications by country, before 2001 the US was the most frequently cited funder for remote sensing and photogrammetry research, with the National Aeronautics and Space Administration (NASA) accounting for around 50% of the funding affiliation. This was followed by America’s National Science Foundation (NSF), which was acknowledged in approximately 10% of the papers. From 2001 to 2010, funding distribution began to diversify, with broader contributions from countries and regions, including China, Canada, Europe, and the UK. However, from 2011 to 2020, there was a dramatic increase in funding from China. In fact, in this period the National Natural Science Foundation of China (NNSF) surpassed NASA to become the top affiliated funder. In this period of 2011-2020, China was affiliated with 40% of all remote sensing papers, while the US was only affiliated with 10.8%. This trend vastly intensified in the period 2021-2023 with 53.8% of the papers having Chinese affiliation and the US only having affiliations with 5% of all remote sensing papers.
Since obtaining and normalizing the impact of each grant by funding level is not feasible, the frequency of attribution was plotted against the number of acknowledged funding agencies from each country for each period, as shown in Figure 6. For this, the number of funders per country was aggregated and averaged over each study period. For example, in the period 2011–2020, the top ten selected funders accounted for 53.83% of all publications. China had 6 funding agencies who were acknowledged in 74% 4(d) of the publications produced by the top 10 nations (thus the actual affiliations represented 39.83% across all nations). This weighted value is then plotted against the average number of funders from that country over that period (typically 10 years). Overall, the R-squared value is 0.833. When only a single country is considered, fitting values rise to 0.966 for China and 0.990 for the US. The near one-to-one ratio of funding to publications for China is probably slightly lagging given the large acceleration in funding in remote sensing in recent years.
5. Discussion
5.1. Contributions
This paper provides a quantifiable analysis of publishing trends in remote sensing, which is important as it both establishes a set of measurable benchmarks for the industry and enables a verifiable means to look at what would otherwise be anecdotal considerations. For example, a scholar might in their own personal experience observe a rise in certain ethnic names, specific institutions, or even country affiliations in recent manuscript reviews, submitted papers, or current reading. However, this would be insufficient to determine (1) whether or not this was true, (2) the extent of the trend, and (3) other potentially contributing factors. Through a multi-decadal analysis of 126,479 journal papers having either the term “remote sensing” or “photogrammetry” appearing in 72 journals devoted to those fields, a definitive baseline has now been established. The largest trends relate to a rapid proliferation of papers and a complete participatory inversion of scholarly participation by the United States and China.
This paper also establishes (in some places and further confirms in others) trends within the publishing industry related to remote sensing including (1) a greater global participation in scholarly publications, (2) the rate of publication growth overall and per journal, (3) the rate of growth in the number of authors per publication, and (4) the relationship between funding availability and publications at a national level.
5.2. Growth in Publications
The data presented herein demonstrated an exponential growth in papers over the period 1961-2023. A similar exponential trend was reported by Zhang et al. (2019) [13] for the years 2009-2017, which is much faster than for scholarly papers overall, according to the Science and Engineering Indicators report from the US NSF, which shows 12.1 million publications in 2003 versus only 33 million in 2023 [16].
There are five readily identifiable drivers for the two orders of magnitude growth in annual remote sensing papers in academic journals. The first is the expansion of funders and greater global participation. This can be most easily seen in Figure 1 as the total number of countries contributing to paper generation significantly expands. Figure 1 documents the first period in which a country publishes a remote sensing or photogrammetry paper but does not indicate their relative contribution to the total publication count or changes in geopolitical conditions (e.g. the dissolution of the USSR). Over the past quarter century, there has been a great expansion of remote sensing research across the global south (see Figure 1). This may be attributable to the second driver, which is the decreased cost and greater accessibility of easy-to-use sensors [e.g. the Velodyne puck [17] and remote sensing platforms (e.g. rotary drones) [18,19].
The third driver is a move across the entire academic publishing industry away from physical publishing to “virtual only” issues, which freed journals from publisher-mandated maximum annual page counts for journal, thereby no longer restricting a journal to a specific number of articles or pages per issue or per calendar year. This change in publishing has also greatly truncated the submission-to-publication cycle, as previously noted by Zhang et al. (2019) [13] looking at the publishing period 2009-2018.
Fourthly, there has been a large expansion of countries that have undertaken and openly published national aerial laser scanning scans, a trend first noted in 2015 [20] and most recently seen in the completion of the United States’ first national scan [21].
The final (and potentially largest) impact on article growth is the adoption of artificial intelligence (AI) in remote sensing research [both machine learning (ML) and deep learning (DL)]. Without considering the potential impact of ChatGPT [22] and other tools that generate content, both ML and DL have enabled a wave of publications, because scholarship can be done without the production of new raw data and the affiliated time and cost of conducting those experiment. This can be achieved either through more effective data reuse or through the generation of synthetic data. Figure 7 shows explicitly the rise in remote sensing papers using the term ML and/or DL each year.
This is trend is also visible in the rise of words like deep learning, and convolutional neural nets in the past 13 years, as shown in the comparative word clouds in Figure 8 where terms like convolutional neural network, as well as machine learning and deep learning gain prominence.
6. Funding, Papers, and Resulting Patents
As early as 2013, China’s coming ascendency in remote sensing was noted in a study covering the 20 years 1991-2010, where Zhuang et al. (2013) [12] ranked China as the second highest cumulative contributor across that period. In that publication, the rapid rise in prominence was attributed to China’s satellite program. While the term “satellite” appears prominently in Figure 8a for the years 1991-2000, its importance greatly decreases in all subsequent periods. Thus, China’s further dominance in scholarly works in remote sensing and photogrammetry must be ascribed to other factors, such as research funding availability shown in Figure 4, Figure 5 and Figure 6. Notably, for the period 2009-2018 Zhang et al. (2019) [13] ranked the 50 institutions producing the largest number of remote sensing papers. Of those 19 were Chinese, and China held the top 4 spots (2 universities and 2 governmental agencies).
The impact of remote sensing research funding is readily mirrored in the filing of patents. Using Google’s worldwide patent search for each of the 7 sub-periods studied herein, the total and annual numbers are shown in Table 1, while Figure 9 shows the percentage of patents filed by the top 19 patent filers in each period clustered by national origin. Figure 9 strongly reflects the radical reversal of the US’s dominance through the end of the 20th century to the extremely rapid rise of China in less than a quarter of a decade.
The importance of such observations are their implications for national prosperity. The use of patents as proxy for predicting gross domestic product (GDP) is a long-established process that has been employed for more than 35 years [23] (Glismann and Horn, 1988) and is actively used today [24,25] (Raghupathi and Raghupathi, 2017; Ye et al., 2022). Work by Paula and Silva [26] (2021) and other researchers have directly linked research and development spending to companies and higher education institutions (public and private), fuel increased national patent applications, and, thus, contributed to national prosperity.
In 2017, Kwon et al. [27] in an examination of all patents 1980-2011 noted a strong surge in both the number of patents from Taiwan, Korea, and China, as well as an improved quality of them (as measured by citations). In that period, while the US dominated IP, there was only a three-fold increase in patent filing compared to the 100-fold increase by China. More crucially, in the years 2000-11, according to Google Patents [28], there were 34,095 patents with the term “remote sensing” of which already more than a quarter of them were Chinese in origin, despite China filing less than 6% of all patents for that period (Table 2), thus showing a clear and targeted set of investments and returns by China in the remote sensing field.
7. Conclusions
This paper establishes quantitatively longitudinal trends and baselines trends related to the publication of peer-reviewed journal publications in remote sensing and photogrammetry and affiliated national funding. Major observations include (1) an exponential growth in papers in this field, far outpacing general science and engineering publication trends and which is occurring without a similar growth in journals; (2) a steady increase in the number of authors per paper which doubled in only 30 years and appears to be continuing upward; (3) international participation in remote sensing scholarship expanded greatly, with over 160 countries consistently contributing since 2011 (3) since 1961, there has been a complete inversion in national affiliations of authors, with the US producing 88% of the remote sensing publications in the period 1961-1970 to only 9% in the years 2021-23; (4) conversely, China now produces more than 47% of all remote sensing papers (2021-23), which was a meteoric rise from only 3% in the years 1991-2000; (5) funding trends strongly mirror the publications, with Chinese funders acknowledged in more than 53% of the publications from 2021-2023 and the US in only 5% of them; (6) these trends are also heavily influenced by the number of funders per nation with an R-squared value of 0.833 correlating to affiliated publication levels.
Author Contributions
Debra Laefer and Jingru Hua both contributed to Methodology, Formal Analysis, and Writing – Original Draft Preparation. Debra Laefer was responsible for Conceptualization, Writing – Review and Editing, Project Administration, and Funding Acquisition. Jingru Hua contributed to Investigation, Data Curation, and Visualization.
Funding
None.
Institutional Review Board Statement
Not applicable.
Informed Consent Statement
Not Applicable.
Data Availability Statement
All data were taken from public realm sources as listed in the paper.
Acknowledgments
None.
Conflicts of Interest
“The authors declare no conflicts of interest.” .
Abbreviations
The following abbreviations are used in this manuscript:
| ML | Machine Learning |
| DL | Deep Learning |
Appendix A

Table A1.
Original Data Schema – maximum attributes.
| Attributes | Data Type | Description | Notes |
| Title | String | Article Title | |
| Accession number | Long | A unique 14-digit number assigned to each record assigned by EV | |
| Author | String | All authors | |
| Author affiliation | String | Authors’ corresponding affiliations | |
| Corresponding author(s) | String | One of the authors and contact | |
| Source | String | Journal | |
| Abbreviated source title | String | Abbreviated journal title | |
| Publisher | String | Publisher | |
| Volume | Int | Volume | |
| Issue | Int | Issue | |
| Pages | String | Pages | |
| Issue date | Date | Issue date | |
| Publication date | Date | Mostly publication year, sometimes contains month | |
| Publication year | Year | Publication year | Compendex only |
| Language | String | Language | |
| ISSN | Int | ISSN | |
| E-ISSN | Int | E-ISSN | |
| DOI | String | Digital Object Identifier | |
| Article number | Int | Article number | |
| CODEN | String | 6-character representations of source titles | |
| Country of publication | String | Country of publication | |
| Document type | String | Document type; Journal article in our case | |
| Abstract | String | Abstract of the article | |
| Number of references | Int | Number of references | |
| Main heading | String | A subject classification that serves to represent the main topic of the document | Compendex only |
| Controlled/Subject terms | String | A list of subject terms used to describe the content of a document in the most specific and consistent way possible | |
| Uncontrolled terms | String | Not assigned from the Engineering Village’s Thesaurus, but are derived from the abstract and author keywords | |
| Classification code | String | A numerical hierarchy of general subject categories. | |
| IPC code | String | International Patent Classification (IPC) codes pertain to a hierarchical classification for patents for different areas of technology | Inspec only |
| CPC code | String | CPC (Cooperative Patent Classification) system was jointly developed by the EPO (European Patent Office) and the USPTO (United States Patent and Trademark Office) | Inspec only |
| Treatment | String | Nature of the content based on the focus | |
| Discipline | String | Discipline | Inspec only |
| Funding details | String | Sponsors; missing values exist | |
| Funding text | String | More details about the funding | |
| Open Access type(s) | String | Open Access, Gold, Hybrid Gold, Bronze, Green | Compendex only |
| Database | String | Compendex/Inspec | |
| Copyright | String | Copyright | |
| Data Provider | String | Engineering Village |
Table A2.
Acronyms and Color of Countries.
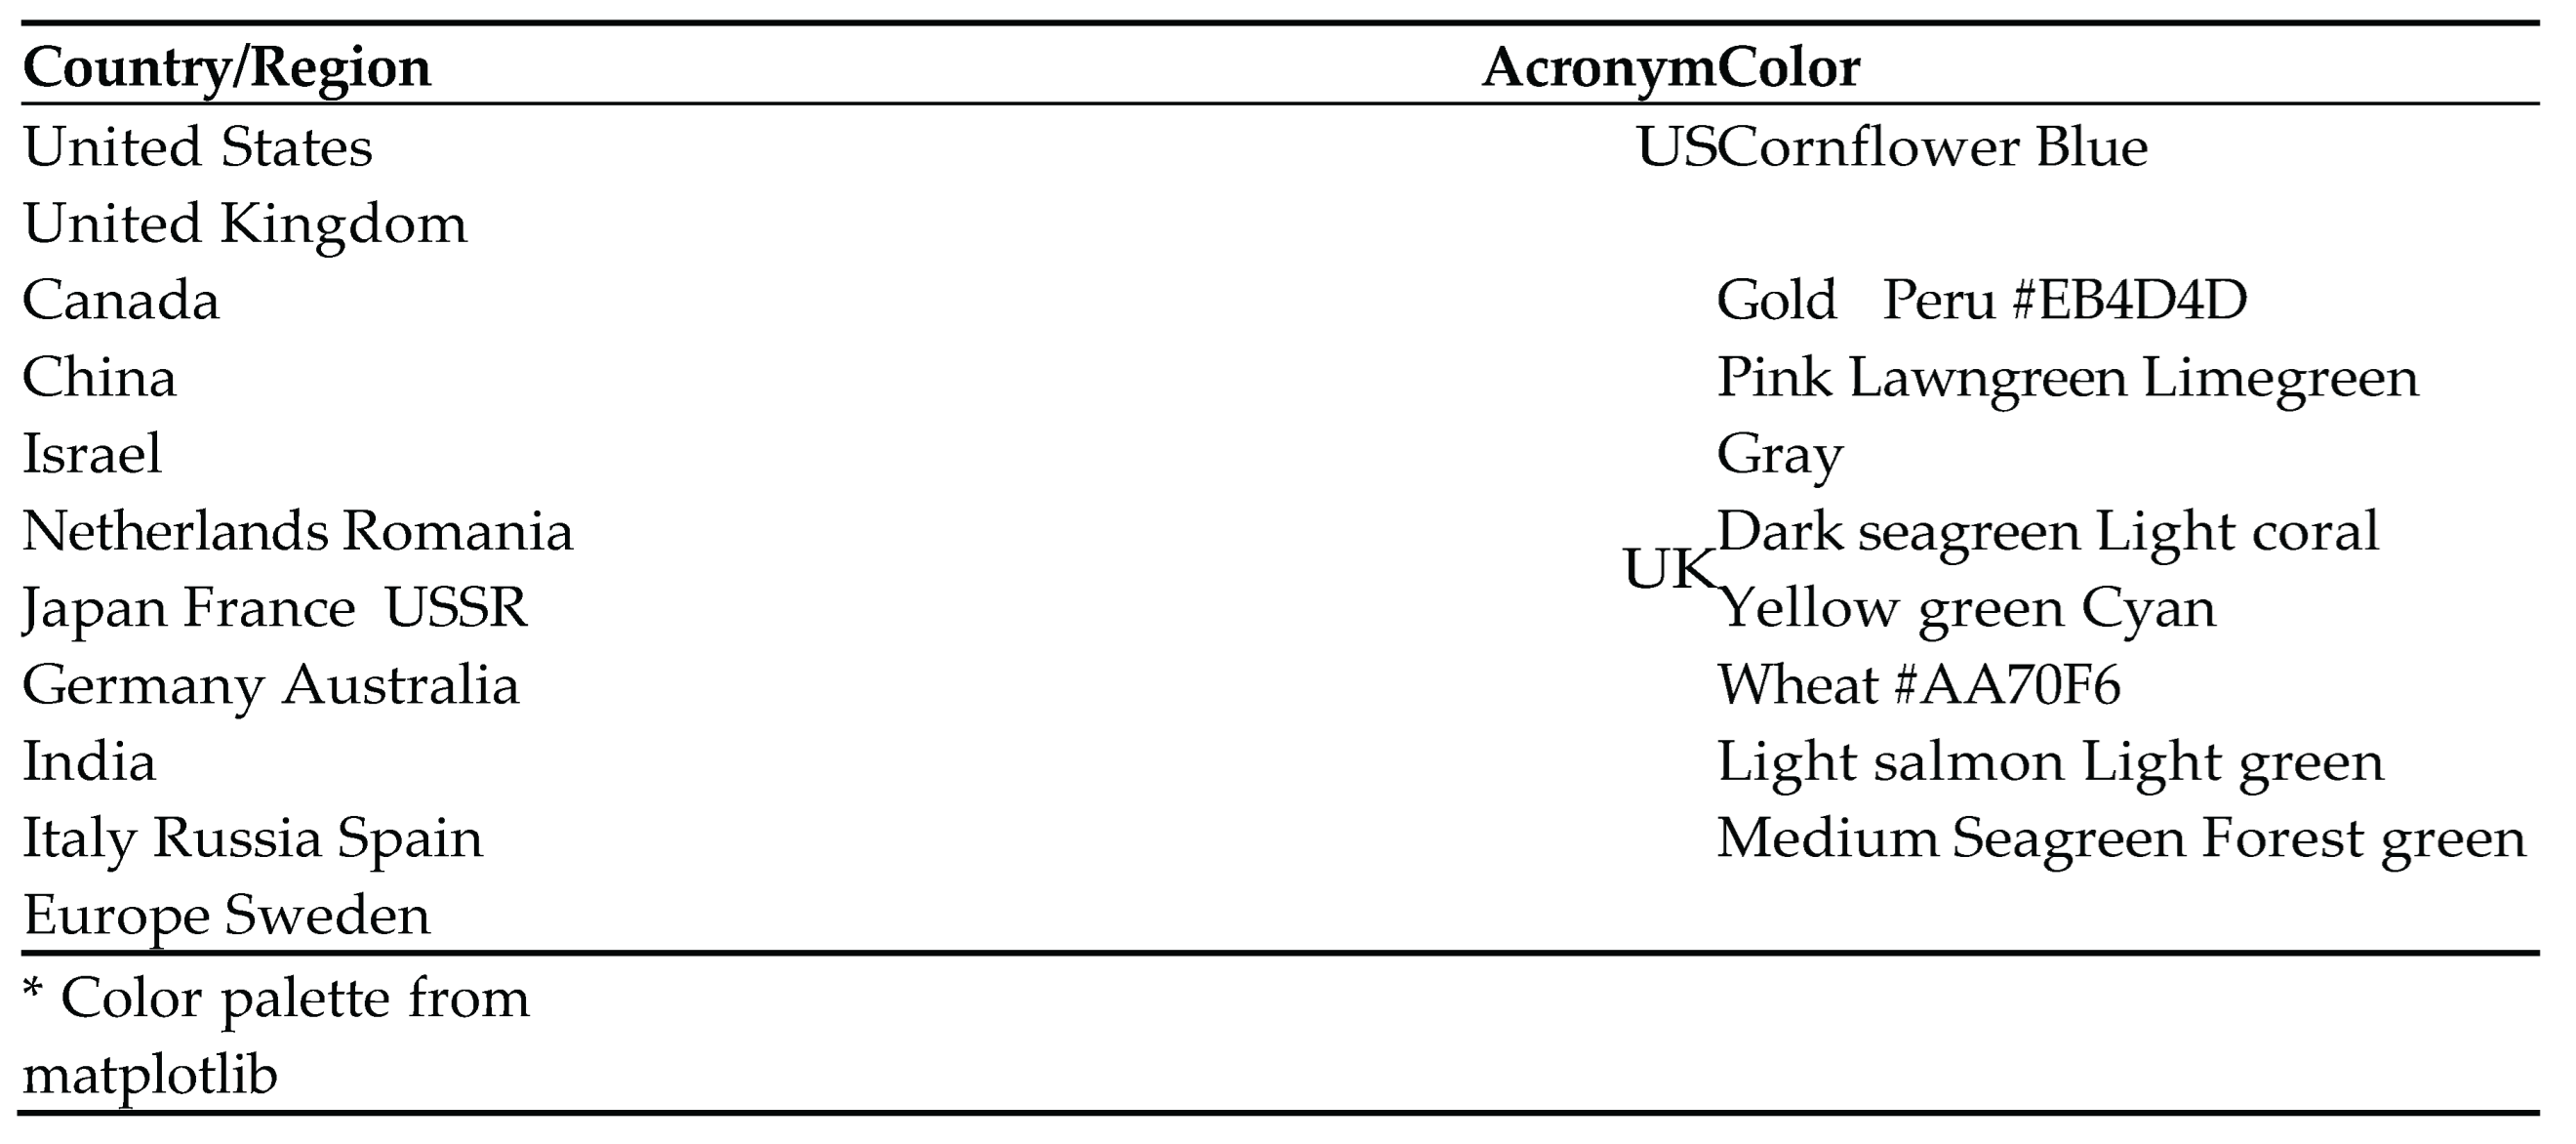 |
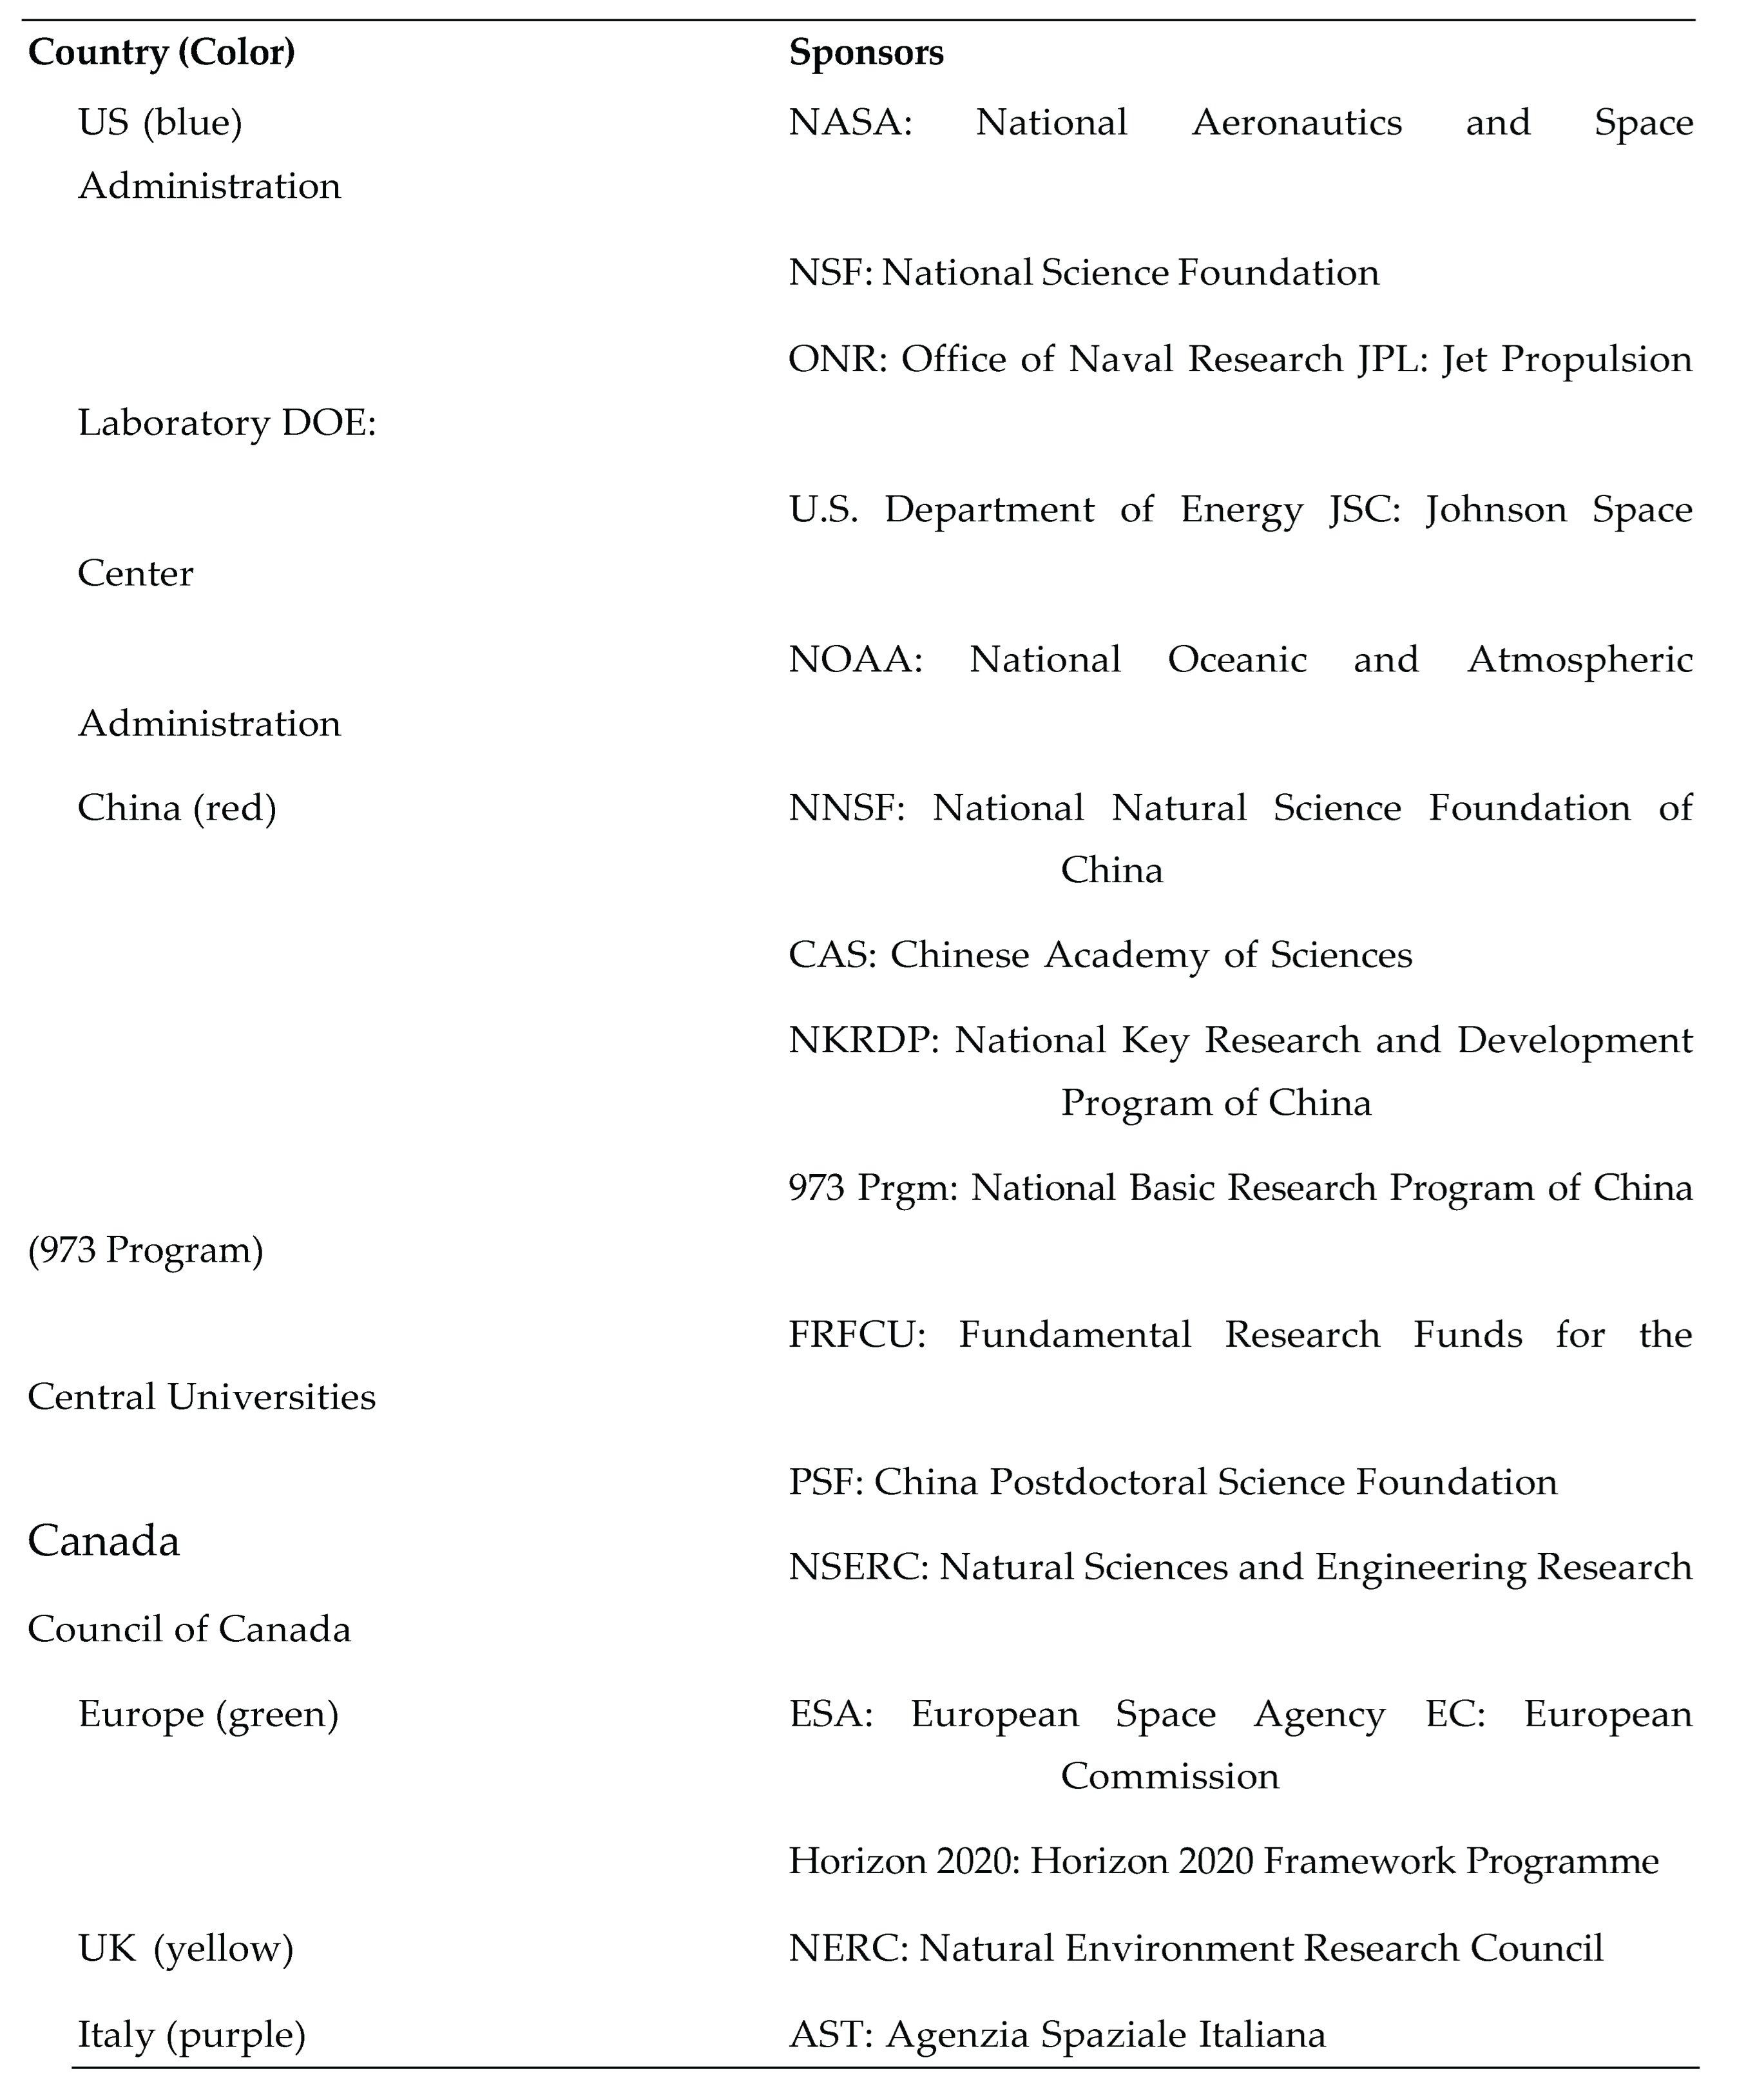
Table A3.
Acronyms for Funding Bodies.
 |
Appendix B
Table B1.
Remote Sensing and Photogrammetry Journals – 72 Titles.
| Journal | ‘61-70 | ‘71-80 | ‘81-90 | ‘91-’00 | ‘01’-’10 | ‘11-20 | ‘21-’23 |
| ASCE Journal of the Surveying and Mapping Division | X | ||||||
| American Society for Photogrammetry and Remote Sensing | X | x | x | ||||
| Applied Sciences | x | x | |||||
| Applied Spectroscopy | x | x | x | x | x | x | |
| Arabian Journal of Geosciences | x | x | |||||
| Australian Journal of Geodesy, Photogrammetry and Surveying | x | x | |||||
| Australian Surveyor | x | x | |||||
| Automation in Construction | x | ||||||
| Bulletin Geodesique | x | ||||||
| Canadian Journal of Remote Sensing | x | x | x | x | x | x | |
| Canadian Surveyor | x | x | |||||
| Chinese Geodetic and Cartographic Journal (in Chinese Cehui Xuebao) | x | x | x | ||||
| Computers and Geosciences | x | x | x | x | x | ||
| Computers, Environment and Urban Systems | x | x | x | ||||
| Earsel Advances in Remote Sensing | x | ||||||
| Earth Observation and Remote Sensing | x | ||||||
| Earth-Oriented Applications of Space Technology | x | ||||||
| Egyptian Journal of Remote Sensing and Space Science | x | x | |||||
| European Journal of Remote Sensing | x | x | |||||
| French Journal of Photogrammetry & Remote Sensing | x | x | |||||
| French Society of Photogrammetry | x | ||||||
| French Society of Photogrammetry & Remote Sensing | x | x | x | x | |||
| Geo-Spatial Information Science | x | x | x | ||||
| Geojournal | x | x | x | x | x | ||
| Geomatics and Information Science of Wuhan University | x | x | x | ||||
| Geomatics, Natural Hazards & Risk | x | x | x | ||||
| Geospatial Solutions | x | ||||||
| Giscience & Remote Sensing | x | x | |||||
| Spectroscopy & Spectral Analysis(in Chinese Guang Pu Xue Yu Guang Pu Fen Xi) | x | x | x | ||||
| Ieee Geoscience & Remote Sensing Letters | x | x | x | ||||
| IEEE Geoscience & Remote Sensing Magazine | x | x | |||||
| IEEE Journal of Selected Topics in Applied Earth Observations & Remote Sensing | x | x | x | ||||
| IEEE Transactions on Geoscience Electronics | x | x | |||||
| IEEE Transactions on Geoscience and Remote Sensing | x | x | x | x | x | x | |
| IEEE Transactions on Image Processing | x | x | x | x | |||
| International Geoscience and Remote Sensing Symposium (IGARSS) | x | x | |||||
| International Journal of Applied Earth Observation and Geoinformation | x | x | |||||
| International Journal of Digital Earth | x | x | |||||
| International Journal of Remote Sensing | x | x | x | x | x | ||
| ISPRS International Journal of Geo-Information | x | x | |||||
| ISPRS Journal of Photogrammetry & Remote Sensing | x | x | x | x | x | ||
| ITC Journal | x | x | |||||
| Journal of Applied Photographic Engineering | x | x | |||||
| Journal of Applied Remote Sensing | x | x | x | ||||
| Journal of Applied Spectroscopy | x | x | |||||
| Journal of Flight Science and Space Research (in German) | x | ||||||
| Journal of Geo-Information Science | x | ||||||
| Journal of Geodesy | x | x | x | ||||
| Journal of Geomatics | x | ||||||
| Journal of Geophysical Research | x | x | x | x | x | ||
| Journal of Imaging Technology | x | ||||||
| Journal of Quantitative Spectroscopy and Radiative Transfer | x | x | x | x | x | x | |
| Journal of Sensors | x | x | |||||
| Journal of Surveying Engineering | x | x | x | x | x | ||
| Journal of Surveying German | x | x | x | ||||
| Journal of the Indian Society of Remote Sensing | x | x | x | ||||
| Journal of the Optical Society of America | x | x | x | x | |||
| Open Geosciences | x | ||||||
| Optoelectronics, Instrumentation & Data Processing | x | x | x | x | x | x | |
| Photogrammetria | x | x | x | ||||
| Photogrammetric Engineering | x | x | |||||
| Photogrammetric Engineering & Remote Sensing | x | x | x | x | x | x | |
| Photogrammetric Record | x | x | x | x | x | ||
| Proceedings of the IEEE | x | x | x | x | x | x | x |
| Radiotekhnika | x | ||||||
| Remote Sensing, MDPI | x | x | x | ||||
| Remote Sensing Applications/Society and Environment | x | x | |||||
| Remote Sensing Letters | x | x | x | ||||
| Remote Sensing Reviews | x | x | |||||
| Remote Sensing of Environment | x | x | x | x | x | x | x |
| Science of Surveying & Mapping | x | ||||||
| Sensors | x | x | x | x | |||
| Solar System Research | x | x | x | x | x | x | |
| Soviet Journal of Optical Technology | x | ||||||
| Soviet Journal of Remote Sensing | x | x | |||||
| Journal of Remote Sensing (in Chinese Yaogan Xuebao) | x | x |
Appendix C.
Table B2.
Number of Entities by Country, Sector, and Period.
| Period | Country | Sector | Entities | Percent(%) |
| 1961-1970 | US | govt | 2 | 4.8 |
| univ | 0 | 0 | ||
| private | 17 | 36 | ||
| Total | 19 | 40.8 | ||
| 1971-1980 | US | govt | 2 | 2.8 |
| univ | 0 | 0 | ||
| private | 11 | 6.2 | ||
| Total | 13 | 9 | ||
| Japan | govt | 0 | 0 | |
| univ | 0 | 0 | ||
| private | 3 | 2.7 | ||
| Total | 3 | 2.7 | ||
| Canada | govt | 0 | 0 | |
| univ | 0 | 0 | ||
| private | 1 | 0.8 | ||
| Total | 1 | 0.8 | ||
| USSR | govt | 0 | 0 | |
| univ | 0 | 0 | ||
| private | 1 | 0.8 | ||
| Total | 1 | 0.8 | ||
| Sweden | govt | 0 | 0 | |
| univ | 0 | 0 | ||
| private | 1 | 0.5 | ||
| Total | 1 | 0.5 | ||
| 1981-1990 | US | govt | 3 | 1.5 |
| univ | 1 | 0.4 | ||
| private | 6 | 4.2 | ||
| Total | 10 | 6.1 | ||
| Japan | govt | 0 | 0 | |
| univ | 0 | 0 | ||
| private | 5 | 14 | ||
| Total | 5 | 14 | ||
| UK | govt | 0 | 0 | |
| univ | 0 | 0 | ||
| private | 1 | 0.7 | ||
| Total | 1 | 0.7 | ||
| India | govt | 1 | 0.6 | |
| univ | 0 | 0 | ||
| private | 0 | 0 | ||
| Total | 1 | 0.6 | ||
| China | govt | 0 | 0 | |
| univ | 0 | 0 | ||
| private | 1 | 0.5 | ||
| Total | 1 | 0.5 | ||
| 1991-2000 | US | govt | 3 | 1.7 |
| univ | 0 | 0 | ||
| private | 7 | 4.1 | ||
| Total | 10 | 5.8 | ||
| Japan | govt | 0 | 0 | |
| univ | 0 | 0 | ||
| private | 5 | 4.5 | ||
| Total | 5 | 4.5 | ||
| China | govt | 1 | 0.6 | |
| univ | 0 | 0 | ||
| private | 0 | 0 | ||
| Total | 1 | 0.6 | ||
| Germany | govt | 1 | 0.5 | |
| univ | 0 | 0 | ||
| private | 0 | 0 | ||
| Total | 1 | 0.5 | ||
| 2001-2010 | China | govt | 7 | 7.7 |
| univ | 10 | 14.6 | ||
| private | 1 | 0.9 | ||
| Total | 18 | 23.2 | ||
| Germany | govt | 1 | 1.1 | |
| univ | 0 | 0 | ||
| private | 0 | 0 | ||
| Total | 1 | 1.1 | ||
| 2011-2020 | China | govt | 5 | 8.8 |
| univ | 13 | 27 | ||
| private | 1 | 0.9 | ||
| Total | 19 | 36.7 | ||
| 2021-2023 | China | govt | 5 | 8.4 |
| univ | 11 | 16.3 | ||
| private | 3 | 3.1 | ||
| Total | 19 | 27.8 |
References
- Kumar, S. GeoBuiz 22: Global Geospatial Industry Outlook Report. Available online: https://geospatialworld.net/gw-market-insights/advancing-augmenting-usd-1-4-trillion-geospatial-market-by-2030/ (accessed on 16 June 2025).
- Terhune, E.A. Collapsible Mast. U.S. Patent 2,832,555, 1958.
- Duncan, P.M. On Some Fossil Reef-Building Corals from the Tertiary Deposits of Tasmania. Quarterly Journal of the Geological Society, 32(1–4), 341–351 (1876).
- Flemer, J.A. An Elementary Treatise on Phototopographic Methods and Instruments. 1906.
- NDE, C. Imagery. Ann Arbor, 1050, pp. 48106–1346, 1934.
- Myers, V.I.; Allen, W.A. Electrooptical Remote Sensing Methods as Nondestructive Testing and Measuring Techniques in Agriculture. Applied Optics, 7(9), 1819–1838 (1968).
- Klemas, V.; Odell, E.L.G. Multispectral Imaging of Mars from a Lander (No. NASA-CR-66827), 1969.
- Bristor, C.L. The Earth Location of Geostationary Satellite Imagery. Pattern Recognition, 2(4), 269–277 (1970).
- Colvocoresses, A.P. ERTS-A Satellite Imagery. Photogrammetric Engineering, 36(6), 555–561 (1970).
- Victor, N.; Maddikunta, P.K.R.; Mary, D.R.K.; Murugan, R.; Chengoden, R.; Gadekallu, T.R.; Rakesh, N.; Zhu, Y.; Paek, J. Remote Sensing for Agriculture in the Era of Industry 5.0—A Survey. IEEE Journal of Selected Topics in Applied Earth Observations and Remote Sensing, 2024.
- Alipouri, E.; Nami, M.H.; Naderi, M. An Overview of the Application of Remote Sensing Tech-nologies in Disaster Management (with an Emphasis on Natural Hazards). Disaster Prevention and Management Knowledge (quarterly), 13(4), 490–507 (2024).
- Zhuang, Y.; Liu, X.; Nguyen, T.; et al. Global Remote Sensing Research Trends During 1991–2010: A Bibliometric Analysis. Scientometrics, 96, 203–219 (2013). Available online: . [CrossRef]
- Zhang, Y.; Thenkabail, P.S.; Wang, P. A Bibliometric Profile of the Remote Sensing Open Access Journal Published by MDPI Between 2009 and 2018. Remote Sensing, 11(1), 91 (2019).
- Engineering Village. Engineering Village. Available online: https://www.engineeringvillage. com (accessed on 7 May 2025).
- Elsevier. Engineering Village Databases. Available online: https://www.elsevier.com/ products/engineering-village/databases (accessed on 7 May 2025).
- National Science Foundation (NSF). Publication Output by Region, Country, or Economy and by Scientific Field. Available online: https://ncses.nsf.gov/pubs/nsb202333/publication-output- by-region-country-or-economy-and-by-scientific-field (accessed on 7 May 2025).
- Neumann, T.; Dülberg, E.; Schiffer, S.; Ferrein, A. A rotating platform for swift acquisition of dense 3D point clouds. In Intelligent Robotics and Applications: 9th International Conference, ICIRA 2016, Tokyo, Japan, August 22–24, 2016, Proceedings, Part I; Springer International Publishing: Cham, 2016; pp. 257–268.
- Chen, S.; Laefer, D.F.; Mangina, E. State of technology review of civilian UAVs. Recent Patents on Engineering 2016, 10(3), 160–174.
- Laghari, A.A.; Jumani, A.K.; Laghari, R.A.; Nawaz, H. Unmanned aerial vehicles: A review.Cognitive Robotics 2023, 3, 8–22.
- Vo, A.V.; Truong-Hong, L.; Laefer, D.F.; Bertolotto, M. Octree-based region growing for point cloud segmentation. ISPRS Journal of Photogrammetry and Remote Sensing 2015, 104, 88–100.
- United States Geological Survey (USGS). 3D Elevation Program. Available online: https://www.usgs.gov/3d-elevation-program (accessed on 7 May 2025).
- OpenAI. (2025). ChatGPT (June 9 version). https://chat.openai.com/.
- Glismann, H.H.; Horn, E.J. Comparative invention performance of major industrial countries: patterns and explanations. Management Science 1988, 34(10), 1169–1187.
- Raghupathi, V.; Raghupathi, W. Innovation at country-level: association between economic development and patents. Journal of Innovation and Entrepreneurship 2017, 6, 1–20.
- Ye, Y.; Xu, S.; Mariani, M.S.; Lü, L. Forecasting countries’ gross domestic product from patent data. Chaos, Solitons & Fractals 2022, 160, 112234.
- Paula, F.D.O.; Silva, J.F.D. R&D spending and patents: levers of national development. Innova-tion & Management Review 2021, 18(2), 175–191.
- Kwon, S.; Lee, J.; Lee, S. International trends in technological progress: Evidence from patent citations, 1980–2011. Scientometrics 2017.
- Google Patents. Remote Sensing Patent Search. Available online: https://patents.google.com (accessed on 7 May 2025).
Figure 1.
Distribution of papers per journal in each period; the 1971-1980 outlier of a single paper published in a journal was in Solar System Research. This anomaly may be due to the incompleteness of the databases.
Figure 1.
Distribution of papers per journal in each period; the 1971-1980 outlier of a single paper published in a journal was in Solar System Research. This anomaly may be due to the incompleteness of the databases.
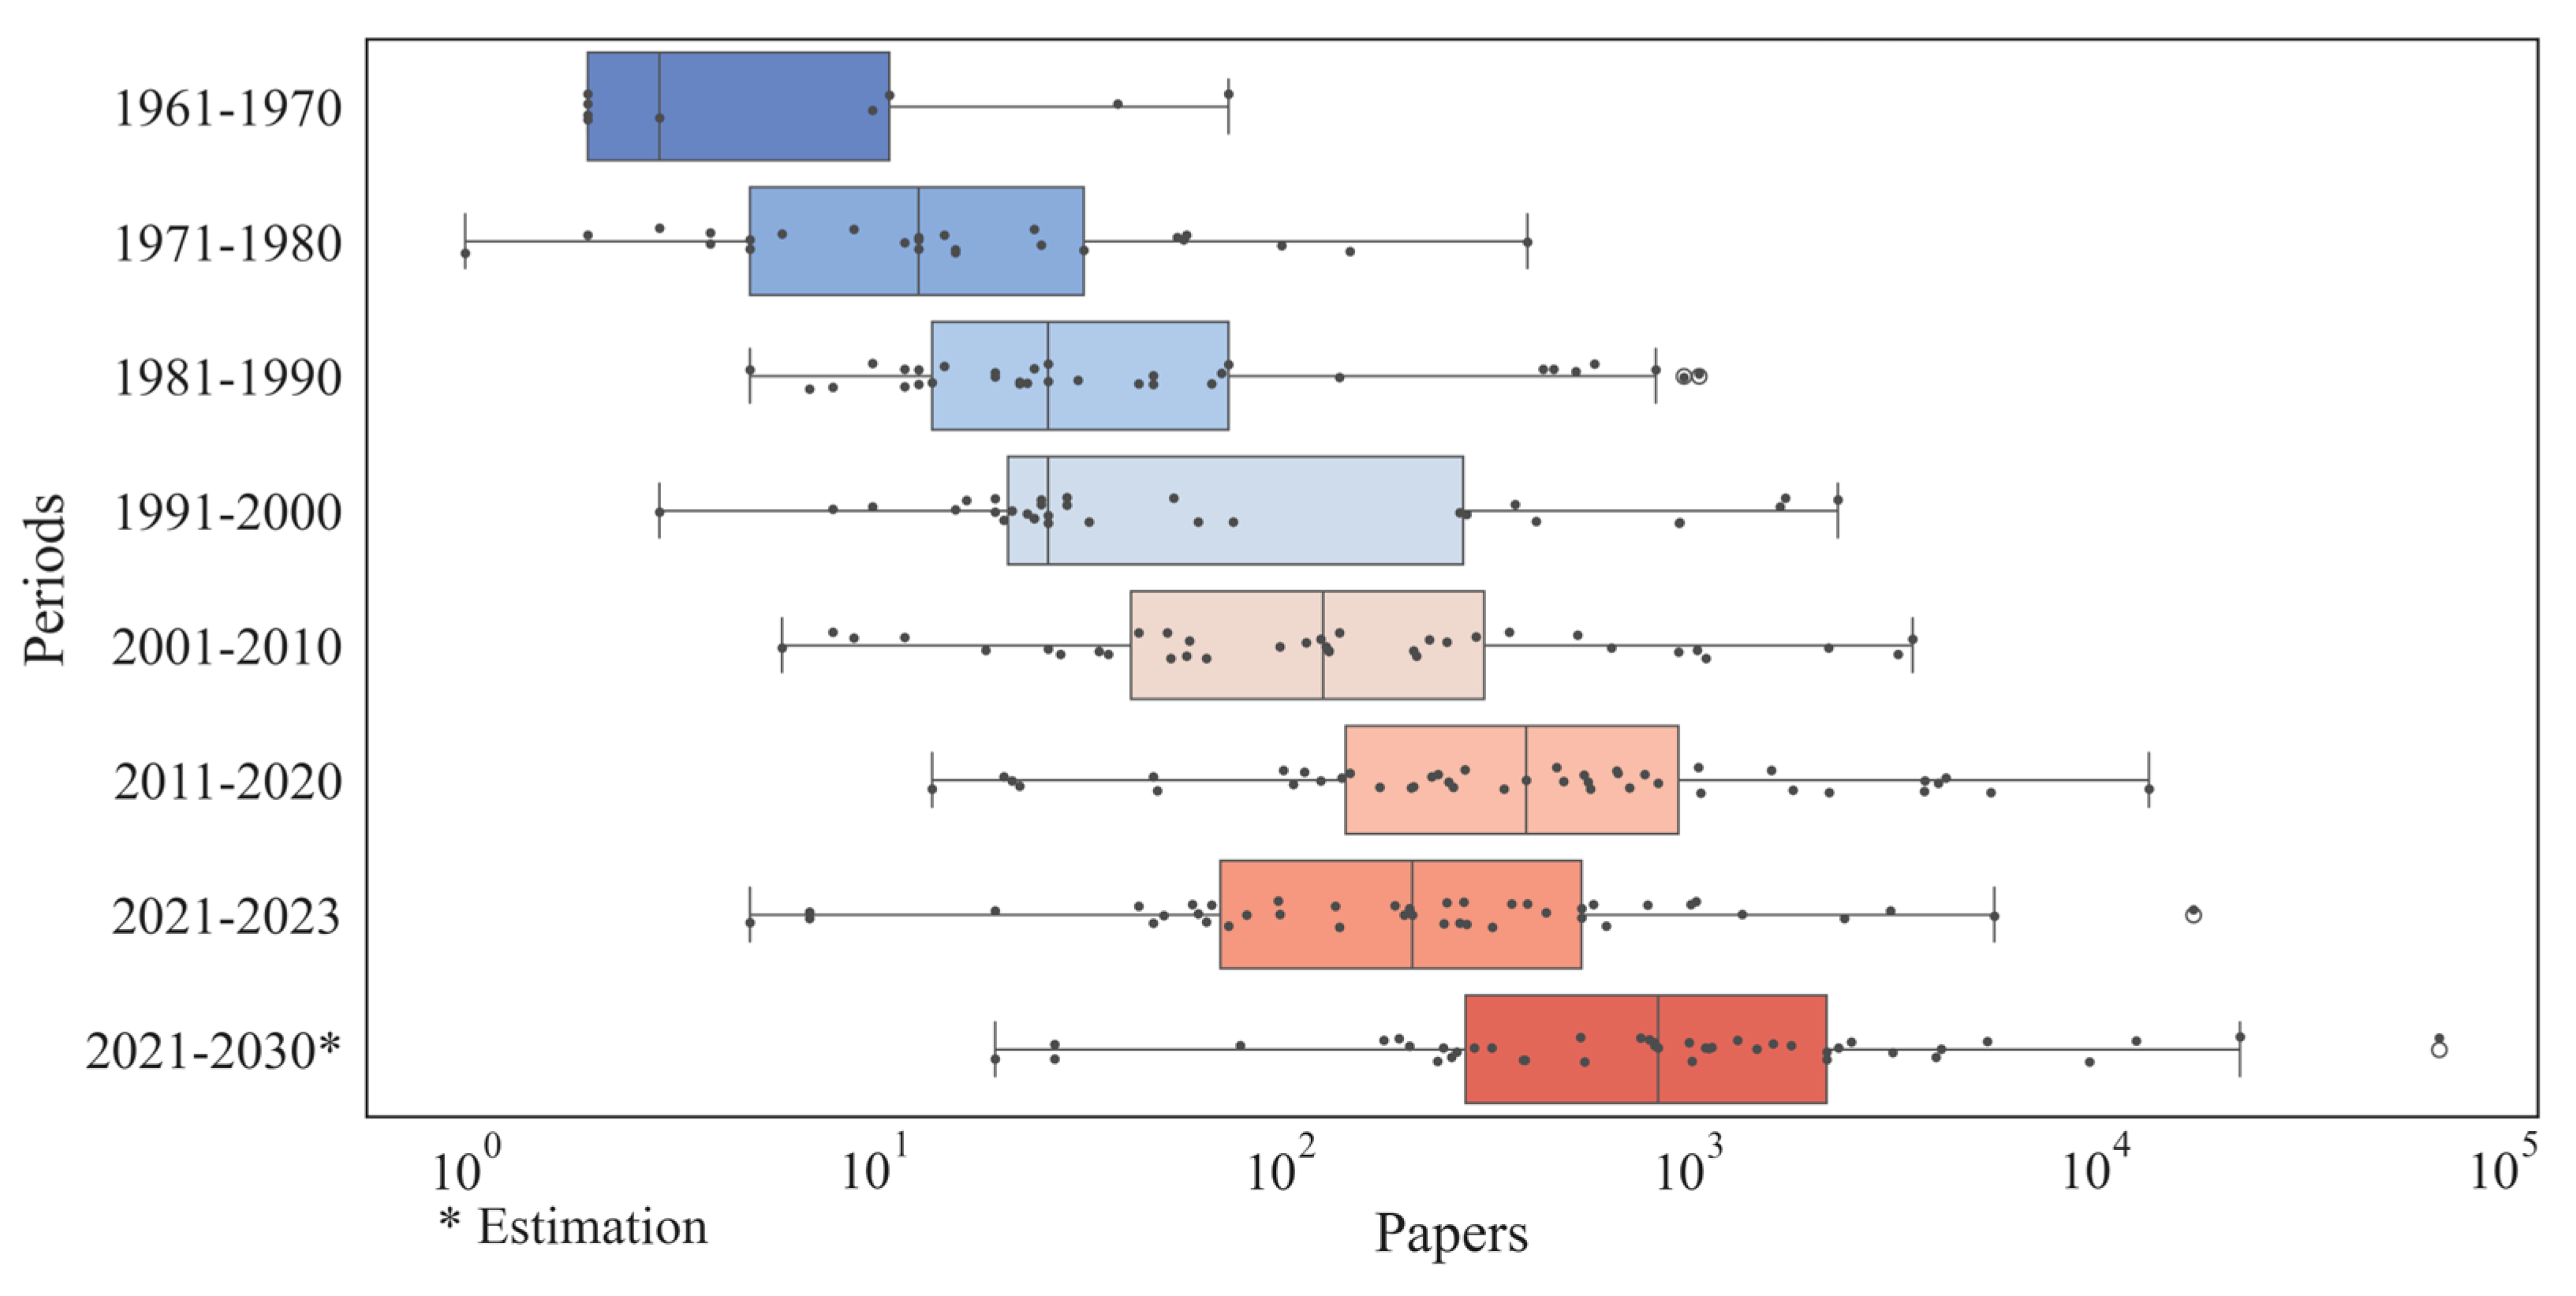
Figure 2.
Distribution of authors per paper.
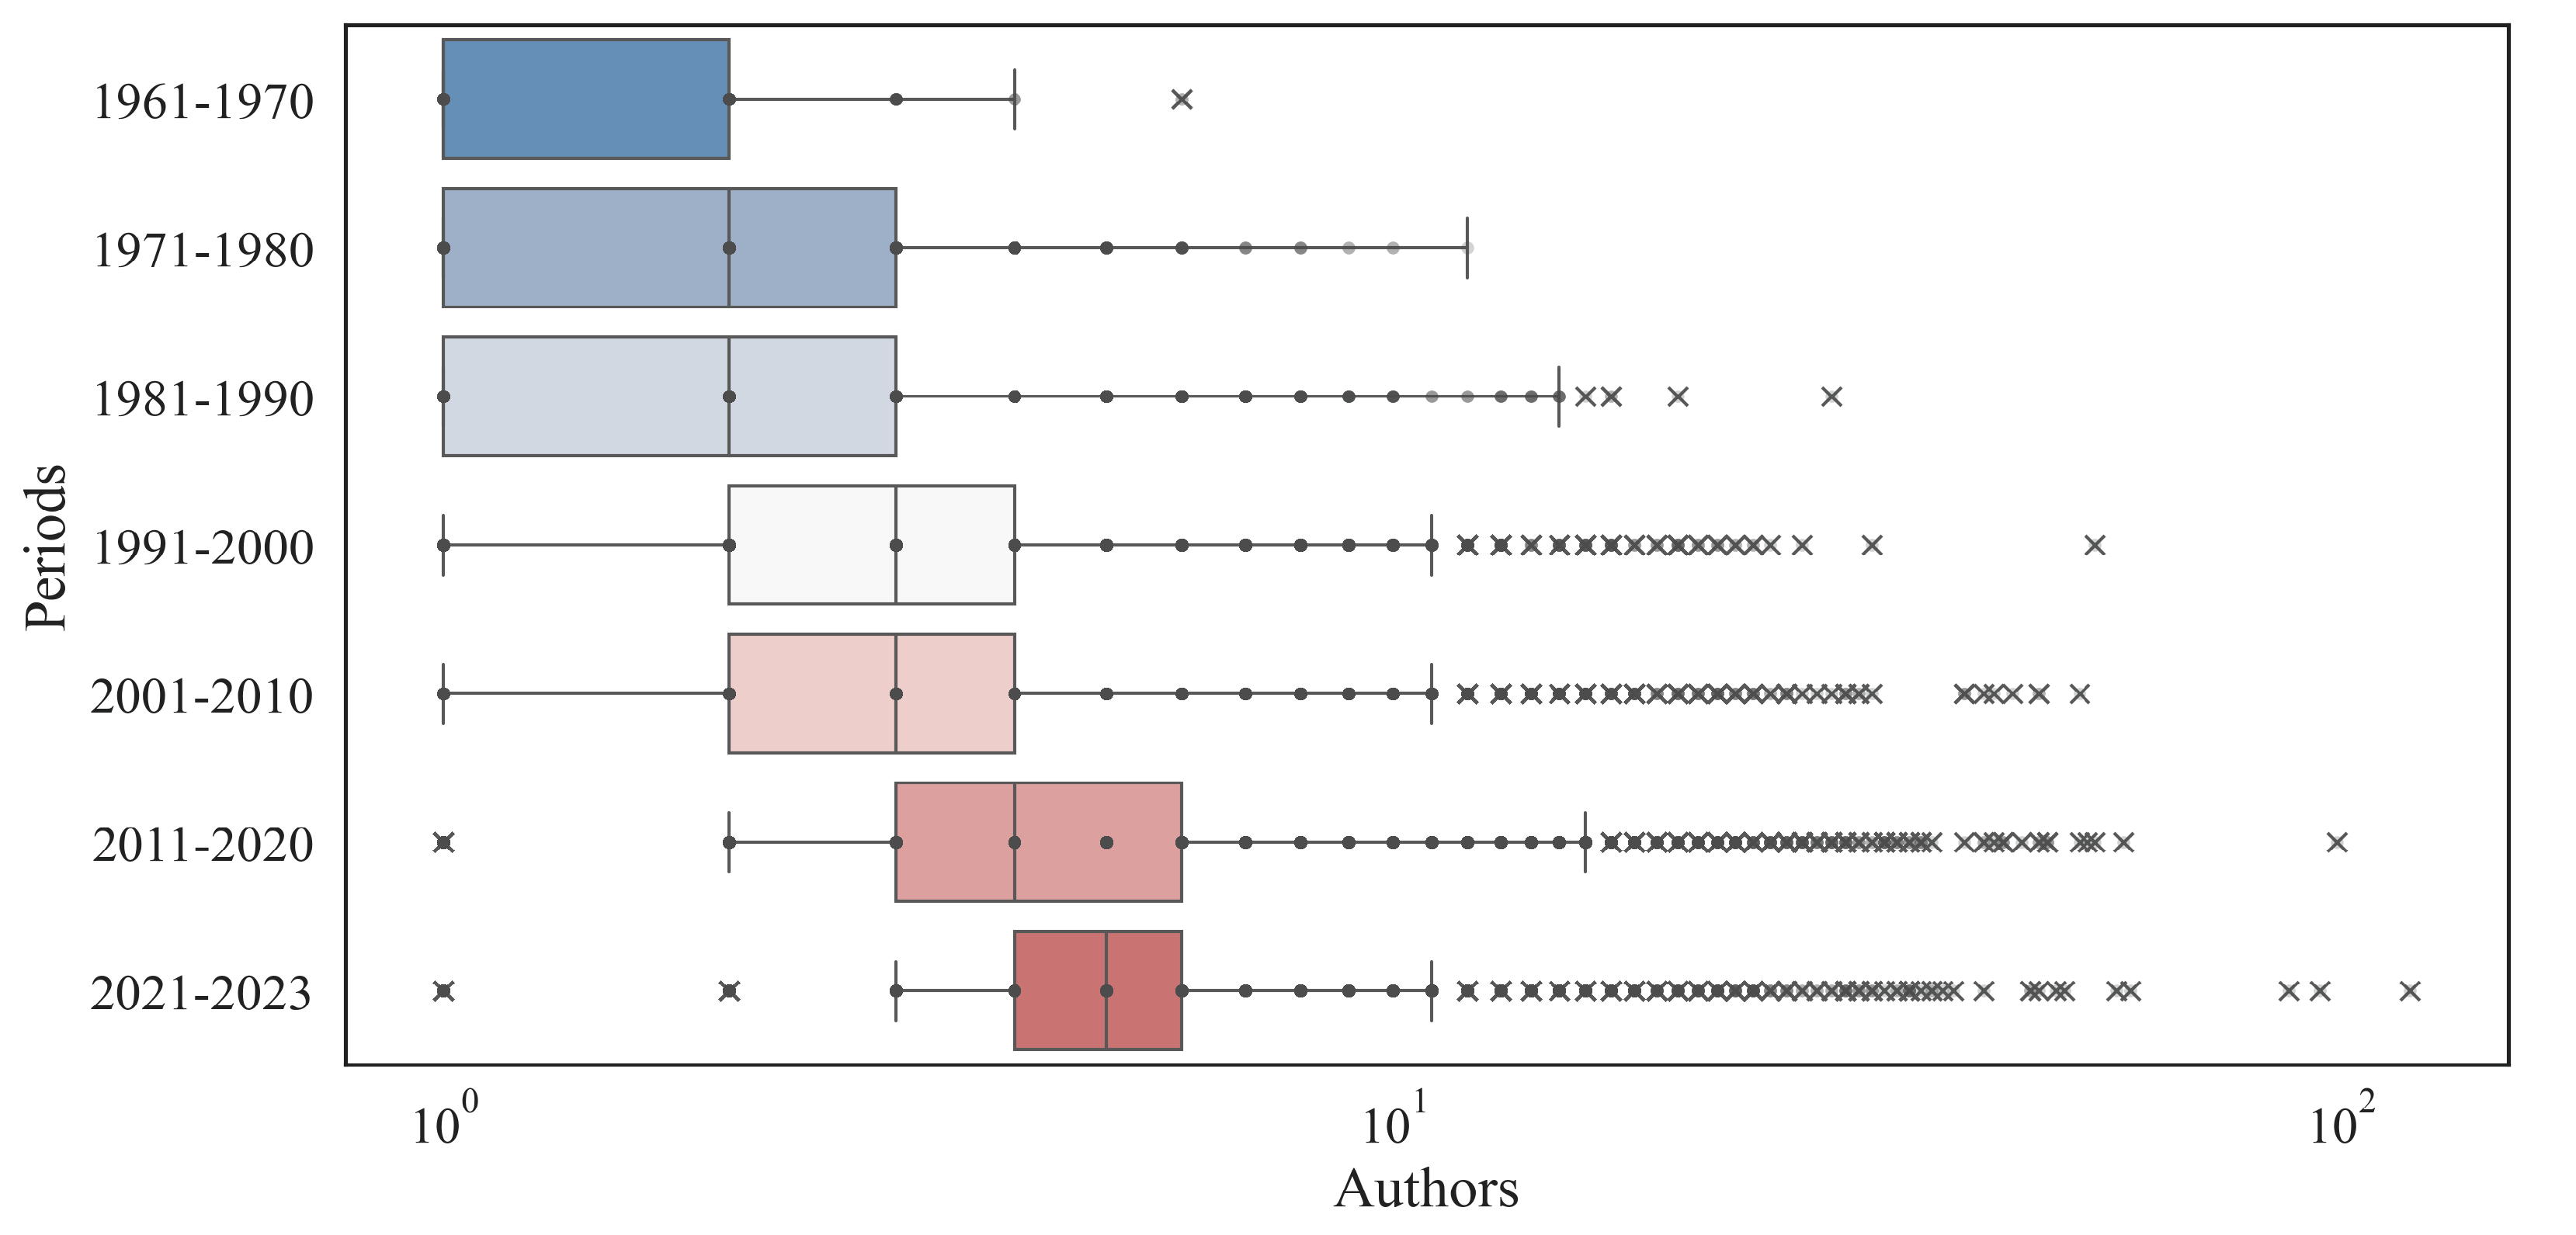
Figure 3.
Visualization of the first instantiation of journal publication in remote sensing or photogrammetry by country.
Figure 3.
Visualization of the first instantiation of journal publication in remote sensing or photogrammetry by country.
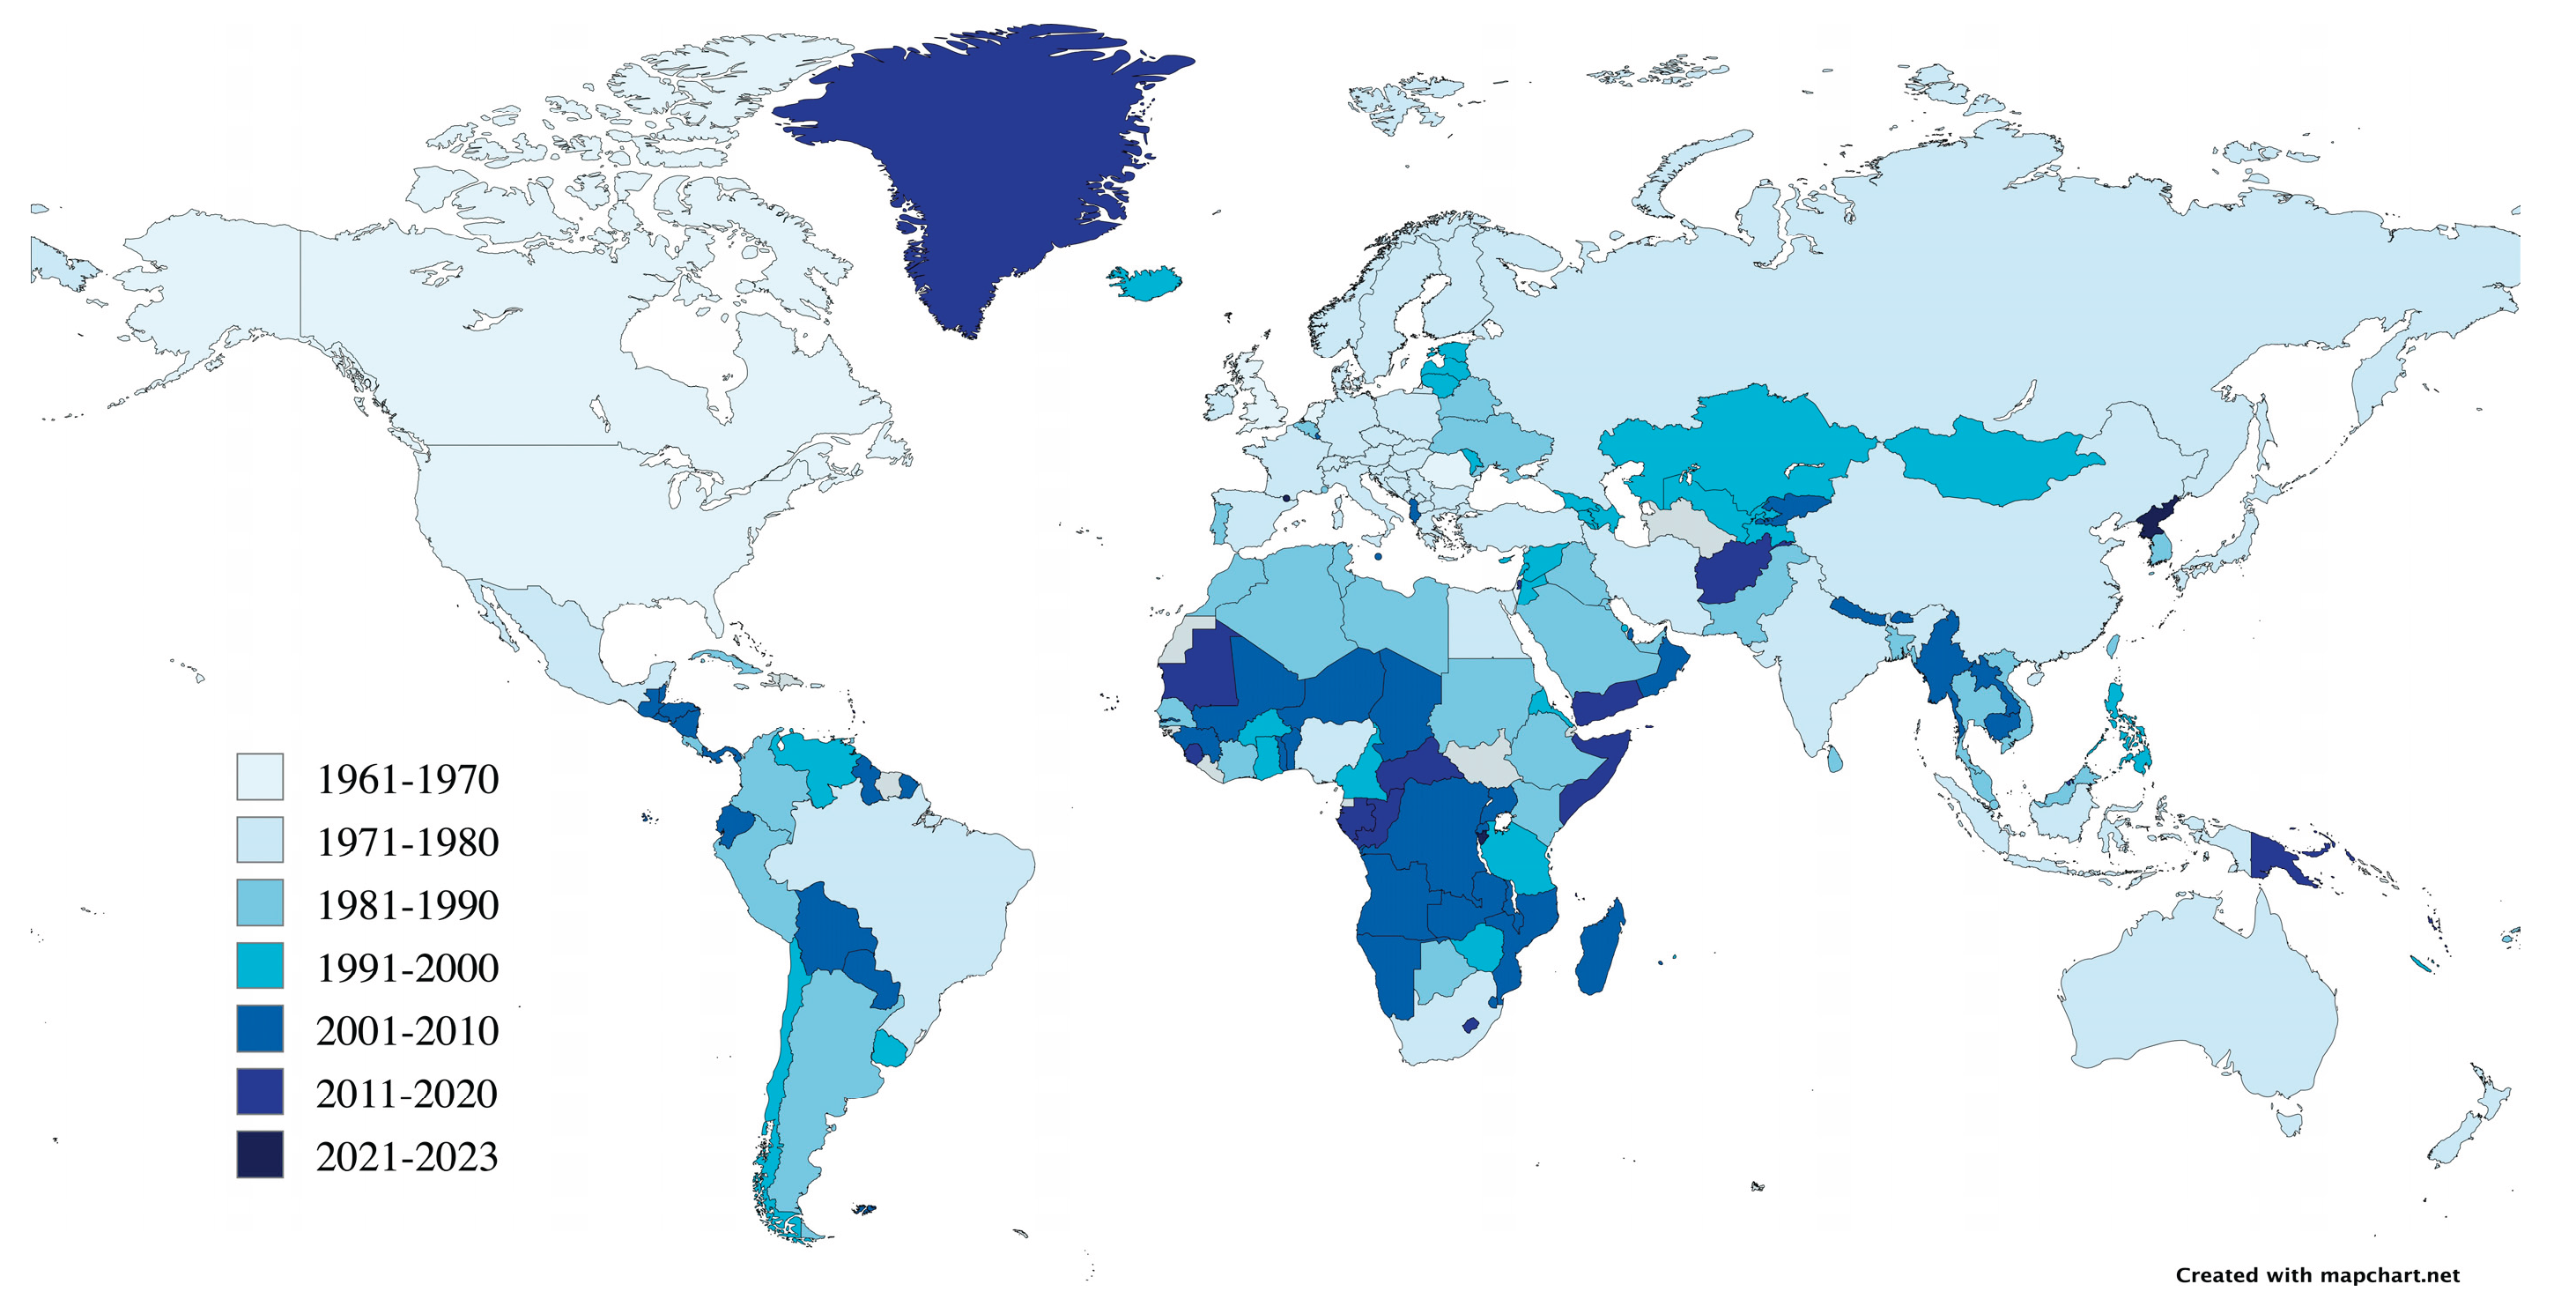
Figure 4.
Percentage of papers by national affiliation from the top 10 national contributors (US = United States; UK = United Kingdom): a 1961-1970. Percentage of all (6) countries: 100.00%; b 1971-1980. Percentage of all (40) countries: 91.39%; c 1981 -1990. Percentage of all (78) countries: 86.20%; d 1991 – 2000. Percentage of all (107) countries: 82.79%; e 2001 – 2010. Percentage of all (160) countries: 77.10%; f 2011 - 2020. Percentage of all (174) countries: 74.60%; g 2021 – 2023. Percentage of all (191) countries: 77.43%.
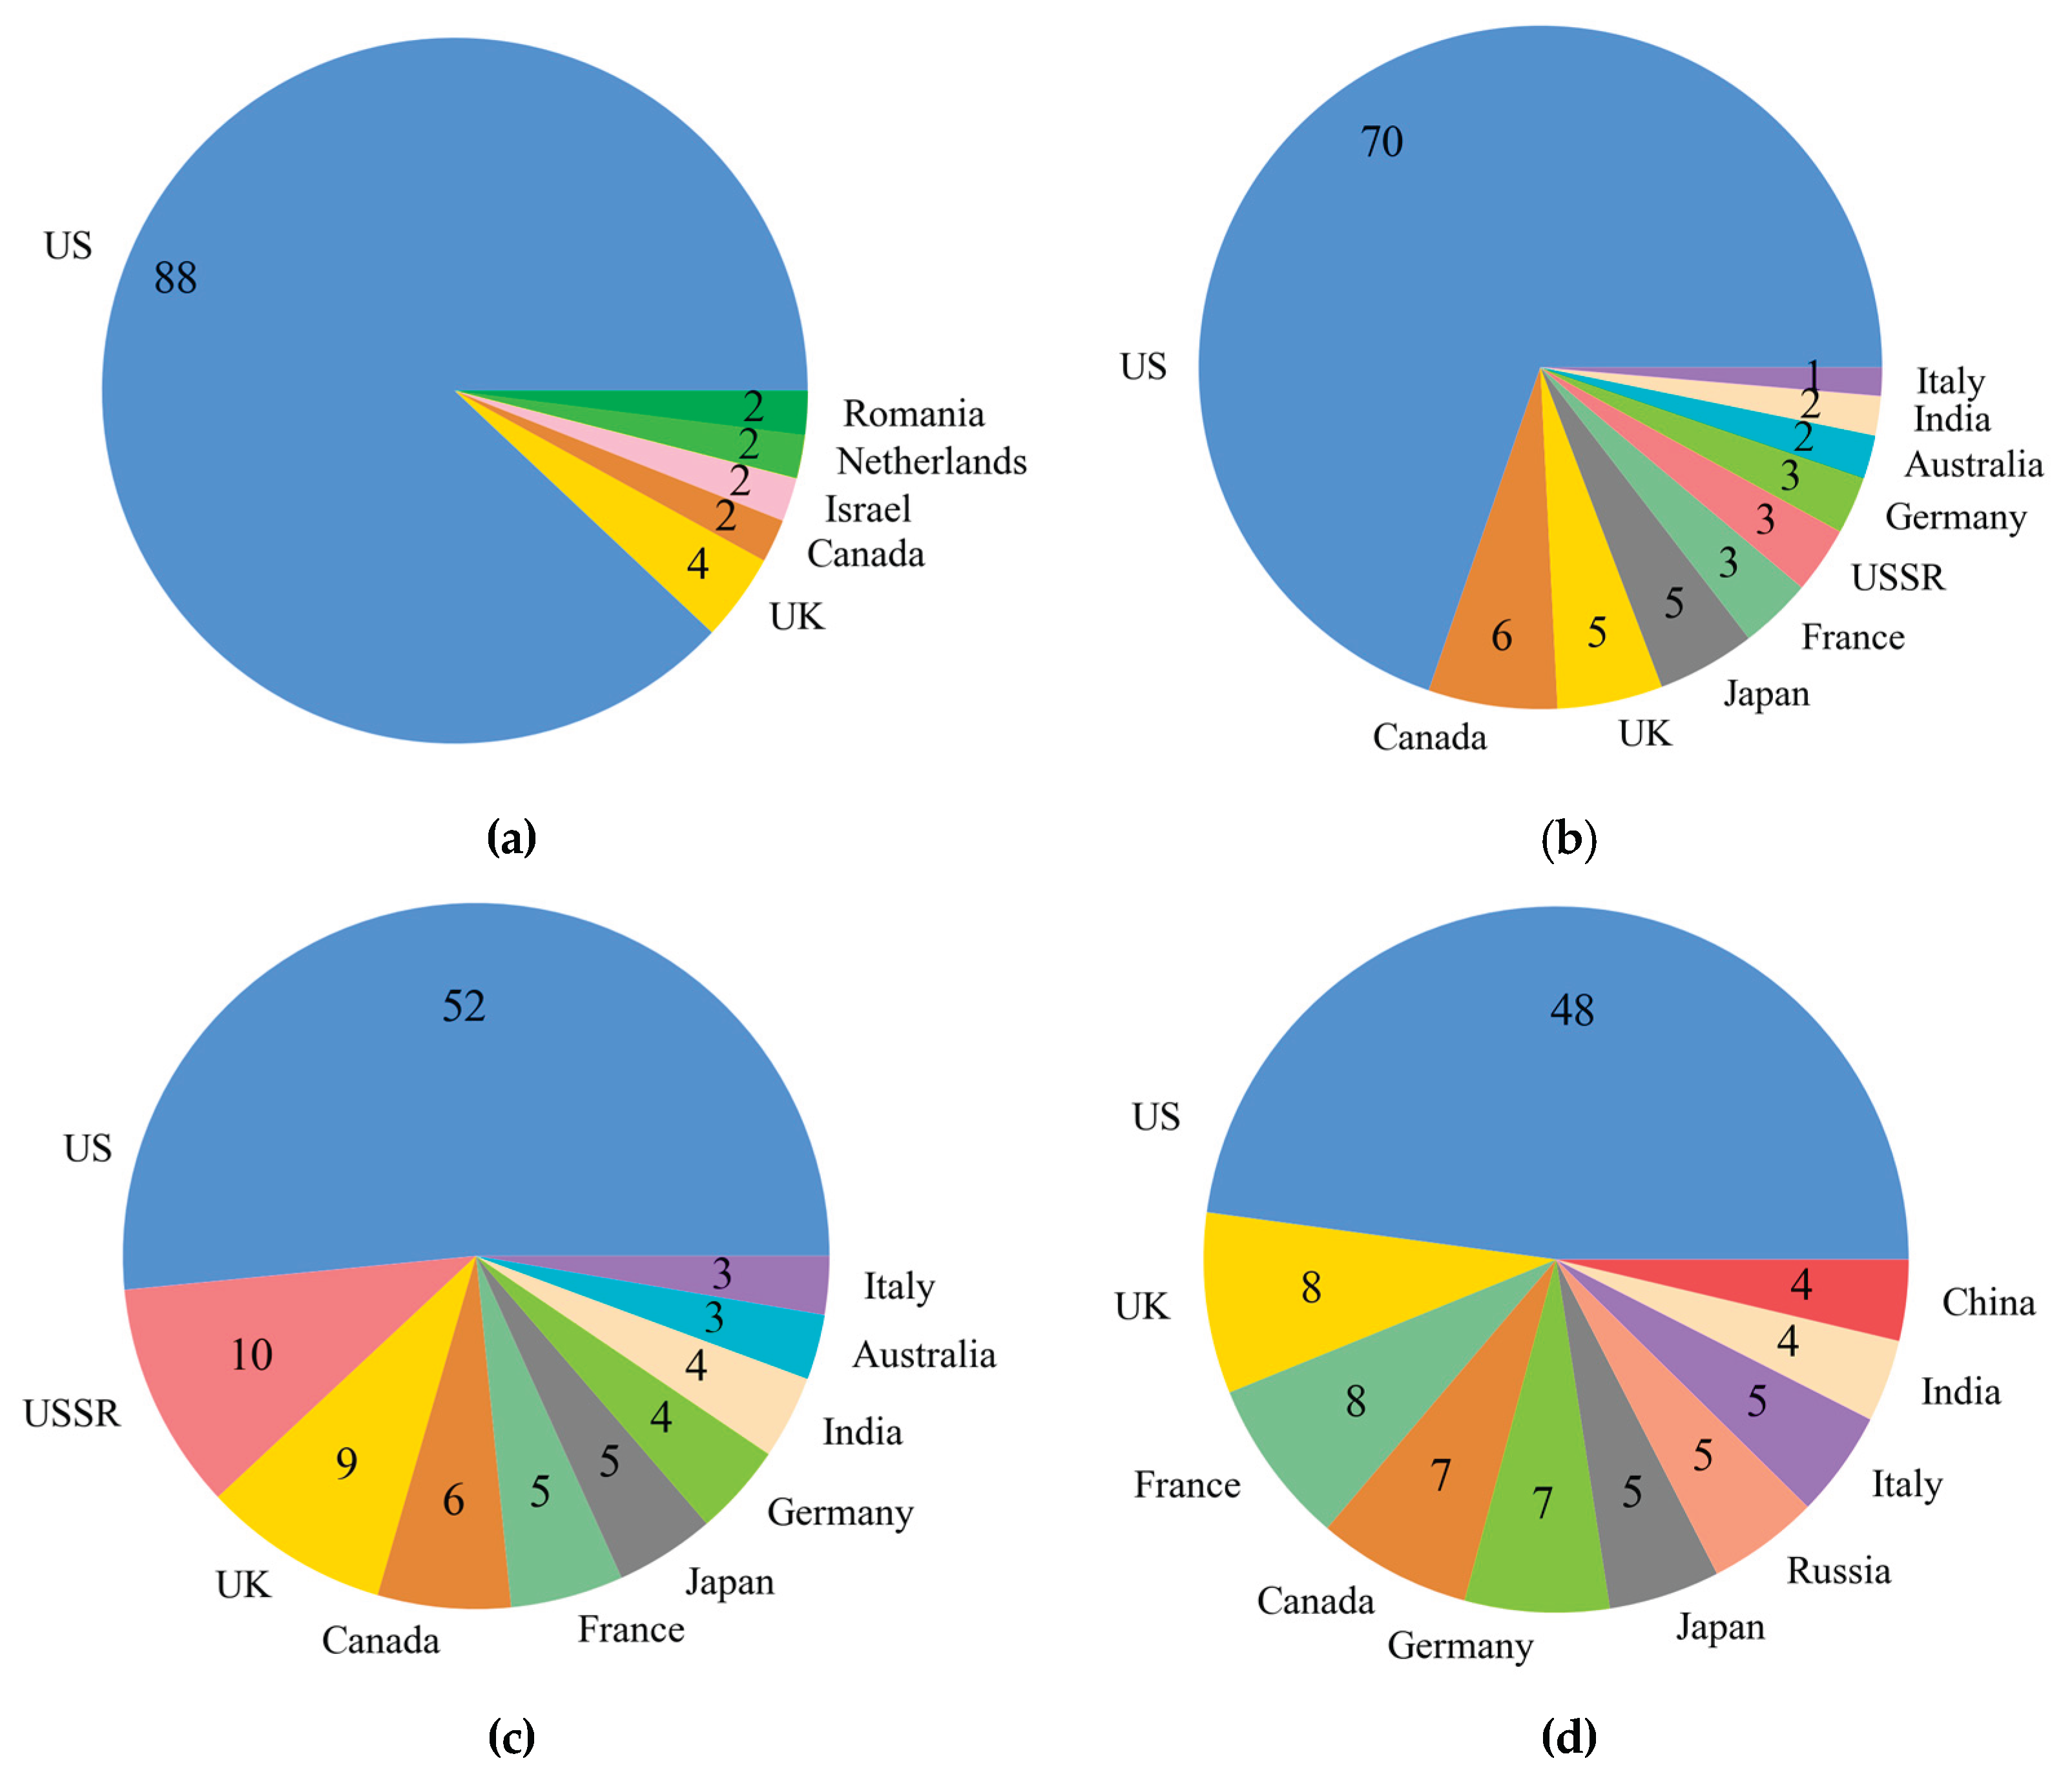
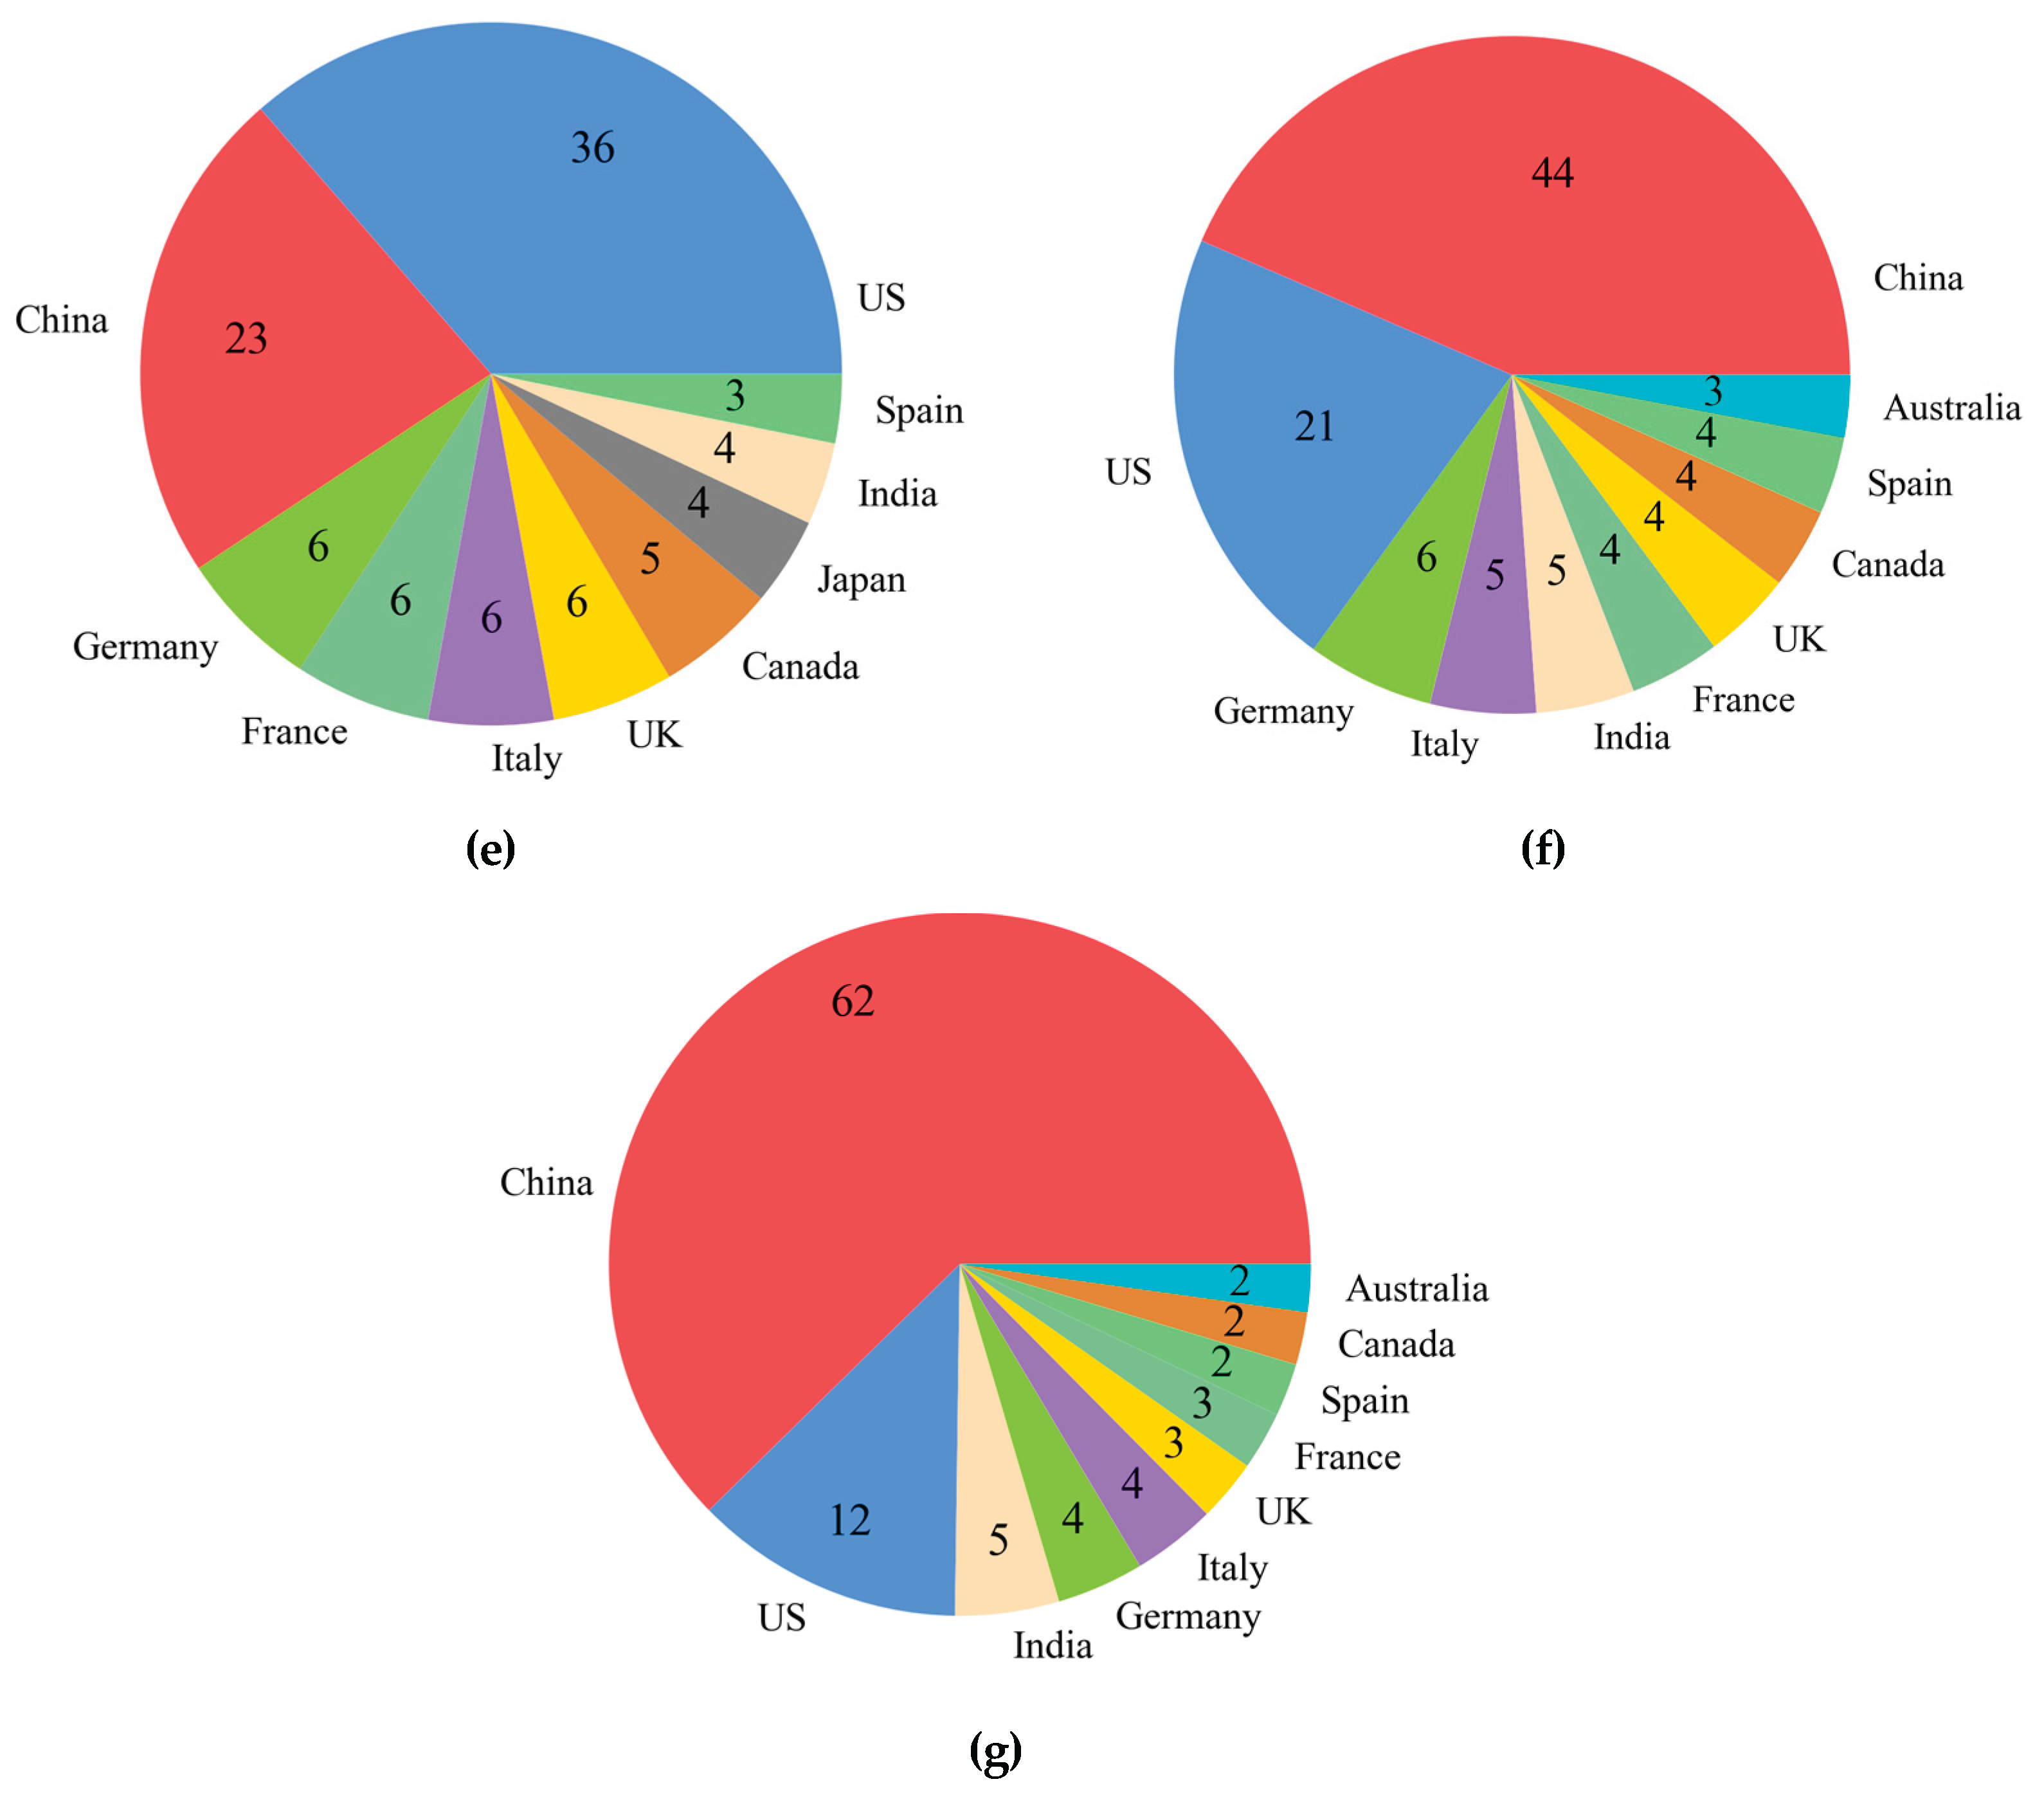
Figure 5.
Paper distribution by funder (see Appendix A Table A3) : a 1981 - 1990; b 1991 – 2000; c 2001 - 2010; d 2011 - 2020; e 2021 - 2023;.
Figure 5.
Paper distribution by funder (see Appendix A Table A3) : a 1981 - 1990; b 1991 – 2000; c 2001 - 2010; d 2011 - 2020; e 2021 - 2023;.
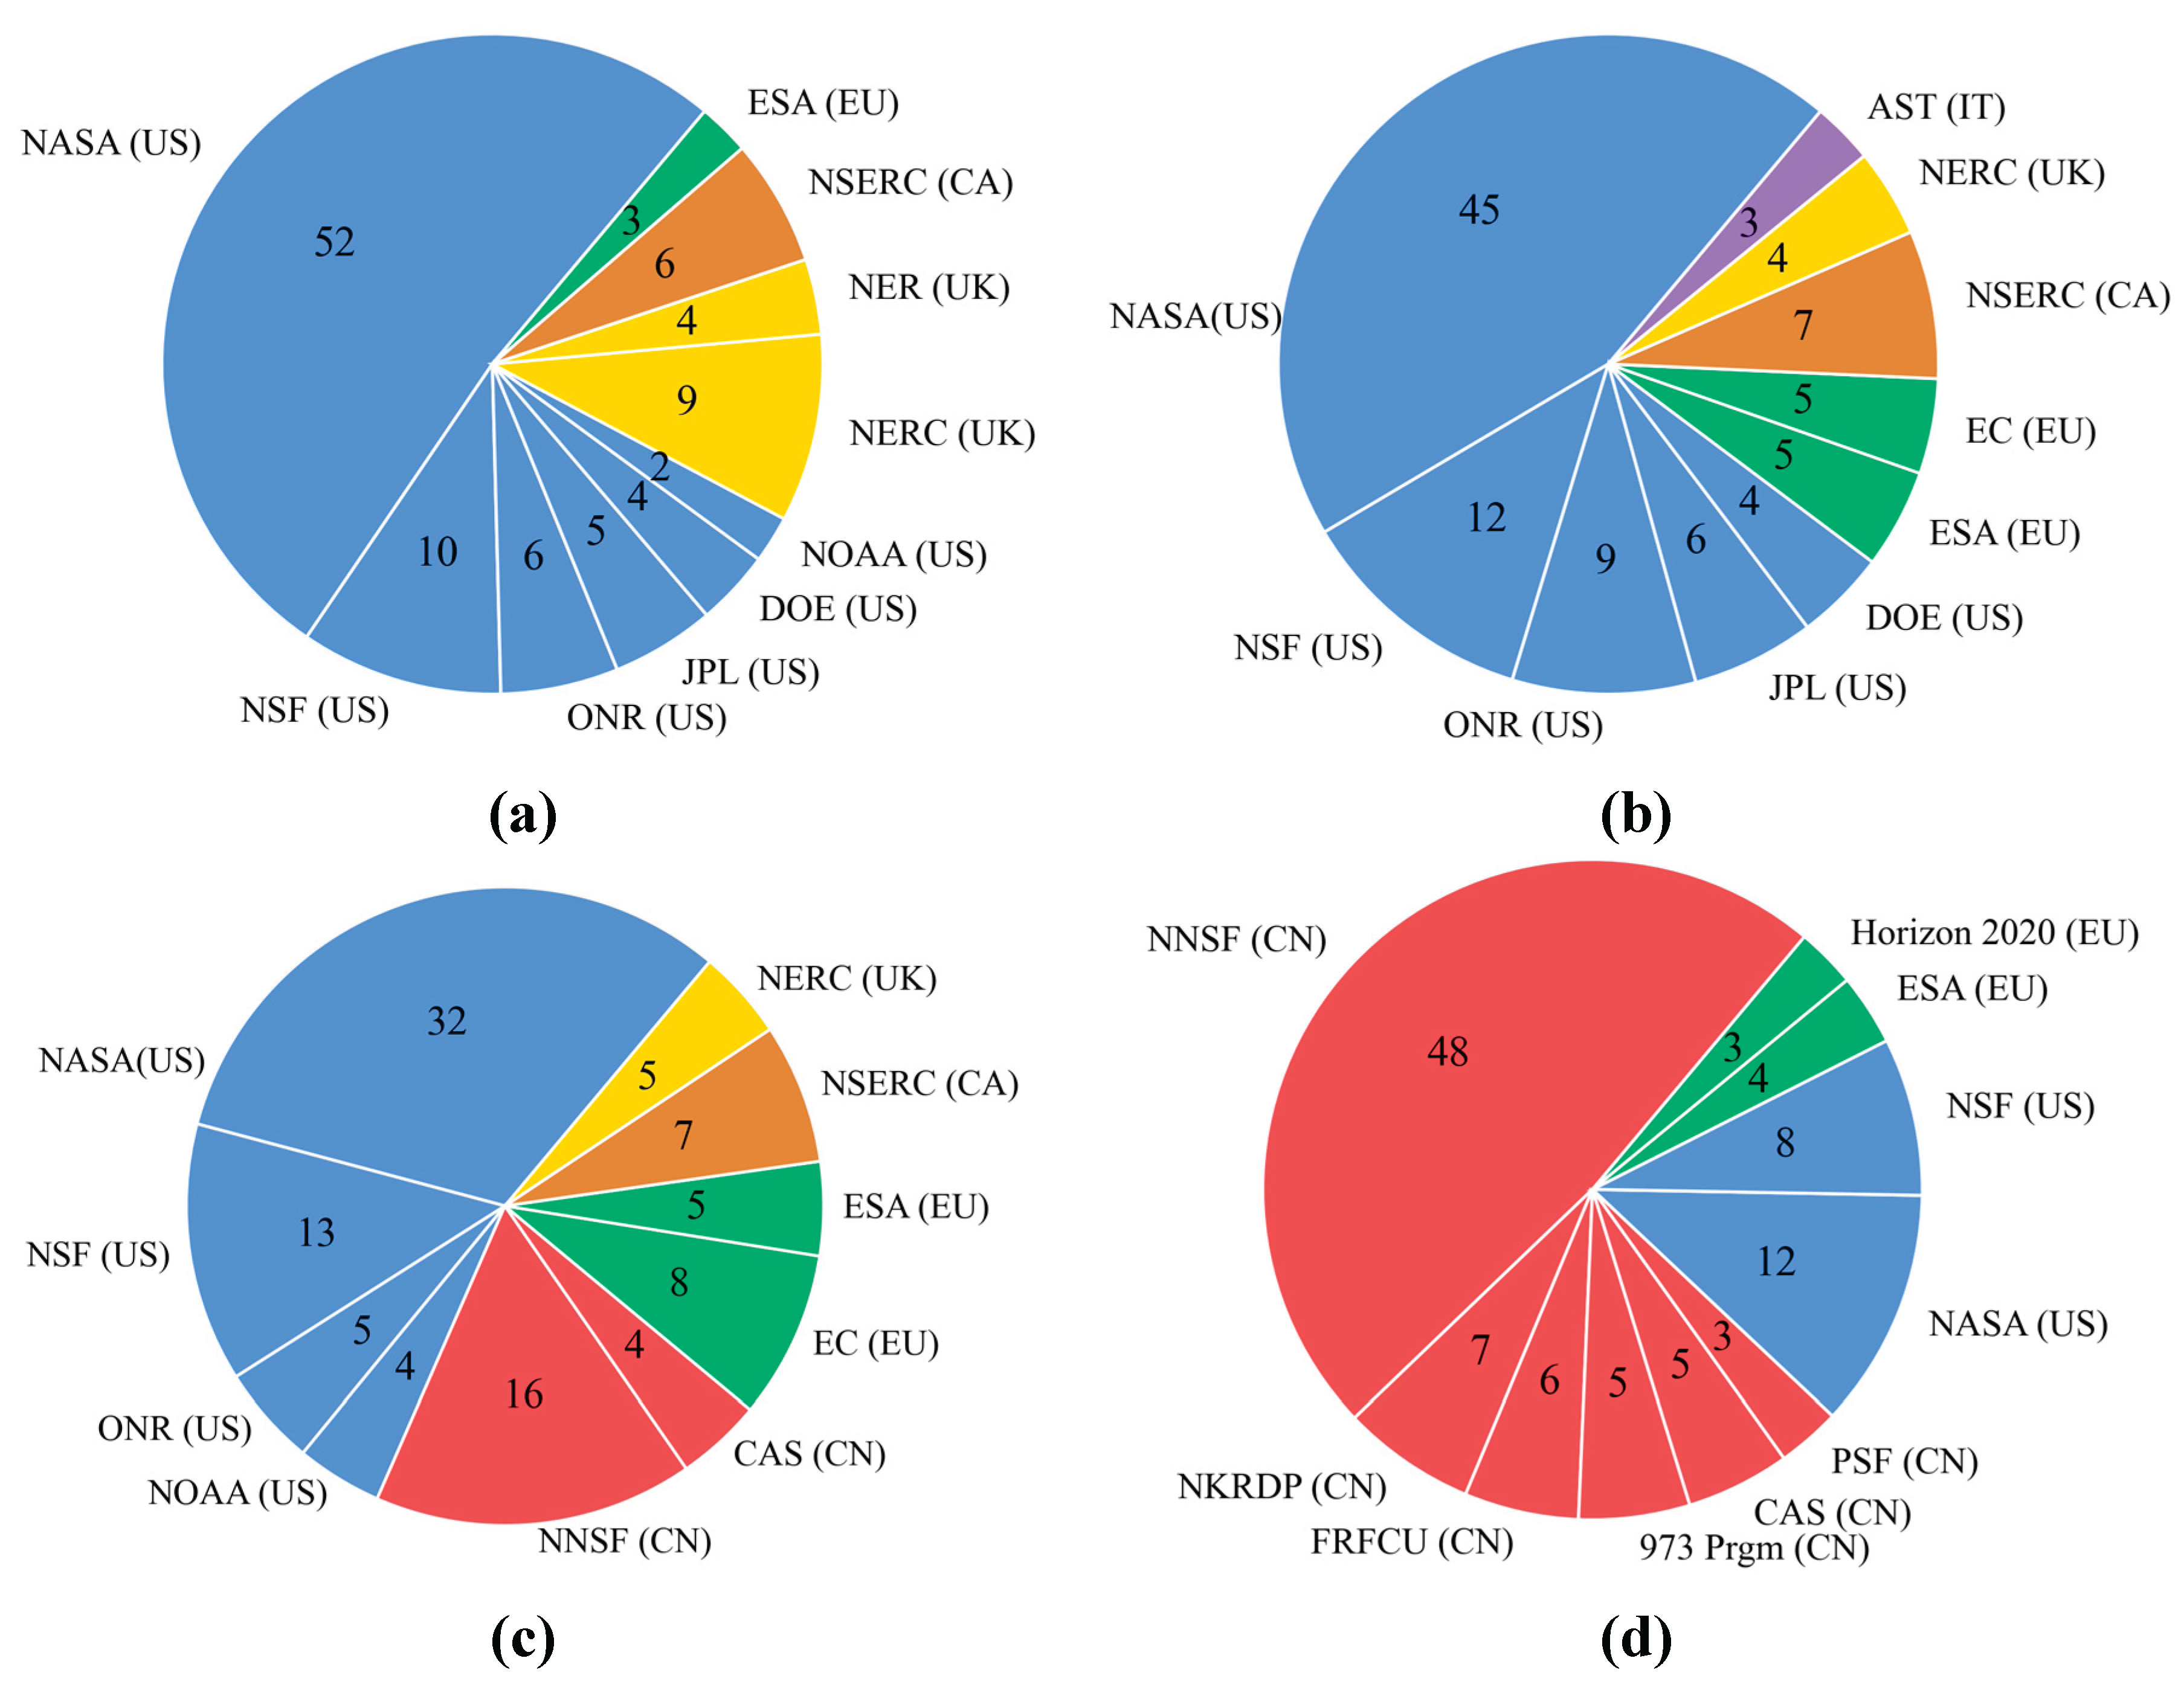
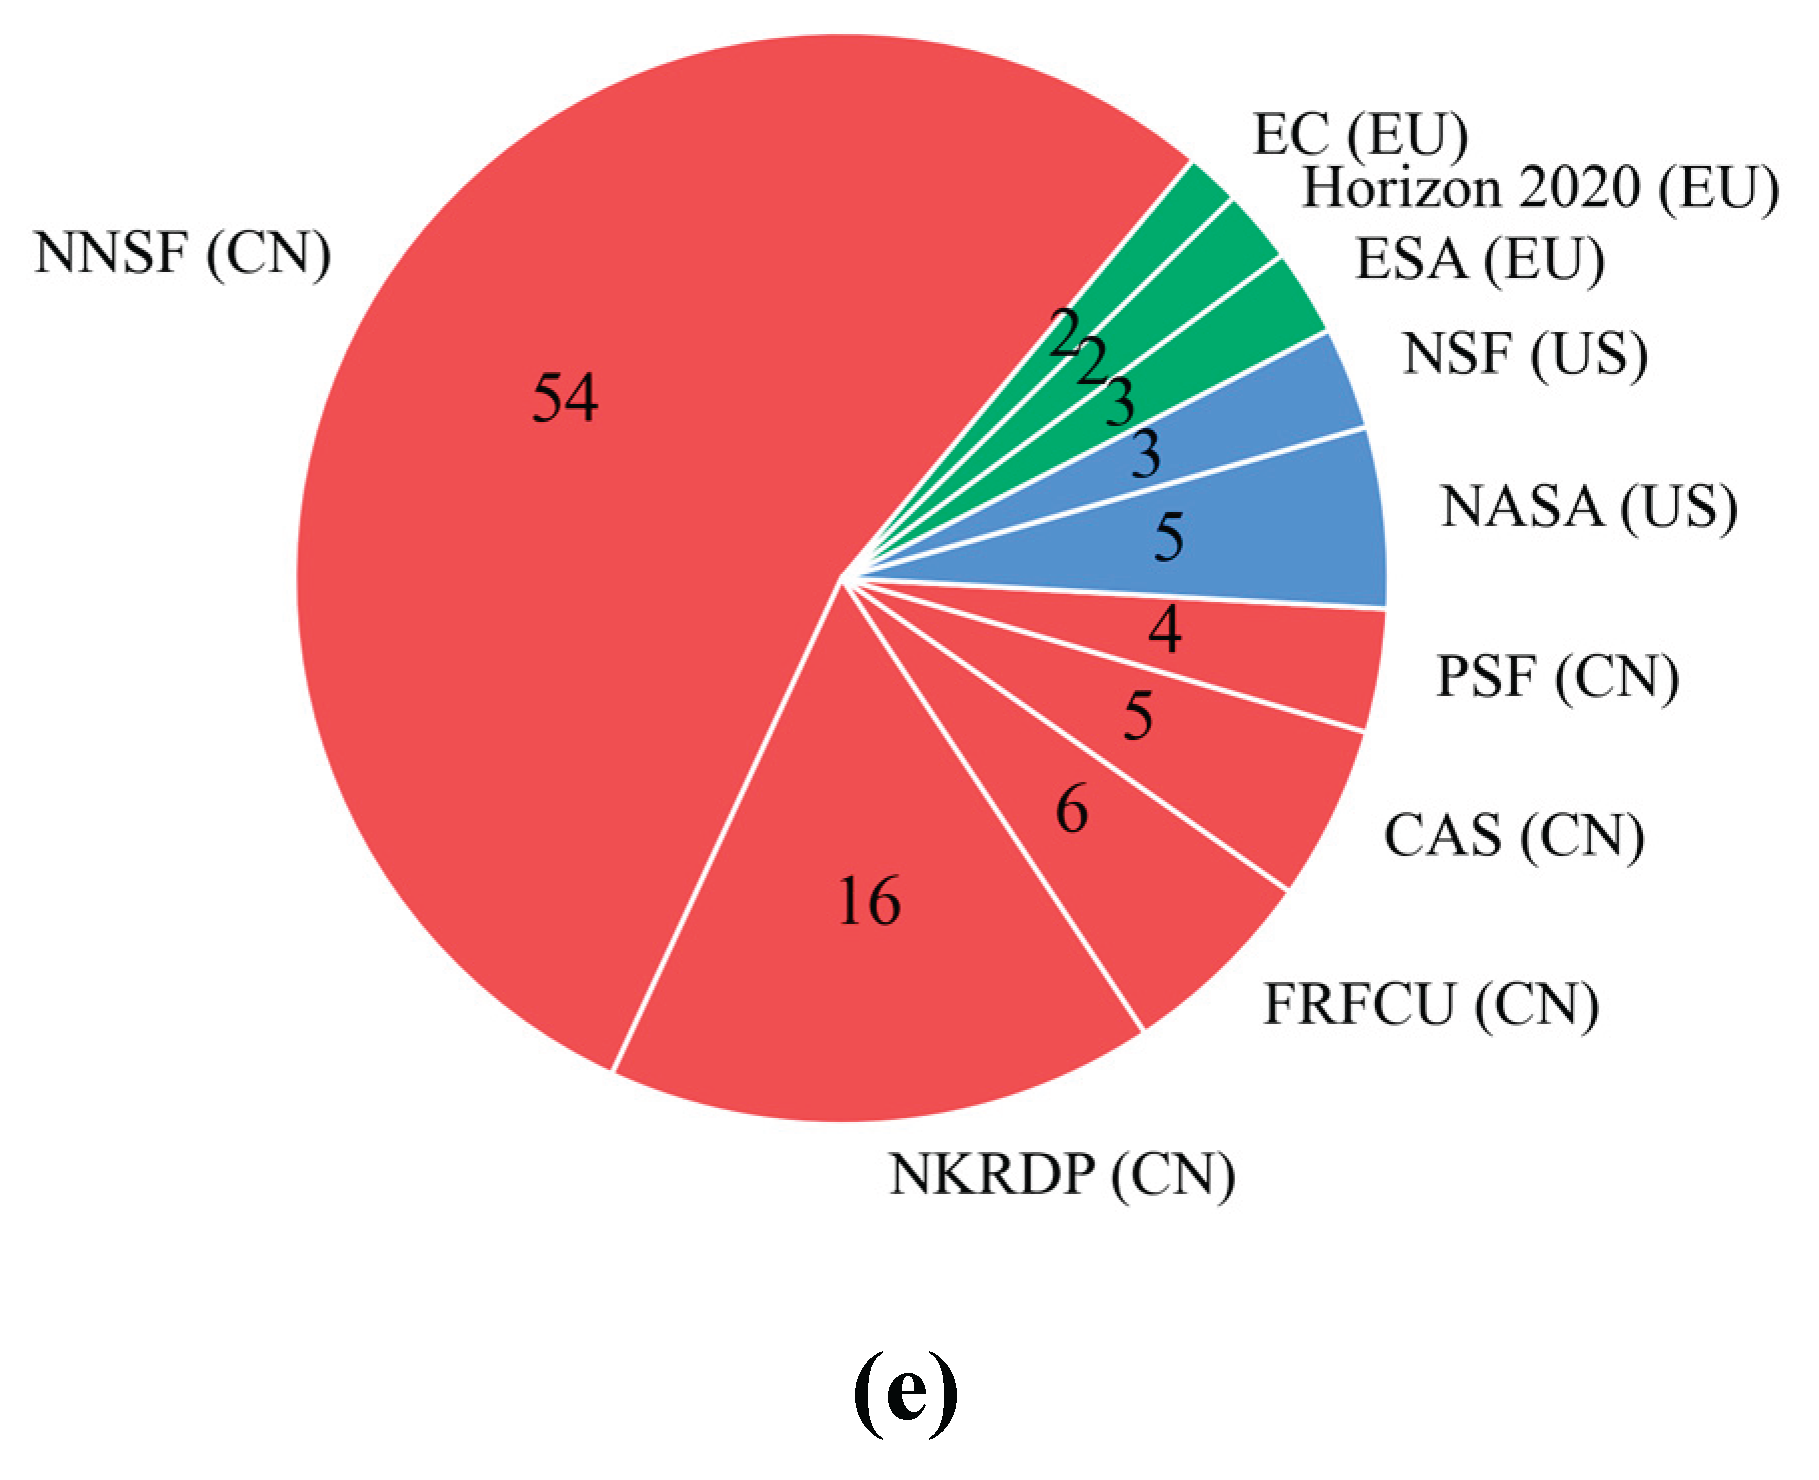
Figure 6.
Percentages vs. Number of Funders.
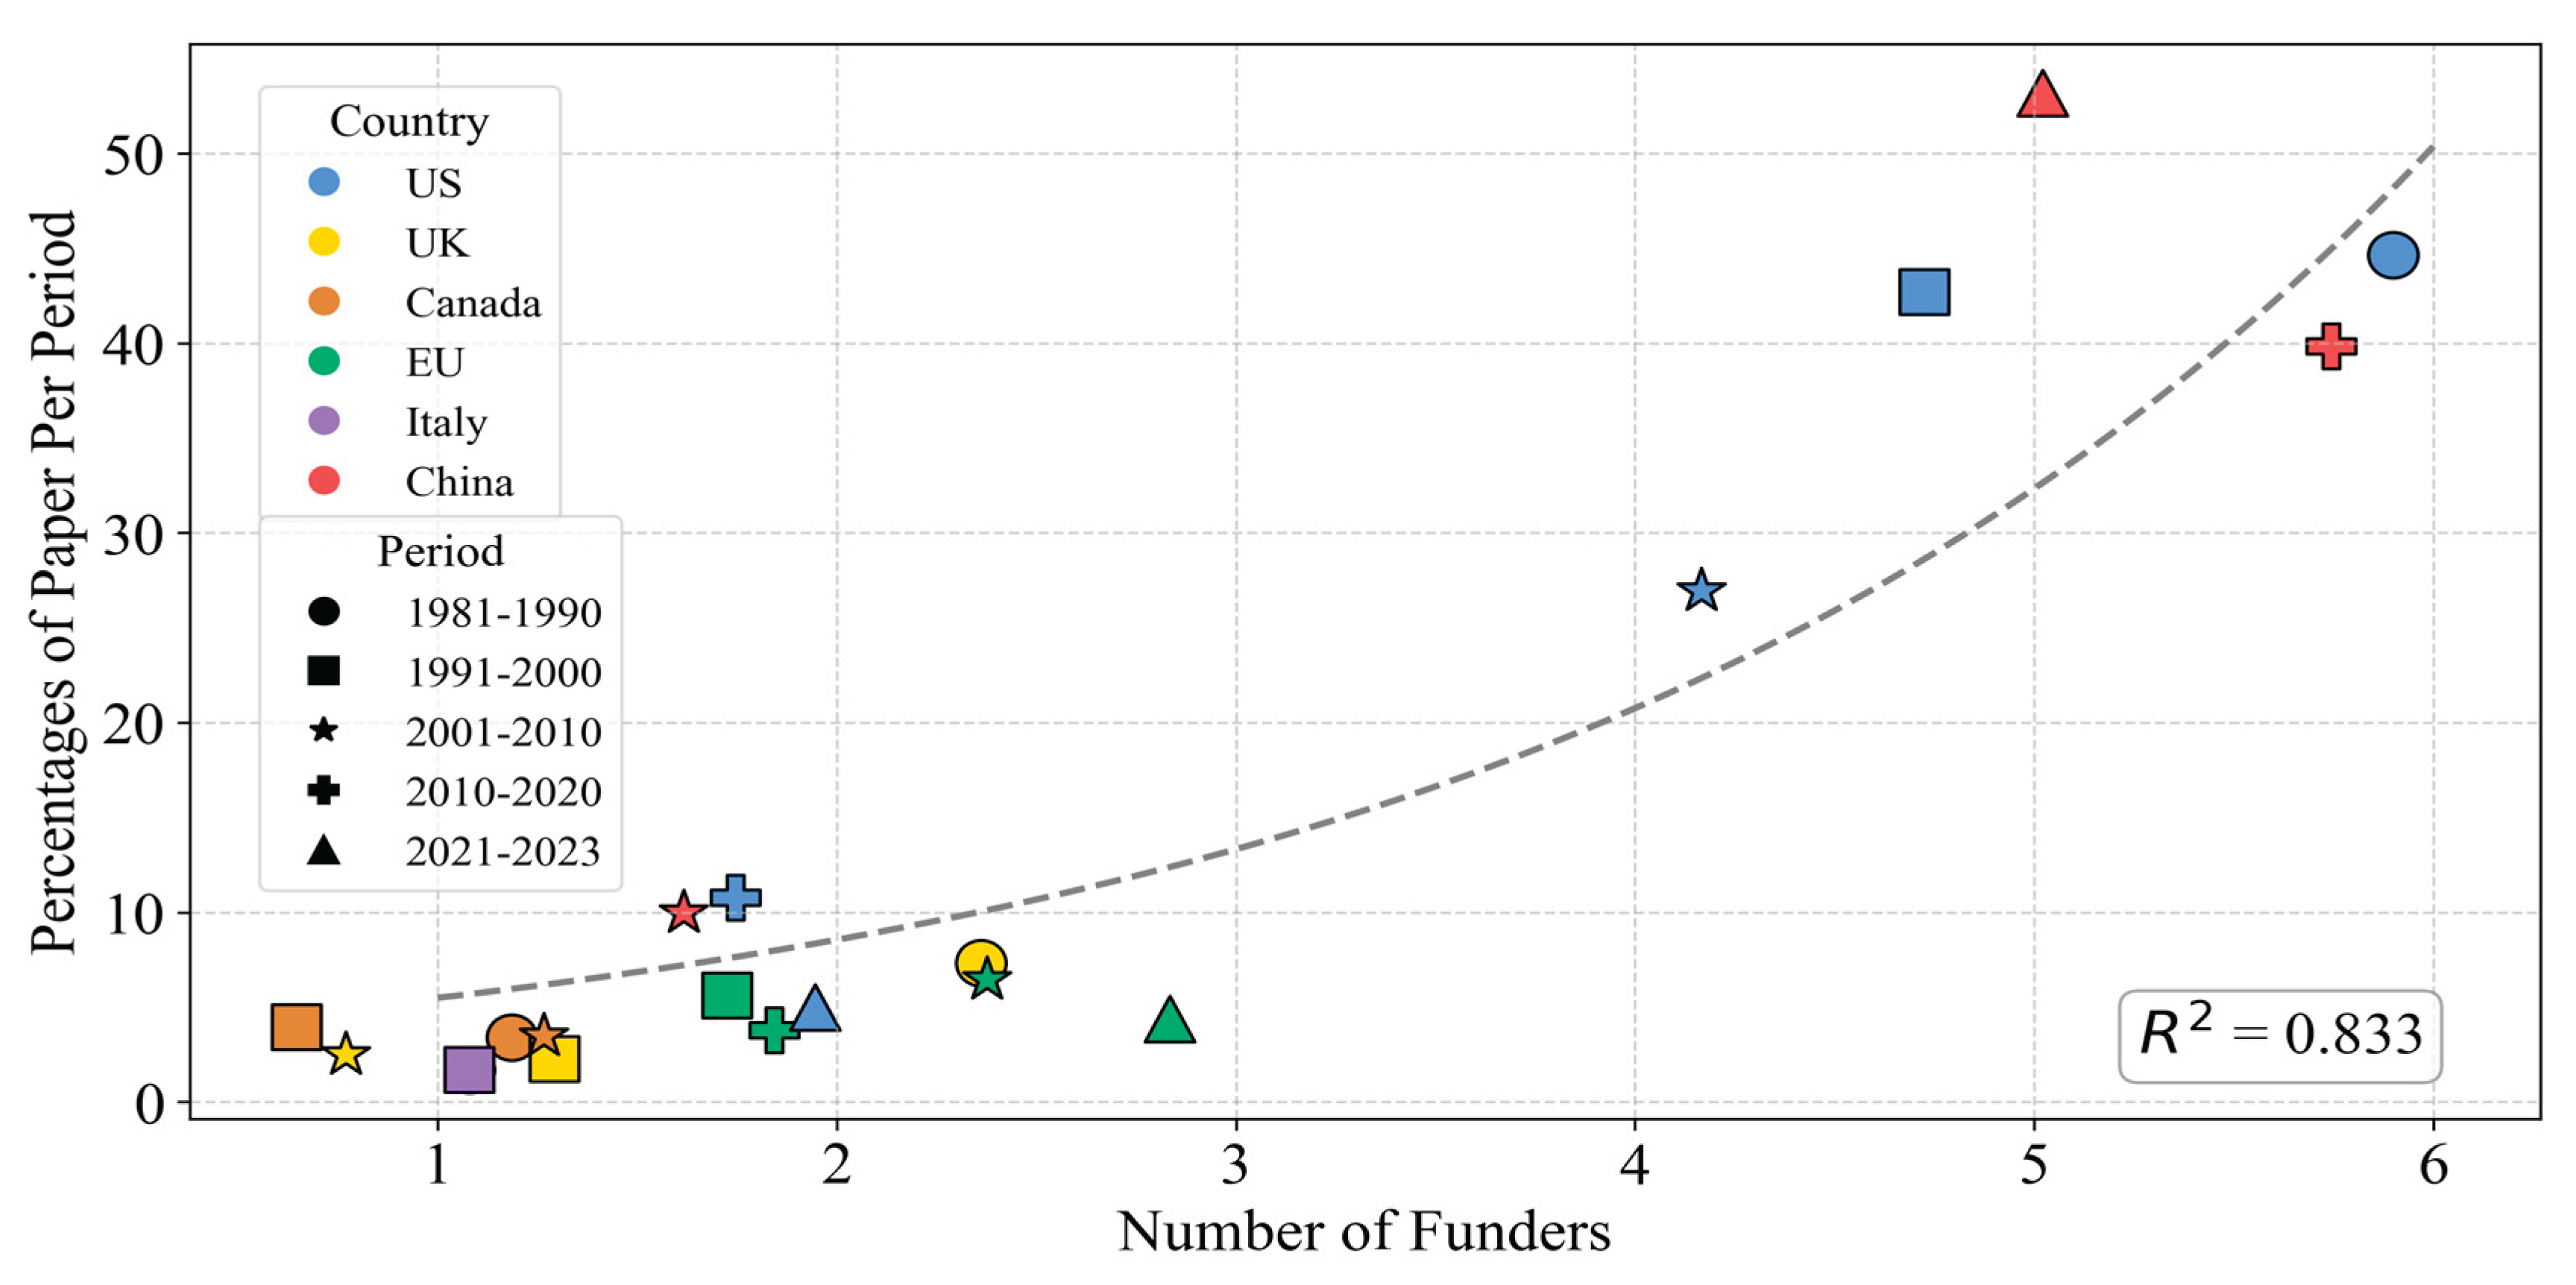
Figure 7.
Number of remote sensing papers mentioning “deep learning” or “machine learning”.
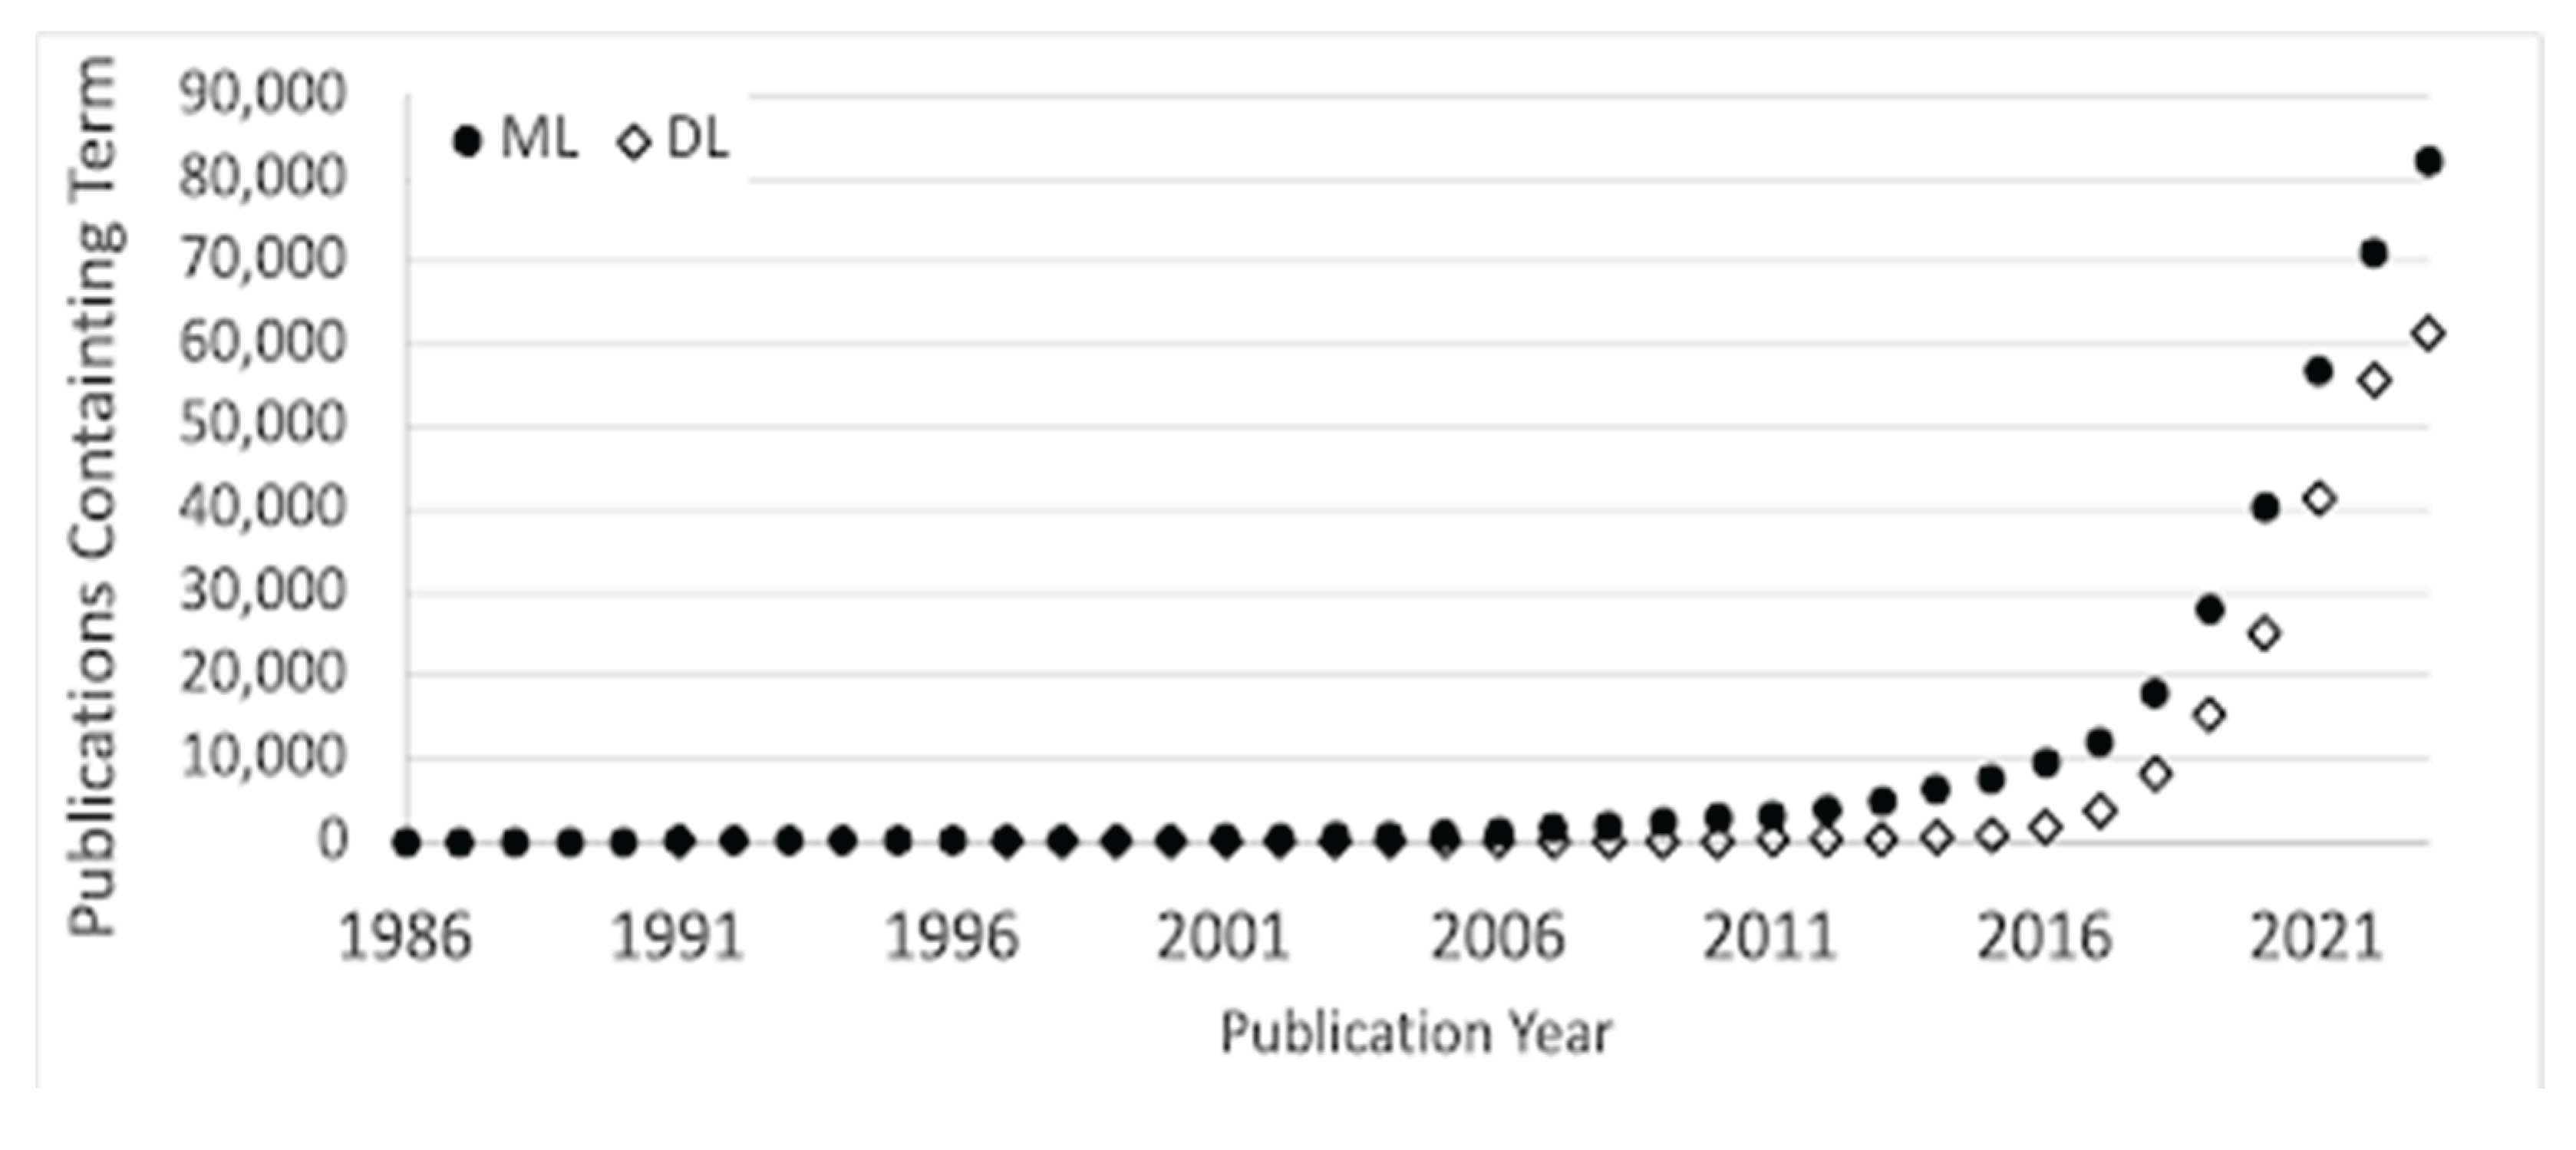
Figure 8.
Word Cloud a Period 1991-2000; b Period 2001-2010; c Period 2011-2020; d Period 2021-2023.
Figure 8.
Word Cloud a Period 1991-2000; b Period 2001-2010; c Period 2011-2020; d Period 2021-2023.
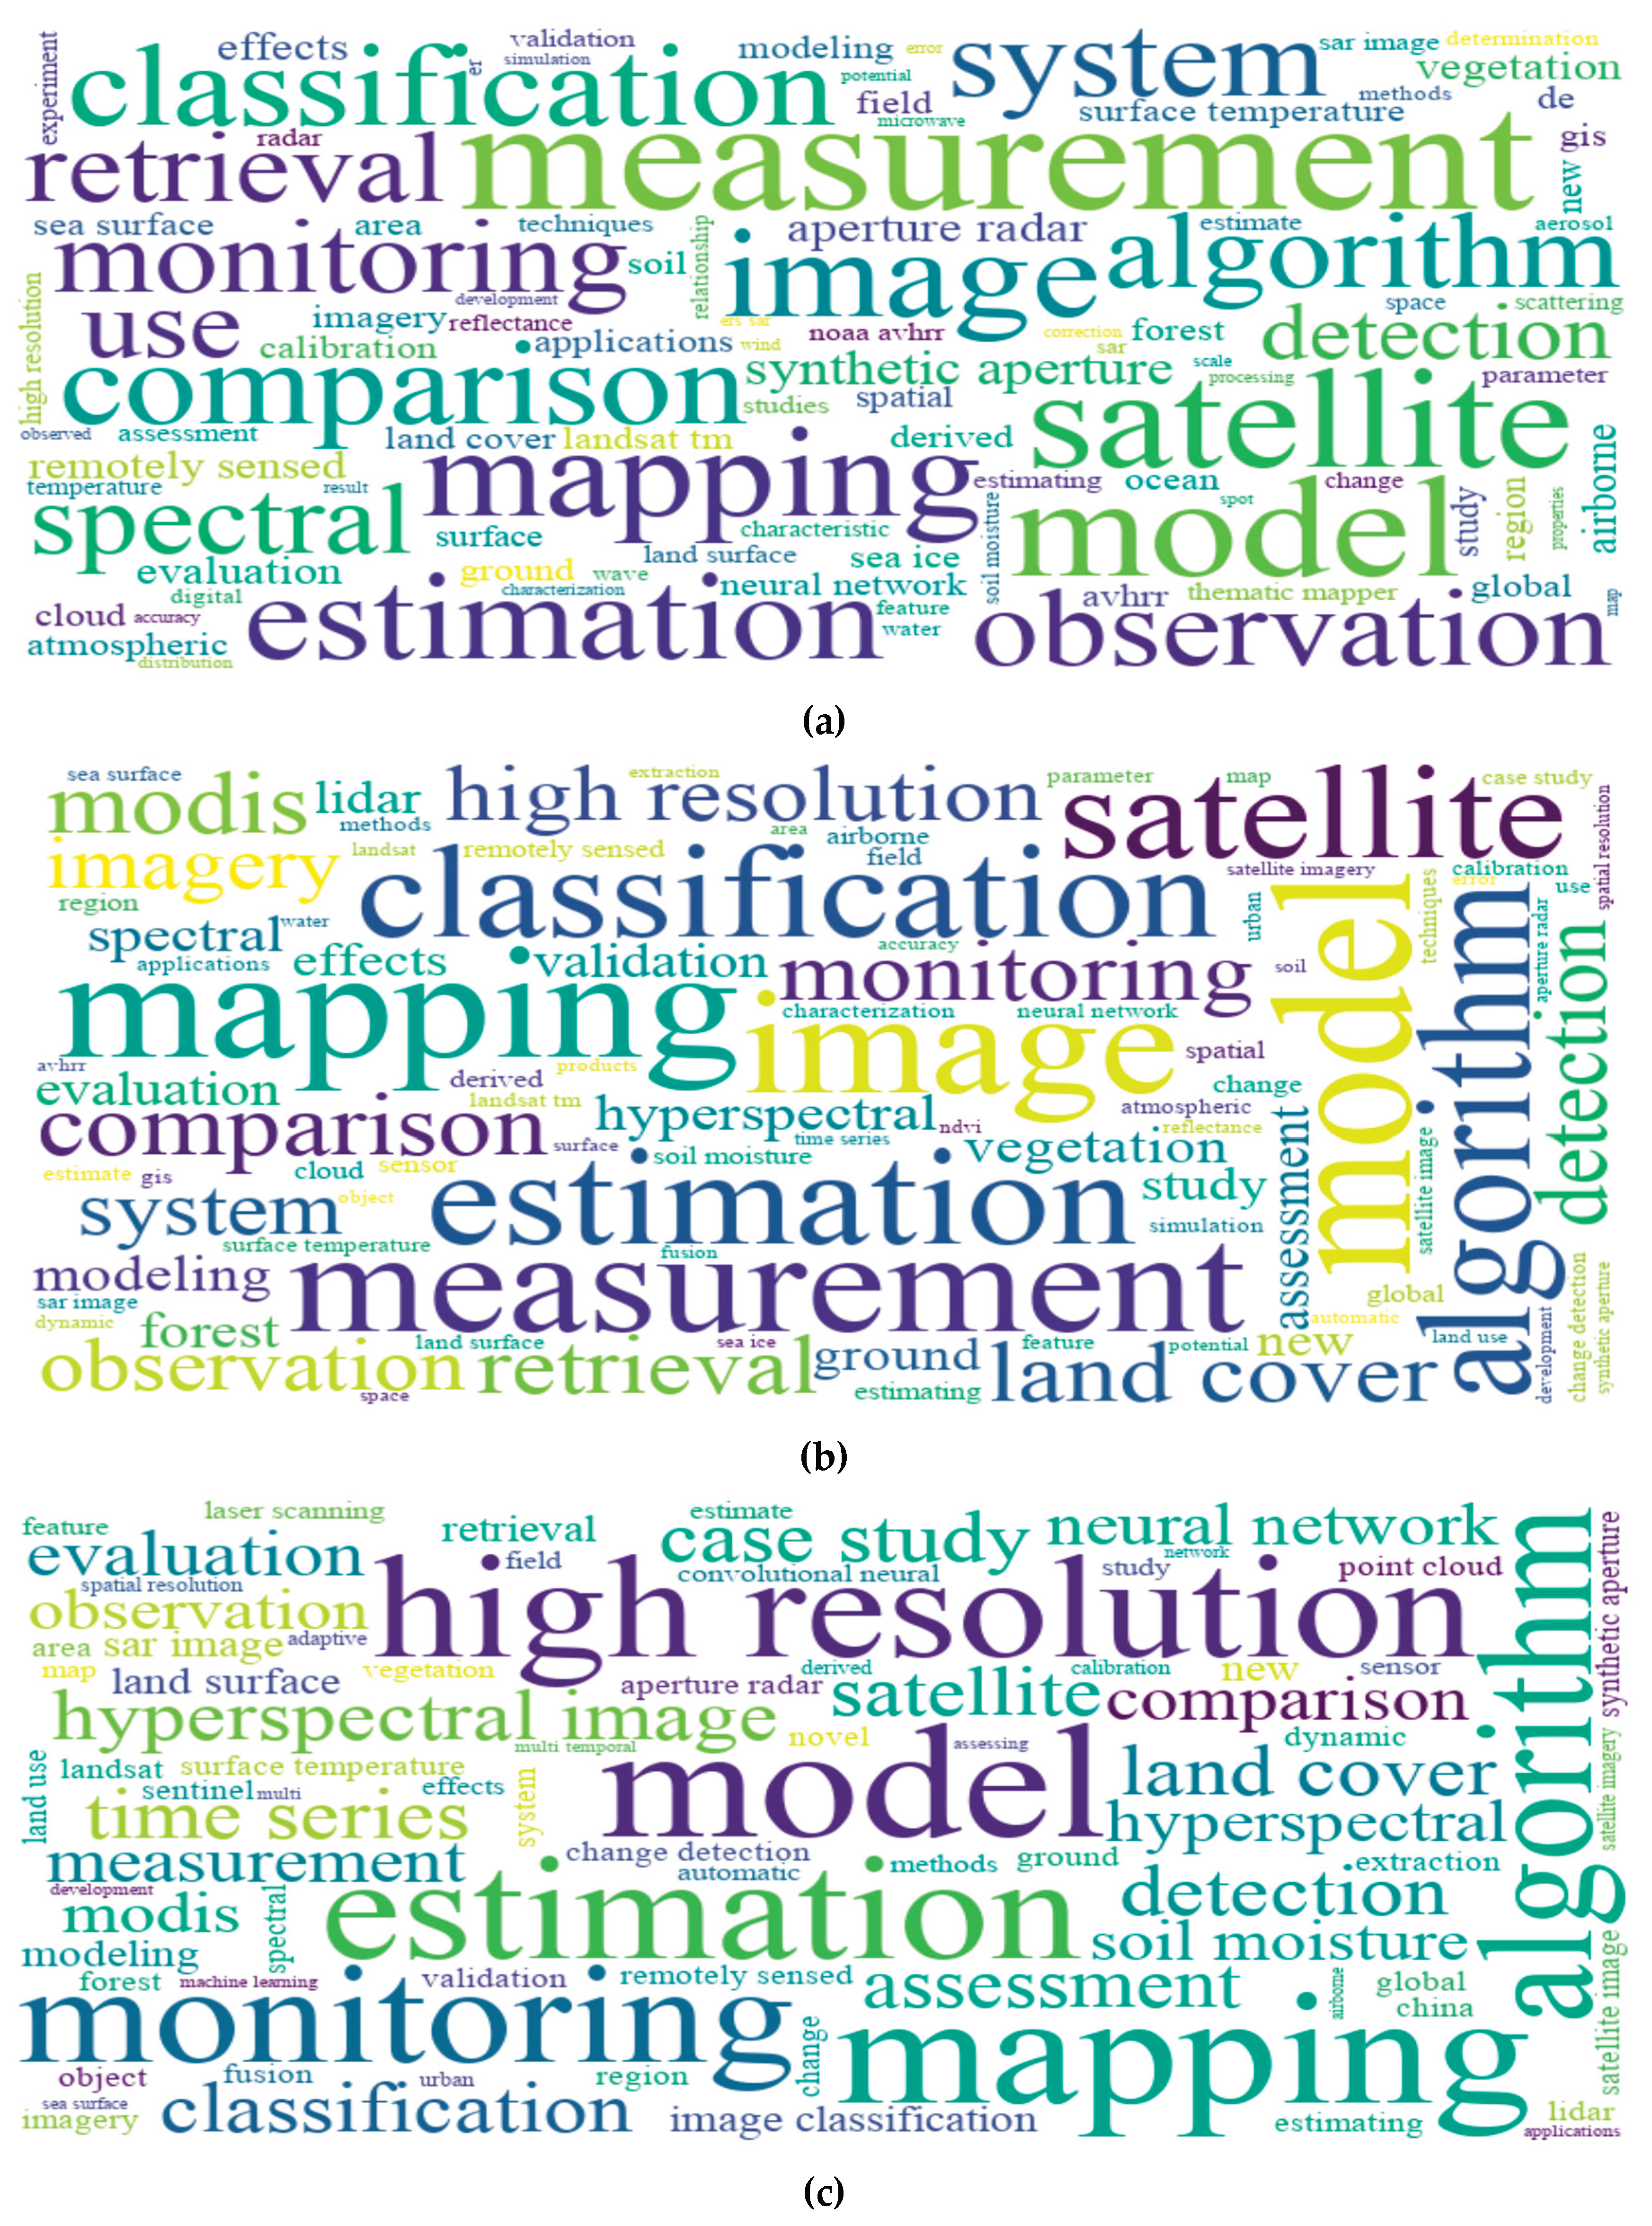
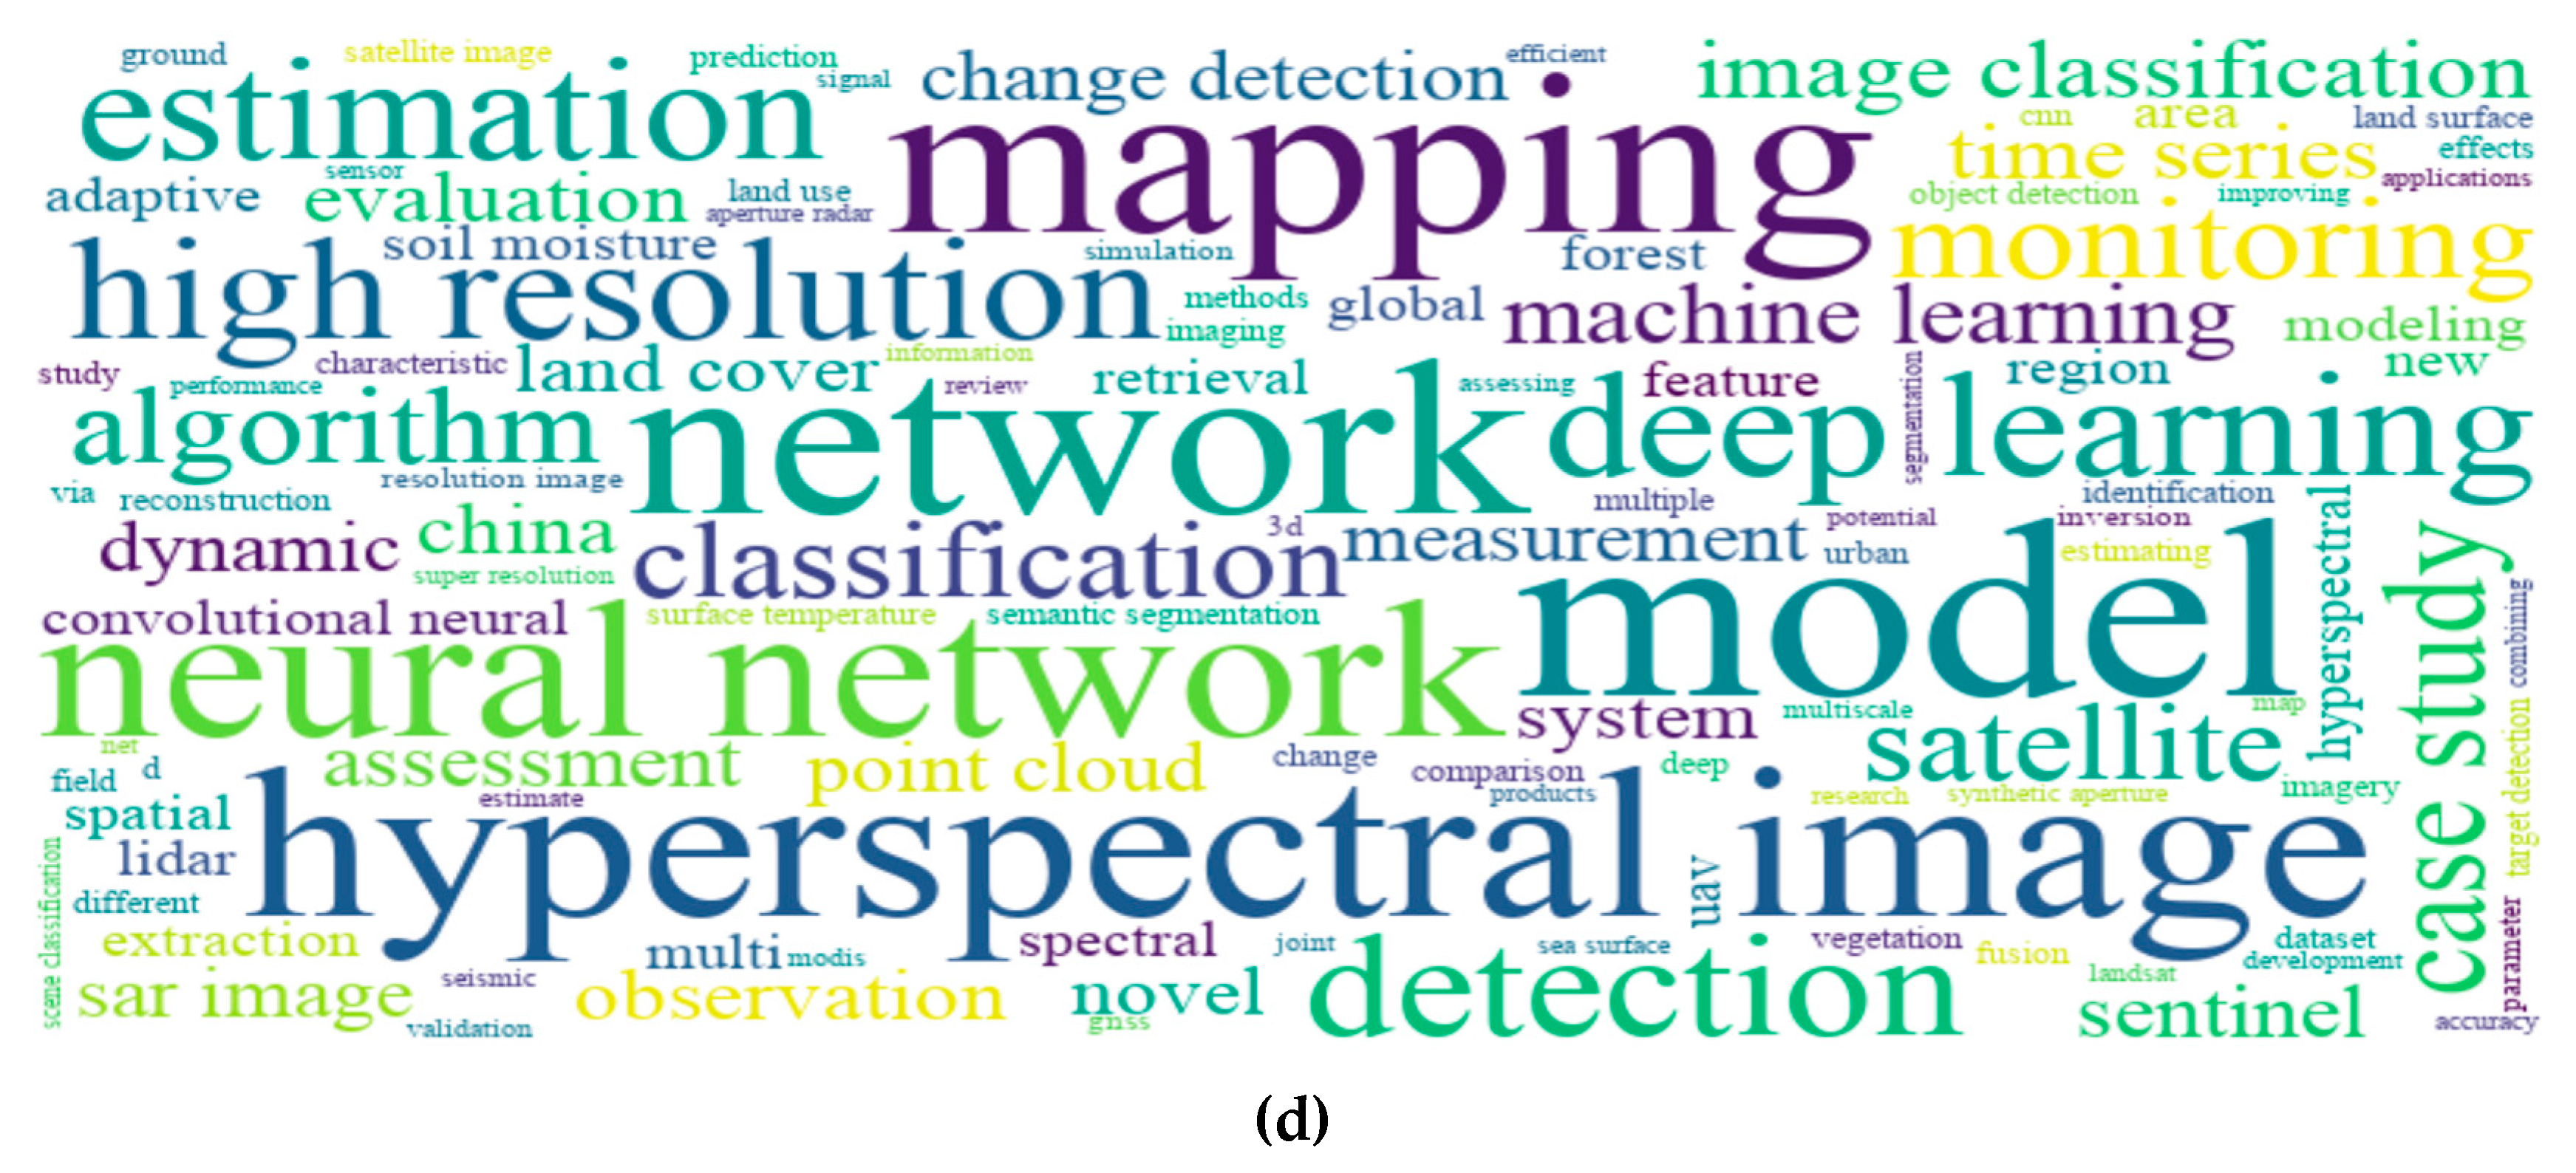
Figure 9.
National origin of top 19 patent filers per period “remote sensing” per period clustered by nation as per colors in Appendix ** per subsector (G=government entity; U = university; P = private company) [28].
Figure 9.
National origin of top 19 patent filers per period “remote sensing” per period clustered by nation as per colors in Appendix ** per subsector (G=government entity; U = university; P = private company) [28].
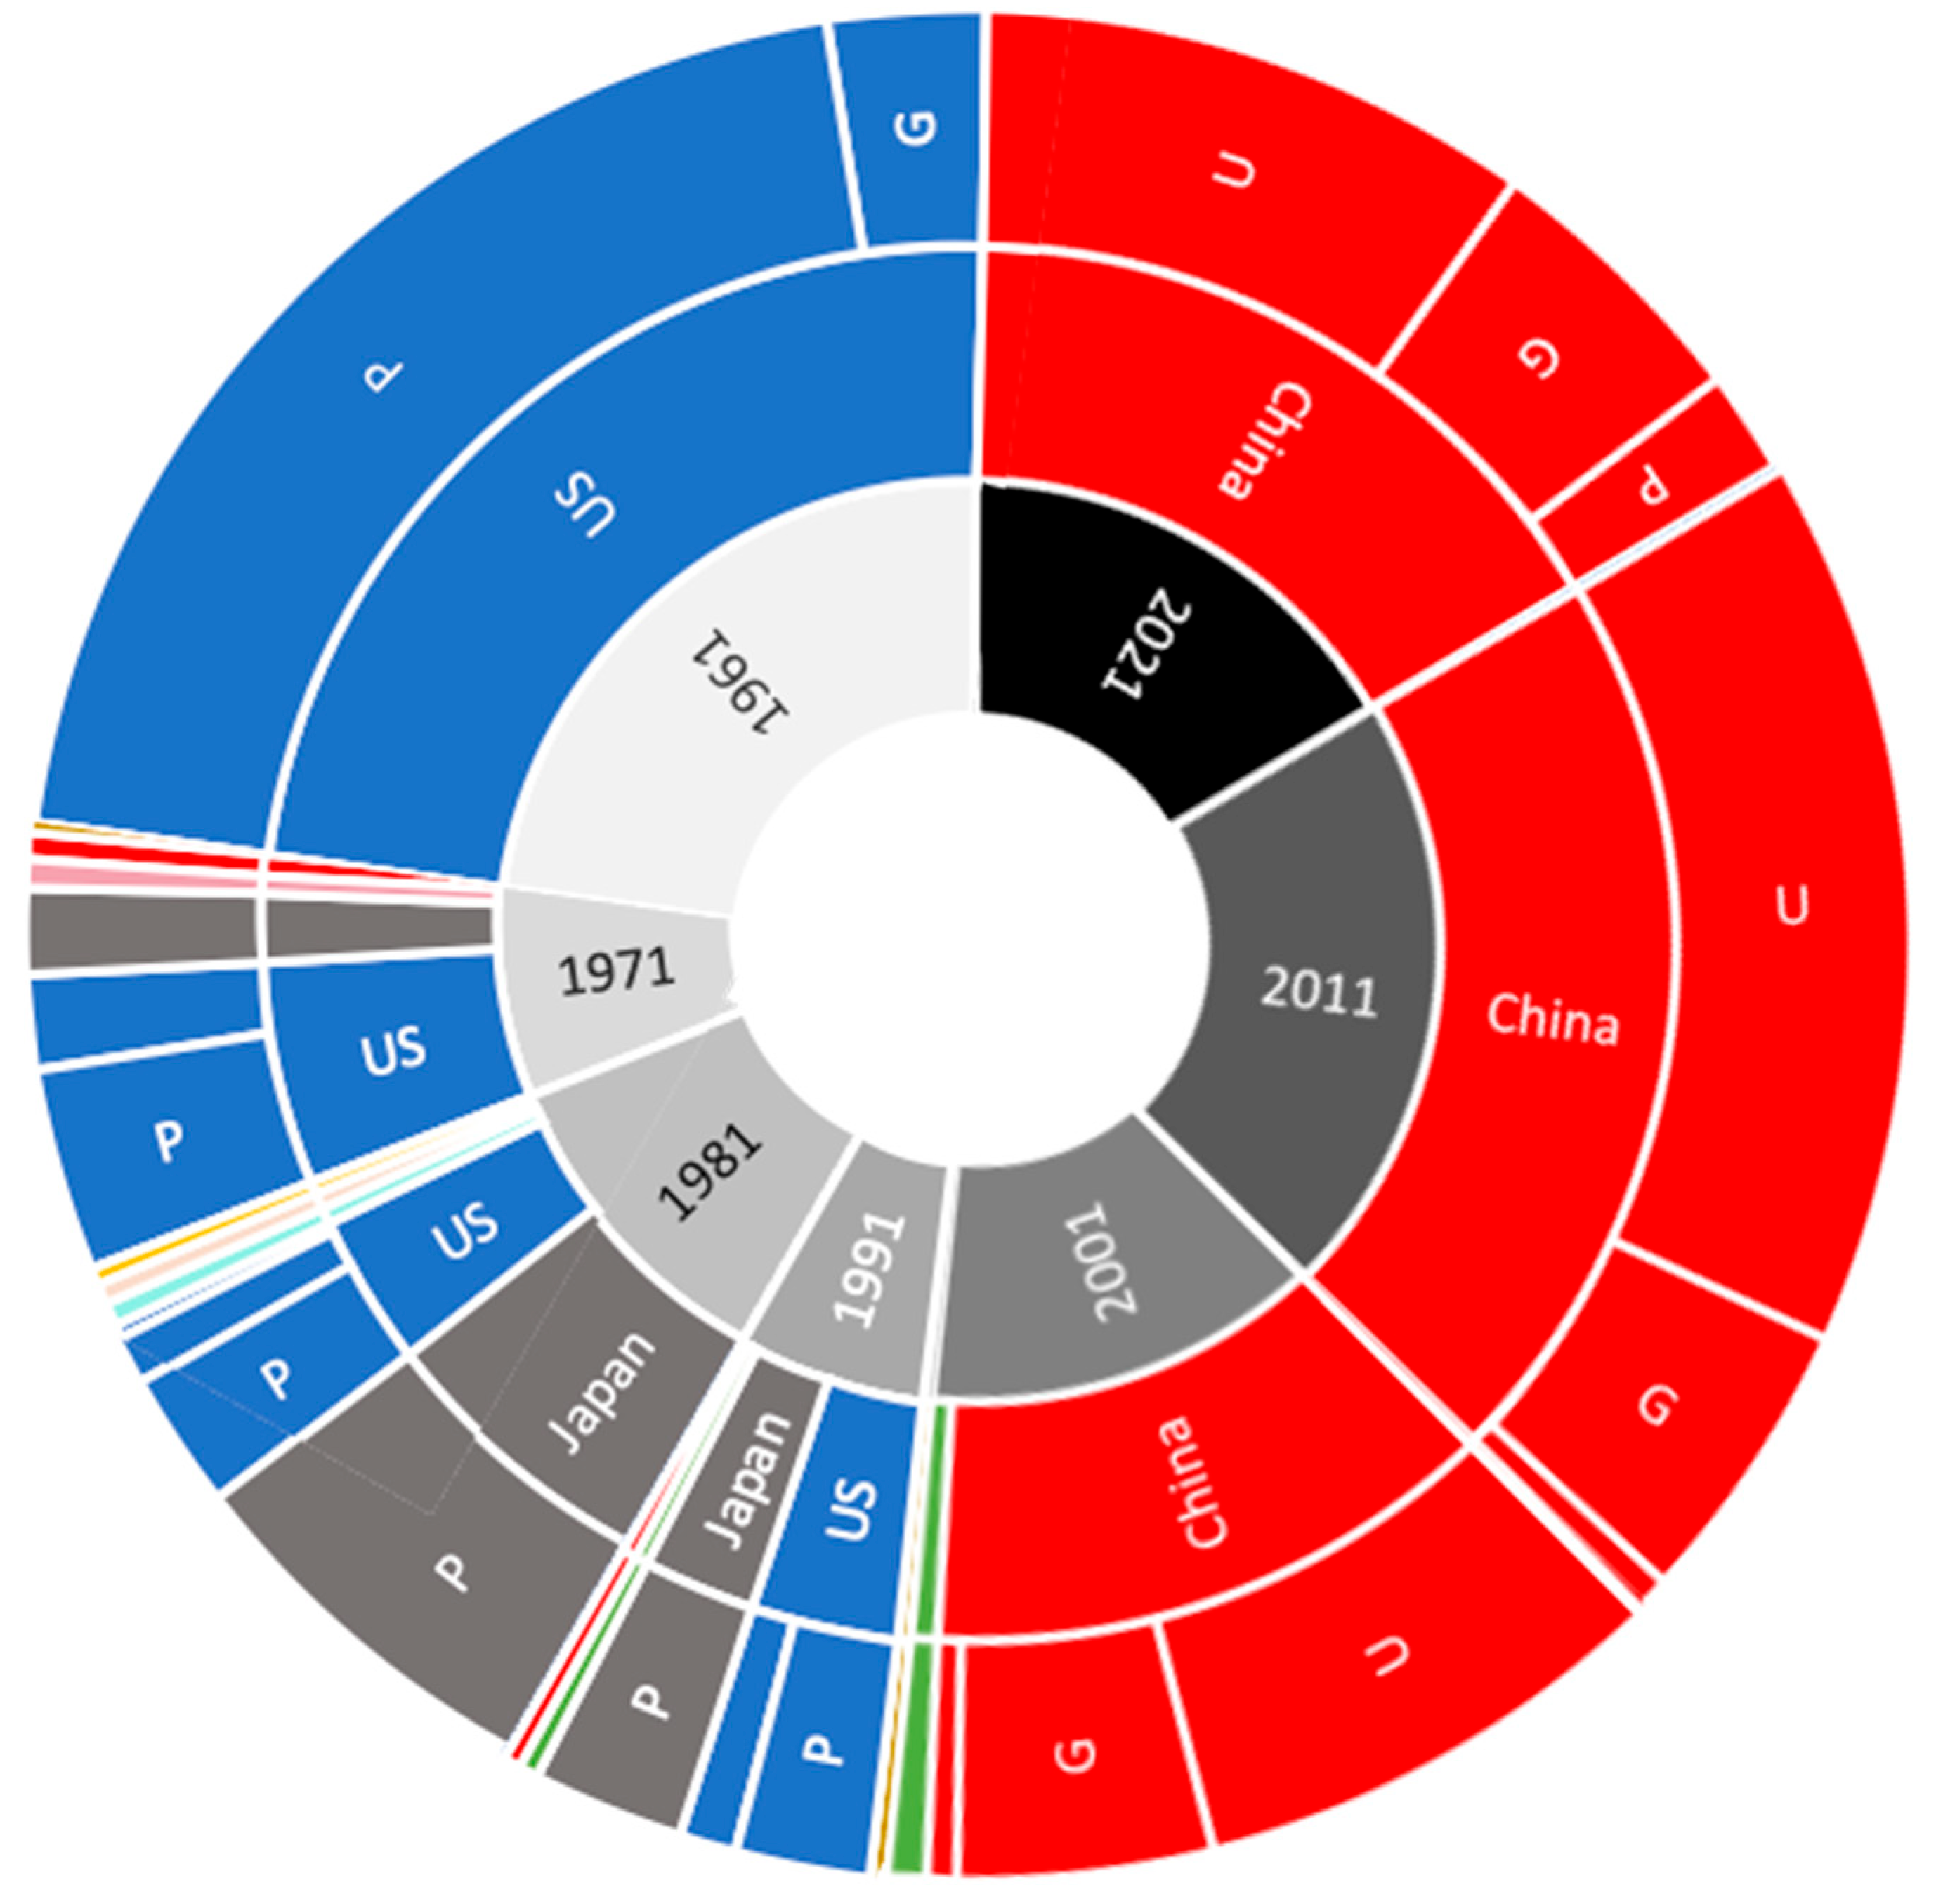
Table 1.
Overview of paper production and relevant journals.
| Period | Av. Number of Paper/Yr | Number ofJournals | Av. Papers per Journal/Yr | Total Papers |
| 1961–1970 | 14.7 | 9 | 1.63 | 147 |
| 1971–1980 | 104.9 | 25 | 4.20 | 1,049 |
| 1981–1990 | 575.7 | 33 | 17.45 | 5,757 |
| 1991–2000 | 967.0 | 31 | 31.19 | 9,670 |
| 2001–2010 | 1,640.3 | 36 | 45.56 | 16,403 |
| 2011–2020 | 5,308.5 | 43 | 123.45 | 53,085 |
| 2021–2023 | 13,456.0 | 43 | 312.93 | 40,368 |
* See Appendix B Table B1 for full journal list.
Table 2.
Patents by period including term “Remote Sensing”.
| Years | 1961–1970 | 1971–1980 | 1980–1990 | 1991–2000 | 2001–2010 | 2011–2020 | 2021–2023 | 2021– 2025* |
| Patents | 92 | 368 | 1,934 | 4,974 | 15,944 | 72,830 | 43,048 | 58,953 |
| Per year | 9.2 | 36.8 | 193.4 | 497.4 | 1,594 | 7,283 | 14,349 | 17,864 |
* As per May 7, 2025.
Table 3.
Patent filings by national[27].
Table 3.
Patent filings by national[27].
| Country | 1980–99 | 1990–99 | 2000–11 | Total |
| United States (US) | 393,595 | 602,865 | 1,053,089 | 2,049,549 |
| China (CN) | 139 | 571 | 11,825 | 12,535 |
| Rest of the World (RW) | 314,738 | 504,955 | 1,005,371 | 1,825,064 |
| Total | 708,472 | 1,108,391 | 2,070,285 | 3,887,148 |
Disclaimer/Publisher’s Note: The statements, opinions and data contained in all publications are solely those of the individual author(s) and contributor(s) and not of MDPI and/or the editor(s). MDPI and/or the editor(s) disclaim responsibility for any injury to people or property resulting from any ideas, methods, instructions or products referred to in the content. |
© 2025 by the authors. Licensee MDPI, Basel, Switzerland. This article is an open access article distributed under the terms and conditions of the Creative Commons Attribution (CC BY) license (http://creativecommons.org/licenses/by/4.0/).
Copyright: This open access article is published under a Creative Commons CC BY 4.0 license, which permit the free download, distribution, and reuse, provided that the author and preprint are cited in any reuse.


