
Submitted:
16 June 2025
Posted:
18 June 2025
You are already at the latest version
Abstract
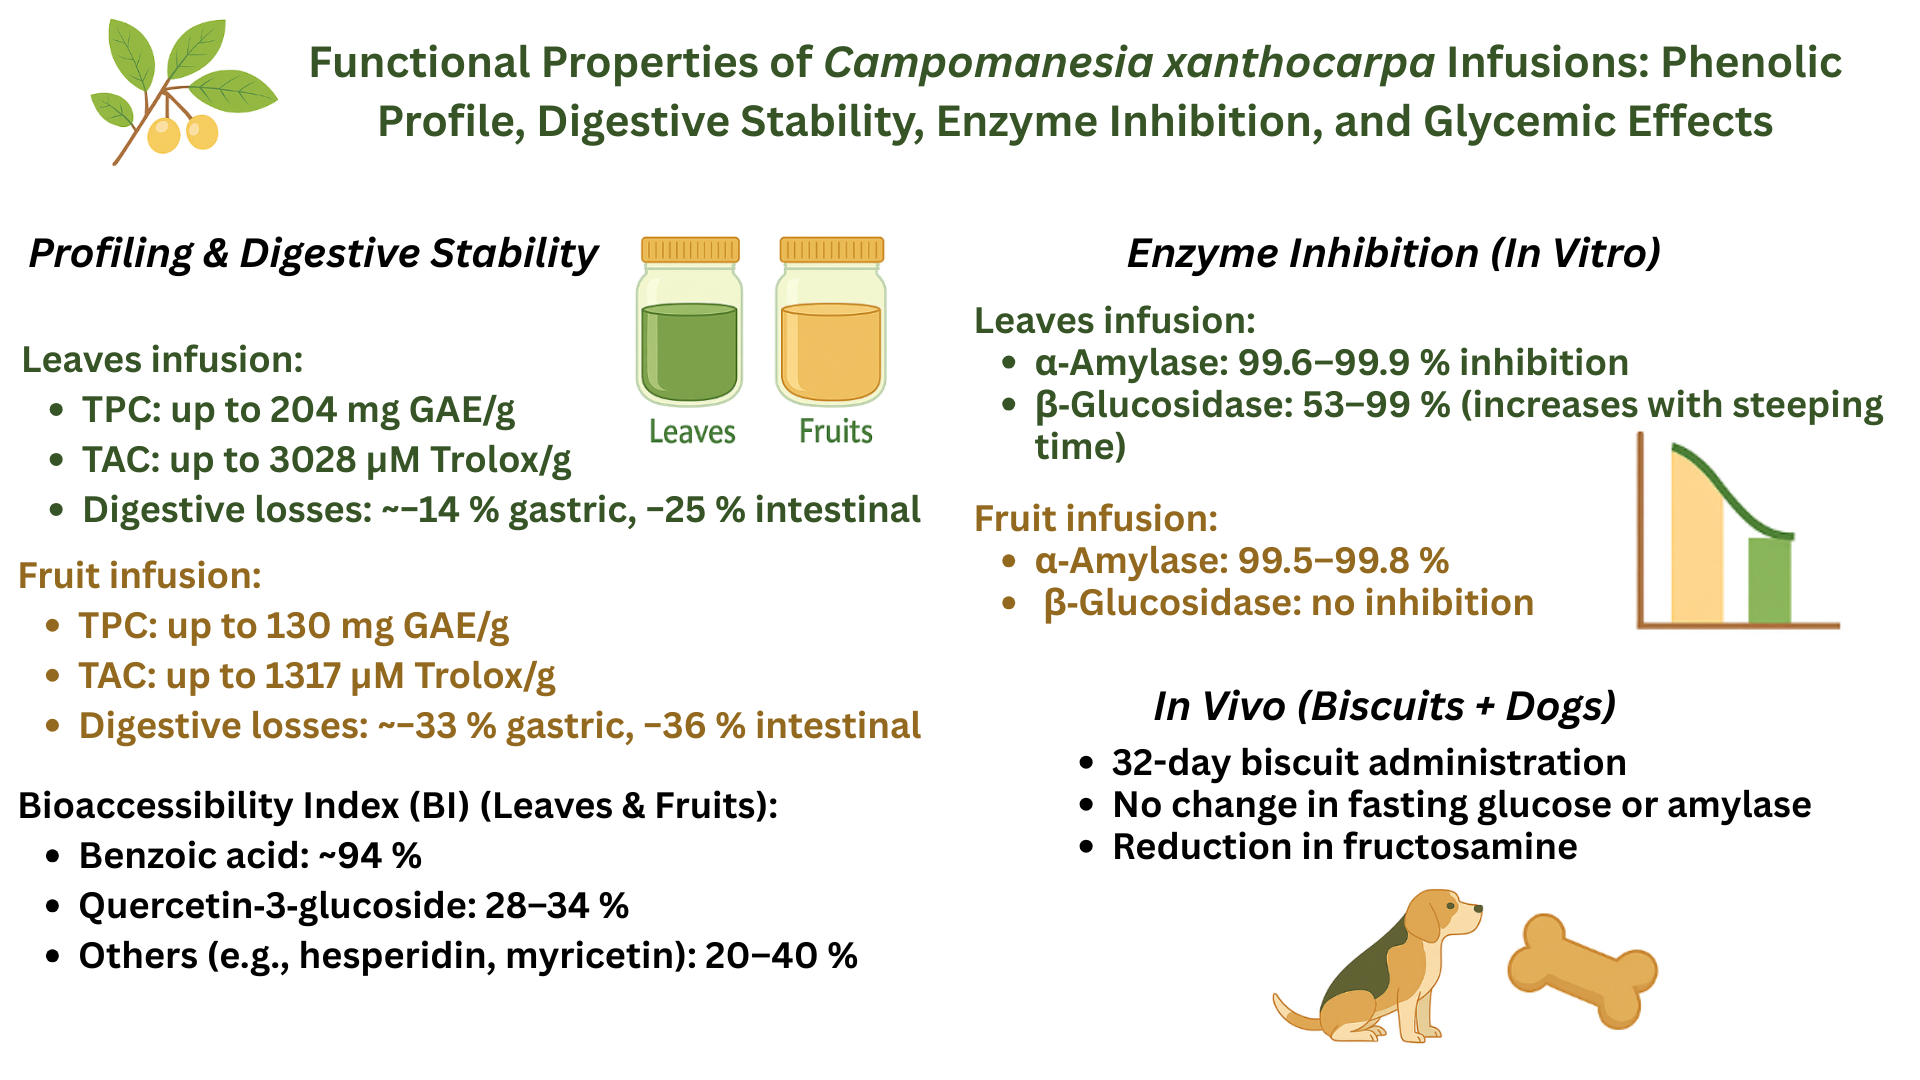
This study explored the functional potential of C. xanthocarpa infusions through phytochemical profiling, simulated gastrointestinal digestion, enzymatic inhibition assays, and an in vivo assessment of glycemic markers. Leaf infusions contained 32 phenolic compounds and exhibited higher total phenolic content (TPC; up to 204.2 mg GAE/g) and antioxidant capacity (TAC; up to 3028 µmol Trolox/g) compared to fruit infusions (21 compounds; 129.9 mg GAE/g and 1316.7 µmol Trolox/g). After digestion, leaf extracts showed greater stability, with TPC reductions of 13.8% (gastric) and 24.8% (intestinal), while fruit extracts decreased by 32.6% and 35.6%. Bioaccessibility indices were notable for compounds such as benzoic acid (93.7%) and quercetin-3-glucoside (up to 33.9%). In vitro assays revealed strong inhibition of salivary α‑amylase (99.7–99.9%) and β‑glucosidase (52.9–99.3%) by leaf extracts, whereas fruit extracts showed minimal activity against β‑glucosidase. In a 32‑day in vivo trial, dogs fed biscuits enriched with leaf infusion experienced no change in fasting glucose or serum amylase, but exhibited a significant treatment × time interaction for serum fructosamine (p = 0.05), indicating a delayed modulation of glycemic control possibly related to antioxidant or antiglycation effects. The combined findings suggest that C. xanthocarpa leaf infusion is a promising functional ingredient for food formulations aimed at glycemic regulation and metabolic health.
Keywords:
Antioxidant activity
; Bioaccessibility
; Functional food
; Polyphenols
; α-Amylase inhibition
; Fructosamine
1. Introduction
Campomanesia xanthocarpa O. Berg, commonly known as guabiroba, is a native species of the Myrtaceae family that is widely distributed in the Atlantic Forest and Cerrado biomes, as well as in parts of Argentina and Paraguay. With small, round, yellow-orange fruits when ripe, opposite leaves, and white flowers, this plant has been traditionally used for both medicinal and dietary purposes, including the treatment of liver diseases, digestive disorders, inflammation, and diabetes [1]. Recent studies have shown that extracts from its leaves and fruits exhibit anti-inflammatory, hepatoprotective, cardioprotective, antioxidant, and antihyperglycemic properties [2,3,4,5].
These properties are largely attributed to the presence of phenolic compounds such as gallic acid, chlorogenic acid, quercetin, and myricetin, which are known for their ability to neutralize reactive oxygen species and reduce cellular oxidative stress [6]. This mechanism is particularly relevant due to the established link between oxidative stress and chronic metabolic diseases such as type 2 diabetes, cardiovascular conditions, and systemic inflammatory damage. In addition, fruits from the Myrtaceae family have demonstrated significant inhibitory activity against digestive enzymes such as α-glucosidase and α-amylase, thereby affecting starch breakdown and carbohydrate absorption in the small intestine. Inhibiting these enzymes is considered an effective strategy for postprandial glycemic control and is viewed as a promising approach for managing hyperglycemia in patients with type 2 diabetes [7].
Several clinical and experimental studies indicate that dietary polyphenols exert hypoglycemic effects by acting at multiple stages of glucose metabolism, including modulating intestinal glucose transporters (SGLT1 and SGLT2), inhibiting hepatic gluconeogenesis, stimulating peripheral glucose uptake, and preserving pancreatic β-cell function [8,9,10]. Additionally, polyphenols have been shown to influence intracellular pathways such as AMPK and PI3K/Akt, thereby affecting insulin sensitivity and glycemic homeostasis [11,12].
However, the functional efficacy of these compounds depends on their bioaccessibility and bioavailability, which are influenced by factors such as the composition of the food matrix, preparation method, digestive stability, phase I/II metabolism, and microbial biotransformation in the gut. The interaction between phenolic compounds and food matrices plays a pivotal role in determining their stability and functionality during digestion. Components such as dietary fibers, proteins, and lipids can interact with polyphenols, potentially forming complexes that hinder or enhance their bioaccessibility [13]. Furthermore, thermal and mechanical processing of foods may alter the chemical structure of polyphenols, thereby impacting their absorption and biological activity [14]. These transformations may either impair the health benefits of phenolic compounds or, in some cases, enhance their availability by breaking down the matrix.
In particular, proteins present in food matrices can bind polyphenols through covalent or non-covalent interactions—such as hydrogen bonding, hydrophobic interactions, and van der Waals forces—forming complexes that influence both phenolic compound stability and protein digestibility [15,16]. These complexes may reduce phenolic solubility and impair their recognition by intestinal transporters, but they can also act as controlled-release systems, enhancing stability and allowing for distal intestinal delivery [14,17]. As such, food matrices should not be seen as a limitation but rather as a technological opportunity to modulate the bioactivity of phenolic compounds, particularly in functional products such as baked goods.
Once ingested, phenolic compounds undergo multiple metabolic processes, including phase I/II enzymatic modifications and extensive microbial biotransformation in the colon, which generate bioactive metabolites with distinct pharmacokinetic profiles [18]. These metabolites are often responsible for the systemic effects observed in vivo and should be considered in the functional evaluation of polyphenol-rich foods. Although the literature highlights the potential therapeutic effects of C. xanthocarpa, few studies integrate phytochemical characterization, in vitro digestibility, phenolic bioaccessibility, and physiological outcomes following consumption via solid food matrices. Research that evaluates these variables in an integrated manner is essential to validate the use of plant extracts in functional and nutraceutical formulations.
Therefore, this study aimed to evaluate the phenolic profile of C. xanthocarpa leaf and fruit infusions prepared at different extraction times, investigate their stability and bioaccessibility after simulated in vitro digestion, assess their inhibitory potential against digestive enzymes (α-amylase and glucoamylase), and examine the physiological effects of consuming dry biscuits enriched with leaf infusion on glycemic markers (glucose, amylase, and fructosamine) in an animal model.
2. Material and Methods
2.1. Plant Material and Chemicals
Leaves and fruits of C. xanthocarpa were harvested in January 2023 (summer in Brazil) from a tree located in a rural area in the municipality of Nova Erechim, western Santa Catarina State (Latitude: 26º54'09" S, Longitude: 52º54'21" W). No fertilization or pesticide treatments were applied to the plant. A voucher specimen was deposited in the LUSC Herbarium of Santa Catarina State University (voucher number: LUSC 10711). The plant material underwent a manual pre-selection process, during which damaged specimens, those with altered coloration, and those showing signs of pathology were discarded, ensuring sample uniformity. Leaves were washed with distilled water and dried in a circulating air oven at 40 ± 5 °C until reaching a constant weight. Fruits were frozen at –83 °C and subsequently lyophilized at –60 °C and 0.05 mTorr (Benchtop Freeze Dryers, Model ilShin, Europe, NL) for 72 hours. Seeds were removed after freeze-drying. Following drying, all plant fractions were ground and sieved through an 8-mesh sieve. Fruit pulp and peel were processed together, while leaves were ground and sieved separately. All chemicals used in this study were of analytical grade. Key reagents included: Folin–Ciocalteu reagent, gallic acid, and sodium carbonate, acquired from Sigma-Aldrich® (Cotia, SP, Brazil). For the amylase assay: Amylase Assay Buffer, Amylase Substrate Mix, Amylase Positive Control, and Nitrophenol Standard were employed. For the β-glucosidase assay: Assay Buffer, β-NPG Substrate, and Calibrator. For antioxidant analysis: Reagent A, Reagent B, and a 50 mM Trolox Standard were used—all obtained from Sigma-Aldrich® (St. Louis, MO, USA). Analytical standards for phenolic compounds were acquired from Sigma-Aldrich®, Supelco®, Dr. Ehrenstorfer™, and Toronto Research Chemicals. A detailed list of these standards is provided in Section 2.4. This research is registered with SisGen (National System for the Management of Genetic Heritage and Associated Traditional Knowledge) under code A926504.
2.2. Obtaining the Infusions
Sample preparation involved infusing 250 mL of boiling distilled water into 1 g of plant material from each fraction (leaves and fruits). For each fraction, three infusions were prepared, with steeping times of 5, 10, and 15 minutes, respectively, totaling six infusions. After the steeping period, the samples were centrifuged at 3000× g for 5 minutes. The resulting supernatants were frozen at –83 °C and subsequently lyophilized at –60 °C and 0.05 mTorr (Benchtop Freeze Dryers, Model ilShin, Europe, NL) for 72 hours [19,20]. Samples were labeled as follows: L5 – leaf infusion steeped for 5 minutes; L10 – leaf infusion steeped for 10 minutes; L15 – leaf infusion steeped for 15 minutes; F5 – fruit infusion steeped for 5 minutes; F10 – fruit infusion steeped for 10 minutes; F15 – fruit infusion steeped for 15 minutes.
2.3. In Vitro Digestion
In vitro digestion was performed in two phases: gastric and intestinal [21,22]. For the gastric phase, 50 mL of each infusion (leaf and fruit) were mixed with 50 mL of simulated gastric fluid (prepared with 16.4 mL of HCl and 10 g of pepsin in 1000 mL of distilled water, pH adjusted to 1.3 ± 0.1 using 0.1 M HCl) and incubated at 37 °C for 60 minutes. Following incubation, the solution was cooled in an ice bath for 10 minutes to halt enzymatic activity. From the final volume (100 mL), 50 mL were set aside for the intestinal digestion phase, while the remaining 50 mL were retained for analysis of the gastric digestion stage. For the intestinal phase, 50 mL of the gastric digest were combined with 15 mL of simulated intestinal fluid, prepared by mixing 500 mL of 2% pancreatin solution with an equal volume of electrolyte solution (containing 6.8 g of KH₂PO₄). The pH was adjusted to 6.8 ± 0.1 using 4% NaOH. The mixture was incubated at 37 °C for 120 minutes under continuous stirring at 100 rpm. After incubation, pancreatin activity was halted by cooling the mixture in an ice bath for 10 minutes. The final digests were stored in amber flasks at –20 °C for subsequent analysis. Samples were labeled as follows: L5-G and L5-I – leaf infusion steeped for 5 minutes, after gastric and intestinal digestion, respectively; L10-G and L10-I – leaf infusion steeped for 10 minutes, after gastric and intestinal digestion, respectively; L15-G and L15-I – leaf infusion steeped for 15 minutes, after gastric and intestinal digestion, respectively; F5-G and F5-I – fruit infusion steeped for 5 minutes, after gastric and intestinal digestion, respectively; F10-G and F10-I – fruit infusion steeped for 10 minutes, after gastric and intestinal digestion, respectively; F15-G and F15-I – fruit infusion steeped for 15 minutes, after gastric and intestinal digestion, respectively.
2.4. Identification and Quantification of Individual Phenolic Compound by Liquid Chromatography-Electrospray Ionization-Tandem Mass Spectrometry (LC-ESI-MS/MS)
To identify and quantify individual phenolic compounds, liquid chromatography coupled with electrospray ionization tandem mass spectrometry (LC-ESI-MS/MS) was employed. Analyses were conducted using a liquid chromatograph (Agilent 1290 Series, Agilent Technologies, Wilmington, USA) coupled to a hybrid quadrupole-linear ion trap mass spectrometer (QTRAP® 5500, Sciex, Foster City, USA) equipped with an electrospray ionization (ESI) source. Phenolic compounds were identified and quantified based on their retention times, precursor ions, major fragments (quantifier ions), and secondary fragments (qualifier ions), in comparison with commercial analytical standards. Chromatographic separation was performed on an Agilent Zorbax Eclipse Plus C18 column (3.0 × 100 mm, 3.5 µm) using a binary mobile phase consisting of water (A) and methanol (B), both containing 0.1% formic acid. The gradient program was as follows: 0–3 min, 2% B; 3–10 min, 20% B; 10–11 min, 90% B; 11–13 min, 2% B. The flow rate was set at 0.3 mL/min, with an equilibration time of 2 minutes between runs. The injection volume was 5 µL. Data acquisition and processing were performed using Analyst and MultiQuant software (Sciex, Framingham, MA, USA), respectively. A total of 18 phenolic compound standards were used for compound identification and quantification. These standards were obtained from Sigma-Aldrich® (Cotia, SP, Brazil), Supelco® (Cotia, SP, Brazil), Dr. Ehrenstorfer™ (Teddington, Middx, UK), and Toronto Research Chemicals (Toronto, ON, Canada), as follows: benzoic acid (CAS 100-90-4, product code DRE-C10265900, purity >99%, Dr. Ehrenstorfer™); chlorogenic acid (CAS 327-97-9, DRE-C11415750, >96%, Dr. Ehrenstorfer™); ferulic acid (CAS 537-98-4, DRE-C13644100, >98%, Dr. Ehrenstorfer™); catechin (CAS 7295-85-4, DRE-C11059100, >93%, Dr. Ehrenstorfer™); coumarin (CAS 91-64-5, DRE-C11735000, >99%, Dr. Ehrenstorfer™); epicatechin (CAS 490-46-0, DRE-C13174690, >98%, Dr. Ehrenstorfer™); hesperidin (CAS 520-26-3, DRE-C14140000, >86%, Dr. Ehrenstorfer™); kaempferol-3-O-β-rutinoside (CAS 64820-99-1, product code R701800, >95%, Toronto Research Chemicals); kaempferol (CAS 520-18-3, DRE-C14502000, >94%, Dr. Ehrenstorfer™); myricetin (CAS 529-44-2, product code M6760, ≥96%, Sigma-Aldrich®); quercetin-3-rhamninoside (CAS 20229-56-5, product code Q8259, ≥95%, Sigma-Aldrich®); quercetin-3-glucoside-7-glucuronide (CAS 33595-51-0, product code Q394000, ≥95%, Toronto Research Chemicals); 4-aminobenzoic acid (CAS 150-13-0, DRE-C10171400, >98%, Dr. Ehrenstorfer™); apigenin (CAS 520-36-5, DRE-C10290600, >97%, Dr. Ehrenstorfer™); galangin (CAS 548-83-4, DRE-C13997000, >98%, Dr. Ehrenstorfer™); pinocembrin (CAS 480-39-7, product code P5239, ≥95%, Supelco®); syringaldehyde (CAS 134-96-3, DRE-C17080000, ≥99%, Dr. Ehrenstorfer™); and syringic acid (CAS 530-57-4, DRE-C17081000, ≥95%, Dr. Ehrenstorfer™).
2.5. Bioaccessibility
The bioaccessibility of phenolic compounds was determined by assessing the effect of in vitro digestion on the composition of individual phenolic constituents in the infusions. The bioaccessibility index (BI) was calculated according to Equation (1), where A represents the concentration of each individual phenolic compound after the intestinal digestion phase, and B corresponds to the concentration of the same compound prior to in vitro digestion (undigested sample) [22,23].
2.6. Total Phenolic Compounds (TPC) and Total Antioxidant Capacity (TAC)
The total phenolic content (TPC) was determined using the Folin–Ciocalteu colorimetric method. For each infusion, 0.1 mL of sample was mixed with 6 mL of distilled water, 0.5 mL of Folin–Ciocalteu reagent, and 2 mL of 20% Na₂CO₃, followed by manual stirring for 30 seconds. The reaction mixture was incubated in the dark for 2 hours. After incubation, absorbance was measured at 750 nm using a spectrophotometer (DR 3900, Hach, Germany) against a blank solution. The standard curve was constructed using gallic acid solutions. The TPC of each infusion was expressed as milligrams of gallic acid equivalent per gram of dry sample (mg GAE/g), based on the equation of the calibration curve. Results were presented as mean ± standard deviation of replicate analyses [22,23,24].
The total antioxidant capacity (TAC) assay was performed in a 96-well plate using a Varioskan LUX Plate Reader (ThermoFisher Scientific, USA), following the manufacturer's instructions as provided in the Antioxidant Test Kit (catalog number MAK334). The Master Reaction Mix (MRX-a) was prepared by mixing 100 μL of Reagent A and 8 μL of Reagent B, which were then added to each test well. A standard curve was prepared using Trolox concentrations of 0, 300, 600, and 1000 μM. In the plate, 20 μL of each standard and 20 μL of sample were pipetted into separate wells, followed by the addition of 100 μL of MRX-a to all wells. The plate was gently shaken by hand and incubated at room temperature for 10 minutes. Absorbance was then measured at 570 nm. TAC values were calculated according to Equation (2), where (A₅₇₀)sample is the absorbance of the sample, (A₅₇₀)blank is the absorbance of the blank, and n is the sample dilution factor:
2.7. In Vitro Inhibition of α-Amylase
The α-amylase inhibition assay was performed using a 96-well plate on a Varioskan LUX Plate Reader, following the manufacturer's instructions provided in the α-Amylase Inhibitor Screening Kit (Catalog Number MAK009, Sigma-Aldrich). The Master Reaction Mixture (MRX-α) was prepared by mixing 50 μL of amylase assay buffer with 50 μL of amylase substrate. In separate wells, the nitrophenol standard, positive control, and test samples (leaf or fruit infusions) were added. Undigested infusions were used in this assay, as salivary α-amylase interacts directly with the native compounds present in the unaltered samples. To each well, 100 μL of MRX-α was added and the contents were gently mixed. After 3 minutes, the initial absorbance (A₄₀₅(initial)) was recorded at 405 nm. The plate was then incubated at 25 °C, and absorbance was measured every 5 minutes over a 1-hour period. The change in absorbance (ΔA₄₀₅) was calculated using Equation (3):
2.8. In Vitro Inhibition of α-Glucosidase
The β-glucosidase inhibition assay was carried out in a 96-well plate using the Varioskan LUX Plate Reader, according to the manufacturer’s instructions provided in the β-Glucosidase Inhibitor Screening Kit (Catalog Number MAK129, Sigma-Aldrich). To initiate the procedure, 20 μL of distilled water was added to two wells, with 200 μL of distilled water in one well and 200 μL of calibrator in the other. The Master Reaction Mixture (MRX-β) was prepared by mixing 200 μL of test sample with 8 μL of β-NPG substrate, yielding a final concentration of 1 mM β-NPG. Separately, the nitrophenol standard, positive control, and test samples (leaf or fruit infusions) obtained after gastric digestion were added to the appropriate wells. These samples were selected because β-glucosidase activity occurs in the small intestine, and therefore only compounds surviving gastric digestion are relevant. Next, 200 μL of MRX-β was added to each test well, and the initial absorbance (A₄₀₅(initial)) was recorded at 405 nm. The plate was incubated for 20 minutes at room temperature or 37 °C, and the final absorbance was measured immediately after incubation. The percentage inhibition of β-glucosidase was calculated based on Equation (4):
2.9. Preparation of Dry Baked Biscuits with Added Leaf Extract
Dry baked biscuits were produced using commercially available ingredients. Two formulations were developed: a control formulation and a treatment formulation containing 0.4% C. xanthocarpa leaf extract. The composition of both formulations is presented in Table 1 as percentages (% w/w), and a representative image is included to illustrate the visual characteristics of the biscuits. To prevent contamination, the workbench was sanitized using 70% ethanol and disposable paper towels prior to preparation. Initially, the dry ingredients were crushed and mixed. Potassium sorbate and bacon flavoring were then added, followed by homogenization of the mixture. In parallel, distilled water was heated to dissolve the gelatin. For the treatment formulation, gelatin was dissolved directly in the C. xanthocarpa extract to ensure uniform distribution of the bioactive compound. The gelatin solution was gradually incorporated into the dry mixture until a soft, homogeneous dough was obtained. The dough was shaped using bone-shaped molds, and individual units were weighed to ensure consistency in mass. The biscuits were baked at 180 °C for 30 minutes, then cooled to room temperature and individually packaged in zip-lock plastic bags for storage and subsequent analyses [25,26].
2.10. In Vivo Evaluation of Glycemic Markers
The in vivo evaluation of glycemic markers was conducted at the Experimental Farm of Santa Catarina State University (Guatambú, Brazil) using ten adult male Beagle dogs, aged 7 years, randomly assigned to two groups (n = 5 per group). The control group (animals 1 to 5) received dry baked biscuits without C. xanthocarpa leaf infusion, while the treatment group (animals 6 to 10) received biscuits formulated with the infusion. The intervention period lasted 28 days, during which two biscuits per day were administered to each animal in the afternoon. Blood samples were collected weekly by jugular vein puncture using vacuum tubes—both with and without clot activator—to obtain serum and plasma, respectively. Samples were centrifuged at 7,000 rpm for 10 minutes, and the supernatant was transferred to 1.5 mL labeled microtubes, then stored at −20 °C until analysis [27]. Biochemical parameters assessed included fasting glucose, fructosamine, and serum amylase, measured using standard clinical chemistry methods. The study was approved by the Ethics Committee on Animal Use (CEUA/UDESC) under protocol number 3728250923, ID 001833.
2.11. Statistical Analysis
Statistical analyses were performed using R Statistical Software (v.3.5.1; ANOVAIREVA, R Core Team, 2016) and Microsoft® Excel® 2019 MSO. The analysis included analysis of variance (ANOVA), and differences between means were evaluated using Tukey’s test, with a 95% confidence level (p < 0.05). All results were based on three independent experimental replicates.
For the in vivo data, a descriptive analysis was first conducted, including measures of central tendency (median) and data dispersion (range, defined as the interval between the minimum and maximum values). Subsequently, all variables were subjected to the Shapiro–Wilk W-test for normality. Variables with non-normal distribution were transformed using appropriate algorithms to ensure normality. After normalization, skewness, kurtosis, and homogeneity of variance were evaluated using the Levene test, and linearity was assessed via linear regression. Statistical modeling was conducted using the PROC MIXED procedure (SAS Institute Inc., Cary, NC, USA; version 9.4), applying the Satterthwaite approximation to determine the denominator degrees of freedom for testing fixed effects. Baseline values (day 0) for each variable were included as covariates in the model. As only a single post-treatment collection was conducted following additive consumption, treatment effects were not reported separately, being instead incorporated into the treatment × day interaction. Mean comparisons were performed using PDIFF (Student’s t-test), and results were expressed as least squares means (LSMEANS) with corresponding standard errors. Statistical significance was set at p ≤ 0.05 [27].
3. Results and Discussion
3.1. Phenolic Composition of Infusions of C. xanthocarpa Before and After in Vitro Digestion
Phenolic compounds and other secondary plant metabolites represent a major class of bioactive molecules studied for both research and commercial applications [28]. Therefore, characterizing their phenolic profile is essential to elucidate potential bioactivities. Figure 1 and Figure 2 present the phenolic composition of leaf and fruit infusions of C. xanthocarpa, respectively, before and after in vitro gastrointestinal digestion.
Figure 1 illustrates the concentrations of phenolic compounds detected in leaf infusions prepared with steeping times of 5, 10, and 15 minutes, along with their corresponding gastric and intestinal digestion phases. A total of twelve phenolic compounds, including phenolic acids and flavonoids, were identified across all digestion stages. Chlorogenic acid and kaempferol-3-O-β-rutinoside were consistently detected at the highest concentrations, suggesting greater chemical stability during the digestive process. Quercetin-3-glucoside-7-glucuronide also exhibited elevated concentrations, particularly in the intestinal phase and in infusions with longer steeping times. In contrast, compounds such as epicatechin and hesperidin showed marked reductions following digestion, indicating low digestive stability. Benzoic acid and ferulic acid were generally found at concentrations below the quantification limit in most treatments. Overall, despite reductions, leaf infusions retained significant concentrations of phenolic compounds post-digestion, underscoring their potential bioavailability. Increasing the steeping time generally enhanced the extraction of compounds such as chlorogenic acid and kaempferol-3-O-β-rutinoside, particularly in L15. However, other compounds, including epicatechin and hesperidin, did not follow this trend, possibly due to degradation during prolonged steeping.
Figure 2 displays the concentrations of phenolic compounds identified in fruit infusions subjected to the same experimental conditions. A total of six phenolic compounds were detected—one phenolic acid and five flavonoids. Unlike the leaf infusions, fruit infusions showed no increase in phenolic concentrations during digestion. Quercetin-3-glucoside was the most abundant compound across all phases, suggesting high resistance to digestive conditions and favorable bioaccessibility. Myricetin and quercetin-3-rhamnoside were also present in relevant concentrations, though to a lesser extent. Conversely, catechin and epicatechin decreased substantially after digestion, reflecting their susceptibility to degradation. Benzoic acid was present in low concentrations throughout. Steeping time had a variable influence on phenolic content. While longer extraction (F15) enhanced concentrations of some compounds, others, like catechin and epicatechin, declined, suggesting degradation over time.
A comparative analysis of the two heat maps (Figure 1 and Figure 2) reveals distinct and informative patterns regarding the stability and distribution of phenolic compounds in C. xanthocarpa infusions. In both leaf and fruit samples, quercetin and its derivatives demonstrated notable resistance to the digestive process, maintaining elevated concentrations after both gastric and intestinal digestion. This suggests these flavonols possess intrinsic structural stability, regardless of the botanical origin. However, qualitative and quantitative differences were observed between the sources. Fruit infusions exhibited higher concentrations of quercetin-3-glucoside, whereas leaf infusions were richer in chlorogenic acid and kaempferol-3-O-β-rutinoside. These differences likely reflect variations in tissue composition and phenolic metabolism between plant organs. In both matrices, digestion generally led to a reduction in phenolic concentrations, although the extent of degradation varied significantly among compounds. This highlights the heterogeneous stability of phenolics under digestive conditions and the compound-specific nature of bioaccessibility. Regarding the influence of steeping time, longer infusion durations generally promoted greater phenolic extraction, particularly for stable compounds such as chlorogenic acid. Nevertheless, this effect was not universal. Certain compounds, including epicatechin and catechin, showed declining concentrations with prolonged extraction, possibly due to thermal degradation or oxidative transformations induced by extended exposure to heat, light, or oxygen. These compounds may be converted into undetectable derivatives or degraded into non-phenolic byproducts. The reduction in phenolic content during digestion is largely attributed to the pH sensitivity and enzymatic hydrolysis of these compounds [29]. The gastric environment, characterized by a pH of 1.5–3.5, can promote the hydrolysis or decomposition of labile phenolics. However, certain compounds demonstrate resilience under such conditions. For instance, chlorogenic acid, an ester of caffeic and quinic acids, possesses multiple hydroxyl groups that likely enhance its acid stability. Similarly, epicatechin and hesperidin exhibit relatively stable structures, supported by their hydroxyl and glycosidic substitutions, respectively. Kaempferol-3-O-β-rutinoside, with its glycoside moiety, and quercetin-3-glucoside (isoquercitrin), a glycosylated flavonol, also display structural features conducive to stability in acidic environments [30,31,32,33,34,35,36]. Previous studies support these observations. Peanparkdee et al. [37], investigating rice bran extracts, reported significant post-digestive reductions in various phenolic acids (e.g., sinapic, protocatechuic, vanillic) and flavonoids (e.g., myricetin, rutin), reinforcing the notion that most phenolics exhibit limited stability under gastrointestinal conditions. On the other hand, Bouayed et al. [38], studying apples, observed a notable increase in phenolic content during the intestinal phase, with over 10% more total phenolics and flavonoids compared to the gastric phase. This rise may be attributed to extended digestion time (exceeding 2 hours) and the action of intestinal enzymes, such as pancreatic lipase, which facilitate the release of matrix-bound phenolics. These findings emphasize the dynamic nature of phenolic bioaccessibility, which is modulated by multiple factors, including compound structure, food matrix, pH shifts, and enzymatic activity. Phenolics often undergo structural modifications during digestion, forming glycosylated, esterified, or polymerized intermediates, which are further hydrolyzed or transformed through acidic and alkaline conditions [39]. Such transformations ultimately influence the fraction of phenolics that remain bioaccessible and potentially bioavailable.
3.2. Bioaccessibility Index of Phenolic Compounds of the Infusions
To assess the stability and transformation of phenolic compounds following simulated gastrointestinal digestion, the BI was calculated for each compound after the complete digestion process (Figure 3).
A range of phenolic acids (e.g., benzoic acid, chlorogenic acid) and flavonoids (e.g., catechin, coumarin, epicatechin, hesperidin, kaempferol-3-O-β-rutinoside, kaempferol, myricetin, quercetin-3-glucoside, and quercetin-3-rhamnoside) were evaluated. Among all compounds, benzoic acid in L5 exhibited the highest BI, reaching approximately 93.70%, indicating strong resistance to degradation during digestion. Chlorogenic acid also demonstrated moderate bioaccessibility, with values of 32.54% in L5, 18.60% in L10, and 22.88% in L15, showing slight variability across infusion times. Catechin showed relatively low bioaccessibility, with a BI of 9.20% in L5, suggesting poor digestive stability. In contrast, coumarin and myricetin in L10 presented BIs of 11.76% and 37.59%, respectively. Quercetin-3-rhamnoside demonstrated moderate stability, with BIs of 28.48% in L5 and 26.00% in L15. Other compounds, including epicatechin, hesperidin, kaempferol-3-O-β-rutinoside, kaempferol, and quercetin-3-glucoside, maintained detectable and consistent bioaccessibility across all steeping durations. In the fruit infusions, myricetin exhibited a low BI of 5.85% in F5, while quercetin-3-glucoside had the highest BI among fruit-derived compounds, with values of 33.94% in F5, 27.63% in F10, and 29.90% in F15, indicating considerable resistance to digestive conditions. Likewise, quercetin-3-rhamnoside maintained relevant bioaccessibility across steeping times, with BIs of 25.64% in F5, 23.25% in F10, and 28.61% in F15. Overall, these findings suggest that glycosylated flavonoids, such as quercetin derivatives, tend to exhibit higher digestive stability compared to non-glycosylated phenolics. The variation in BI among different compounds also reinforces the influence of molecular structure and extraction time on phenolic bioaccessibility.
Dantas et al. [40] investigated the bioaccessibility of frozen pulps from Brazilian native fruits, including açaí, cupuaçu, blackberry, blueberry, jabuticaba, raspberry, cajá, and soursop. The study revealed a wide range of bioaccessibility levels across different phenolic compounds and fruit matrices. For example, epicatechin in açaí pulp showed a bioaccessibility of 32.99%, while quercetin-3-glucoside exhibited highly variable values—122.01% in blackberry and 13.94% in blueberry. Hesperidin presented bioaccessibility levels of 13.91% in cajá and 28.01% in açaí, highlighting the influence of both the compound and the matrix on digestive stability. In fruits, phenolic acids may occur in the form of free glycosides or soluble esters, which contribute significantly to their antioxidant potential. Thus, it is essential to evaluate the bioaccessibility of phenolics in both whole fruits and their derivatives, as matrix composition can markedly affect compound release and transformation [41]. Within the phenolic acid class, chlorogenic acid was also evaluated by Dantas et al. [40], showing bioaccessibility levels of 18.28% in açaí and 15.65% in blueberry. The decrease in chlorogenic acid concentration during digestion may be attributed to partial hydrolysis into derivatives such as caffeoylquinic acid and dimethoxycinnamoylquinic acid [42]. Similarly, Yu et al. [42] reported bioaccessibility values for plum phenolic extracts, including chlorogenic acid (23.11%), epicatechin (26.66%), and isoquercitrin (12.40%). The moderate bioaccessibility of epicatechin may be linked to the degradation of procyanidin B2, a dimer of epicatechin. During gastrointestinal digestion, procyanidin B2 can be depolymerized into monomeric units, including epicatechin, thereby increasing its measurable concentration in the intestinal phase [43]. The changes observed in the bioaccessibility (BI) of phenolic compounds after in vitro gastrointestinal digestion can be attributed to the complex interactions and transformations these compounds undergo during digestion. Phenolic acids, such as benzoic acid and chlorogenic acid, are known for their relative stability in acidic environments like the gastric phase, which can explain their detectable and consistent BI levels. Chlorogenic acid, despite partial degradation, forms derivatives with comparable bioactivity, contributing to its stability across various extraction times [44,45]. Flavonoids, including catechin, epicatechin, hesperidin, and quercetin derivatives, are often influenced by their glycosylation patterns. Glycosylated flavonoids, such as quercetin-3-glucoside and quercetin-3-rhamnoside, are typically more stable during digestion due to the protective effect of sugar moieties, which can be hydrolyzed to release aglycones during intestinal digestion. This process enhances their bioavailability, which is reflected in the significant BI levels observed [45,46]. Compounds like myricetin and kaempferol derivatives show variability in BI likely due to their sensitivity to pH changes and enzymatic hydrolysis. Myricetin’s relatively high BI in certain conditions may result from its resistance to degradation and effective release during intestinal digestion. Conversely, the lower BI of catechin and coumarin may stem from their susceptibility to oxidation or interaction with digestive enzymes, leading to reduced stability [44]. The observed variations between leaf and fruit infusions could be linked to the intrinsic matrix effects, such as the presence of other bioactive compounds, fiber, or proteins, which can influence the release and stability of phenolics during digestion. Additionally, the extraction time plays a role in determining the initial concentration of phenolics, affecting their subsequent BI. These findings underscore the importance of both the chemical structure of phenolic compounds and the food matrix in modulating their stability and bioavailability after digestion.
3.3. TPC and TAC of the Infusions
Table 2 presents the results for TPC and total TAC of C. xanthocarpa leaf and fruit infusions, both before and after in vitro gastrointestinal digestion. Phenolic compounds, which are widely distributed in plants, are recognized as potent antioxidants. Phenolic acids such as chlorogenic, gallic, caffeic, and ellagic acids exert antioxidant activity primarily through the donation of hydrogen atoms from hydroxyl groups on their aromatic rings. Additional mechanisms include electron transfer and quenching of singlet oxygen species [47]. Natural flavonoids such as kaempferol, quercetin, and myricetin, commonly found in various plant-based foods, also exhibit robust antioxidant effects [48,49,50].
As expected, the undigested infusions exhibited the highest TPC, with the exception of sample L10. Gastrointestinal digestion significantly influenced the phenolic content of the samples. In leaf infusions, reductions in TPC were observed after the gastric phase: 36.38% (L5-G), 2.46% (L10-G), and 2.39% (L15-G). During the intestinal phase, reductions of 57.26% (L5-I) and 47.00% (L15-I) were observed, whereas L10-I exhibited a 29.77% increase in TPC. This increase may be attributed to the action of intestinal enzymes, which facilitate the release of phenolic compounds previously bound to the plant matrix [51]. For fruit infusions, digestion also led to significant TPC reductions: 57.80% (F5-G), 25.05% (F10-G), and 15.03% (F15-G) during the gastric phase; and 61.42% (F5-I), 10.52% (F10-I), and 35.51% (F15-I) during the intestinal phase. On average, leaf infusions exhibited TPC reductions of 13.75% (gastric) and 24.83% (intestinal), while fruit infusions showed higher average reductions of 32.63% (gastric) and 35.56% (intestinal). These results indicate greater phenolic stability in leaf infusions under simulated gastrointestinal conditions. These findings are consistent with previous literature. Celep et al. [52] reported an approximately 57% reduction in TPC during intestinal digestion. Similarly, Kashyap et al. [53] observed a 49.79% decrease in phenolic content in digested extracts of Meghalayan cherry. Farias et al. [54] found 35% and 50% reductions in TPC of uvaia during the gastric and intestinal phases, respectively. According to Pavan et al. [55], the reduction in TPC during digestion is likely due to the instability of smaller phenolic molecules released through hydrolysis at higher pH values, particularly in the intestinal environment.
The TAC of C. xanthocarpa infusions, measured before and after in vitro digestion, exhibited a notable reduction across all samples. In the intestinal phase, TAC values for the leaf infusions decreased by 51.65% (L5-I), 58.87% (L10-I), and 52.09% (L15-I). For the fruit infusions, the reductions were even more pronounced—61.19% (F5-I), 64.55% (F10-I), and 61.16% (F15-I)—for the corresponding steeping times (5, 10, and 15 minutes). These findings are supported by previous studies. Farias et al. [54] reported a 21% decrease in the antioxidant potential of digested uvaia extracts, while Dacoreggio et al. [23] observed an 18.75% reduction during the gastric phase. Similarly, Ma et al. [56] noted a progressive decline in antioxidant activity during digestion of pea peel samples, suggesting a consistent pattern across plant-based matrices. This reduction in TAC may be attributed to the varied structural forms of phenolic compounds within food matrices—namely, free, conjugated, or bound phenolics—which influence their release and reactivity under digestive conditions [57]. Furthermore, enzymatic activity (e.g., pepsin, pancreatin) and pH transitions during gastrointestinal simulation likely contribute to the breakdown or transformation of antioxidant compounds, thereby altering their capacity to scavenge free radicals. Despite the post-digestion decline, leaf infusions consistently exhibited higher antioxidant capacity than fruit infusions prior to digestion, reflecting a greater initial concentration of bioactive compounds. Even after intestinal digestion, leaf infusions maintained a superior antioxidant profile, suggesting that their phenolic constituents are not only more abundant but potentially more stable or reactive. The observed decrease in TAC reinforces the complexity of antioxidant mechanisms and highlights the importance of complementary assays for a comprehensive understanding of how digestion affects the antioxidant potential of plant-derived foods.
3.4. Inhibition of Starch-Digesting Enzymes by Infusions
Figure 4 illustrates the percentage inhibition of α-amylase and β-glucosidase by C. xanthocarpa leaf and fruit infusions prepared with steeping times of 5, 10, and 15 minutes.
All samples exhibited marked inhibition of α-amylase, with values ranging from 99.54% to 99.91%. In contrast, β-glucosidase inhibition was observed exclusively in the leaf infusions, with inhibition increasing progressively with extraction time—from 52.9% at 5 minutes (L5) to 99.3% at 15 minutes (L15). The assessment of β-glucosidase inhibition was conducted using samples previously subjected to simulated gastric digestion, in alignment with the physiological location where this enzyme is active (i.e., the small intestine). The strong inhibition of α-amylase by C. xanthocarpa infusions suggests the presence of potent bioactive compounds capable of modulating early steps in carbohydrate digestion. These findings are consistent with previous studies indicating that phenolic compounds can act as natural α-amylase inhibitors, representing potential alternatives to synthetic drugs for controlling postprandial glycemia and managing type 2 diabetes [58]. Flavonoids, in particular, have been shown to modulate carbohydrate metabolism by reducing starch digestibility and by inhibiting glucose transporters such as SGLT-1 in the intestinal epithelium, thereby enhancing glycemic control [59]. Although both leaf and fruit infusions demonstrated high α-amylase inhibition, leaf infusions (99.67–99.91%) outperformed fruit infusions (99.54–99.84%), likely due to their higher concentrations of specific phenolics such as quercetin, gallic acid, and chlorogenic acid, as evidenced in the phenolic profile (Table 1) [60,61].
Supporting this, Etgeton et al. [62] reported concentration-dependent α-amylase inhibition by aqueous fruit extracts of C. xanthocarpa, with inhibition ranging from 20% to 77%, highlighting the plant’s potential as a natural source of enzyme inhibitors. Similar results have been reported for other species; for instance, Mushtaq et al. [63] observed significant inhibitory effects on both α-amylase (70%) and β-glucosidase (65%) in Calligonum polygonoides, reinforcing the functional relevance of flavonoids and phenolic acids. With regard to β-glucosidase, inhibition was restricted to leaf infusions and increased with steeping time, suggesting a time-dependent release of inhibitory phytochemicals. Flavonoids such as quercetin and kaempferol, which are abundant in leaves of the Myrtaceae family, have demonstrated high affinity for the active site of β-glucosidase [64]. Thus, the inhibitory activity observed in C. xanthocarpa leaves can be attributed to the presence of these compounds. Conversely, no β-glucosidase inhibition was detected in the fruit infusions, regardless of the extraction time (0% inhibition). This absence of activity suggests that the responsible bioactives are either absent or present at insufficient concentrations in the fruit matrix. This pattern is consistent with findings from other botanical studies showing that leaves typically accumulate higher levels of enzyme-inhibiting phenolics, while fruits tend to be richer in sugars and non-inhibitory constituents. For example, Wojdyło et al. [65] compared leaves and fruits of apple, pear, and quince, reporting that leaf extracts had higher phenolic content and greater inhibitory activity against α-amylase and α-glucosidase than fruit extracts. In particular, quince leaves were classified as potent α-amylase inhibitors. Similarly, Spínola et al. [66] demonstrated that leaves of Elaeagnus umbellata and Sambucus lanceolata exhibited stronger α-glucosidase inhibition than their fruits. Furthermore, Gong et al. [67] emphasized that flavonoids possess superior α-glucosidase inhibitory capacity compared to phenolic acids, likely due to additional hydroxyl groups on the flavonoid backbone, which enhance enzyme binding. In line with this, Phan et al. [68] demonstrated that flavonoids such as baohuoside I, kaempferol, and quercetin inhibited yeast α-glucosidase by 82.6%, 95.1%, and 94.7%, respectively, while compounds like icariin and epimedins showed inhibition below 5%. Together, these findings underscore the therapeutic potential of C. xanthocarpa, particularly its leaves, as a natural source of bioactive compounds capable of modulating key digestive enzymes involved in carbohydrate metabolism.
3.5. In Vivo Evaluation of Glycemic Markers
The data for fasting glucose, serum fructosamine, and amylase activity are presented in Table 3. The administration of dry baked biscuits containing C. xanthocarpa leaf infusion did not result in statistically significant differences in fasting glucose levels (p = 0.19) or serum amylase activity (p = 0.84) compared to the control group. However, a significant treatment × time interaction was observed for fructosamine levels (p = 0.05), suggesting a time-dependent modulation of intermediate glycemic control. Fructosamine reflects the non-enzymatic glycation of serum proteins, primarily albumin, and serves as a marker of average glycemia over the preceding two to three weeks. In contrast to fasting glucose, which is subject to rapid physiological fluctuations, fructosamine offers a more stable and integrative assessment of glycemic status [69,70].
The elevated fructosamine levels detected at specific time points in the treatment group—especially on day 11—may reflect a metabolic response to the phenolic compounds present in the C. xanthocarpa infusion added to the biscuits. These compounds can influence glucose metabolism through multiple mechanisms, including the modulation of intestinal glucose absorption, inhibition of carbohydrate-digesting enzymes, and interference with hepatic glucose production or insulin signaling pathways [71,72]. Although the overall mean glucose levels remained unaffected, the time-dependent variation in fructosamine levels suggests that the phenolic-enriched biscuits may exert effects through cumulative or delayed physiological responses rather than immediate glycemic shifts. These physiological findings are consistent with the results of the in vitro enzymatic assays, in which the same C. xanthocarpa infusion used in biscuit formulation significantly inhibited both salivary α-amylase and glucoamylase activities. The inhibition of these key enzymes involved in starch digestion may delay carbohydrate breakdown and glucose release into the bloodstream, thereby contributing to the observed modulation of fructosamine levels over time [73]. Although this mechanism did not result in a significant reduction in fasting glucose, it may partially explain the fluctuations observed in intermediate glycemic markers, supporting a subtle but biologically relevant regulatory role for the phenolic compounds delivered through the dry biscuits. Additionally, the interaction between the food matrix and phenolic compounds may have influenced the bioaccessibility and functionality of these bioactives in vivo. The biscuit matrix, due to its dry and compact nature, could modulate the release profile of phenolics during digestion, potentially slowing their degradation and enabling more sustained physiological effects [74,75]. Such matrix-related interactions are crucial for understanding how bioactive compounds behave under real dietary conditions and may help explain the time-dependent effects observed in fructosamine levels.
Although direct markers of oxidative stress were not evaluated in vivo, the observed modulation of serum fructosamine may also reflect, in part, the antiglycation or antioxidant potential of the phenolic compounds retained after digestion. Given that advanced glycation processes are closely linked to oxidative stress, the reduction or stabilization of protein glycation markers could suggest a systemic effect of bioaccessible phenolics beyond their role in glycemic control [76,77,78]. This hypothesis is supported by the strong in vitro antioxidant activity observed, especially in the leaf infusions.
The delivery of phenolic compounds through a complex food matrix such as dry biscuits may have influenced their release profile, contributing to the delayed modulation of glycemic markers like fructosamine. Phenolic-protein interactions—particularly those formed during thermal processing—can act as controlled-release systems, protecting bioactive compounds from early degradation and ensuring their gradual release throughout the gastrointestinal tract [79]. Such interactions may also explain why no immediate reduction in fasting glucose was observed, while a significant time-dependent effect emerged in fructosamine levels.
In this context, the proteins present in the biscuit formulation, including quinoa-derived proteins and gelatin, are likely to interact with polyphenols through hydrogen bonding or covalent attachments [80]. These interactions may not only protect phenolics from enzymatic hydrolysis but also influence protein digestibility and intestinal absorption dynamics. Studies have shown that such complexes can modify the tertiary structure of proteins, altering their hydrolysis rate and possibly enhancing the release of phenolics at more distal sites of digestion [81,82].
This finding also points to the relevance of integrative experimental approaches combining in vitro biochemical assays and physiological validation. Future studies should explore additional metabolic markers, including oxidative stress parameters, to further clarify the mechanisms by which C. xanthocarpa phenolics influence glycemic homeostasis. Furthermore, the apparent dissociation between fructosamine and glucose responses may indicate a compensatory adjustment in insulin sensitivity or peripheral glucose utilization, which could be further explored in studies involving insulin quantification, glucose tolerance tests, or gene expression analysis of glucose transporters and related metabolic regulators [83,84,85]. Overall, the interaction between phenolics and the food matrix should not be regarded merely as a barrier to absorption, but rather as a functional mechanism that can modulate bioactive compound behavior in vivo.
4. Conclusions
This study provides a comprehensive evaluation of the functional potential of C. xanthocarpa infusions, integrating phytochemical characterization, in vitro digestion assays, enzyme inhibition analyses, and in vivo physiological responses. Both leaf and fruit infusions were shown to contain a variety of phenolic compounds; however, leaf infusions exhibited superior total phenolic content, antioxidant activity, and enzyme inhibitory capacity, particularly against α-amylase and β-glucosidase, key enzymes involved in carbohydrate metabolism. Simulated gastrointestinal digestion confirmed that several phenolic compounds remained bioaccessible, especially glycosylated flavonoids such as quercetin-3-glucoside and kaempferol derivatives, supporting their potential physiological relevance after oral consumption. The bioaccessibility and digestive stability of these compounds were influenced by both the extraction time and the food matrix, with longer infusion times generally favoring the release of bioactive phenolics. The in vivo administration of dry baked biscuits enriched with leaf infusion resulted in a significant treatment × time interaction for serum fructosamine, indicating a time-dependent modulation of intermediate glycemic markers. Although no immediate changes were observed in fasting glucose or serum amylase, the modulation of fructosamine suggests that phenolic compounds retained bioactivity following digestion and were capable of influencing glycation pathways. This effect may be mediated by antioxidant or antiglycation mechanisms, potentially enhanced by protein–polyphenol interactions within the food matrix that delayed phenolic release and absorption. Taken together, the findings support the notion that C. xanthocarpa, particularly its leaves, may serve as a promising functional dietary ingredient with the capacity to modulate glycemic responses through enzyme inhibition, antioxidant activity, and systemic metabolic effects. Importantly, the study also highlights the critical role of the food matrix in influencing phenolic bioaccessibility and behavior in vivo. Nevertheless, it must be emphasized that the in vivo findings were derived from a short-term, non-pathological animal model, and extrapolation to human health outcomes requires caution. Future research should focus on long-term interventions, dose–response relationships, and the inclusion of human clinical trials to validate the observed effects. Additional investigations into oxidative stress markers, insulin sensitivity, and molecular pathways will further clarify the mechanisms through which C. xanthocarpa phenolics contribute to glycemic homeostasis and overall metabolic health.
Author Contributions
Conceptualization, A.P.K. and A.S.S.; methodology, C.M.C.T., V.R.F.S. and C.T.P.D.; formal analysis, C.M.C.T., V.R.F.S., L.C. and V.G.B.; investigation, C.M.C.T., V.R.F.S., L.C. and V.G.B.; resources, A.P.K. and A.S.S.; data curation, V.R.F.S. and C.T.P.D.; writing—original draft preparation, C.M.C.T. and V.R.F.S..; writing—review and editing, A.P.K. and A.S.S.; supervision, A.P.K. and A.S.S.; project administration, A.P.K.; funding acquisition, A.P.K. All authors have read and agreed to the published version of the manuscript.
Funding
This research was funded by FAPESC, grant number 2023TR564. Aniela Pinto Kempka is granted a fellowship (PQ2) from CNPq–Brazil (303915/2022-6).
Institutional Review Board Statement
The animal study was conducted in accordance with the guidelines of the Institutional Animal Care and Use Committee of Santa Catarina State University and approved under protocol number CEUA/UDESC 3728250923 (ID 001833).
Informed Consent Statement
Not applicable.
Data Availability Statement
The data supporting the findings of this study are available from the corresponding author upon reasonable request.
Acknowledgments
The authors thank the Bioprocess Laboratory (UDESC) and the Experimental Farm of Santa Catarina State University for technical support.
Conflicts of Interest
The authors declare no conflicts of interest. The funders had no role in the design of the study; in the collection, analyses, or interpretation of data; in the writing of the manuscript; or in the decision to publish the results.
References
- Raphaelli, C.O.; Pereira, E.S.; Camargo, T.M.; Ribeiro, J.A.; Pereira, M.C.; Vinholes, J.; Dalmazo, G.O.; Vizzotto, M.; Nora, L. Biological activity and chemical composition of fruits, seeds and leaves of guabirobeira (Campomanesia xanthocarpa O. Berg – Myrtaceae): A review. Food Biosci. 2021, 40, 100899. [Google Scholar] [CrossRef]
- Arcari, S.G.; Arena, K.; Kolling, J.; Rocha, P.; Dugo, P.; Mondello, L.; Cacciola, F. Polyphenolic compounds with biological activity in guabiroba fruits (Campomanesia xanthocarpa Berg.) by comprehensive two-dimensional liquid chromatography. Electrophoresis 2020, 41, 1784–1792. [Google Scholar] [CrossRef]
- Sant’Anna, L.S.; Merlugo, L.; Ehle, C.S.; Limberger, J.; Fernandes, M.B.; Santos, M.C.; Mendez, A.S.L.; Paula, F.R.; Moreira, C.M. Chemical composition and hypotensive effect of Campomanesia xanthocarpa. Evid. Based Complement. Altern. Med. 2017, 2017, 1591762. [Google Scholar] [CrossRef]
- Duarte, L.S.; Pereira, M.T.M.; Pascoal, V.D.B.; Pascoal, A.C.R.F. Campomanesia genus: a literature review of nonvolatile secondary metabolites, phytochemistry, popular use, biological activities, and toxicology. Eclética Química 2020, 45, 12–22. [Google Scholar] [CrossRef]
- Catelan, T.B.S.; Gaiola, L.; Duarte, B.F.; Cardoso, C.A.L. Evaluation of the in vitro photoprotective potential of ethanolic extracts of four species of the genus Campomanesia. J. Photochem. Photobiol. B Biol. 2019, 197, 111500. [Google Scholar] [CrossRef]
- De Sousa, J.A.; Prado, L.S.; Alderete, B.L.; Boaretto, F.B.M.; Allgayer, M.C.; Miguel, F.M.; De Sousa, J.T.; Marroni, N.P.; Lemes, M.L.B.; Corrêa, D.S.; Ferraz, A.D.B.; Picada, J.N. Toxicological aspects of Campomanesia xanthocarpa Berg. associated with its phytochemical profile. J. Toxicol. Environ. Health A 2019, 82, 62–74. [Google Scholar] [CrossRef]
- Pereira, E.d.S.; Vinholes, J.R.; Camargo, T.M.; Nora, F.R.; Crizel, R.L.; Chaves, F.; Nora, L.; Vizzotto, M. Characterization of araçá fruits (Psidium cattleianum Sabine): Phenolic composition, antioxidant activity and inhibition of α amylase and α glucosidase. Food Biosci. 2020, 37, 100665. [Google Scholar] [CrossRef]
- Zhang, H.; Hassan, Y.I.; Liu, R.; Mats, L.; Yang, C.; Liu, C.; Tsao, R. Molecular mechanisms underlying the absorption of aglycone and glycosidic flavonoids in a Caco 2 BBe1 cell model. ACS Omega 2020, 5, 10782–10793. [Google Scholar] [CrossRef] [PubMed]
- De Araújo, F.F.; Farias, D.P.; Neri-Numa, I.A.; Pastore, G.M. Polyphenols and their applications: An approach in food chemistry and innovation potential. Food Chem. 2021, 288, 127535. [Google Scholar] [CrossRef]
- Sarkar, D.; Christopher, A.; Shetty, K. Phenolic bioactives from plant based foods for glycemic control. Front. Endocrinol. 2022, 12, 727503. [Google Scholar] [CrossRef]
- Kim, Y.; Keogh, J.B.; Clifton, P.M. Polyphenols and glycemic control. Nutrients 2016, 8, 17. [Google Scholar] [CrossRef]
- Li, M.; Ding, L.; Cao, L.; Zhang, Z.; Li, X.; Li, Z.; Xia, Q.; Yin, K.; Song, S.; Wang, Z.; Du, H.; Zhao, D.; Li, X.; Wang, Z. Natural products targeting AMPK signaling pathway therapy, diabetes mellitus and its complications. Front. Pharmacol. 2025, 16, 1534634. [Google Scholar] [CrossRef]
- Sęczyk, Ł.; Gawlik Dziki, U.; Świeca, M. Influence of phenolic–food matrix interactions on in vitro bioaccessibility of selected phenolic compounds and nutrient digestibility in fortified white bean paste. Antioxidants 2021, 10, 1825. [Google Scholar] [CrossRef] [PubMed]
- Wang, B.; Pham, L.B.; Adhikari, B. Complexation and conjugation between phenolic compounds and proteins: mechanisms, characterisation and applications as novel encapsulants. Sustainable Food Technol. 2024, 2, 1206–1227. [Google Scholar] [CrossRef]
- Shahidi, F.; Dissanayaka, C.S. Phenolic–protein interactions: insights from in silico analyses – a review. Food Prod. Process Nutr. 2023, 5, 2. [Google Scholar] [CrossRef]
- Rawel, H.M.; Czajka, D.; Rohn, S.; Kroll, J. Interactions of different phenolic acids and flavonoids with soy proteins. Int. J. Biol. Macromol. 2002, 30, 137–150. [Google Scholar] [CrossRef] [PubMed]
- Zhou, S.D.; Lin, Y.F.; Xu, X.; Meng, L.; Dong, M.S. Effect of non covalent and covalent complexation of (–)-epigallocatechin gallate with soybean protein isolate on protein structure and in vitro digestion characteristics. Food Chem. 2020, 309, 125718. [Google Scholar] [CrossRef]
- Wojtunik Kulesza, K.; Nowak, A.; Bączek, N.; Baranowska Bosiacka, I.; Drózdz, M.; Żółkiewicz, A.; Socha, M. Influence of in vitro digestion on composition, bioaccessibility and antioxidant activity of food polyphenols—a non systematic review. Nutrients 2020, 12, 1401. [Google Scholar] [CrossRef]
- Dacoreggio, M.V.; Moroni, L.S.; Kempka, A.P. Antioxidant, antimicrobial and allelopathic activities and surface disinfection of the extract of Psidium cattleianum Sabine leaves. Biocatal. Agric. Biotechnol. 2019, 21, 101295. [Google Scholar] [CrossRef]
- da Silva, V.R.F.; da Silva, G.B.; Manica, D.; Deolindo, C.T.P.; Bagatini, M.D.; Kempka, A.P. Phytotherapeutic potential of Campomanesia xanthocarpa (Mart.) O. Berg: antitumor effects in vitro and in silico, with emphasis on SK-MEL-28 melanoma cells—a study on leaf and fruit infusions. In Silico Pharmacol. 2024, 12, 105. [Google Scholar] [CrossRef]
- Jagadeesan, G.; Muniyandi, K.; Manoharan, A.L.; Nataraj, G.; Thangaraj, P. Understanding the bioaccessibility, α amylase and α glucosidase enzyme inhibition kinetics of Allmania nodiflora (L.) R.Br. ex Wight polyphenols during in vitro simulated digestion. Food Chem. 2022, 372, 131294. [Google Scholar] [CrossRef]
- Kautzmann, C.; Castanha, E.; Dammann, C.A.J.; de Jesus, B.A.P.; da Silva, G.F.; Magalhães, M.L.B.; Deolindo, C.T.P.; Kempka, A.P. Roasted yerba mate (Ilex paraguariensis) infusions in bovine milk model before and after in vitro digestion: Bioaccessibility of phenolic compounds, antioxidant activity, protein–polyphenol interactions and bioactive peptides. Food Res. Int. 2024, 183, 114206. [Google Scholar] [CrossRef]
- Dacoreggio, M.V.; Santetti, G.S.; Inácio, H.P.; Haas, I.C.S.; Wanderley, B.R.S.M.; Hoff, R.B.; Freire, C.B.F.; Kempka, A.P.; Amboni, R.D.M.C. Exploring the effects of gastrointestinal digestion on phenolic profile and antioxidant activity: A new perspective on the biological potential of Eugenia pyriformis Cambess leaf infusion. Meas. Food 2024, 14, 100167. [Google Scholar] [CrossRef]
- Bonoli, M.; Bendini, A.; Cerretani, L.; Lercker, G.; Toschi, T.G. Qualitative and semiquantitative analysis of phenolic compounds in extra virgin olive oil as a function of the ripening degree of olive fruits by different analytical techniques. J. Agric. Food Chem. 2004, 52, 7026–7032. [Google Scholar] [CrossRef] [PubMed]
- Arepally, D.; Reddy, R.S.; Goswami, K.; Datta, A.K. Biscuit baking: A review. LWT 2020, 131, 109726. [Google Scholar] [CrossRef]
- Ricca, M.L.M. Development of veterinary biscuits containing Ginkgo biloba extract. Braz. J. Health Rev. 2020, 3, 5715–5733. [Google Scholar] [CrossRef]
- Sumny, E.H.; Cunico, L.; Céceres, B.G.O.; da Silva, A.S.; Kempka, A.P. Comparative analysis of non fermented and Saccharomyces boulardii fermented whey: Peptidomic profiling, in silico bioactive peptide analysis, and in vivo evaluation of serum proteins and immune response. Int. Dairy J. 2025, 166, 106222. [Google Scholar] [CrossRef]
- Bandara, N.; Chalamaiah, M. Bioactives from agricultural processing by-products. In Encyclopedia of Food Chemistry; Elsevier: London, UK, 2019; pp. 742–480. [Google Scholar] [CrossRef]
- Spínola, V.; Llorent Martínez, E.J.; Castilho, P.C. Antioxidant polyphenols of Madeira sorrel (Rumex maderensis): How do they survive simulated in vitro gastrointestinal digestion? Food Chem. 2018, 259, 105–112. [Google Scholar] [CrossRef]
- Liang, N.; Kitts, D.D. Role of chlorogenic acids in controlling oxidative and inflammatory stress conditions. Nutrients 2016, 8, 16. [Google Scholar] [CrossRef]
- Rha, C.-S.; Seong, H.; Jung, Y.S.; Jang, D.; Keak, J.-G.; Kim, D.-O.; Han, N.S. Stability and fermentability of green tea flavonols in in vitro simulated gastrointestinal digestion and human fecal fermentation. Int. J. Mol. Sci. 2019, 20, 5890. [Google Scholar] [CrossRef]
- Stanisic, D.; Liu, L.H.B.; Santos dos, R.V.; Costa, A.F.; Durán, N.; Tasic, L. New sustainable process for hesperidin isolation and anti-ageing effects of hesperidin nanocrystals. Molecules 2020, 25, 4534. [Google Scholar] [CrossRef] [PubMed]
- Wang, W.; Le, T.; Wang, W.-W.; Yin, J.-F.; Jiang, H.-Y. The effects of structure and oxidative polymerization on antioxidant activity of catechins and polymers. Foods 2023, 12, 4207. [Google Scholar] [CrossRef]
- Xu, Y.-Q.; Gao, Y.; Granato, D. Effects of epigallocatechin gallate, epigallocatechin and epicatechin gallate on the chemical and cell based antioxidant activity, sensory properties, and cytotoxicity of a catechin free model beverage. Food Chem. 2021, 339, 128060. [Google Scholar] [CrossRef] [PubMed]
- Calderón Montaño, J.M.; Burgos Morón, E.; Pérez Guerrero, C.; López Lázaro, M. A review on the dietary flavonoid kaempferol. Mini Rev. Med. Chem. 2011, 11, 298–344. [Google Scholar] [CrossRef]
- Nabavi, S.F.; Russo, G.L.; Daglia, M.; Nabavi, S.M. Role of quercetin as an alternative for obesity treatment: you are what you eat! Food Chem. 2015, 179, 305–310. [Google Scholar] [CrossRef] [PubMed]
- Peanparkdee, M.; Patrawart, J.; Iwamoto, S. Physicochemical stability and in vitro bioaccessibility of phenolic compounds and anthocyanins from Thai rice bran extracts. Food Chem. 2020, 329, 127157. [Google Scholar] [CrossRef]
- Bouayed, J.; Hoffmann, L.; Bohn, T. Total phenolics, flavonoids, anthocyanins and antioxidant activity following simulated gastrointestinal digestion and dialysis of apple varieties: bioaccessibility and potential uptake. Food Chem. 2011, 128, 14–21. [Google Scholar] [CrossRef]
- Alminger, M.; Aura, A.-M.; Bohn, T.; Dufour, C.; El, S.N.; Gomes, A.; Karakaya, S.; Martínez Cuesta, M.C.; McDougall, G.J.; Requena, T.; Santos, C.N. In vitro models for studying secondary plant metabolite digestion and bioaccessibility. Compr. Rev. Food Sci. Food Saf. 2014, 13, 413–436. [Google Scholar] [CrossRef]
- Dantas, A.M.; Mafaldo, I.M.; de Oliveira, P.M.L.; dos Lima, M.S.; Magnani, M.; Borges, G.S.C. Bioaccessibility of phenolic compounds in native and exotic frozen pulps explored in Brazil using a digestion model coupled with a simulated intestinal barrier. Food Chem. 2019, 274, 202–214. [Google Scholar] [CrossRef]
- Asadi, S.; Nojavan, S.; Behpour, M.; Mahdavi, P. Electromembrane extraction based on agarose gel for the extraction of phenolic acids from fruit juices. J. Chromatogr. B 2020, 1159, 122401. [Google Scholar] [CrossRef]
- Yu, J.; You, B.; Yang, S.; Xian, W.; Deng, Y.; Huang, W.; Yang, R. Phenolic profiles, bioaccessibility and antioxidant activity of plum (Prunus salicina Lindl.). Food Res. Int. 2021, 143, 110300. [Google Scholar] [CrossRef]
- Xiao, Y.; Hu, Z.; Yin, Z.; Zhou, Y.; Liu, T.; Zhou, Z.; Chang, D. Profiling and distribution of metabolites of procyanidin B2 in mice by UPLC DAD ESI IT TOF MSⁿ technique. Front. Pharmacol. 2017, 8, 231. [Google Scholar] [CrossRef]
- Gonzales, G.B.; Camp, J.V.; Vissenaekens, H.; Raes, K.; Smagghe, G.; Grootaert, C. Review on the use of cell cultures to study metabolism, transport, and accumulation of flavonoids: from mono-cultures to co culture systems. Compr. Rev. Food Sci. Food Saf. 2015, 14, 741–754. [Google Scholar] [CrossRef]
- Xie, L.; Deng, Z.; Zhang, J.; Dong, H.; Wang, W.; Xing, B.; Liu, X. Comparison of flavonoid O glycoside, C glycoside and their aglycones on antioxidant capacity and metabolism during in vitro digestion and in vivo. Foods 2022, 11, 882. [Google Scholar] [CrossRef] [PubMed]
- Vaz, V.M.; Jitta, S.R.; Verma, R.; Kumar, L. Hesperetin-loaded proposomal gel for topical antioxidant activity. J. Drug Deliv. Sci. Technol. 2021, 66, 102873. [Google Scholar] [CrossRef]
- Shahidi, F.; Ambigaipalan, P. Phenolics and polyphenolics in foods, beverages and spices: antioxidant activity and health effects—a review. J. Funct. Foods 2015, 18, 820–897. [Google Scholar] [CrossRef]
- Sultana, B.; Anwar, F. Flavonols (kaempferol, quercetin, myricetin) contents of selected fruits, vegetables and medicinal plants. Food Chem. 2008, 108, 879–884. [Google Scholar] [CrossRef]
- Panche, A.N.; Diwan, A.D.; Chandra, S.R. Flavonoids: an overview. J. Nutr. Sci. 2016, 5, 47. [Google Scholar] [CrossRef]
- Lopez Corona, A.V.; Valencia Espinosa, I.; González Sánchez, F.A.; Sánchez López, A.L.; Garcia Amezquita, L.E.; Garcia Varela, R. Antioxidant, anti inflammatory and cytotoxic activity of phenolic compound family extracted from raspberries (Rubus idaeus): a general review. Antioxidants 2022, 11, 1192. [Google Scholar] [CrossRef]
- Zhang, B.; Deng, Z.; Tang, Y.; Chen, P.X.; Liu, R.; Ramdath, D.D.; Liu, Q.; Hernandez, M.; Tsao, R. Bioaccessibility, in vitro antioxidant and anti-inflammatory activities of phenolics in cooked green lentil (Lens culinaris). J. Funct. Foods 2017, 32, 248–255. [Google Scholar] [CrossRef]
- Celep, E.; Akyüz, S.; İnanç, Y.; Yesilada, E. Stability of phenolic content of some herbal infusions and their antioxidant activity following in vitro digestion. Turk. J. Biochem. 2017, 42, 375–380. [Google Scholar] [CrossRef]
- Kashyap, P.; Riar, C.S.; Jindal, N. Effect of extraction methods and simulated in vitro gastrointestinal digestion on phenolic compound profile, bio accessibility, and antioxidant activity of Meghalayan cherry (Prunus nepalensis) pomace extracts. LWT 2022, 153, 112570. [Google Scholar] [CrossRef]
- Farias, D.P.; de Araújo, F.F.; Neri Numa, I.A.; Dias Audibert, F.L.; Delafiori, J.; Catharino, R.R.; Pastore, G.M. Effect of in vitro digestion on the bioaccessibility and bioactivity of phenolic compounds in fractions of Eugenia pyriformis fruit. Food Res. Int. 2021, 150, 110767. [Google Scholar] [CrossRef]
- Pavan, V.; Sancho, R.A.S.; Pastore, G.M. The effect of in vitro digestion on the antioxidant activity of fruit extracts (Carica papaya, Artocarpus heterophyllus and Annona marcgravii). LWT – Food Sci. Technol. 2014, 59, 1247–1251. [Google Scholar] [CrossRef]
- Ma, Y.; Gao, J.; Wei, Z.; Shahidi, F. Effect of in vitro digestion on phenolics and antioxidant activity of red and yellow colored pea hulls. Food Chem. 2021, 337, 127606. [Google Scholar] [CrossRef] [PubMed]
- Qin, Y.; Wang, L.; Liu, Y.; Zhang, Q.; Li, Y.; Wu, Z. Release of phenolic compounds from Rubus idaeus L. dried fruits and seeds during simulated in vitro digestion and their bio activities. J. Funct. Foods 2018, 46, 57–65. [Google Scholar] [CrossRef]
- Sun, Y.-Q.; Tao, X.; Men, X.-M.; Xu, Z.-W.; Wang, T. In vitro and in vivo antioxidant activities of three major polyphenolic compounds in pomegranate peel: ellagic acid, punicalin and punicalagin. J. Integr. Agric. 2017, 16, 1808–1818. [Google Scholar] [CrossRef]
- Williamson, G. Possible effects of dietary polyphenols on sugar absorption and digestion. Mol. Nutr. Food Res. 2013, 57, 48–57. [Google Scholar] [CrossRef]
- Huang, Y.; Richardson, S.J.; Brennan, C.S.; Kasapis, S. Mechanistic insights into α amylase inhibition, binding affinity and structural changes upon interaction with gallic acid. Food Hydrocoll. 2024, 148, 109467. [Google Scholar] [CrossRef]
- Zheng, Y.; Yang, W.; Sun, W.; Chen, S.; Liu, D.; Kong, X.; Tian, J.; Ye, X. Inhibition of porcine pancreatic α amylase activity by chlorogenic acid. J. Funct. Foods 2020, 64, 103587. [Google Scholar] [CrossRef]
- Etgeton, S.A.P.; Ávila, S.; Silva, A.C.R.; de Lima, J.J.; Rodrigues, A.D.D.P.S.; Beux, M.R.; Kruger, C.C.H. Nutritional composition, simulated digestion and biological activities of Campomanesia xanthocarpa fruit. Plant Foods Hum. Nutr. 2024, 79, 59–65. [Google Scholar] [CrossRef] [PubMed]
- Mushtaq, A.; Naila, S.; Nadia, M.; Rahmat, A.K. Phytochemical analysis and inhibitory effects of Calligonum polygonoides on pancreatic α amylase and β glucosidase enzymes. J. Tradit. Chin. Med. 2022, 42, 426–431. [Google Scholar] [CrossRef]
- Habtemariam, S. α Glucosidase inhibitory activity of kaempferol 3 O rutinoside. Nat. Prod. Commun. 2011, 6, 201–203. [Google Scholar] [CrossRef]
- Wojdyło, A.; Nowicka, P.; Turkiewicz, I.P.; Tkacz, K.; Hernández, F. Comparison of bioactive compounds and health promoting properties of fruits and leaves of apple, pear and quince. Sci. Rep. 2021, 11, 20253. [Google Scholar] [CrossRef]
- Spínola, V.; Pinto, J.; Llorent Martínez, E.J.; Castilho, P.C. Changes in the phenolic compositions of Elaeagnus umbellata and Sambucus lanceolata after in vitro gastrointestinal digestion and evaluation of their potential anti diabetic properties. Food Res. Int. 2019, 122, 283–294. [Google Scholar] [CrossRef]
- Gong, L.; Feng, D.; Wang, T.; Ren, Y.; Liu, Y.; Wang, J. Inhibitors of α amylase and α glucosidase: potential linkage for whole cereal foods on prevention of hyperglycemia. Food Sci. Nutr. 2020, 8, 6320–6337. [Google Scholar] [CrossRef] [PubMed]
- Phan, M.A.T.; Wang, J.; Tang, J.; Lee, Y.; Ng, K. Evaluation of α glucosidase inhibition potential of some flavonoids from Epimedium brevicornum. Food Sci. Technol. 2013, 53, 492–498. [Google Scholar] [CrossRef]
- Mittman, N.; Desiraju, B.; Fazil, I.; Kapupara, H.; Chattopadhyay, J.; Jani, C.M.; Avram, M.M. Serum fructosamine versus glycosylated hemoglobin as an index of glycemic control, hospitalization, and infection in diabetic hemodialysis patients. Kidney Int. 2010, 78 (Suppl. 117), S41–S45. [Google Scholar] [CrossRef] [PubMed]
- Andrade, L.J.O.; Bittencourt, A.M.V.; Brito, L.F.M.; Oliveira, L.M.; Oliveira, G.C.M. Estimated average blood glucose level based on fructosamine level. Arch. Endocrinol. Metab. 2023, 67, 262–265. [Google Scholar] [CrossRef]
- Hanhineva, K.; Törrönen, R.; Bondia Pons, I.; Pekkinen, J.; Kolehmainen, M.; Mykkänen, H.; Poutanen, K. Impact of dietary polyphenols on carbohydrate metabolism. Int. J. Mol. Sci. 2010, 11, 1365–1402. [Google Scholar] [CrossRef]
- Naz, R.; Saqib, F.; Awadallah, S.; Wahid, M.; Latif, M.F.; Iqbal, I.; Mubarak, M.S. Food polyphenols and type II diabetes mellitus: pharmacology and mechanisms. Molecules 2023, 28, 3996. [Google Scholar] [CrossRef]
- Alam, S.; Sarker, M.M.R.; Sultana, T.N.; Chowdhury, M.N.R.; Rashid, M.A.; Chaity, N.I.; Zhao, C.; Xiao, J.; Hafez, E.E.; Khan, S.A.; Mohamed, I.N. Antidiabetic phytochemicals from medicinal plants: prospective candidates for new drug discovery and development. Front. Endocrinol. 2022, 13, 800714. [Google Scholar] [CrossRef] [PubMed]
- Tarko, T.; Duda-Chodak, A. Influence of food matrix on the bioaccessibility of fruit polyphenolic compounds. J. Agric. Food Chem. 2020, 68, 1315–1325. [Google Scholar] [CrossRef] [PubMed]
- Sęczyk, Ł.; Gawlik Dziki, U.; Świeca, M. Influence of phenolic food matrix interactions on in vitro bioaccessibility of selected phenolic compounds and nutrient digestibility in fortified white bean paste. Antioxidants 2021, 10, 1825. [Google Scholar] [CrossRef] [PubMed]
- Sadowska Bartosz, I.; Bartosz, G. Prevention of protein glycation by natural compounds. Molecules 2015, 20, 3309–3334. [Google Scholar] [CrossRef]
- Muñiz, A.; Garcia, E.; Gonzalez, D.; Zuñiga, L. Antioxidant activity and in vitro antiglycation of the fruit of Spondias purpurea. Evid. Based Complement. Alternat. Med. 2018, 2018, 5613704. [Google Scholar] [CrossRef]
- Atta, A.; Shahid, M.; Kanwal, Z.; Jafri, S.A.; Riaz, M.; Xiao, H.; Abbas, M.; Egbuna, C.; Simal Gandara, J. Inhibition of oxidative stress and advanced glycation end product formation in a purified BSA/glucose glycation system by polyphenol extracts of selected nuts from Pakistan. Food Sci. Nutr. 2023, 11, 3414–3421. [Google Scholar] [CrossRef]
- Wang, Y.; Zhang, Q.; Li, X.; Chen, H.; Li, J.; Zhao, W.; Liu, S. Research progress on hypoglycemic effects and molecular mechanisms of flavonoids. Antioxidants 2023, 14, 378. [Google Scholar] [CrossRef]
- Shahidi, F.; Dissanayaka, C.S. Phenolic–protein interactions: insight from in silico analyses – a review. Food Prod. Process Nutr. 2023, 5, 2. [Google Scholar] [CrossRef]
- Jiang, Z.; Li, T.; Ma, L.; Chen, W.; Yu, H.; Abdul, Q.; Hou, J.; Tian, B. Comparison of interaction between three similar chalconoids and α lactalbumin: impact on structure and functionality of α lactalbumin. Food Res. Int. 2020, 131, 109006. [Google Scholar] [CrossRef]
- Wagar, K.; Engholm Keller, K.; Joehnke, M.S.; Chatterton, D.E.W.; Poojary, M.M.; Lund, M.N. Covalent bonding of 4 methylcatechol to β lactoglobulin results in the release of cysteine 4 methylcatechol adducts after in vitro digestion. Food Chem. 2022, 397, 133775. [Google Scholar] [CrossRef] [PubMed]
- Cederholm, J.; Wibell, L. Insulin release and peripheral sensitivity at the oral glucose tolerance test. Diabetes Res. Clin. Pract. 1990, 10, 167–175. [Google Scholar] [CrossRef] [PubMed]
- Dion, F.; Dumayne, C.; Henley, N.; Beauchemin, S.; Arias, E.B.; Leblond, F.A.; Lesage, S.; Lefrançois, S.; Cartee, G.D.; Pichette, V. Mechanism of insulin resistance in a rat model of kidney disease and the risk of developing type 2 diabetes. PLoS ONE 2017, 12, e0176650. [Google Scholar] [CrossRef]
- Park, S.Y.; Gautier, J.F.; Chon, S. Assessment of insulin secretion and insulin resistance in humans. Diabetes Metab. J. 2021, 45, 641–654. [Google Scholar] [CrossRef] [PubMed]
Figure 1.
Concentrations of phenolic compounds detected in leaf infusions with steeping times of 5, 10, and 15 minutes, and their respective gastric and intestinal in vitro digestions. Note: The samples were labeled as follows: L5, L10, and L15 represent leaf infusions with resting times of 5, 10, and 15 minutes, respectively; L5-G, L10-G, and L15-G correspond to leaf infusions with resting times of 5, 10, and 15 minutes, respectively, subjected to gastric digestion, while L5-I, L10-I, and L15-I refer to those subjected to intestinal digestion.
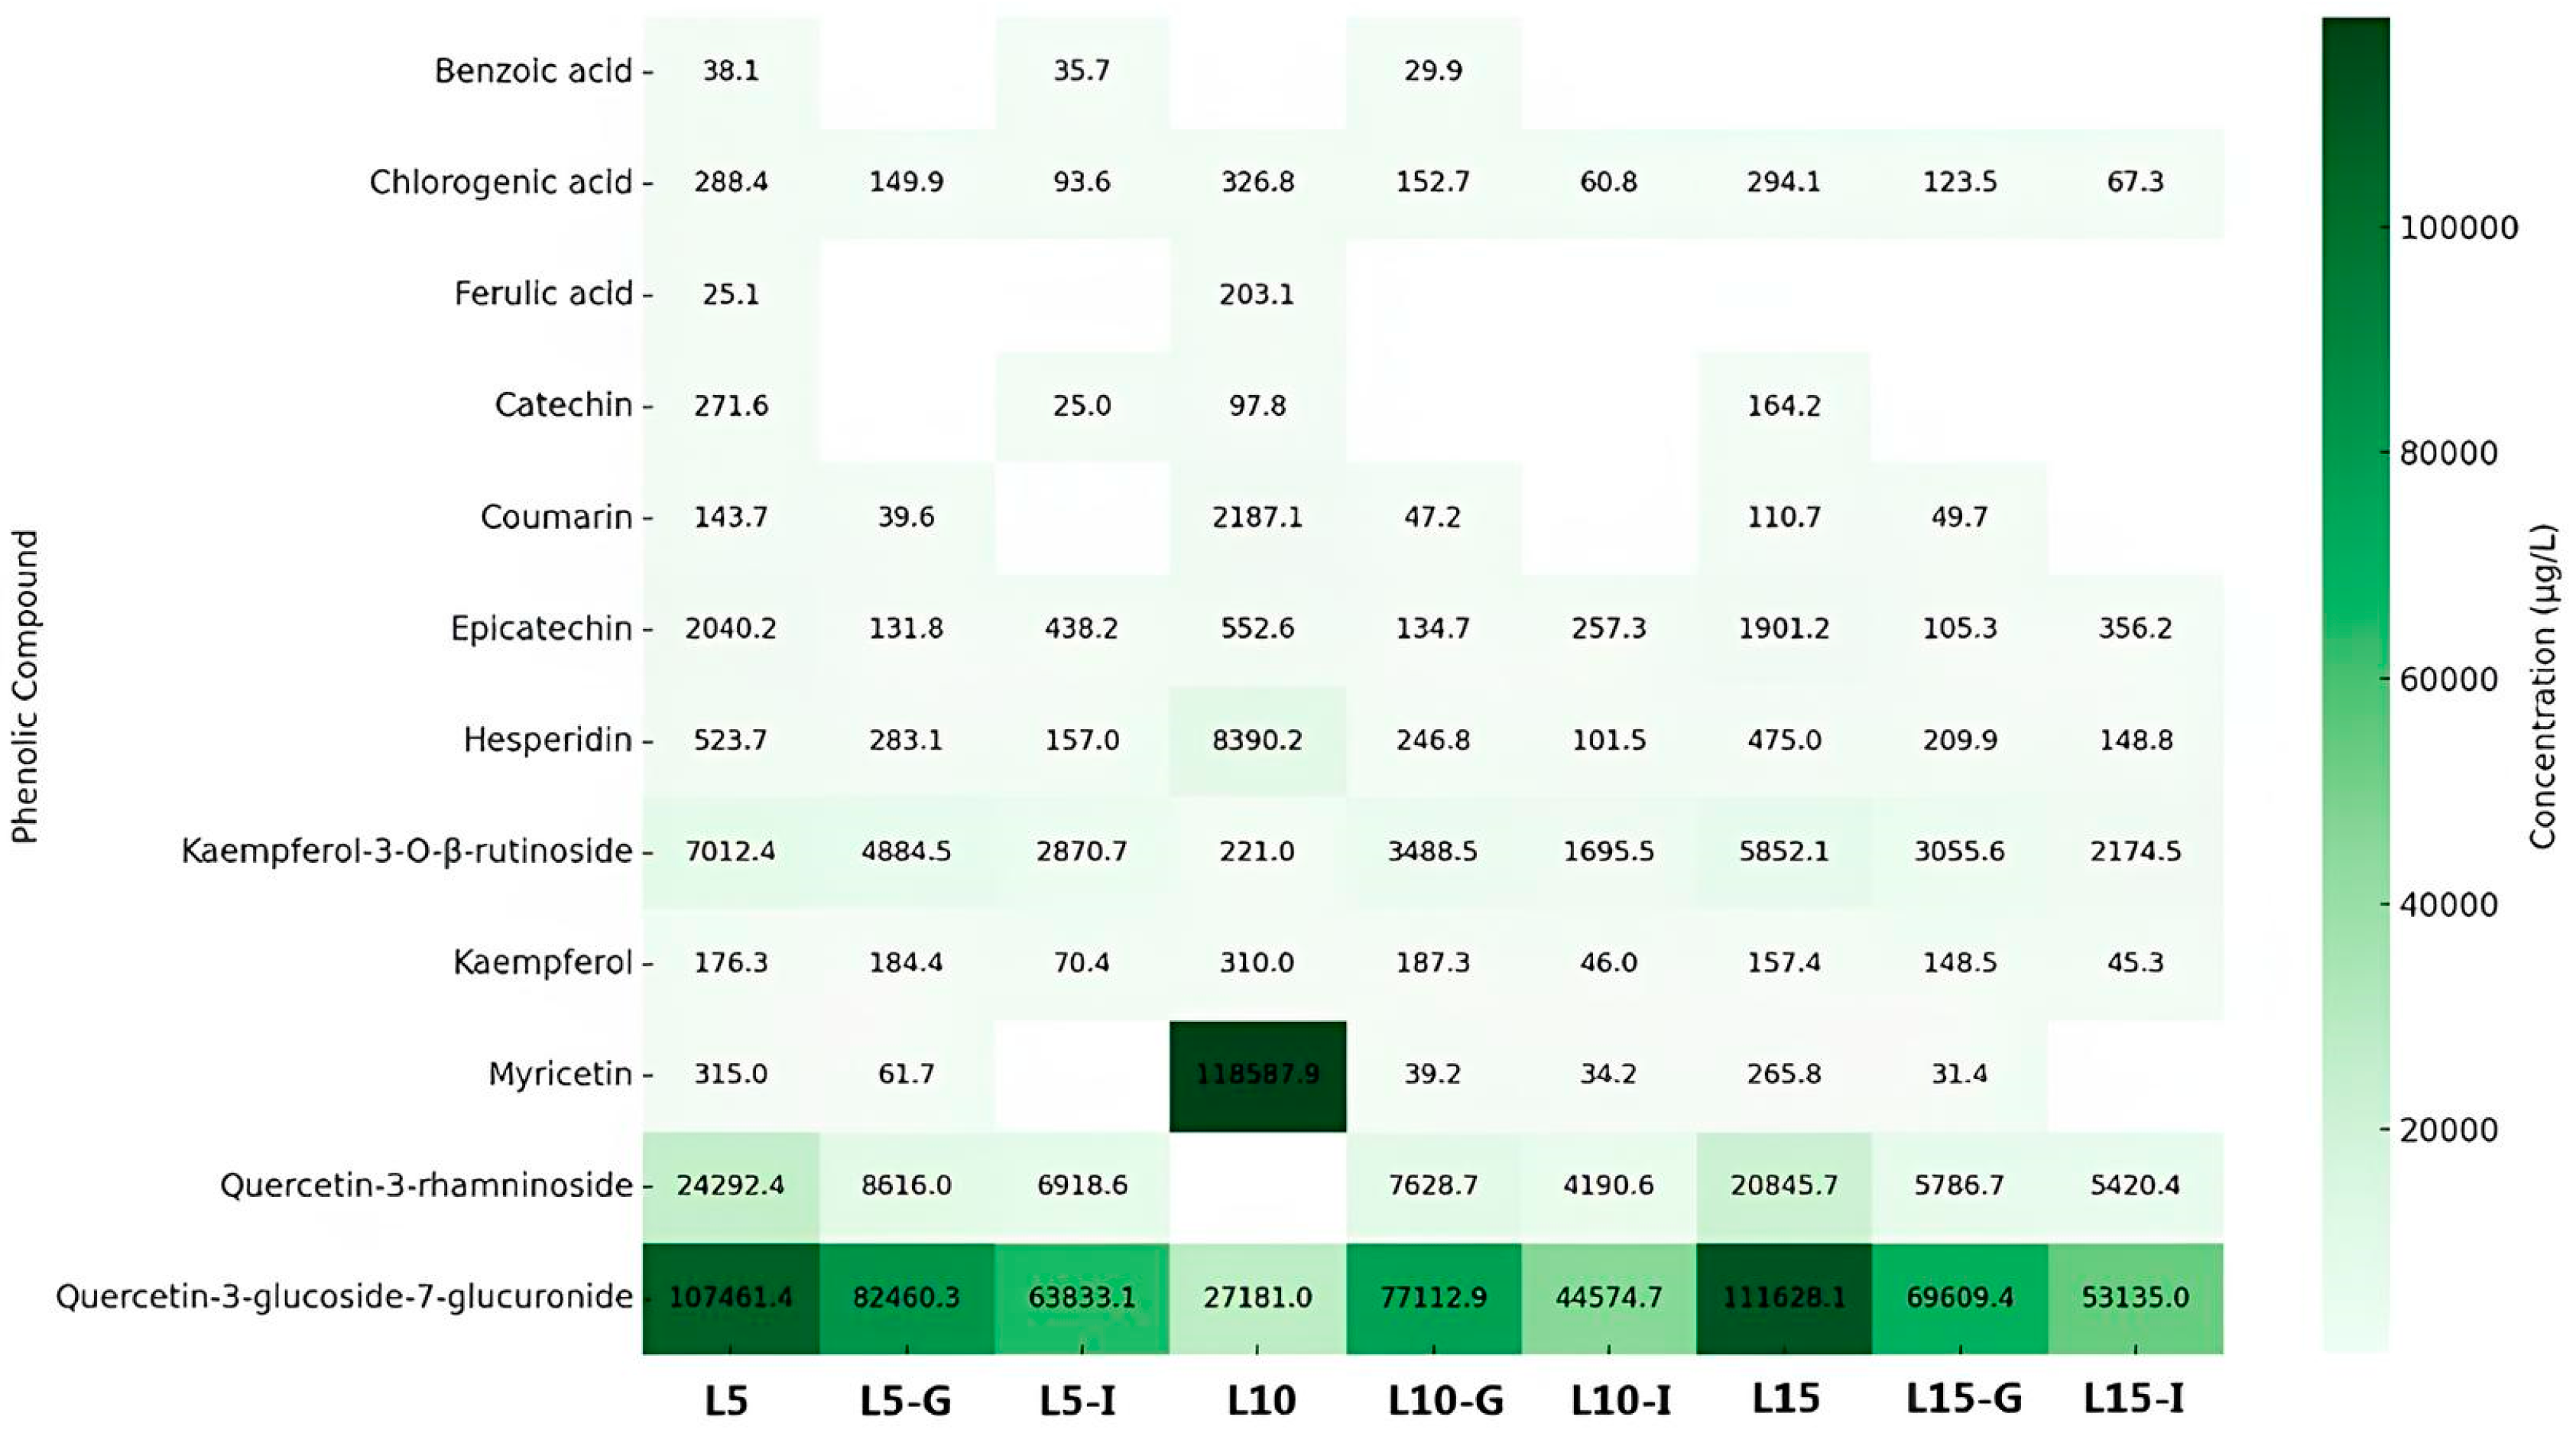
Figure 2.
Concentrations of phenolic compounds detected in fruit infusions with steeping times of 5, 10, and 15 minutes, and their respective gastric and intestinal in vitro digestions. Note: The samples were labeled as follows: F5, F10, and F15 represent fruit infusions with resting times of 5, 10, and 15 minutes, respectively; F5-G, F10-G, and F15-G correspond to fruit infusions with resting times of 5, 10, and 15 minutes, respectively, subjected to gastric digestion, while F5-I, F10-I, and F15-I refer to those subjected to intestinal digestion.
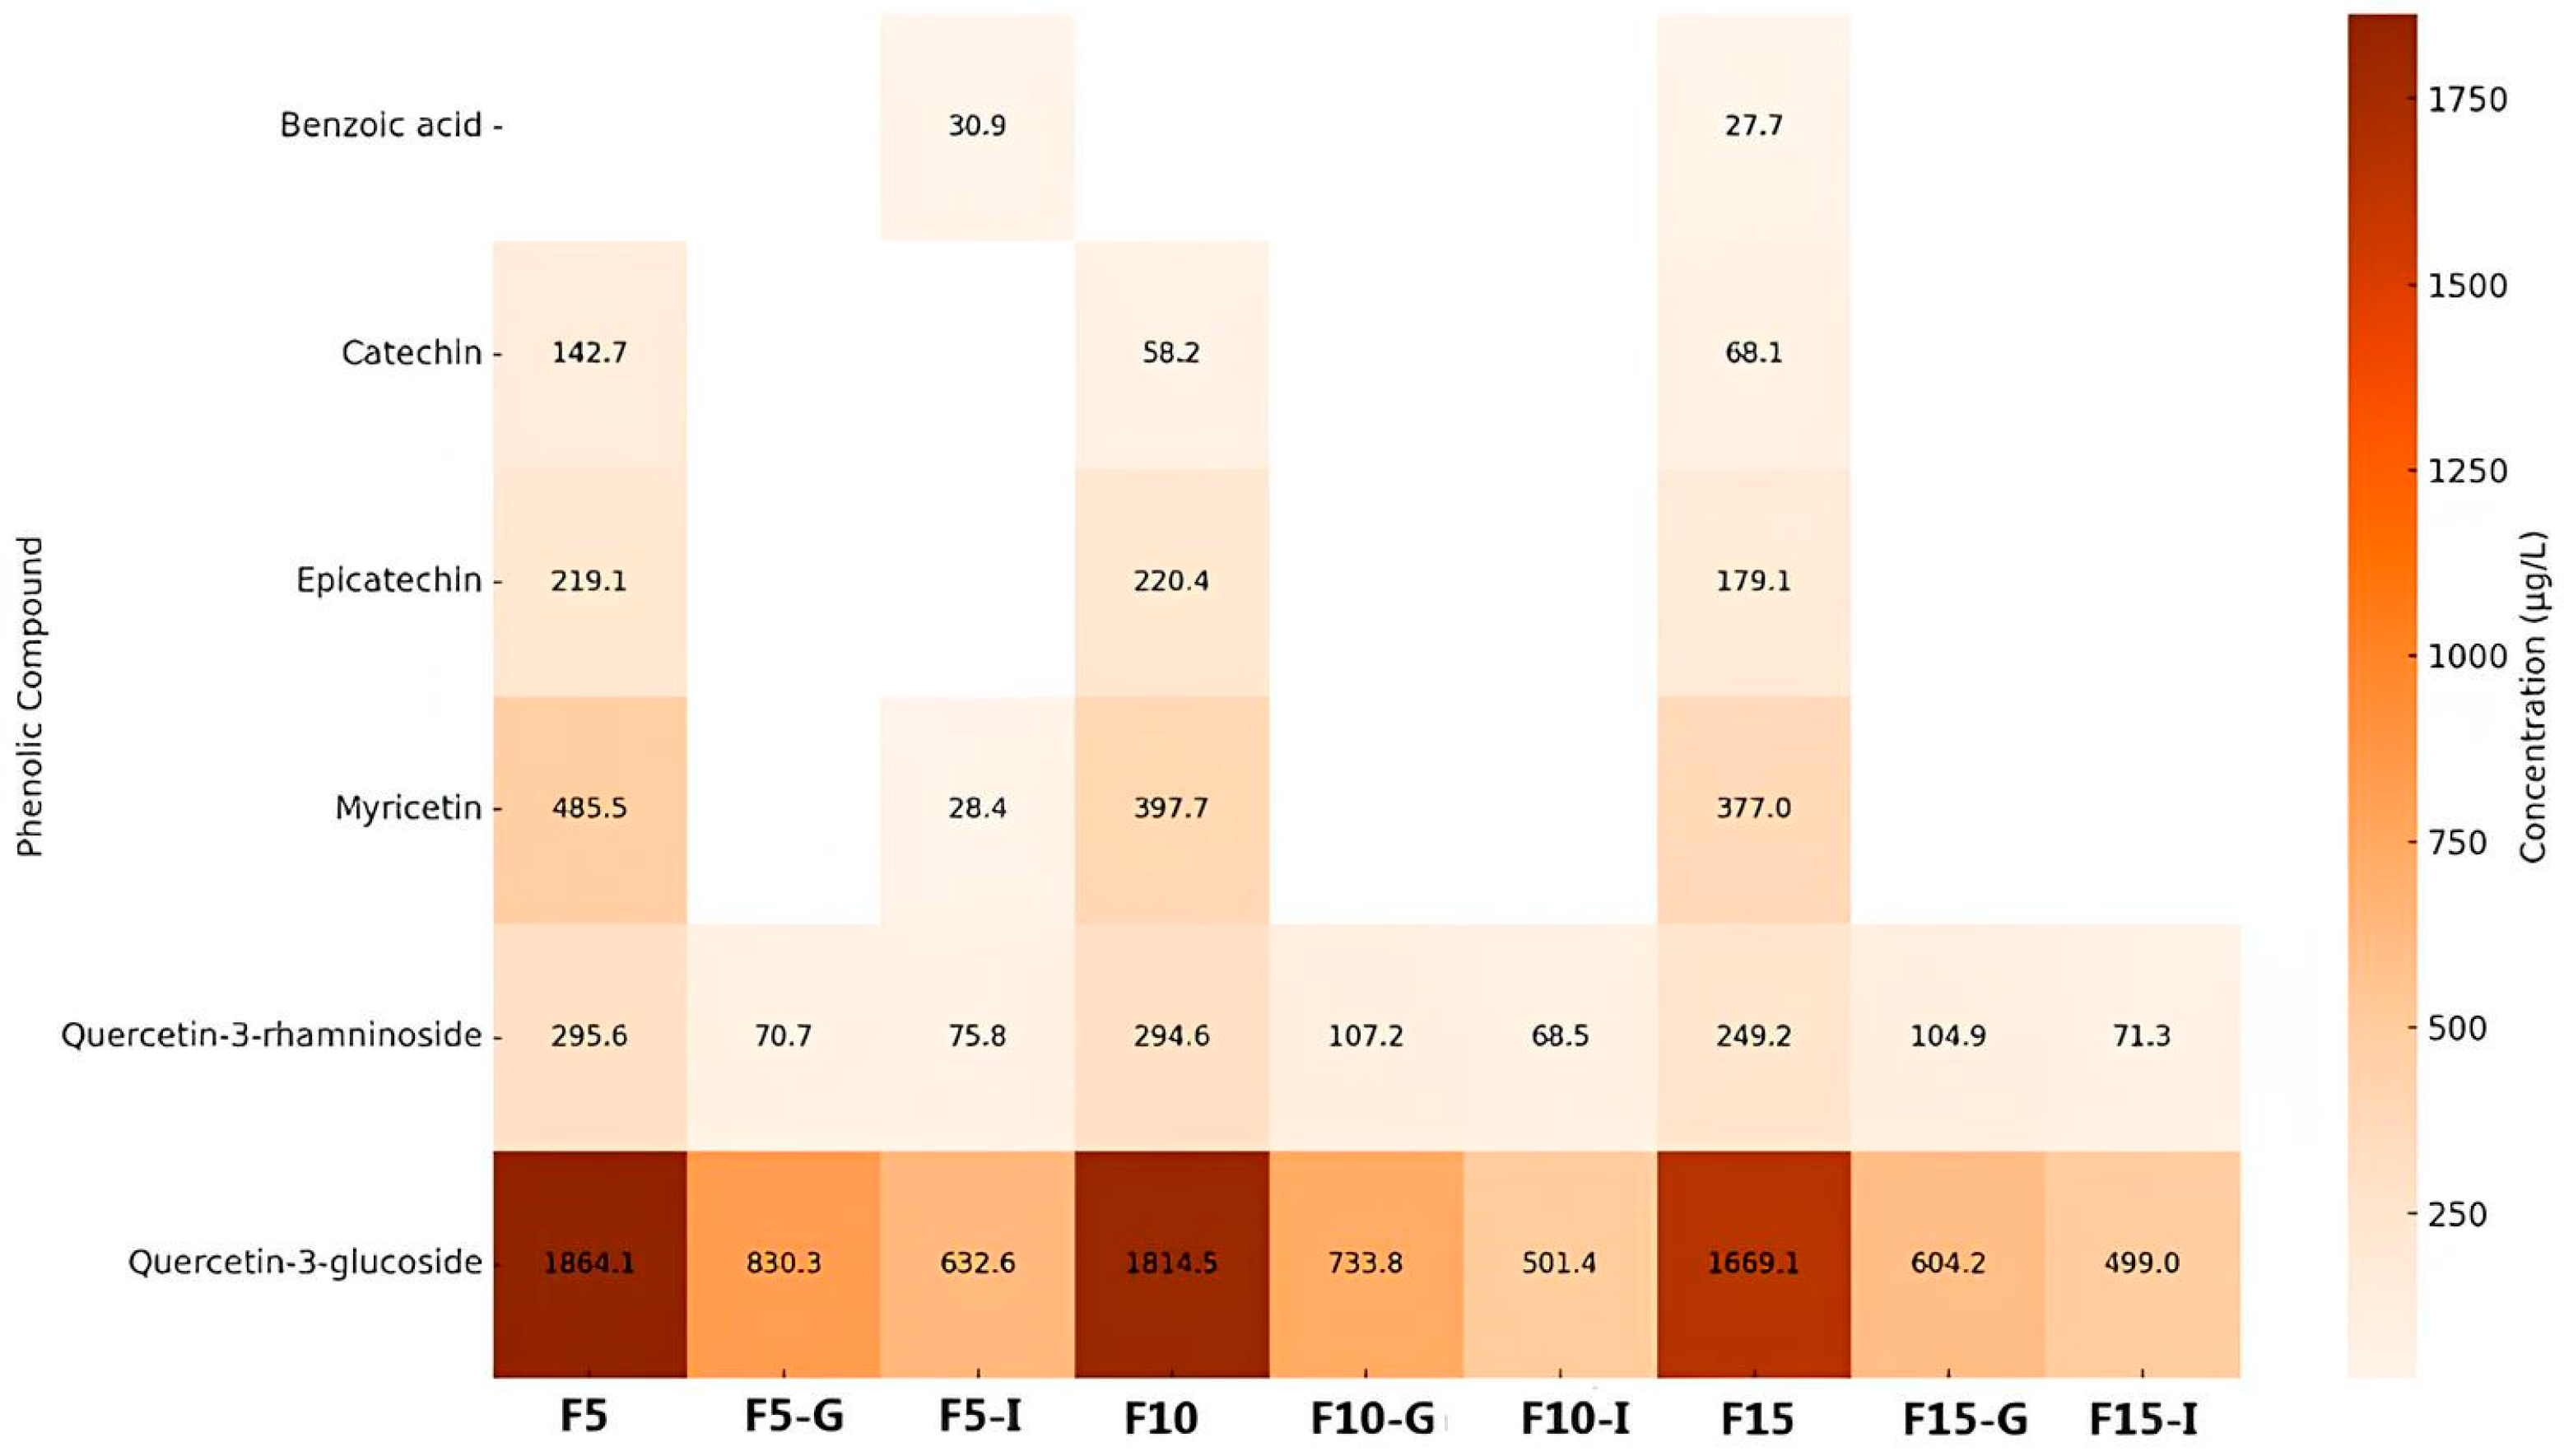
Figure 3.
Bioaccessibility index (%) of phenolic compounds after the in vitro gastrointestinal digestion process of Campomanesia xanthocarpa leaf and fruit infusions.
Figure 3.
Bioaccessibility index (%) of phenolic compounds after the in vitro gastrointestinal digestion process of Campomanesia xanthocarpa leaf and fruit infusions.
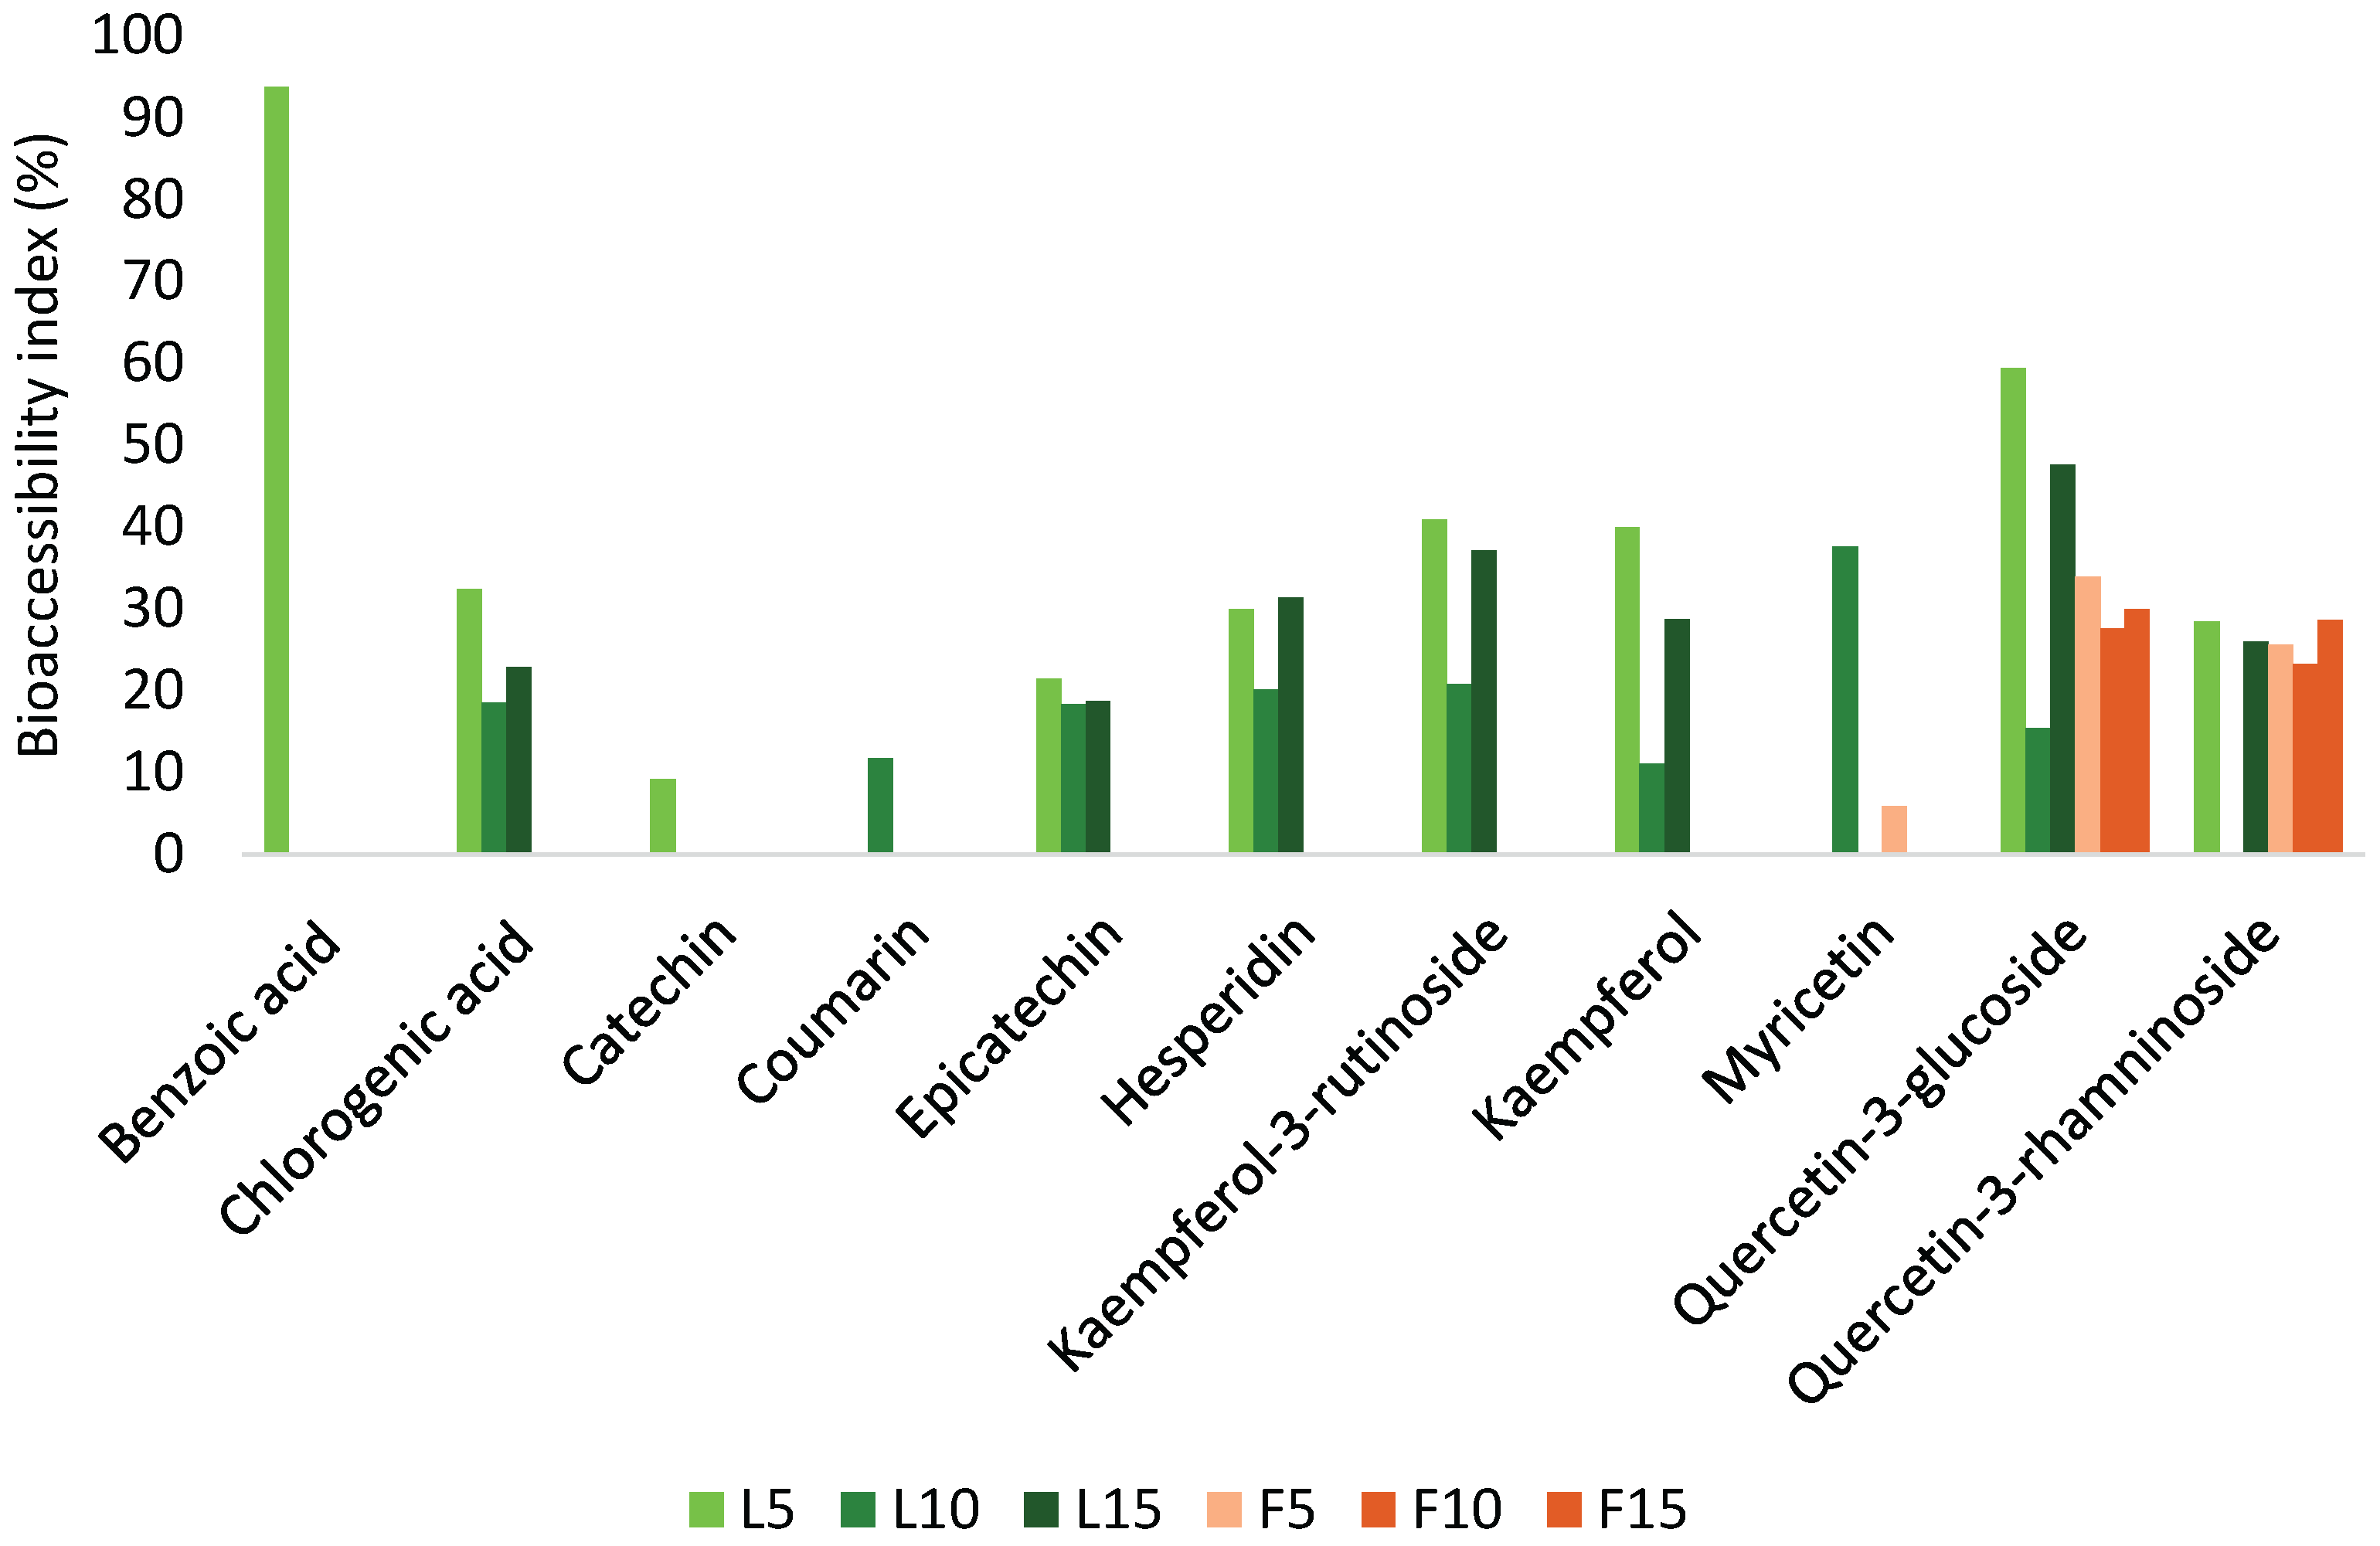
Figure 4.
Percentage inhibition of α-amylase and β-glucosidase by C. xanthocarpa leaf and fruit infusions prepared at different extraction times (5, 10, and 15 minutes).Note: Samples used for β-glucosidase inhibition were previously subjected to simulated gastric digestion, reflecting the physiological digestive progression to the small intestine.
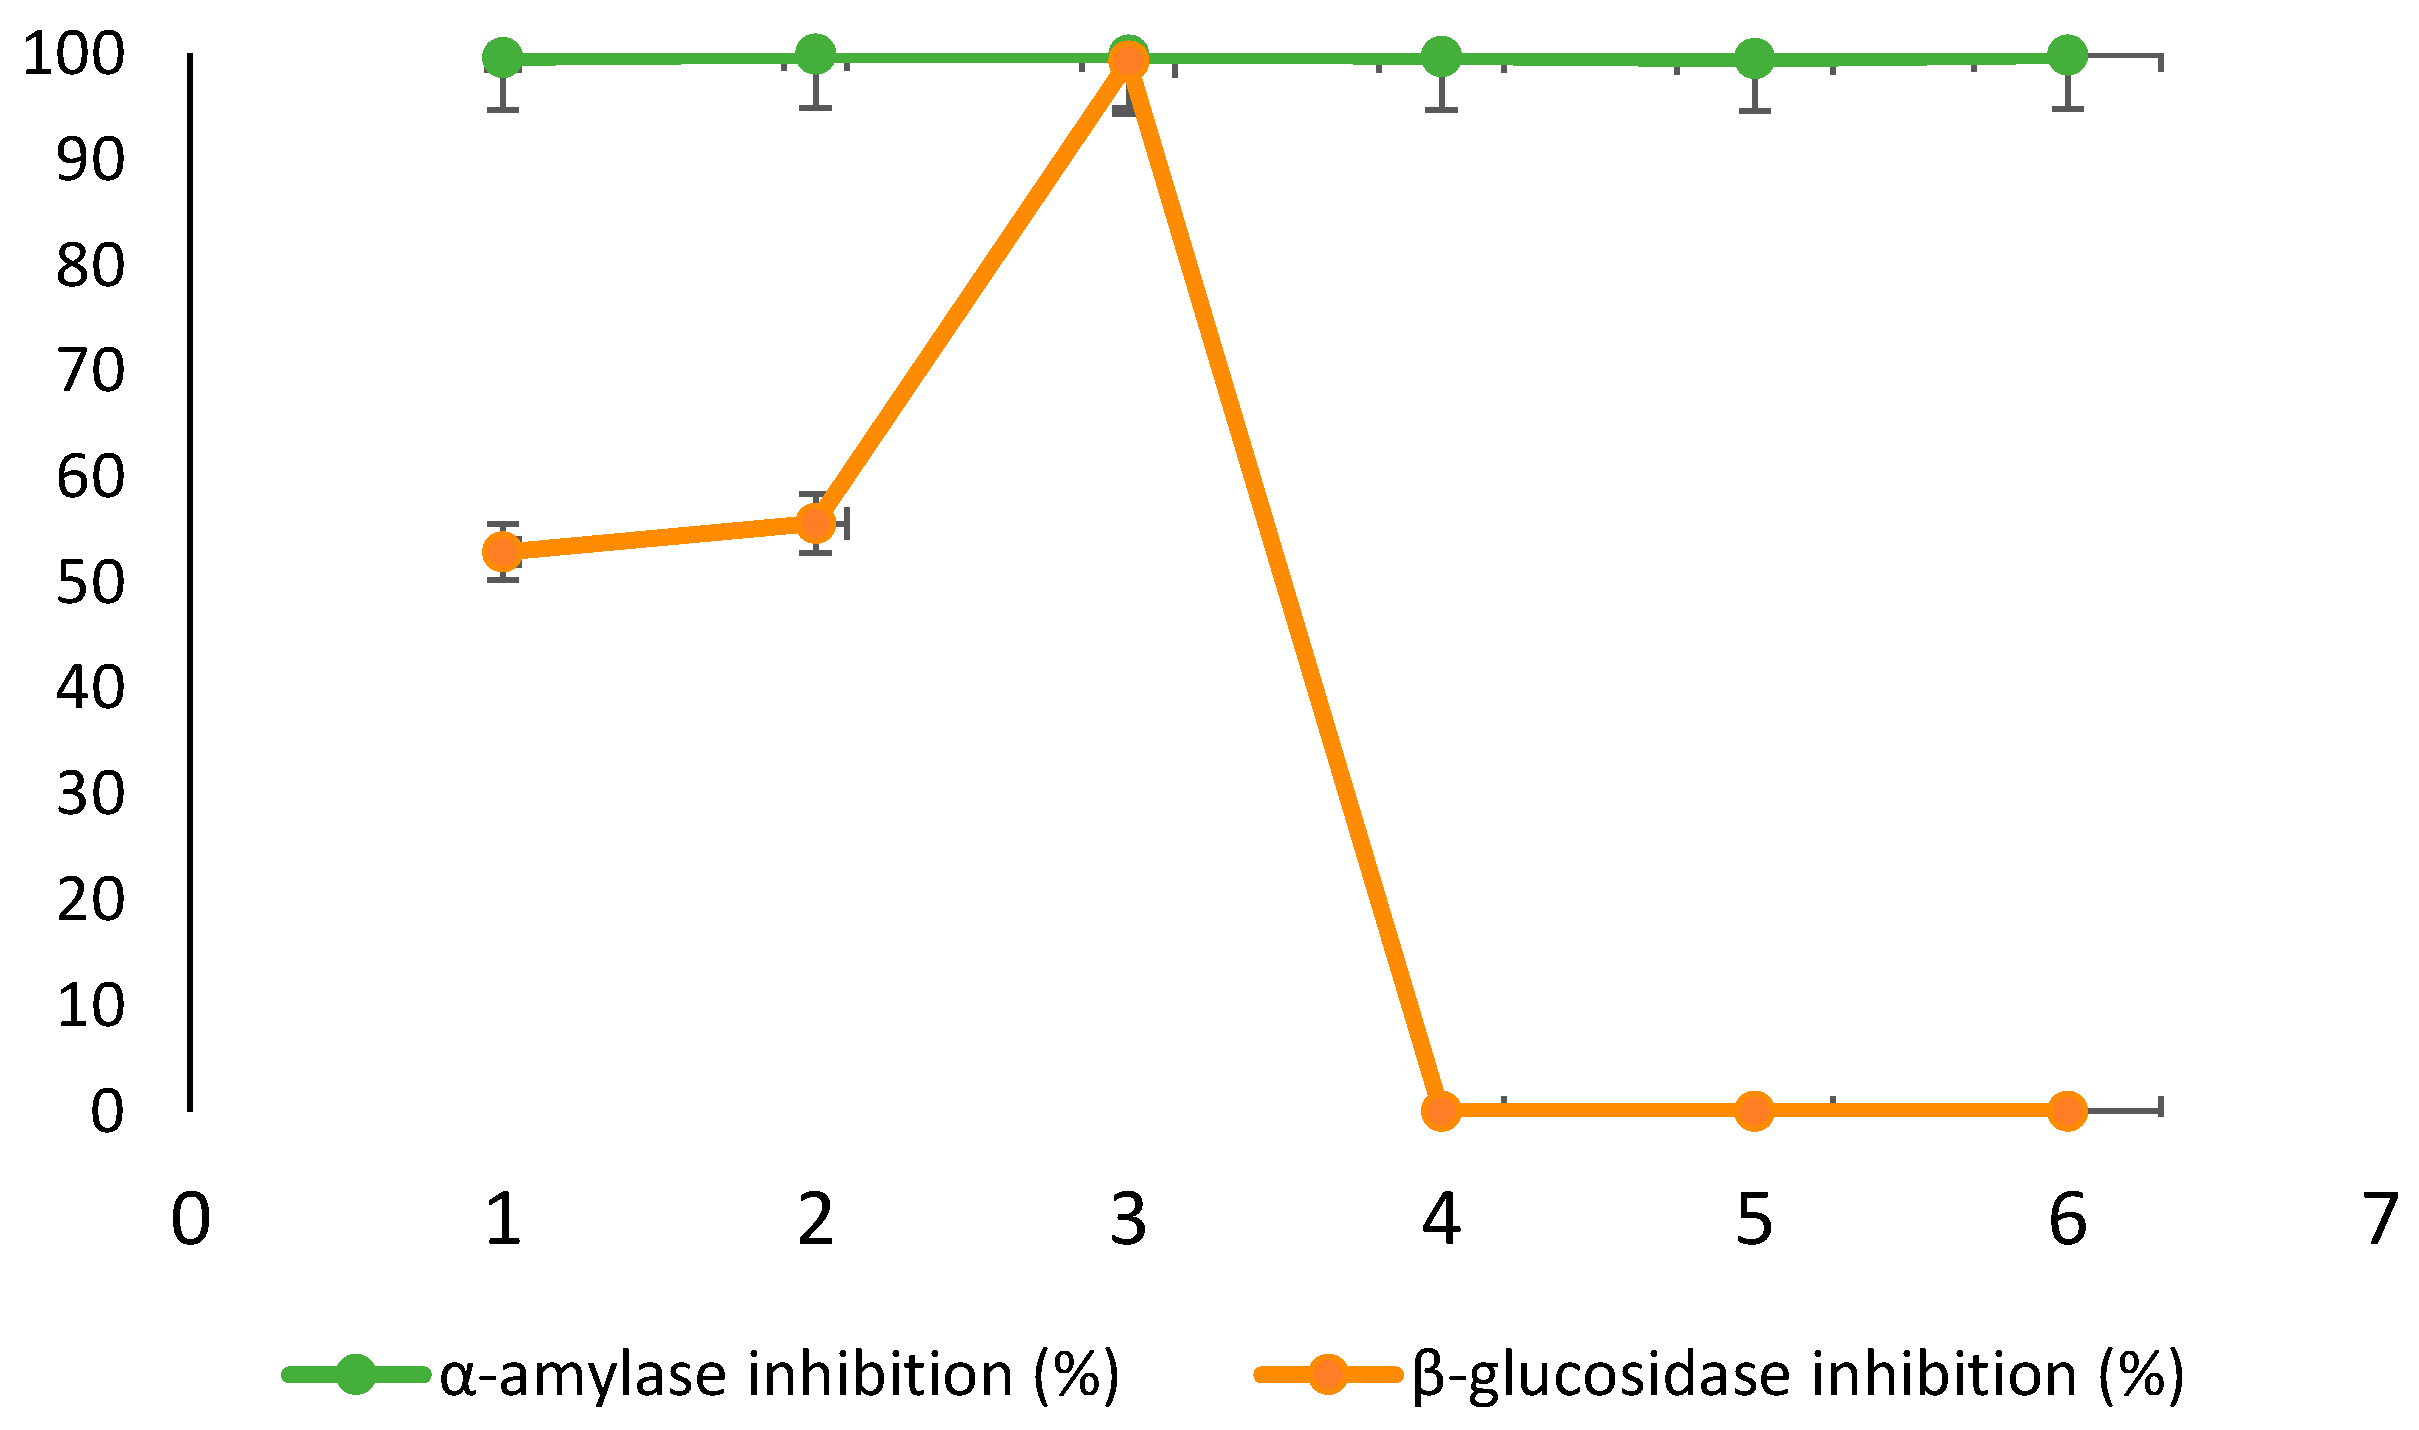

Table 1.
Ingredient composition of control and treatment dry baked biscuit formulations (% w/w), with representative image of the final product.
Table 1.
Ingredient composition of control and treatment dry baked biscuit formulations (% w/w), with representative image of the final product.
| Ingredient | Control (%) | Treatment (%) | Visual aspect |
| C. xanthocarpa leaf extract | – | 0.40 | 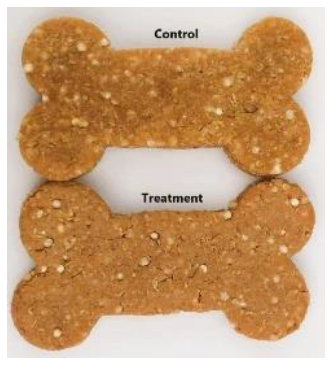 |
| Industrialized sesame biscuit | 29.89 | 29.49 | |
| Quinoa | 12.64 | 12.64 | |
| Potassium sorbate | 0.16 | 0.16 | |
| Bacon flavoring | 0.42 | 0.42 | |
| Unflavored, colorless gelatin | 4.21 | 4.21 | |
| Distilled water | 52.68 | 52.68 |
Note: The commercial sesame biscuit used in both formulations was obtained from the brand Orquídea (Caxias do Sul, Brazil).
Table 2.
- Total phenolic content (TPC) and total antioxidant capacity (TAC) of C. xanthocarpa leaf and fruit infusions before and after simulated in vitro gastrointestinal digestion.
Table 2.
- Total phenolic content (TPC) and total antioxidant capacity (TAC) of C. xanthocarpa leaf and fruit infusions before and after simulated in vitro gastrointestinal digestion.
| Sample | TPC (mg de EGA. g-1) | TAC (μM) | |||
| Infusion | Gastric digestion |
Intestinal digestion |
Infusion | Intestine | |
| L5 | 204.20 ±8.47aA | 129.90 ± 44.77aB | 87.26 ± 25.47aB | 3028.33 ± 223.6aA | 1470.00 ± 51.64aB |
| L10 | 94.85 ± 9.81cA | 92.51 ± 15.59bA | 123.10 ± 45.08aA | 2491.67 ± 85.66bA | 1025.00 ± 162.7bB |
| L15 | 154.20 ± 15.65bA | 150.50 ± 5.97aA | 81.72 ± 37.78aB | 2931.67 ± 83.14aA | 1405.00 ±15.83aB |
| F5 | 129.90 ± 49.00bA | 54.83 ± 11.90cB | 50.11 ± 2.97cB | 1288.33 ± 75.05cA | 500.00 ± 27.86cB |
| F10 | 92.52 ± 32.05cA | 69.34 ± 4.70cA | 82.78 ± 14.94aA | 1316.67 ± 113.9cA | 466.67 ± 27.95cB |
| F15 | 107.80 ± 5.21cA | 91.59 ± 36.64bA | 69.52 ± 3.21bB | 1321.67 ± 62.30cA | 513.33 ± 62.35cB |
Note: Abbreviation: <LQ = limit of quantification; L5, L10, and L15 represent leaf infusions with resting times of 5, 10, and 15 minutes, respectively; F5, F10, and F15 represent fruit infusions with resting times of 5, 10, and 15 minutes, respectively. Values followed by different lowercase letters in the same column differ significantly (P < 0.05). Different uppercase letters in the same row indicate significant differences (P < 0.05).
Table 3.
Mean values (±SEM) of fasting glucose, serum fructosamine, and amylase activity in control and treatment groups over the experimental period.
Table 3.
Mean values (±SEM) of fasting glucose, serum fructosamine, and amylase activity in control and treatment groups over the experimental period.
| Variables | Control | Treatment | SEM | P: treatment | P: treatment × day |
| Amylase (U/L) | 0.84 | 0.92 | |||
| Day 1 | 1883 | 1796 | 71.3 | ||
| Day 11 | 1939 | 1935 | 70.8 | ||
| Day 18 | 1863 | 1754 | 74.1 | ||
| Day 25 | 1769 | 1704 | 66.2 | ||
| Day 32 | 1854 | 1897 | 70.1 | ||
| Mean | 1856 | 1822 | 70.6 | ||
| Glucose (mg/dL) | 0.19 | 0.22 | |||
| Day 1 | 104 | 103 | 2.89 | ||
| Day 11 | 100 | 112 | 3.12 | ||
| Day 18 | 106 | 108 | 3.12 | ||
| Day 25 | 103 | 111 | 3.09 | ||
| Day 32 | 102 | 107 | 2.97 | ||
| Mean | 102.75 | 109.5 | 3.01 | ||
| Fructosamine (µmol/L) | 0.39 | 0.05 | |||
| Day 1 | 136 | 133 | 3.14 | ||
| Day 11 | 132ᵇ | 150ᵃ | 3.09 | ||
| Day 18 | 131 | 142 | 2.98 | ||
| Day 25 | 137 | 149 | 3.12 | ||
| Day 32 | 146 | 147 | 3.08 | ||
| Mean | 136 | 147 | 3.11 |
Note: Different letters indicate significant differences (p ≤ 0.05) in the treatment × time interaction.
Disclaimer/Publisher’s Note: The statements, opinions and data contained in all publications are solely those of the individual author(s) and contributor(s) and not of MDPI and/or the editor(s). MDPI and/or the editor(s) disclaim responsibility for any injury to people or property resulting from any ideas, methods, instructions or products referred to in the content. |
© 2025 by the authors. Licensee MDPI, Basel, Switzerland. This article is an open access article distributed under the terms and conditions of the Creative Commons Attribution (CC BY) license (http://creativecommons.org/licenses/by/4.0/).
Copyright: This open access article is published under a Creative Commons CC BY 4.0 license, which permit the free download, distribution, and reuse, provided that the author and preprint are cited in any reuse.


