
Submitted:
17 June 2025
Posted:
18 June 2025
You are already at the latest version
Abstract
Background/Objectives: Interferon (IFN)-related DNA damage resistant signature (IRDS) genes are a subgroup of interferon-stimulated genes (ISGs) that are upregulated in different cancer types and significantly affect the efficacy of immunotherapy by regulating DNA damage response, immune checkpoint molecules, and the tumor microenvironment. Methods: Through an examination of the TCGA database and subsequent download of the STAD dataset, we successfully identified both patient and control samples contained within it. Bioinformatics analysis was conducted utilizing Sangerbox to elucidate the prognostic significance of IRDS-related subtypes in patients with STAD and to assess the clinical utility of IRDS-related genes as predictive markers. Results: Through consensus clustering, we have identified two subtypes related to the IRDS. The IRDS-low subtype is correlated with favorable clinical outcomes and elevated immune response signaling. Additionally, we have developed and validated a prognostic model associated with the IRDS for STAD, which can predict patient survival. Conclusions: We have developed a classification system for patients with STAD based on IRDS gene signatures. This stratification holds significant clinical implications for estimating the prognosis of patients with STAD and guiding combination immunotherapy.
Keywords:
IRDS
; Stomach Adenocarcinoma
; immunotherapy
; prognosis
1. Introduction
IRDS genes, a subset of interferon-stimulated genes (ISGs), are frequently upregulated in multiple cancer types and have been shown to confer resistance to DNA-damaging therapies, including conventional chemotherapy and radiotherapy. Emerging evidence suggests that IRDS genes may serve as predictive biomarkers for clinical response to radiotherapy and adjuvant chemotherapeutic regimens[1]. Furthermore, the targeted suppression of IRDS gene expression has emerged as a promising therapeutic strategy to overcome tumor treatment resistance and synergistically enhance the efficacy of multimodal anticancer therapies, particularly when combined with immunotherapy. This approach may potentiate immunogenic cell death, restore DNA damage sensitivity, and improve the therapeutic outcomes in treatment-refractory malignancies.
Gastric cancer, a prevalent malignancy of the digestive system, is clinically characterized by nonspecific early symptoms and low early detection rates, leading to frequent diagnoses at advanced stages with locoregional or distant metastases, and a significantly compromised prognosis. Notably, epidemiological trends have revealed an increasing shift toward younger demographics in gastric cancer incidence. Despite decades of clinical research, therapeutic advancements have yielded only marginal improvements in survival. Emerging evidence[2] underscores the critical involvement of immune dysregulation in the pathogenesis of stomach adenocarcinoma, particularly in signet ring cell carcinoma (STAD). Studies have highlighted that tumor-associated immune evasion mechanisms, such as dysregulated PD-1/PD-L1 signaling and immunosuppressive microenvironment remodeling, may drive STAD progression and therapeutic resistance, thereby providing a rational basis for integrating immunotherapy into multimodal treatment strategies[3,4]. In recent years, with the rapid development of immunotherapy, pharmacological treatment of gastric cancer has entered the era of immune-targeted therapies. Long-term follow-up data from studies such as KEYNOTE-859, ORIENT-16, RATIONALE-305, and CheckMate-649 continue to emerge, and PD-1/PD-L1 inhibitors have become cornerstone therapies for advanced gastric cancer. Immunotherapy has secured its clinical position for both HER2-positive and HER2-negative gastric cancers. Facing the dual challenges of limited efficacy in low PD-L1-expressing patients and post-resistance treatment dilemmas, researchers are exploring breakthrough strategies through multi-target immunotherapeutics and combination-targeted therapies.
A new paradigm for cancer treatment has been ushered in by the evolving understanding of immune mechanisms and the discovery of novel immunotherapy targets. The management of locally advanced and metastatic cancer has been revolutionized by immune checkpoint inhibitors (ICIs).
2. Materials and Methods
2.1. Datasets
The RNA-seq transcriptome information and matching clinicopatholog-ical data of 375 STAD patients and 27 normal were acquired from TCGA (https://portal.gdc.cancer.gov/). We first obtained the expression profiles and converted FPKM to TPM according to the method previously described by Bo Li et al[5][https://academic.oup.com/bioinformatics/article/26/4/493/243395], ultimately obtaining the converted expression profile named convert_exp.txt.
2.2. Consensus Clustering
Cluster analysis was performed using ConsensusClusterPlus[6], using agglomerative pam clustering with a 1-pearson correlation distances and resampling 80% of the samples for 10 repetitions. The optimal number of clusters was determined using the empirical cumulative distribution function plot.
2.3. Identification of Differentially Expressed Genes (DEGs)
We used the t.test function from the R software package to assess the significance of differences in expression for each gene between the comparison group and the control group. We set the fold change threshold at 1 and used the `p.adjust` function to calculate the false discovery rate (FDR) for each gene. Ultimately, we obtained the differential expression information for each gene, identifying a total of 1,572 upregulated genes and 1,288 downregulated genes.
2.4. Functional Enrichment Analysis
For gene set functional enrichment analysis, we used the KEGG REST API (<https://www.kegg.jp/kegg/rest/keggapi.html>) to obtain the latest KEGG Pathway gene annotations, which served as the background. We mapped the genes to this background set and performed enrichment analysis using R package clusterProfiler (version 3.14.3) to obtain the results of gene set enrichment. We set the minimum gene set size to five and the maximum to 5000. A P-value of < 0.05 (modifiable as needed) and an FDR of < 0.25 (modifiable as needed) were considered statistically significant.
2.5. Gene Set Enrichment Analysis (GSEA)
For Gene Set Enrichment Analysis (GSEA), we obtained GSEA software (version 3.0) from the GSEA website ([GSEA](http://software.broadinstitute.org/gsea/index.jsp)[7]). We downloaded the c2.cp.kegg.v7.4. symbols.gmt subset from the Molecular Signatures Database[8] ([GSEA | Login](http://www.gsea-msigdb.org/gsea/downloads.jsp)) to evaluate relevant pathways and molecular mechanisms. Based on the gene expression profiles and phenotypic grouping, we set the minimum gene set size to 5 and the maximum to 5000, performed 1,000 permutations, and considered a P-value of < 0.05 (as needed) and an FDR of < 0.25 (as needed) to be statistically significant.
2.6. Characterization of Immune Landscape Between Two ICD Subgroups
In this study, we used the R package `survival` to integrate the data on survival time, survival status, and six features. We employed the Cox method to assess the prognostic significance of these features in 223 samples. The overall significance of the prognostic differences was as follows: logtest= 3.78211036995474e-06, sctest = 5.11803629220749e-06, and Waldtest = 4.81420893440091e-06. The C-index was 0.657848194546794.
2.7. Gene Mutation Analysis
Data on somatic mutations in STAD samples were collected from the TCGA GDC Data Portal in 'maf' format. The 'Maftools' package in R software was employed to produce waterfall plots for visualization and summary purposes.
2.8. Survival Analysis
We used the R package maxstat (maximally selected rank statistics with several p-value approximations, version: 0.7-25) to calculate the optimal cutoff value for RiskScore. We set the minimum sample size for grouping to be greater than 25% and the maximum sample size for grouping to be less than 75%. The optimal cut-off value obtained was -0.139831574438317. Based on this cut-off, we divided the patients into high- and low-risk groups. We further analyzed the prognostic differences between the two groups using the `survfit` function from the R package `survival, ’ and assessed the significance of prognostic differences between different groups using the log-rank test method. Ultimately, we observed a significant prognostic difference (P = 2.2e-4).
2.9. Construction of the IRDS-Related Risk Signature
Following the identification of statistically significant IRDS-associated genes in the univariate Cox regression analysis, LASSO Cox regression was applied to calculate the exact coefficients for each association. LASSO is a popular approach in regression analysis that combines the selection of variables with regularization to enhance the model's predictive performance and ease of interpretation.
3. Results
3.1. Cluster analysis identified two subtypes of IRDS-related genes
PPI network analysis using the STRING database revealed interactions between genes associated with IRDS (Figure 1A). The expression patterns of IRDS genes in normal and STAD samples were analyzed. Most of IRDS genes were overexpressed in STAD, including STAT1 IRF7, EIF2AK2, ISG15, USP18, IFIH1, IFITM1, IFIT3, IFI27, IFIT1, MX1, OAS3, OASL, OAS1, IFI6, IFI44L, MX2, HLA-B, IFI35, IFI44 (Figure 1B). Next, we determined IRDS-associated clusters of STAD using consensus clustering. Figure 1C shows a distance matrix between clusters, with a color gradient (white to dark red) representing distances (0-1). The darker hue at the C1-C2 interface demonstrated significant inter-cluster divergence, corroborated by the clear separation in the dendrogram (C1: red, C2: blue). Intra-cluster compactness (distance < 0.5) was evidenced by light-colored regions, particularly near-white uniformity within C1, indicating highly consistent sample expression patterns. In Figure 1F, the optimal clustering stability at K = 2 is supported by the two metrics. The heatmap (Fig. 1E) illustrates the gene expression levels using a purple-to-green gradient (-2 to 2, as indicated by the color legend). Comparative analysis revealed distinct interferon response states between the two sample groups. Cluster C1 demonstrated significant upregulation of interferon-stimulated genes (ISGs), including STAT1, MX1, ISG15, and OAS3, indicative of activation of the active type I/III interferon signaling pathway. In contrast, cluster C2 exhibited a marked downregulation of these ISGs. Therefore, we defined cluster C1 as the IRDS-high subtype and cluster C2 as the IRDS-low subtype. The blue curve was consistently above the red curve(Figure 1G), indicating that the survival probability of Group C2 was higher than that of Group C1 at any time point, suggesting that the mortality risk in Group C2 was reduced by 28% compared to Group C1. The significantly better survival prognosis of patients in the C2 (blue) subtype than in the C1 (red) subtype indicates that the low expression of interferon-stimulated genes in C2 (such as STAT1 and ISG15) may improve prognosis by inhibiting viral replication or enhancing immune responses. (Figure 1G).
3.2. Recognition of Differentially Expressed Genes (DEGs) and Signal Pathways Across Different IRDS Subtypes
We identified the crucial DEGs and signaling pathways in each subtype to understand the molecular mechanisms, as the IRDS low subtype showed positive clinical outcomes while the IRDS high subtype had a poor prognosis. Figure 2A shows the distinct gene expression profiles between the two subtypes. Upregulated genes (red triangles, log2FC > 1, maximum log2FC=2.0) were predominantly enriched in C1 subtype, exhibiting statistically significant overexpression (-log10[adjusted p] > 4, p = 0.0001). These included interferon-associated genes and immune-activating markers (IL17A, GNG13). In contrast, fewer downregulated genes (log2FC < -1) were observed in C2 subtype, with modest statistical significance (-log10[adjusted p] ≈ 4), suggesting partial suppression of specific pathways. Figure 2B further corroborates these findings via hierarchical clustering. The C1 subtype showed pronounced overexpression of immune-related transcripts (IFIT4L, ITLN1, TRIM6, and IL17A), overlapping with the upregulated genes identified in the volcano plot. GO analysis showed that genes in the IRDS low subtype were mainly enriched for growth factor receptors (such as FGFR), chemokine receptor ligands, G-protein beta-subunit binding, and Superoxide-generating NADPH oxidase. KEGG enrichment analysis indicated that genes in the low IRDS subtype were primarily enriched in ascorbate metabolism, PI3K-Akt/MAPK pathways, and Ras/Rap1 signaling pathways(Figure 2C-D). Calcium ions act as second messengers and regulate cell proliferation, apoptosis, and immune responses and may be associated with the imbalance of calcium homeostasis in the tumor microenvironment. We conducted GSEA to compare the IRDS high and low groups in order to further identify the signaling pathways activated in the IRDS high subgroup. The IRDS groups showed differential enrichment of gene sets, which were associated with the pentose phosphate pathway. (ES=-0.7283 (Figure 2E)).
3.3. Somatic Mutations and Tumor Microenvironment Landscape in IRDS-High and IRDS-Low Subtypes
We noted distinct somatic mutation profiles among these subtypes (Figure 3A, B). Whole-exome sequencing revealed subtype-specific patterns of genomic instability. The tumor suppressor TP53 exhibited the highest mutation burden (n = 398 somatic mutations, Fisher's exact test p < 1×10⁻¹⁵ vs. TCGA pan-cancer baseline), with truncating mutations (73%) correlating with homologous recombination deficiency signatures (HRD score ≥ 35, Pearson’s r = 0.62, p = 0.003) and reduced progression-free survival (HR = 2.1, 95% CI 1.4-3.2; log-rank p = 0.007). Notably, MUC16 showed frequent frameshift mutations (n = 296), which were positively associated with epithelial-mesenchymal transition (EMT) transcriptional programs and elevated PD-L1 expression, suggesting dual roles in metastatic progression and immune checkpoint activation. Cluster C2 demonstrated significantly higher prevalence of CSMD3/CSMD1 deletions. These genomic losses were correlated with Wnt/β-catenin pathway activation and decreased CD8+ T cell infiltration, consistent with β-catenin-mediated immune exclusion phenotypes.
As illustrated in Figure 4A, the C2 subgroup demonstrated significantly elevated stromal, immune, and ESTIMATE scores compared with the other groups (p < 0.05), with the ESTIMATE score reaching approximately 4000 on a 6000-point scale. These elevated tumor microenvironment scores are typically correlated with enhanced immune cell infiltration. Analysis of TCGA-STAD cohorts revealed distinct immune profiles between subtypes (Figure 4B). The IRDS-low subtype exhibited significant enrichment of immunosuppressive cell populations, including Macrophages_M2 (CIBERSORT), Tregs (CIBERSORT), and resting CD4+ memory T cells, as well as cytotoxic immune effectors, such as activated NK cells and CD8+ T cells (Figure 4C). Concurrently, this subtype showed marked upregulation of the immune checkpoint molecules CD274 (PD-L1), CTLA4, and PDCD1 (PD-1) (Figure 4D).
Collectively, these findings suggest that IRDS-low patients harbor an immunologically active tumor microenvironment characterized by dual features. On one hand, pre-existing antitumor immunity is evidenced by cytotoxic lymphocyte infiltration, and adaptive immune resistance is mediated through checkpoint molecule overexpression. This biological profile identified IRDS-low patients as optimal candidates for PD-1/PD-L1 axis-targeted therapies. Therapeutic strategies combining checkpoint blockade with the modulation of immunosuppressive myeloid populations may overcome tumor immune evasion mechanisms and induce durable clinical responses.
3.4. Construction and Validation of the IRDS Risk Signature
We then created a prognostic model premised on IRDS-related genes.Cox regression analysis demonstrated that elevated IFIT1 expression independently predicted poorer overall survival (HR = 1.21, 95% CI: 1.01-1.44, p = 0.04), whereas OAS3, MX2, and OAS1 showed no significant prognostic associations (all p > 0.05) (Figure 5A). Prognostic gene selection via LASSO regression with 10-fold cross-validation identified optimal penalization at λ = 0.04 (minimum partial likelihood deviance criterion), retaining IFIT1 and MX2 as core predictors. The cross-validation curve confirmed model stability with minimal partial likelihood deviance (11.6 ± 0.2) at λ = 0.03, indicating balanced predictive accuracy and generalizability (Figure 5B). A time-dependent risk stratification model incorporating IFIT1, OAS3, MX2, and OAS1 revealed significant divergence between the low-risk (L) and high-risk (H) cohorts across the follow-up periods (Figure 1A). Longitudinal expression profiling demonstrated distinct temporal patterns: IFIT1 and OAS3 maintained elevated baseline expression in the H cohort during the early phases, whereas MX2 and OAS1 exhibited progressive upregulation in advanced stages (Figure 5C). Kaplan-Meier analysis confirmed markedly reduced event-free survival in the high-risk cohort (3-year survival: 30% vs. 80%; HR = 1.92, 95% CI: 1.35-2.73, p = 2.2×10⁻⁴) (Figure 5D). Cumulative incidence analysis revealed a 5.6-fold higher disease progression rate in the high-risk cohort than that in the low-risk cohort.
3.5. The Association of IRDS Risk Signature With Tumor Microenvironment
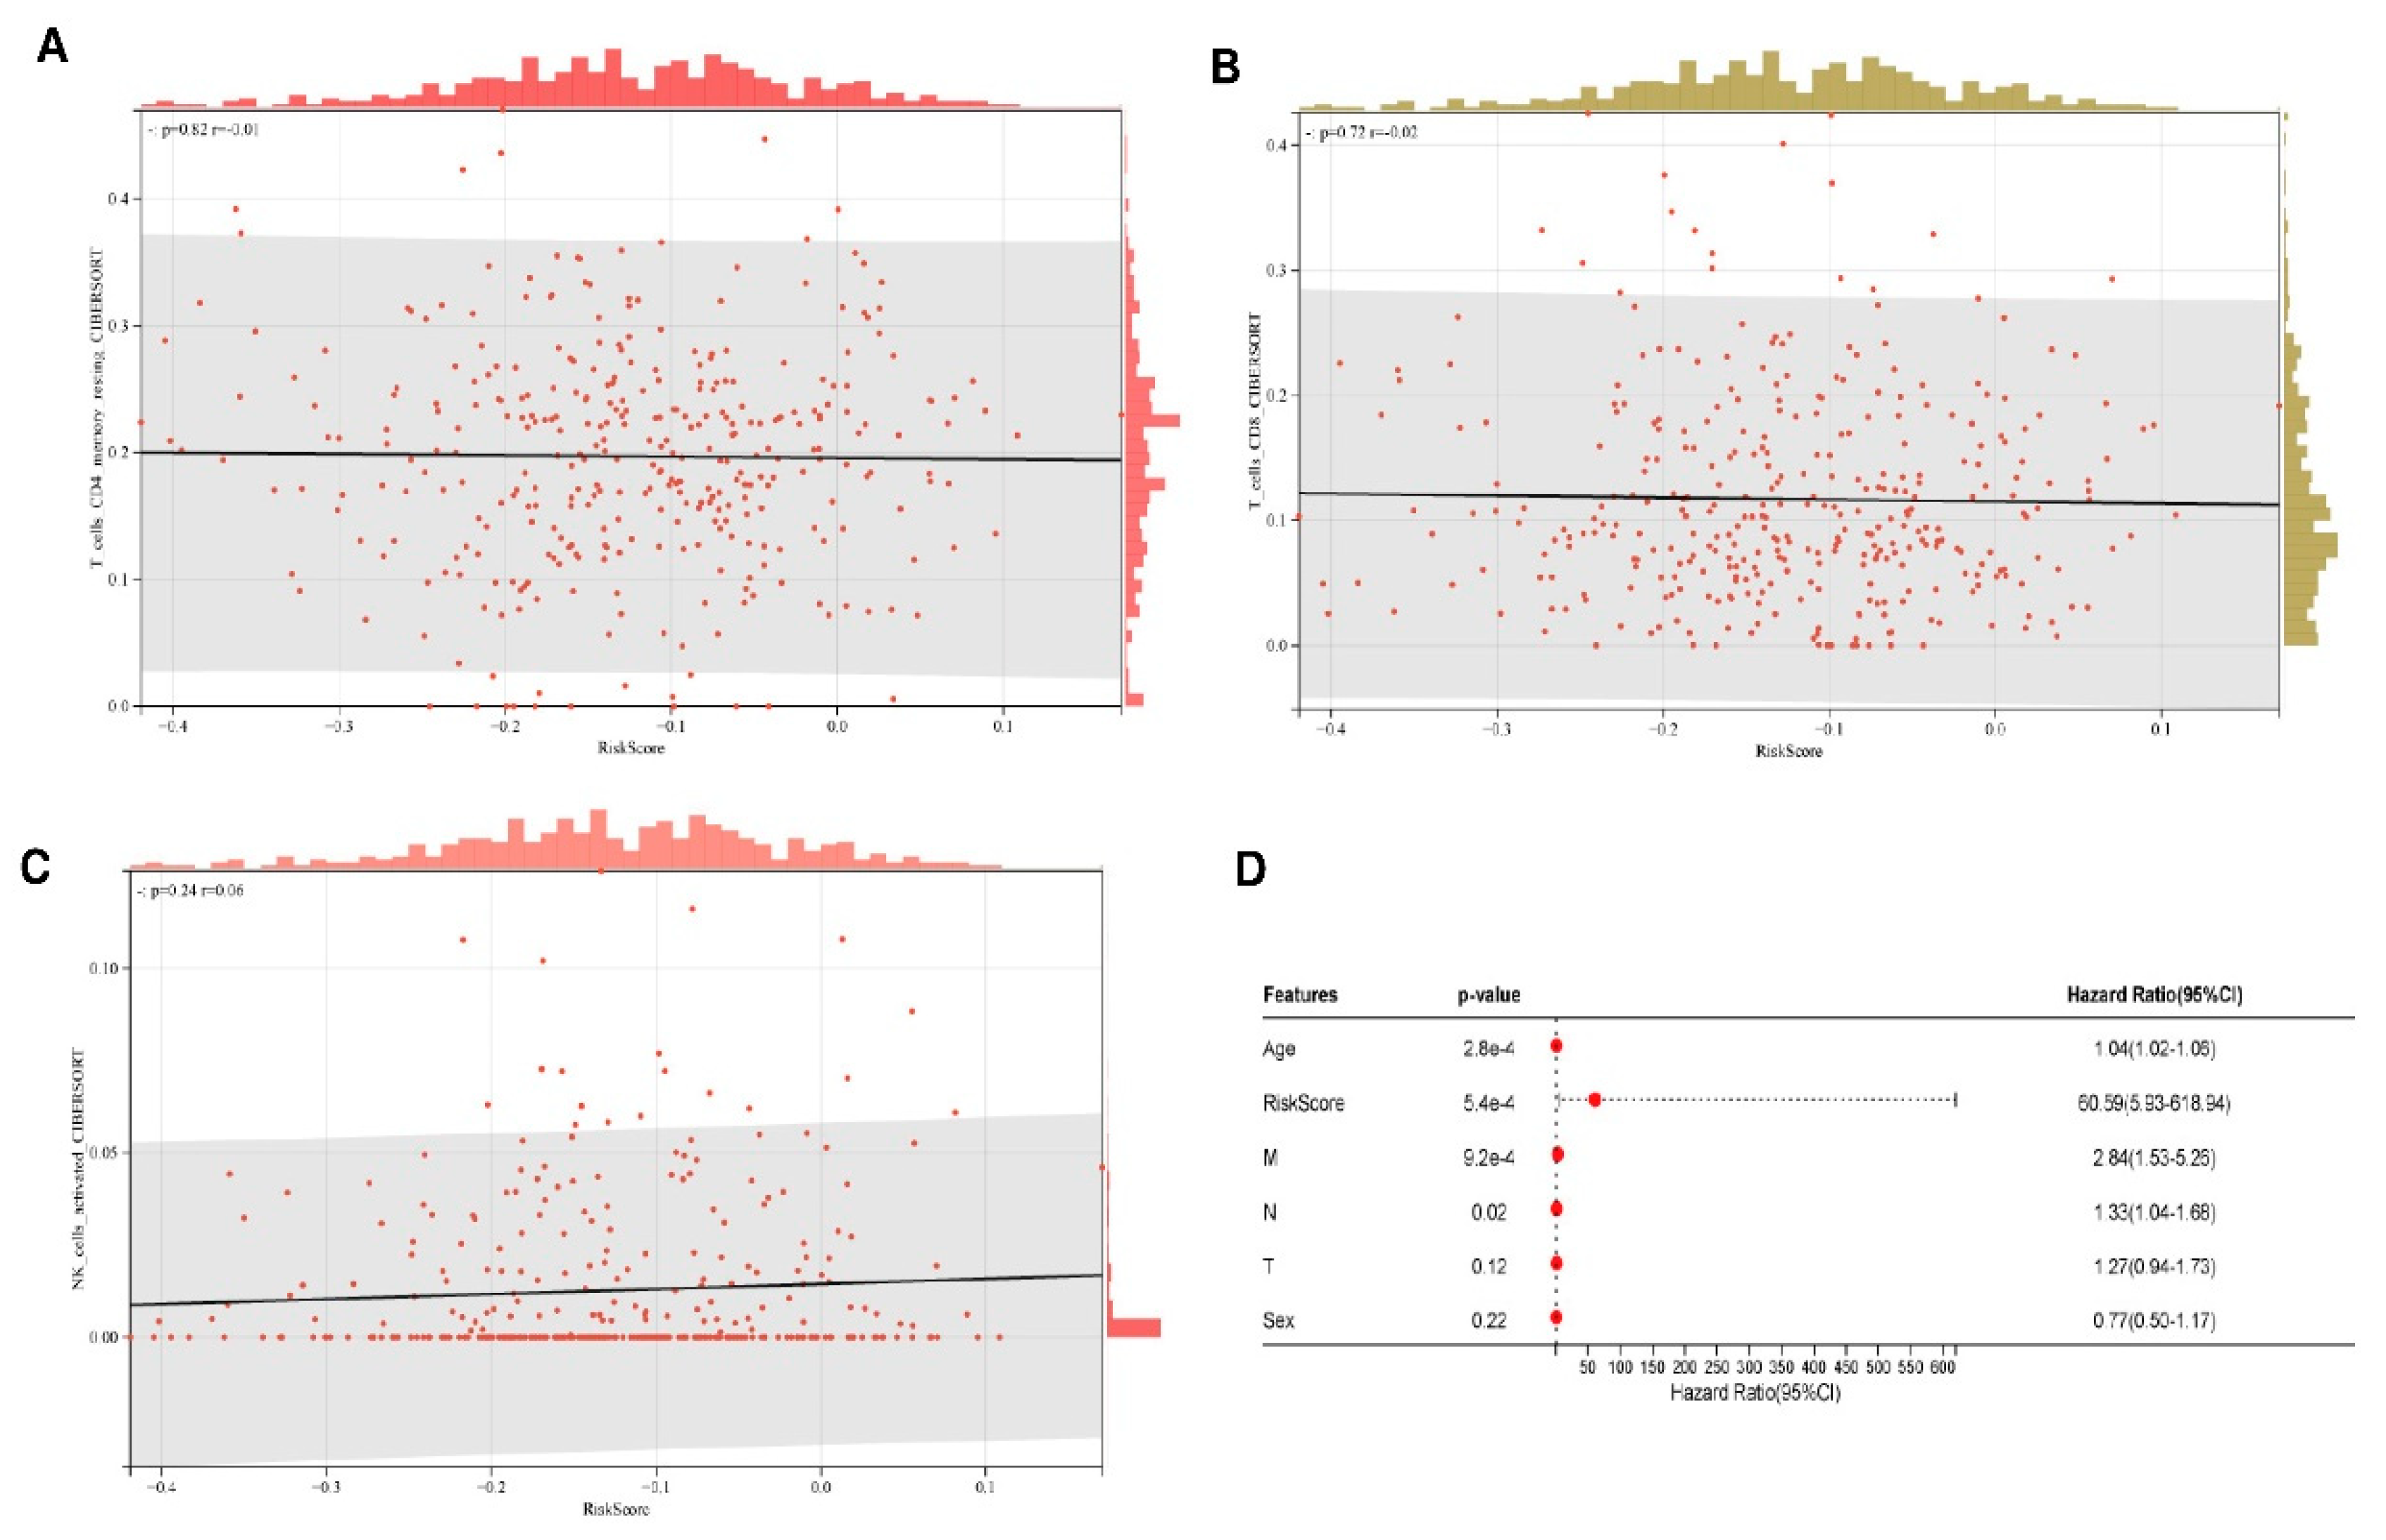
As illustrated in Figure 6A-C, while the RiskScore demonstrated strong prognostic efficacy (HR = 60.59), there were no statistically significant associations with adaptive immune cell infiltration levels. Multivariate Cox regression confirmed the RiskScore as an independent prognostic determinant (HR = 60.59, 95% CI: 5.93-618.94, p = 5.4×10⁻⁴), demonstrating effect magnitudes substantially exceeding conventional clinical parameters (M-stage: HR = 2.84). Notably, established prognostic variables including age (HR = 1.04/year, 95% CI: 1.02-1.06, p = 2.8×10⁻⁴) and N-stage (HR = 1.33, 95% CI: 1.05-1.60, p = 0.02) retained predictive significance (Figure 6D). According to multivariate analysis, the IRDS risk score can independently predict outcomes for patients with STAD. (Figure 6D).
4. Discussion
Type 1 IFNs produced by irradiated tumor cells and tumor-infiltrating leukocytes can enhance dendritic cell cross-priming of CD8+ T-cells (cytolytic T cells) and concomitant T-cell-mediated killing. IFN-I may act on irradiated cancer cells directly, priming them for immunogenic and necroptotic cell death[9,10]. Majority of the IRDS genes can be found as the subset of ISGs[11,12], and these genes are largely regulated by both Type I and Type II IFNs or by all three IFN types. The combination of immunogenic therapeutic and novel immunotherapeutic regimens holds great promising for treating malignancies[13,14,15,16]. Hence, recognizing IRDS-related biomarkers that differentiate patients by the benefits they experience from immunotherapy could be advantageous. Our findings reveal that the expression of genes associated with IRDS is significantly connected to the prognosis of STAD. Using consensus clustering, we identified two IRDS subgroups based on gene expression. Favorable clinical outcomes are linked to the low IRDS subtype. Additionally, we constructed and validated a prognostic risk signature with four IRDS-related genes, which divided STAD patients into high- and low-risk groups. Additionally, this risk signature proved to have a high predictive value for overall survival and might operate as an independent prognostic indicator for STAD patients. The IRDS-related genes we analyzed were previously outlined by Padariya et al.[17].
IRDS is induced by interferon (IFN) signaling. Interferons can enhance antigen presentation, activate T cells and natural killer (NK) cells, promote antitumor immunity, and induce immune suppression. IRDS helps tumor cells resist DNA damage (such as that caused by radiotherapy and chemotherapy), reduces the release of tumor antigens, and diminishes the synergistic effects of immunotherapy. Moreover, some IRDS-related genes (such as STAT1) may upregulate the expression of PD-L1 in tumor cells via interferon signaling, making patients more responsive to PD-1/PD-L1 inhibitors. In summary, our study emphasized the association between IRDS subtypes and changes in the immunological tumor microenvironment in STAD. These observations may help inform intervention measures based on immunotherapy for patients with STAD. We also constructed and validated an IRDS-related prognostic signature that has significant value in predicting the overall survival time of patients with STAD.
In the future, IRDS genes will significantly affect the efficacy of immunotherapy by regulating the DNA damage response, immune checkpoint molecules, and tumor microenvironment. Future research directions may include the development of combination therapies targeting the IRDS pathway as well as the use of IRDS as a biomarker to optimize patient stratification.
5. Conclusions
Our study highlights the association between IRDS subtypes and modifications in the immunological tumor microenvironment in STAD. These findings may potentially facilitate stratification and corresponding therapeutic interventions for STAD patients based on immunotherapy in the future. We also constructed and validated an IRDS-related prognostic signature that demonstrated good predictive value in estimating the overall survival for STAD patients with STAD.
Author Contributions
Conceptualization,Haixiu Ma. and Xingtian Wang, Methodology, Ping Jiang. and Xingtian Wang.; validation,Haixiu Ma; formal analysis, Xingtian Wang.; investigation,Ping Jiang; writing-original draft preparation, Haixiu Ma.; writing-review and editing, Zhanhai Su and Xingtain Wang; funding Acquisition: Zhanhai Su. All the authors have read and agreed to the published version of the manuscript.
Funding
This research had been supported by Natural Science Foundation of Qinghai Province of China (2023-ZJ-932M), and by National Natural Science Foundation of China (32360242)
Data Availability Statement
The datasets used and/or analyzed during the current study are Available from the corresponding author upon request.
Conflicts of Interest
The authors declare no conflict of interest.
References
- Weichselbaum, R.R.; Ishwaran, H.; Yoon, T.; Nuyten, D.S.A.; Baker, S.W.; Khodarev, N.; Su, A.W.; Shaikh, A.Y.; Roach, P.; Kreike, B.; et al. An interferon-related gene signature for DNA damage resistance is a predictive marker for chemotherapy and radiation for breast cancer. Proc Natl Acad Sci U S A 2008, 105, 18490–18495. [Google Scholar] [CrossRef] [PubMed]
- Guo, S.; Shang, M.-Y.; Dong, Z.; Zhang, J.; Wang, Y.; Zheng, Z.-C.; Zhao, Y. Clinicopathological features and prognostic analysis of signet ring cell gastric carcinoma: a population-based study. Transl Cancer Res 2019, 8, 1918–1930. [Google Scholar] [CrossRef] [PubMed]
- Janjigian, Y.Y.; Ajani, J.A.; Moehler, M.; Shen, L.; Garrido, M.; Gallardo, C.; Wyrwicz, L.; Yamaguchi, K.; Cleary, J.M.; Elimova, E.; et al. First-Line Nivolumab Plus Chemotherapy for Advanced Gastric, Gastroesophageal Junction, and Esophageal Adenocarcinoma: 3-Year Follow-Up of the Phase III CheckMate 649 Trial. J Clin Oncol 2024, 42, 2012–2020. [Google Scholar] [CrossRef] [PubMed]
- Sun, L.; Zhang, Y.; Yang, B.; Sun, S.; Zhang, P.; Luo, Z.; Feng, T.; Cui, Z.; Zhu, T.; Li, Y.; et al. Lactylation of METTL16 promotes cuproptosis via m6A-modification on FDX1 mRNA in gastric cancer. Nat Commun 2023, 14, 6523. [Google Scholar] [CrossRef] [PubMed]
- Li, B.; Ruotti, V.; Stewart, R.M.; Thomson, J.A.; Dewey, C.N. RNA-Seq gene expression estimation with read mapping uncertainty. Bioinformatics 2010, 26, 493–500. [Google Scholar] [CrossRef] [PubMed]
- Wilkerson, M.D.; Hayes, D.N. ConsensusClusterPlus: a class discovery tool with confidence assessments and item tracking. Bioinformatics 2010, 26, 1572–1573. [Google Scholar] [CrossRef] [PubMed]
- Subramanian, A.; Tamayo, P.; Mootha, V.K.; Mukherjee, S.; Ebert, B.L.; Gillette, M.A.; Paulovich, A.; Pomeroy, S.L.; Golub, T.R.; Lander, E.S.; et al. Gene set enrichment analysis: A knowledge-based approach for interpreting genome-wide expression profiles. Proc Natl Acad Sci U S A 2005, 102, 15545–15550. [Google Scholar] [CrossRef] [PubMed]
- Liberzon, A.; Subramanian, A.; Pinchback, R.; Thorvaldsdóttir, H.; Tamayo, P.; Mesirov, J.P. Molecular signatures database (MSigDB) 3.0. Bioinformatics 2011, 27, 1739–1740. [Google Scholar] [CrossRef] [PubMed]
- Snyder, A.G.; Hubbard, N.W.; Messmer, M.N.; Kofman, S.B.; Hagan, C.E.; Orozco, S.L.; Chiang, K.; Daniels, B.P.; Baker, D.; Oberst, A. Intratumoral activation of the necroptotic pathway components RIPK1 and RIPK3 potentiates anti-tumor immunity. Sci Immunol 2019, 4, eaaw2004. [Google Scholar] [CrossRef] [PubMed]
- Sarhan, J.; Liu, B.C.; Muendlein, H.I.; Weindel, C.G.; Smirnova, I.; Tang, A.Y.; Ilyukha, V.; Sorokin, M.; Buzdin, A.; Fitzgerald, K.A.; et al. Constitutive interferon signaling maintains critical threshold of MLKL expression to license necroptosis. Cell Death Differ 2019, 26, 332–347. [Google Scholar] [CrossRef] [PubMed]
- Stark, G.R.; Darnell, J.E. The JAK-STAT Pathway at Twenty. Immunity 2012, 36, 503–514. [Google Scholar] [CrossRef] [PubMed]
- Rusinova, I.; Forster, S.; Yu, S.; Kannan, A.; Masse, M.; Cumming, H.; Chapman, R.; Hertzog, P.J. INTERFEROME v2.0: an updated database of annotated interferon-regulated genes. Nucleic Acids Res 2013, 41, D1040–D1046. [Google Scholar] [CrossRef] [PubMed]
- Yang, W.; Zhang, F.; Deng, H.; Lin, L.; Wang, S.; Kang, F.; Yu, G.; Lau, J.; Tian, R.; Zhang, M.; et al. Smart Nanovesicle-Mediated Immunogenic Cell Death through Tumor Microenvironment Modulation for Effective Photodynamic Immunotherapy. ACS Nano 2020, 14, 620–631. [Google Scholar] [CrossRef] [PubMed]
- Li, Y.; Zhang, H.; Li, Q.; Zou, P.; Huang, X.; Wu, C.; Tan, L. CDK12/13 inhibition induces immunogenic cell death and enhances anti-PD-1 anticancer activity in breast cancer. Cancer Letters 2020, 495, 12–21. [Google Scholar] [CrossRef] [PubMed]
- Duan, X.; Chan, C.; Lin, W. Nanoparticle-Mediated Immunogenic Cell Death Enables and Potentiates Cancer Immunotherapy. Angew Chem Int Ed Engl 2019, 58, 670–680. [Google Scholar] [CrossRef] [PubMed]
- Kroemer, G.; Galluzzi, L.; Kepp, O.; Zitvogel, L. Immunogenic Cell Death in Cancer Therapy. Annu. Rev. Immunol. 2013, 31, 51–72. [Google Scholar] [CrossRef] [PubMed]
- Padariya, M.; Sznarkowska, A.; Kote, S.; Gómez-Herranz, M.; Mikac, S.; Pilch, M.; Alfaro, J.; Fahraeus, R.; Hupp, T.; Kalathiya, U. Functional Interfaces, Biological Pathways, and Regulations of Interferon-Related DNA Damage Resistance Signature (IRDS) Genes. Biomolecules 2021, 11, 622. [Google Scholar] [CrossRef] [PubMed]
Figure 1.
Cluster analysis identified two subtypes of IRDS-related genes. A.The protein–protein interaction network centered on IRF7, OAS1, and OASL, highlighting core nodes (e.g., STAT1 and EIF2AK2) in antiviral signaling. B/C/E. Hierarchical clustering heatmaps (B: sample-type correlation; C: multi-omics co-patterns; E: gene expression stratification) with color gradients indicating expression levels (red: upregulated; blue: downregulated). D. Fluorescence microscopy of GES-1, HGC-27, and AGS cell lines showing ISG15 subcellular localization with DAPI nuclear counterstain (blue), merged channels, and validation of differential expression. F. Kaplan-Meier survival curve assessing the clinical relevance of OAS1-associated pathways. G. Time-resolved expression kinetics of interferon-stimulated genes (ISG15 and MX1) under experimental perturbations, with color-coded phases delineating critical regulatory windows.
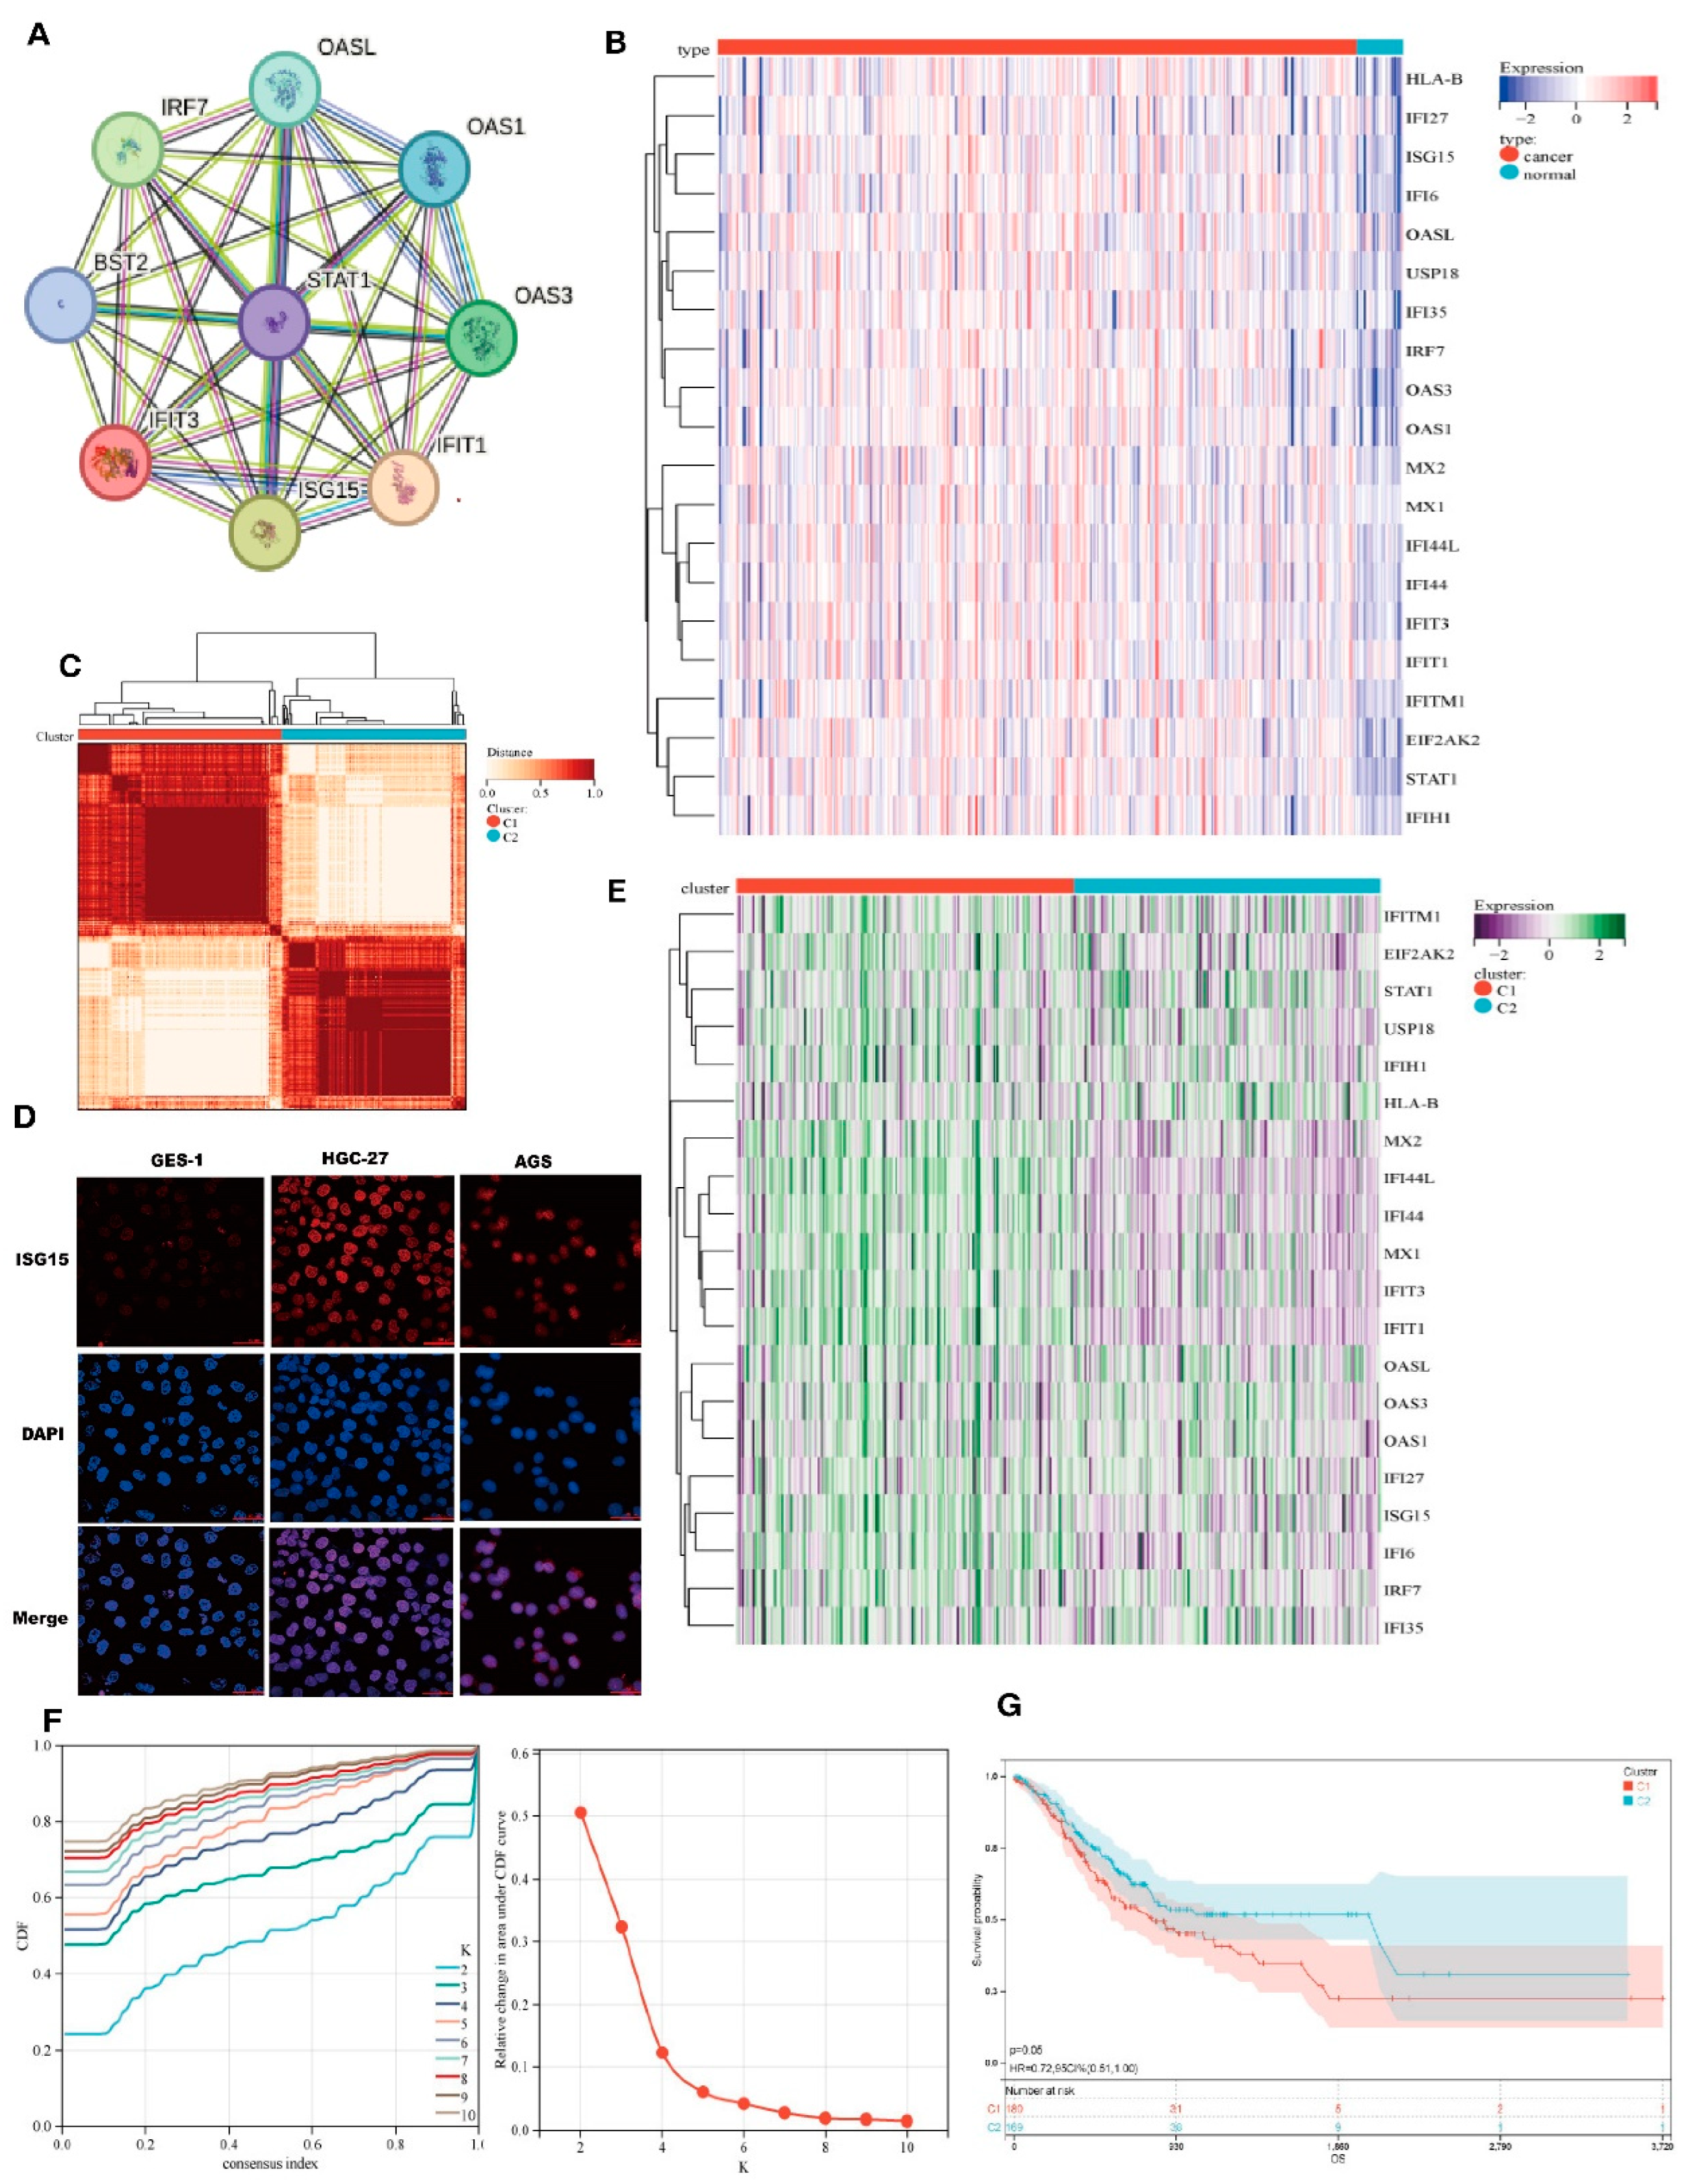
Figure 2.
Identification of Differentially Expressed Genes (DEGs) and Signal Pathways in Different IRDS Subtypes. (A) Volcano plot of differentially expressed genes (DEGs). Red triangles denote upregulated genes (log2 fold-change > 1, adjusted p < 0.01), green triangles indicate downregulated genes (log2 fold-change < -1, adjusted p < 0.01), and black circles represent non-significant genes. Dashed lines demarcate significance thresholds (|log2FC| ≥ 1; Benjamini-Hochberg corrected p < 0.01).(B) Hierarchical clustering heatmap. Rows represent genes (z-score normalized expression) and columns correspond to C1 (left) and C2 (right) samples. Color gradient from blue (low expression) to red (high expression).(C) KEGG pathway enrichment analysis. Y-axis: Significantly enriched pathways (Fisher's exact test, FDR < 0.05). X-axis: GeneRatio (enriched genes/total genes, 0.05-0.15). Point color reflects significance (-log10[p], blue:5→red:15); size corresponds to gene count (10-50).(D) GO biological process analysis. X-axis: GeneRatio (0.12-0.28). Color intensity indicates enrichment significance (-log10[p] = 20-24); point size reflects gene count (100-160).(E) GSEA profile of the hallmark pathways. Top: Enrichment plot showing a negative enrichment score (ES = -0.62) with leading edge genes ranked left. Bottom: Bar plot displays normalized enrichment scores (NES) with 95% confidence intervals (CI). The dashed line indicates the nominal threshold of p = 0.05.
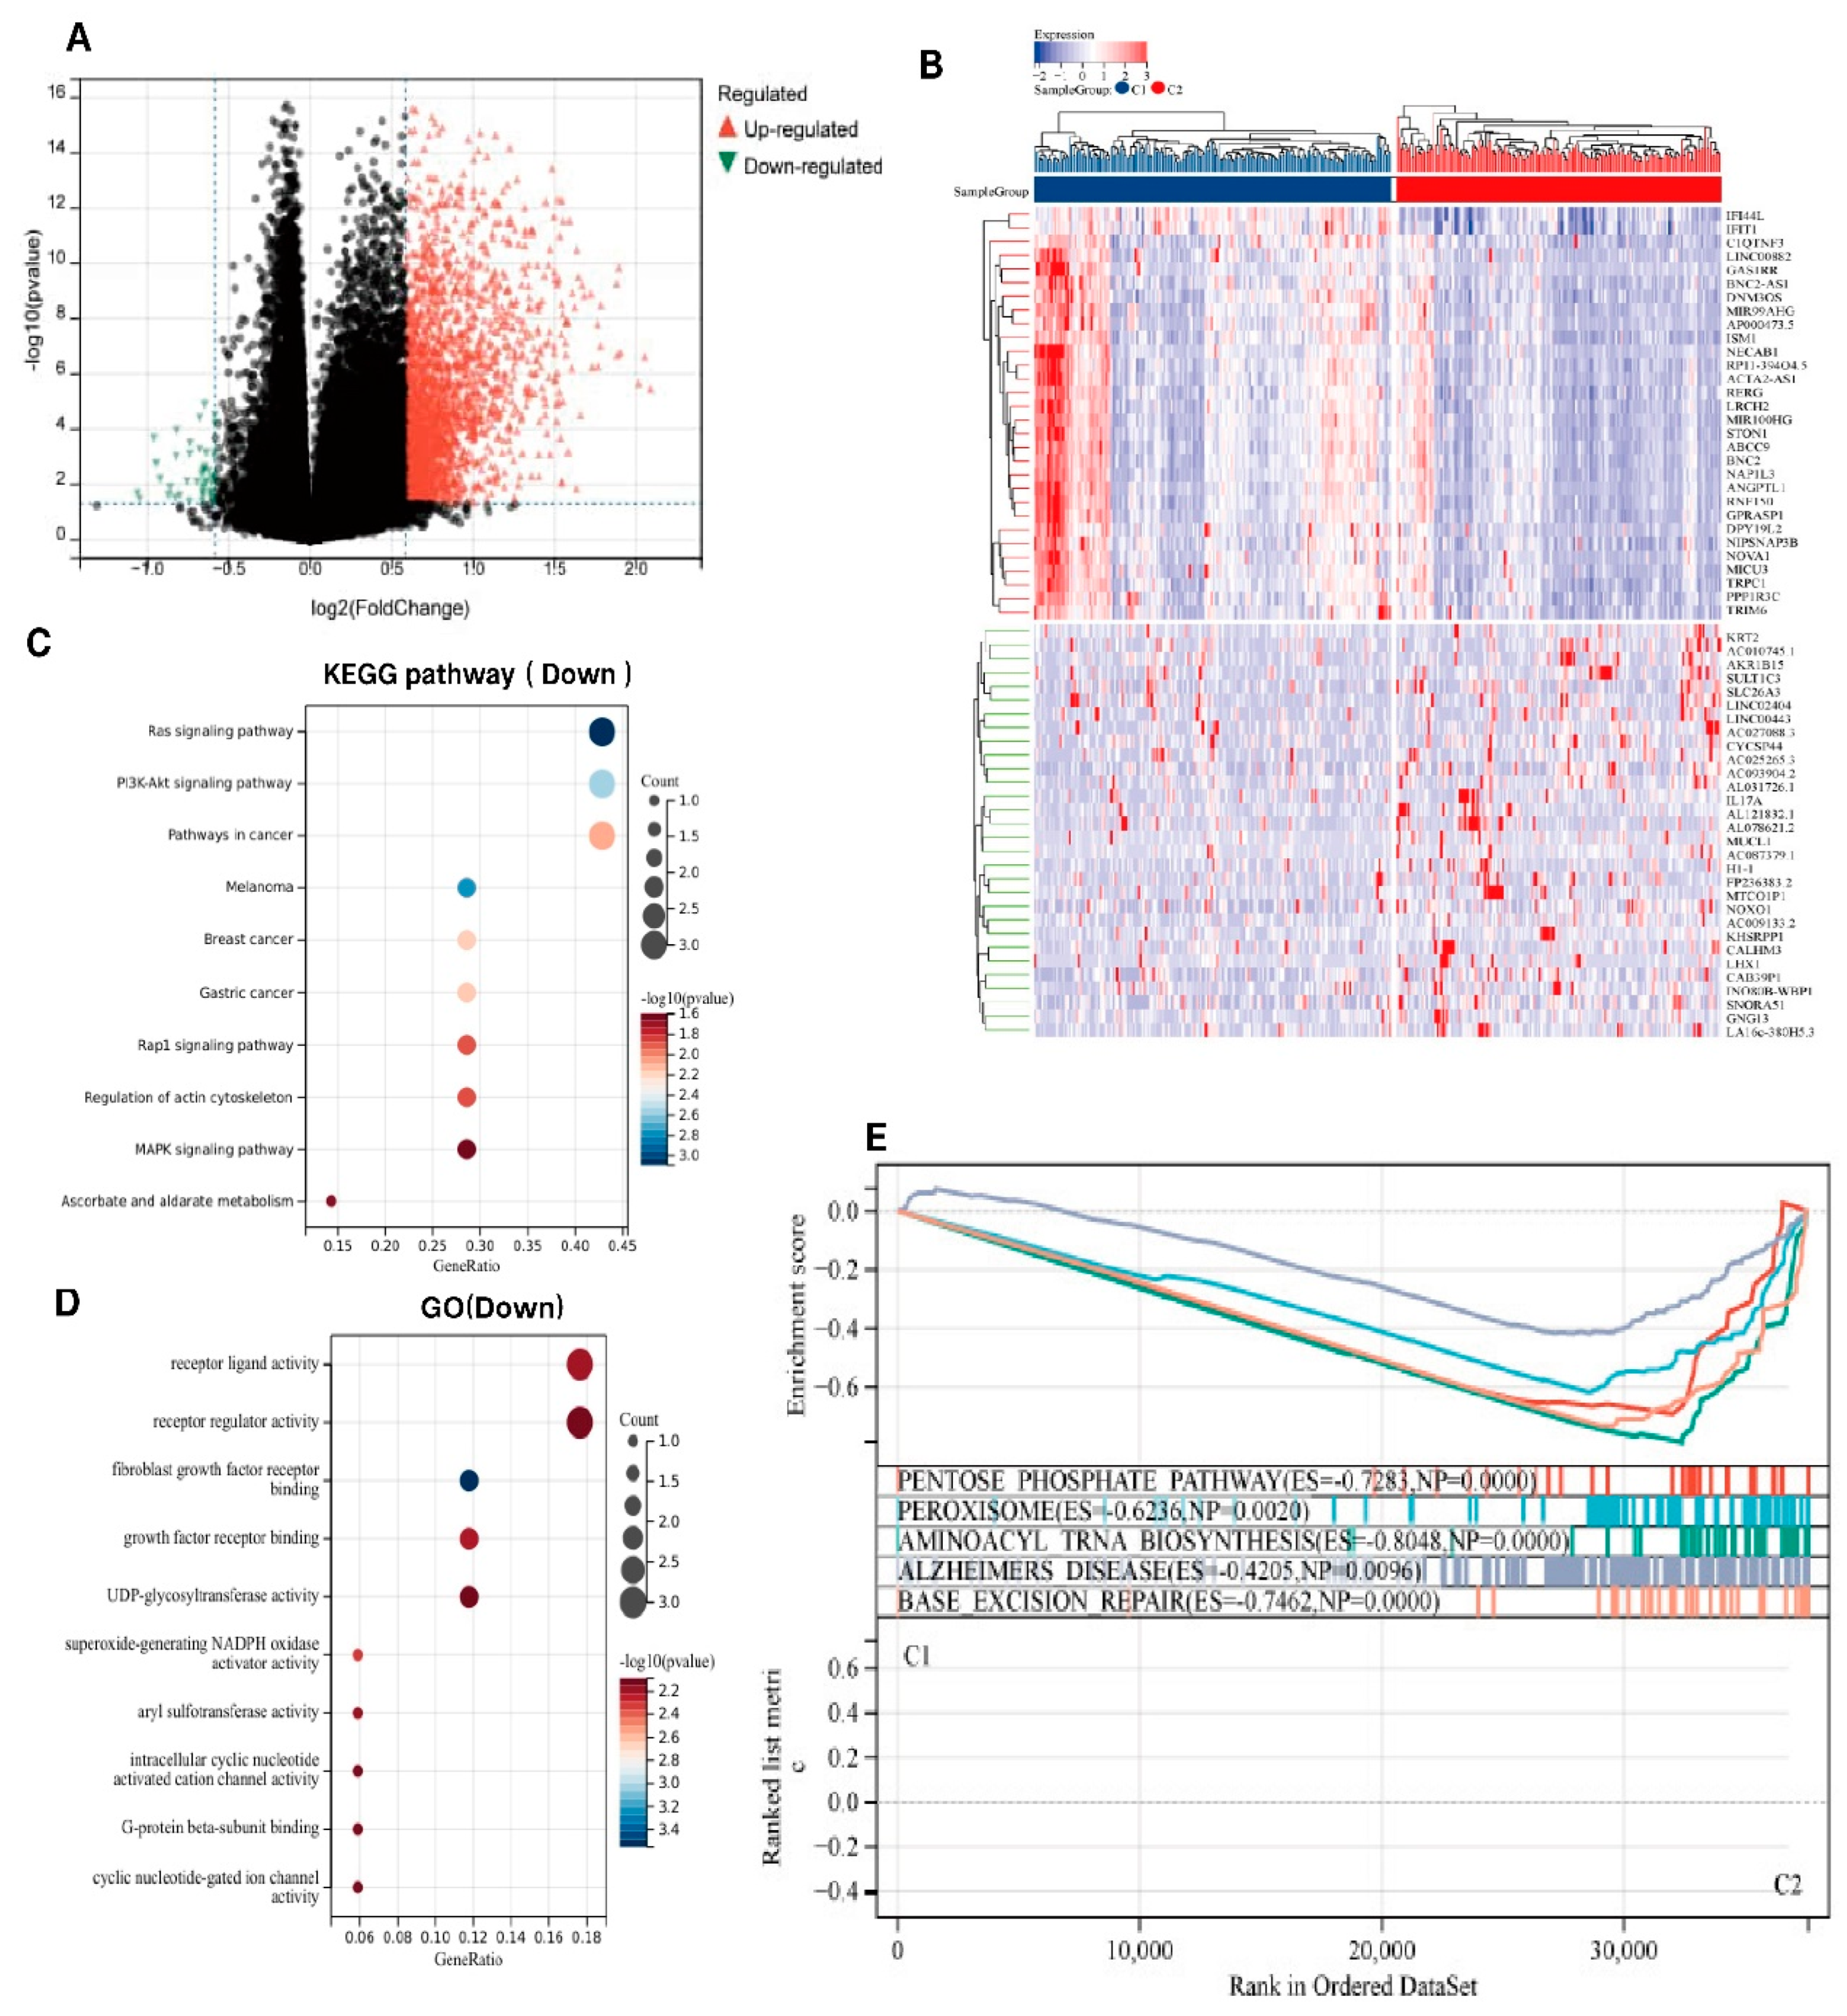
Figure 3.
Somatic Mutations in IRDS-High and IRDS-Low Subtypes. The x-axis represents gene names, the y-axis represents mutation counts, and the color indicates mutation types. On the right side, there are also the proportions of mutation types and the proportions of the two clusters, C1 and C2.
Figure 3.
Somatic Mutations in IRDS-High and IRDS-Low Subtypes. The x-axis represents gene names, the y-axis represents mutation counts, and the color indicates mutation types. On the right side, there are also the proportions of mutation types and the proportions of the two clusters, C1 and C2.
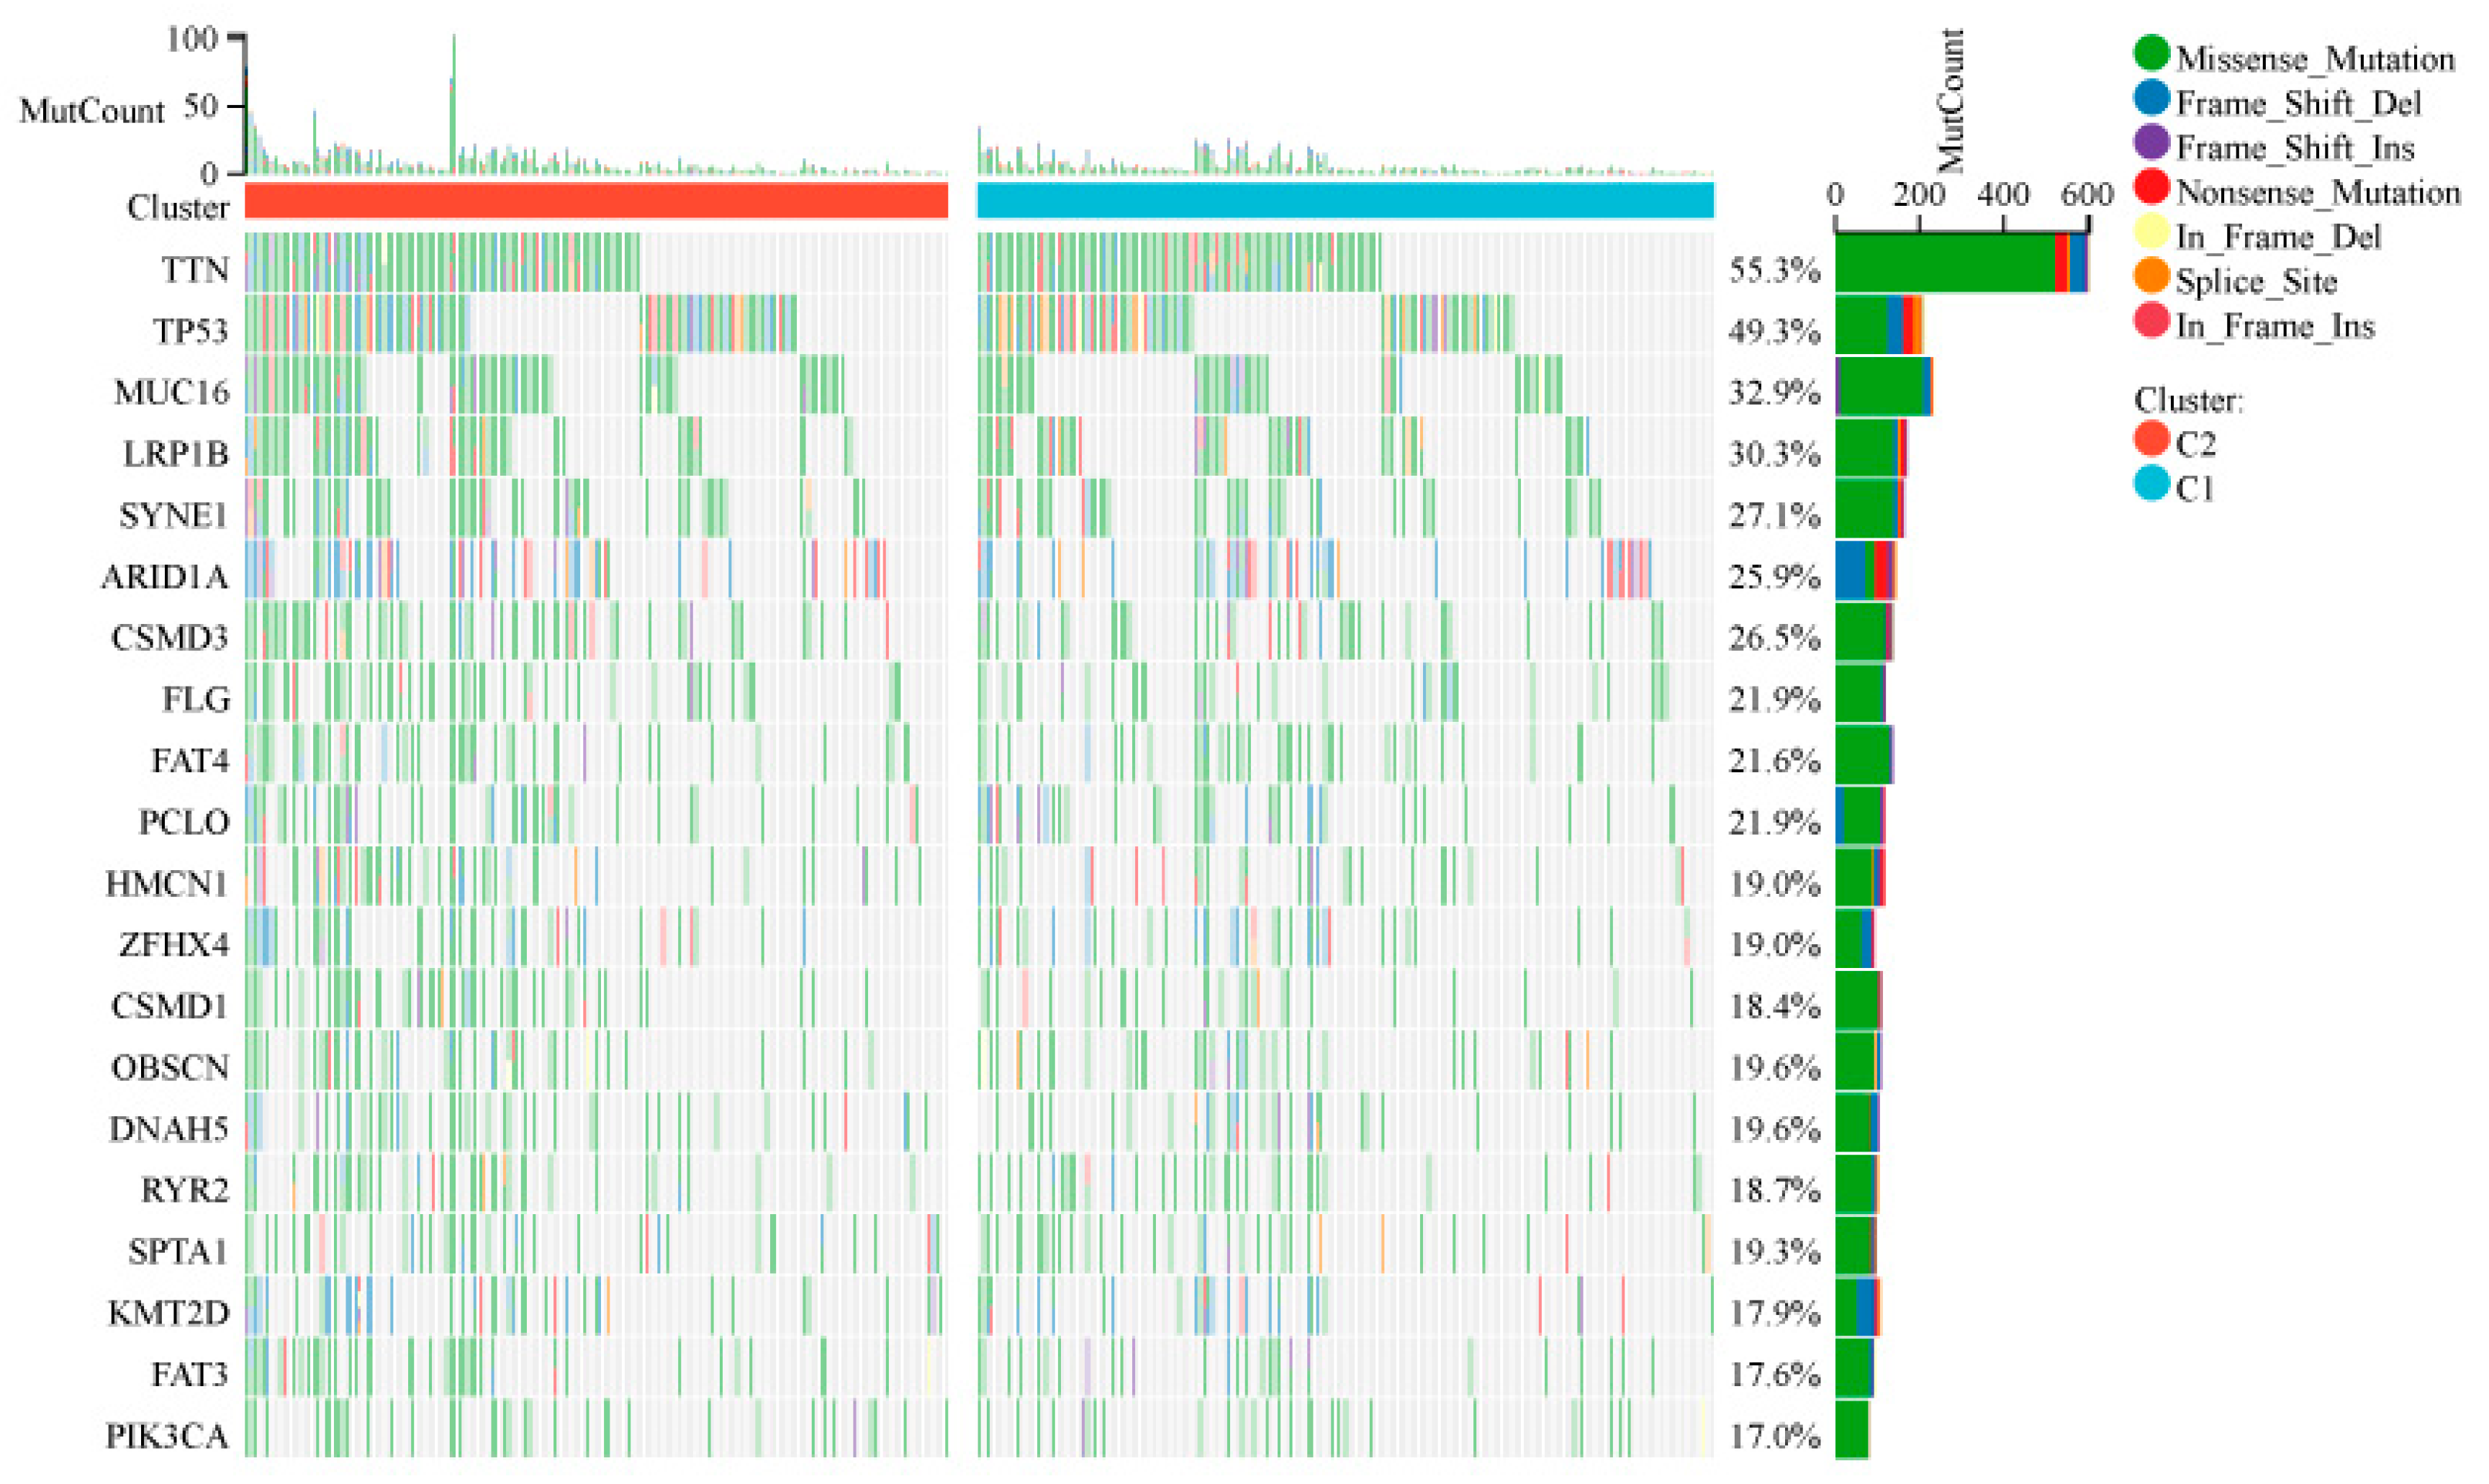
Figure 4.
Tumor Microenvironment Landscape in IRDS-High and IRDS-Low Subtypes. A is a violin plot showing the data of StromalScore, ImmuneScore, ESTIMATEScore, and neutrophils, divided into two groups, C1 and C2. B is a heat map showing the distribution of different immune cells in the two groups. C shows a box plot comparing the expression levels of various immune cells. D is a violin plot showing differences in the expression of immune checkpoint genes, such as CD274 (PD-L1) and CTLA4.
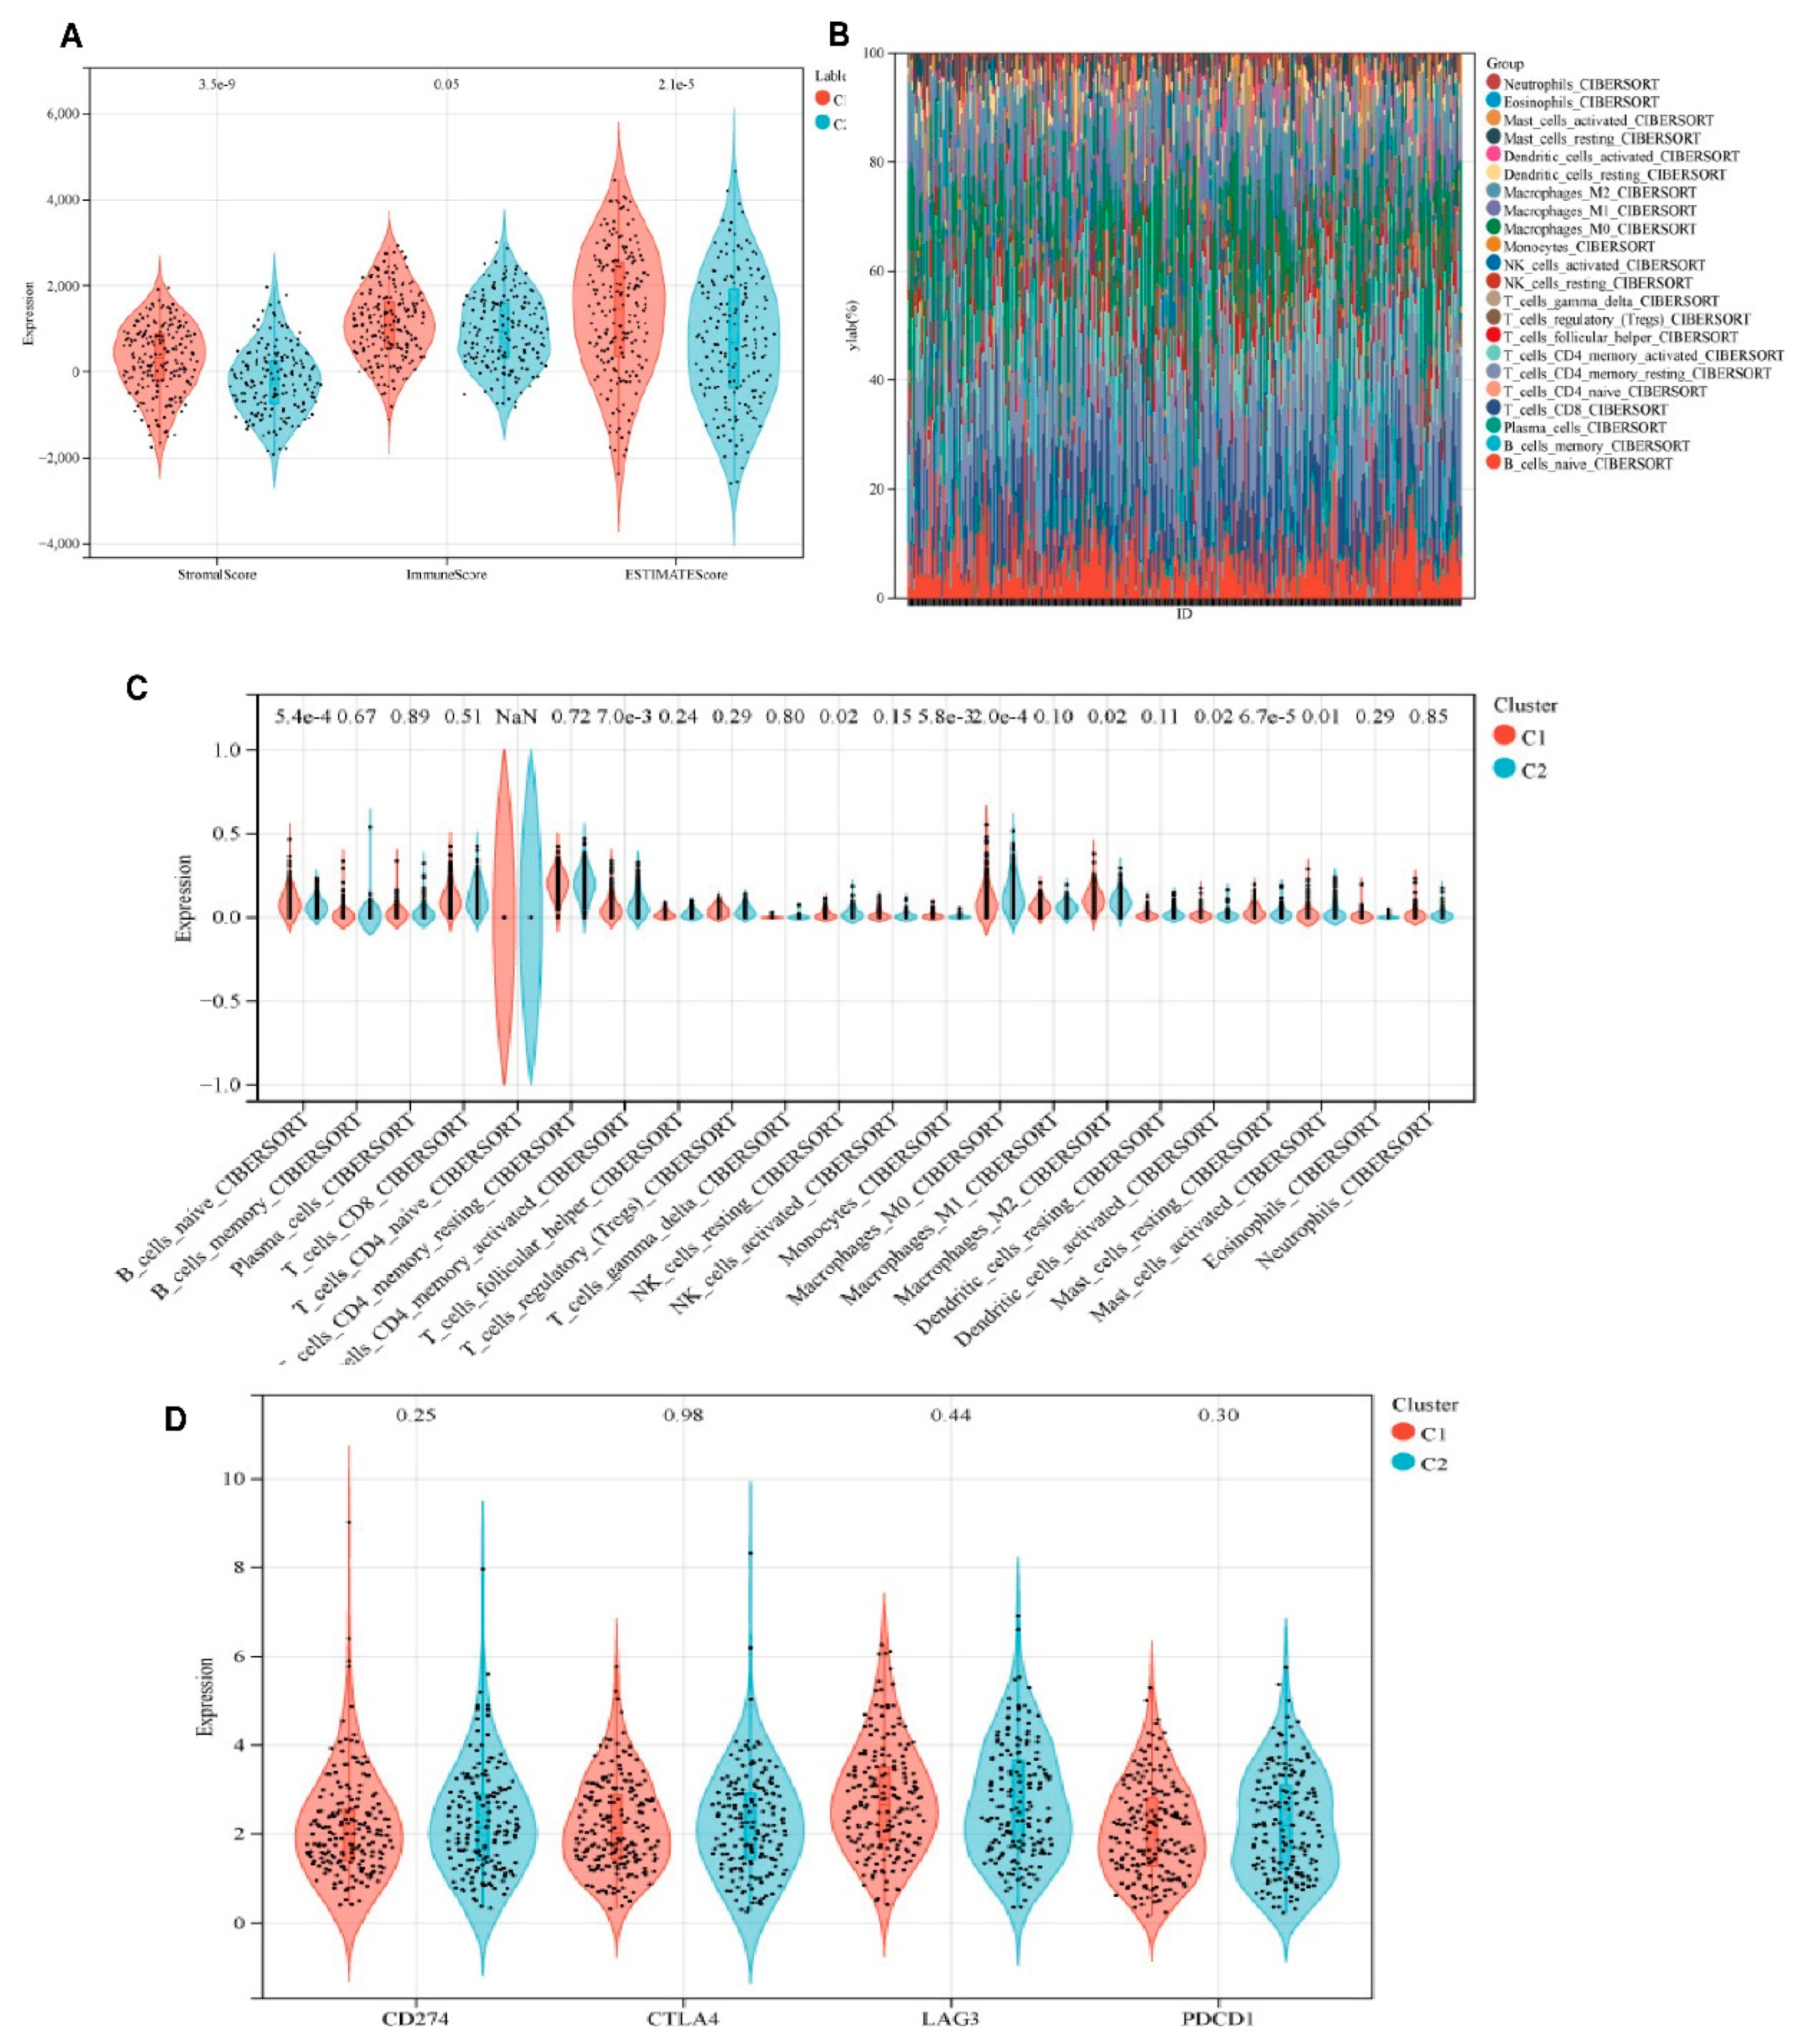
Figure 5.
Prognostic modeling and validation in the discovery cohort. (A) Multivariate Cox regression analysis of interferon response genes. Forest plots display hazard ratios (HR) with 95% confidence intervals for IFIT1 (HR = 0.62, 95% CI 0.47-0.82, p = 0.001), OAS3 (HR = 1.83, 95% CI 1.24-2.70, p = 0.002), MX2 (HR = 0.75, 95% CI 0.61-0.93, p = 0.008), and OAS1 (HR = 1.51, 95% CI 1.09-2.10, p = 0.013); (B) LASSO Cox regression coefficient shrinkage. Left: Trajectory of partial likelihood deviance versus log2(λ) (red line), with the vertical dashed line indicating optimal λ selection (λ = 0.032) through 10-fold cross-validation. Right: Coefficient profiles showing the feature selection process (C) Dynamic risk assessment model. Upper: Time-dependent RiskScore trajectories stratified by risk group (low-risk: blue, high-risk: red). Middle: Risk score distribution (points) with mortality status annotation (filled: deceased). Lower: Heatmap of 8-gene prognostic signature expression (z-score normalized); (D) Kaplan-Meier survival analysis. Significant divergence in overall survival between risk groups (log-rank p = 3.2×10⁻⁵), with 5-year survival rates of 68% (low-risk) versus 29% (high-risk) (HR = 3.1, 95% CI 2.0-4.8).( (E) Localization of IFIT1 in GES-1, HGC-27, and AGS cells.
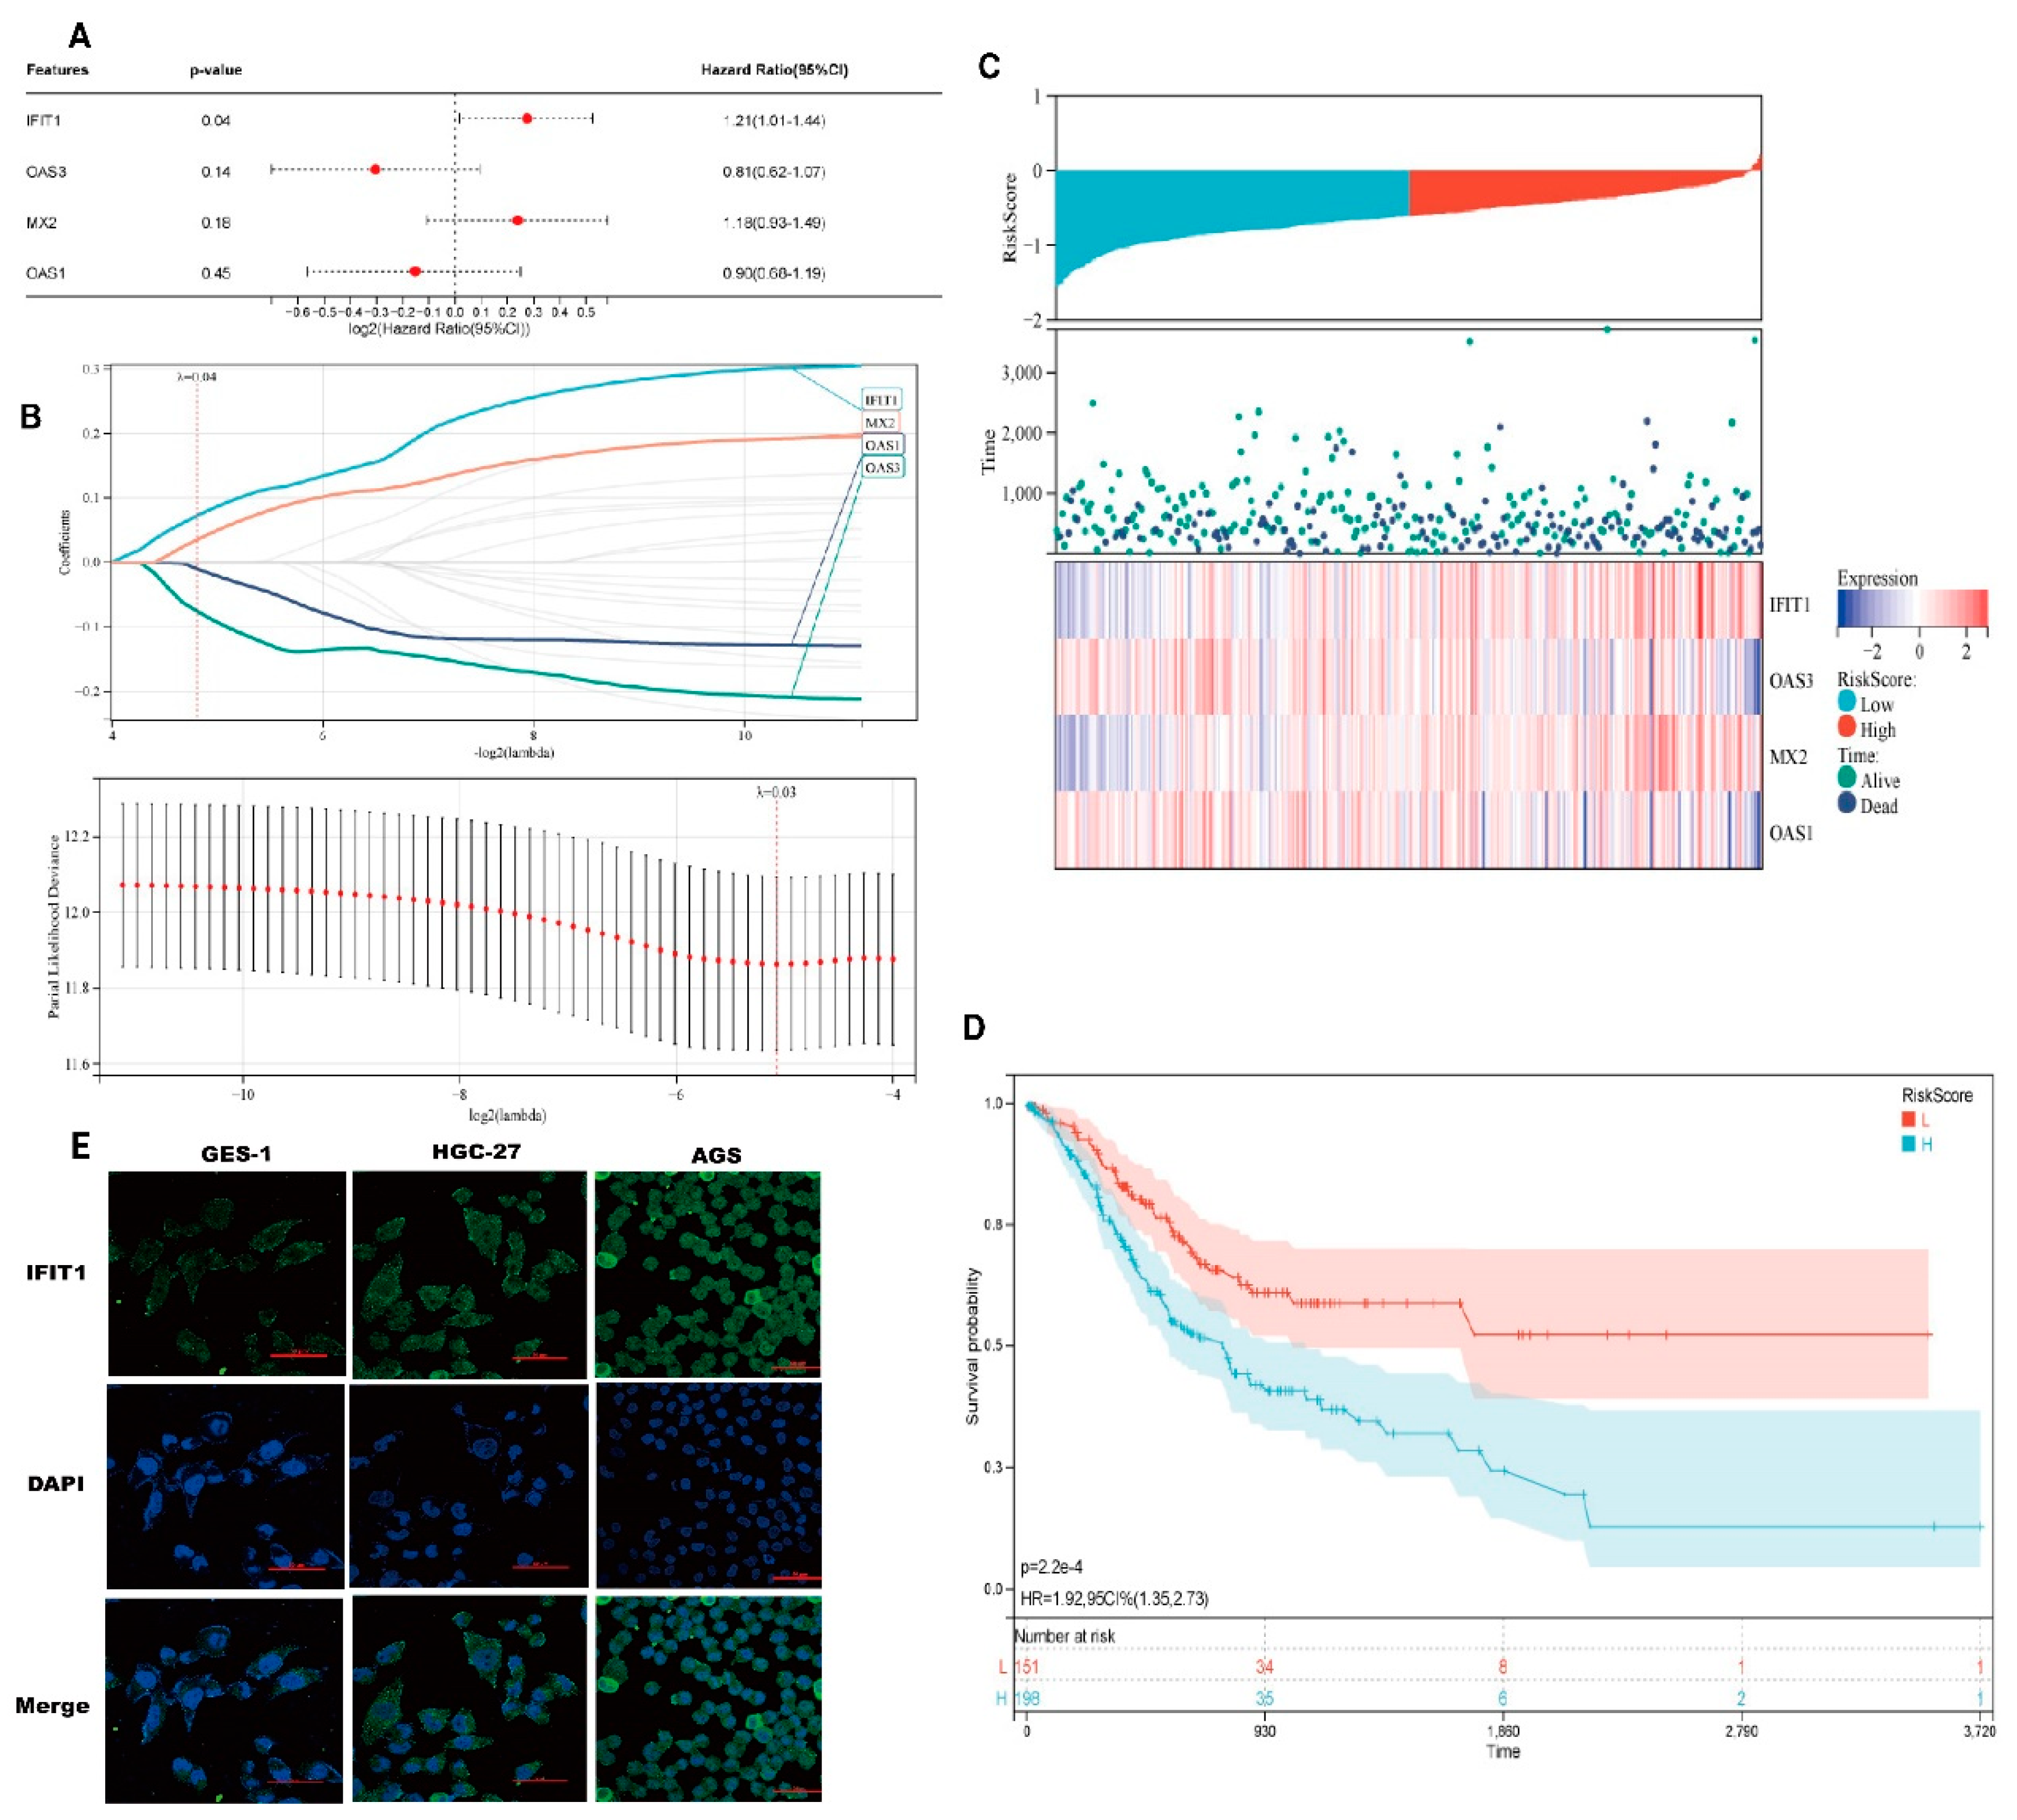
Figure 6.
Differential feature analysis across experimental conditions. (A-C) Multidimensional volcano plot variations demonstrating the differential expression profiles. X-axis: log2 fold-change (rank metric based on effect size magnitude); Y-axis: log10-transformed raw p-values. The dashed horizontal line indicates the significance threshold (nominal P = 0.05). Red points represent features meeting dual thresholds (|log2FC| > 1 with Benjamini-Hochberg adjusted p < 0.05). (D) Statistical summary of core discriminatory features.
Disclaimer/Publisher’s Note: The statements, opinions and data contained in all publications are solely those of the individual author(s) and contributor(s) and not of MDPI and/or the editor(s). MDPI and/or the editor(s) disclaim responsibility for any injury to people or property resulting from any ideas, methods, instructions or products referred to in the content. |
© 2025 by the authors. Licensee MDPI, Basel, Switzerland. This article is an open access article distributed under the terms and conditions of the Creative Commons Attribution (CC BY) license (http://creativecommons.org/licenses/by/4.0/).
Copyright: This open access article is published under a Creative Commons CC BY 4.0 license, which permit the free download, distribution, and reuse, provided that the author and preprint are cited in any reuse.


