
Submitted:
02 July 2024
Posted:
03 July 2024
You are already at the latest version
Abstract
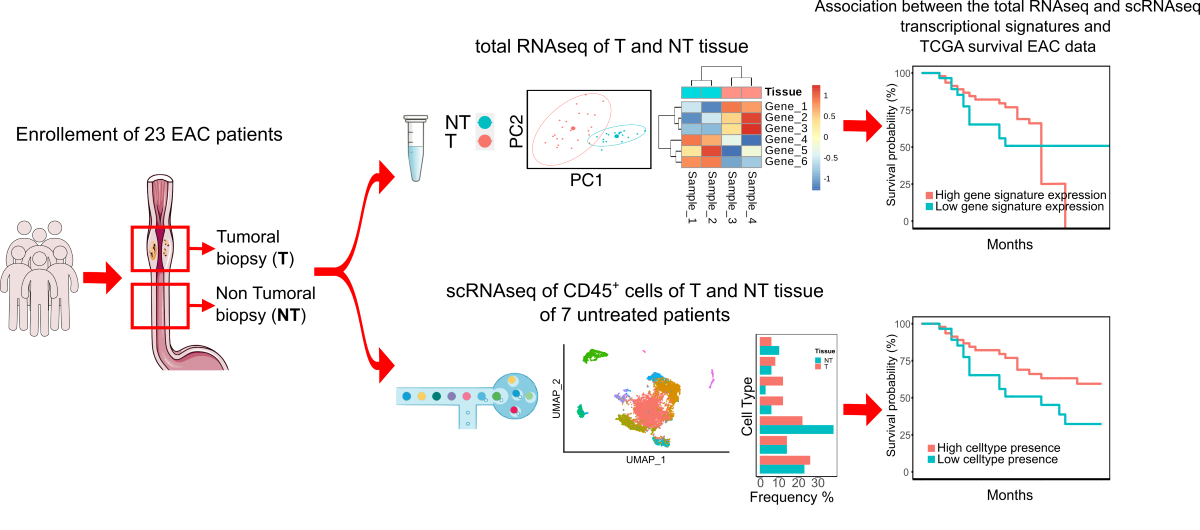
Esophageal cancer is an extremely deadly tumor that accounts for 5% of all cancer deaths. The two main subtypes of the disease are esophageal squamous cell carcinoma (ESCC) and esophageal adenocarcinoma (EAC). To date, few studies analyse EAC for transcriptional signatures associated with diagnosis and/or prognosis, while most focus on the analysis of transcriptional profiles of ESCC. In this study, we used single-cell RNA sequencing (scRNA-seq) analysis of CD45+ cells enriched from Tumors and matched Non Tumor tissues from therapy naїve patients to identify all types of immune cells present in tumor immune infiltrate and its transcriptional profile. In addi-tion, we analysed the entire transcriptome in a cohort of 23 patients whose tissue biopsies were taken from Tumors and matched with Non Tumor tissue.
The transcriptional signatures we obtained were then used to stratify a large cohort of TCGA EAC patients, demonstrating a strong association with their prognosis, as well as the ability to predict a patient's clinical outcome and better define the prognosis of EAC after surgery. In addition, these features may lead patients to effective therapies including immunotherapy approaches.
Keywords:
Esophageal-Adenocarcinoma
; Cancer
; immunotherapy
; treatment
; single-cell RNA
; single-cell sequencing
; RNA sequencing
; transcriptional signature
; response to therapy
; immune infiltrate.
1. Introduction
Esophageal adenocarcinoma (EAC) and esophageal squamous cell carcinoma (ESCC) are among the deadliest cancers in the world, and their incidence is rapidly increasing [1]. In many gastrointestinal cancers, the tumor microenvironment (TME) has been shown to be a prognostic feature and allows the establishment of an "immune core" [2]; however, this approach has not yet been adopted in the management of EAC. While previous studies have shown the important role of tumor-infiltrating lymphocytes (TILs) as a useful predictor for therapeutic response and prognosis in ESCC patients [3], clinicians are still far from effectively predicting the persistence of responses to neoadjuvant co-chemoradiation (CTRT). Improving the prediction of a patient's response to treatment, tumor progression, and/or recurrence remains a significant challenge. RNA sequencing (RNA-seq) technology has emerged as a powerful tool for the analysis of gene expression in cancer samples, providing a comprehensive view of the transcriptome landscape. By analysing the RNA expression profiles of cancer samples, RNA-seq is able to reveal novel tissue heterogeneity that can improve patients’ stratification and guide personalized treatment decisions [4]: an example could be the TME and its transcription factors, already associated with tumor development and progression, response to treatment, or antitumor response [5,6,7,8]. Until now, in situ tumor immunology has been acknowledged as highly significant for the prognosis of multiple cancers, even if most of the research in the field of esophageal cancer has focused on ESCC, and marginal attention has been paid to the EAC [8,9]. To bridge this gap, we deeply examined the immune infiltrate of three EAC Tumor tissues and their matched Non Tumor tissues obtained from three patients who underwent surgery for EAC resection. In parallel, we performed total transcriptome profiling by RNA sequencing on a large cohort of EAC patients to determine the prognosis and other factors related to the clinical course of the disease. Finally, the expression profile of immune markers and transcriptional signatures identified within our cohort were utilized to stratify a larger cohort of TCGA EAC patients. A strong association with their prognosis was demonstrated, thereby enabling the identification of immunological prognostic biomarkers linked to tumor progression, recurrence, and survival. These findings shed a light on the possibility of incorporating immunotherapy strategies, such as immune checkpoint inhibitors and cancer vaccines, into future potential treatment plans for EAC, and emphasize the potential of new cancer treatments to improve patients’ outcomes.
2. Materials and Methods
2.1. Patients’ Recruitment, Tissue Collection and Experimental Workflow
After being appropriately consented, a total of 26 patients who underwent surgery for esophageal adenocarcinoma at the Esophagogastric Surgery Unit at IRCCS Istituto Clinico Humanitas from January 2020 to December 2020 were enrolled in this study. For each patient, tumor (T) samples and their matched adjacent tissues (NT) were acquired. Single-cell analyses were performed on patients that did not have any kind of neoadjuvant chemoradiotherapy treatment preceding surgery (untreated patients) to avoid any bias introduced by the therapy; both patients treated with neoadjuvant chemoradiotherapy before surgery (treated patients) and without treatments were chosen for total RNA sequencing analyses. T and NT tissues were processed for single-cell RNA sequencing and total RNA sequencing according to specific protocols. The complete list of patients and their relative clinical data are reported in Supplementary Table 1.
2.2. Single-Cell Sequencing: Cells’ Preparation, Library Preparation and Sequencing
ScRNA-seq of the immune infiltrate in EAC was performed to unravel tissue heterogeneity, enabling a complete definition of all the immune cells subpopulations pervading the tumor site and their gene expression alterations. After surgery, Tumor and Non Tumor tissues were dissociated to obtain a single-cell suspension with the Tumor Dissociation Kit, human (Miltenyibiotec); cells were then stained with live dead eFluor780 and CD45+ antibody and sorted with FacsAria III. An average of 7000 cells were loaded into the Chromium controller System (10X Genomics) for Gel bead Emulsion generation and libraries were prepared using the Single-cell 3’ library preparation approach, according to manufacturer’s instruction (ChromiumTM Single Cell 3’ Reagent Kits v2-rev C). Libraries were sequenced on the Illumina NextSeq550 platform and an average of 40.000 reads per single cell was obtained.
2.3. Analysis of Single-cell RNA Sequencing Data
The reads obtained from the sequencing of the Tumor and Non Tumor biopsies were mapped to the reference genome GRCh38 using the CellRanger Software version 3.1.0 (10x Genomics). Raw counts were concatenated and then filtered using the Scater [10] and DropletUtils [11] packages. We used the emptyDrops function to remove all the droplets with a false discovery rate greater than 0.05, and all cells with a number of UMIs, detected genes or a percentage of mitochondrial and ribosomal genes that were outliers compared to the median absolute deviation. All genes that did not have a minimum of 10 counts in the entire dataset were removed. Cells that were imputed arising from doublets through the doubletCells function were excluded. After the quality filter, cells were analysed using the Seurat version 4.0.1 package [12,13]. The gene counts of each cell was normalized by dividing them to the library size of their cell; counts were converted in CPM and subsequently log-transformed. The cells of the different patients were then further filtered selecting only cells with at least one PTPRC gene count and integrated with 4 patient scRNA-seq data, from Croft et al. [14] into a single dataset via canonical correlation analysis (CCA) workflow. Subsequent analyses were conducted using only the 2000 most highly variable genes in the dataset. Principal Component Analysis (PCA) was used for dimensionality reduction, selecting the first 15 dimensions for CD45+ and the first 40 for CD3+ cells, followed by clustering using a graph-based clustering approach [15]; for clustering analysis, resolution was set at 0.6 for CD45+ and 0.7 for CD3+ cells. Afterward, Uniform Manifold Approximation and Projection (UMAP) was used for two-dimensional visualization of the resulting clusters. The clusters were annotated by analysing the expression of a panel of cellular-type marker genes. The T-cell sub-population was obtained by selecting the T cell cluster, CD8+ and CD4+, from the CD45+ cell clustering and performing the previous analysis step. Subsequently, the annotated clusters of the T-cell subtypes were obtained with the same methodology as those obtained with all the immune infiltrate. The differentially expressed genes among each T-cell cluster, extrapolated from Tumoral and Non Tumoral tissues, were calculated with the normalized count matrix with the MAST algorithm, after the removal of ribosomal and mitochondrial genes. To compare our EAC single-cell RNA data with publicly available ESCC dataset, we downloaded Raw-data from GSE145370 [16] and we performed an integrated analysis of the two dataset by reciprocal-PCA integration workflow of Seurat Package.
2.4. Identification of TF regulons
Single-cell regulatory network identification was characterized using the Python package pyscenic [17]. Putative target genes for a supplied list of human transcription factors [18] human were identified based on co-expression using the GRNBoost2 algorithm [19]. Co-expression modules were filtered using cis-regulatory motif analysis (RcisTarget) and only modules enriched for putative direct-binding targets of the corresponding transcription factor were retained. Where multiple modules were identified for a TF, these were combined to result in a single regulon per TF. Finally, cells were scored for the activity of each TF regulon using the AUCell algorithm and results were visualized using the clustermap function from the Seaborn Python package.
2.5. Polychromatic Flow Cytometry
Frozen samples were thawed in RPMI-1640 medium supplemented with 10% FBS (Sigma-Aldrich), 1% penicillin-streptomycin and 1% Ultra-glutamine (both from Lonza) and 20 µg/mL DNase I from bovine pancreas (Sigma-Aldrich). After extensive washing with PBS 1x without calcium and magnesium (Sigma-Aldrich), cells were immediately stained with the combination of monoclonal antibodies (mAbs) listed in Supplementary Table 4. Flow cytometry procedures for high-dimensional single-cell panel development have been previously described [20]. All data were acquired at the FACS Symphony A5 flow cytometer (BD Biosciences) equipped with 5 lasers (UV, 350 nm; violet, 405 nm; blue, 488 nm; yellow/green, 561 nm; red, 640 nm; all tuned at 100 mW, except for UV, which tuned at 60 mW). Flow cytometry data were compensated in FlowJo by using single stained controls (BD Compbeads incubated with fluorescently conjugated antibodies) [21].
2.6. Computational analysis of flow cytometry data
Flow Cytometry Standard (FCS) 3.0 files were imported into FlowJo software (version 9) and analysed by standard gating to remove aggregates and dead cells and identify CD45+ CD3+ T cells. 20000 CD3+ T cells per sample were subsequently imported in FlowJo (version 10), biexponentially transformed, and exported for further analysis in Python (version 3.7.3) by a custom-made pipeline of PhenoGraph [22] where we modified the Linux-community and the core.py script of PhenoGraph package in order to fix the seed to “123456”). Tumoral and peritumoral samples were labeled with a unique computational barcode for further identification and converted into comma-separated (CSV) files and concatenated in a single matrix by using the merge function of the pandas package. The K value, indicating the number of nearest neighbours identified in the first iteration of the algorithm, was set at 500. The data were then reorganized and saved as new CSV files, one for each cluster, that were further analysed in FlowJo to determine the frequency of positive cells for each marker and the corresponding median fluorescent intensity (MFI). Subsequent metaclustering of iMFI values was performed using the gplots R package. UMAP was obtained by UMAP Python package; all scripts mentioned above are available at: https://github.com/luglilab/Cytophenograph
2.7. Analysis of Bulk RNA Sequencing Data
RNA was extracted with RNeasy Mini kit (QIAGEN); libraries were prepared with the SMARTer Stranded Total RNA Sample Prep Kit-HI Mammalian (Takara) and sequenced on the Illumina NextSeq550 platform by generating at least 80 million reads 75bp paired-end per sample.
The raw reads were mapped against reference genome GRCh38 with STAR Aligner [23] and count table was generated using FeatureCounts [24]. Genes with less than 10 raw counts in 1% of the samples or with hypervariable expression were removed before of normalization. Normalization was calculate using variance stabilizing transformation (VST) using DESeq2 package [25]. We excluded from the analysis all biopsies of tumor tissue that had a Pearson correlation coefficient with their respective tumor biopsy greater than 0.85. Subsequently, surrogate variables that generated non-biological variance among samples were identified. The filtered matrix was used for the differential expressed gene identification. The surrogate variables identified using a R package “DaMiRseq” [26] were indicated in the design slot of the DESeqDataSet object: in this way, the counts were corrected from the batch effect before the identification of differential expressed genes. The differentially expressed genes with a P-adjusted lower than 0.05 were selected as a Differential Expressed Genes Tumor Vs Non Tumor signature (DEGs) and used for pathways enrichment and to identify potential biomarkers or pharmaceutical targets among them using the Ingenuity Pathway Analysis (IPA) software (Ingenuity H Systems, www.ingenuity.com). Finally to verify whether some of these genes were associated with an early prognosis (progression or relapse of tumor) we repeated the analysis of the RNA-seq data among the tumor biopsies of the patients for whom the early prognosis was known and who had a Pearson coefficient greater than 0.85 with their class, positive or negative early prognosis (Positive or Negative) using only the previously identified up-regulated gene counts in tumor biopsies compared to non-tumor biopsies. The resulting differentially expressed genes with a P-value lower than 0.05 were selected as Early Prognosis Signature (EPS).
2.8. SODEGIR Analysis
We integrated our total RNA-seq data with CNV data of 87 esophageal adenocarcinoma patients from TCGA database and PREDA package [27] to verify whether there are genomic regions overexpressed or inhibited in our tumoral tissue samples. The matrix of the total RNA-seq counts normalized and corrected with the Damirseq package was used to produce a GE score along chromosomes 1-22 using the statistic option within the PREDA package between the expression values of the T biopsies against the NT biopsies. The average of the CNA values for each gene of the TGCA data was calculated and subsequently the log2 was calculated, finally these data were used within PREDA to calculate a CN score along the genome. Chromosomal regions showing a GE score above or below a threshold of +/- 0.5 with a q-value <0.01 and a CN score, according to the GE score, above or below a threshold of +/- 0.1 with a q-value <0.01 were classified, respectively, GAIN or LOSS.
2.9. Survival Analysis
The top 100 up-regulated genes of the DEGs signature reported from IPA as biomarkers, the EPS, and the 37 DEGs that fall into GAIN regions were used to verify the existence of an association between these and the prognosis of 78 patients with adenocarcinoma. esophageal of the ESCA court of TCGA using RNA-seq data and clinical information present to construct Kaplan-Meier curves through survival [28] and survminer R packages.
For each signature, a score was obtained for each of the 78 patients who were divided into two groups based on a threshold; For total RNAseq derived signatures were selected the threshold which divide the two curves with the most significant P-value, chosen between the first (25% of the patients) and the third quartile (75%); For scRNAseq signatures the patients were splitted by median of the score signatures. The signature scores were calculated as the average of the logTPMs of the signature gene counts.
Furthermore, the association between the survival of the patients and their content of cell types that we found in our single-cell analysis: for this analysis we used the gene counts of the 78 patients of TCGA normalized for the cell content. T and the top 50 genes differentially expressed by the cell type considered.
The P-values for all curves were calculated with the log-rank test. The EPS and single-cell signatures were tested as overall survival along 30 months, the top 100 IPA biomarker DEGsS and DEGsS in GAIN regions were tested along 60 months. for the correlation between survival and clinical parameters of patients and with signatures, the TNM parameters, when available for the patient, were reorganized as follows: staging N and M other than N0 and M0 were all merged into N1 and M1; for the T staging, the pairs T1 and T2 and T3 and T4 have been merged with each other; the age of the patients was divided into two categories based on whether the patients were over or under 65. the R survminer package was used for the cox regressions and for the chi-square tests and the Odd Ratios the function oddratio.fisher from the R epitools package. The association between the age of the patients and the signatures was tested with the wilcox.test by compare_means function of ggpubr package.
3. Results
3.1. Single-Cell Level Analysis of Esophageal Adenocarcinoma Immune Infiltrate
Patients undergoing esophageal resection were recruited for single-cell sequencing (scRNA-seq) and total RNA sequencing (totRNA-seq) analyses. All the clinical data regarding the selected cohort of patients are collected in Supplementary Table 1. The entire workflow of our study is shown in Figure 1A. For scRNA-seq experiments, Tumor (T) and matched Non Tumor (NT) biopsies from three patients who did not receive any pharmacological treatment were collected and analysed. We then integrated our data with scRNA-seq data, selecting only CD45+ cells, from Croft et al. [14] including 4 treatment-naive patients for a total of 7 patients analysed to obtain a larger cohort of EAC. Uniform Manifold Approximation and Projection (UMAP) of T and NT EAC immune cells outlined a differential enrichment of those cells according to the tissue of origin (Figure 1B) and bioinformatic analysis was able to define 8 clusters of CD45+ cells. In detail, EAC immune infiltrate was composed of myeloid, mast, plasma, NK, B, CD8+ T and CD4+ T Cells (Figure 1C). The dot plot in Figure 1D shows the expression of marker genes used for the cell type annotation.
When comparing the percentage frequencies of CD45+ cells across EAC samples based on their tissue of origin, we observed that Tumor samples generally exhibited an enrichment of T infiltrating lymphocytes (TILs), specifically CD4+ T cells and NK cells, compared to Non-Tumoral samples (Figure 1E). Furthermore, NT tissues showed a higher presence of B cells and CD8+ T cells, whereas T tissue resulted enriched in the other identified CD45+ cell types. To assess whether the different subsets of T cells could be differentiated according to a specific transcriptional program, we employed python single-cell regulatory network inference and clustering (pySCENIC) analysis on our single-cell dataset for CD8+ and CD4+ cells infiltrating tumor tissue. This analysis revealed several active regulons that confirm the differentiation and activation of these cell types (Supplementary Figure 1). Additionally, we integrated the dataset of the 7 EAC patients with the scRNA-seq data of ESCC from Zheng et al. [16]. We identified the same cell types reported in Supplementary figure 1A albeit with differences in the relative abundances between the two types of esophageal cancer (Supplementary figure 2B): in particular, EAC seems to be characterized by a greater number of tumor-infiltrating CD4+ T cells, while ESCC shows a marked enrichment of myeloid cells.
3.2. Dissection of T-cells Heterogeneity in Esophageal Adenocarcinoma
The heterogeneity of the T-cells cluster was explored by reanalysing the subset of CD45+ CD3+ cells. As depicted in Figure 2A, the sub clustering of only T cells revealed 8 distinct clusters, which were manually annotated based on their gene marker expression (Figure 2B). The markers’ genes for each cell type were chosen among the differentially expressed genes (DEGs) identified through a research in the literature. The DEGs among CD45+ cells originating from Tumor tissue are reported in Supplementary Table 2. We outlined 3 clusters with higher frequency in Tumor tissues (Supplementary Figure3): T regulatory (Treg) cells, Mucosal Associated Invariant T (MAIT) and Exhausted CD8+ cells. In contrast, Temra CD8+ were more abundant in NT tissues. CD4+ naїve, CD4+ Tcm, CD8+ Tcm and CD8+ Tem cells showed no differences in abundance between Tumor and Non Tumor tissues. With reference to annotation, the CD8+ Tem cluster showed high expression of cytotoxic markers such as granzyme K (GZMK), granzyme A (GZMA), granzyme B (GZMB), granzyme H (GZMH) and perforin 1 (PRF1), but low expression level of CCR7. Naïve CD4+ T cells were characterized by the expression of IL7R and the T-cell differentiation markers SELL and CCR7. The subset of cells expressing CCR7, SELL and FAS was defined as CD4+ Tcm. Treg cluster was characterized by the expression of CD4, CD25 (IL2RA), BATF and FOXP3. Cells within the CD8+ Temra cluster were also found to be widely distributed in NT tissue; they exhibited enrichment in cytotoxic markers including PRF1, GZMA, GZMB, GZMH, although with low expression of the CD8+ Tem gene marker GZMK. Additionally, these cells also express inflammatory markers like CCL5 and CCL4. CD8+cells with lower expression of cytotoxic markers but higher levels of IL7R were annotated as CD8+ Tcm. The MAIT cluster was defined by the expression of the cytotoxicity markers CD61 (KLRB1), IL7R, and CCL5. We then analysed the highly differentially expressed transcripts between Tumor and Non Tumor in each CD8+ T cell subpopulation (Supplementary Table 2). A strong fold change in the average expression level of the main Differentially Expressed Genes (DEGs) markers of each CD3+ cell cluster was observed when comparing Tumor and Non Tumor tissues (Figure 2C). As expected, CD8+ T cell infiltrating Tumor tissues showed high levels of cytotoxic markers and metallothionein, which are involved in maintaining homeostasis and regulating apoptotic and autophagy pathways. Interestingly, at gene expression level, TILs from Tumor and Non Tumor tissues displayed distinct profiles. This allowed us to define a differential transcriptome profile signature for each CD8+ subcluster in Tumor and Non Tumor tissue. We then focused our analysis on TILs within the Tumor tissues. After defining their specific transcriptional signature, we used it for subsequent analyses. To validate our findings with a protein-based approach, we designed a 22-parameter polychromatic flow cytometry panel using the signature markers previously identified from our single-cell analysis. This panel was equipped to detect markers of activation (CD38, CD45RO, CD127, HLA-DR), exhaustion (CD39), proliferation (KI67) and metabolic activity (GZMB, GZMK), that were identified at transcriptomic level by the single-cell sequencing analysis in both Tumoral and Non Tumoral tissues. This flow cytometry panel was specifically designed to be representative of the cell clusters we previously described and outlined in Figure 2A. Figure 2E shows the differential expression of the markers used to identify these clusters. The UMAP shows the dimensional reduction of the cells according to the tissue type (Figure 2D, left panel) and the CD8+ or CD4+ T-cell phenotype (Figure 2E, central panel). We then focused our attention on CD8+ T cells: using PhenoGraph, we identified 7 different CD8+ clusters (Figure 2D, right panel).
Among the memory T cells subsets, we distinguished between resident and effector cells. TRM cells showed high expression of residency markers such as CD39+ and CD103+, and variable levels of the checkpoint inhibitor marker KI67+. Interestingly, this subset appeared to be exclusive to tumor tissue. The remaining effector cells were characterized by the memory marker CD45RO. Notably, two subclusters expressed the tissue residency marker CD69, and were labeled as CD127hi and CXCR6+. The CD127hi was characterized by high expression of the differentiation marker CD127, encoded by the Interleukin 7 receptor (IL7Ra). The CXCR6+ subset exhibited high levels of exhaustion marker CD39 along with variable levels of the activation marker CD38, being more prevalent in tumor cells. The effector subset consisted in two clusters: TTE and TTEKI67+. Both expressed high level of effector molecule GZMB, but TTEKI67+ also displayed high expression of KI67 and the activation markers HLA-DR and CD38. Al last, we identified CTLs cells with a cytotoxic phenotype characterized by GZMK expression and the effector differentiation marker CD127. Detailed information about the antibodies used for the panel can be found in Supplementary Table 3.
We then integrated our EAC dataset with a public ESCC dataset to investigate potential similarities among the TILs of the two types of esophageal cancer. The distribution of EAC CD45+ cells mostly overlapped with the one of ESCC. As expected, the abundance of CD45+ cells differed due to the diverse sample sizes and cancer types (Supplementary Figure 2A). Additionally, UMAP identified 12 clusters using a panel of markers selected from the highly differentially expressed genes, highlighting the similarity of CD45+ cells between EAC and ESCC (Supplementary Figure 2B). The complete list of genes used for the annotation is provided in Supplementary Figure 3. Bar plots showing the differential composition of EAC and ESCC tissues are presented in Supplementary Figure 2C.
3.3. Whole Transcriptome Profiling of Esophageal Adenocarcinoma Tissues for the Identification of a Prognostic Signature
Total RNA sequencing was performed on a wider cohort of patients compared to the one used for single-cell sequencing. For this task, we included also patients who had undergone neoadjuvant therapies before surgery. In total, RNA from 55 tissue samples was extracted and subsequently sequenced. Principal Components Analysis (PCA) confirmed the segregation of the samples according to the tissue of origin: PC1 separated Tumor and Non Tumor tissues, explaining the 63.91% of the variance. The distance measurement of the centroids yielded a statistically significant P-value (P-value<0,001) (Figure 3A). In Figure 3B, a hierarchically clustered heatmap shows the topmost significant DEGs between Tumor and Non-Tumor samples, indicating a clear separation in the expression profiles of the two tissue types. We then investigated whether a specific transcriptional profile could be associated with early prognosis of EAC. Figure 3C shows the PCA plot with a significant separation of the samples according to the postoperative course (P-value <0,001).
In Figure 3D, the top differentially expressed genes between positive and negative postoperative courses are shown in a hierarchically clustered heatmap, revealing a clear separation between the two groups and identifying a specific transcriptional profile associated with relapse/progression has been identified. Ingenuity Pathway Analysis (IPA) on upregulated genes in EAC Tumor samples was then performed to evaluate the enrichment of markers involved in tumor onset and/or progression or known drug targets. As shown in Figure 3E, a wide panel of gene markers associated with diagnosis, disease progression, low drug efficacy, poor prognosis or low response to therapies was outlined. As expected, pathway enrichment analysis on genes upregulated in tumor samples revealed enrichment in pathways involved in tumorigenesis (Supplementary Figure 4). Finally, we integrated our total RNA sequencing data with Copy Number Variation (CNV) data from TCGA database using SODEGIR analysis, highlighting regions of chromosomal instability previously associated with esophageal cancer [29,30,31] (Figure 3F). When we merged data from SODEGIR and IPA analyses, and identified seven genes (TREM1, PGC, AGR2, AGR3, SFRP4, INHBA and COL4A1) that were already recognized as IPA biomarkers (Supplementary Table 5). The upregulated DEGs which were located inside the GAIN genomic regions were used to construct a signature used for subsequent analyses.
3.4. Association between the Prognostic Signatures and Patients’ Survival
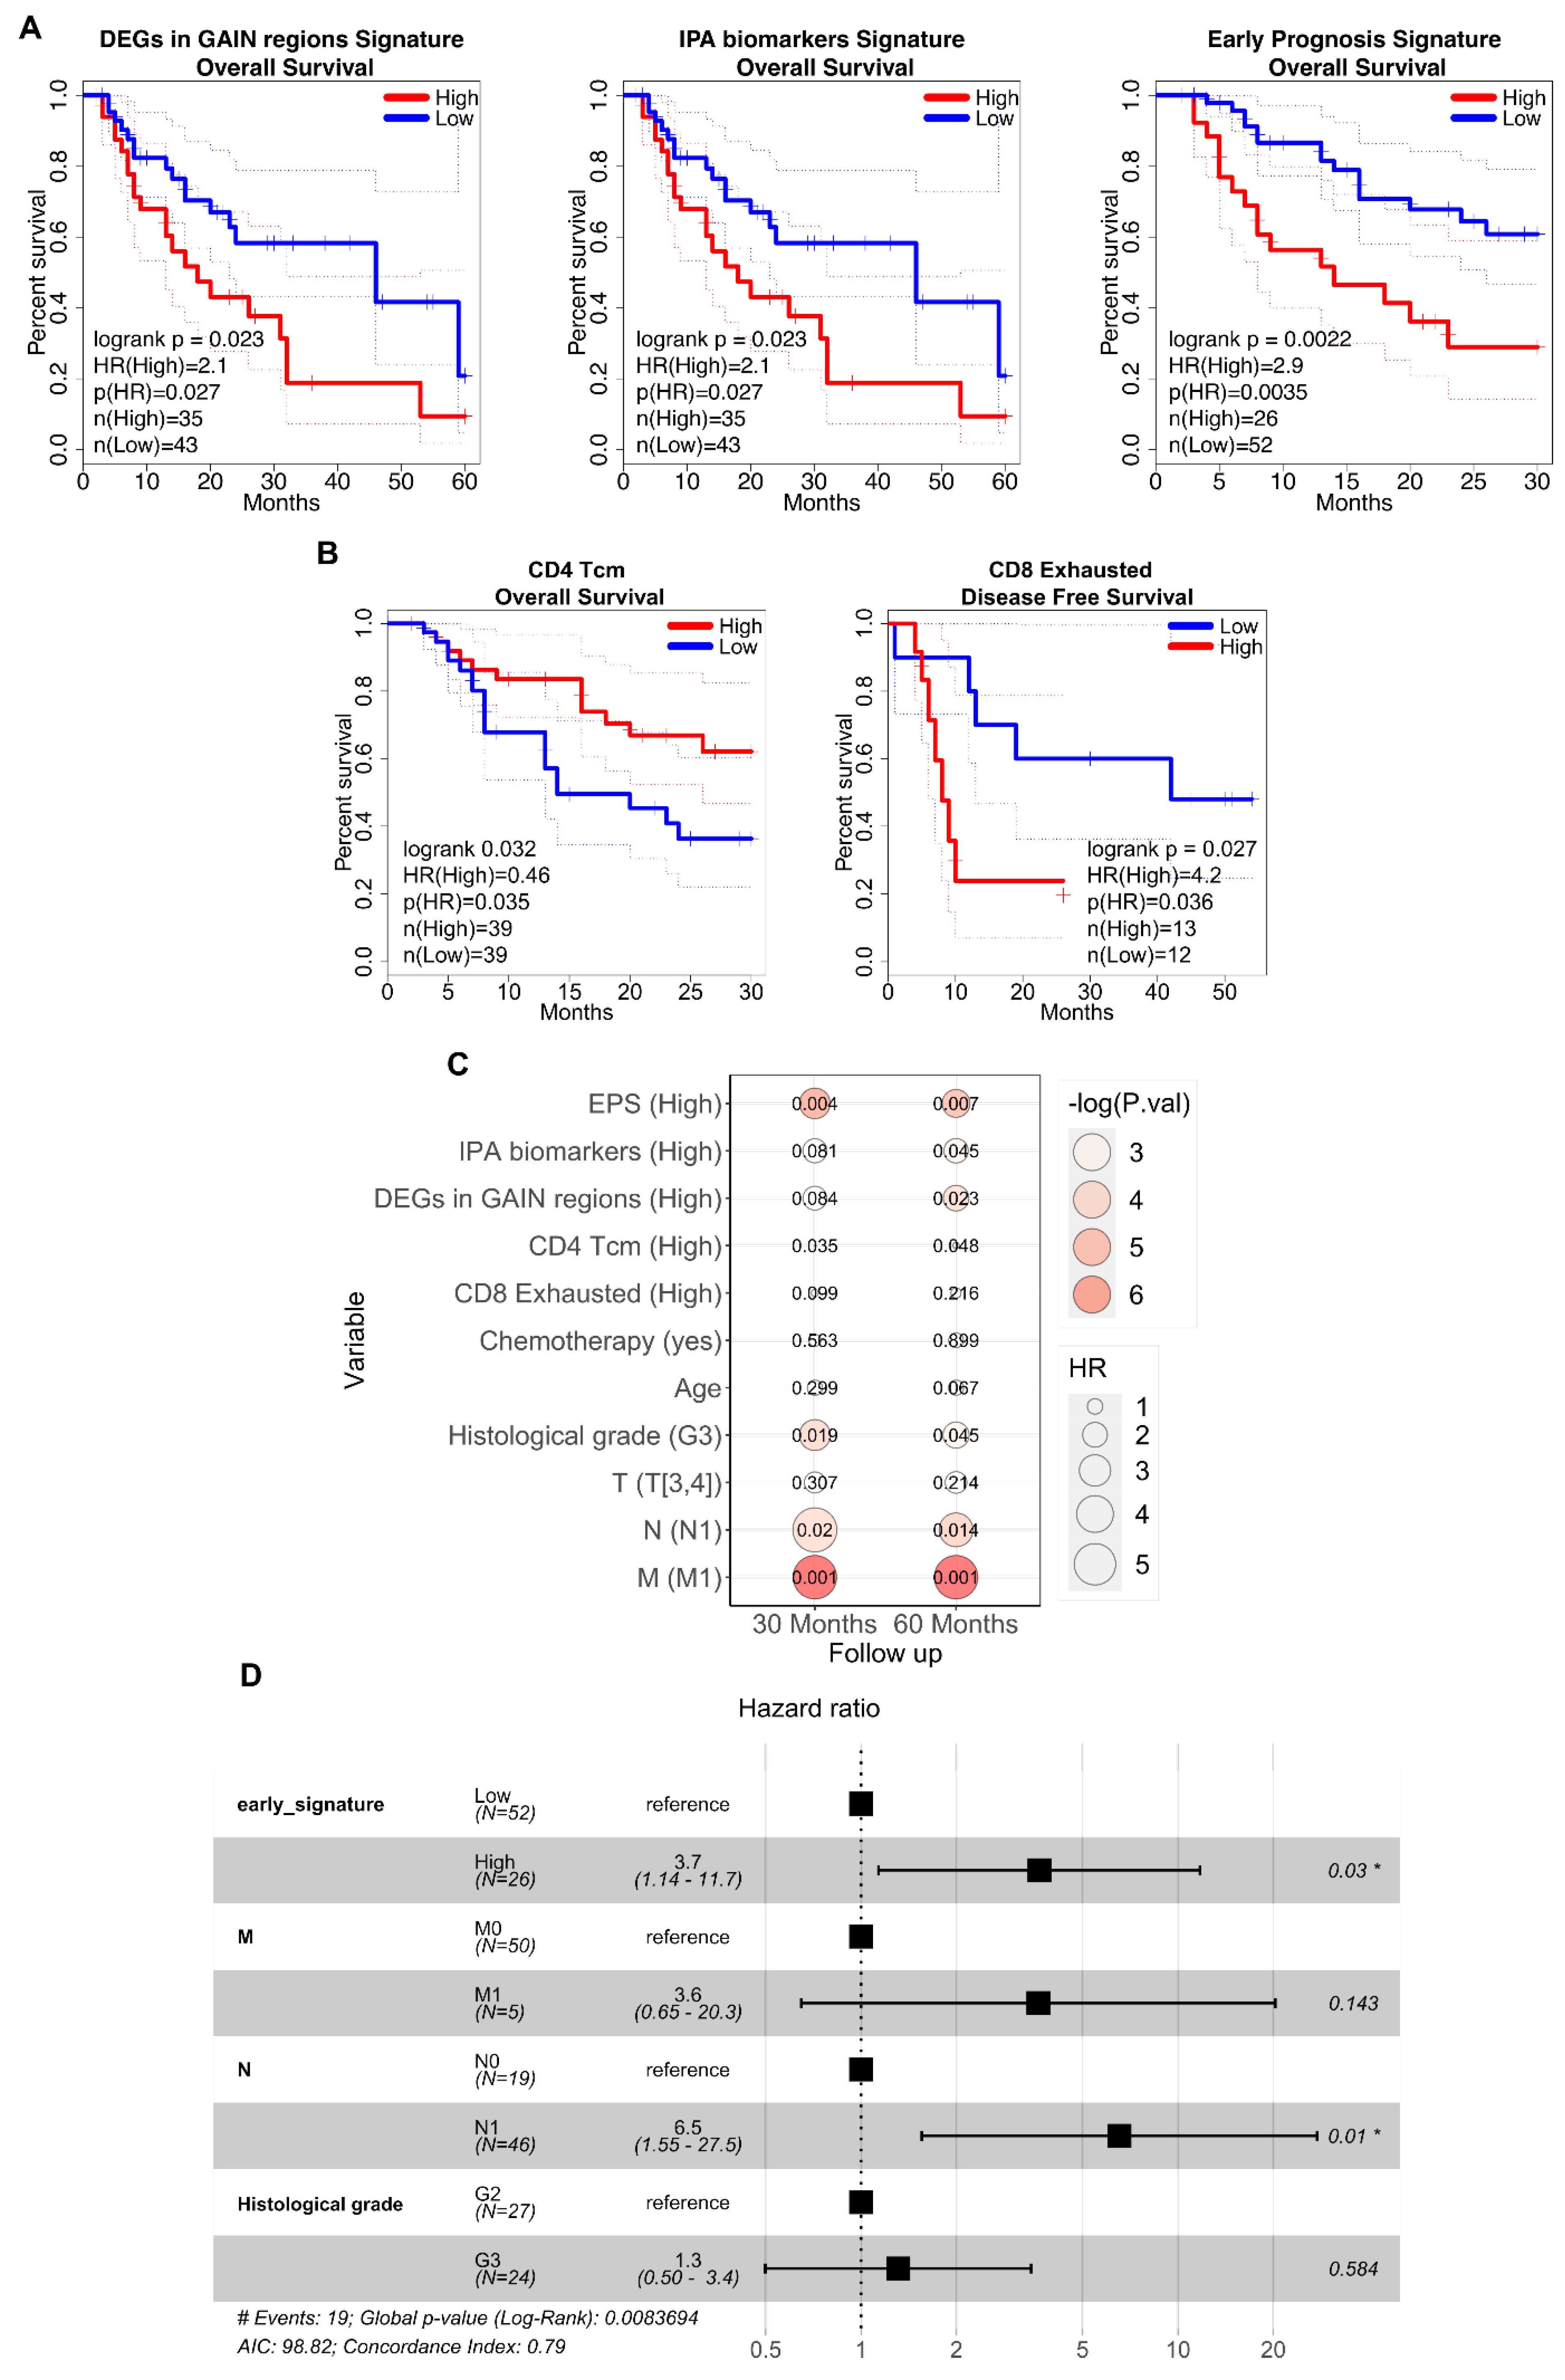
We used the transcriptional signatures derived from our data analysis to predict survival in a larger and different cohort of EAC patients. Total RNA-seq data from tumoral biopsies of 78 EAC patients from the TCGA database were obtained, and survival prediction was performed. We tested whether the differential signatures could separate TCGA patients into two groups: one with low expression and one with high expression of the signatures. We then assessed if the expression level of the signatures were associated with different prognoses. We specifically examined the association of DEGs in GAIN genomic regions, DEGs related to the IPA signature, and those specific to the early prognosis signature (EPS), with the overall patient survival (Figure 4A). In all three analyses, the separation of patients according to their prognosis was statistically significant (P-values=0.023, 0.031, 0.002 respectively). Patients with higher overall survival probability (up to 60 months post-surgery) and, thus, a good prognosis, exhibited low expression levels of both DEGs in GAIN genomic regions and IPA biomarkers. Conversely, patients showing high expression levels of these differential signatures had a lower overall survival probability, indicating a poor prognosis. Similarly, high expression of EPS was negatively associated with patient prognosis within the first 30 months post-surgery. Next, we examined survival curves using the signatures of the T cell subtypes identified in our scRNA-seq analysis, focusing only on the T cells infiltrating tumor tissues (Figure 4B). Patients with high expression of the CD4+ Tcm cluster signatures had a good prognosis, showing a high overall survival probability in the first 30 months post-surgery. Additionally, exhausted CD8+ T cells were able to stratify patients in our cohort (analysed with total RNA-seq) for Disease-Free Survival (DFS) data, suggesting a potential link to treatment success in preventing relapse. In particular, high expression of these cells seemed to be associated with a poor response to treatments.
Finally, we investigated whether the transcriptomic signatures derived from this study could predict patient prognosis alongside established clinical parameters in EAC diagnosis, such as the TNM staging system and the histological grade of the tumor. Initially, univariate Cox regression estimated Hazard Ratios (HR) for each parameter independently, revealing correlations and a substantial increase in HR with survival at 30 and 60 months only for TNM N and M factors, and histological grade (Figure 4C). Subsequently, these factors alongside each expression signature (excluding TNM M to ensure sufficient event numbers across cohorts over time.) were included in a multivariate Cox regression analysis. Among the signatures, only EPS maintained an association with poorer prognosis after adjusting for the other factors (Figure 4D). To understand the type of correlation with clinical parameters, odds ratios and chi-square tests were performed, demonstrating independence from clinical parameters through the distinct associations of the signatures (Supplementary Figure 5). Additionally, the Wilcoxon test showed no age-related differences between Low and High signature cohorts (data not shown).
4. Discussion
In this study, we conducted single-cell sequencing and total RNA sequencing analyses on Tumor and matched Non Tumor tissues from patients with esophageal adenocarcinoma (EAC) to characterize immune cell subpopulations and identify gene markers associated with patients’ clinical outcomes. CD45+ cells infiltrating Tumor tissues were analysed at single-cell level, resulting in the identification of 8 distinct subpopulations. Further analysis of T cells revealed 8 subclusters with differential gene expression between Tumor and Non Tumor tissues.
Bulk total RNA-seq analysis across a larger cohort of patients clearly distinguished between Tumor and Non Tumor tissues. Transcriptome analysis focused on tumor samples enabled stratification of patients based on early prognosis, outlining a panel of DEGs linked to clinical outcomes. Notably, UGT2B15, previously associated with pathogenesis and prognosis of gastric cancer [32,33] and HEPACAM2, upregulated in patients with poor prognosis and linked to metastasis in various types of cancer, were highlighted. MMPs, including MMP-1 and MMP-10, known for their roles in esophageal tumorigenesis, were also found to be upregulated in tumor samples [34,35]. Conversely, we observed downregulation of IGKV2D-40, part of an immune-related gene panel for colorectal cancer prognosis.
We performed gene set enrichment and SODEGIR analyses to identify enrichment in TREM1, PGC, INHBA, and AGR, all of which are involved in cancer-related pathways and associated with patient prognosis in esophageal carcinomas and premalignant Barrett's epithelium [36].
Analysis of EAC patients from the TCGA dataset showed that high expression of genes located within genomic GAIN regions, as outlined by SODEGIR analysis, correlated with poor prognosis (Figure 4A). This is consistent with previous studies linking genomic alterations in EAC to tumor malignancy.
Through gene set enrichment analysis, we identified potential prognostic biomarkers in EAC, suggesting their utility in predicting patient outcomes. To further validate our findings, we tested this signature on the TCGA dataset: patients with low expression of the identified DEGs had a better prognosis within the first 30 months of follow-up. Additionally, we observed that elevated expression levels of the CD4+ Tcm cluster signature and reduced expression of the Exhausted CD8+ cluster signature reflected differences in the tumor immune infiltrate composition and were associated with positive treatment outcomes.
We speculate that these immune cell types contribute to the anti-tumor responses, and the identified differential expression signatures could be used to develop a cytofluorimetric panel for early detection and the prediction of tumors which are likely to respond favorably. Overall, our study delineates immune cell subpopulations pervading the EAC tumor site and their gene expression profiles, providing insights into EAC immune landscape and potential therapeutic targets. Furthermore, these results propose the potential role of novel immunological biomarkers for predicting EAC prognosis, aiding in the stratification of the patients for post-surgical outcomes and follow-up or guiding the design of personalized follow-up programs and decisions regarding adjuvant therapies.
5. Conclusions
In conclusion, this study provides a detailed characterization of immune cell subpopulations and their gene expression profiles within esophageal adenocarcinoma (EAC) tissues. The identification of specific transcriptional signatures and differentially expressed genes linked to clinical outcomes underscores their potential as prognostic biomarkers. These findings enhance our understanding of the EAC immune landscape and highlight novel therapeutic targets. The results also propose new immunological biomarkers that can predict patient prognosis, assist in post-surgical stratification, and inform personalized follow-up and adjuvant therapy decisions.
Supplementary Materials
The following supporting information can be downloaded at the website of this paper posted on Preprints.org
Author Contributions
For research articles with several authors, a short paragraph specifying their individual contributions must be provided. The following statements should be used “Conceptualization, X.X. and Y.Y.; methodology, X.X.; software, X.X.; validation, X.X., Y.Y. and Z.Z.; formal analysis, X.X.; investigation, X.X.; resources, X.X.; data curation, X.X.; writing—original draft preparation, X.X.; writing—review and editing, X.X.; visualization, X.X.; supervision, X.X.; project administration, X.X.; funding acquisition, Y.Y. All authors have read and agreed to the published version of the manuscript.” Please turn to the CRediT taxonomy for the term explanation. Authorship must be limited to those who have contributed substantially to the work reported.
Funding
This research received no external funding.
Institutional Review Board Statement
This study was approved by the Research Ethics Board of Humanitas Research Hospital (authorization number 2819) and all the procedures have been conducted in agreement with the Declaration of Helsinki.
Informed Consent Statement
Informed consent was obtained from all subjects involved in the study.
Data Availability Statement
The raw data of scRNA-seq and total RNA sequencing analysis performed in this study are available at https://zenodo.org/record/7898240#.ZFSZbs5ByN4.
Acknowledgments
In this section, you can acknowledge any support given which is not covered by the author contribution or funding sections. This may include administrative and technical support, or donations in kind (e.g., materials used for experiments).
Conflicts of Interest
The authors declare no conflicts of interest
References
- Coleman HG, et al. The Epidemiology of Esophageal Adenocarcinoma. Gastroenterology. 2018;154(2):390-405. [CrossRef]
- Fridman WH, et al. The immune contexture in human tumours: Impact on clinical outcome. Nature Reviews Cancer. Published online 2012. [CrossRef]
- Fassan M, et al. PD-L1 expression, CD8+ and CD4+ lymphocyte rate are predictive of pathological complete response after neoadjuvant chemoradiotherapy for squamous cell cancer of the thoracic esophagus. Cancer Medicine. 2019;8(13):6036-6048. [CrossRef]
- Hong, M. , Tao, S., Zhang, L. et al. RNA sequencing: new technologies and applications in cancer research. J Hematol Oncol 13, 166 (2020). [CrossRef]
- Chung W, et al. Single-cell RNA-seq enables comprehensive tumour and immune cell profiling in primary breast cancer. Nature Communications. 2017;8. [CrossRef]
- Peng J, et al. Single-cell RNA-seq highlights intra-tumoral heterogeneity and malignant progression in pancreatic ductal adenocarcinoma. Cell Research. 2019;29(9):725-738. [CrossRef]
- Lambrechts D, et al. Phenotype molding of stromal cells in the lung tumor microenvironment. Nature Medicine. 2018;24(8):1277-1289. [CrossRef]
- Savas P, et al. Single-cell profiling of breast cancer T cells reveals a tissue-resident memory subset associated with improved prognosis. Nature Medicine. 2018;24(7):986-993. [CrossRef]
- JH L, et al. Data-Driven Phenotypic Dissection of AML Reveals Progenitor-like Cells that Correlate with Prognosis. Cell. 2015;162(1):184-197. [CrossRef]
- McCarthy DJ, Campbell KR, Lun ATL, Wills QF. Scater: Pre-processing, quality control, normalization and visualization of single-cell RNA-seq data in R. Bioinformatics. 2017;33(8):1179-1186. [CrossRef]
- Lun ATL, Riesenfeld S, Andrews T, Dao TP, Gomes T, Marioni JC. EmptyDrops: Distinguishing cells from empty droplets in droplet-based single-cell RNA sequencing data. Genome Biology. 2019;20(1):63. [CrossRef]
- Butler A, Hoffman P, Smibert P, Papalexi E, Satija R. Integrating single-cell transcriptomic data across different conditions, technologies, and species. Nature Biotechnology. Published online 2018. [CrossRef]
- Satija R, Farrell JA, Gennert D, Schier AF, Regev A. Spatial reconstruction of single-cell gene expression data. Nature Biotechnology. 2015;33(5):495-502. [CrossRef]
- Croft W, Evans RPT, Pearce H, Elshafie M, Griffiths EA, Moss P. The single cell transcriptional landscape of esophageal adenocarcinoma and its modulation by neoadjuvant chemotherapy. Mol Cancer. 2022 Oct 17;21(1):200. [CrossRef] [PubMed]
- Li X, Wang K, Lyu Y, et al. Deep learning enables accurate clustering with batch effect removal in single-cell RNA-seq analysis. Nature Communications. 2020;11(1):1-14. [CrossRef]
- Zheng, Y. , Chen, Z., Han, Y. et al. Immune suppressive landscape in the human esophageal squamous cell carcinoma microenvironment. Nat Commun 11, 6268 (2020). [CrossRef]
- van de Sande B, Flerin C, Davie K, et al. A scalable SCENIC workflow for single-cell gene regulatory network analysis. Nature Protocols. 2020;15(7):2247-2276. [CrossRef]
- Lambert SA, Jolma A, Campitelli LF, et al. Erratum: The Human Transcription Factors (Cell (2018) 172(4) (650–665), (S0092867418301065) (10.1016/j.cell.2018.01.029)). Cell. 2018;175(2):598-599. [CrossRef]
- Moerman T, Aibar Santos S, Bravo González-Blas C, et al. GRNBoost2 and Arboreto: Efficient and scalable inference of gene regulatory networks. Bioinformatics. 2019;35(12):2159-2161. [CrossRef]
- Lugli E, Zanon V, Mavilio D, Roberto A. FACS analysis of memory T lymphocytes. In: Methods in Molecular Biology. Vol 1514. Humana Press Inc.; 2017:31-47. [CrossRef]
- Brummelman J, Haftmann C, Núñez NG, et al. Development, application and computational analysis of high-dimensional fluorescent antibody panels for single-cell flow cytometry. Nature Protocols. 2019;14(7). [CrossRef]
- Elowitz MB, Levine AJ, Siggia ED, Swain PS. Stochastic gene expression in a single cell. Science. 2002;297(5584):1183-1186. [CrossRef]
- Dobin A, Davis CA, Schlesinger F, et al. STAR: Ultrafast universal RNA-seq aligner. Bioinformatics. 2013;29(1):15-21. [CrossRef]
- Liao Y, Smyth GK, Shi W. FeatureCounts: An efficient general purpose program for assigning sequence reads to genomic features. Bioinformatics. 2014;30(7):923-930. [CrossRef]
- Love MI, Huber W, Anders S. Moderated estimation of fold change and dispersion for RNA-seq data with DESeq2. Genome Biology. 2014;15(12). [CrossRef]
- Chiesa M, Colombo GI, Piacentini L. DaMiRseq -An R/Bioconductor package for data mining of RNA-Seq data: Normalization, feature selection and classification. Bioinformatics. 2018;34(8):1416-1418. [CrossRef]
- Ferrari F, Solari A, Battaglia C, Bicciato S. PREDA: An R-package to identify regional variations in genomic data. Bioinformatics. 2011;27(17):2446-2447. [CrossRef]
- Therneau, TM. A Package for Survival Analysis in R. 2020. Available from: https://CRAN.R-project.
- Salem ME, et al. Comparative Molecular Analyses of Esophageal Squamous Cell Carcinoma, Esophageal Adenocarcinoma, and Gastric Adenocarcinoma. The Oncologist. 2018;23(11):1319-1327. [CrossRef]
- Killcoyne S, et al. Genomic copy number predicts esophageal cancer years before transformation. Nature Medicine. 2020;26(11):1726-1732. [CrossRef]
- Karagoz K, Lehman HL, Stairs DB, Sinha R, Arga KY. Proteomic and Metabolic Signatures of Esophageal Squamous Cell Carcinoma. Current cancer drug targets. Published online , 2016. 2 February.
- Chen X, Li D, Wang N, et al. Bioinformatic analysis suggests that UGT2B15 activates the Hippo YAP signaling pathway leading to the pathogenesis of gastric cancer. Oncology Reports. Published online , 2018. 26 July. [CrossRef]
- Li D, Yin Y, He M, Wang J. Identification of Potential Biomarkers Associated with Prognosis in Gastric Cancer via Bioinformatics Analysis. Medical Science Monitor. 2021;27. [CrossRef]
- Quilty F, Byrne AM, Aird J, et al. Impact of Deoxycholic Acid on Oesophageal Adenocarcinoma Invasion: Effect on Matrix Metalloproteinases. International Journal of Molecular Sciences. 2020;21(21). [CrossRef]
- Peng H hua, Zhang X, Cao P guo. MMP-1/PAR-1 signal transduction axis and its prognostic impact in esophageal squamous cell carcinoma. Brazilian Journal of Medical and Biological Research. 2012;45(1):86. [CrossRef]
- Wang Z, Hao Y, Lowe AW. The Adenocarcinoma-Associated Antigen, AGR2, Promotes Tumor Growth, Cell Migration, and Cellular Transformation. Cancer Research. 2008;68(2). [CrossRef]
Figure 1.
CD45+ cells annotation. A) Schematic representation of the experimental workflow B) UMAP visualization of CD45+ clusters according to their tissue of provenance. C) UMAP visualization of annotated CD45+ cell clusters. Annotation was made considering the differential expression of the main cell type gene markers. D) DotPlot of the expression level of gene markers specific for each cell type. E) Barplots of relative abundance of cell clusters according to their tissue of provenance; the bars represent the mean of the frequencies while the error bar the standard deviation; P-values computed by Mann-Whitney U test.
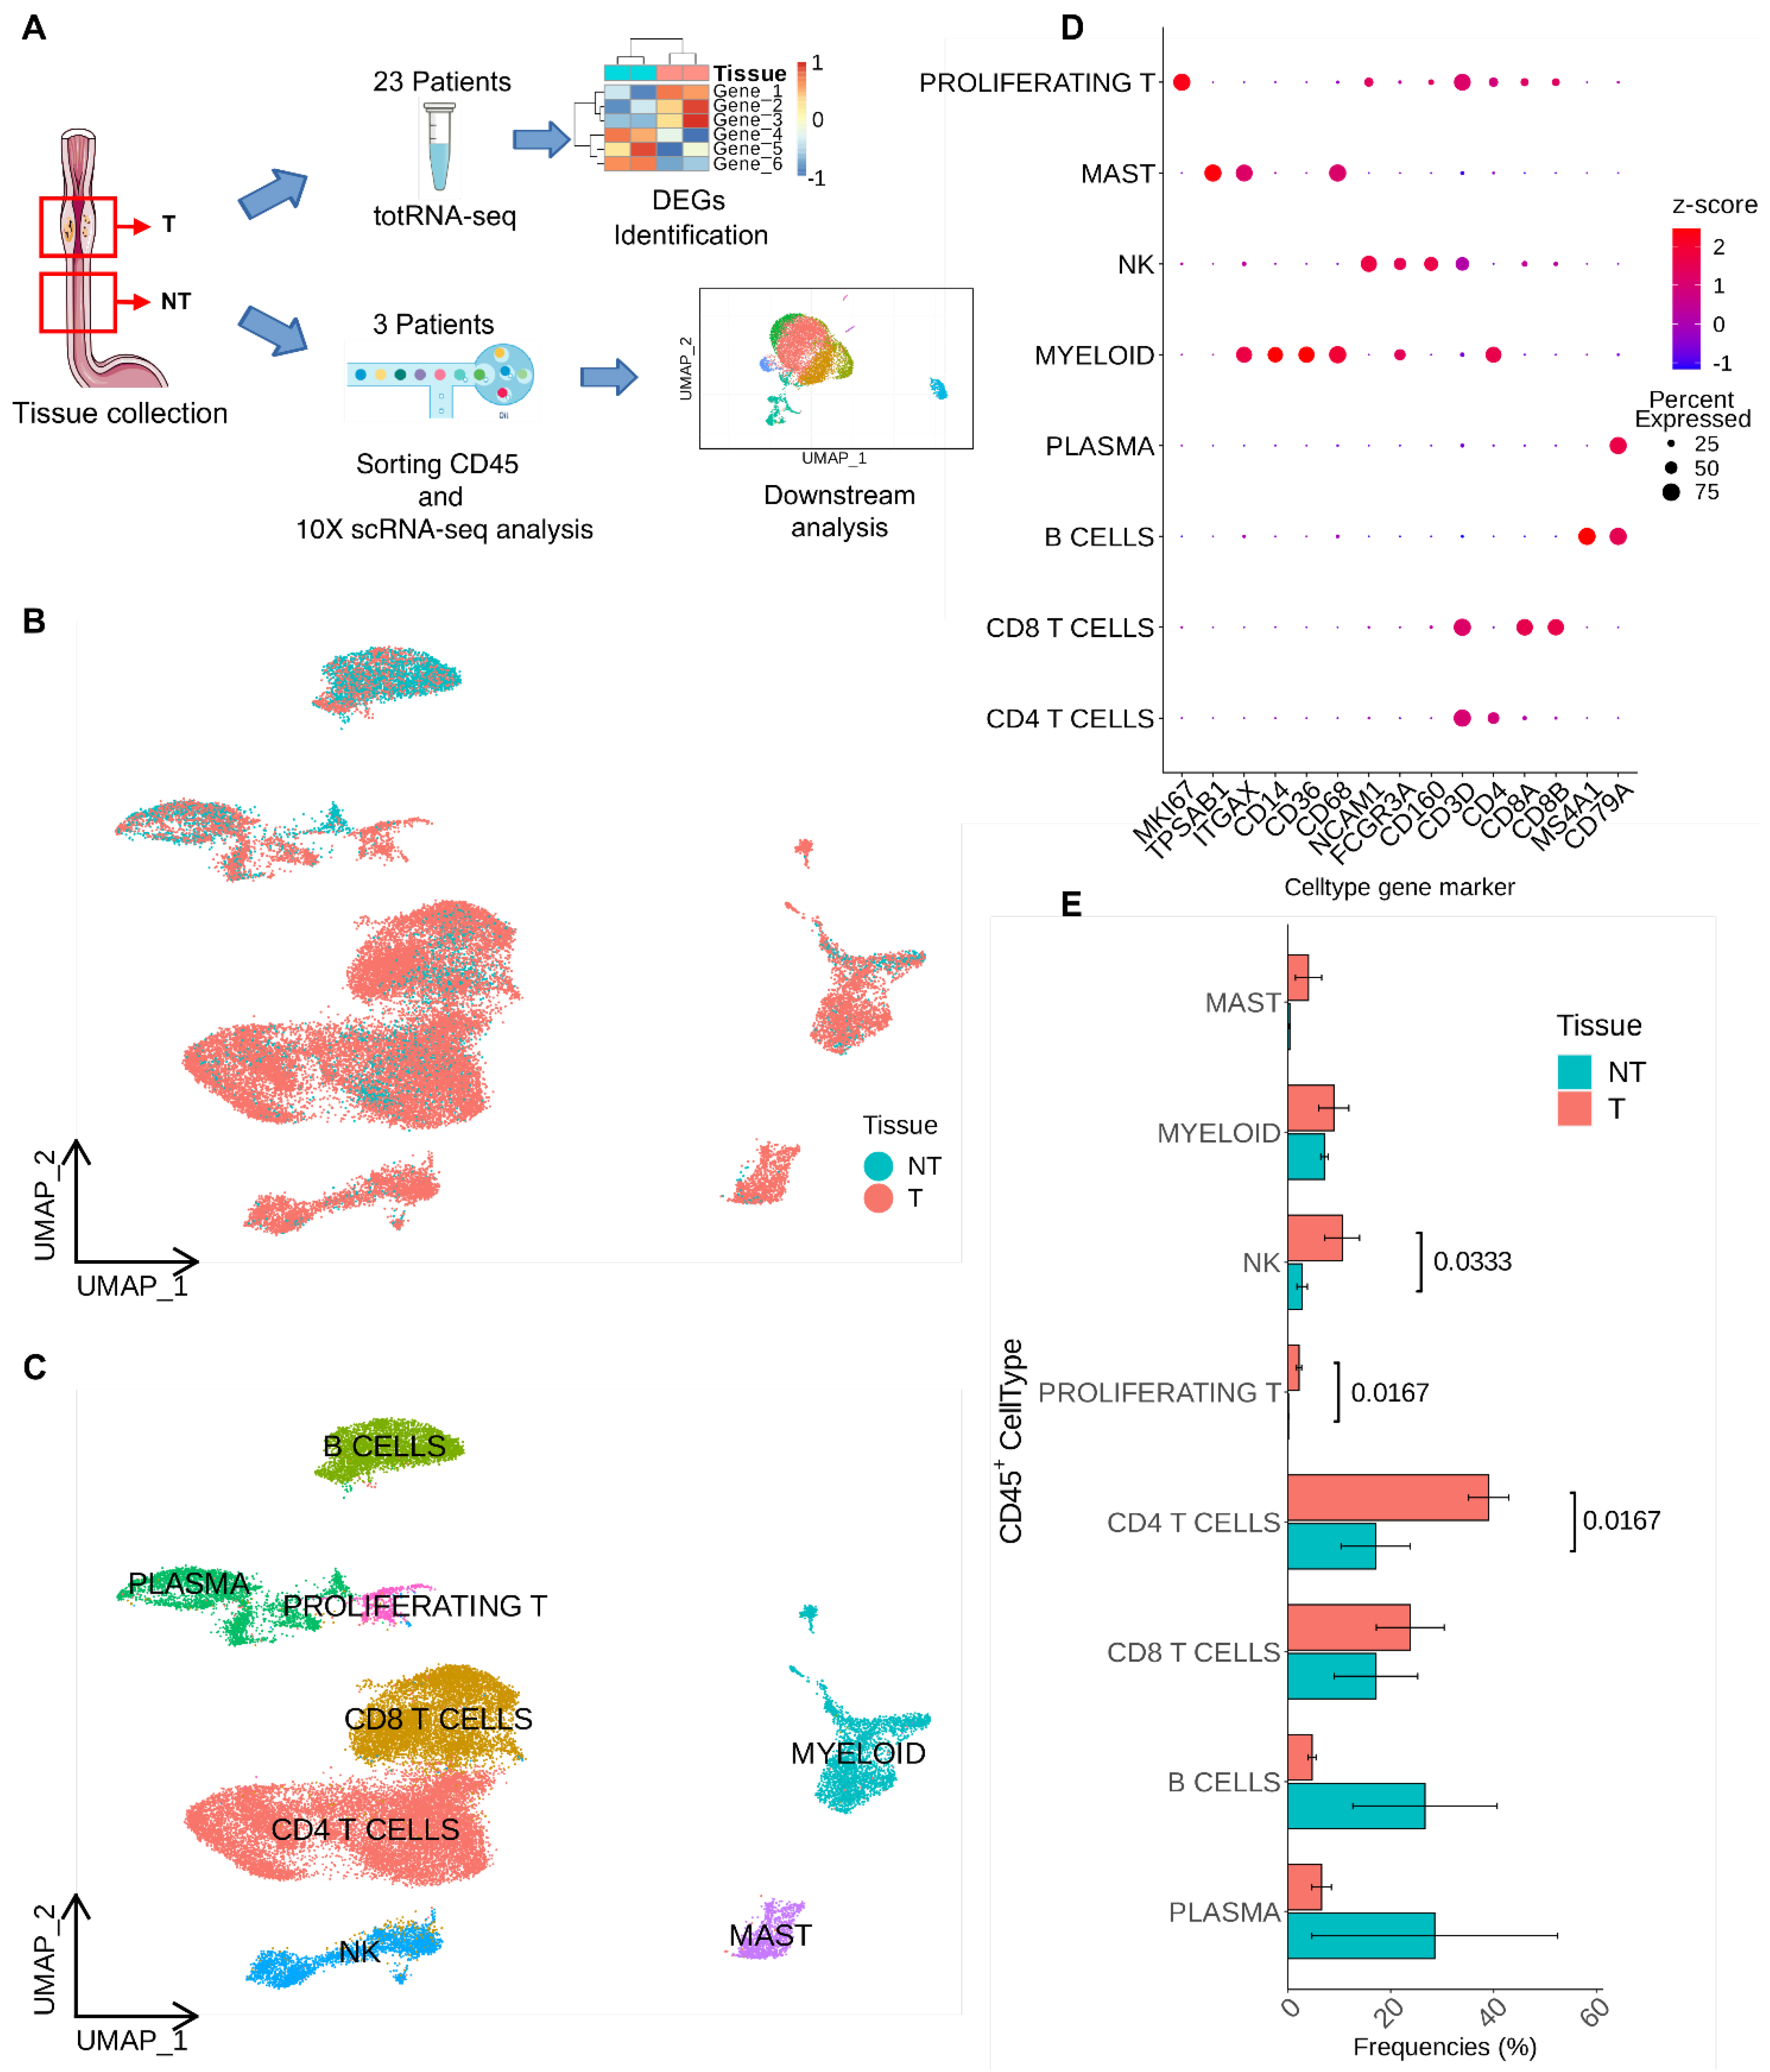
Figure 2.
T cells annotation and differential expression analyses. A) UMAP visualization of annotated T cells clusters. B) violin plot with the average expression of cell type marker genes used for annotation. C) Differential gene expression in each T cells subcluster made comparing Tumor and Non Tumor samples. D) UMAP analyses of the separation of the cells according to the tissue type (left panel), the T-cell type (central panel), and the annotation of each subcluster (right panel). E) Dot plot showing the cluster identification according to the MFI of the antibody and the frequency of positive cells (left panel) and the frequency of each cell population according to the tissue of origin (Tumor or Non Tumor tissue, right panel). Each cluster was identified considering the mean fluorescence intensity (MFI) of the antibody and its frequency in each tissue type.
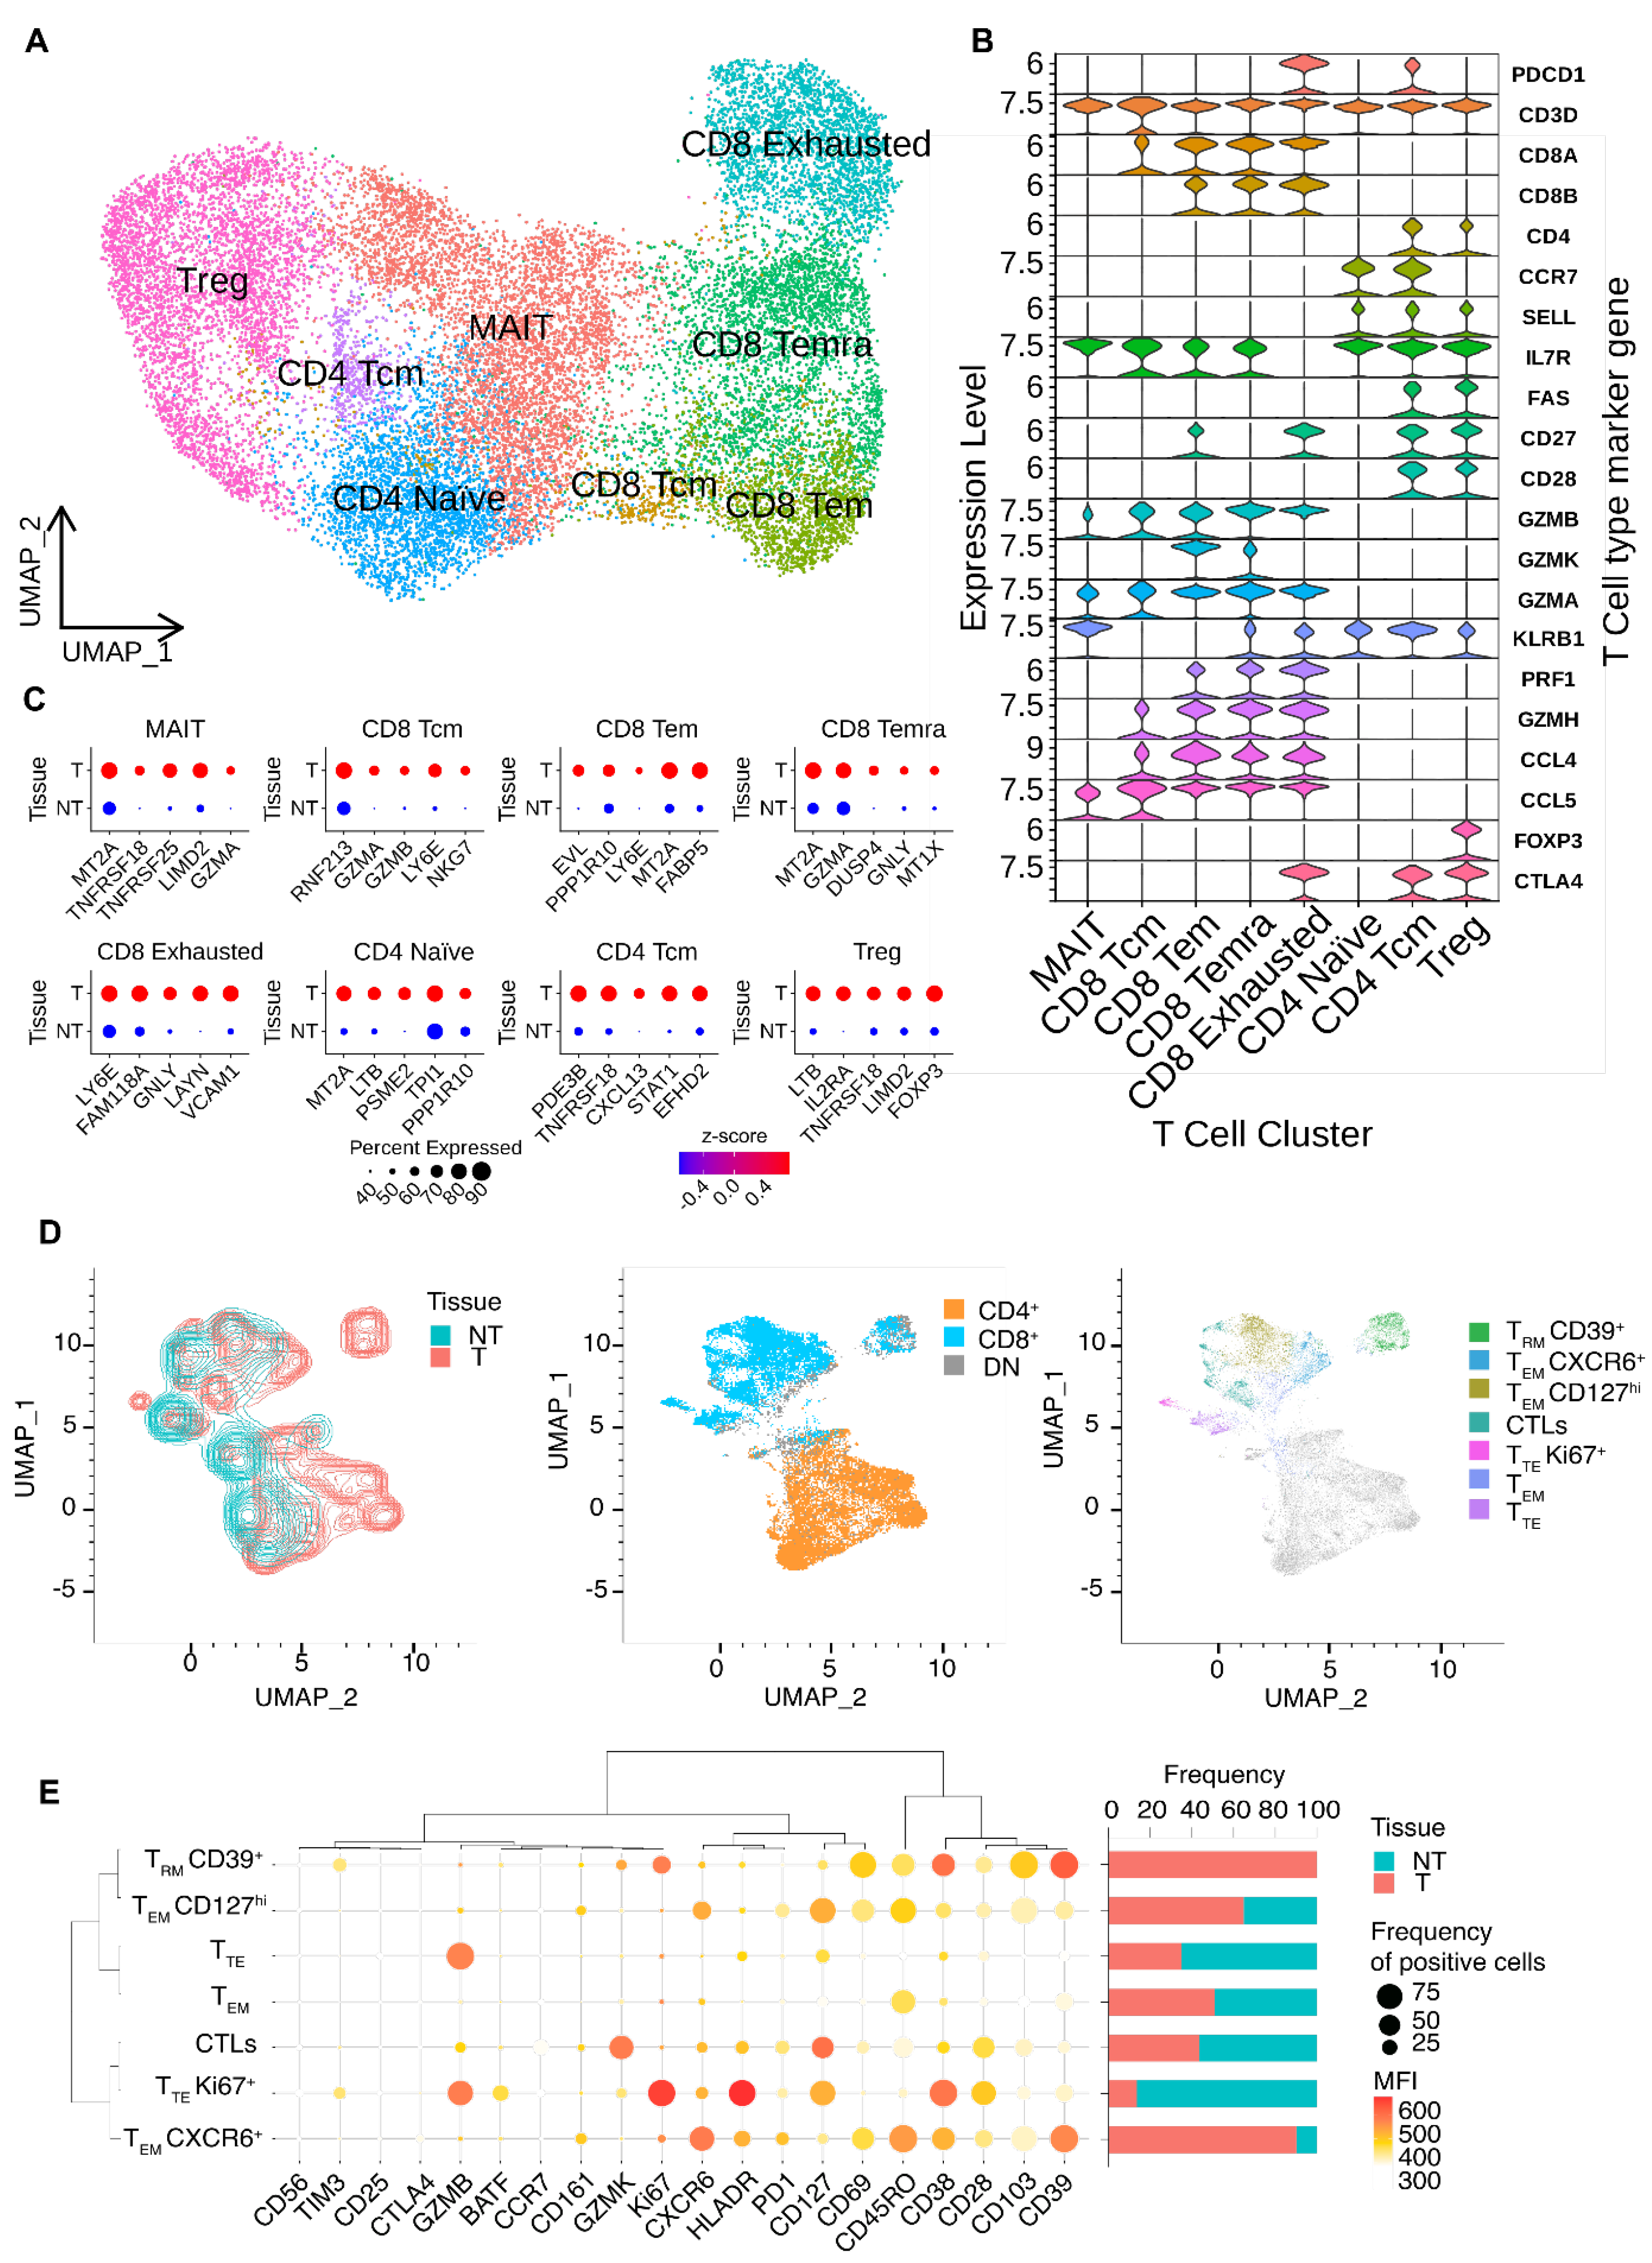
Figure 3.
total RNA expression analysis of Tumor and Non Tumor esophageal tissues. A) PCA of bulk RNA-seq samples visualized according to the tissue of origin. B) Heatmap of differential expressed genes from total RNA sequencing data comparing Tumor and Non Tumor samples. C) PCA of bulk RNA-seq samples visualized according to the early prognosis. Patients with a bad prognosis could have had either progression or relapse of the tumor D) Heatmap of differentially expressed genes according to early prognosis data. E) IPA analysis of the differentially expressed genes in tumor samples after bulk analysis showing the annotated biomarkers among top 100 up-regulated DEGs. F) Plot showing GAINs and LOSSes in genomic regions obtained by SODEGIR analysis of total RNA-seq data integrated with CNV data from TGCA database.
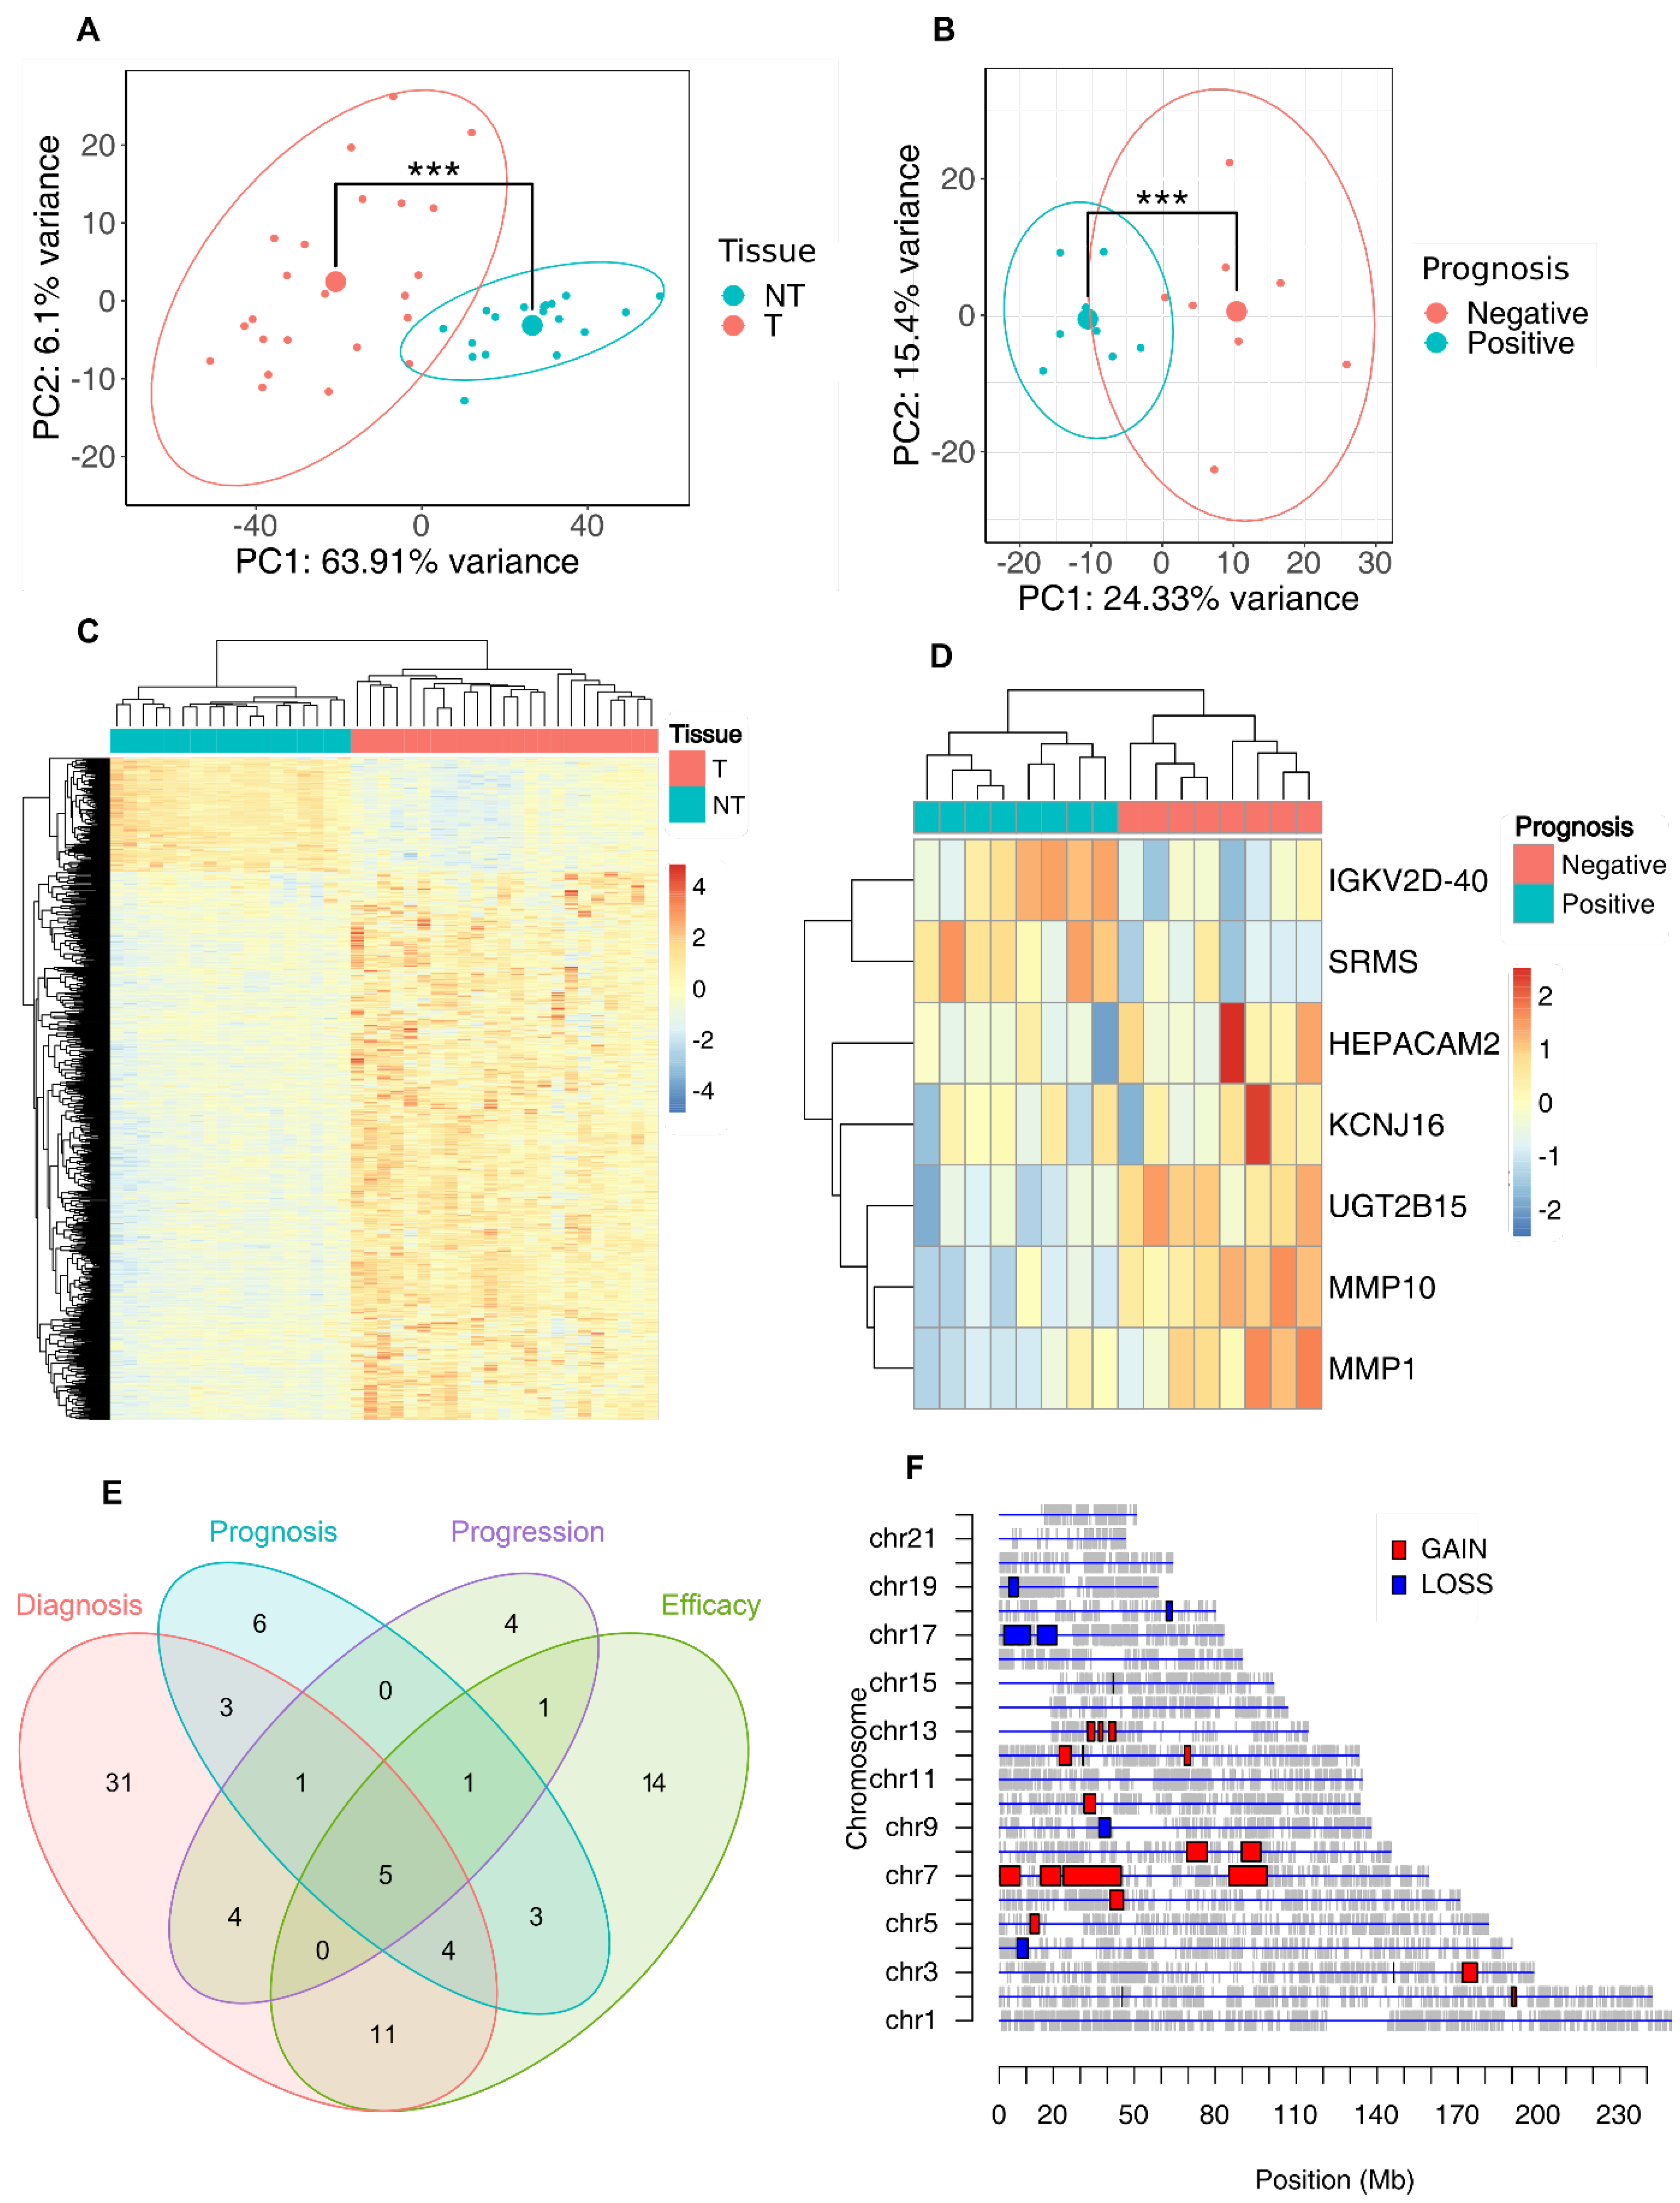
Figure 4.
Survival Kaplan-Meier curves of TCGA EAC patients. A) The first two plot show the Kaplan-Meier curves with overall survival of TGCA EAC patients at 60 months separated according to their values of expression of PREDA signature score, to the values of the DEGs signature reported from IPA as biomarkers signature score. The last plot shows overall survival of TGCA EAC patients at 30 months separated according to their values of expression of EPS score. B) Kaplan-Meier curves with the overall survival of TGCA EAC patients at 30 months separated according to their values of expression of CD4 Tcm cells signature (on the left) and the Disease Free Survival ones of our cohort of total RNA Patients separated according to CD8 Exhausted expression score. P values were calculated using logrank test. C) Univariate Cox proportional hazards regression between the signatures, the main available clinical parameters used for the diagnosis of EAC and the OS of TCGA patients at 30 or 60 months of follow up; the size of the dots reflects the hazard ratio, the color the -log(p-value). D) Multivariate Cox regression analysis of early prognosis signature with M, N and histological grade parameters.
Disclaimer/Publisher’s Note: The statements, opinions and data contained in all publications are solely those of the individual author(s) and contributor(s) and not of MDPI and/or the editor(s). MDPI and/or the editor(s) disclaim responsibility for any injury to people or property resulting from any ideas, methods, instructions or products referred to in the content. |
© 2024 by the authors. Licensee MDPI, Basel, Switzerland. This article is an open access article distributed under the terms and conditions of the Creative Commons Attribution (CC BY) license (https://creativecommons.org/licenses/by/4.0/).
Copyright: This open access article is published under a Creative Commons CC BY 4.0 license, which permit the free download, distribution, and reuse, provided that the author and preprint are cited in any reuse.


