
Submitted:
16 June 2025
Posted:
17 June 2025
You are already at the latest version
Abstract
Concrete cracks and sulfate degradation severely compromise structural durability, highlighting the need for sustainable solutions to enhance longevity and minimize environmental impact. This study assesses the efficacy of bacterial self-healing technology utilizing Bacillus megaterium (BM) and Bacillus sphaericus (BS) in enhancing the resistance of concrete to sulfate attacks and improving its mechanical properties. Bacterial suspensions (1% and 2.5% of cement weight) were mixed with concrete containing silica fume or fly ash (10% of cement weight) and cured in freshwater or sulfate solutions (2%, 5%, and 10% concentrations). Specimens were tested for compressive strength, flexural strength, and microstructure (using SEM, EDS, and XRD) at various ages. Results indicated that 2.5% bacterial content yielded the best performance, with BM surpassing BS, enhancing compressive strength by up to 41.3% and flexural strength by 52.3% in freshwater-cured samples. Although sulfate exposure initially improved early-age strength by 1.97% at 7 days, it led to an 8.5% loss at 120 days. Bacterial inclusion mitigated sulfate damage through microbially induced calcium carbonate precipitation (MICP), sealing cracks, and bolstering durability. Cracked specimens treated with BM recovered up to 93.1% of their original compressive strength, promoting sustainable, sulfate-resistant, self-healing concrete for more resilient infrastructure.
Keywords:
Self-healing
; bacillus megaterium
; sulfate resistance
; MICP
; pozzolanic materials
1. Introduction
Sustainable building plays a crucial role in the modern community by focusing on reducing the environmental impact of construction processes while also addressing social and economic concerns associated with the construction industry [1,2,3,4]. Sustainable concrete is characterized by traditional concrete in its use of industrial, agricultural waste, or other resources [5]. Pozzolanic materials can be used to reduce the carbon footprint of concrete structures. that decrease the permeability of the concrete and, therefore, play a significant role in improving its durability and strength, lowering costs, and mitigating environmental effects in the manufacturing of building materials [6]. Pozzolan is defined as a siliceous or siliceous and aluminous material that, when mixed with lime and water, will set and harden like cement but has little or no binding property on its own. Amongst these can be found fly ash (FA), blast furnace slag (BFS), silica fume (SF), metakaolin (MK), rice husk ash (RHA), sugarcane bagasse ash (SCBA), wood ash (WA), and others [7].
Concrete is one of the most widely used building materials because of its superior mechanical properties, durability, and affordability when compared to alternative materials [8]. Concrete has a low tensile strength [9,10]. Several significant mechanical, physical, and chemical processes, such as shrinkage, external loading, temperature changes, and support settlement, can increase the local stress in concrete, leading to cracks in the structure of the concrete [11]. One of the unavoidable problems of concrete is cracking. Microcracks form and merge to form a continuous network of cracks in the concrete [12]. Cracks make the concrete more permeable, allowing moisture and aggressive substances like acids, sulfate, and chloride ions to seep in. Sulfate ions penetrate the cementitious matrix when concrete and cement mortars are exposed to a sulfate-loaded environment during their service life [13].The increasing sulfate ion concentration is transported into the concrete’s inside, where it interacts chemically with the hydrated cement products [14].
The primary cause of degradation in sulfate attack was shown to be a two-stage distress process on the concrete matrix. The first stage, known as chemical sulfate attack, is caused by the interaction of sulfate ions with portlandite (CH) to form gypsum, which then interacts with tricalcium aluminate (C3A) to produce ettringite precipitates in the pores of concrete. In the second stage, concrete swells, cracks, and spalls as a result of expanding forces linked to ettringite caused by high crystallization pressure [15]. Concrete is susceptible to damage from sulfate salt crystallization in this type of sulfate-induced degradation, known as physical sulfate attack (PSA) [16]. These factors destroy the concrete matrix, cause corrosion in the reinforcing, and shorten the lifespan of the structure [17].To extend the lifespan of concrete structures, many methods for maintenance and restoration have been developed.
Time has seen extensive usage of traditional techniques such as sealing, grouting, stitching, grouting, chemical injection, and carbon fiber reinforcement. However, these techniques have distinct drawbacks as they can be time-consuming, especially when dealing with larger or more complex cracks. Furthermore, inconsistencies in the traditional crack healing methods can be ascribed to a variety of factors, including labor skill, material quality, and ambient circumstances. Moreover, these techniques are ineffective for deep and tiny cracks and frequently fix large cracks [18].Repairing agents can be costly and environmentally dangerous [19].Moreover, using cement is necessary for the traditional process of concrete crack healing, which is responsible for increasing the footprint of carbon dioxide (CO2) [20].Lastly, traditional methods may need periodic maintenance and reapplication of healing agents to maintain long-term efficacy.
The attention of researchers is currently being attracted to self-healing concrete, which is thought to be a durable repair technique [21,22]. Concrete that heals itself has similar characteristics of the human body, including the ability for wounds and injuries to heal themselves without external intervention [23,24]. In the last ten years, research on self-healing cementitious composites has significantly increased. Two common self-healing methods are widely used for concrete self-healing: autogenous and autonomous. The autogenous technique aims to enhance the natural mechanism of crack healing. The capacity for autogenous healing is limited in every concrete structure [25]. This technique includes only the material's original components due to their specific chemical structure and promotes healing under environmentally favorable systems [21]. Furthermore, due to its inherent properties, concrete has micro-reservoirs with irregularly distributed unhydrated cement particles, which promote self-healing [26]. The French Academy of Sciences made the first observation of the autogenous self-healing technique in 1836, which was around 200 years ago [27,28,29,30,31,32,33,34,35]. Researchers have been examining the efficacy of this technique for repairing cracks in pipes, culverts, and other water infrastructure since the early 19th century [36,37,38].
The autonomous technique, on the other hand, aims to modify concrete by incorporating different healing agents into the concrete matrix to allow the crack to self-heal after it forms [39]. Unlike traditional approaches, this technique can save costs because the repairing agents are pre-buried in the concrete mixture and can automatically heal cracks as they appear [40]. Both techniques use calcium carbonate (CaCO3) material deposition onto the crack surface as their principal mechanism for promoting crack healing. Both artificial (autonomous) and natural (autogenous) processes can produce this substance. Furthermore, CaCO3 has a rough crystal morphology that exhibits a high propensity for surface adhesion and self-sustaining growth [40].
The bacterial-based method has demonstrated the most promising findings among all self-healing techniques because of its long-term efficacy [41,42,43].The capability of bacteria to convert vegetative bacterial cells into spores is responsible for this long-term effectiveness, which ensures viability for more than 200 years and is responsible for this prolonged efficiency in crack repair [44,45].Water ingress causes bacteria in a fresh crack to activate from their dormant state. They then multiply and precipitate minerals like calcite (CaCO3), which finally seals the crack. The bacteria enter a hibernation stage after the crack heals. A later-formed crack is filled by the bacteria when they have reactivated. As a result, bacteria have a healing effect that lasts for a long time. That process is called microbially induced calcium carbonate precipitation (MICP). Thus, there is a significant reduction in the penetration of moisture, other environmental agents, and aggressive chemicals into the concrete. Therefore, microbial self-healing concrete technology has become a research hotspot in recent years with the goals of (I) decreasing repair costs, (II) reducing environmental degradation, (III) enhancing concrete durability, and (IV) improving concrete properties [46,47,48].
Numerous abiotic and biotic factors can influence self-healing because it is a biological process [49,50]. Important biological parameters that influence bacterial growth include the number of cells, age, and the physiological state of the bacteria. Environmental factors like pH and temperature have an impact on these parameters [51]. For survival, most bacteria need a suitable pH and temperature, except spore-forming bacteria. Bacteria can only survive as spores in environments with pH values greater than 12; they cannot germinate in these conditions [52]. Normally, concrete has a pH of between 12 and 13 [53], but during mixing, the exothermic cement hydration causes the pH to rise to 13 and 90 °C, which may have an effect on bacterial survival and nutritional availability [53-55]. Different implementation approaches are needed to maintain microorganisms in concrete due to their short survival period and environmental influences. There are two suitable methods to improve the efficacy of self-healing bacteria: encapsulation or direct inclusion. It has been shown that encapsulation performs more effectively, particularly because of concrete's alkaline nature and temperature. However elevated pH values over 12 may reduce the efficiency of bacteria, and the process of concrete hydration may cause the number of bacteria to decrease [56]. The germination of bacteria may also be reduced by extended exposure to an alkaline environment. Carrier technology emerges as a solution to these problems. Investigation into carrier technologies is essential [56]. These technologies include zeolite, ceramsite, hydrogel, microcapsules, and lightweight aggregates. Furthermore, some methods may cause an unequal dispersion of self-healing factors since they have a relatively low density of the carrier relative to cement paste. Achieving a smooth integration of the self-healing concrete system requires the capsule's mechanical durability to endure internal forces during the mixing process.
Researchers have used various spore-forming bacillus strains, including Bacillus sphaericus [57,58,59], Bacillus pasteurii [60,61,62],Bacillus megaterium [63,64,65], and Bacillus Subtilis [66,67] to create self-healing concrete [68].The self-healing of cement-based materials may be enhanced by the use of many different nutrients, such as calcium acetate [69], sodium citrate [70], calcium formate [71], and other calcium acid salts like succinate, oxalate, malate, and glyoxylate [62].
Pooja Kanaujia et al. [72] studied the effects of variations in sulfate concentrations on the compressive strength, flexural strength, weight analysis, density loss, and visual appearance of concrete specimens of various grades as they deteriorated over time. The concrete grades M-25, M-30, and M-35 were utilized for experimental studies. Concrete samples were submerged in sulfate solutions with varying concentrations (4.0, 5.0, and 6.0 pH). As the concrete grade was raised from M-25 to M-35, a decrease in the loss of compressive strength was observed. The density and weight analysis findings further confirm flexural and compressive strength reduction. Concrete blocks showed signs of discoloration after being submerged in a sulfate solution at 4.0, 5.0, and 6.0 pH for 75 and 90 days. It looked like concrete flakes and resembled mold growth.
In their study, Arun Kumar Parashar et al. [73], provide an overview of the effect of different Bacillus family bacteria concentrations ranging from 100 CFU to 10^8 on concrete's durability and strength characteristics. It was concluded that bacterial presence in concrete enhanced its mechanical properties and decreased the permeability of water by filling in voids. Also, out of all the bacterial concentrations, the one with the most significant results was 10^5, cells/mL.
The effect of these microorganisms on the strength and durability of the concrete was investigated by Nidhi Nain et al. [74], using energy dispersive spectroscopy, split tensile strength, and compressive strength testing. Bacillus megaterium was the microorganism used, and its concentration was 10^8 cells/ml. According to the results, utilizing Bacillus megaterium bacteria in concrete enhanced its split tensile strength by 18.29% and its compressive strength by 22.58% compared to control concrete. The bacteria of the genus Bacillus megaterium provide concrete more strength and durability.
Joshi et al. [75], in their research, examined cement performance using exposure regimes in a sulfate environment for mortar prisms and concrete cubes. The calcium, urea, and nutritional broth medium concentrations were 25 mM w/v, 2% w/v, and 1.3% w/v, respectively. Compared to the control, the compressive strength of test types of cement treated and cured with bacterial solutions indicated BAT and BST increased. The test cement that was cured by spraying it with a bacterial solution showed a 16% increase in compressive strength, whereas the treated test cement showed a 35% increase compared to the control test cement.
Research Significance
This work involves a rigorous mechanistic investigation of sustainable self-healing concrete systems through systematic characterization of Bacillus megaterium and Bacillus sphaericus-induced calcium carbonate precipitation under sulfate-rich conditions utilizing high-end microstructural analysis (SEM-EDS-XRD) complemented by multiscale mechanical testing to quantitatively establish structure-property relationships among microbial metabolic activity, further innovating through the incorporation of industrial waste products (silica fume/fly ash) to create an optimized eco-efficient material system that addresses simultaneously three major gaps in current state-of-the-art research: (1) quantitative measurement of enhancement of sulfate resistance through biocementation, (2) partial understanding of stability of healing products under chemical attack, and (3) limited systematic study of recovery of mechanical properties for cracked as compared to uncracked conditions, thus providing both a fundamental understanding of microbial concrete chemo-mechanics and practical solutions for durable, eco-efficient infrastructure. This research examined the effect of bacteria type, content, curing type, and pozzolanic material type on self-healing properties using Bacillus megaterium and Bacillus sphaericus at 0%, 1%, and 2.5% by cement weight. Microstructural analysis was performed using SEM, EDS, and XRD, and the specimens' resistance to sulfate attack was also investigated.
2. Experimental Work
2.1. Experimental Outline
The main objective of the present work is to examine the effects of bacteria type, content, curing type, and pozzolanic materials type on self-healing properties using Bacillus megaterium and Bacillus sphaericus. Which was added with different contents (1% and 2.5% by cement weight). This section describes the materials used in concrete mixes, the casting method, the type and content of bacteria used, how to prepare them, and the conditions for curing concrete specimens. It also includes tests conducted on different concrete specimens. The experimental program included pouring 24 concrete mixes containing different pozzolanic materials (silica fume or fly ash) at a percentage of 10% by cement weight. The concrete specimens were treated with fresh water and sulfate solutions at different concentrations of 2%, 5%, and 10%, as shown in Figures 1, and 2. compression and flexural tests were conducted on concrete specimens loaded to failure at 7, 28, 56, and 120 days. compression tests were also performed on pre-cracked specimens at 65 % of ultimate load after the 28-day treatment period at 56 and 120 days.
Figure 1.
Outline of the experimental work.
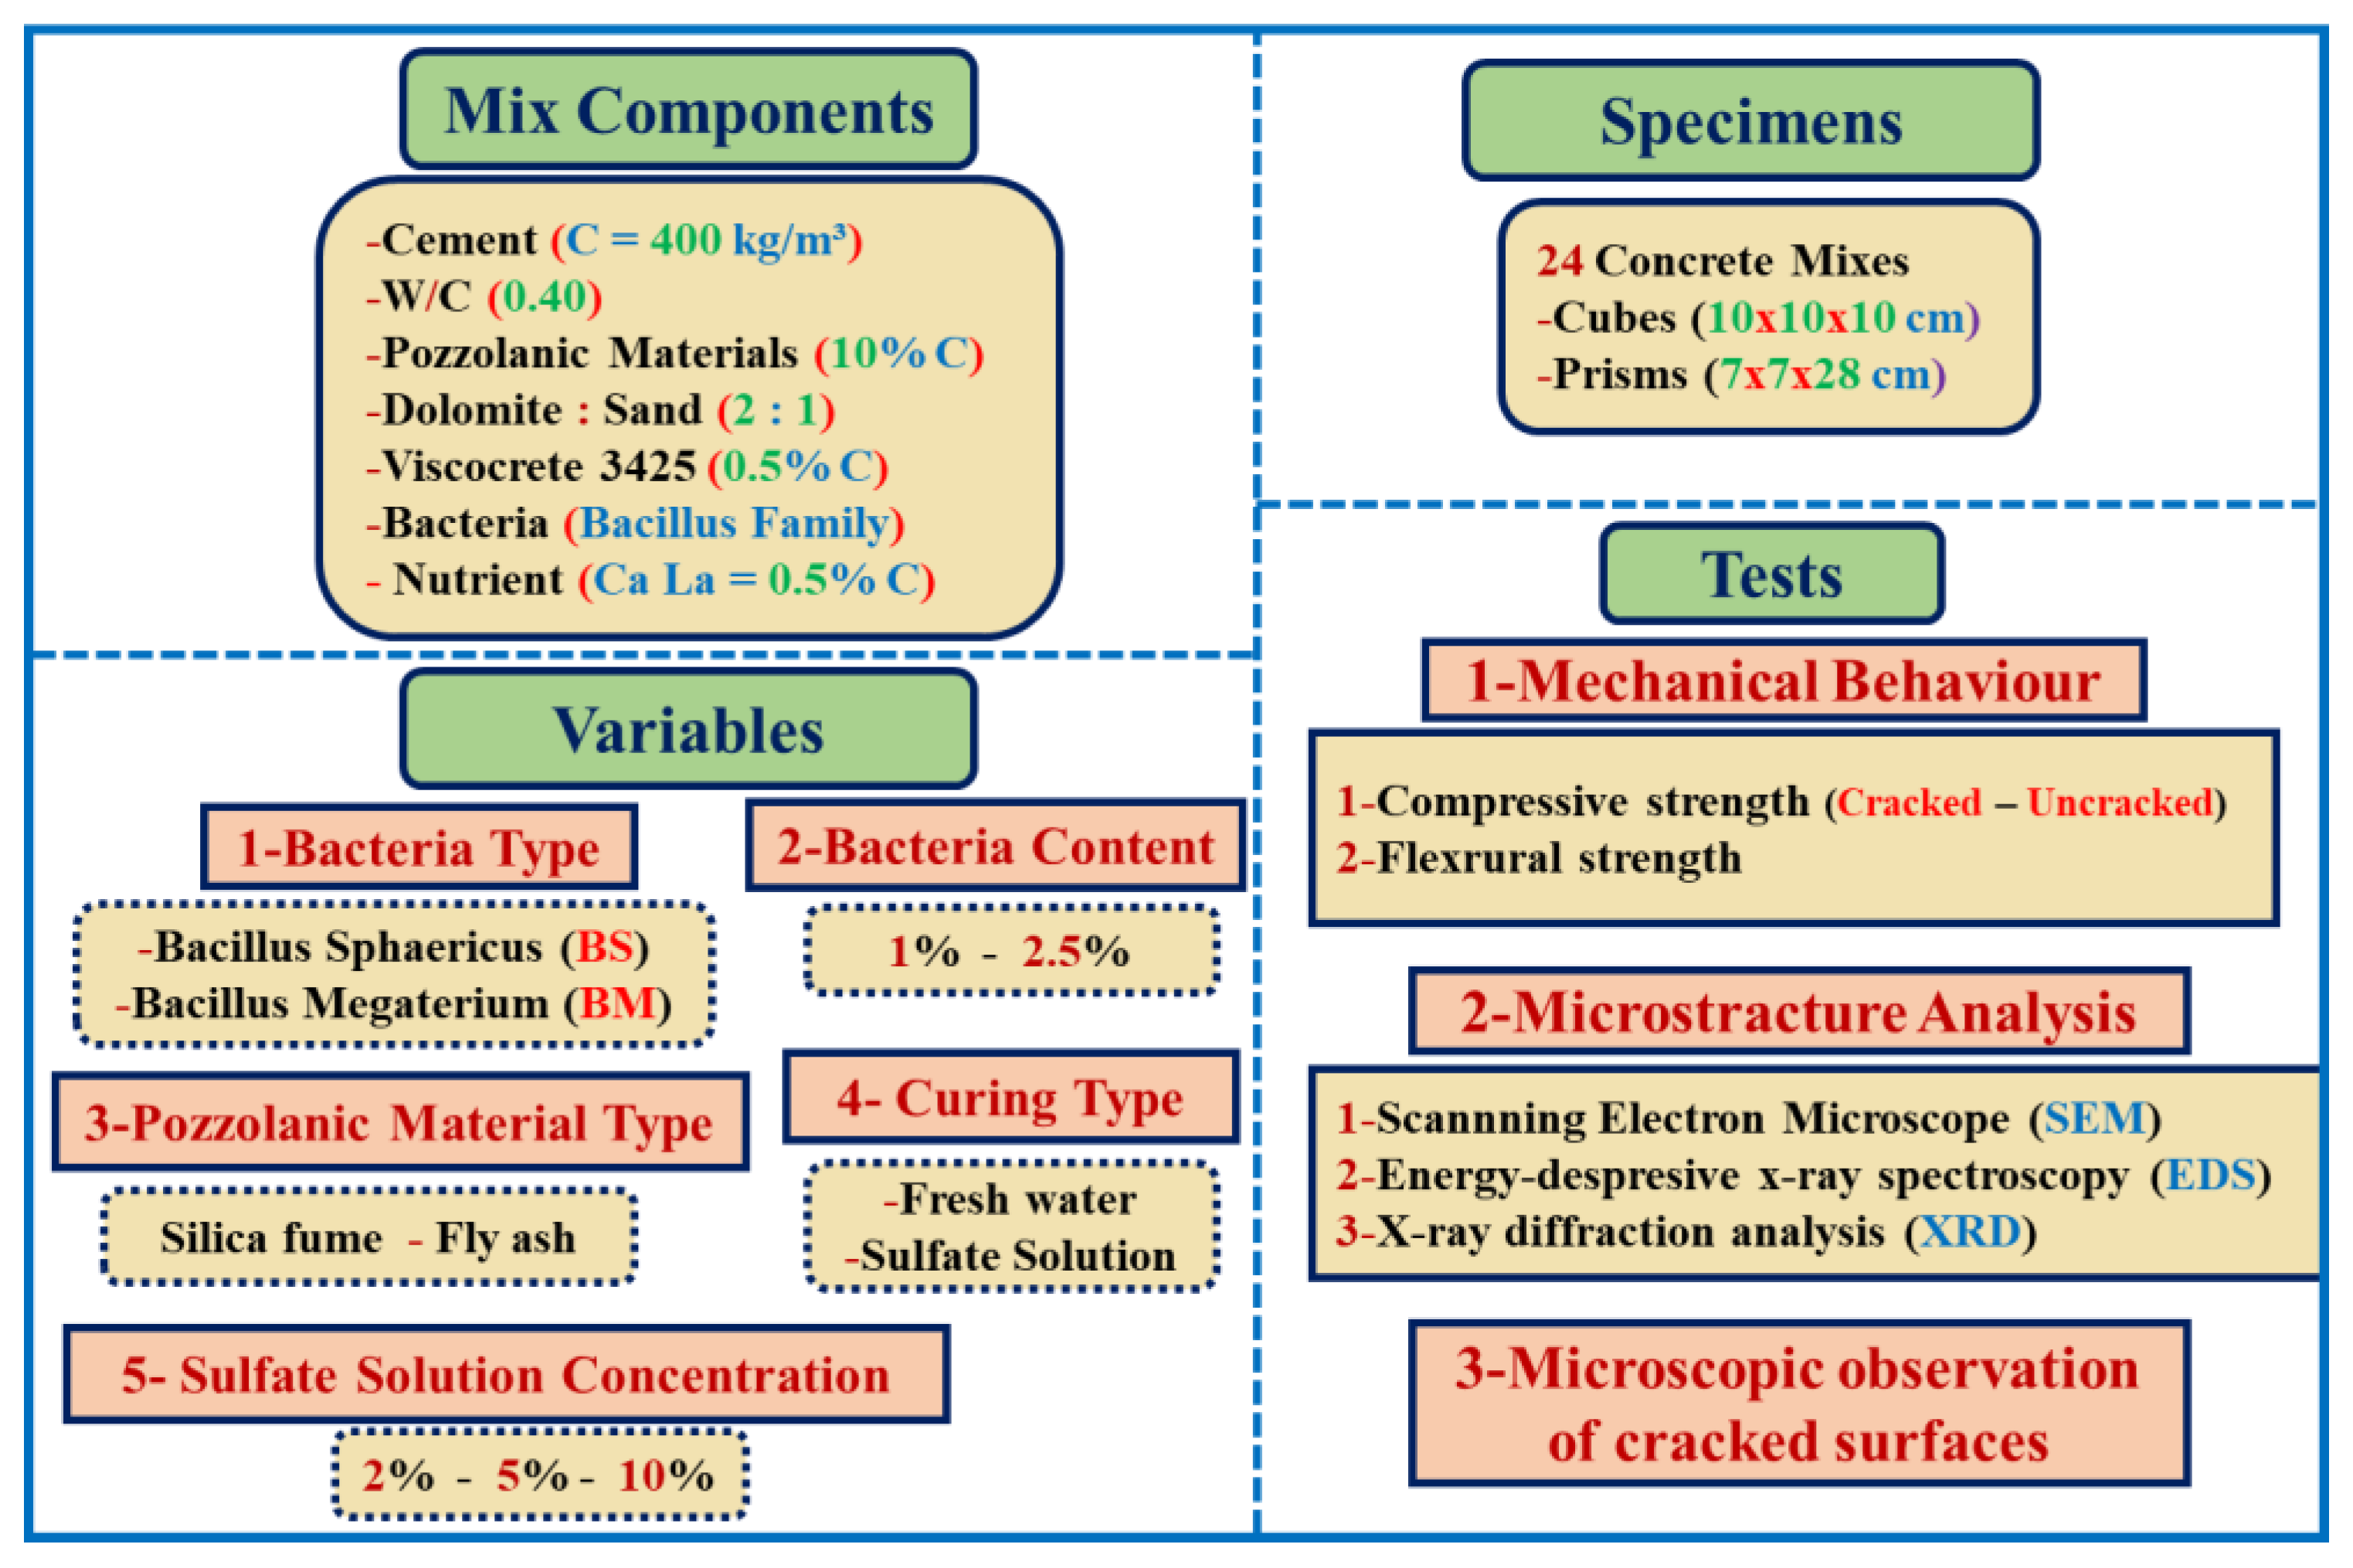
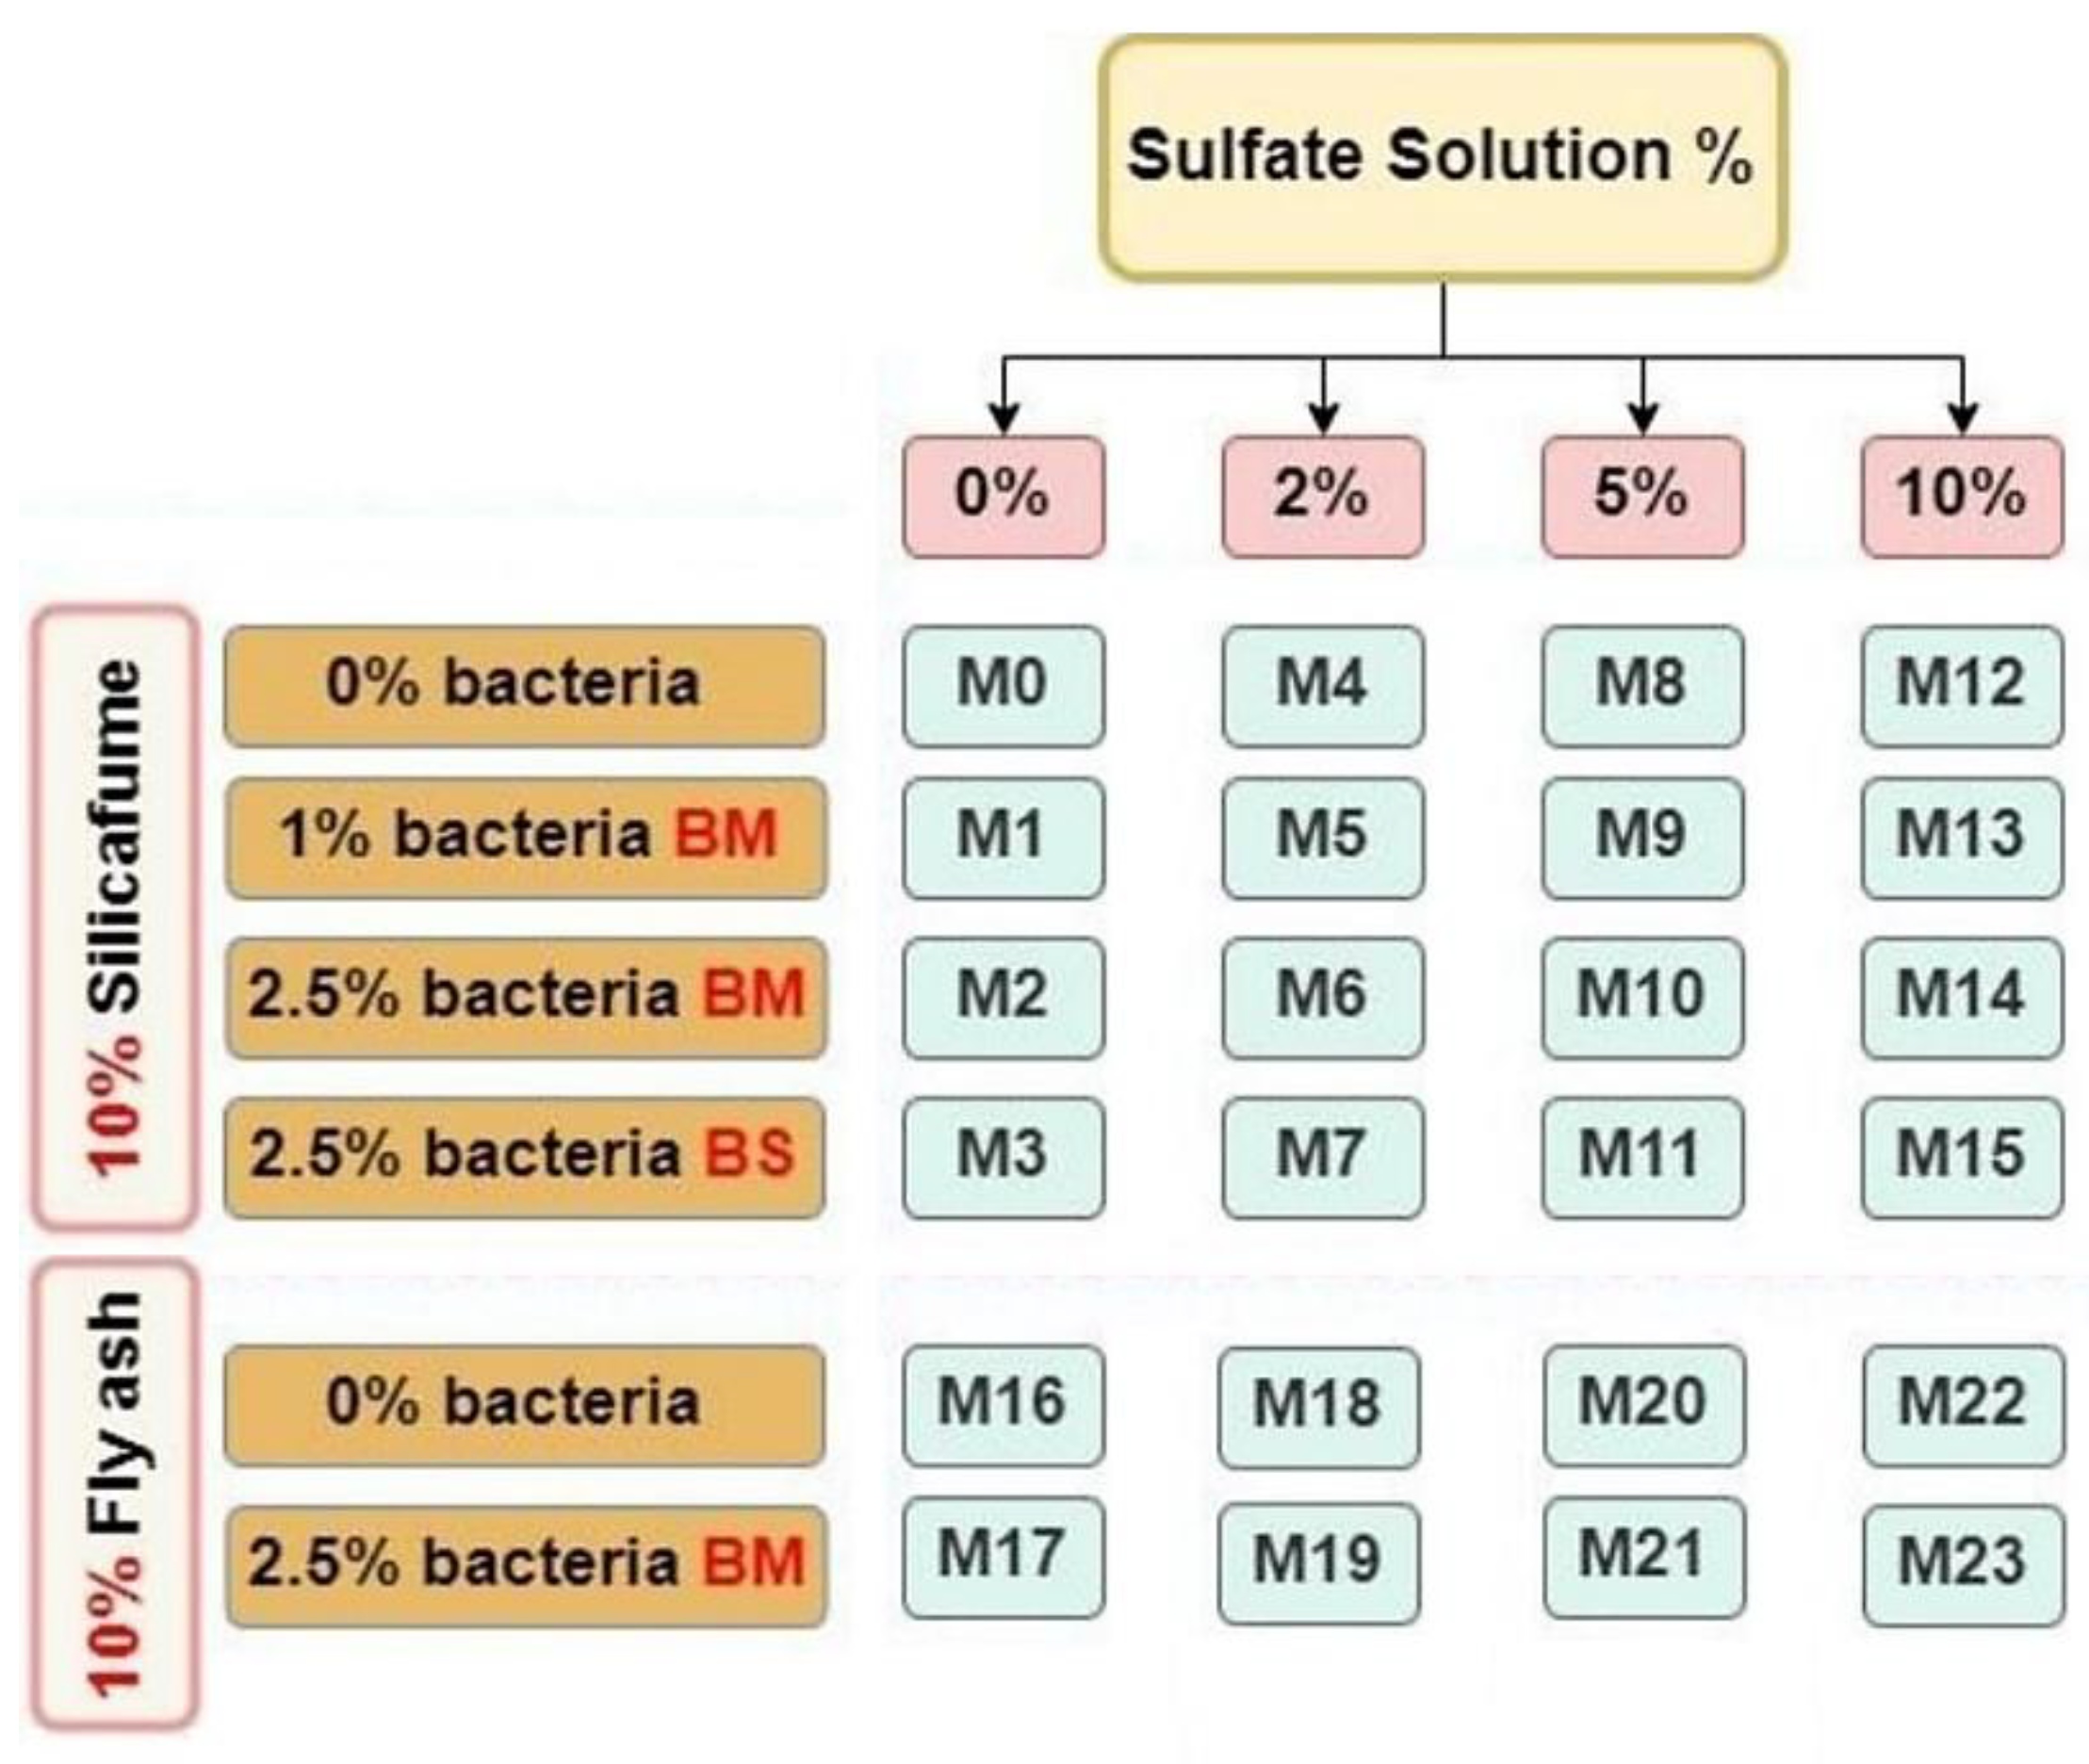
Figure 2.
Flow chart for concrete mixes, where M: Mix, BM: Bacillus Megaterium, and BS: Bacillus Sphaericus.
Figure 2.
Flow chart for concrete mixes, where M: Mix, BM: Bacillus Megaterium, and BS: Bacillus Sphaericus.
2.2. Materials
Ordinary Portland Cement (CEM-I 42.5 N) was utilized in this research, according to ESS 4756-1/2013 [76]. Table 1 shows the mechanical, chemical, and physical properties of cement. The cement content is 400 kg/m3 for all mixtures. Dolomite was used as coarse aggregate with a nominal maximum size of 10 mm, washed, and allowed to dry before use. Its specific weight was 2.81, and its bulk density was 1.66 t/m3. Locally available natural siliceous sand that had a specific weight of 2.49, a bulk density of 1.78 t/m3, and a fineness modulus of 2.65 was used as fine aggregate according to ESS 1109/2021 [77]. The sieve analysis results for the fine and coarse aggregates are shown in Figure 3. In the mixing process, clean drinking water was used. Fly ash and silica fume from Sika Egypt Company were brought in for use as a mineral admixture in this study. The physical properties of fly ash and silica fume used are described in the datasheet of the manufacturer, which is displayed in Table 2 and Table 3. For all mixtures, the silica fume and fly ash/cement ratio was 10% for all mixes. This study utilized a high-range water reducer superplasticizer concrete admixture called Sika Viscocrete-3425. This is a third-generation homogeneous concrete superplasticizer. According to ASTM-C-494-2020, types F and G meet superplasticizer requirements [78]. Table 4 displays the properties of the superplasticizers utilized in this research; the superplasticizer/cement ratio was 0.50%. The source of calcium lactate, which has the chemical formula C6H10CaO6, was Oxford Lab Fine Chem LLP. The ratio of cement to calcium lactate was 0.50%.

Table 1.
Physical, Mechanical, and Chemical Properties of Portland Cement.
| Properties | Composition of chemicals (%) | The mechanical and physical properties of Portland cement | |
|---|---|---|---|
| Property | results | ||
| Fe2o3 | 2.8 | Specific Gravity | 3.15 |
| Al2o3 | 3.4 | Specific surface area | 3550 |
| Sio2 | 21.24 | Initial setting time (min) | 150 |
| MgO | 3.1 | Final setting time (min | 250 |
| Cao | 63.2 | compressive strength 7-day (MPa) | 34 |
| compressive strength 28-day (MPa) | 55 | ||
Table 2.
Properties of Silica Fume.
| Property | Results |
|---|---|
| Color | Grey powder |
| Specific gravity | 2.2 |
| Composition | A latently hydraulic blend of active ingredients |
| Shape of particles | spherical (very small particles) |
| 170000 | |
| Bulk Density | |
| 8 |
Table 3.
Properties of fly ash.
| Property | Results |
|---|---|
| Color | Light grey powder |
| Specific Gravity | 2.23 |
| Composition | Alumina silicate |
| Shape of particles | Spherical |
| Surface area (cm2/gm) | 49700 |
| Bulk Density | 300 kg/m3 |
| Particle size, μm | 34 |
Table 4.
Properties of the superplasticizers used.
| Property | Results |
|---|---|
| Color | Clear liquid |
| Dry Material Content (%) | 40% by weight |
| Density (Kg/lt) | 1.08 |
| pH-Value | 4.0 |
This study used two ureolytic bacterium types from the Bacillus family, Bacillus Megaterium (BM) and Bacillus Sphaericus (BS), as indicated in Table 5. Both of these types of gram-positive bacteria were selected for the study since they do not have an adverse effect on human health. Through the mineralization process, Bacillus Megaterium and Bacillus Sphaericus can precipitate (CaCO₃) when provided with a calcium source. Both types are capable of producing spores that can survive harsh environments and activate in the presence of water. From the Microbiological Resources Centre (MIRCEN), Faculty of Agriculture, Ain Shams University in Egypt, Bacillus Megaterium and Bacillus Sphaericus were obtained. A bacterial suspension was used to replace the mixing water partially.
2.3. Growth of Bacterial Culture
The procedure described by Elmahdy et al. [79, 80] was followed to prepare the bacterial cell suspension. The bacterial stock is obtained from the Microbiological Resources Centre and stored in the fridge until used sterilely. To create the culture medium, thirteen grams of powdered nutritional broth were dissolved in one liter of distilled water, containing 5.0 g/l peptone, 5.0 g/l sodium chloride, 1.50 g/l yeast extract, and 1.5 g/l HM peptone B#. The pH was adjusted to 7.2± 0.2 for optimal Bacillus growth. All instruments were autoclaved before use, and Using an autoclave device, the container containing the culture media was sterilized at 121°C and a pressure of 1.5 bar for 20 minutes, then allowed to cool. This process ensured the media was contaminant-free. Using a loop, bacteria were extracted from the fridge and put into the growth media flask in an AURA HZ 48 laminar flow cabinet. The flasks were incubated for three days at 150 rpm and 30°C, resulting in turbidity that indicated bacterial growth and sporulation. After microscopic examination, bacterial cells were isolated and diluted appropriately with distilled water. Solid media recorded the bacterial colonies, diluted to a concentration of (2×10 to the ninth) CFU/ml. All activities were conducted at the Faculty of Veterinary Medicine, Zagazig University, Egypt. Figure 4 shows the basic steps for preparing a bacterial cell suspension.
2.4. Mix design and specimen preparation
The quantities of each ingredient required to produce 1 m3 of concrete were determined utilizing the absolute volume approach. Table 6 shows proportions of the concrete mixes. The ratio of dolomite to sand in all concrete mixes was 2:1 by weight, the ratio of fly ash and silica fume to cement was 10%, the ratio of water to cement was 0.4, the ratio of superplasticizer to cement was 0.50%, the ratio of calcium lactate to cement was 0.50%, and the cement content was 400 kg/m3. We added two ratios of bacteria (1% and 2.5% of cement weight) to the concrete. A portion of the mixing water was substituted with bacterial suspension, and The control mix specimens were prepared in the identical manner without the addition of bacteria.
All concrete mixtures have a specific mixing method that needs to be used sequentially. The dry materials (sand, dolomite, and cement) were thoroughly mixed in a mechanical horizontal pan mixer. The mix is combined at a low speed for two minutes after introducing the required quantity of fly ash or silica fume with calcium lactate. Then, water and superplasticizer are added to the mixture gradually, and it continues to mix for approximately five minutes to ensure that everything is uniformly distributed. Water is introduced to bacterial mixtures first, followed by adding BM or BS bacteria simultaneously. Then, in accordance with ASTM C-192/C192M, After pouring three layers of concrete into molds, the layers are compacted for thirty seconds using a mechanical vibrator [81]. The samples were taken out of their mold and began curing following a day of casting in order to get them ready for testing. All of the sample mixing stages are depicted in Figure 5.
2.5. Curing Procedure
The next day after pouring the concrete specimens, the molds were removed from the concrete specimens, and the mix type and casting date were written on each sample. Then the curing phase began, where the concrete specimens were immersed in different curing conditions with fresh water and magnesium sulfate solution at different concentrations (2%, 5%, and 10%). The specimens were removed from the curing water and left to dry according to the timing of conducting compression and flexural tests at the different ages of 7, 28, 56, and 120 days.
2.6. Creation of cracks
To identify the ultimate load in all mixes, cubic specimens measuring 100 x 100 x 100 mm were removed from the curing process after seven days of curing (three specimens were loaded till failure in each concrete mix) utilizing a hydraulic testing machine with a 2000 KN capacity. Nine cubes (three for loading until failure and six for cracking at 65% of the ultimate load) and two beams for loading till failure were extracted out of each mix after the 28-day treatment period. Visual inspection reveals minor cracks that appear in some loaded samples after loading, as shown in Figure 6. After that, the pre-cracked specimens were put back into the curing process, where bacteria started to precipitate calcium carbonate and seal the cracks. Six cubes (three without pre-cracking and three pre-cracking after 28 days) and two beams were extracted from each mix after 56 days of treatment and loaded till failure. The following samples have been extracted from each mix for loading until failure after 120 days of treatment: 6 cubes (3 cubes without pre-cracking and 3 cubes pre-cracking after 28 days).
A stereo-microscope equipped with the OLYMPUS SZ 61 camera system was utilized to visually monitor the healing and progression of cracks. In the experiment, artificial cracks that were measured in samples of varying sizes, as shown in Figure7 (a), with each specimen having a different crack width at 7 and 120 days of age. The experimental device that was used to visually measure the cracks is depicted in Figure 7 (b). The microscope was at the Faculty of Agriculture's Seed and Tissue Pathology lab at Mansoura University.
2.7. Compressive strength test
The compressive strength of concrete specimens was measured after 7, 28, 56, and 120 days from the date of casting in accordance with BS EN 12390-3:2019 [82]. At every age of testing, three 100 x 100 x 100 mm specimen cubes were evaluated for each concrete mix. The average value of three concrete specimens was calculated for each concrete mix. The mixes ' strength was determined utilizing a hydraulic testing machine with a 2000 KN capacity at various ages. in the engineering faculty's concrete lab at Zagazig University.
2.8. Flexural strength test
According to BS EN 12390-5:2019 [83], concrete flexural specimens were subjected to a three-point loading test on 70 × 70 × 280 mm concrete beams after 28 and 56 days of casting. The average of the concrete samples for each mixture was calculated. At different ages, the flexural strength of concrete mixes was determined by utilizing a hydraulic testing machine with a 1000 kN capacity in the concrete lab of the engineering faculty at Zagazig University.
2.9. Microscopic analysis tests
SEM is used to examine sample surfaces because it provides a clear, high-quality stereoscopic image with extensive information about the sample's microstructure. The effect of biological calcium carbonate precipitation on the concrete sample was investigated using SEM. The test was performed in Egypt at the Faculty of Agriculture at Mansoura University with an electronic microscope type JEOL JSM-651OLVthat has a magnification of 300,000x. To examine the samples, different magnifications were used, including 4000Xand 5000X. The following details explain the sample preparation process: concrete specimens were obtained from the cracked specimens' deepest core following a compressive strength test at 120 days of age. These samples were placed on holders using carbon adhesive after being dried at 70°C until they achieved a constant weight. The dried specimens were coated with gold using a sputter coating evaporator to increase clarity and microstructure surface imaging. The elements of the precipitation of specimens were determined using the Oxford X-Max 20 EDS device, which was connected to the SEM.
X-ray diffraction examined the anhydrous and hydrated cement phases at 120 days to analyze and examine cementitious materials. The specimens were carefully pulverized utilizing a tubular aerosol suspension chamber and were then put on glass fiber filter paper. The experiment was conducted at the Housing and Building National Research Center using the Philips X’ Pert Pro Diffractometer MPD PW 3050/60.
3. Results and Discussion
3.1. Specimens Without Pre-Cracking
3.1.1. Compressive Strength
Figure 8, Figure 9, Figure 10, Figure 11, Figure 12 and Figure 13 present the compressive strength results of specimens without pre-cracking at 7, 28, 56, and 120 days, which examine the effects of bacterial content and type, pozzolanic material type, and curing type. The impact of bacterial content on self-healing concrete's compressive strength after being cured in freshwater and sulfate solution with different concentrations at different ages is shown in Figure 8 and Figure 9. The compressive strength of the bacterial mixes increased compared to the control mixes at ages 7, 28, 56, and 120 days when concrete samples were cured in freshwater and sulfate solution at different concentrations of 2%, 5%, and 10%. The compressive strength of mix M1, which is a 1% bacteria BM, increased by 7.52%, 7.81%, 9.71%, and 11.3% compared to the control mix M0. The compressive strength of mix M2, which contains 2.5% bacteria BM, was increased over the control mix M0 by values of 19.09%, 26.91%, 37.41%, and 41.3%, respectively. The compressive strength of mix M3 containing 2.5% bacteria BS increased over the control mix M0 by 11.23%, 20.55%, 31.63%, and 37.39%, respectively. According to previous findings, concrete samples with a bacteria content of 2.5% achieved the best compressive strength results. The higher the bacterial content, the higher the compressive strength. The use of bacteria has a positive effect on increasing the compressive strength of the samples. The reason for the increase in compressive strength is the precipitation of calcium carbonate, which fills the pores in concrete and causes the size of the pores to decrease. [84-86].
As illustrated in Figure 10, the type of bacteria (BM and BS) employed in this study has an effect on the compressive strength behavior under different environmental conditions and ages for uncracked specimens. The compressive strength at 7, 28, 56, and 120 days was 19.09, 26.91, 37.41, and 41.3% higher for the mix M2 containing 2.5% bacteria BM than that of the control mix M0, respectively. Comparing M3, which contained 2.5% of BS bacteria, to the control mix M0, compressive strength increased by 11.23%, 20.55%, 31.63%, and 37.39%. The compressive strength of concrete changed noticeably according to the type of bacteria present. Results for the Bacillus megaterium type generally show a more noticeable improvement than those for the Bacillus sphaericus type. Bacillus megaterium enhanced the production of CaCO₃ to fill voids, which caused a great improvement in compressive strength. The main cause of the higher compressive strength seen in BM mixes over others is the higher content of CaCO₃. [79, 87, 88].
Mineral admixtures can be added to concrete to enhance the compressive strength. The type and ratio of mineral admixtures to choose from to improve the quality of construction in concrete are important considerations. [89]. In this study, we used mineral admixtures, including fly ash (FA) and silica fume (SF). They are industrial by-products. According to previous studies, the amount of 10% of fly ash and silica fume has a greater effect on the strength of concrete.
As shown in Figure 11, the compressive strength of control mix M0, which includes 0% bacteria with silica fume, increased by 7%, 10.74%, 11%, and 6% at different ages, in comparison to control mix M16, which contained 0% bacteria with fly ash. The compressive strength of mix M2, which includes 2.5% bacteria BM with silica fume, showed increases of 6.19%, 8%, 9.31%, and 4.6% at 7, 28, 56, and 120 days, respectively, when compared to mix M17, which contained 2.5% bacteria BM with fly ash. It is evident that the outcomes showed the same trend for the mixtures treated with sulfate solution at different concentrations. Under different environmental conditions at various ages, silica fume generally shows a more noticeable improvement in results than fly ash because of its high reactive pozzolanic property, large surface area, high SiO₂ content, and fine particles; then it fills the pores of concrete and reduces porosity [90]. The primary cause of strengthening the bond between cement paste and aggregate is the use of silica fume to enhance the strength of concrete. Cement hydration product Ca(OH)₂ can react with silica fume to produce a C-S-H gel with higher strength [91]. Fly ash participates in the secondary cement hydration process and produces fewer cement hydration products in the early stage due to its low activity. In the early stage, there is less chemical reaction, which causes the concrete's compressive strength to decrease. In the later stage, as cement hydration products continue to form, the pozzolanic reaction is accelerated and promoted, significantly boosting the final strength of concrete [89].
Figure 12 and Figure 13 illustrate the effect of curing type on the compressive strength of concrete, demonstrating the significant impact of the curing environment on compressive strength. In the early stages, the compressive strength of the bacterial and control samples increased marginally when exposed to sulfate.
In comparison to control mix M0, which was cured in freshwater, the compressive strength of control mix M8, which was cured in a 5% sulfate solution concentration, increased by 1.97% at 7 days as a result of the continuous penetration of sulfate ions into the cementitious matrix. The production of expansive compounds such as gypsum, CaSO₄·2H₂O, and ettringite, which aid in filling holes and voids and so increasing microstructural density, is responsible for this increase in compressive strength [92, 93]. When comparing the samples cured in freshwater to those exposed to sulfate solution for later ages, a gradual decrease in strength was observed. The compressive strength of control mix M8, which was cured in 5% sulfate solution concentration, decreased by 7.51%, 8.23%, and 8.5% compared to control mix M0, which was cured in freshwater at 28, 56, and 120 days, respectively. This strength loss could be a consequence of increased sulfate penetration, leading to more expansion products accumulating in the pores of the samples. A slight improvement in compressive strength of 3.14% in M6, which contains 2.5% bacteria BM and is cured in 2% sulfate solution concentration, was observed when compared with M2, which includes 2.5% bacteria BM and is cured in freshwater at 7 days, and then a gradual decrease of 3.96%, 4.04%, and 5.69% in strength was observed at 28, 56, and 120 days, respectively.
The bacterial samples did not exhibit a significant decrease in strength when exposed to sulfate, indicating that the bacteria are effective in mitigating the negative effects of sulfate by precipitating calcite, which fills the pores in the concrete. Sulfate ion penetration into the cementitious matrix was thereby greatly decreased. The formation of harmful reaction products that can lead to concrete deterioration was also reduced by the minimum infiltration of sulfate ions. A similar conclusion is reached by other researchers [75]. The compressive strength of mix M10, which contains 2.5% bacteria BM, increased by 24.48%, 28.2%, 37.49%, and 41.46% at different ages, as compared to the control mix M8 at a 5% sulfate solution concentration. The results showed that adding bacteria to concrete improved its compressive strength under different curing conditions, demonstrating the positive effect of bacterial activity.
3.1.2. Flexural strength
The flexural strength results for specimens without pre-cracking are presented in Figure 14, Figure 15, Figure 16, Figure 17, Figure 18 and Figure 19. The flexural strength tests were conducted on several mixes of various pozzolanic materials, bacterial contents, and types at 28 and 56 days under different environmental conditions.
The effect of bacterial content on the flexural strength results for uncracked specimens at 28 and 56 days is illustrated in Figure 14 and Figure 15. The mix M1, which included 1% bacteria BM, had a flexural strength that was 15.85% higher at 28 days and 17.32% higher at 56 days than the control mix M0 when cured in freshwater. In comparison to M0, the flexural strength of M2 increased by 51.83% and 52.31% when using 2.5% bacteria BM, and the flexural strength of M3 increased by 49.39% and 50.23% when using 2.5% bacteria BS. According to previous results, a bacterial content of 2.5% gives the highest flexural strength results by increasing the amount of CaCO₃ that precipitates, which improves flexural strength. [94, 95].
According to Figure 16, the results indicate that the flexural strength changes with variations in bacterial type from BM to BS. The flexural strength of BM types generally has better performance than that of BS types. At 2% sulfate, M6 used 2.5% bacteria BM, which improved flexural strength by 52.42% and 54.34% compared to the control mix M4, and M7 used 2.5% bacteria BS, which increased flexural strength by 50.31% and 52.43% compared to the control mix M4 at 28 and 56 days, respectively. When compared to the control mix M12 at 28 and 56 days, respectively, the flexural strength of M14 increased by 57.67% and 58.41%, which contains 2.5% bacteria BM, and the flexural strength of M15 increased by 53.56% and 54.24%, which contains 2.5% bacteria BS at 10% sulfate. These results, depending on the mechanical properties of compressive strength and flexural strength, demonstrate that BM is the best because it produces more CaCO₃, which fills voids and enhances mechanical properties.
The effect of pozzolanic material type on the difference in flexural strength results of uncracked specimens at 28 and 56 days is shown in Figure 17. At 5% sulfate, the flexural strength of the control mix M8, which contains 0% bacteria with silica fume, is increased more than that of the control mix M20, which includes 0% bacteria with fly ash, by 3.43% and 4.71% at 28 and 56 days. Compared to mix M21, which contained 2.5% bacteria BM with fly ash, the flexural strength of mix M10, which includes 2.5% bacteria BM with silica fume, increased by 4.76% and 4.86% at 28 and 56 days, respectively. At 10% sulfate, compared to the control mix M22, which contains 0% bacteria with fly ash, the flexural strength of the control mix M12, which includes 0% bacteria with silica fume, increased by 3.84% and 5.07% at 28 and 56 days, respectively. Compared to M23, which contains 2.5% bacteria BM with fly ash, the flexural strength of M14, which includes 2.5% bacteria BM with silica fume, increased by 4.73% and 4.92% at 28 and 56 days, respectively.
Confirming that in the flexural strength test, the effect of silica fume was still higher than that of fly ash. Due to their finer particles than cement grains, silica fume particles may efficiently fill the micro-voids in bulk paste and the transition zone. As a result, the microstructure becomes denser due to enhanced physical packing, and because of its high silicon dioxide content and extreme fineness, silica fume is extremely reactive and easily participates in pozzolanic reactions. Moreover, the accelerated pozzolanic reaction and efficient micro-filling action of silica fume result in improved bond strength between the paste and aggregate. On the other hand, the fly ash did not significantly improve the properties of concrete as silica fume did because of its weak pozzolanic activity and insignificant micro-filling ability.
Figure 18 and Figure 19 depict the flexural strength reduction of concrete specimens cured in various sulfate concentrations compared to the concrete specimens cured in freshwater. The flexural strength of control mix M8 cured in a 5% sulfate solution concentration decreased by 4.59% at 28 days and 5.35% at 56 days compared to control mix M0 cured in freshwater. The M12 control mix flexural strength, which was cured in a 10% sulfate solution concentration, showed a greater decrease than the M0 control mix cured in freshwater by 12.33% and 12.91% at 28 and 56 days, respectively. The main reason for strength loss is the diffusion of SO₄²⁻ ions into the concrete pore structure, which then reacts with the hydrated products to form ettringite. The volume of the solid phase is greatly increased by the formation of ettringite. The needle-like nature of ettringite crystals causes significant stress, which results in macroscopic manifestations such as concrete expansion and cracking, with a few coarse cracks appearing on the surface. However, the bacterial specimens performed extremely well when exposed to sulfate. The biogenic precipitation of CaCO₃ crystals significantly decreased sulfate ion access inside the cementitious matrix. In the presence of bacteria, the flexural strength of mixes M1, M2, and M3 increased by 15.85%, 51.83%, and 49.39% at 28 days and 17.32%, 52.31%, and 50.23% at 56 days, respectively. The flexural performance of the concrete appears to be improved by the addition of bacteria, possibly as a result of the bacteria's ability to repair microcracks.
3.2. Specimens with Pre-Cracking
3.2.1. Compressive Strength
The compressive strength of uncracked and pre-cracked concrete specimens cured in freshwater and sulfate solution, with different pozzolanic materials and variable bacterial content and type, at 56 and 120 days, is displayed in Figure 20, Figure 21, Figure 22, Figure 23, Figure 24, Figure 25, Figure 26, Figure 27, Figure 28, Figure 29, Figure 30 and Figure 31.
The effect of bacterial content on the compressive strength of pre-cracked specimens in comparison to uncracked specimens treated in fresh water and sulfate solution at 56 and 120 days is depicted in Figure 20, Figure 21, Figure 22 and Figure 23. When the bacteria content increased to 1.0% BM, 2.5% BM, and 2.5% BS for mixes M1, M2, and M3, the compressive strength of pre-cracked specimens undergoing freshwater curing increased significantly, increasing by 57.51%, 106.62%, and 96.72% at 120 days, respectively, in comparison to the sample without any bacteria. This suggests that bacteria play a crucial role in enhancing the healing of cracks and restoring the mechanical properties of concrete. This trend was also observed in specimens cured in a sulfate solution.
For instance, at 56 days, the compressive strength of the reloaded cracked samples was 57.33%, 81.19%, 92.10%, and 89.45%, respectively, compared to the unloaded samples. At 120 days, it was 63.70%, 90.14%, 93.14%, and 91.20%, respectively, in mixes M0, M1, M2, and M3. As the bacterial content increases due to the increase in CaCO₃, the recovery ratio of the compressive strength after reloading on pre-cracked specimens in comparison to uncracked specimens of the same mix increases, as shown in [64, 96, 97].
Figure 24 and Figure 25 illustrate how the type of bacteria affects the compressive strength of pre-cracked specimens in comparison to uncracked specimens treated in fresh water and sulfate solution at 56 and 120 days. In comparison to uncracked specimens of the same mix at 56 and 120 days, the compressive strength test results for the reloaded cracked specimens containing bacteria BM showed an increase in strength over the specimens containing bacteria BS.
The compressive strength of reloaded cracked specimens utilizing bacteria BM at a 2% sulfate solution is 91.89% and 92.78% of the ultimate compressive strength at 56 and 120 days, respectively, for M6. Reloaded cracked specimens with bacteria BS have a compressive strength of 89.28% and 90.75% of ultimate compressive strength at 56 and 120 days, respectively, for M7. According to the results, Bacillus Megaterium belongs to the Bacillus family and has the ability to reduce voids and increase compressive strength. The bacterial colonies that form and the precipitation of calcite that fills the voids in the concrete, which enhances the density of the concrete, are the causes of the increase in compressive strength. Additionally, the calcite precipitation caused by bacteria and the layer of calcite deposited on the sample surface fill the pores in the concrete. [65, 87, 98, 99].
Continuous hydration was the main mechanism 56 days after the casting date, when the pozzolanic reaction had been finished, because the concrete had a considerable portion of unhydrated particles of cement at the early stages. [100]. In comparison to uncracked specimens of the same mix at 56 and 120 days, the results showed that the reloaded cracked specimens containing silica fume had higher compressive strength than those containing fly ash, as shown in Figure 26 and Figure 27.
The effect of healing on cracking specimens at 0% sulfate at various ages is shown in Figures 26(A), and 27(A). The ratio between (Fcu crack)/(Fcu ult) for the control mix M0, which includes 0% bacteria with silica fume, is 57.33% at 56 days and 63.70% at 120 days. At 56 and 120 days, the ratio between (Fcu crack)/(Fcu ult) is 56.98% and 63.23%, respectively, for the control mix M16, which includes 0% bacteria with fly ash. Furthermore, the ratio for mix M2, which includes 2.5% bacteria BM with silica fume, is 92.10% at 56 days and 93.14% at 120 days, respectively. Lastly, the ratio between (Fcu crack)/(Fcu ult) is 91.41% and 92.53% at 56 and 120 days for mix M17, which includes 2.5% bacteria BM with fly ash.
The effect of curing type on the compressive strength of cracked samples compared to uncracked samples cured in both fresh water and sulfate solution at 56 and 120 days is depicted in Figure 28, Figure 29, Figure 30 and Figure 31. In comparison to uncracked specimens of the same mix at 56 and 120 days, the compressive strength of the reloaded cracked specimens decreases as the concentration of sulfate solution increases when curing in different sulfate concentrations. Because of the reaction between 〖〖SO〗_4〗^2and the hydration products in the hardened cement paste produce expansive ettringite.
For instance, as shown in Figure28(A), the compressive strength of the pre-cracked specimens in comparison to uncracked specimens was 57.33%, 55.63%, 53.49%, and 49.37% for mixes M0, M4, M8, and M12 at 56 days, and 63.70%, 62.52%, 60.02%, and 57.27% at 120 days, respectively. The results also showed that compared to the specimens without pre-cracking, the reloaded cracked specimens, which contain bacteria, had higher compressive strength than those without bacteria when exposed to sulfate. The compressive strengths of the reloaded cracked specimens were 55.63% and 91.89% for mixes M4 and M6 at 56 days, 62.52% and 92.78% at 120 days, respectively, in comparison to the uncracked specimens, indicating the effectiveness of bacteria in reducing the adverse effects of sulfate resulting from calcite precipitation.
3.3. Scanning Electron Microscope (SEM)
Scanning Electron Microscopy (SEM) was employed to elucidate the microstructural evolution of the concrete mixtures, providing crucial information regarding the impact of bacterial activity, pozzolanic additions, and sulfate exposure on the density, durability, and self-healing potential of the matrix. Figure 32 and Figure 33 illustrate the findings using 4000X and 5000X magnifications to verify the precipitation of calcite. The control samples, without bacteria, M0 using silica fume and M16 using fly ash, possess porous microstructures with well-defined micro-cracks and voids. The presence of evidence for hydration products like Calcium Silicate Hydrate (C-S-H) and Calcium Hydroxide (CH) but the lack of calcite indicates the presence of continuous hydration but no biomineralization, and the poor Interfacial Transition Zones (ITZ) indicate mechanical weakness along with ineffective self-healing.
In the presence of bacteria, as in M2, M3, and M17, a miraculous change is observed. These mixes not only show hydration products but also extensive calcite reservoirs and typical bacterial presence voids, which suggest microbial-induced calcite precipitation (MICP). The presence of calcite helps fill micro-voids and seal micro-cracks, densifying and hardening the matrix [101-104]. In particular, Bacillus megaterium (BM) and Bacillus subtilis (BS) were equally effective in achieving densification but with remnants of micro-cracking. The presence of silica fume or fly ash with bacterial activity enhances the pozzolanic reaction and self-healing property, and therefore, such mixes are better in the structural sense compared to the respective control mixes.
Under sulfate exposure, control specimens M8 and M20 without bacteria form ettringite- and calcium sulfate (CaSO₄)-dominant microstructures with residual porosity and cracking. These anticipated sulfate reaction products are expansive and can be detrimental to long-term durability. However, the presence of bacteria in sulfate-exposed mixes, such as M10, M11, and M21, is revealed by SEM micrographing to co-occur with ettringite and bacterially precipitated calcite. The pores and cracks are filled with calcite even in the case of sulfate attack, indicating that bacterial action minimizes sulfate-induced damage to a certain level. Though the sulfate attack still progresses, densification resulting from MICP and increased C-S-H growth, especially in the case of silica fume or fly ash, demonstrates greater resistance to degradation.
Generally, SEM analysis reveals that bacterial ingestion, especially with sulfate, induces concrete matrix healing and densification. It significantly enhances microstructural integrity compared to control mixes. When mixed with supplementary cementitious materials, such as silica fume or fly ash, it enhances hydration, reduces porosity, and slows sulfate attack, with the potential for long-term self-healing properties in concrete.
3.4. Energy-Dispersive X-ray Spectroscopy (EDS)
EDS analysis provides valuable insights into the chemical composition and microstructural characteristics of self-healing concrete mixes, particularly when subjected to sulfate, which simulates extreme environmental conditions. Figure 34 displays the EDS test findings. As far as that is concerned, the calcium-to-silicon (Ca/Si) ratio is a convenient indicator of the quality and kind of resulting hydration products formed, especially the all-important calcium silicate hydrate (C-S-H) gel responsible for strength development and durability. Also, Ca/Si ratio values that are too high are said to indicate the existence of excess calcium phases, which would be unfavorable to mechanical strength and durability. [97, 105]. In situations where the concrete is exposed to contact with solutions of sulfates, such as in mixes indicated by additions of sulfate, the foreign sulfates would react with calcium hydroxide and other hydrating phases to produce expansive forms such as ettringite and gypsum. The reaction can add more Ca to the matrix or cause low-density, poor structures, thereby affecting both mechanical performance and durability.
For analysis of the control mix with silica fume (M0), the Ca/Si ratio is 3.634, which implies that while the pozzolanic reaction of silica fume with calcium hydroxide, free calcium is not fully utilized, and some is present in portlandite or secondary product form. As Bacillus sphaericus is added to M3, the Ca/Si ratio decreases to 2.701, which shows greater utilization of free calcium, likely due to microbial-induced calcium carbonate precipitation (MICP), which leads to densification of the matrix. However, for mix M11 using 2.5% of Bacillus Sphaericus and silica fume exposed to sulfate attack with a 5% sulfate solution, the Ca/Si ratio increases significantly to 5.984. This jump indicates that the ingression of sulfate promotes the formation of structurally suboptimal but calcium-rich phases, thereby eliminating the potentially beneficial effects of MICP and silica.
Similarly, in the Bacillus megaterium series, mix M2 using 2.5% of Bacillus Megaterium and silica fume has a low Ca/Si ratio of 1.948, which reflects highly effective pozzolanic as well as microbial activity under non-aggressive conditions, which is likely to be a dense and strong C-S-H matrix. When exposure to sulfate is introduced in M10 using 2.5% of Bacillus Megaterium and silica fume, the Ca/Si ratio is 5.323. In this case, it is seen that while BM still causes some healing, the exterior's sulfate ions dominate the matrix to form expansive and less cohesive compounds. Also, for mix M21, using 2.5% of Bacillus Megaterium and fly ash has an even higher Ca/Si ratio of 6.906, which means that in the state of sulfate attack, the more delayed reactivity of fly ash is not sufficient to encrust the increasing calcium adequately.
Surprisingly enough, the sulfate-free control mix with fly ash mix M16 has a Ca/Si of 5.232, and the same components exposed to sulfate in mix M20 jump significantly to 8.104. This sharp increase testifies to the vulnerability of fly ash-based materials to sulfate attack in the absence of other microbial additives. For comparison, M17 using 2.5% Bacillus megaterium and fly ash, unexposed to sulfates, possesses a comparatively low Ca/Si ratio of 2.188, which attests to the beneficial role played by BM to enhance hydration and prevent free calcium accumulation.
3.5. X-Ray Diffraction Analysis
X-ray diffraction (XRD) was performed to analyze the mineralogical composition and crystalline phases of self-healing concrete of varying types of bacteria, pozzolanic material, and sulfate exposure. The diffraction patterns of XRD are depicted in Figure 35 between the control and bacteria specimens at the age of 120 days regarding the mixes M0, M2, M3, M8, M10, M11, M16, M17, M20 and M21. Quartz, calcite, and dolomite are the prominent crystalline phases found in all mixes. The minerals reflect hydration behavior, microbial-induced calcium carbonate precipitation (MICP), and the influence of pozzolanic reactions and sulfate exposure.
High quartz content (51%) and a prevailing dolomite peak (43%) and low calcite content (6%) are found in control mix M0 without bacteria, using silica fume and subjected to fresh water curing. The blend here is an expression of ordinary hydration reaction and pozzolanic activity where C-S-H gel formation prevails over widespread crystalline calcite formation. With the inclusion of 5% sulfate solution curing, as in control mix M20 using fly ash, calcite content is very low at 3%, and it indicates that sulfate could be inhibiting the growth of calcite or enabling the growth of other secondary products, although none were identified as major peaks.
In Mix M2, when using 2.5% of Bacillus Megaterium and silica fume, calcite is supplemented remarkably to 20%, with 35% dolomite and 45% quartz, which demonstrates a remarkable MICP effect. This has also been observed in mix M17 with the same contents but using fly ash, wherein there is calcite (17%) and dolomite (40%). The results indicate that Bacillus Megaterium is able to induce calcium carbonate precipitation efficiently, in particular in sulfate-free conditions and independent of the type of pozzolanic material. Furthermore, mix M2, which contains 2.5% bacteria BM has several peaks for quartz and calcite in Fig. 35 (B). One possible explanation for its apparent increased strength in comparison to the control mix M0 is more calcite. It suggests that bacteria may have an impact on the production and availability of these minerals, which might lead to greater strength and the capacity to seal cracks [70, 97, 106, 107].On the other hand, mix M10, using 2.5% of Bacillus Megaterium and silica fume subjected to 5% of the sulfate solution, showed extensive calcite formation (12%) under exposure conditions of sulfates, indicating the partial sulfate tolerance of Bacillus Megaterium and the ability to continue bio-mineralization activity. Apart from this, microcline content (8%) may be explained in terms of enhanced interaction among bacteria, pozzolanic silica, and alkalis resulting in the formation of secondary minerals.
Whereas mixes with Bacillus Sphaericus, such as mix M11 using 2.5% of Bacillus Sphaericus and silica fume subjected to 5% of the sulfate solution, and M3 using 2.5% of Bacillus Sphaericus and silica fume subjected to freshwater, yield different performances. M11 had medium calcite (10%) and high dolomite (52%) content, whereas M3 had 18% calcite and 48% dolomite content. This reveals that Bacillus Sphaericus also participates in MICP, although its effectiveness is remarkably less compared to that of Bacillus Megaterium, particularly when exposed to sulfate. But in sulfate-free medium (M3), the increase in calcite confirms that BS can activate self-healing effectively.
Comparing Mixes M21 using 2.5% Bacillus Megaterium and the control mix M20, with fly ash and subjected to 5% of sulfate solution in the two mixes, clarifies the role of sulfate and bacterial strain interactions. M21, a bacterial inclusion, showed 11% calcite (moderate calcite) under conditions of sulfate, as proof that BM preserves MICP activity in more unfavorable conditions better than control M20, which showed only 3% calcite. This is due to protection from penetration by sulfate of the bio-deposited calcite as well as reduction of degrading processes from within.
Generally, XRD analysis clearly indicates the presence of bacteria, especially Bacillus Megaterium, implying extensive precipitation of calcite as evidence of active MICP processes. This is most effective in sulfate-free mixes and where silica fume is used as a pozzolanic material. Sulfate exposure will reduce calcite formation, but not eliminate it, especially when highly aggressive bacteria such as BM are present. In addition, silica fume is shown to offer a better environment for microbial development compared to fly ash, which may be due to its higher pozzolanic activity and smaller particle size, allowing it to better absorb nutrients and support microbial colonization. The findings demonstrate the synergistic action of microbial and pozzolanic activity in enhancing the durability of concrete under severe conditions, as well as promoting self-healing.
3.6. Surface Crack Healing Analysis
Figure 36 displays images of microscopic crack healing for control and microbial specimens with varying bacterial contents of Bacillus megaterium and Bacillus sphaericus. These specimens were cured in sulfate solutions and freshwater for 120 days. Through mineral precipitation, it is evident that the crack width decreases in every instance. However, the control specimen's crack width did not significantly change, indicating that this crack healing was limited. Control of concrete crack healing is most likely caused by autogenous healing, a feature of cementitious materials. Autogenous healing explains this by hydrating unhydrated cement particles or carbonating dissolved calcium hydroxide to heal cracks when water is present. Some of the cracks were filled partly with this white precipitate, and white products were observed surrounding the cracks in the bacterial concrete. It was determined by microstructural analysis to be the precipitation of calcite. Table 7 displays the healing rate percentages for mixes M0, M1, M2, M3, M10, and M11, which were computed using Equation (1), as utilized in [108, 109]. The results show a favorable correlation between the higher bacterial content in each Bacillus megaterium and Bacillus sphaericus and the crack healing rate. For instance, in mix M2, which contains 2.5% bacteria BM, the cracks displayed a healing % of 100% at 120 days. On the other hand, Mix M1, which includes 1% bacteria BM, showed a healing percentage of 73.19% at 120 days. Bacillus megaterium bacteria have a greater efficiency of crack healing than Bacillus sphaericus bacteria. For instance, in M2, which contains 2.5% bacteria BM, healing efficiency is 100% at 120 days, whereas in M3, which includes 2.5% bacteria BS, healing efficiency is 84.33% at 120 days. On the other hand, Mix M1, which includes 1% bacteria BM, showed a healing percentage of 73.19% at 120 days. Bacillus megaterium bacteria have a greater efficiency of crack healing than Bacillus sphaericus bacteria. For instance, in M2, which contains 2.5% bacteria BM, healing efficiency is 100% at 120 days, whereas in M3, which contains 2.5% bacteria BS, healing efficiency is 84.33% at 120 days.
3. CONCLUSIONS
The study evaluates the effectiveness of Bacillus megaterium (BM) and Bacillus sphaericus (BS) in enhancing the durability of sustainable concrete against sulfate attack through microbially induced calcium carbonate precipitation (MICP). The main conclusions findings include:
1. A 2.5% bacterial concentration (by cement weight) maximized strength and self-healing efficiency.
2. Bacillus megaterium outperformed Bacillus sphaericus, enhancing compressive strength by 41.3% and flexural strength by 52.3%.
3. Silica fume’s pozzolanic reactivity and micro-filling action improved concrete density and bond strength more effectively than fly ash.
4. Sulfate exposure initially increased early strength through pore filling but caused long-term degradation (an 8.5% loss at 120 days) due to ettringite expansion.
5. BM-treated specimens restored 93.1% of compressive strength post-cracking, demonstrating robust self-healing.
6. Bacterial calcite precipitation reduced ettringite formation by 30%, mitigating sulfate-induced damage.
7. Calcium lactate at 0.5% cement weight was critical for sustaining bacterial activity and MICP.
8. Bacterial concrete retained strength in sulfate environments (2–10% concentrations) better than control mixes.
9. Bacterial spores remained viable beyond 120 days, offering prolonged self-healing capability without reapplication.
Author Contributions
Conceptualization S.S.E.A., M.A.R.E., and A.A.E.; Methodology, S.S.E.A., E.A., M.A.R.E.,
and A.A.E.; Validation, S.S.E.A., M.A.R.E., and A. E.; Formal analysis, M.A.R.E, A. E., and E. A.; Investigation, E.A., and A.A.E.; Data curation, M.A.R.E, E.A., and A.A.E; Writing original draft, E.A., M.A.R.E., A.A.E, and A.A; Writing review & editing, S.S.E.A., M.A.R.E. E.A., A.A.E., A. E., and A.A. All authors have read and agreed to the published version of the manuscript.
Funding
No funds.
Funding
No funds.
Institutional Review Board Statement
Not applicable.
Informed Consent Statement
t was obtained from all individual participants included in this study. All the authors agree that the article will be published after acceptance.
Data Availability Statement
All data are reported in this manuscript.
Acknowledgments
This work represents the experimental portion of the first author's M.Sc. thesis.
Conflicts of Interest
The authors declare that they have no competing interests.
References
- R. M. Reda, H. S. E. Mahmoud, S. S. E. Ahmad, and H. E.-D. M. Sallam, "Mechanical properties of sustainable concrete comprising various wastes," Scientific Reports, vol. 13, p. 13234, 2023/08/14 2023. [CrossRef]
- M. F. Alnahhal, U. J. Alengaram, M. Z. Jumaat, M. A. Alqedra, K. H. Mo, and M. Sumesh. (2017, Evaluation of Industrial By-Products as Sustainable Pozzolanic Materials in Recycled Aggregate Concrete. Sustainability 9(5). [CrossRef]
- M. Khan and C. McNally, "A holistic review on the contribution of civil engineers for driving sustainable concrete construction in the built environment," Developments in the Built Environment, vol. 16, p. 100273, 2023. [CrossRef]
- S. Arshad, M. B. Sharif, M. Irfan-ul-Hassan, M. Khan, and J.-L. Zhang, "Efficiency of supplementary cementitious materials and natural fiber on mechanical performance of concrete," Arabian Journal for Science And Engineering, vol. 45, pp. 8577-8589, 2020. [CrossRef]
- Essam, M. A. R. Elmahdy, Y. Elmenshawy, A. A. Elshami, S. S. E. Ahmad, and A. Aboubakr, "Experimental investigation on the recycling of medical waste for sustainable fiber-reinforced concrete production," Case Studies in Construction Materials, vol. 22, p. e04675, 2025/07/01/ 2025. [CrossRef]
- M. Shekarchi, B. Ahmadi, F. Azarhomayun, B. Shafei, and M. Kioumarsi, "Natural zeolite as a supplementary cementitious material – A holistic review of main properties and applications," Construction and Building Materials, vol. 409, p. 133766, 2023/12/15/ 2023. [CrossRef]
- J. A. Becerra-Duitama and D. Rojas-Avellaneda, "Pozzolans: A review," Engineering and Applied Science Research, vol. 49, pp. 495-504, 02/22 2022. 10.14456/easr.2022.49.
- D. K. Jaf and P. I. Abdulrahman, "A Review on Self-Healing Concrete," Advanced Materials Research, vol. 1175, pp. 139-148, 2023. [CrossRef]
- M. Riad, A. A. Elshami, and M. M. Y. Elshikh, "Influence of concentration and proportion prepared bacteria on properties of self-healing concrete in sulfate environment," Innovative Infrastructure Solutions, vol. 7, 2021. [CrossRef]
- Pinto, B. González-Fonteboa, S. Seara-Paz, and F. Martínez-Abella, "Effects of bacteria-based self-healing nutrients on hydration and rheology of cement pastes," Construction and Building Materials, vol. 404, p. 133142, 2023/11/10/ 2023. [CrossRef]
- Grace Agbons Aruya and V. K. Chukwuemezie, "Causes of Cracks on Concrete Structures and Repair Methods," International Journal of Engineering Research and Applications vol. 07, 2022.
- S. Mondal, P. Das, and A. K. Chakraborty, "Application of bacteria in concrete," Materials Today: Proceedings, vol. 4, pp. 9833-9836, 2017. [CrossRef]
- G. Massaad, E. Rozière, A. Loukili, and L. Izoret, "Advanced testing and performance specifications for the cementitious materials under external sulfate attacks," Construction and Building Materials, vol. 127, pp. 918-931, 2016. [CrossRef]
- M. Whittaker and L. Black, "Current knowledge of external sulfate attack," Advances in Cement Research, vol. 27, pp. 532-545, 2015. [CrossRef]
- M. Nehdi and M. Hayek, "Behavior of blended cement mortars exposed to sulfate solutions cycling in relative humidity," Cement and Concrete Research, vol. 35, pp. 731-742, 2005. [CrossRef]
- H. Haynes and M. Bassuoni, "Physical Salt Attack on Concrete," Concrete international, vol. 33, 2011.
- P. Dinarvand and A. Rashno, "Review of the potential application of bacteria in self-healing and the improving properties of concrete/mortar," Journal of Sustainable Cement-Based Materials, vol. 11, pp. 250-271, 2021. [CrossRef]
- J. Wang, K. Van Tittelboom, N. De Belie, and W. Verstraete, "Use of silica gel or polyurethane immobilized bacteria for self-healing concrete," Construction and Building Materials, vol. 26, pp. 532-540, 2012/01/01/ 2012. [CrossRef]
- W. Khaliq and M. B. Ehsan, "Crack healing in concrete using various bio influenced self-healing techniques," Construction and building materials, vol. 102, pp. 349-357, 2016. [CrossRef]
- H. Ghazy, M. R. Emara, A. M. Abdellah, and M. I. E. Attia, "Self-healing concrete techniques and performance, A review," Research on Engineering Structures and Materials, 2023. 10.17515/resm2023.51ma0615rv.
- M. Amran, A. M. Onaizi, R. Fediuk, N. I. Vatin, R. S. Muhammad Rashid, H. Abdelgader, et al., "Self-healing concrete as a prospective construction material: a review," Materials, vol. 15, p. 3214, 2022. [CrossRef]
- S. H. Jakhrani, A. Qudoos, H. G. Kim, I. K. Jeon, and J. S. Ryou, "Review on the self-healing concrete-approach and evaluation techniques," Journal of Ceramic Processing Research, vol. 20, pp. 1-18, 2019. [CrossRef]
- S. Luhar, I. Luhar, and F. U. A. Shaikh, "Review on performance evaluation of autonomous healing of geopolymer composites," Infrastructures, vol. 6, p. 94, 2021. [CrossRef]
- [A. Mohamed, Y. Zhou, E. Bertolesi, M. Liu, F. Liao, and M. Fan, "Factors influencing self-healing mechanisms of cementitious materials: A review," Construction and Building Materials, vol. 393, p. 131550, 2023. [CrossRef]
- H. Žáková, J. Pazderka, Z. Rácová, and P. Ryparová, "Effect of bacteria bacillus pseudofirmus and fungus trichoderma reesei on self-healing ability of concrete," Acta Polytechnica CTU Proceedings, vol. 21, pp. 42-45, 2019. [CrossRef]
- G. A. Metwally, M. Mahdy, and A. H. El-Raheem, "Performance of bio concrete by using bacillus pasteurii bacteria," Civil Engineering Journal, vol. 6, pp. 1443-1456, 2020. [CrossRef]
- M. Rajczakowska, K. Habermehl-Cwirzen, H. Hedlund, and A. Cwirzen, "Autogenous self-healing: a better solution for concrete," Journal of Materials in Civil Engineering, vol. 31, p. 03119001, 2019. [CrossRef]
- Y. Ç. Erşan, E. Hernandez-Sanabria, N. Boon, and N. De Belie, "Enhanced crack closure performance of microbial mortar through nitrate reduction," Cement and concrete composites, vol. 70, pp. 159-170, 2016. [CrossRef]
- N. De Belie, E. Gruyaert, A. Al-Tabbaa, P. Antonaci, C. Baera, D. Bajare, et al., "A review of self-healing concrete for damage management of structures," Advanced materials interfaces, vol. 5, p. 1800074, 2018. [CrossRef]
- R. Davies and A. Jefferson, "Micromechanical modelling of self-healing cementitious materials," International Journal of Solids and Structures, vol. 113, pp. 180-191, 2017. [CrossRef]
- L. Ferrara, V. Krelani, F. Moretti, M. R. Flores, and P. S. Ros, "Effects of autogenous healing on the recovery of mechanical performance of High Performance Fibre Reinforced Cementitious Composites (HPFRCCs): Part 1," Cement and Concrete Composites, vol. 83, pp. 76-100, 2017. [CrossRef]
- H. A. A. Algaifi, S. A. Bakar, A. R. M. Sam, and A. R. Z. Abidin, "Crack-healing in cementitious material to improve the durability of structures," in MATEC Web of Conferences, 2018, p. 03005. [CrossRef]
- G. Souradeep and H. W. Kua, "Encapsulation technology and techniques in self-healing concrete," Journal of Materials in Civil Engineering, vol. 28, p. 04016165, 2016. [CrossRef]
- D. Suarez-Riera, L. Restuccia, D. Falliano, G. A. Ferro, J.-M. Tuliani, M. Pavese, et al., "An Overview of Methods to Enhance the Environmental Performance of Cement-Based Materials," Infrastructures, vol. 9, p. 94, 2024. [CrossRef]
- W. Zhang, Q. Zheng, A. Ashour, and B. Han, "Self-healing cement concrete composites for resilient infrastructures: A review," Composites Part B: Engineering, vol. 189, p. 107892, 2020. [CrossRef]
- C. Meera and V. Subha, "Strength and durability assessment of bacteria based self-healing concrete," IOSR J. Mech. Civ. Eng, vol. 3, pp. 1-7, 2016.
- K. Das and K. Kumar, "An Appraisal of Autogenous and Autonomous Self-Healing in Concrete in Building Construction," Journal of Advanced Cement & Concrete Technology, vol. 5, 2022. [CrossRef]
- Beglarigale, D. Eyice, B. Tutkun, and H. Yazıcı, "Evaluation of enhanced autogenous self-healing ability of UHPC mixtures," Construction and Building Materials, vol. 280, p. 122524, 2021. [CrossRef]
- M. Roig-Flores, S. Formagini, and P. Serna, "Self-healing concrete-what is it good for?," Materiales de Construcción, vol. 71, pp. e237-e237, 2021. [CrossRef]
- J. Zhang, Y. Liu, T. Feng, M. Zhou, L. Zhao, A. Zhou, et al., "Immobilizing bacteria in expanded perlite for the crack self-healing in concrete," Construction and Building Materials, vol. 148, pp. 610-617, 2017. [CrossRef]
- S. Mondal and A. Ghosh, "Microbial concrete as a sustainable option for infrastructural development in emerging economies," in ASCE India Conference 2017, 2017, pp. 413-423. [CrossRef]
- E. Tziviloglou, V. Wiktor, H. Jonkers, and E. Schlangen, "Bacteria-based self-healing concrete to increase liquid tightness of cracks," Construction and Building Materials, vol. 122, pp. 118-125, 2016. [CrossRef]
- Y. Javeed, Y. Goh, K. H. Mo, S. P. Yap, and B. F. Leo, "Microbial self-healing in concrete: A comprehensive exploration of bacterial viability, implementation techniques, and mechanical properties," Journal of Materials Research and Technology, vol. 29, pp. 2376-2395, 2024. [CrossRef]
- K. Vijay and M. Murmu, "Effect of calcium lactate on compressive strength and self-healing of cracks in microbial concrete," Frontiers of Structural and Civil Engineering, vol. 13, pp. 515-525, 2019. [CrossRef]
- J. Feng, B. Chen, W. Sun, and Y. Wang, "Microbial induced calcium carbonate precipitation study using Bacillus subtilis with application to self-healing concrete preparation and characterization," Construction and Building Materials, vol. 280, p. 122460, 2021. [CrossRef]
- J. de Brito and R. Kurda, "The past and future of sustainable concrete: A critical review and new strategies on cement-based materials," Journal of Cleaner Production, vol. 281, p. 123558, 2021. [CrossRef]
- El-Newihy, P. Azarsa, R. Gupta, and A. Biparva, "Effect of polypropylene fibers on self-healing and dynamic modulus of elasticity recovery of fiber reinforced concrete," Fibers, vol. 6, p. 9, 2018. [CrossRef]
- S. Jena, B. Basa, K. C. Panda, and N. K. Sahoo, "Impact of Bacillus subtilis bacterium on the properties of concrete," Materials Today: Proceedings, vol. 32, pp. 651-656, 2020. [CrossRef]
- J. He and X. Shi, "Developing an abiotic capsule-based self-healing system for cementitious materials: The state of knowledge," Construction and Building Materials, vol. 156, pp. 1096-1113, 2017/12/15/ 2017. [CrossRef]
- S. Lu, M. Chen, Y. Dang, L. Cao, J. He, and J. Zhong, "Bacterial self healing cement based materials: Mechanism at nanoscale," AIP Advances, vol. 9, 2019. [CrossRef]
- Z. B. Bundur, M. J. Kirisits, and R. D. Ferron, "Use of pre-wetted lightweight fine expanded shale aggregates as internal nutrient reservoirs for microorganisms in bio-mineralized mortar," Cement and Concrete Composites, vol. 84, pp. 167-174, 2017. [CrossRef]
- H. Khodadadi Tirkolaei and H. Bilsel, "Estimation on ureolysis-based microbially induced calcium carbonate precipitation progress for geotechnical applications," Marine Georesources & Geotechnology, vol. 35, pp. 34-41, 2017. [CrossRef]
- T. H. Nguyen, E. Ghorbel, H. Fares, and A. Cousture, "Bacterial self-healing of concrete and durability assessment," Cement and Concrete Composites, vol. 104, p. 103340, 2019. [CrossRef]
- J. Wang, H. M. Jonkers, N. Boon, and N. De Belie, "Bacillus sphaericus LMG 22257 is physiologically suitable for self-healing concrete," Applied microbiology and biotechnology, vol. 101, pp. 5101-5114, 2017. [CrossRef]
- H. Kim, H. Son, S. Park, and H.-K. Lee, "Effects of biological admixtures on hydration and mechanical properties of Portland cement paste," Construction and Building Materials, vol. 235, p. 117461, 2020. [CrossRef]
- P. Y. Wong, J. Mal, A. Sandak, L. Luo, J. Jian, and N. Pradhan, "Advances in microbial self-healing concrete: A critical review of mechanisms, developments, and future directions," Science of The Total Environment, vol. 947, p. 174553, 2024/10/15/ 2024. [CrossRef]
- B. M. S. Reddy and D. Revathi, "An experimental study on effect of Bacillus sphaericus bacteria in crack filling and strength enhancement of concrete," Materials Today: Proceedings, vol. 19, pp. 803-809, 2019. [CrossRef]
- P. A. Nagar, N. Gupta, K. Kishore, and A. K. Parashar, "Coupled effect of B. Sphaericus bacteria and calcined clay mineral on OPC concrete," Materials Today: Proceedings, vol. 44, pp. 113-117, 2021. [CrossRef]
- T. S. Priya, N. Ramesh, A. Agarwal, S. Bhusnur, and K. Chaudhary, "Strength and durability characteristics of concrete made by micronized biomass silica and Bacteria-Bacillus sphaericus," Construction and Building Materials, vol. 226, pp. 827-838, 2019. [CrossRef]
- M. S. Jafarnia, M. K. Saryazdi, and S. M. Moshtaghioun, "Use of bacteria for repairing cracks and improving properties of concrete containing limestone powder and natural zeolite," Construction and Building Materials, vol. 242, p. 118059, 2020. [CrossRef]
- B. Chen, W. Sun, X. Sun, C. Cui, J. Lai, Y. Wang, et al., "Crack sealing evaluation of self-healing mortar with Sporosarcina pasteurii: Influence of bacterial concentration and air-entraining agent," Process Biochemistry, vol. 107, pp. 100-111, 2021. [CrossRef]
- P. Ryparová, P. Tesárek, H. Schreiberová, and Z. Prošek, "The effect of temperature on bacterial self-healing processes in building materials," in IOP conference series: materials science and engineering, 2020, p. 012012. [CrossRef]
- Y. Su, T. Zheng, and C. Qian, "Application potential of Bacillus megaterium encapsulated by low alkaline sulphoaluminate cement in self-healing concrete," Construction and Building Materials, vol. 273, p. 121740, 2021. [CrossRef]
- S. Bifathima and B. N. Matcha, "Self healing concrete by adding Bacillus megaterium MTCC with glass & steel fibers," Civil and Environmental Engineering, vol. 16, pp. 184-197, 2020. [CrossRef]
- V. Nagarajan, T. K. Prabhu, M. G. Shankar, and P. Jagadesh, "A study on the strength of the bacterial concrete embedded with Bacillus megaterium," International Research Journal of Engineering and Technology, vol. 4, pp. 1784-1788, 2017.
- K. Vijay and M. Murmu, "Experimental study on bacterial concrete using Bacillus subtilis micro-organism," in Emerging Trends in Civil Engineering: Select Proceedings of ICETCE 2018, 2020, pp. 245-252. [CrossRef]
- Manikandan and A. Padmavathi, "An experimental investigation on improvement of concrete serviceability by using bacterial mineral precipitation," International Journal of Research and Scientific Innovation, vol. 2, pp. 46-49, 2015.
- Jang, D. Son, W. Kim, W. Park, and C. Yi, "Effects of spray-dried co-cultured bacteria on cement mortar," Construction and Building Materials, vol. 243, p. 118206, 2020. [CrossRef]
- X. Chen, J. Yuan, and M. Alazhari, "Effect of Microbiological Growth Components for Bacteria-Based Self-Healing on the Properties of Cement Mortar," Materials (Basel), vol. 12, Apr 20 2019. [CrossRef]
- K. Vijay, M. Murmu, and S. V. Deo, "Bacteria based self healing concrete – A review," Construction and Building Materials, vol. 152, pp. 1008-1014, 2017/10/15/ 2017. [CrossRef]
- M. Luo and C. Qian, "Influences of bacteria-based self-healing agents on cementitious materials hydration kinetics and compressive strength," Construction and Building Materials, vol. 121, pp. 659-663, 2016/09/15/ 2016. [CrossRef]
- P. Kanaujia, R. Banerjee, S. M. A. Husain, and S. Ahmed, "The Effect of Sulfate Attack on Physical Properties of Concrete," International Journal of Recent Technology and Engineering (IJRTE), vol. 10, pp. 21-27, 2021. [CrossRef]
- K. Parashar and A. Gupta, "Effects of the concentration of various bacillus family bacteria on the strength and durability properties of concrete: A Review," in IOP Conference Series: Materials Science and Engineering, 2021, p. 012162. [CrossRef]
- V. Rameshkumar, S. Prabhath Ranjan Kumar, V. Poornima, R. Venkatasubramani, and V. Sreevidya, "Improvements in mechanical and durability parameters of bio-engineered concrete with metakaolin as a partial substitute for cement," European Journal of Environmental and Civil Engineering, vol. 26, pp. 2753-2766, 2022/05/19 2020. [CrossRef]
- S. Joshi, S. Goyal, A. Mukherjee, and M. S. Reddy, "Protection of concrete structures under sulfate environments by using calcifying bacteria," Construction and Building Materials, vol. 209, pp. 156-166, 2019. [CrossRef]
- ES 4756-1 (2013) Cement-part 1: composition, specifcations and conformity criteria for common cements, Egyptian Organi- zation for Standardization and Quality, Egypt.
- Egyptian Standard Specification, Aggregates For Concrete, ESS. No. 1109, 2021. https://www.eos.org.eg/en/standard/288.
- American Society for Testing and Materials, Standard Specification for Chemical Admixtures for Concrete, ASTM-C-494-2020, n.d. https://www.astm.org/c0494_c0494m-19e01.html.
- M. A. Elmahdy, A. ELShami, E.-S. M. Yousry, and S. S. Ahmad, "Self-healing mortar using different types, content, and concentrations of bacteria to repair cracks," Frattura e Integrita Strutturale, 2022. 10.3221/IGF-ESIS.59.32.
- S. Ahmad, M. El-Mahdy, A. Elshami, and E.-S. Yousry, "Bacterial sustainable concrete for repair and rehabilitation of structural cracks," Journal of Sustainable Cement-Based Materials, vol. 12, pp. 1-20, 07/22 2022. [CrossRef]
- American Society for Testing Materials, Standard Practice for Making and Curing Concrete Test Specimens in the Laboratory, ASTMC-192/C192M-2020, n.d. https://www.astm.org/c0192_c0192m-24.html.
- British Standards Institution, Testing Hardened Concrete-part 3: Compressive Strength of Test Specimens, BS EN 12390-3:2019, n.d. https://www.en-standard.eu/bs-en-12390-3-2019-testing-hardened-concrete-compressive-strength-of-test-specimens/.
- British Standards Institution, Testing Hardened Concrete-part 5: Flexural Strength of Test Specimens, BS EN 12390-5-2019, n.d. https://www.en-standard.eu/bs-en-12390-5-2019-testing-hardened-concrete-flexural-strength-of-test-specimens/.
- K. Prathyush, V. Poornima, M. Gopal, H. N. Rahul, and R. Kumaraguru, "An experimental study on the usage of silica fume in bacterial concrete," Materials Today: Proceedings, 2023. [CrossRef]
- R. Garg, R. Garg, and N. O. Eddy, "Microbial induced calcite precipitation for self-healing of concrete: a review," Journal of Sustainable Cement-Based Materials, vol. 12, pp. 317-330, 2023. [CrossRef]
- Z. Helal, H. Salim, S. S. E. Ahmad, H. Elemam, A. I. H. Mohamed, and M. A. R. Elmahdy, "Sustainable bacteria-based self-healing steel fiber reinforced concrete," Case Studies in Construction Materials, vol. 20, p. e03389, 2024/07/01/ 2024. [CrossRef]
- N. Nain, R. Surabhi, N. Yathish, V. Krishnamurthy, T. Deepa, and S. Tharannum, "Enhancement in strength parameters of concrete by application of Bacillus bacteria," Construction and Building Materials, vol. 202, pp. 904-908, 2019. [CrossRef]
- R. Andalib, M. Z. Abd Majid, M. W. Hussin, M. Ponraj, A. Keyvanfar, J. Mirza, et al., "Optimum concentration of Bacillus megaterium for strengthening structural concrete," Construction and Building Materials, vol. 118, pp. 180-193, 2016. [CrossRef]
- R. Weerasinghe, Y.-L. Guo, X.-Y. Liu, Y.-P. Hu, and C. Fang, "Study on the influence of fly ash and silica fume with different dosage on concrete strength," E3S Web of Conferences, vol. 237, p. 03038, 2021. [CrossRef]
- Pathak, "Effect of silica fume and fly ash as partial replacement of cement on strength of concrete," in International Conference of Advance Research & Innovation (ICARI), 2020. [CrossRef]
- R. Weerasinghe, H.-Y. Zhang, X.-Y. Liu, D.-F. Wei, and C. Fang, "Influence of Silica Fume Content on Performance of High - Performance Concrete," E3S Web of Conferences, vol. 237, p. 03039, 2021. [CrossRef]
- M. Ziada, H. Tanyildizi, and M. Uysal, "Bacterial healing of geopolymer concrete exposed to combined sulfate and freeze-thaw effects," Construction and Building Materials, vol. 369, p. 130517, 2023. [CrossRef]
- S. Ahmad, Y. Elmenshawy, Y. O. El Gammal, H. M. El-Sheikh, M. Moawad, A. A. Elshami, et al., "Investigating the repair of cracks through bacterial self-healing for sustainable concrete in aggressive sulfate attack environments," Fracture and Structural Integrity, vol. 19, pp. 194-210, 11/07 2024. [CrossRef]
- K. D. Mutitu, M. O. Munyao, M. J. Wachira, R. Mwirichia, K. J. Thiong'o, and M. J. Marangu, "Effects of biocementation on some properties of cement-based materials incorporating Bacillus Species bacteria–a review," Journal of Sustainable Cement-Based Materials, vol. 8, pp. 309-325, 2019. [CrossRef]
- D. K. Mutitu, J. M. Wachira, R. Mwirichia, J. K. Thiong’o, O. M. Munyao, and M. Genson, "Biocementation influence on flexural strength and chloride ingress by Lysinibacillus sphaericus and bacillus megaterium in mortar structures," Journal of Chemistry, vol. 2020, p. 1472923, 2020. [CrossRef]
- K. Vijay and M. Murmu, "Self-repairing of concrete cracks by using bacteria and basalt fiber," SN Applied Sciences, vol. 1, pp. 1-10, 2019. [CrossRef]
- Souid, M. Esaker, D. Elliott, and O. Hamza, "Experimental data of bio self-healing concrete incubated in saturated natural soil," Data in brief, vol. 26, p. 104394, 2019. [CrossRef]
- K. Parashar and A. Gupta, "Experimental study of the effect of bacillus megaterium bacteria on cement concrete," in IOP conference series: materials science and engineering, 2021, p. 012168. [CrossRef]
- H. Kalhori and R. Bagherpour, "Application of carbonate precipitating bacteria for improving properties and repairing cracks of shotcrete," Construction and Building Materials, vol. 148, pp. 249-260, 2017. [CrossRef]
- D. J. De Souza and L. F. Sanchez, "Understanding the efficiency of autogenous and autonomous self-healing of conventional concrete mixtures through mechanical and microscopical analysis," Cement and Concrete Research, vol. 172, p. 107219, 2023. [CrossRef]
- S. Joshi, Y.-H. Ahn, S. Goyal, and M. S. Reddy, "Performance of bacterial mediated mineralization in concrete under carbonation and chloride induced corrosion," Journal of Building Engineering, vol. 69, p. 106234, 2023. [CrossRef]
- S. Mondal and A. D. Ghosh, "Biomineralization, bacterial selection and properties of microbial concrete: A review," Journal of Building Engineering, vol. 73, p. 106695, 2023. [CrossRef]
- S. A. Kadapure and U. B. Deshannavar, "Bio-smart material in self-healing of concrete," Materials Today: Proceedings, vol. 49, pp. 1498-1503, 2022. [CrossRef]
- Y. Elmenshawy, M. A. R. Elmahdy, M. Moawad, A. A. Elshami, S. S. E. Ahmad, and K. Nagai, "Investigating the bacterial sustainable self-healing capabilities of cracks in structural concrete at different temperatures," Case Studies in Construction Materials, vol. 20, p. e03188, 2024/07/01/ 2024. [CrossRef]
- K. Parashar and A. Gupta, "Experimental study of the effect of bacillus megaterium bacteria on cement concrete," IOP Conference Series: Materials Science and Engineering, vol. 1116, p. 012168, 2021/04/01 2021. [CrossRef]
- H. Yi, T. Zheng, Z. Jia, T. Su, and C. Wang, "Study on the influencing factors and mechanism of calcium carbonate precipitation induced by urease bacteria," Journal of Crystal Growth, vol. 564, p. 126113, 2021. [CrossRef]
- K. K. Maurya, A. Rawat, and R. Shanker, "Performance evaluation concept for crack healing in bacterial concrete structure using electro mechanical impedance technique with PZT patch," Developments in the Built Environment, vol. 15, p. 100196, 2023. [CrossRef]
- S. Mondal and A. D. Ghosh, "Spore-forming Bacillus subtilis vis-à-vis non-spore-forming Deinococcus radiodurans, a novel bacterium for self-healing of concrete structures: a comparative study," Construction and Building Materials, vol. 266, p. 121122, 2021. [CrossRef]
- M. A. Elshazly, A. A. Elakhras, A. A. Elshami, S. S. E. Ahmad, and M. A. R. Elmahdy, "Investigating the effectiveness of a bacterial self-healing mechanism for repairing cracks in sustainable cement mortar at low temperatures," Results in Engineering, vol. 25, p. 103907, 2025/03/01/ 2025. [CrossRef]
Figure 3.
The sieve analysis for aggregate, (a) Sand, and (b) Gravel.
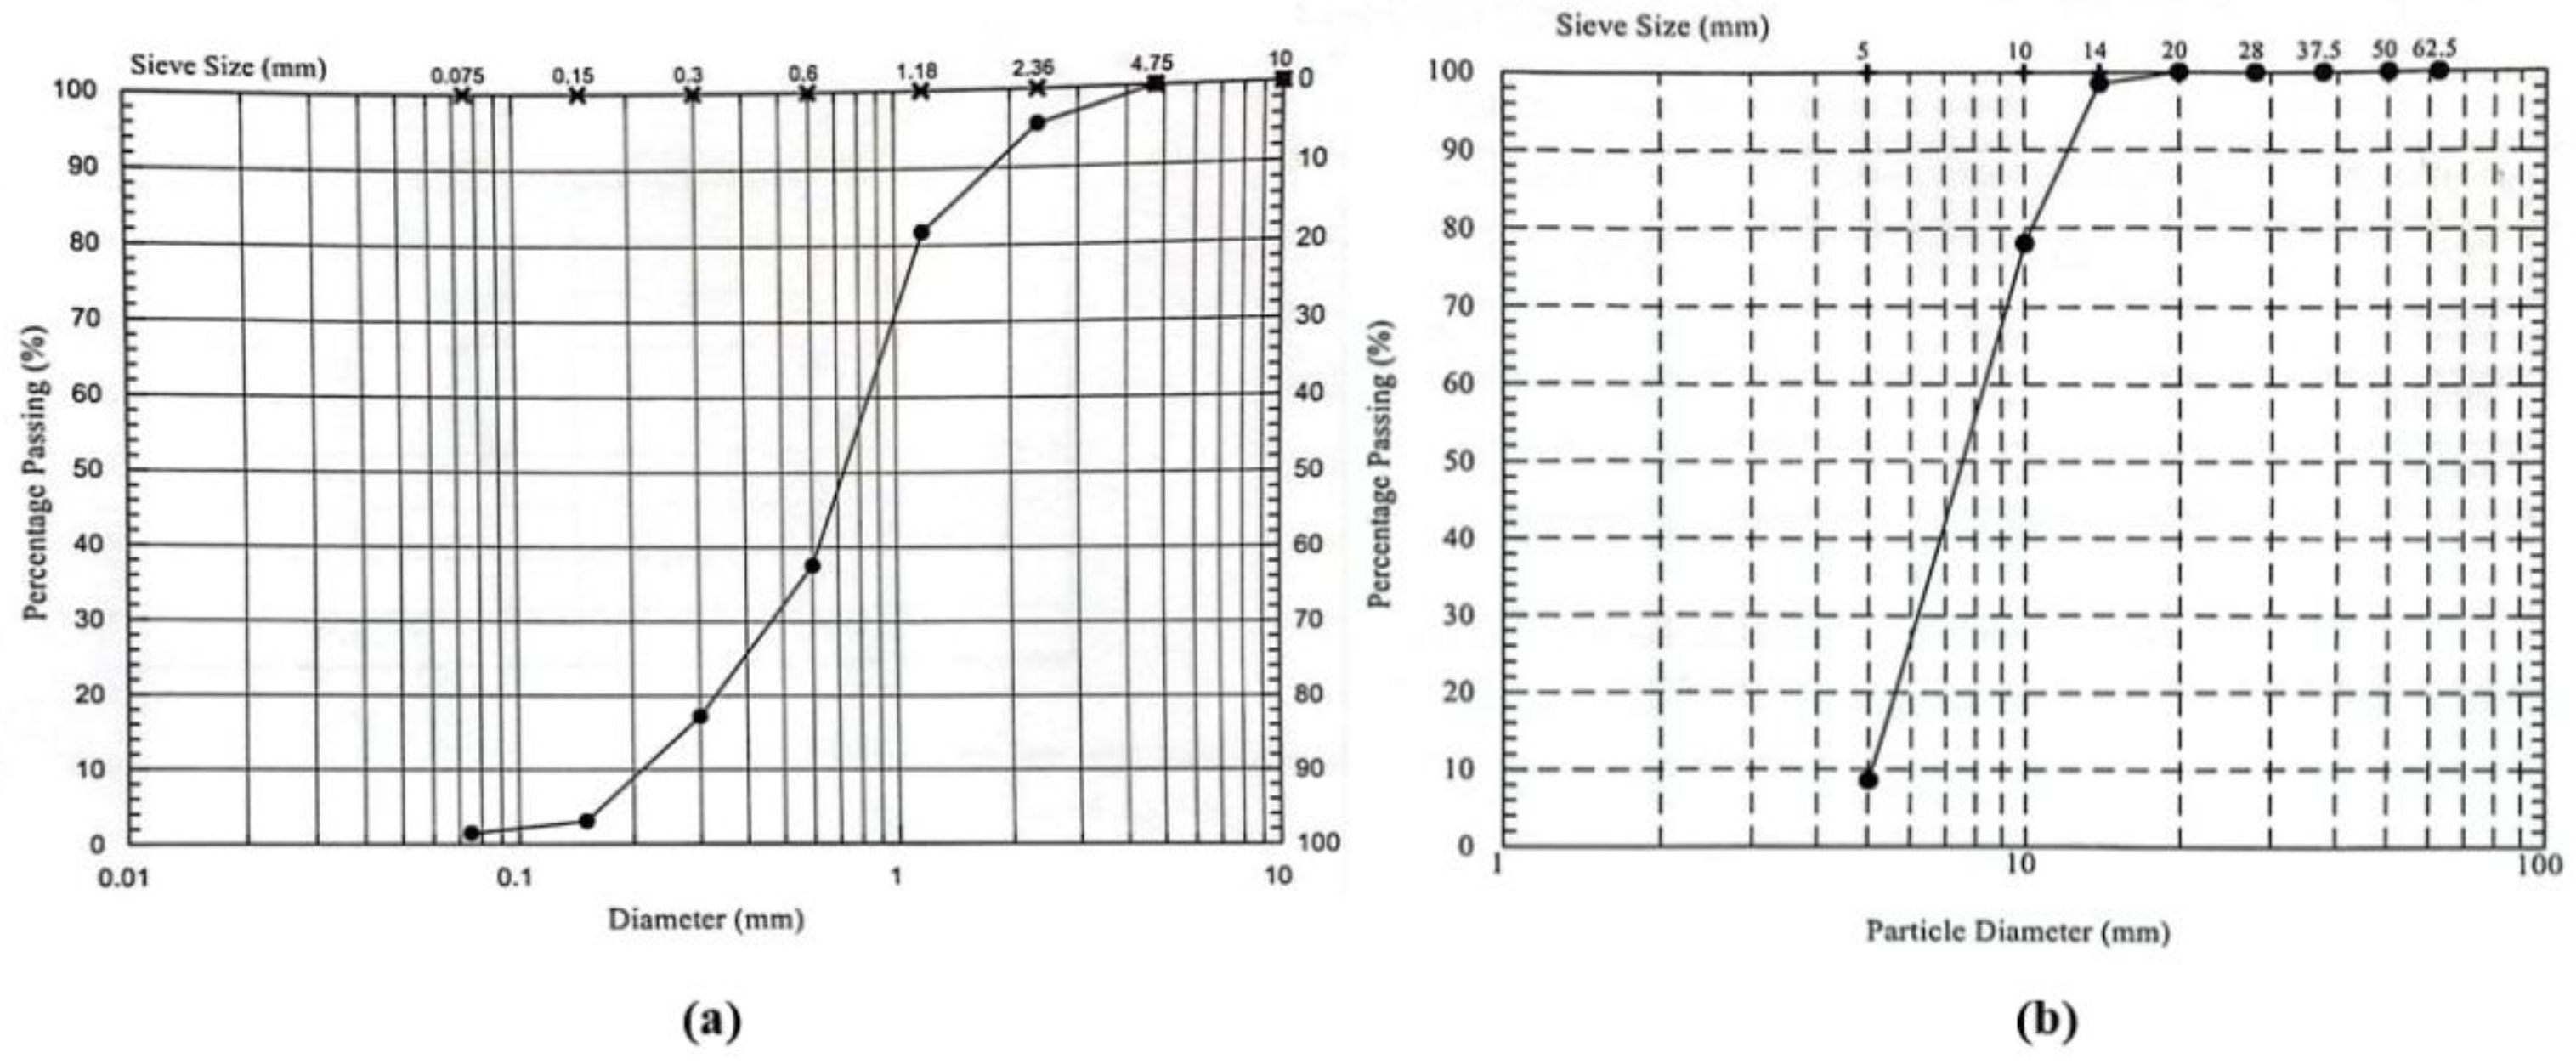
Figure 4.
Fundamental steps to prepare a bacterial cell suspension.
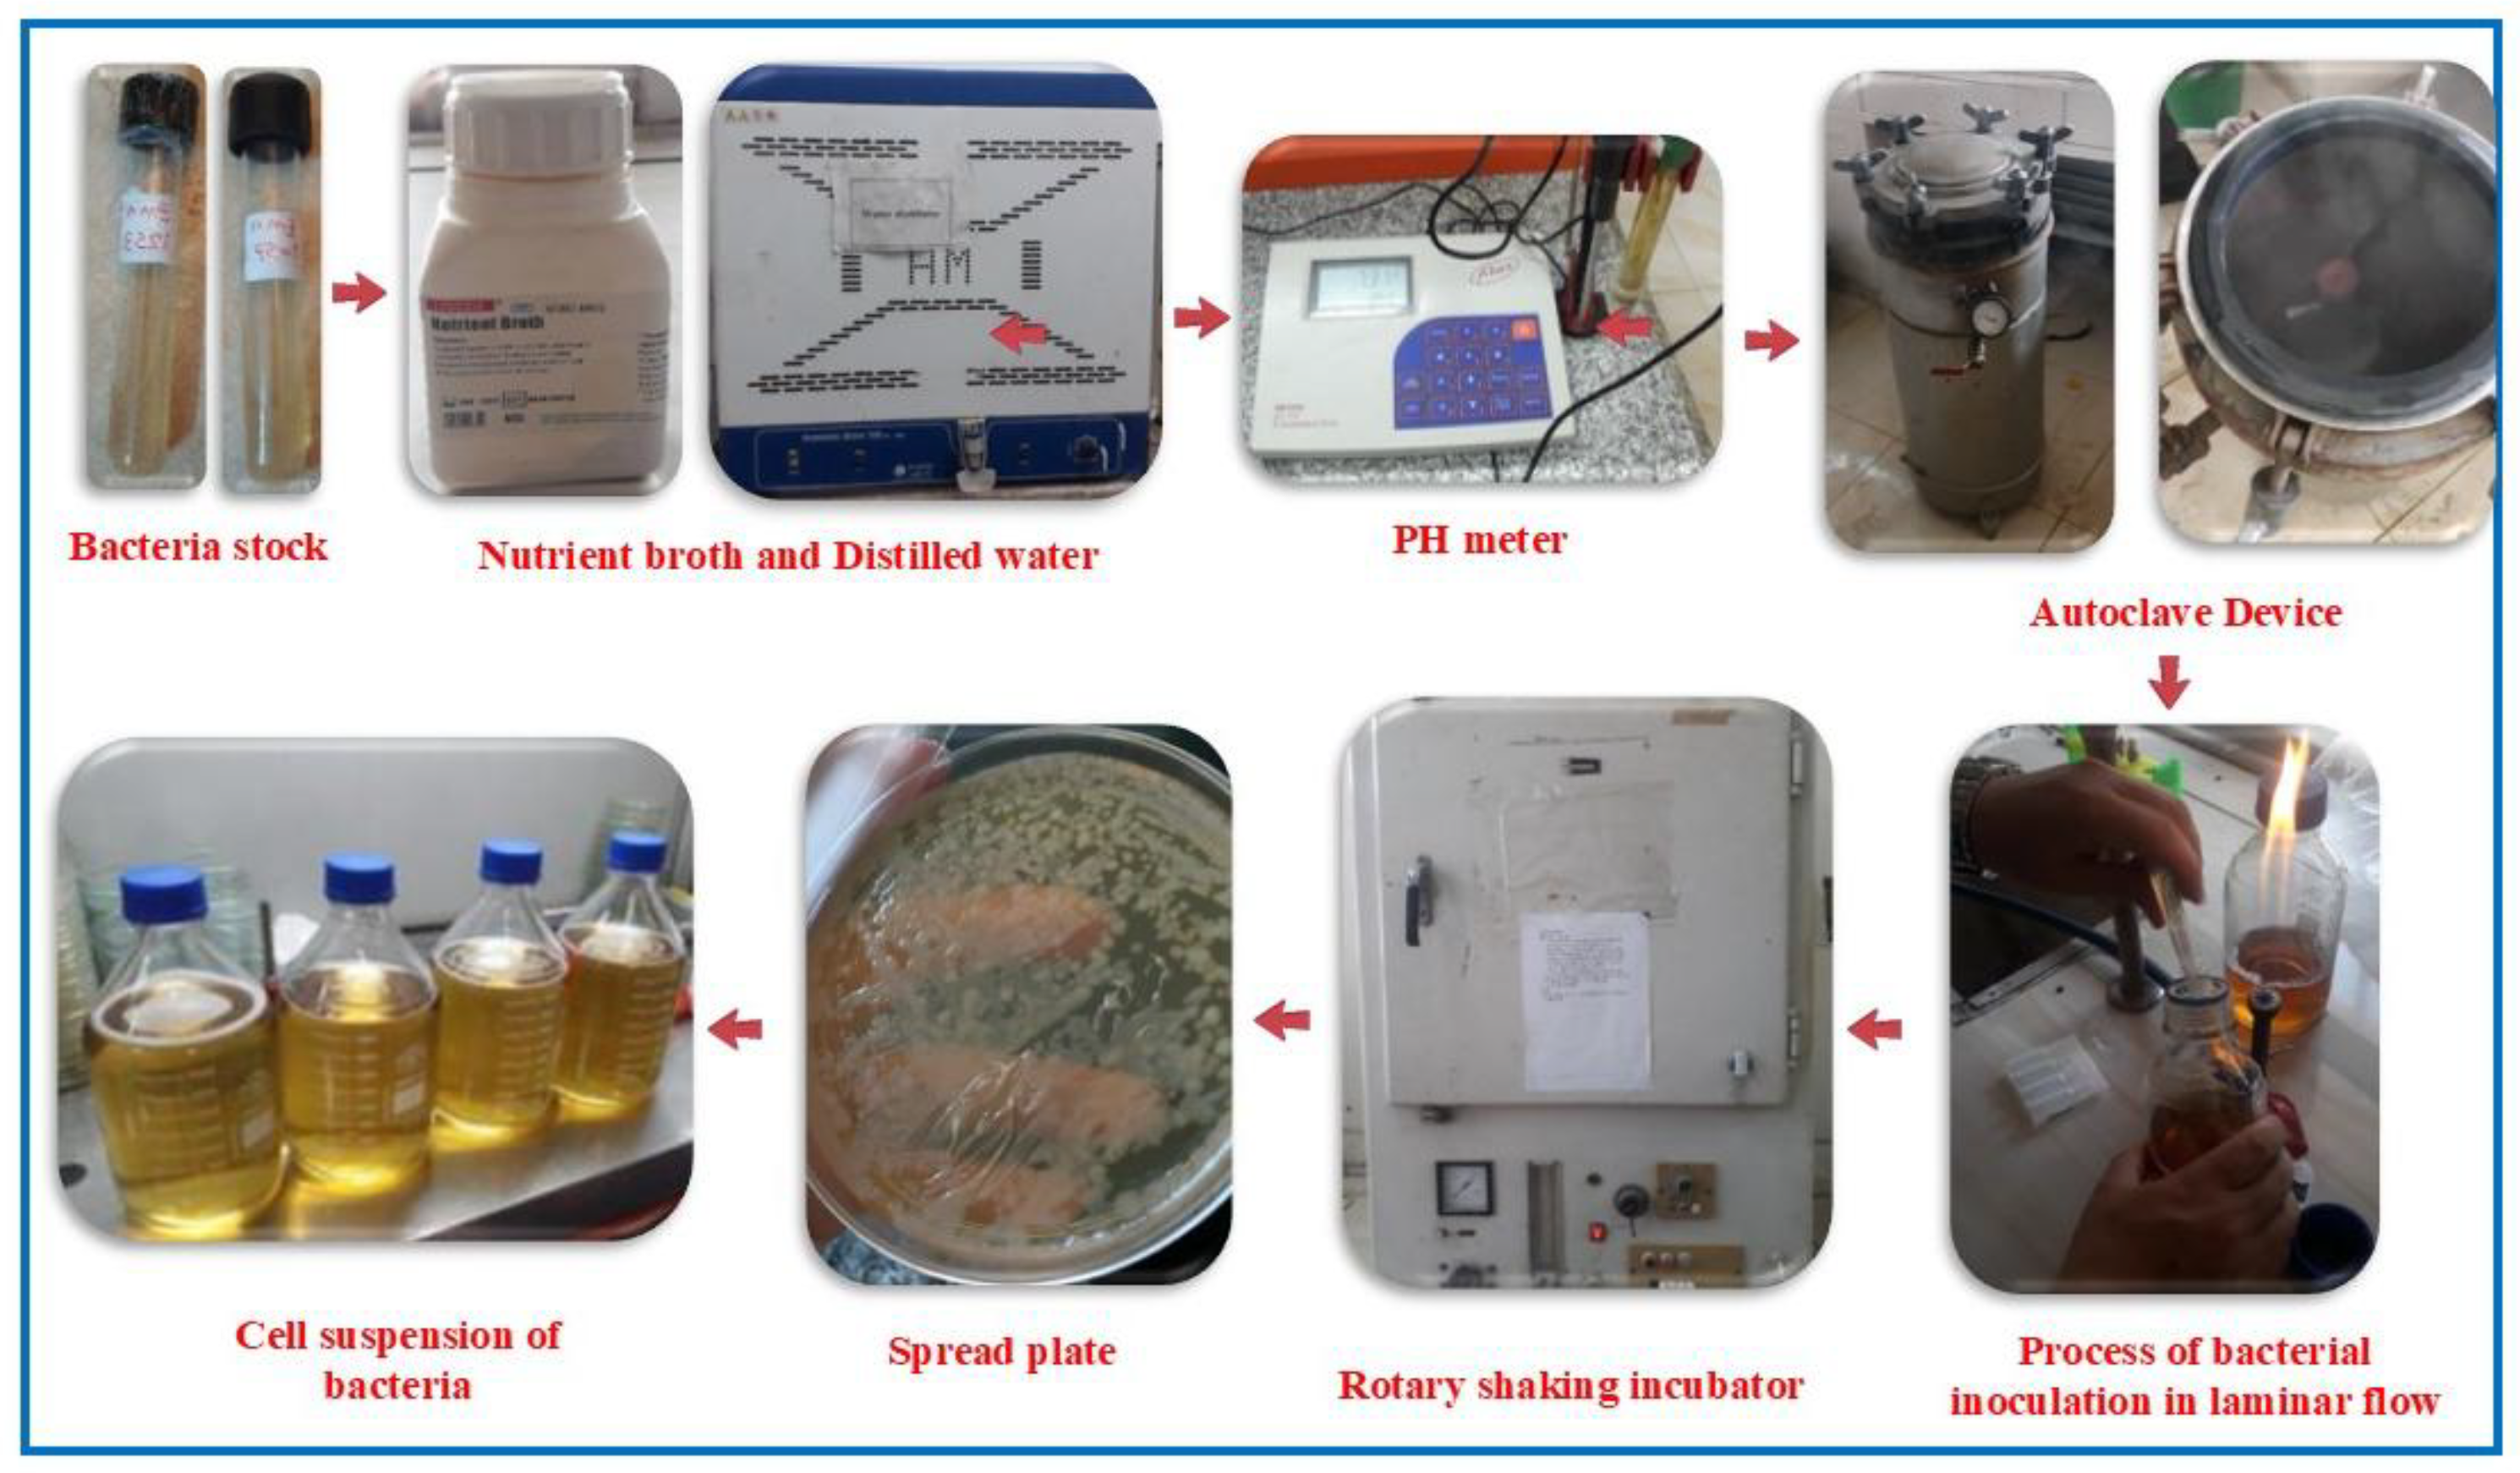
Figure 5.
Steps of the sample mixing.
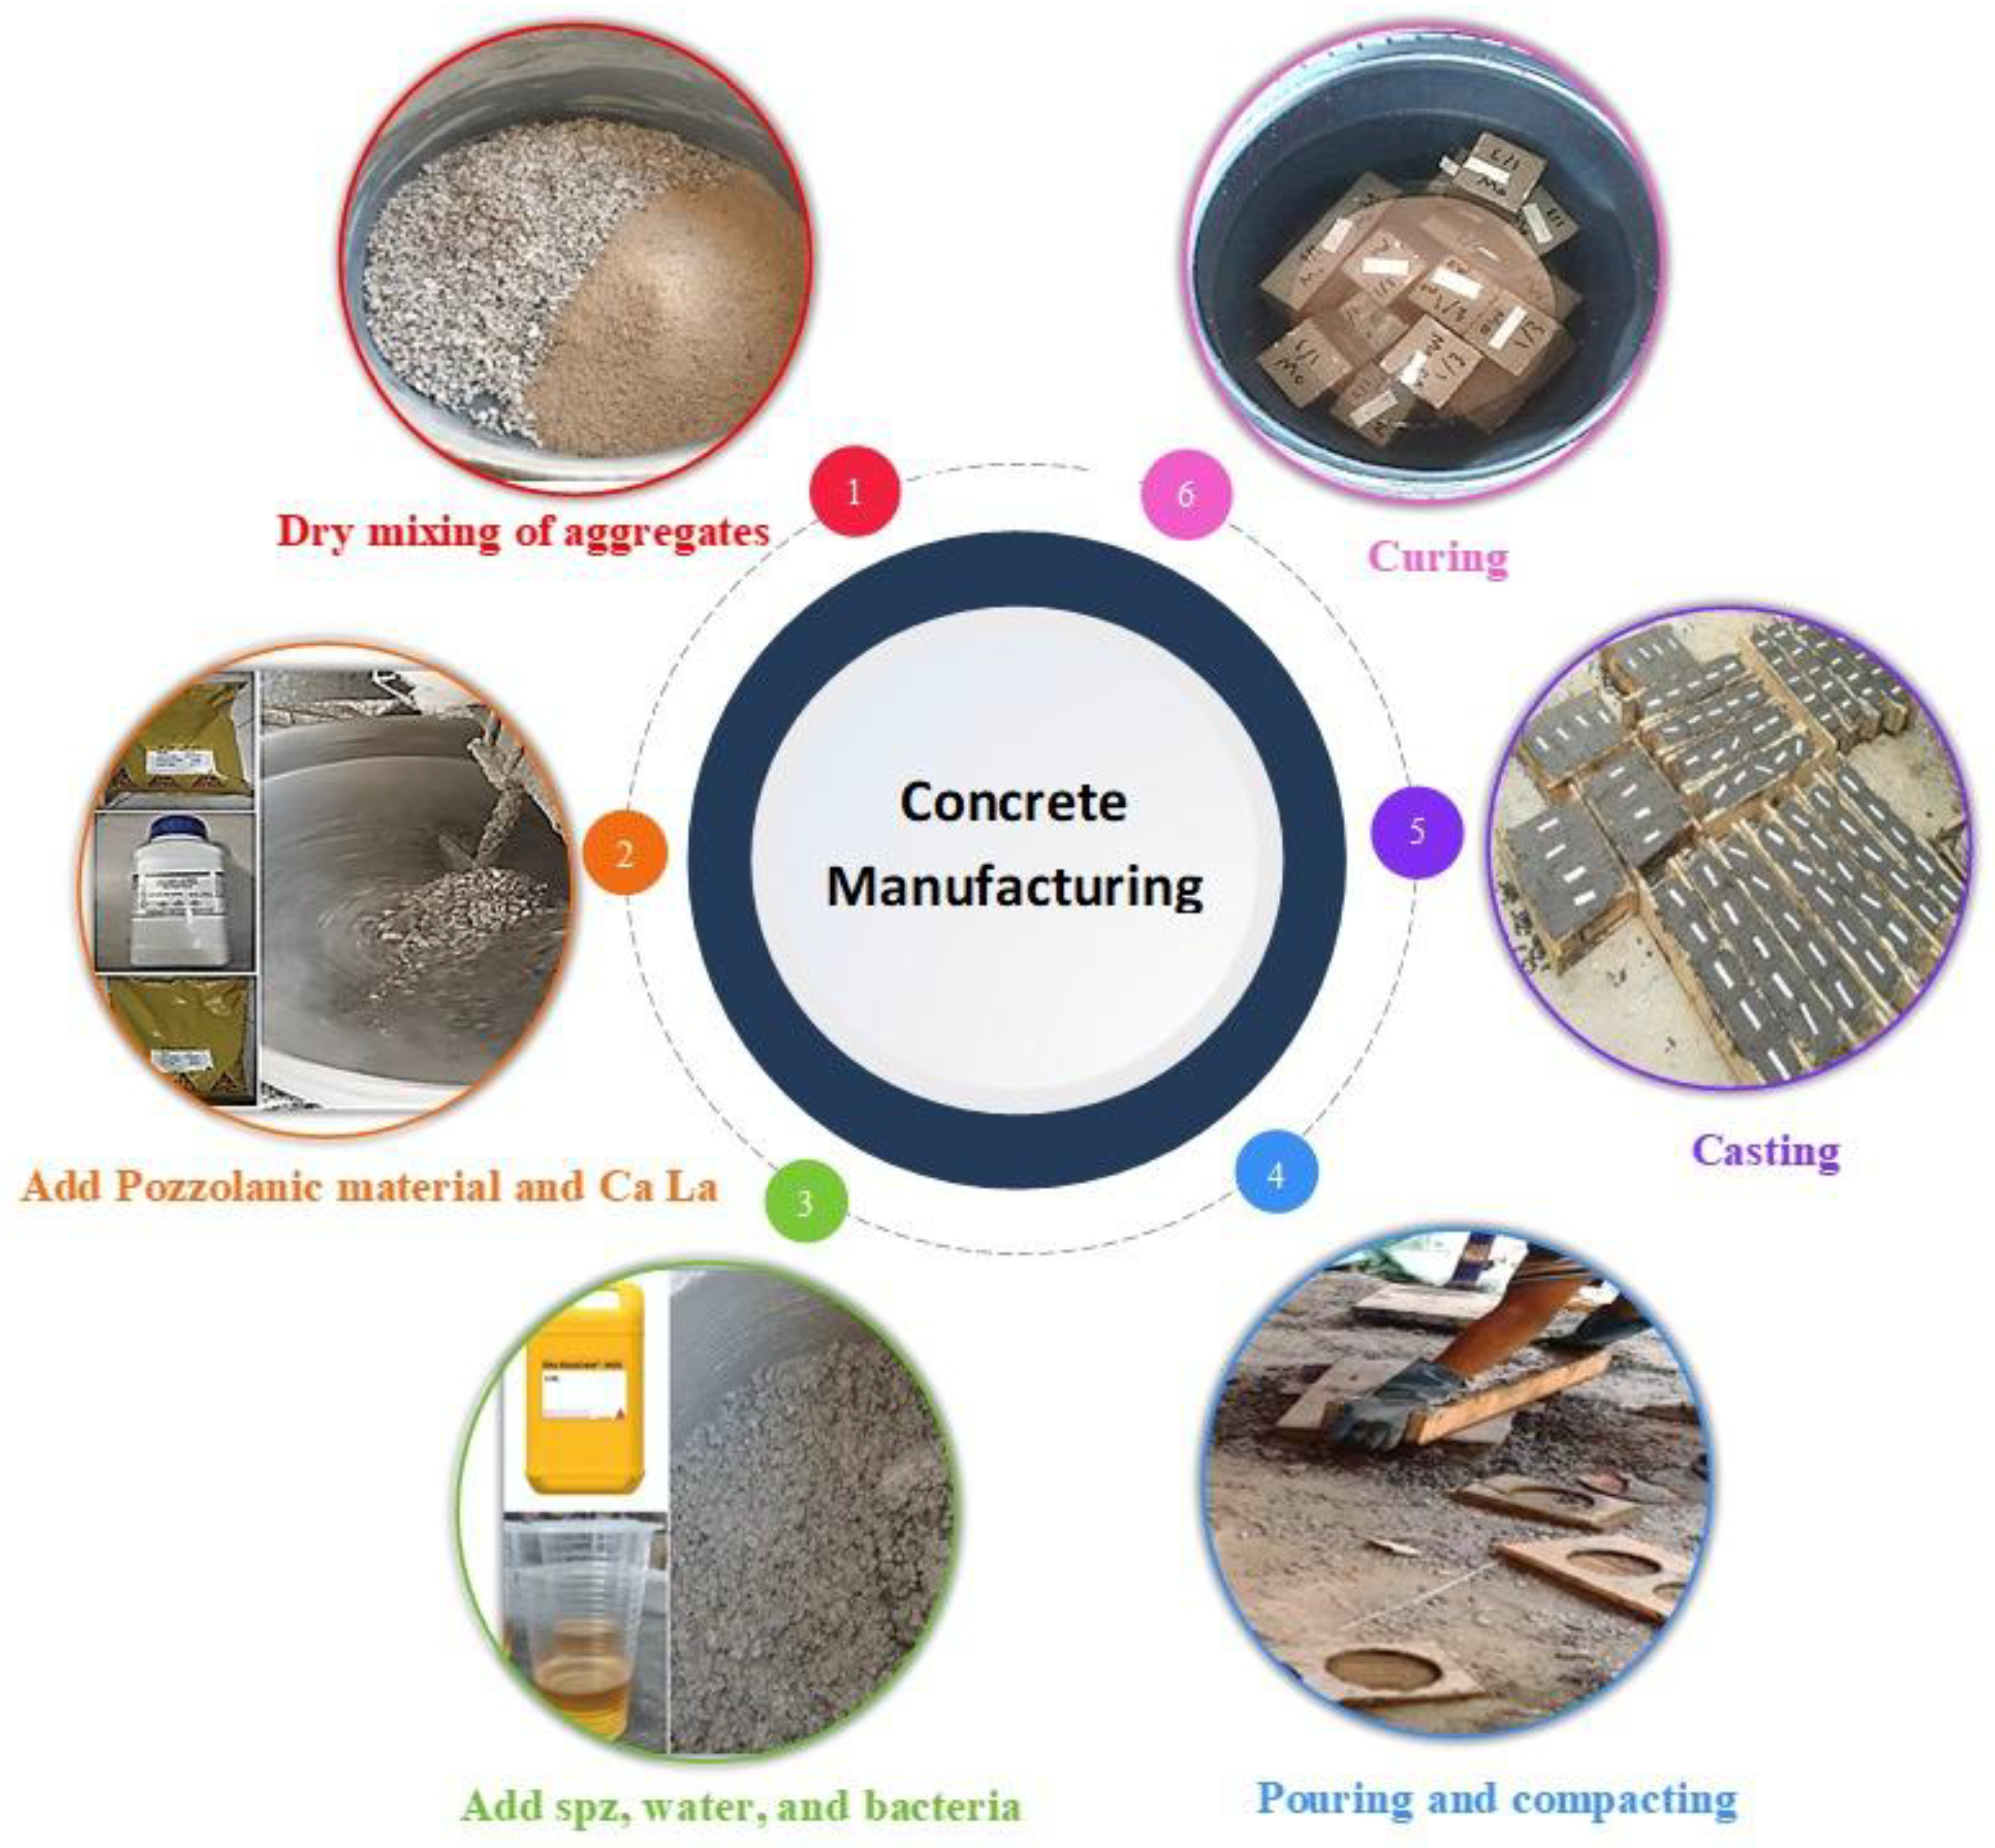
Figure 6.
(a) Specimen before cracking. (b) Specimen after cracking.
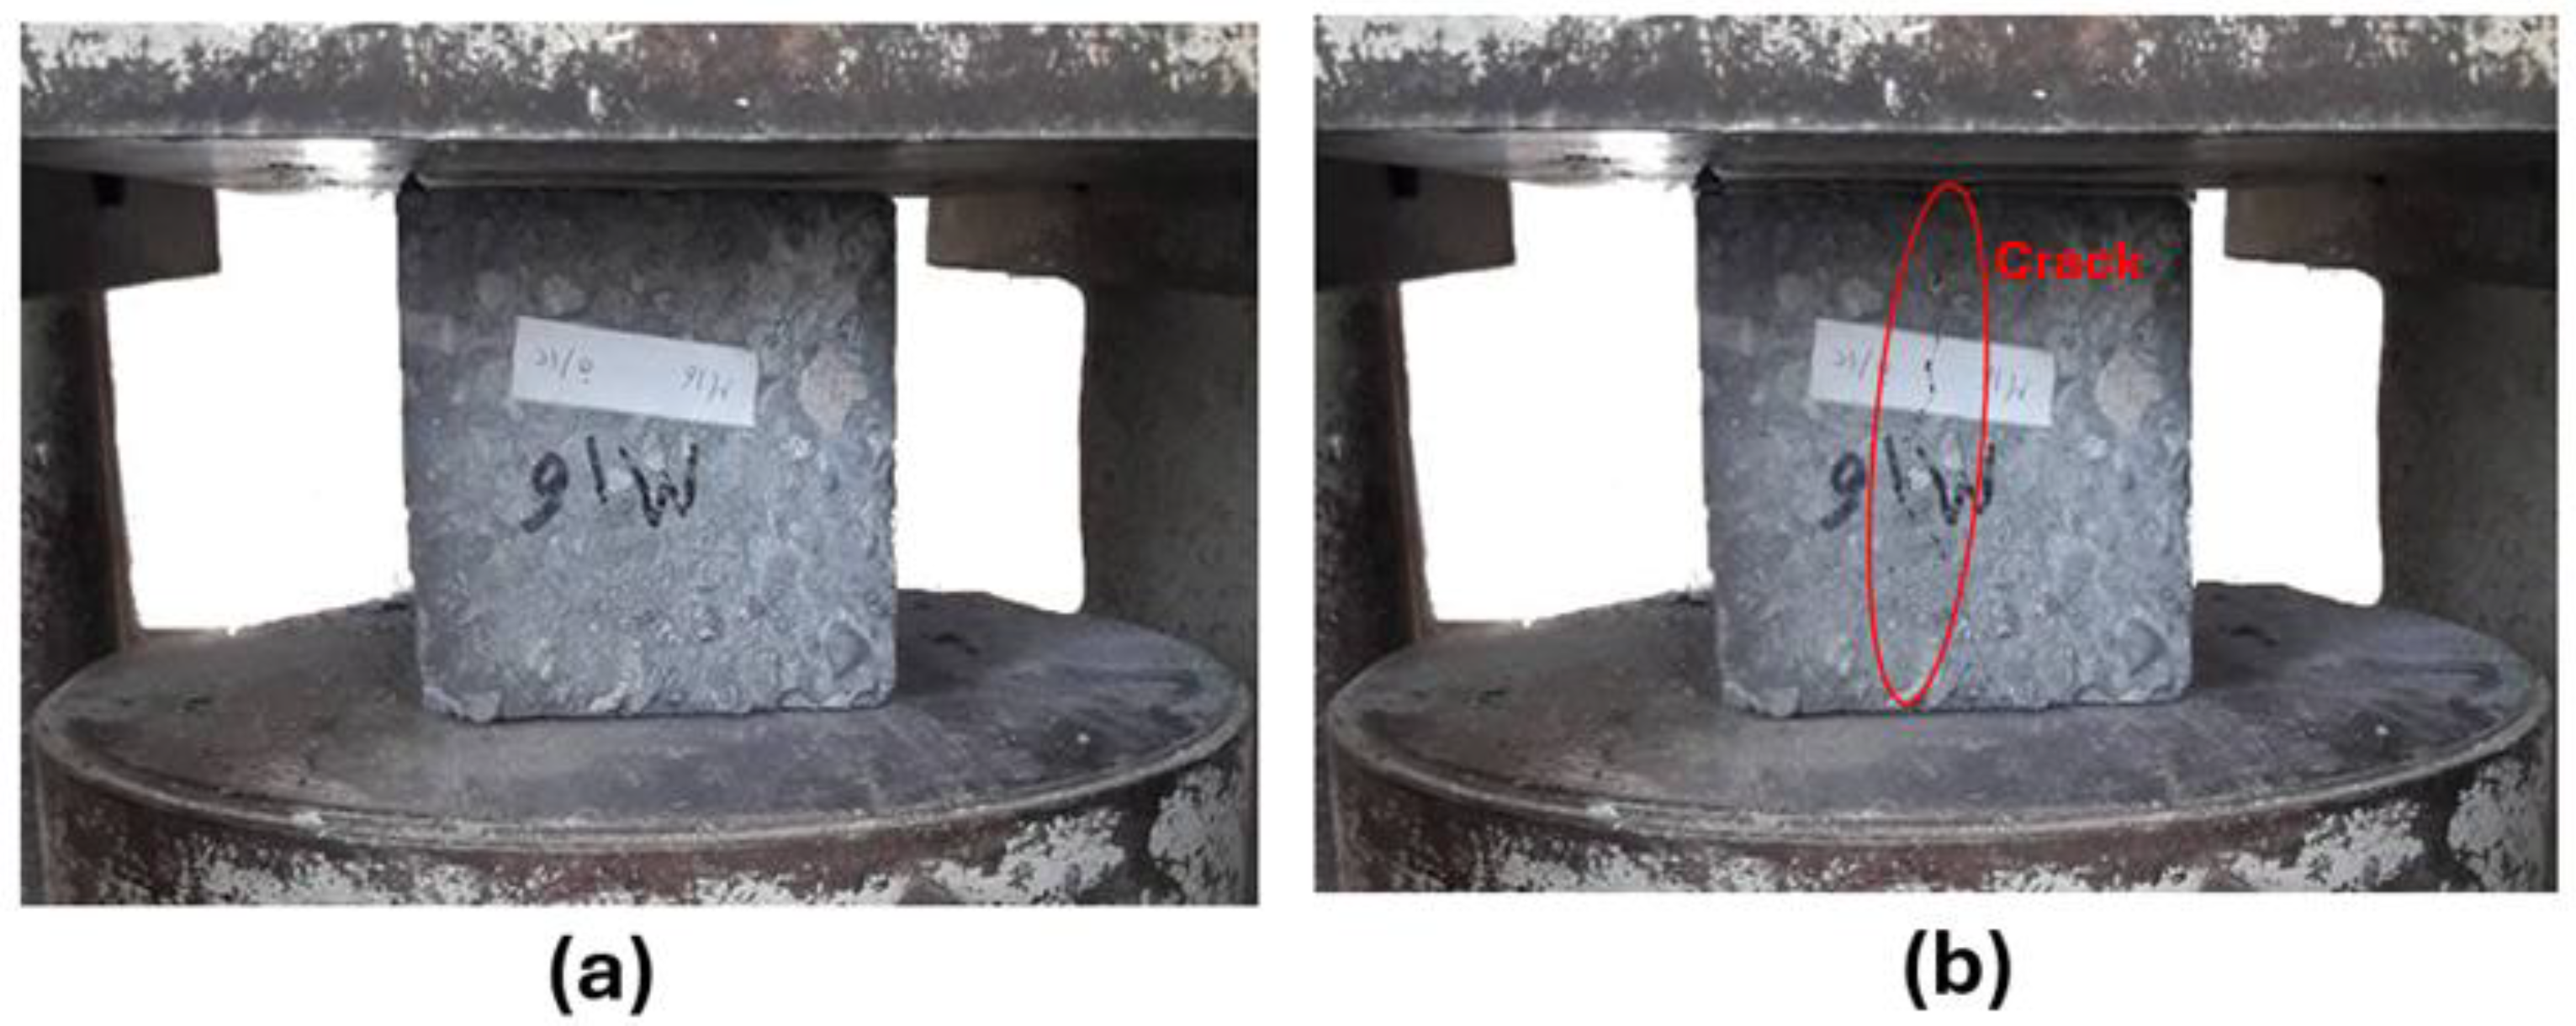
Figure 7.
(a): Creation of visible cracks, and (b): The experimental device for measuring visible cracks.
Figure 7.
(a): Creation of visible cracks, and (b): The experimental device for measuring visible cracks.
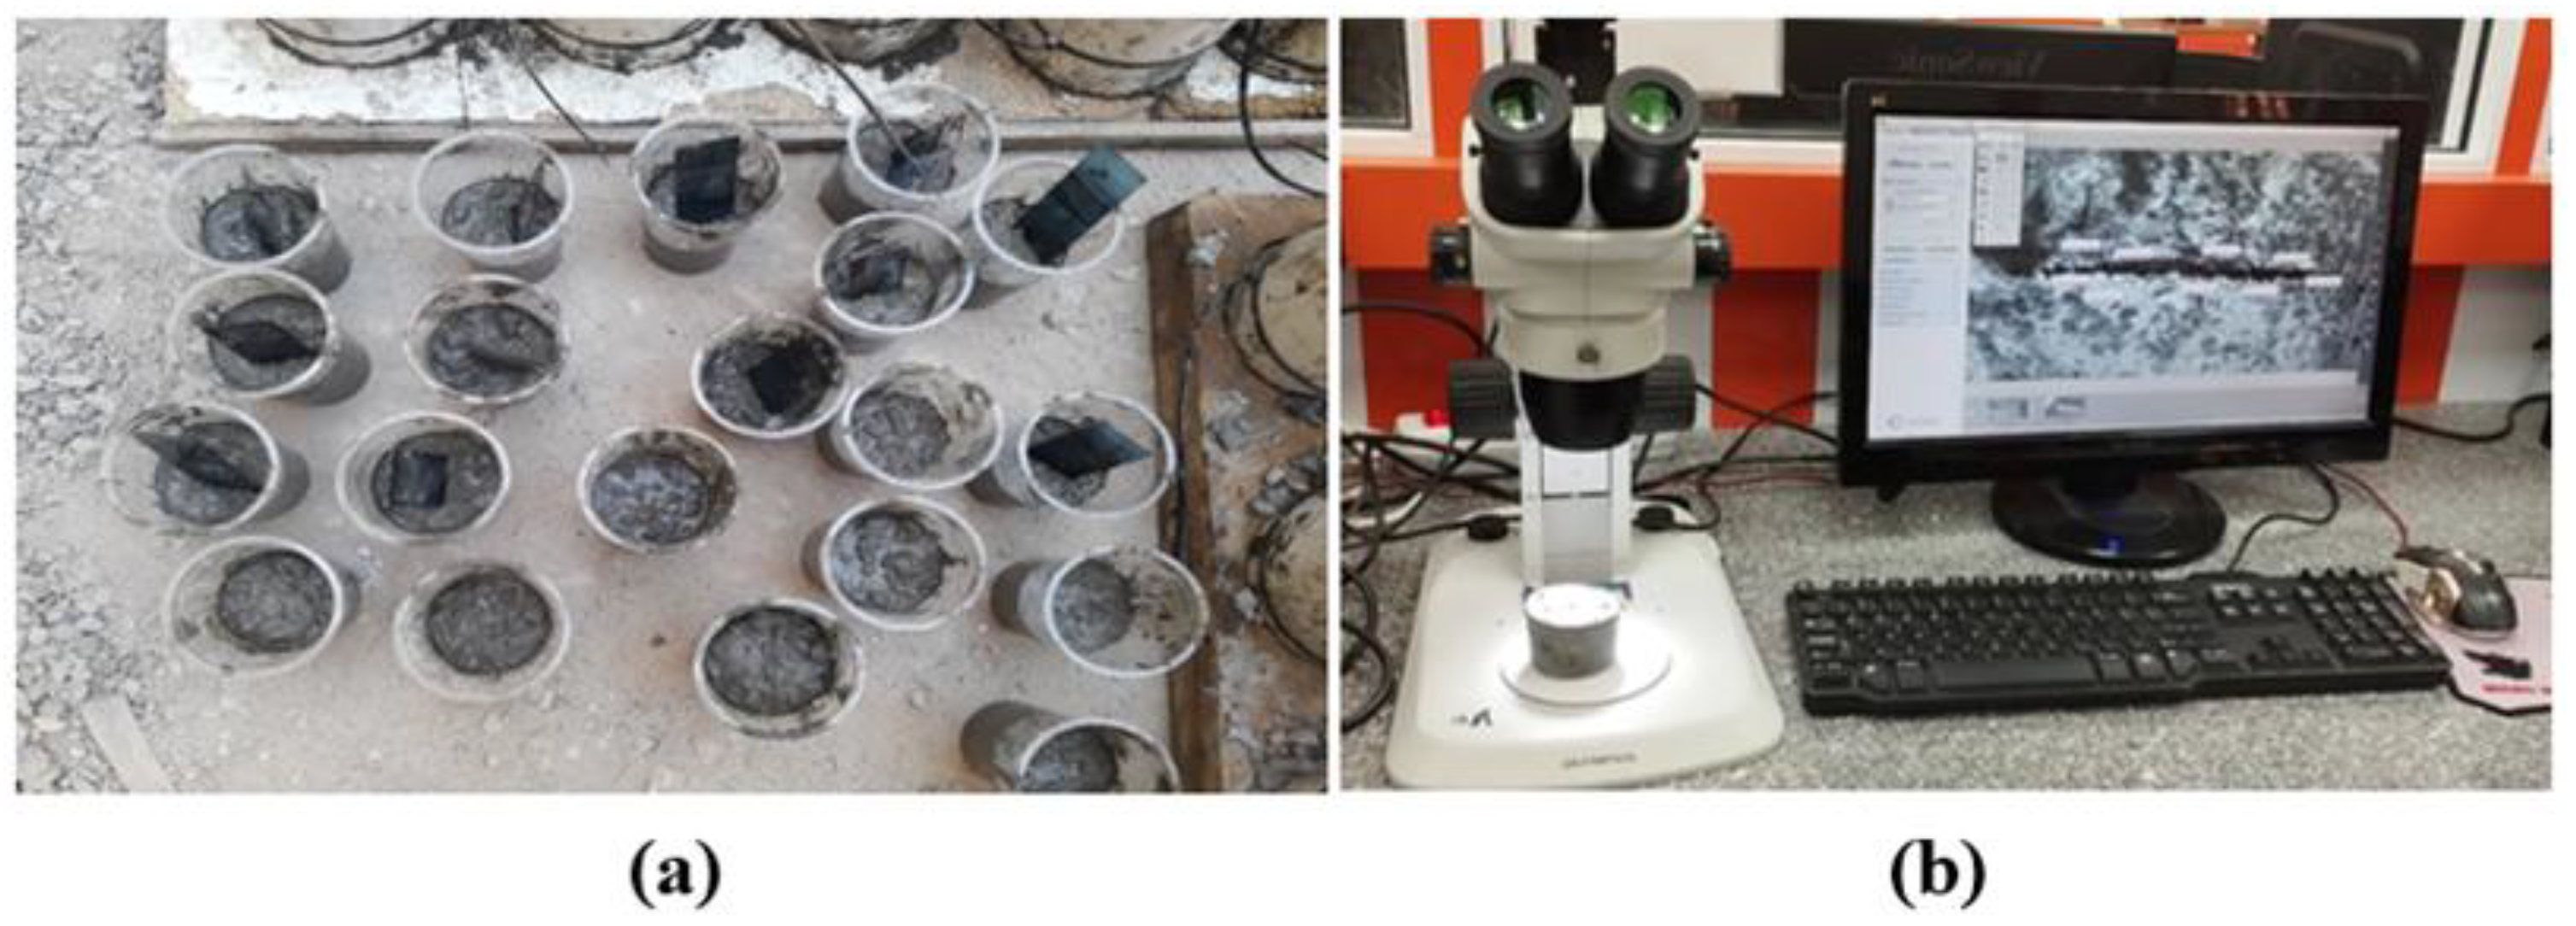
Figure 8.
Impact of bacterial content on the compressive strength of concrete for uncracked specimens for silica fume at 7, 28, 56, and 120 days: (A) at 0% sulfate, (B) at 2% sulfate, (C) at 5% sulfate, and (D) at 10% sulfate.
Figure 8.
Impact of bacterial content on the compressive strength of concrete for uncracked specimens for silica fume at 7, 28, 56, and 120 days: (A) at 0% sulfate, (B) at 2% sulfate, (C) at 5% sulfate, and (D) at 10% sulfate.
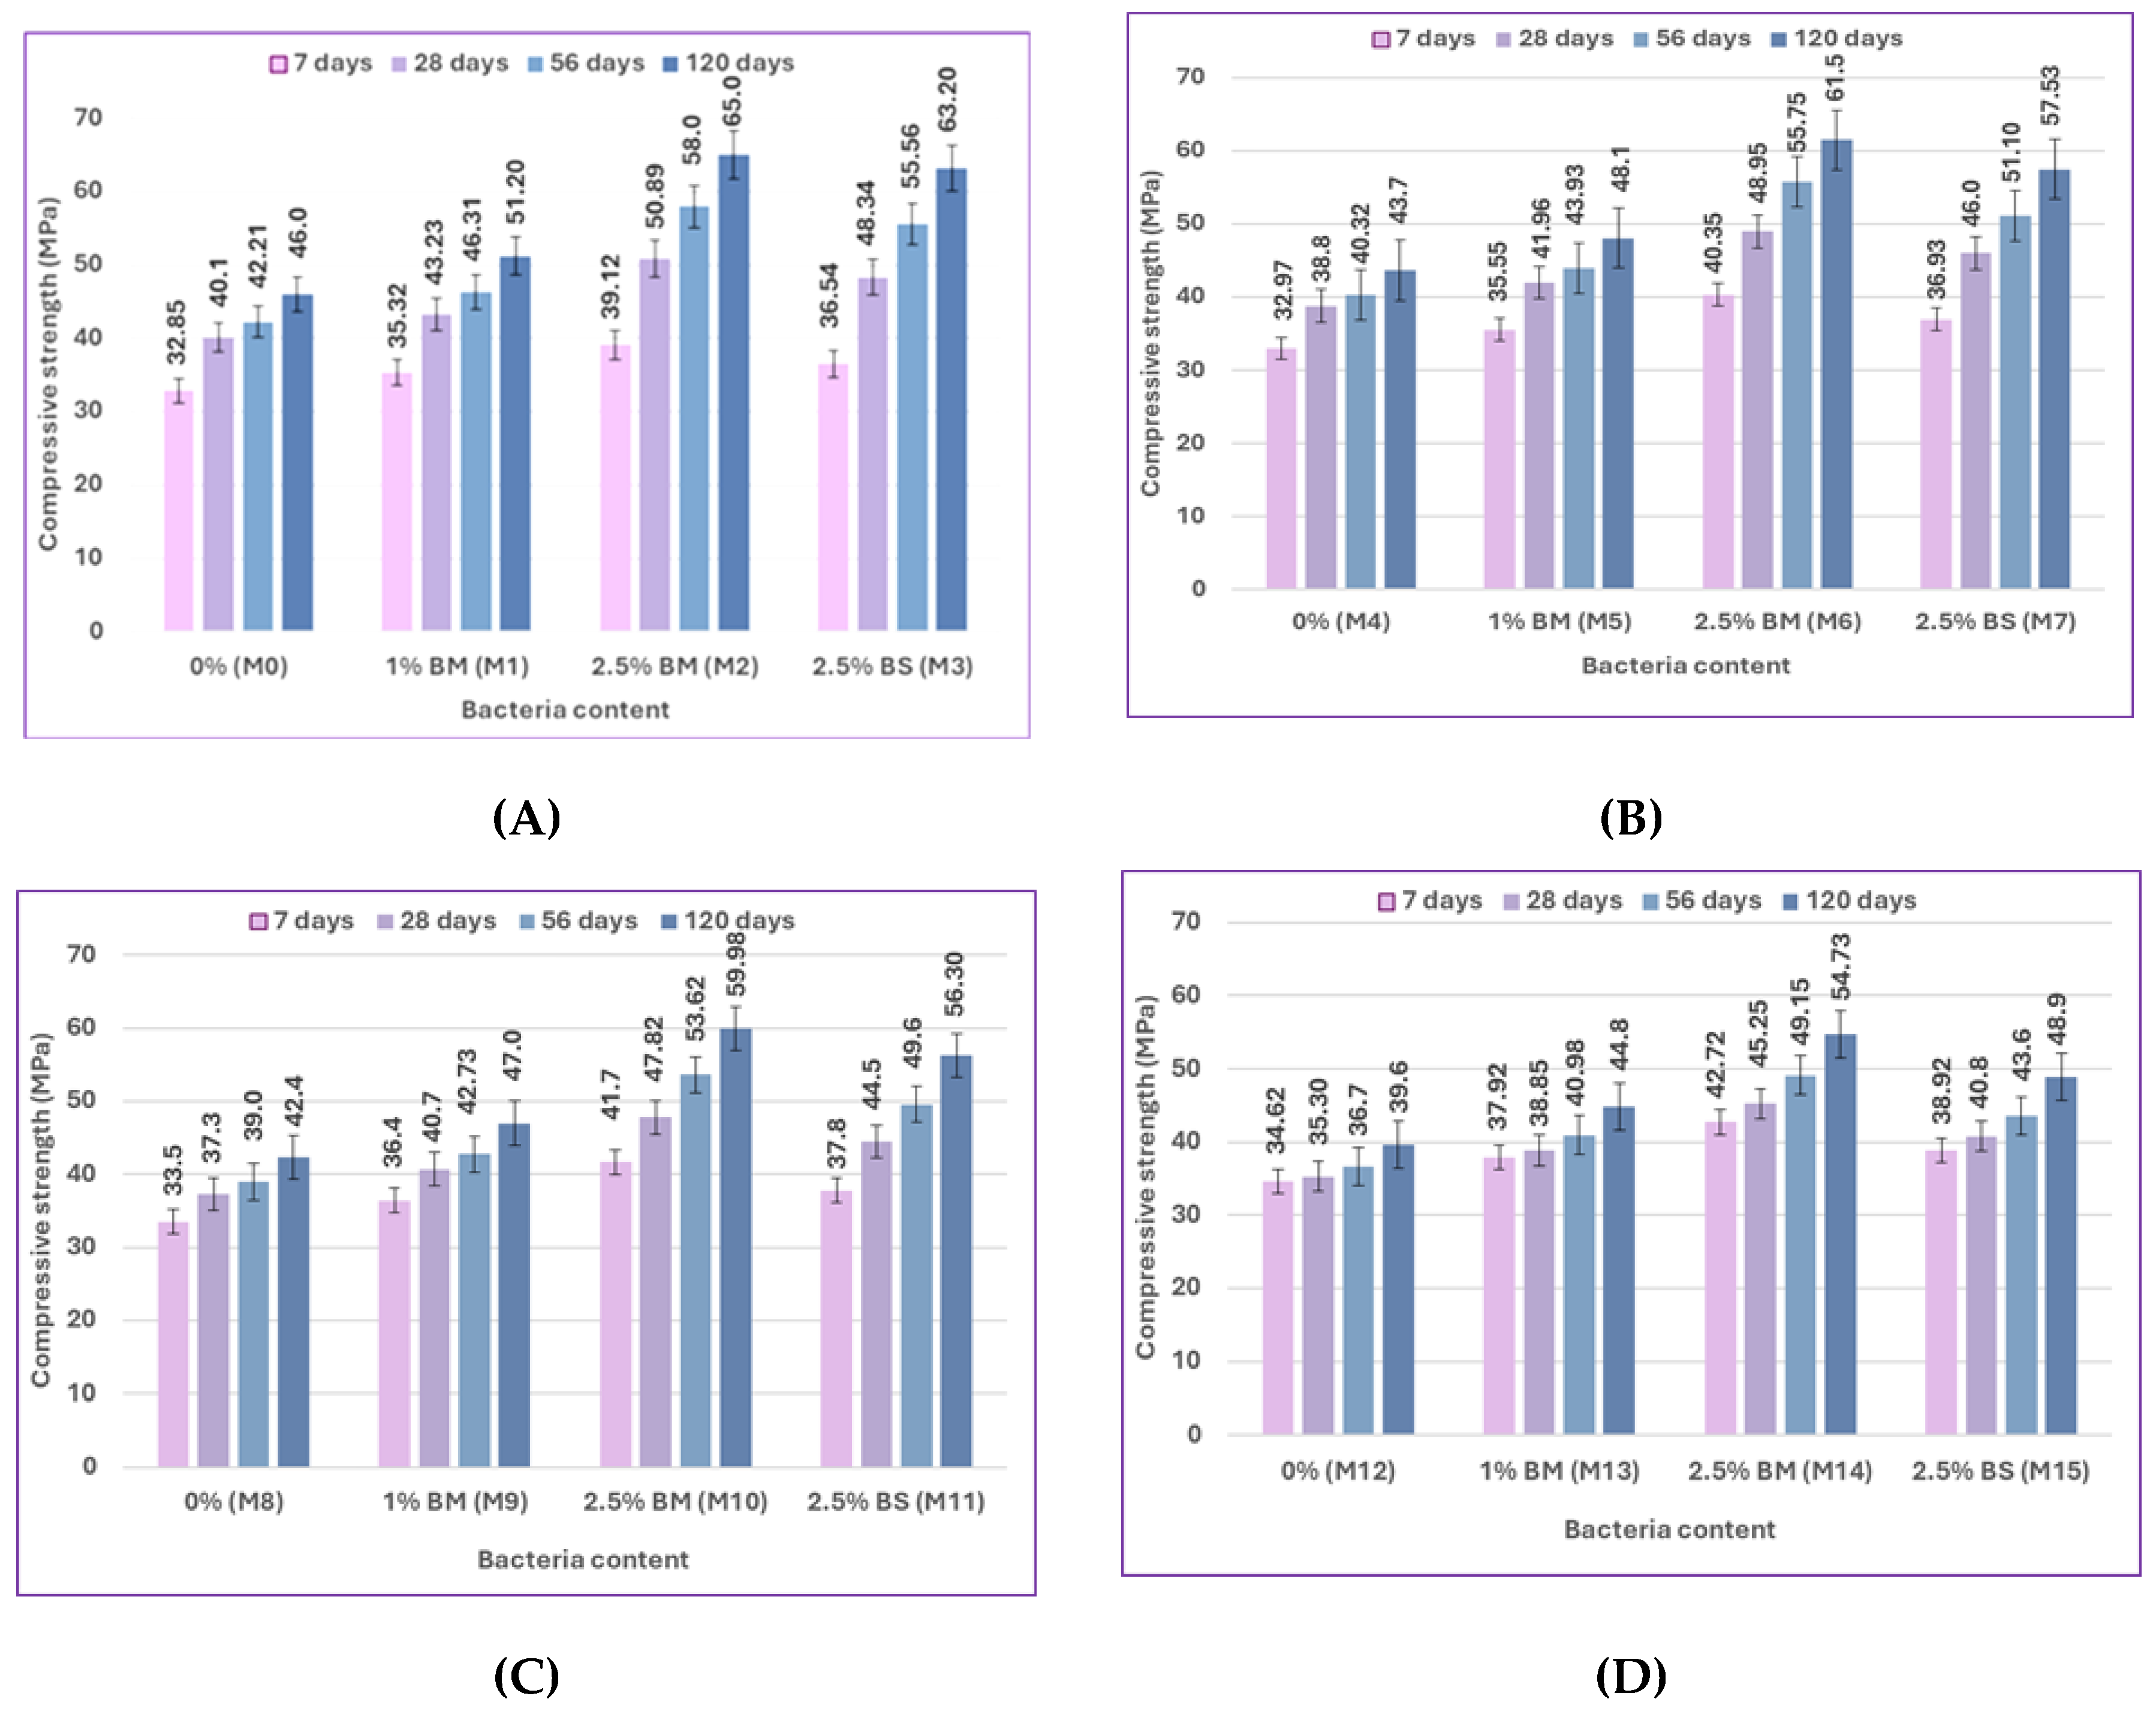
Figure 9.
Impact of bacterial content on the compressive strength of concrete for uncracked specimens for fly ash at 7, 28, 56, and 120 days: (A) at 0% sulfate, (B) at 2% sulfate, (C) at 5% sulfate, and (D) at 10% sulfate.
Figure 9.
Impact of bacterial content on the compressive strength of concrete for uncracked specimens for fly ash at 7, 28, 56, and 120 days: (A) at 0% sulfate, (B) at 2% sulfate, (C) at 5% sulfate, and (D) at 10% sulfate.
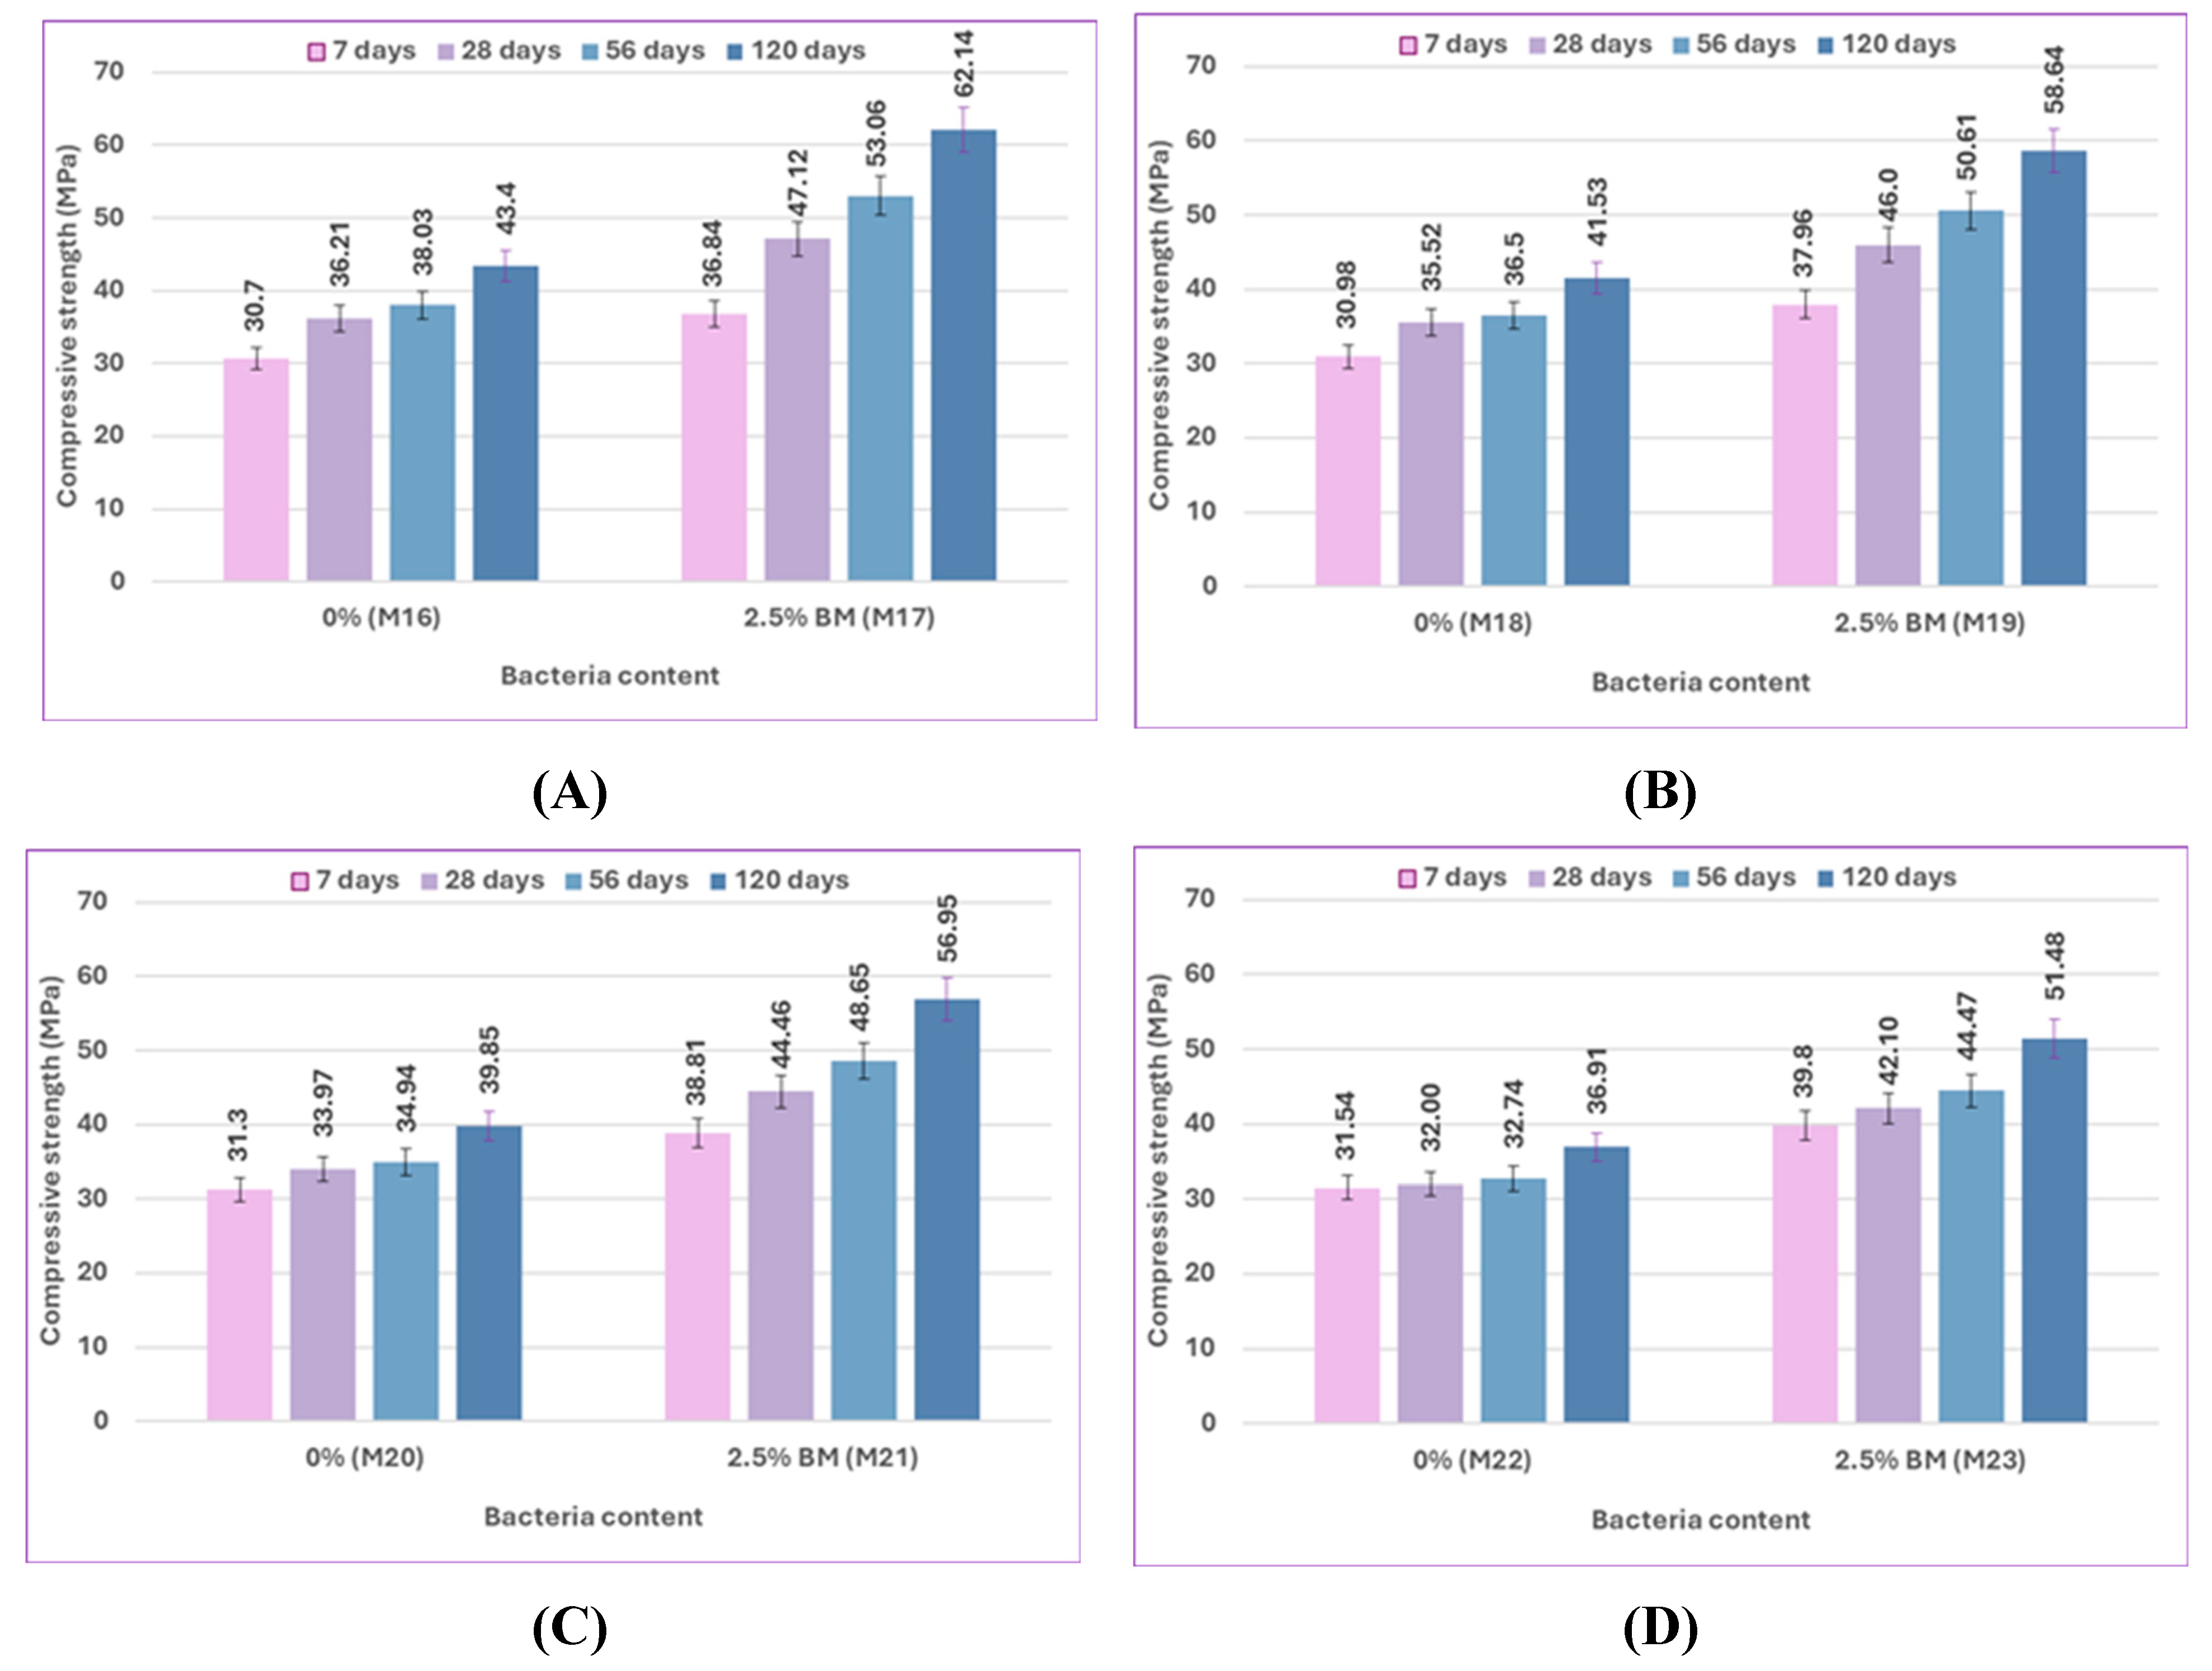
Figure 10.
Impact of bacterial type on the compressive strength of concrete for uncracked specimens for silica fume at 7, 28, 56, and 120 days: (A) at 0% sulfate, (B) at 2% sulfate, (C) at 5% sulfate, and (D) at 10% sulfate.
Figure 10.
Impact of bacterial type on the compressive strength of concrete for uncracked specimens for silica fume at 7, 28, 56, and 120 days: (A) at 0% sulfate, (B) at 2% sulfate, (C) at 5% sulfate, and (D) at 10% sulfate.
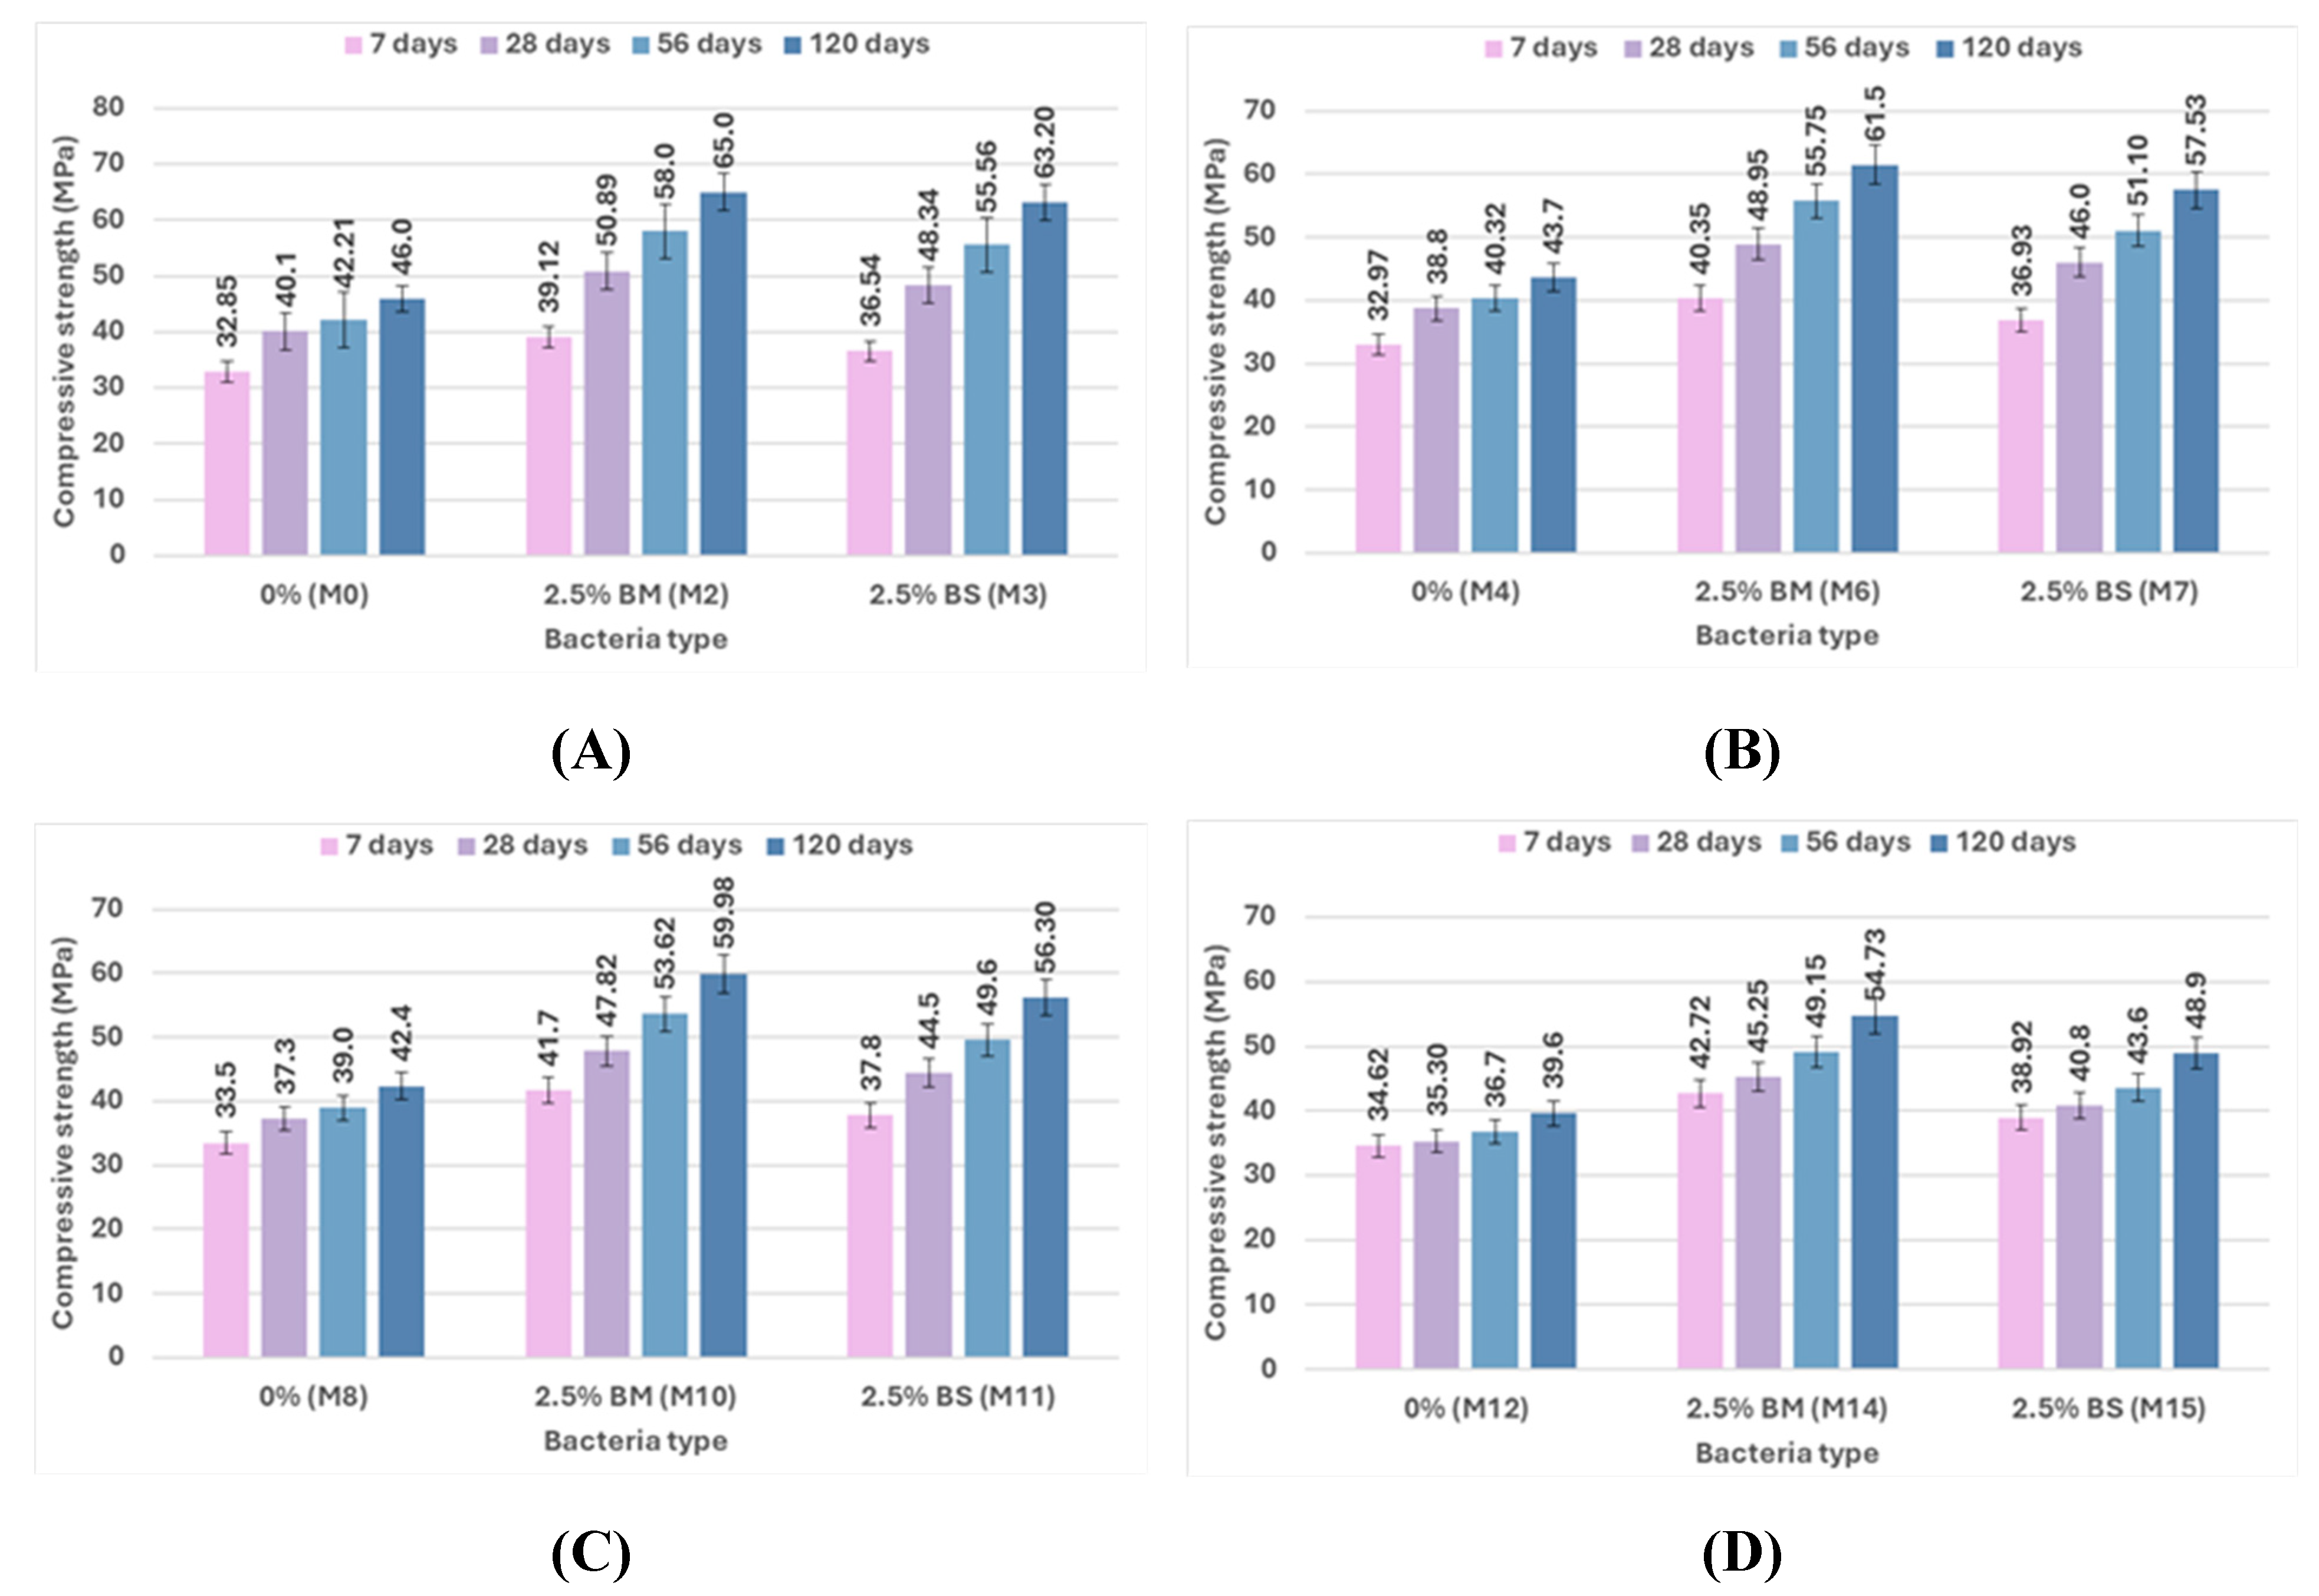
Figure 11.
Impact of pozzolanic material type on the compressive strength of concrete for uncracked specimens at 7, 28, 56, and 120 days: (A) at 0% sulfate, (B) at 2% sulfate, (C) at 5% sulfate, and (D) at 10% sulfate.
Figure 11.
Impact of pozzolanic material type on the compressive strength of concrete for uncracked specimens at 7, 28, 56, and 120 days: (A) at 0% sulfate, (B) at 2% sulfate, (C) at 5% sulfate, and (D) at 10% sulfate.
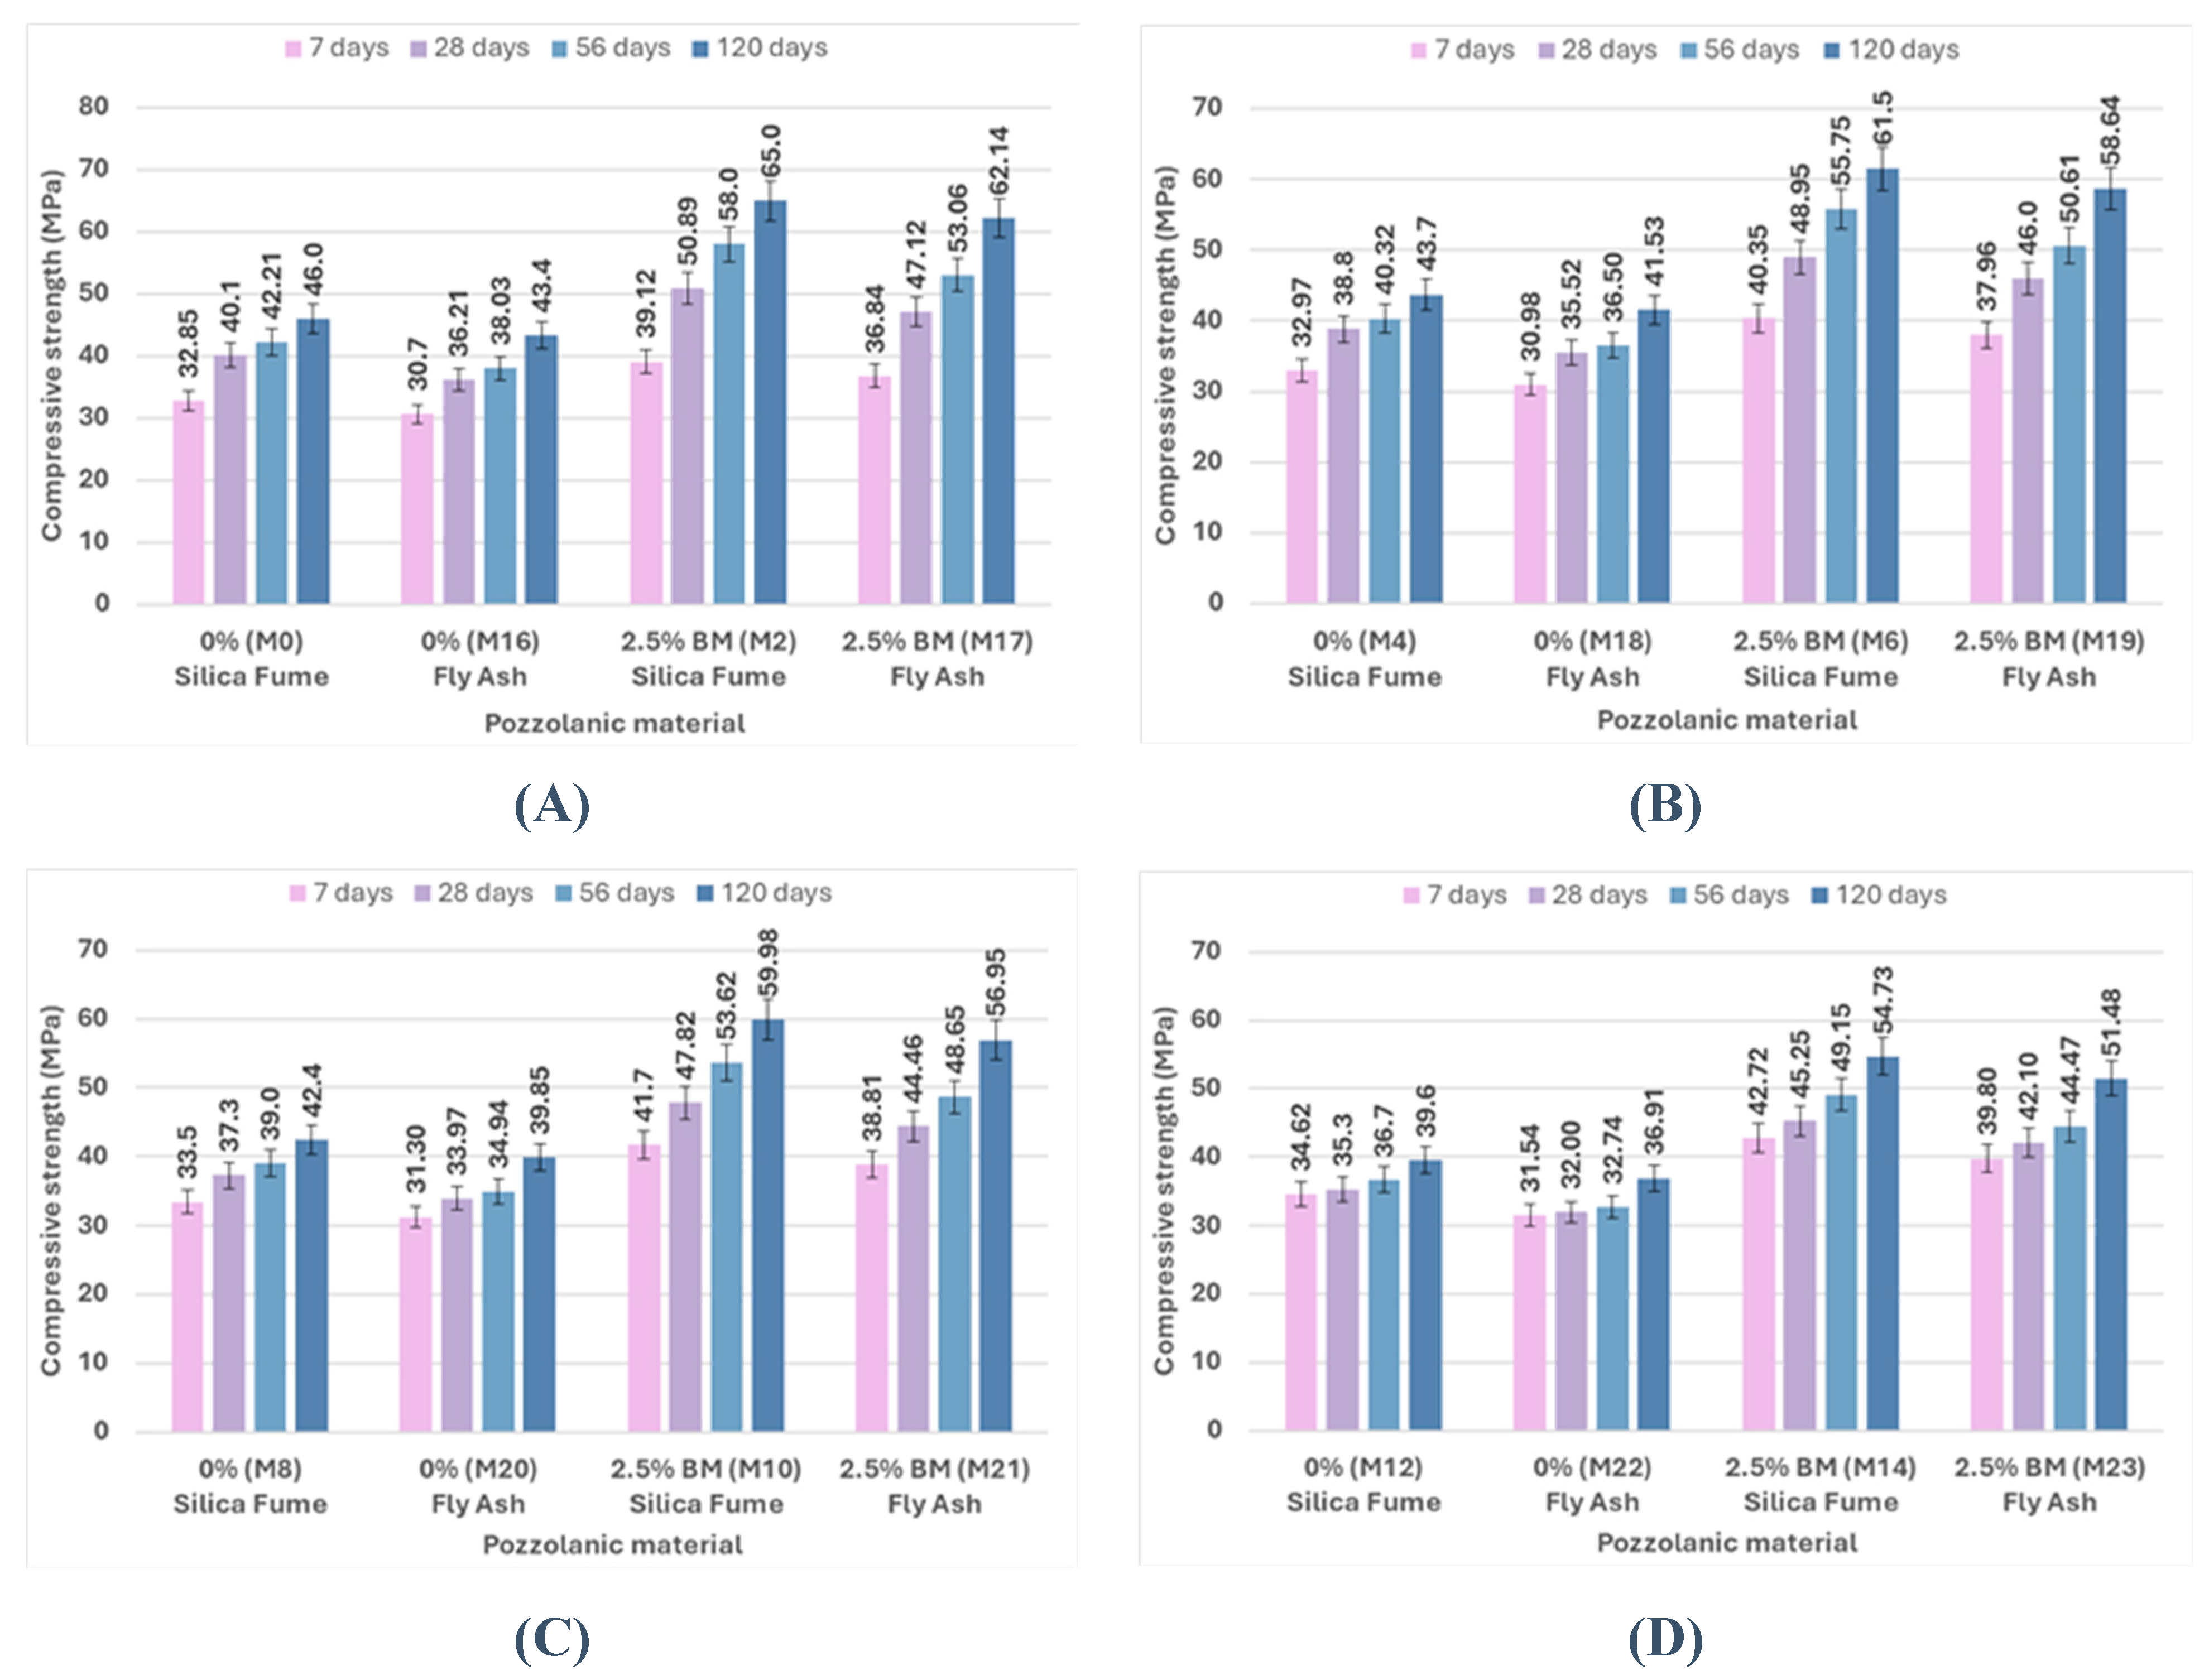
Figure 12.
Impact of curing type on the compressive strength of concrete for uncracked specimens for silica fume at 7, 28, 56, and 120 days: (A) at 0% bacteria, (B) at 1% bacteria BM, (C) at 2.5% bacteria BM, and (D) at 2.5% bacteria BS.
Figure 12.
Impact of curing type on the compressive strength of concrete for uncracked specimens for silica fume at 7, 28, 56, and 120 days: (A) at 0% bacteria, (B) at 1% bacteria BM, (C) at 2.5% bacteria BM, and (D) at 2.5% bacteria BS.
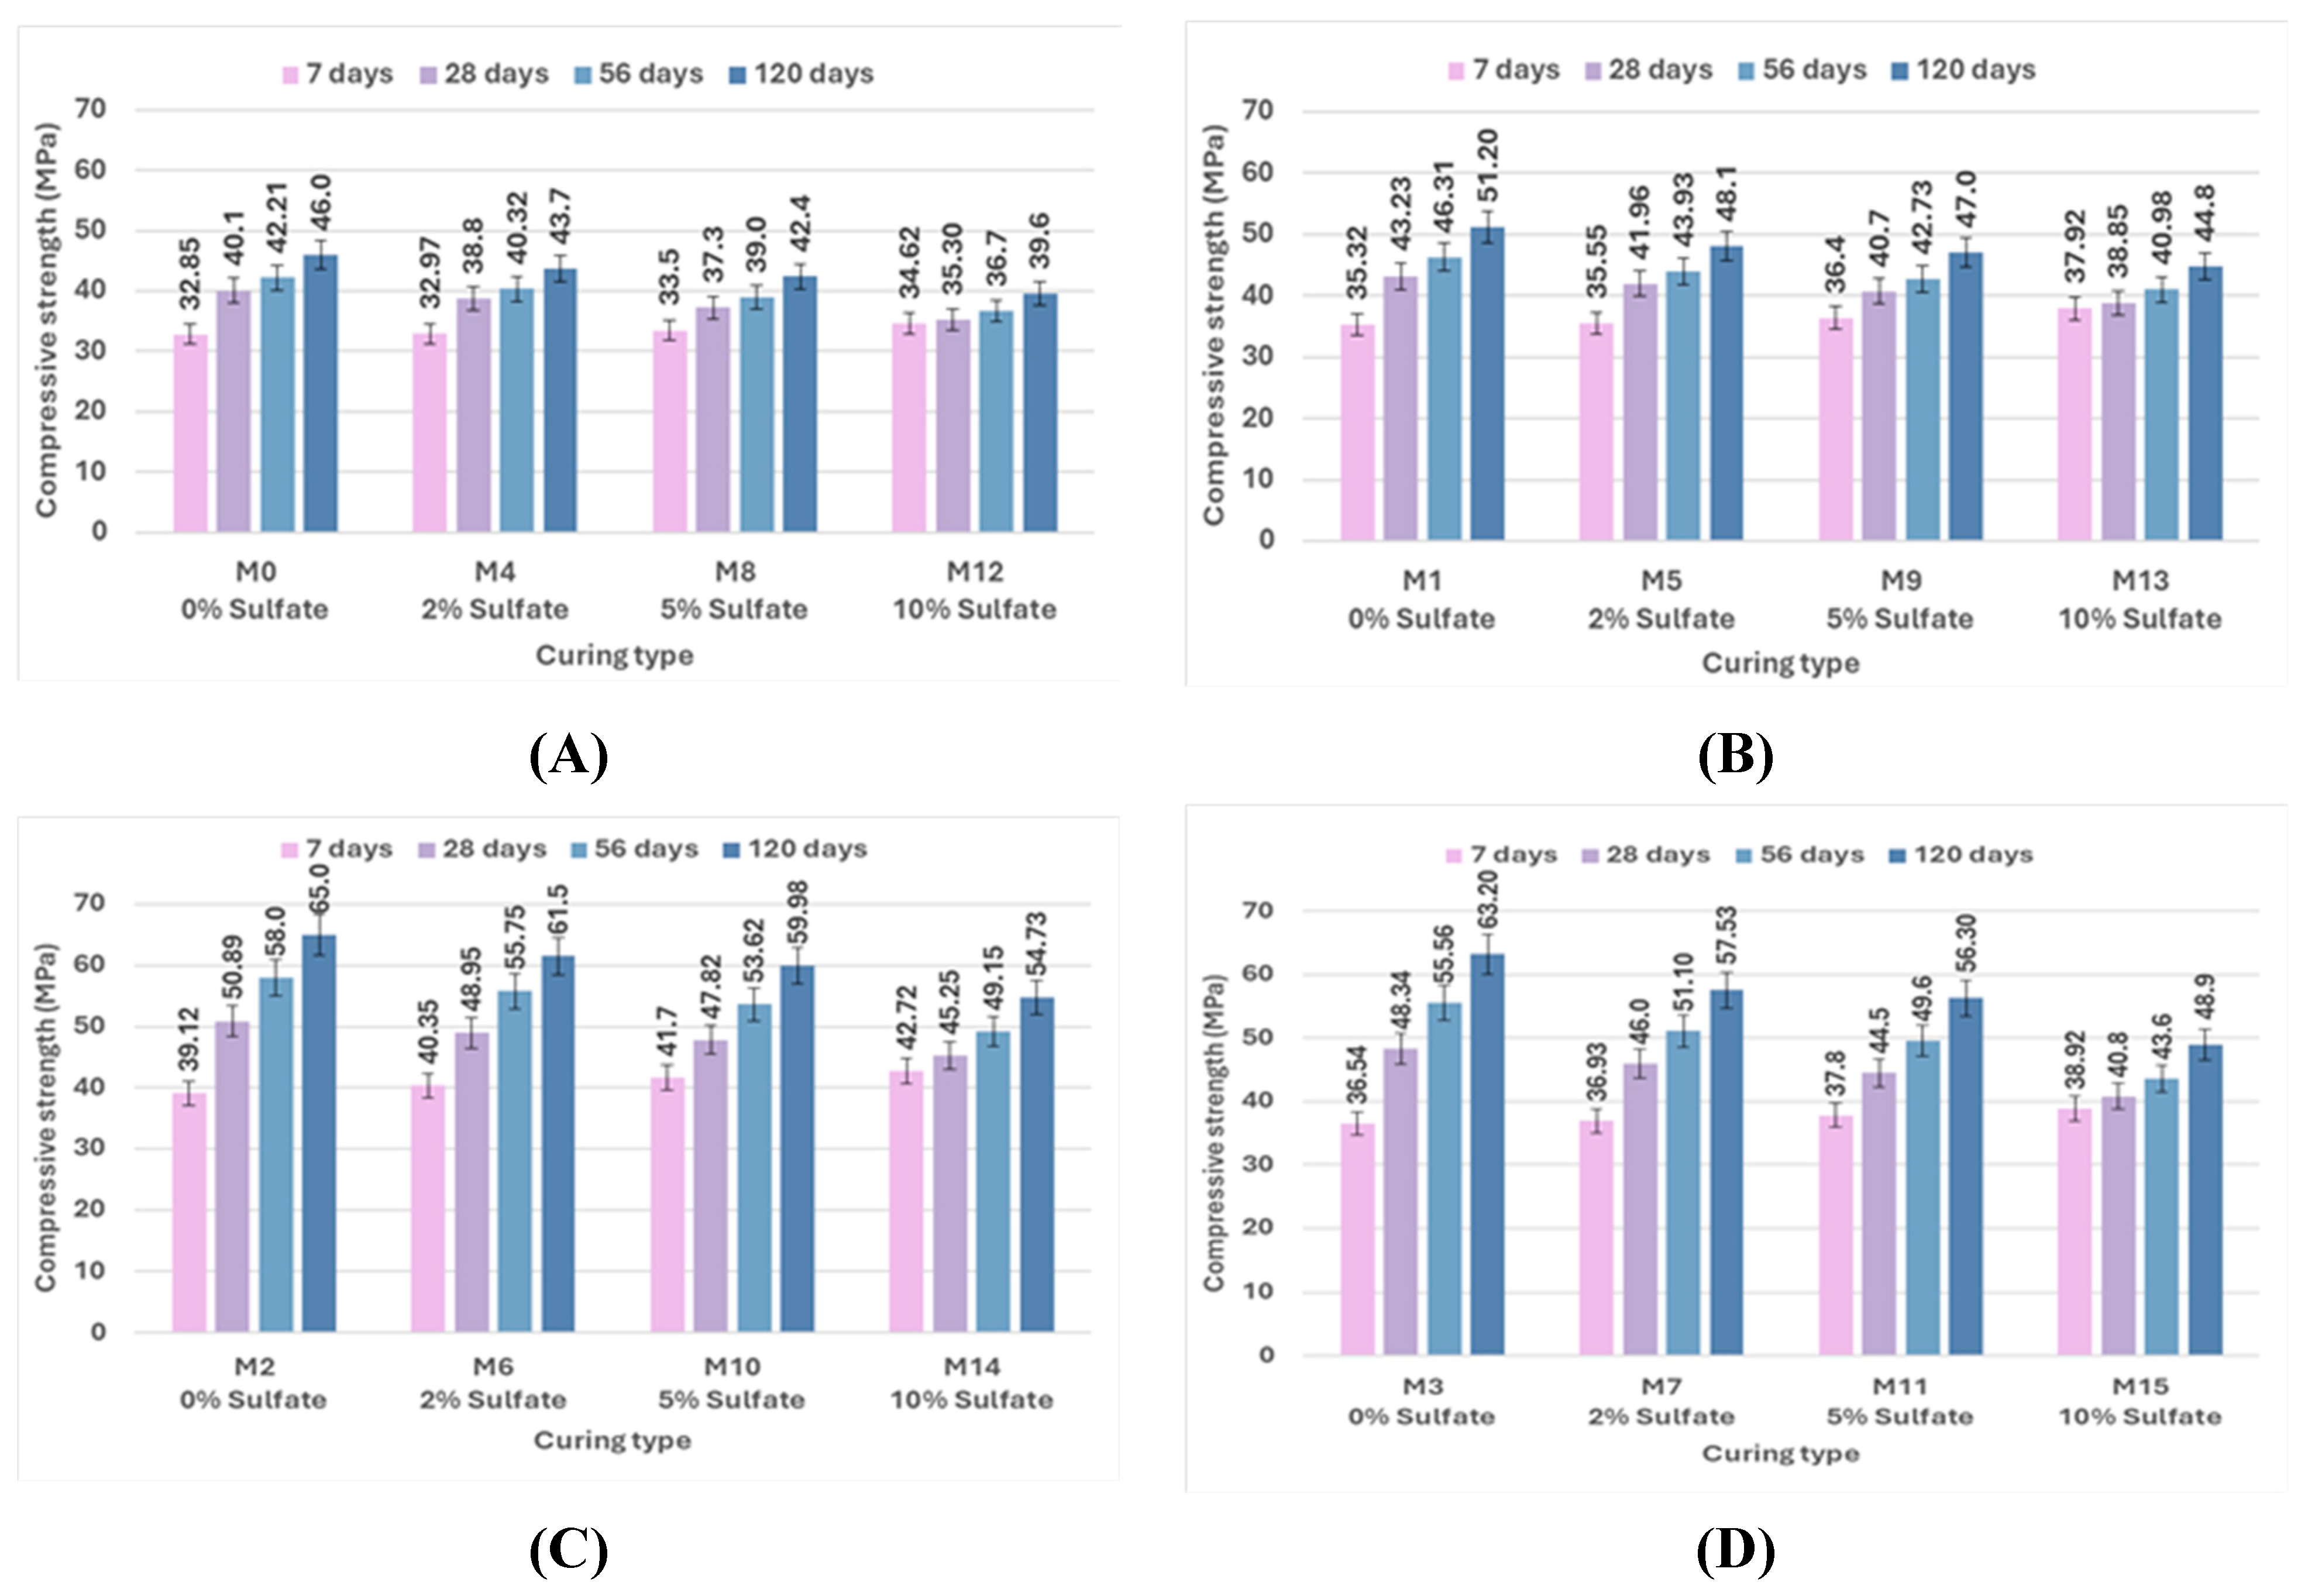
Figure 13.
Impact of curing type on the compressive strength of concrete for uncracked specimens for fly ash at 7, 28, 56, and 120 days: (A) at 0% bacteria, (B) at 2.5% bacteria BM.
Figure 13.
Impact of curing type on the compressive strength of concrete for uncracked specimens for fly ash at 7, 28, 56, and 120 days: (A) at 0% bacteria, (B) at 2.5% bacteria BM.
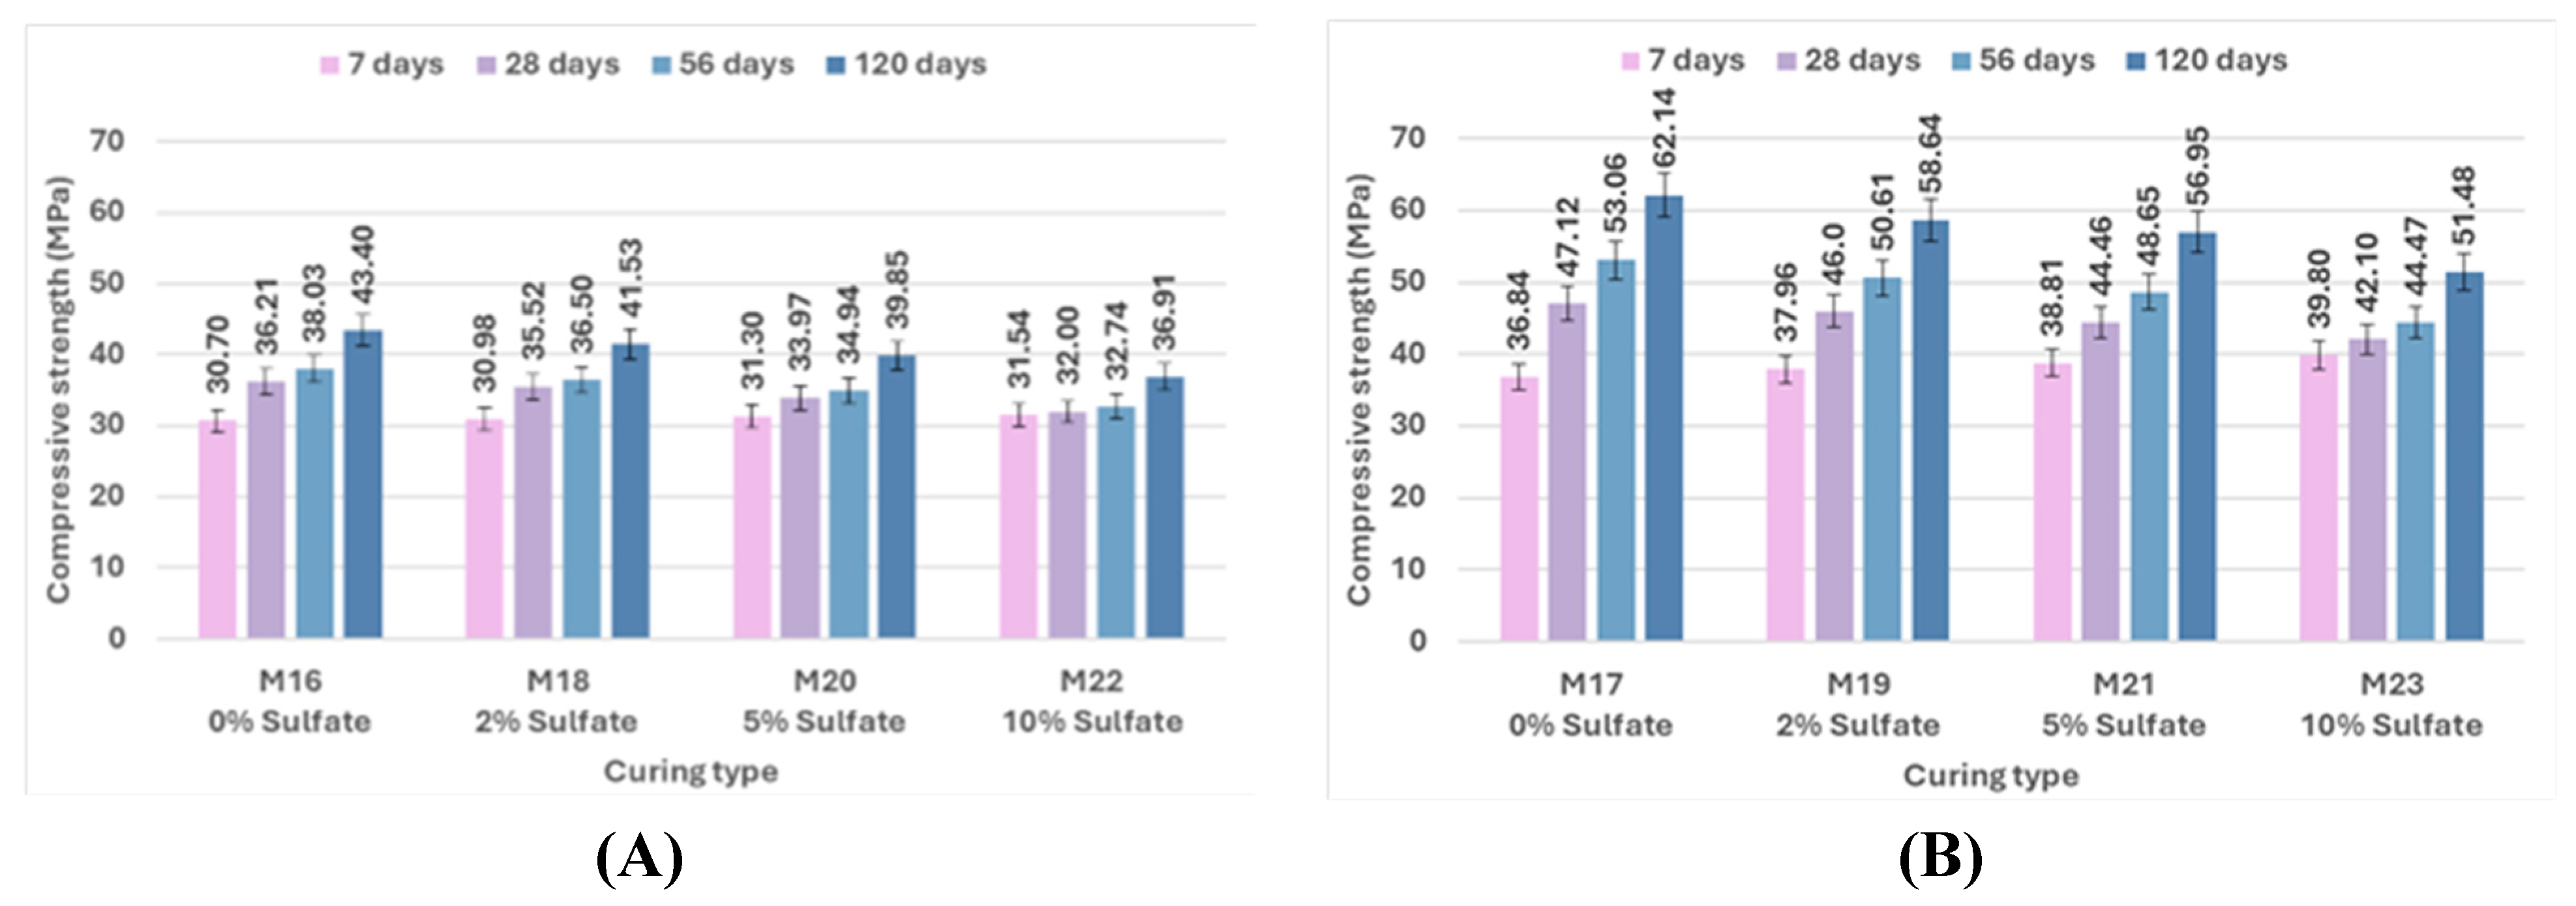
Figure 14.
Impact of bacterial content on the flexural strength of concrete for uncracked specimens for silica fume at 28 and 56 days: (A) at 0% sulfate, (B) at 2% sulfate, (C) at 5% sulfate, and (D) at 10% sulfate.
Figure 14.
Impact of bacterial content on the flexural strength of concrete for uncracked specimens for silica fume at 28 and 56 days: (A) at 0% sulfate, (B) at 2% sulfate, (C) at 5% sulfate, and (D) at 10% sulfate.
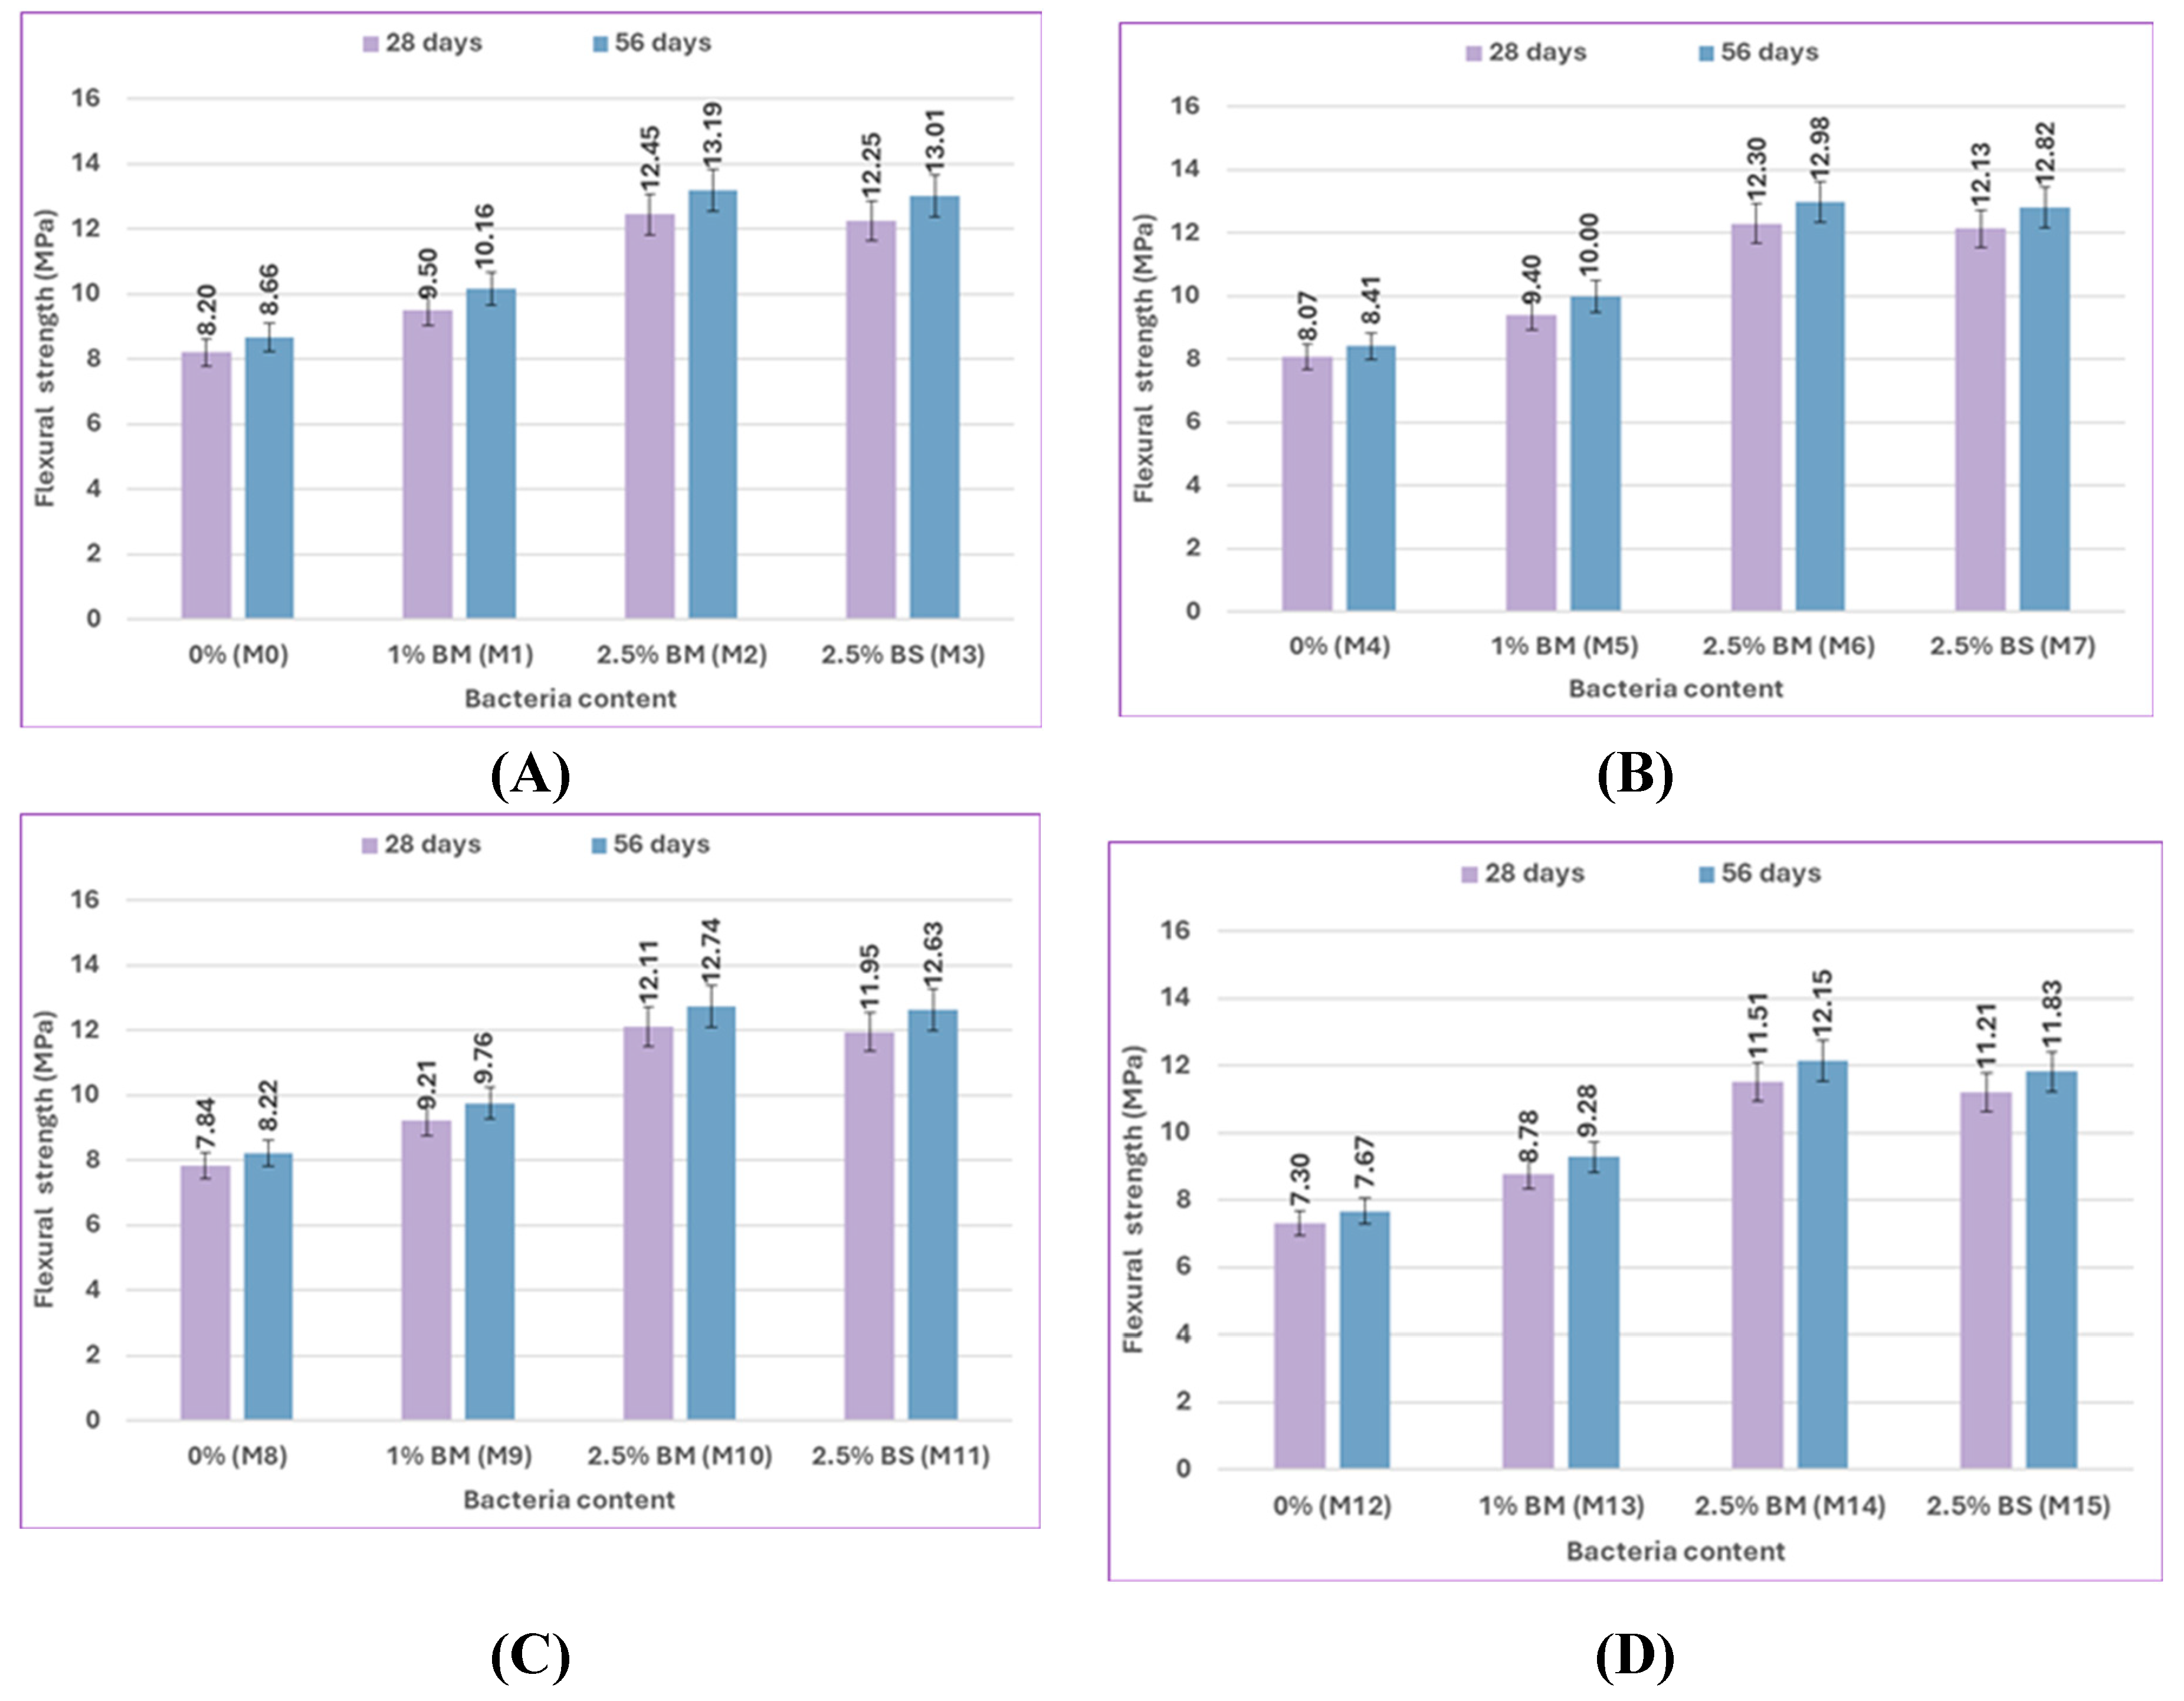
Figure 15.
Impact of bacterial content on the flexural strength of concrete for uncracked specimens for fly ash at 28 and 56 days: (A) at 0% sulfate, (B) at 2% sulfate, (C) at 5% sulfate, and (D) at 10% sulfate.
Figure 15.
Impact of bacterial content on the flexural strength of concrete for uncracked specimens for fly ash at 28 and 56 days: (A) at 0% sulfate, (B) at 2% sulfate, (C) at 5% sulfate, and (D) at 10% sulfate.
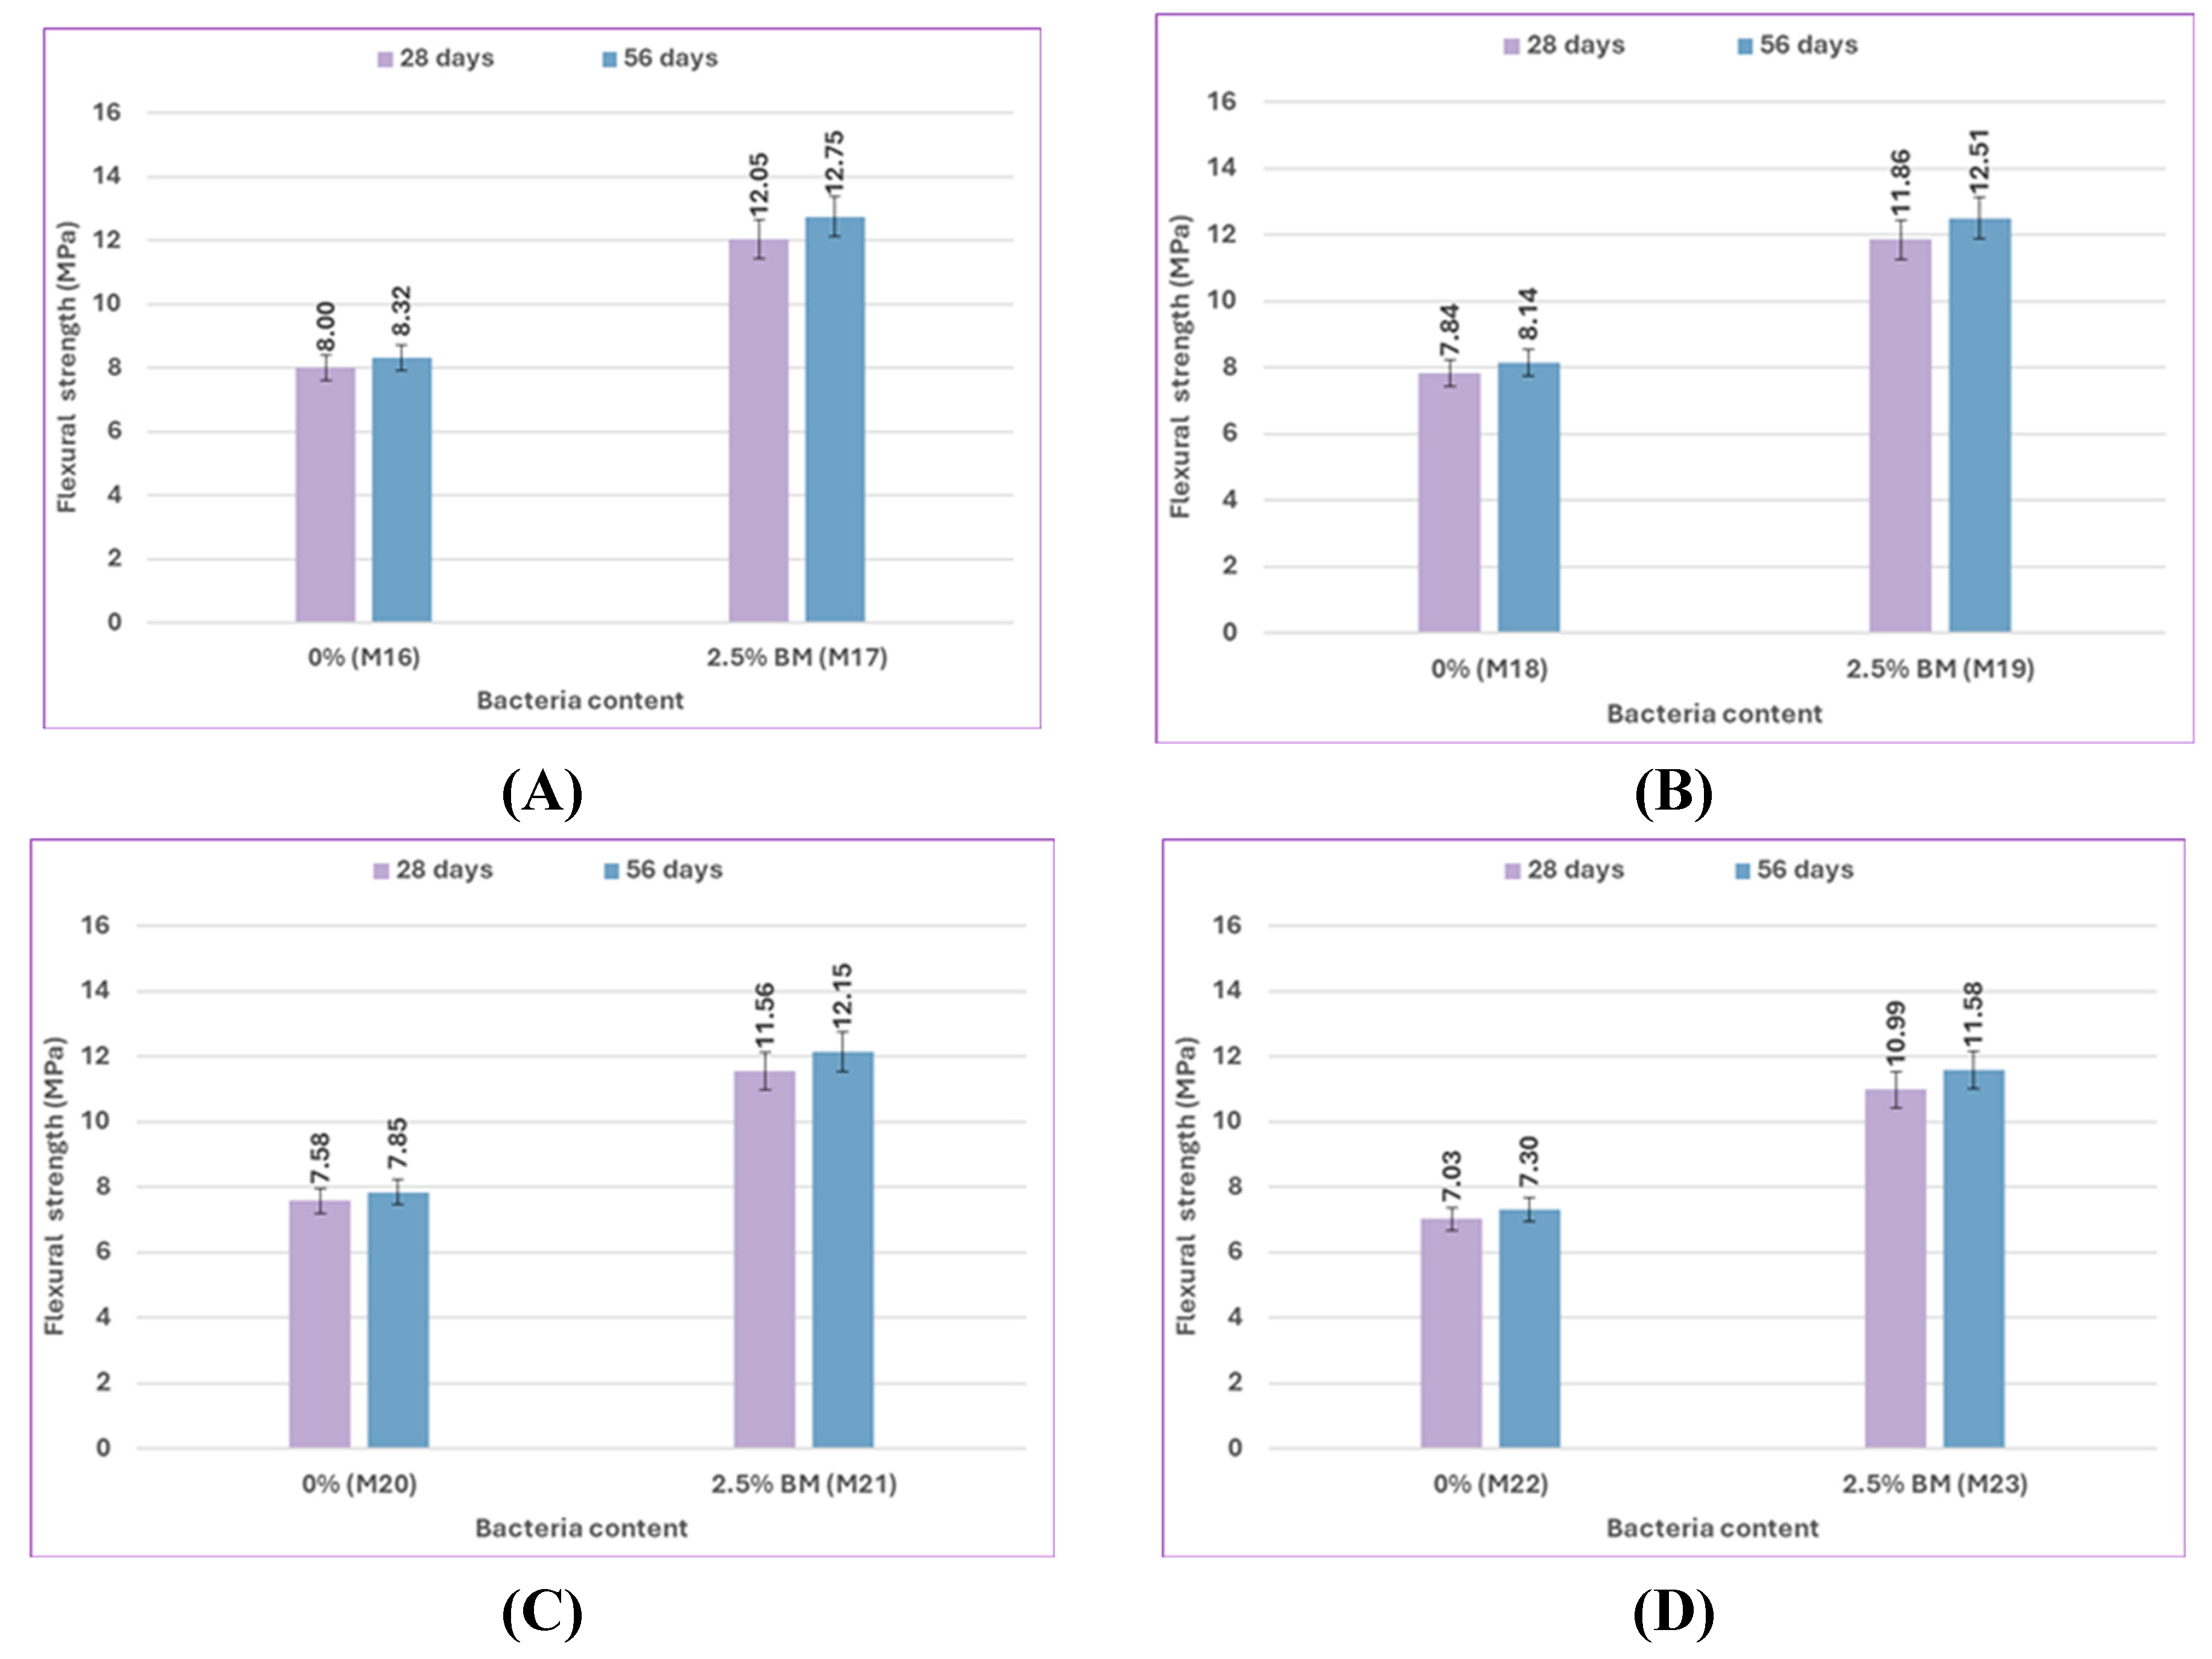
Figure 16.
Impact of bacterial type on the flexural strength of concrete for uncracked specimens for silica fume at 28 and 56 days: (A) at 0% sulfate, (B) at 2% sulfate, (C) at 5% sulfate, and (D) at 10% sulfate.
Figure 16.
Impact of bacterial type on the flexural strength of concrete for uncracked specimens for silica fume at 28 and 56 days: (A) at 0% sulfate, (B) at 2% sulfate, (C) at 5% sulfate, and (D) at 10% sulfate.
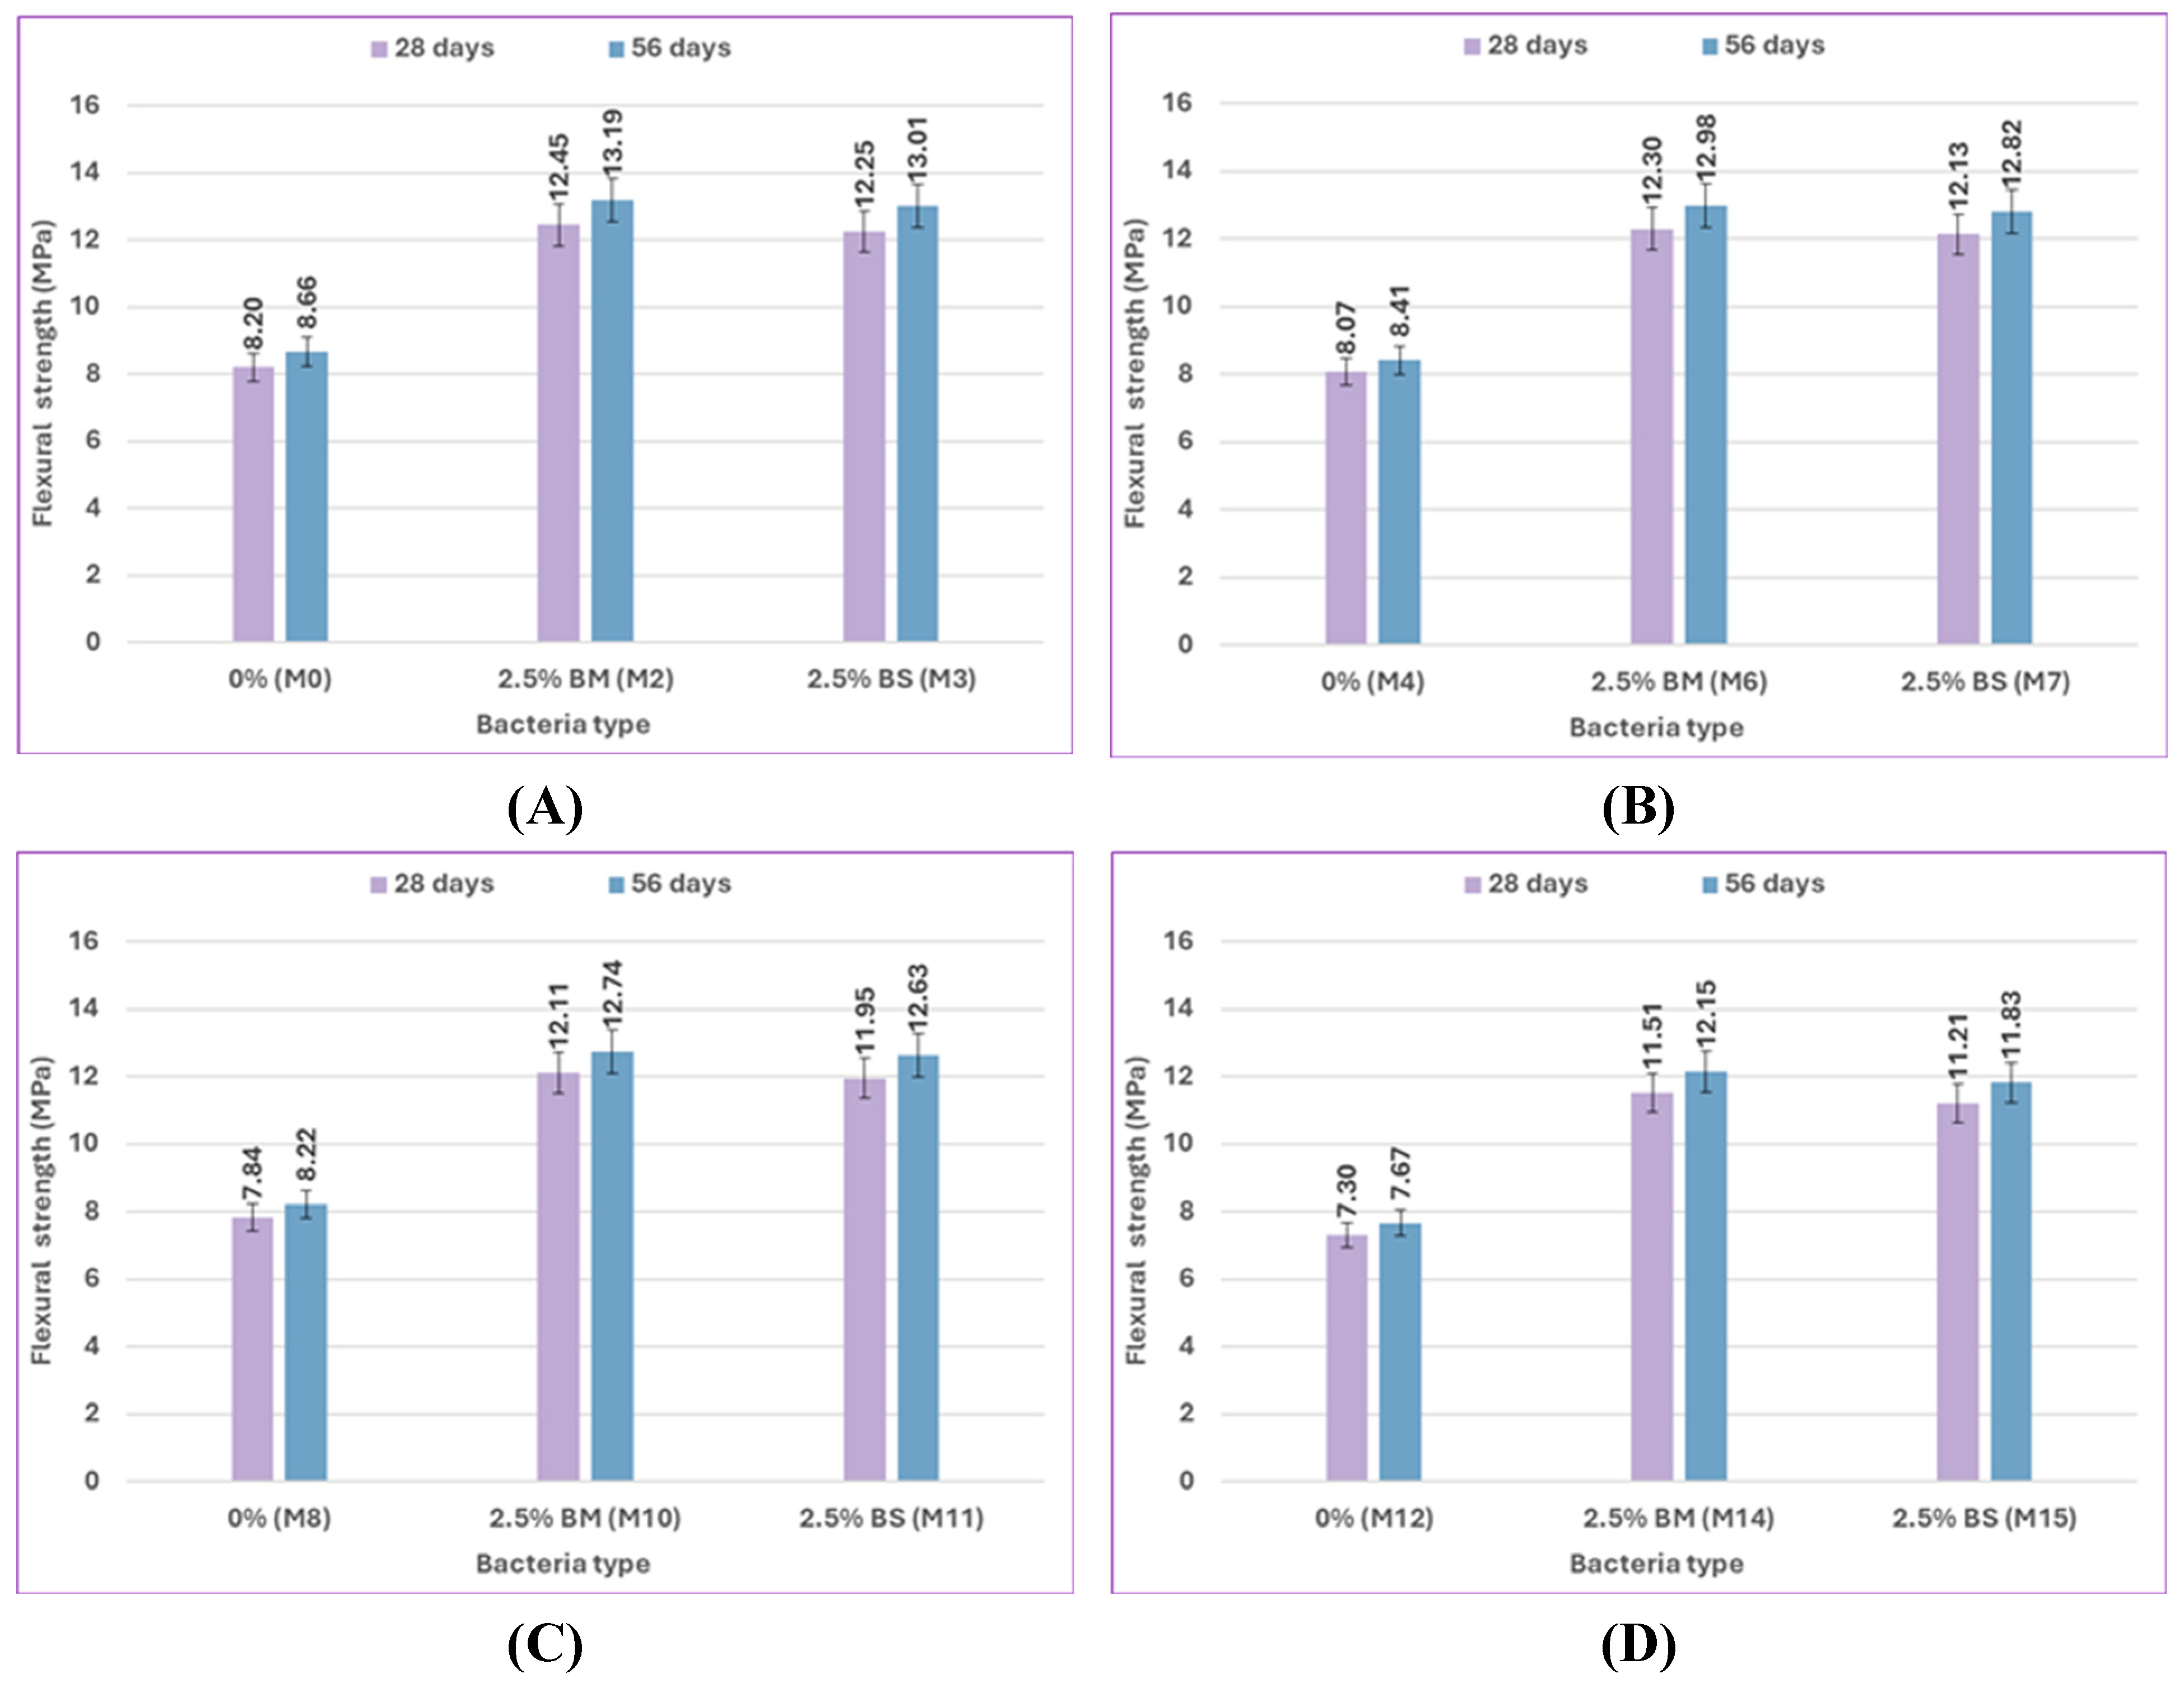
Figure 17.
Impact of pozzolanic material type on the flexural strength of concrete for uncracked specimens at 28 and 56 days: (A) at 0% sulfate, (B) at 2% sulfate, (C) at 5% sulfate, and (D) at 10% sulfate.
Figure 17.
Impact of pozzolanic material type on the flexural strength of concrete for uncracked specimens at 28 and 56 days: (A) at 0% sulfate, (B) at 2% sulfate, (C) at 5% sulfate, and (D) at 10% sulfate.
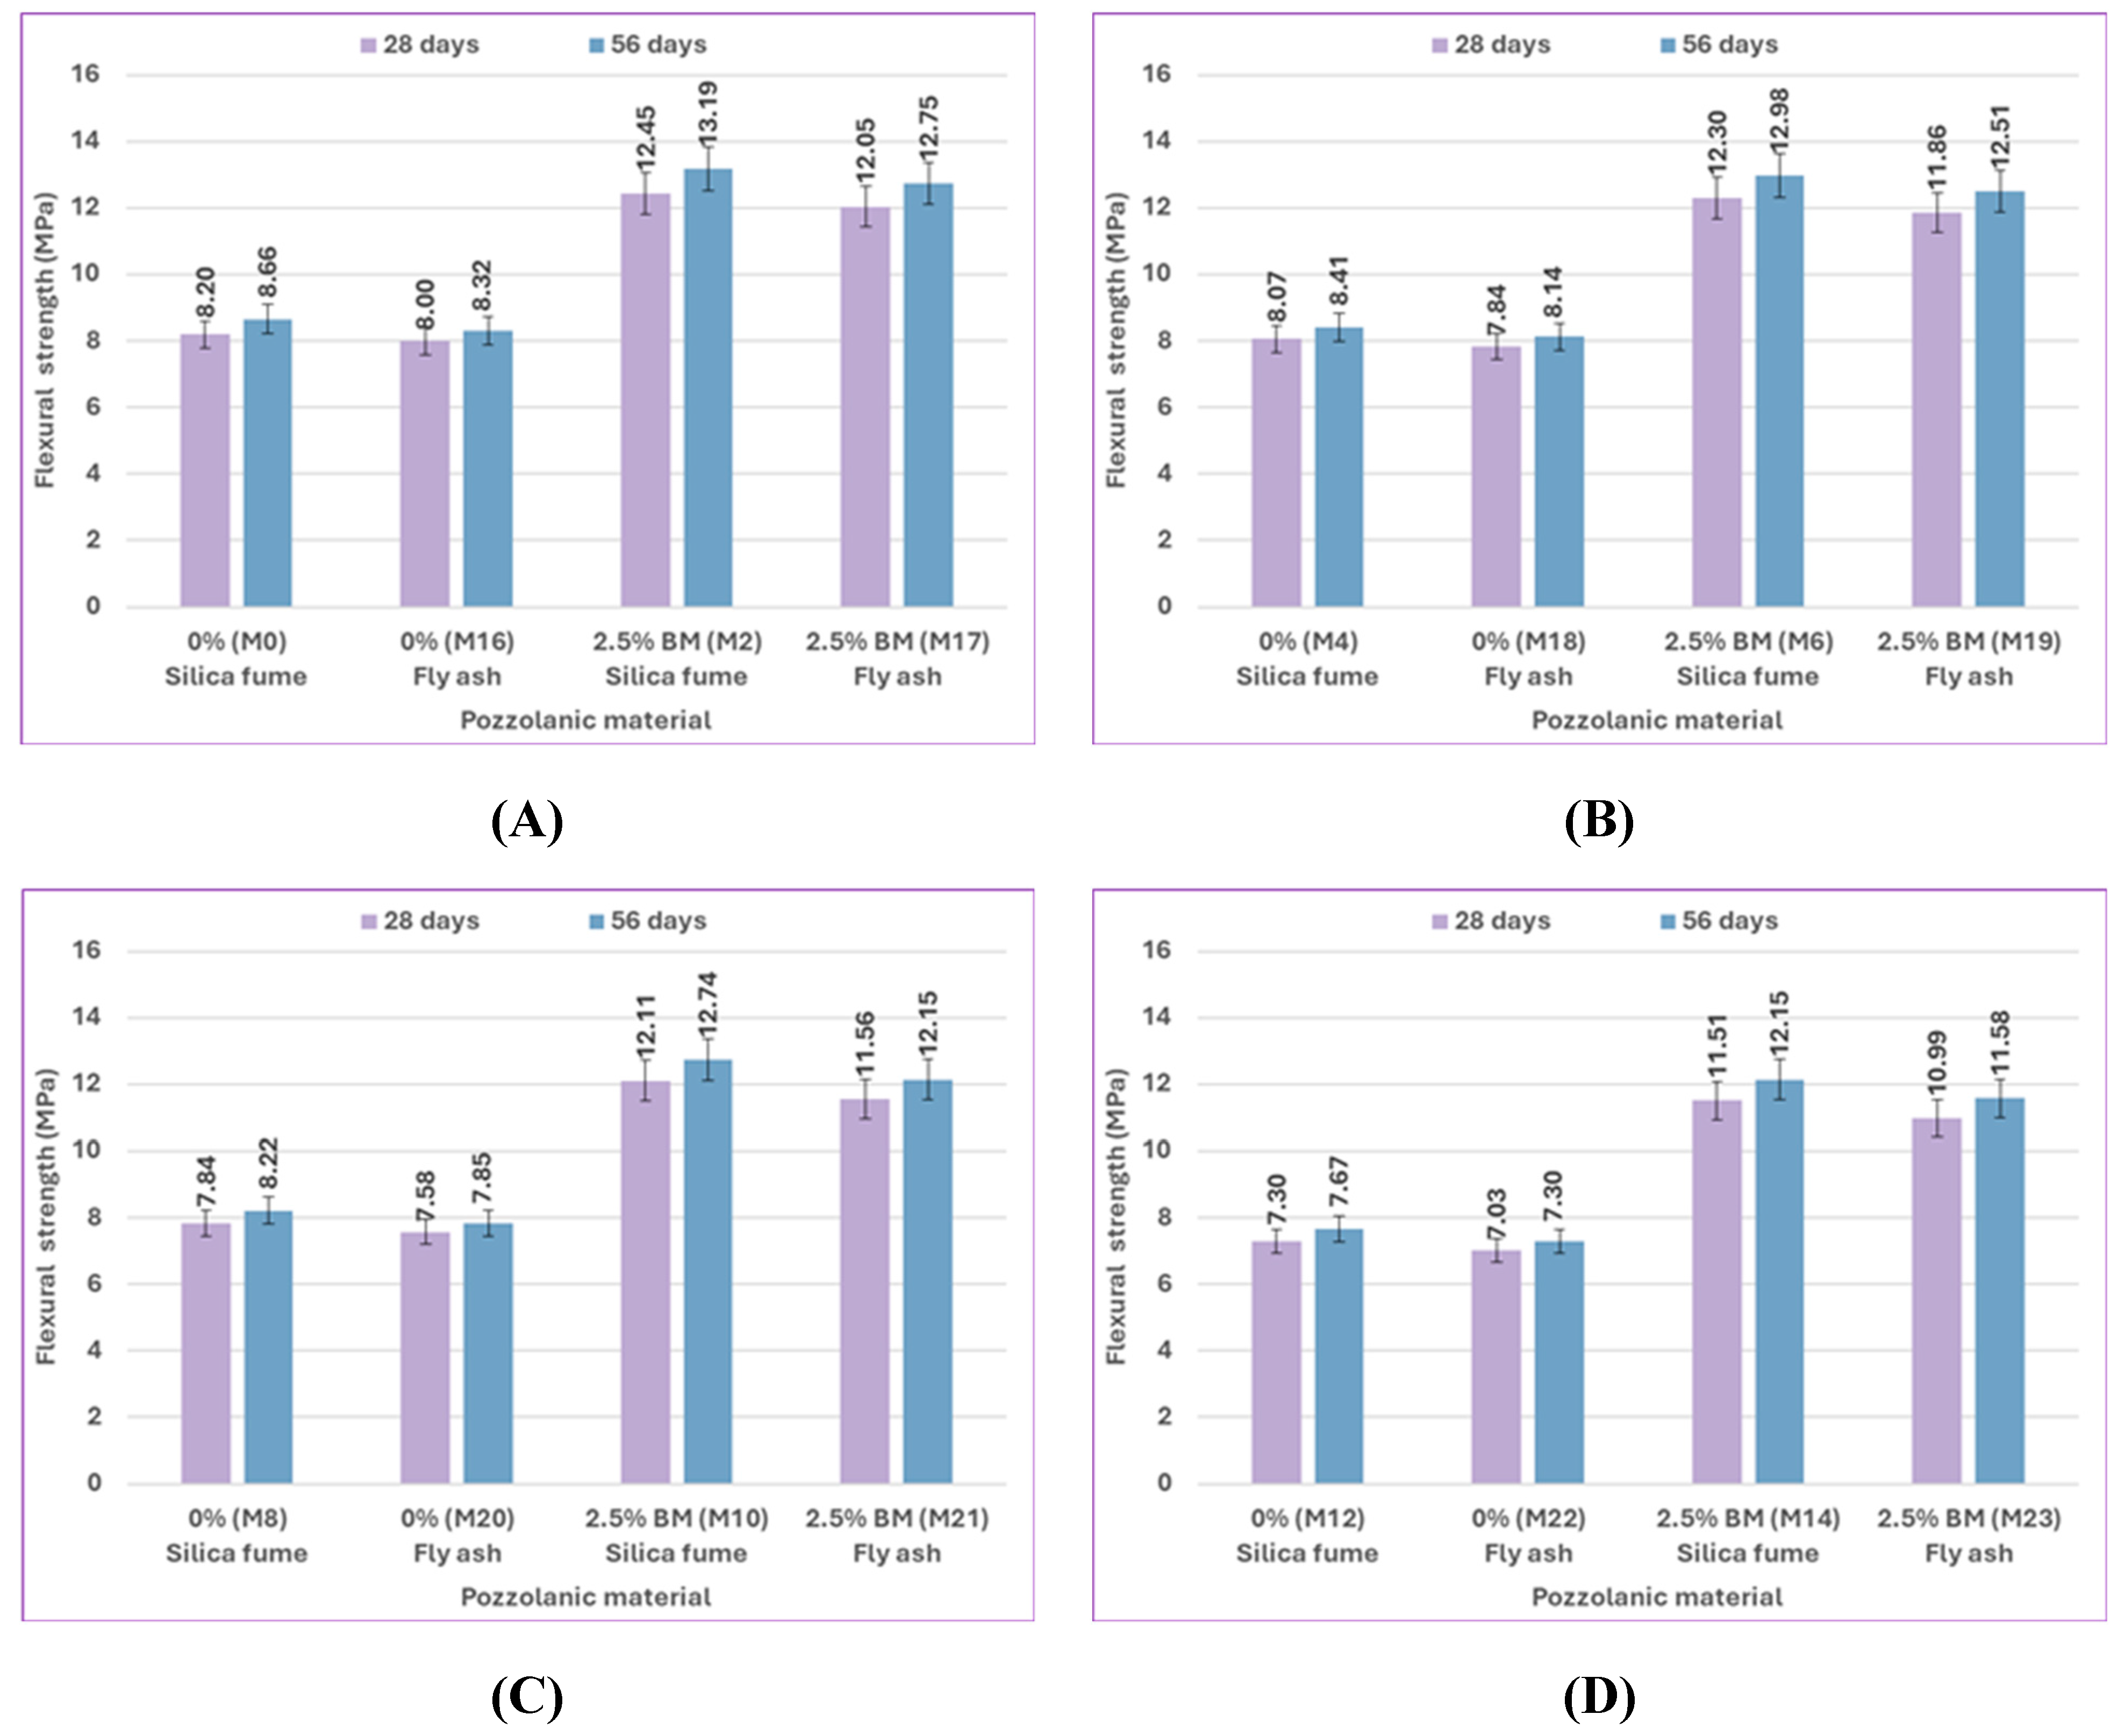
Figure 18.
Impact of curing type on the flexural strength of concrete for uncracked specimens for silica fume at 28 and 56 days: (A) at 0% bacteria, (B) at 1% bacteria BM, (C) at 2.5% bacteria BM, and (D) at 2.5% bacteria BS.
Figure 18.
Impact of curing type on the flexural strength of concrete for uncracked specimens for silica fume at 28 and 56 days: (A) at 0% bacteria, (B) at 1% bacteria BM, (C) at 2.5% bacteria BM, and (D) at 2.5% bacteria BS.
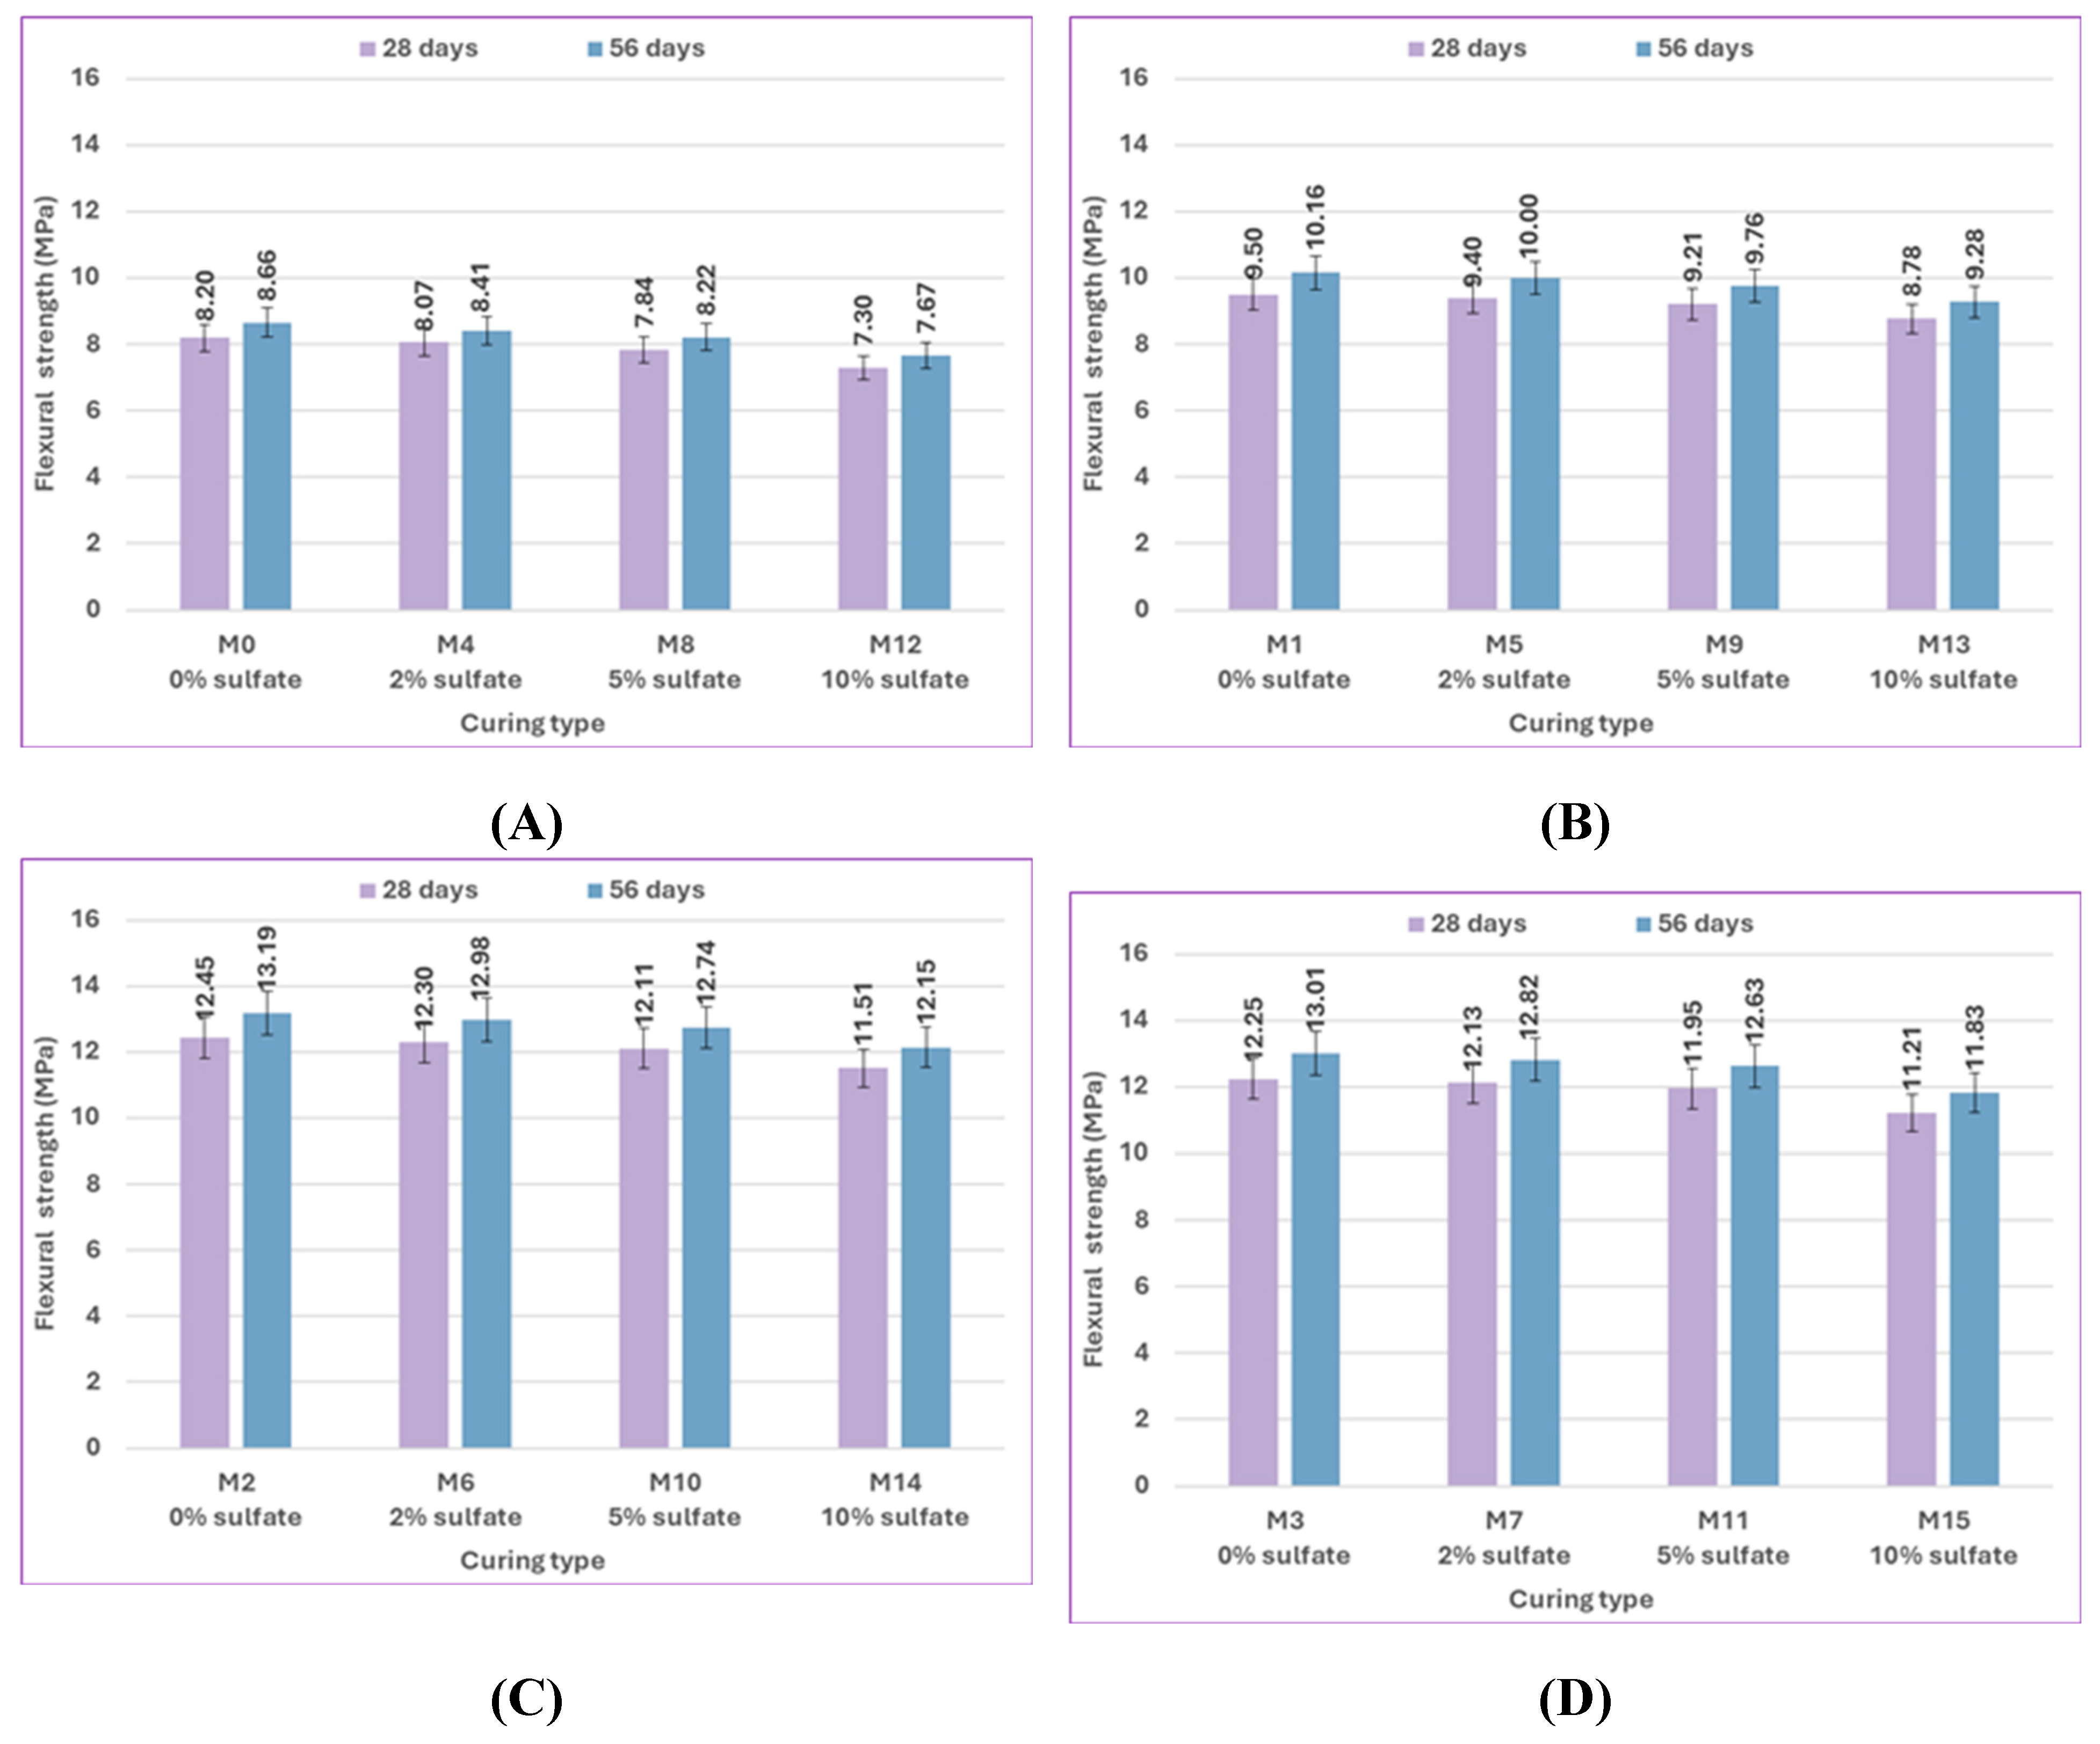
Figure 19.
Impact of curing type on the flexural strength of concrete for uncracked specimens for fly ash at 28 and 56 days: (A) at 0% bacteria, (B) at 2.5% bacteria BM.
Figure 19.
Impact of curing type on the flexural strength of concrete for uncracked specimens for fly ash at 28 and 56 days: (A) at 0% bacteria, (B) at 2.5% bacteria BM.
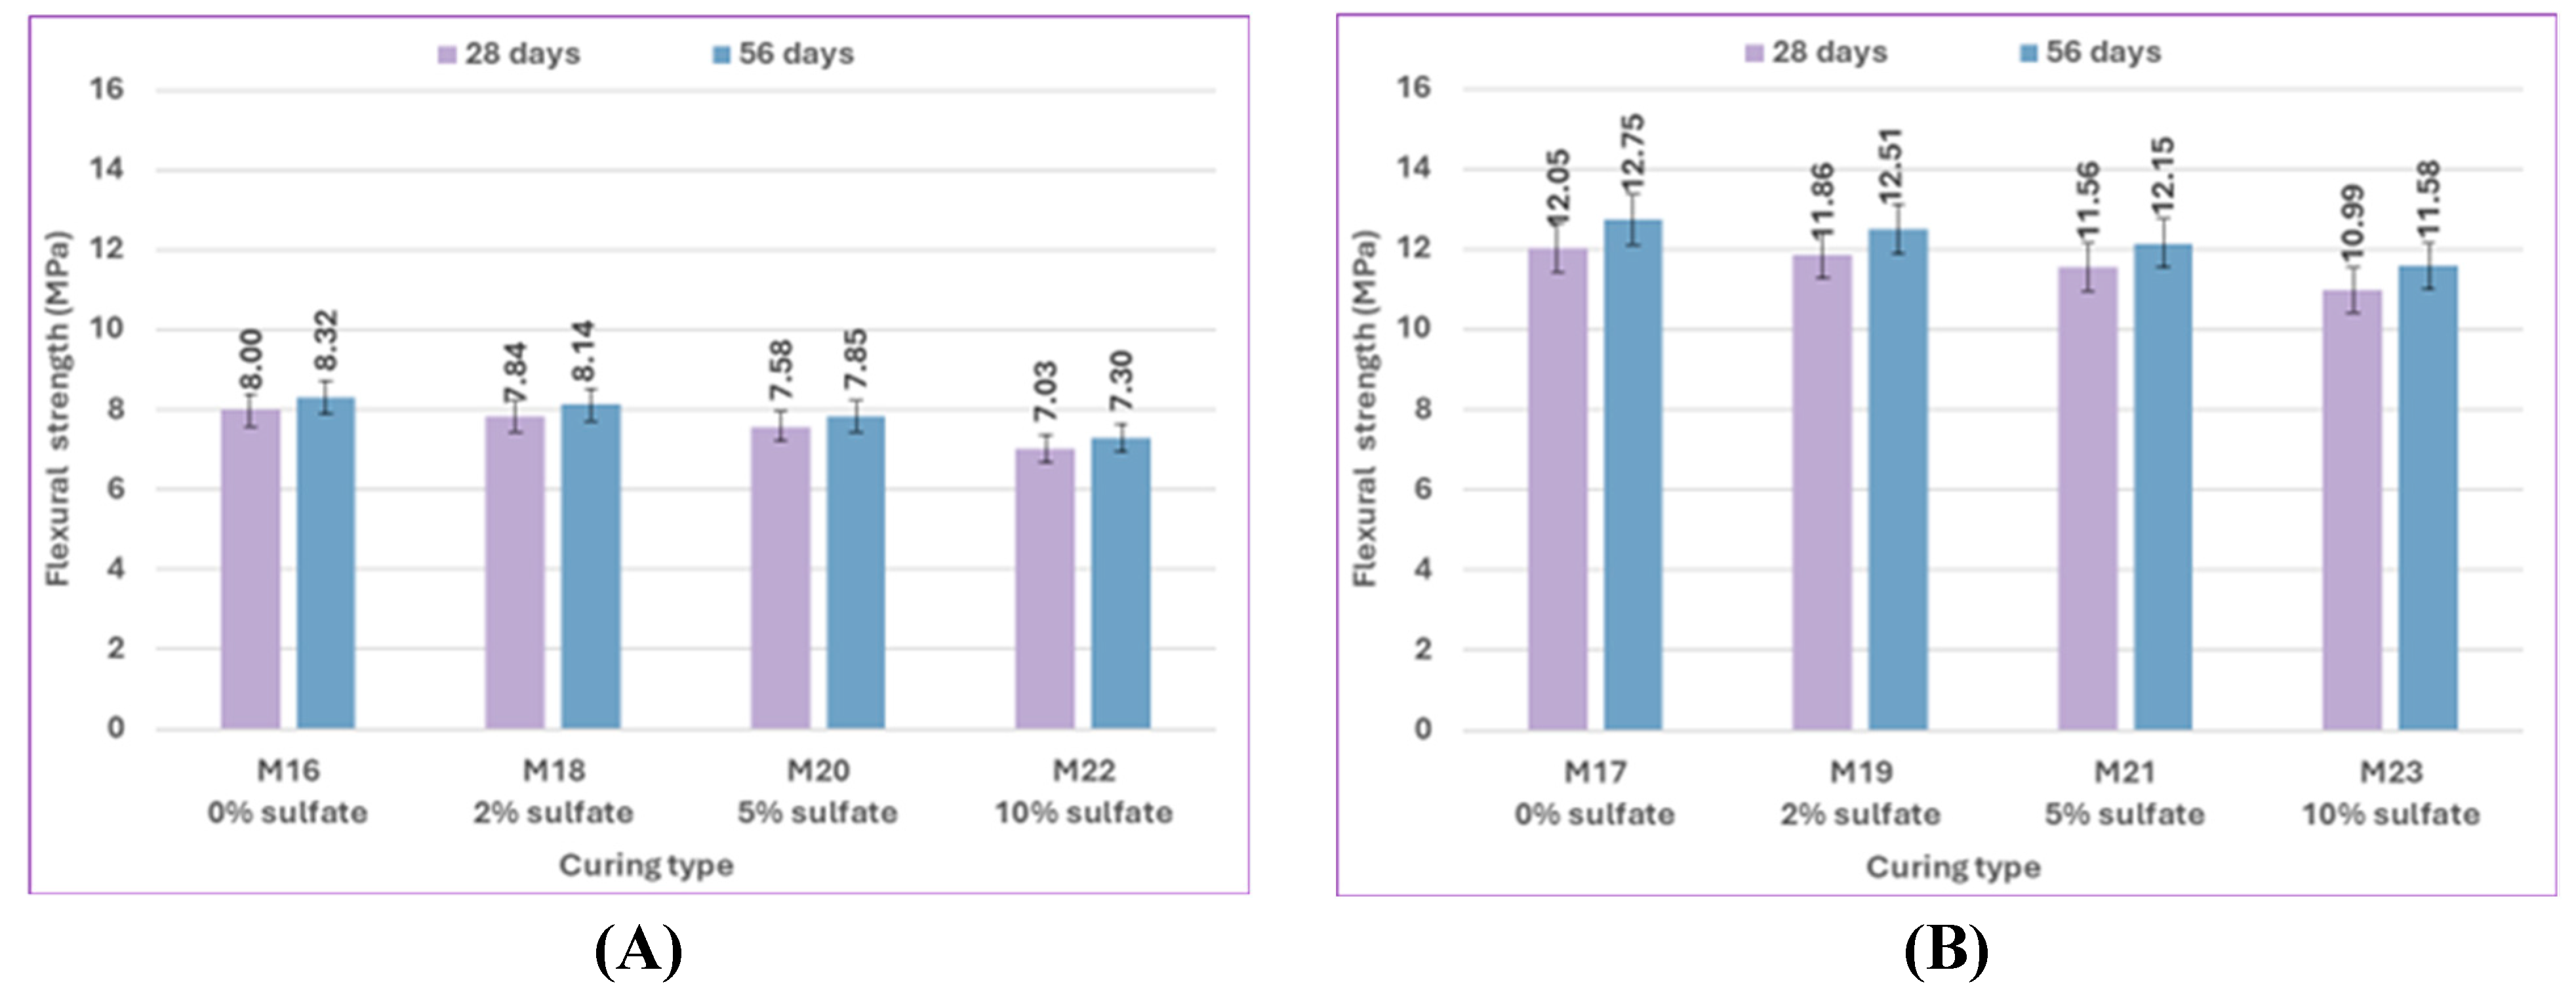
Figure 20.
Impact of bacterial content on concrete compressive strength for uncracked specimens and pre-cracked specimens for silica fume at 56 days: (A) at 0% sulfate, (B) at 2% sulfate, (C) at 5% sulfate, and (D) at 10% sulfate.
Figure 20.
Impact of bacterial content on concrete compressive strength for uncracked specimens and pre-cracked specimens for silica fume at 56 days: (A) at 0% sulfate, (B) at 2% sulfate, (C) at 5% sulfate, and (D) at 10% sulfate.
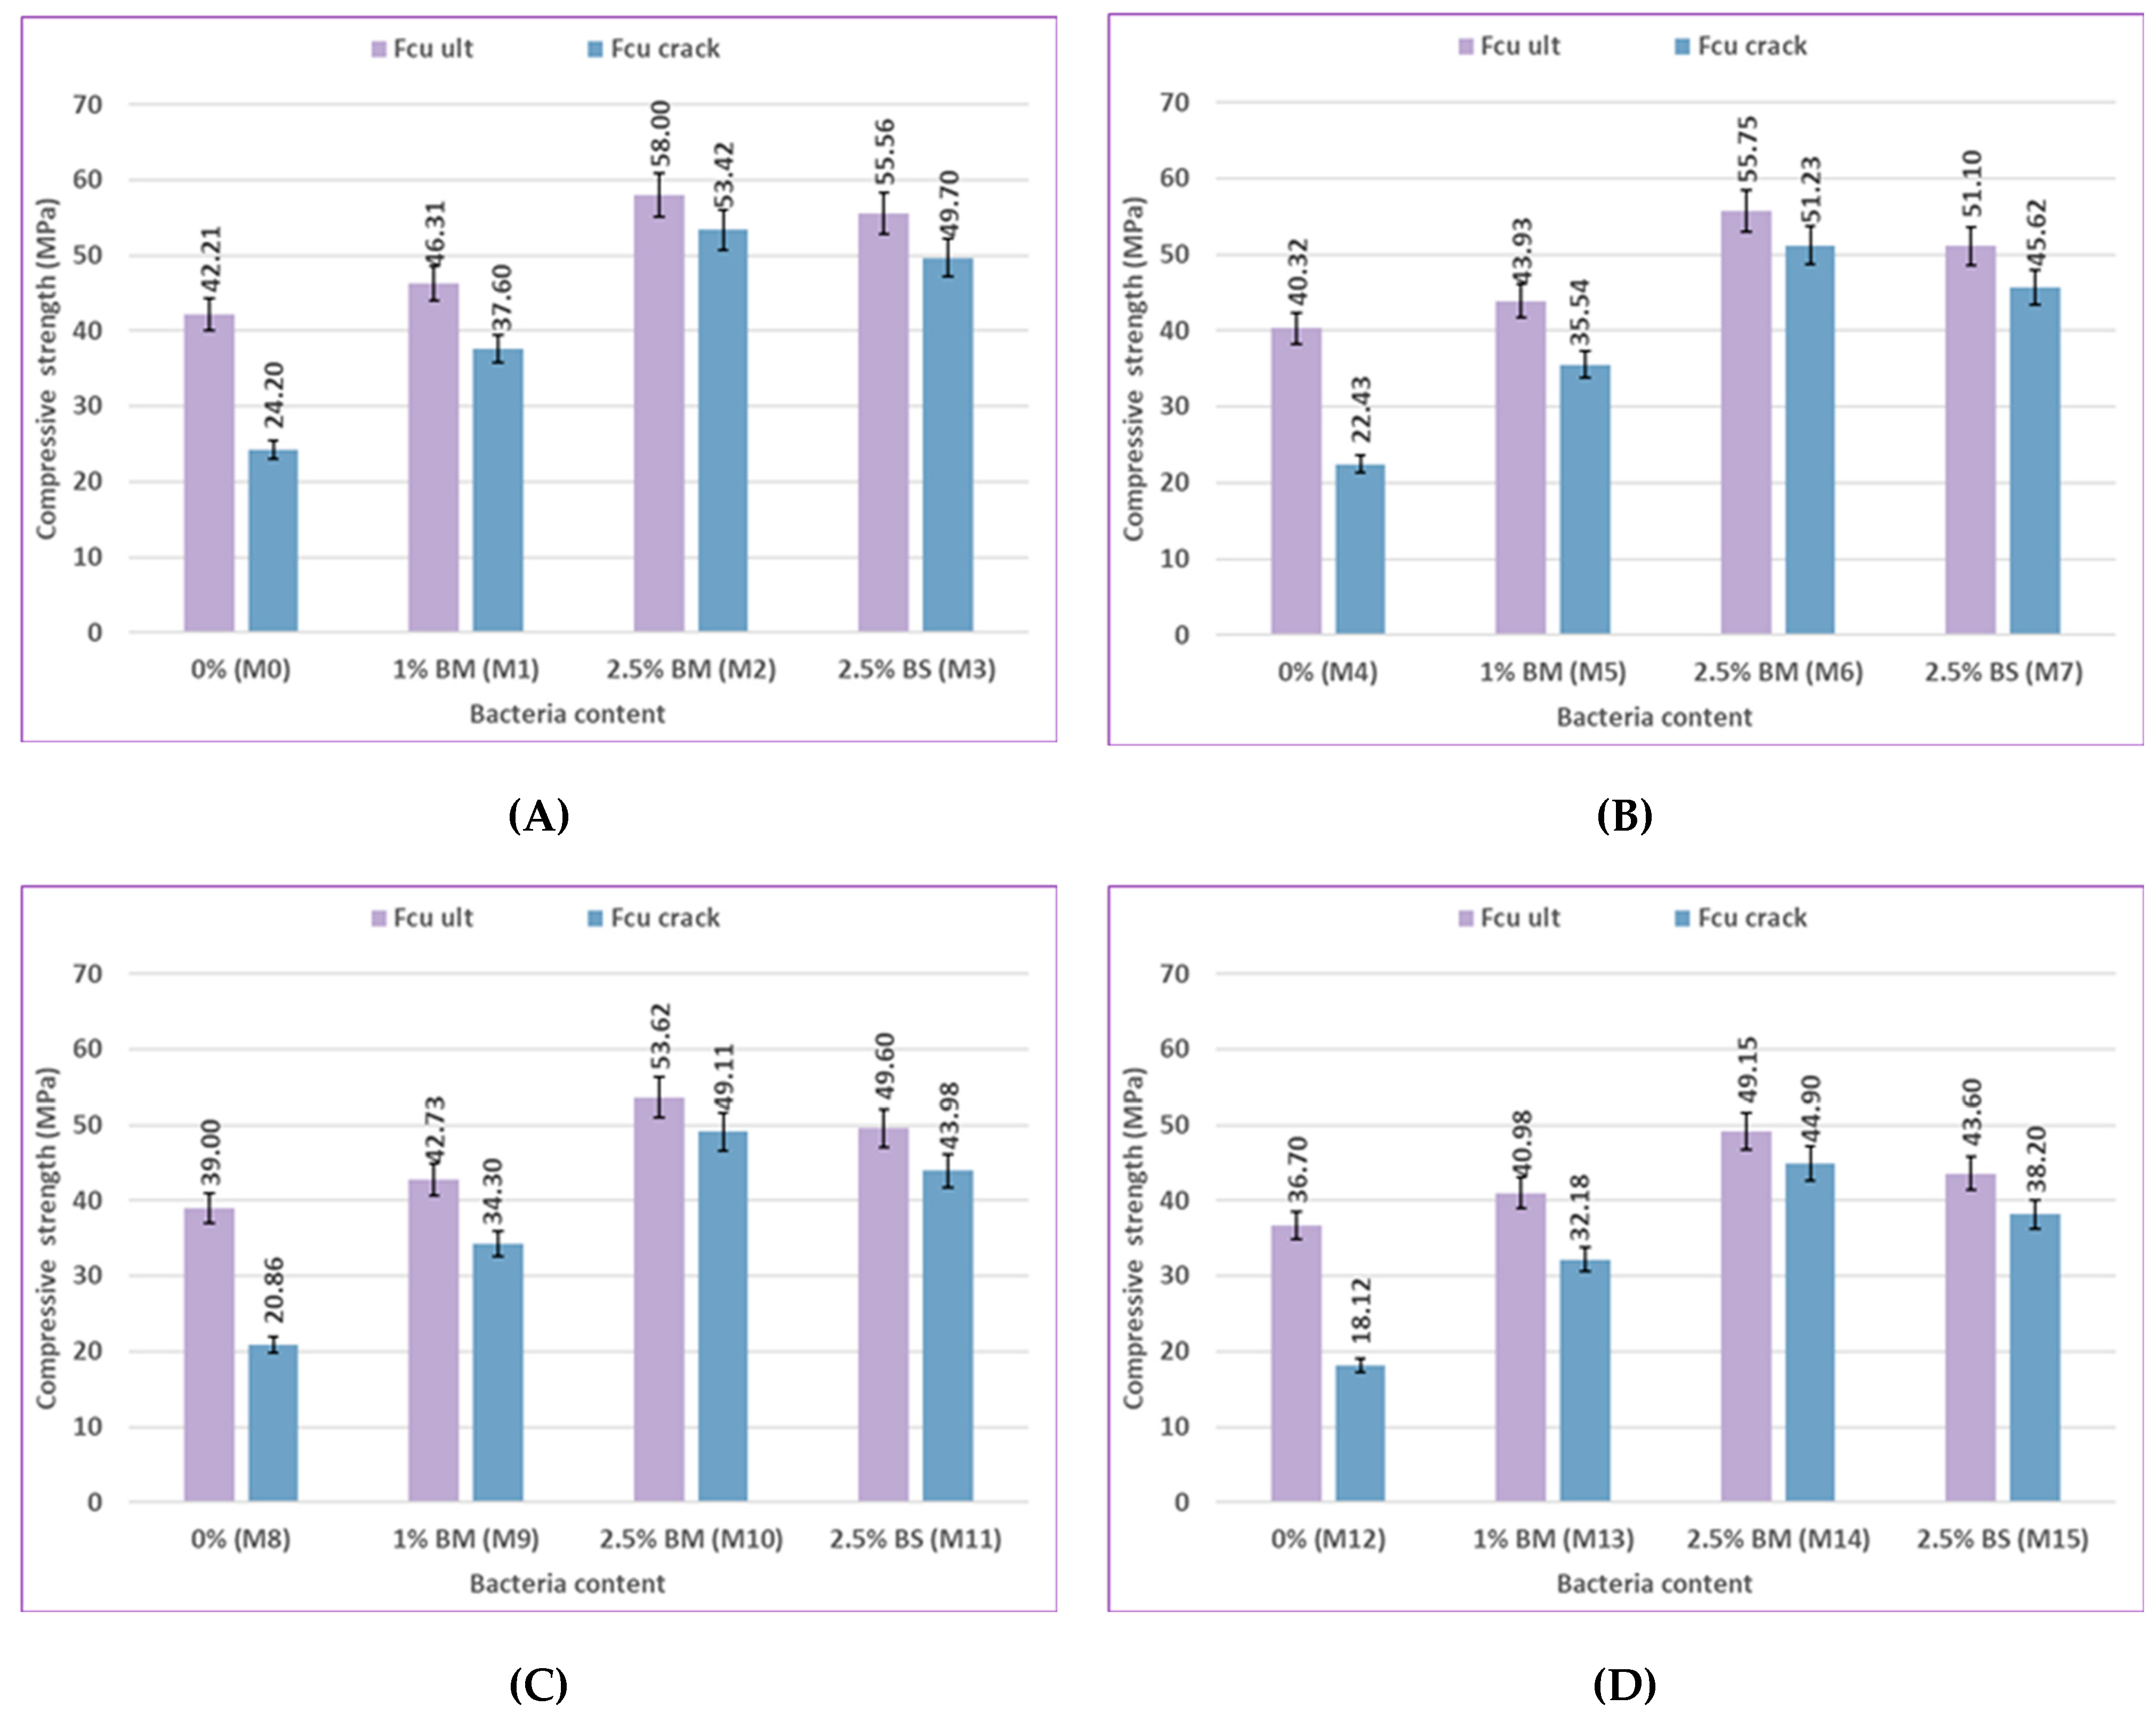
Figure 21.
Impact of bacterial content on concrete compressive strength for uncracked specimens and pre-cracked specimens for silica fume at 120 days: (A) at 0% sulfate, (B) at 2% sulfate, (C) at 5% sulfate, and (D) at 10% sulfate.
Figure 21.
Impact of bacterial content on concrete compressive strength for uncracked specimens and pre-cracked specimens for silica fume at 120 days: (A) at 0% sulfate, (B) at 2% sulfate, (C) at 5% sulfate, and (D) at 10% sulfate.
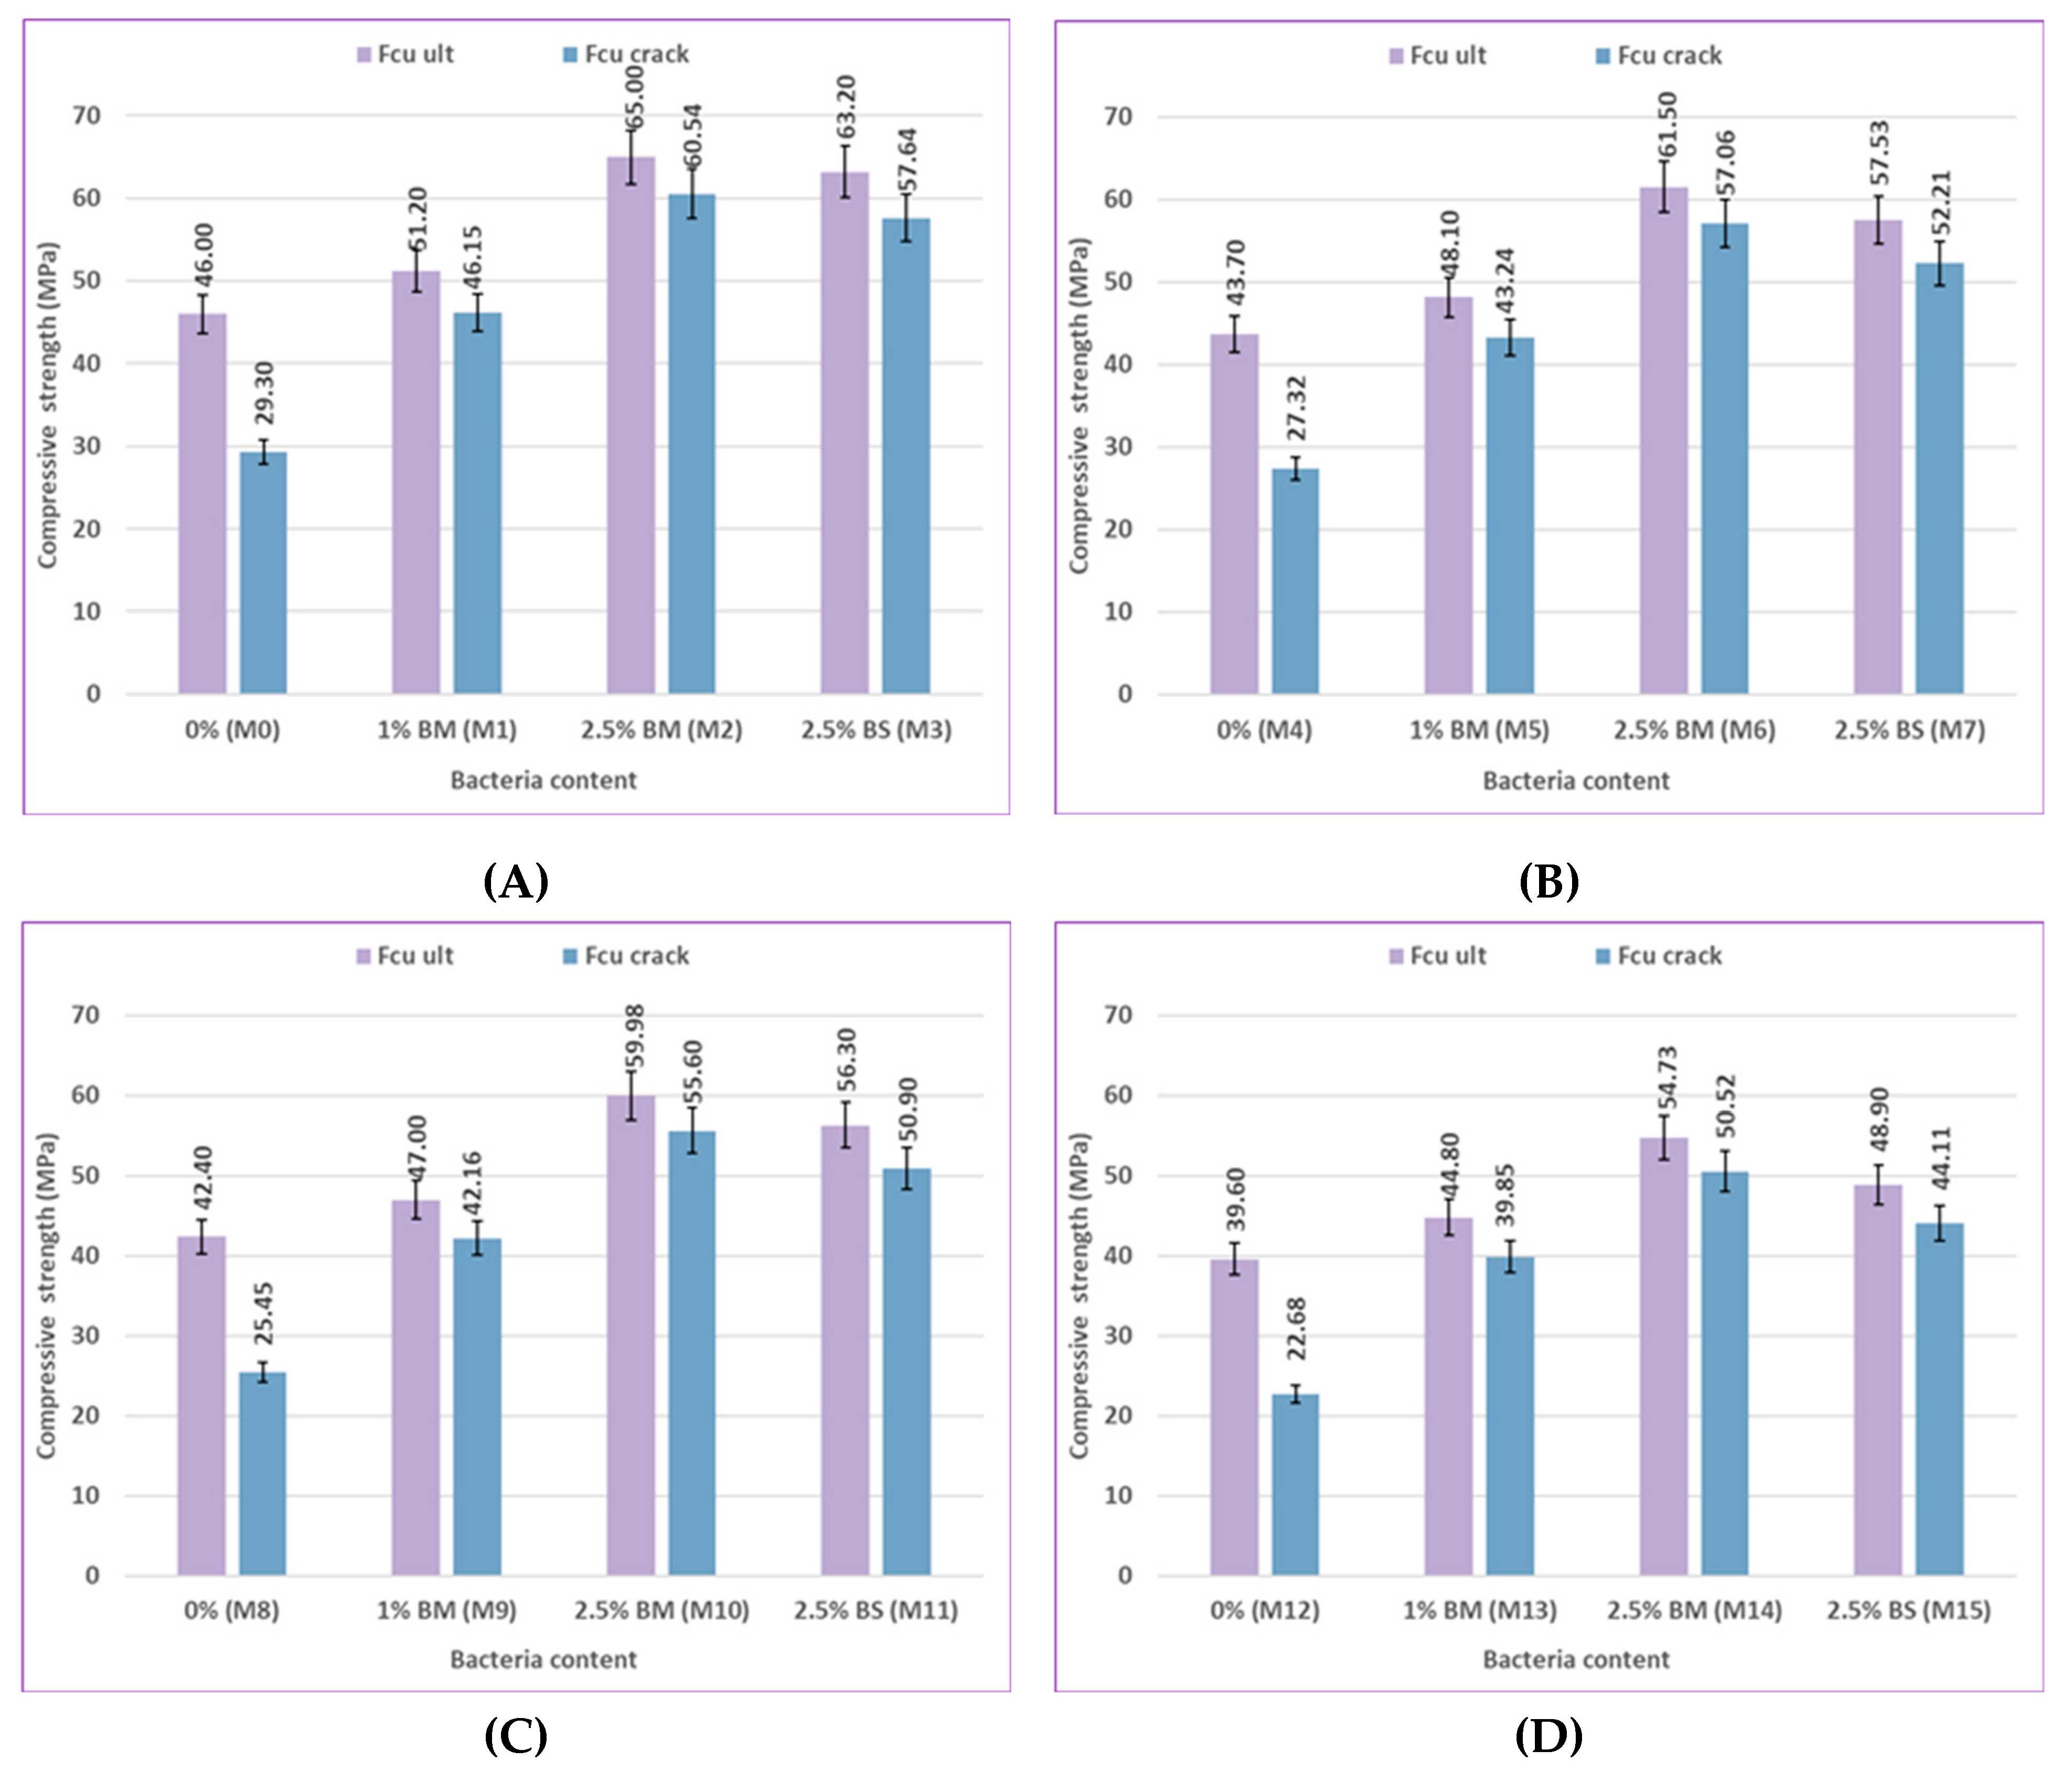
Figure 22.
Impact of bacterial content on concrete compressive strength for uncracked specimens and precracked specimens for fly ash at 56 days: (A) at 0% sulfate, (B) at 2% sulfate, (C) at 5% sulfate, and (D) at 10% sulfate.
Figure 22.
Impact of bacterial content on concrete compressive strength for uncracked specimens and precracked specimens for fly ash at 56 days: (A) at 0% sulfate, (B) at 2% sulfate, (C) at 5% sulfate, and (D) at 10% sulfate.
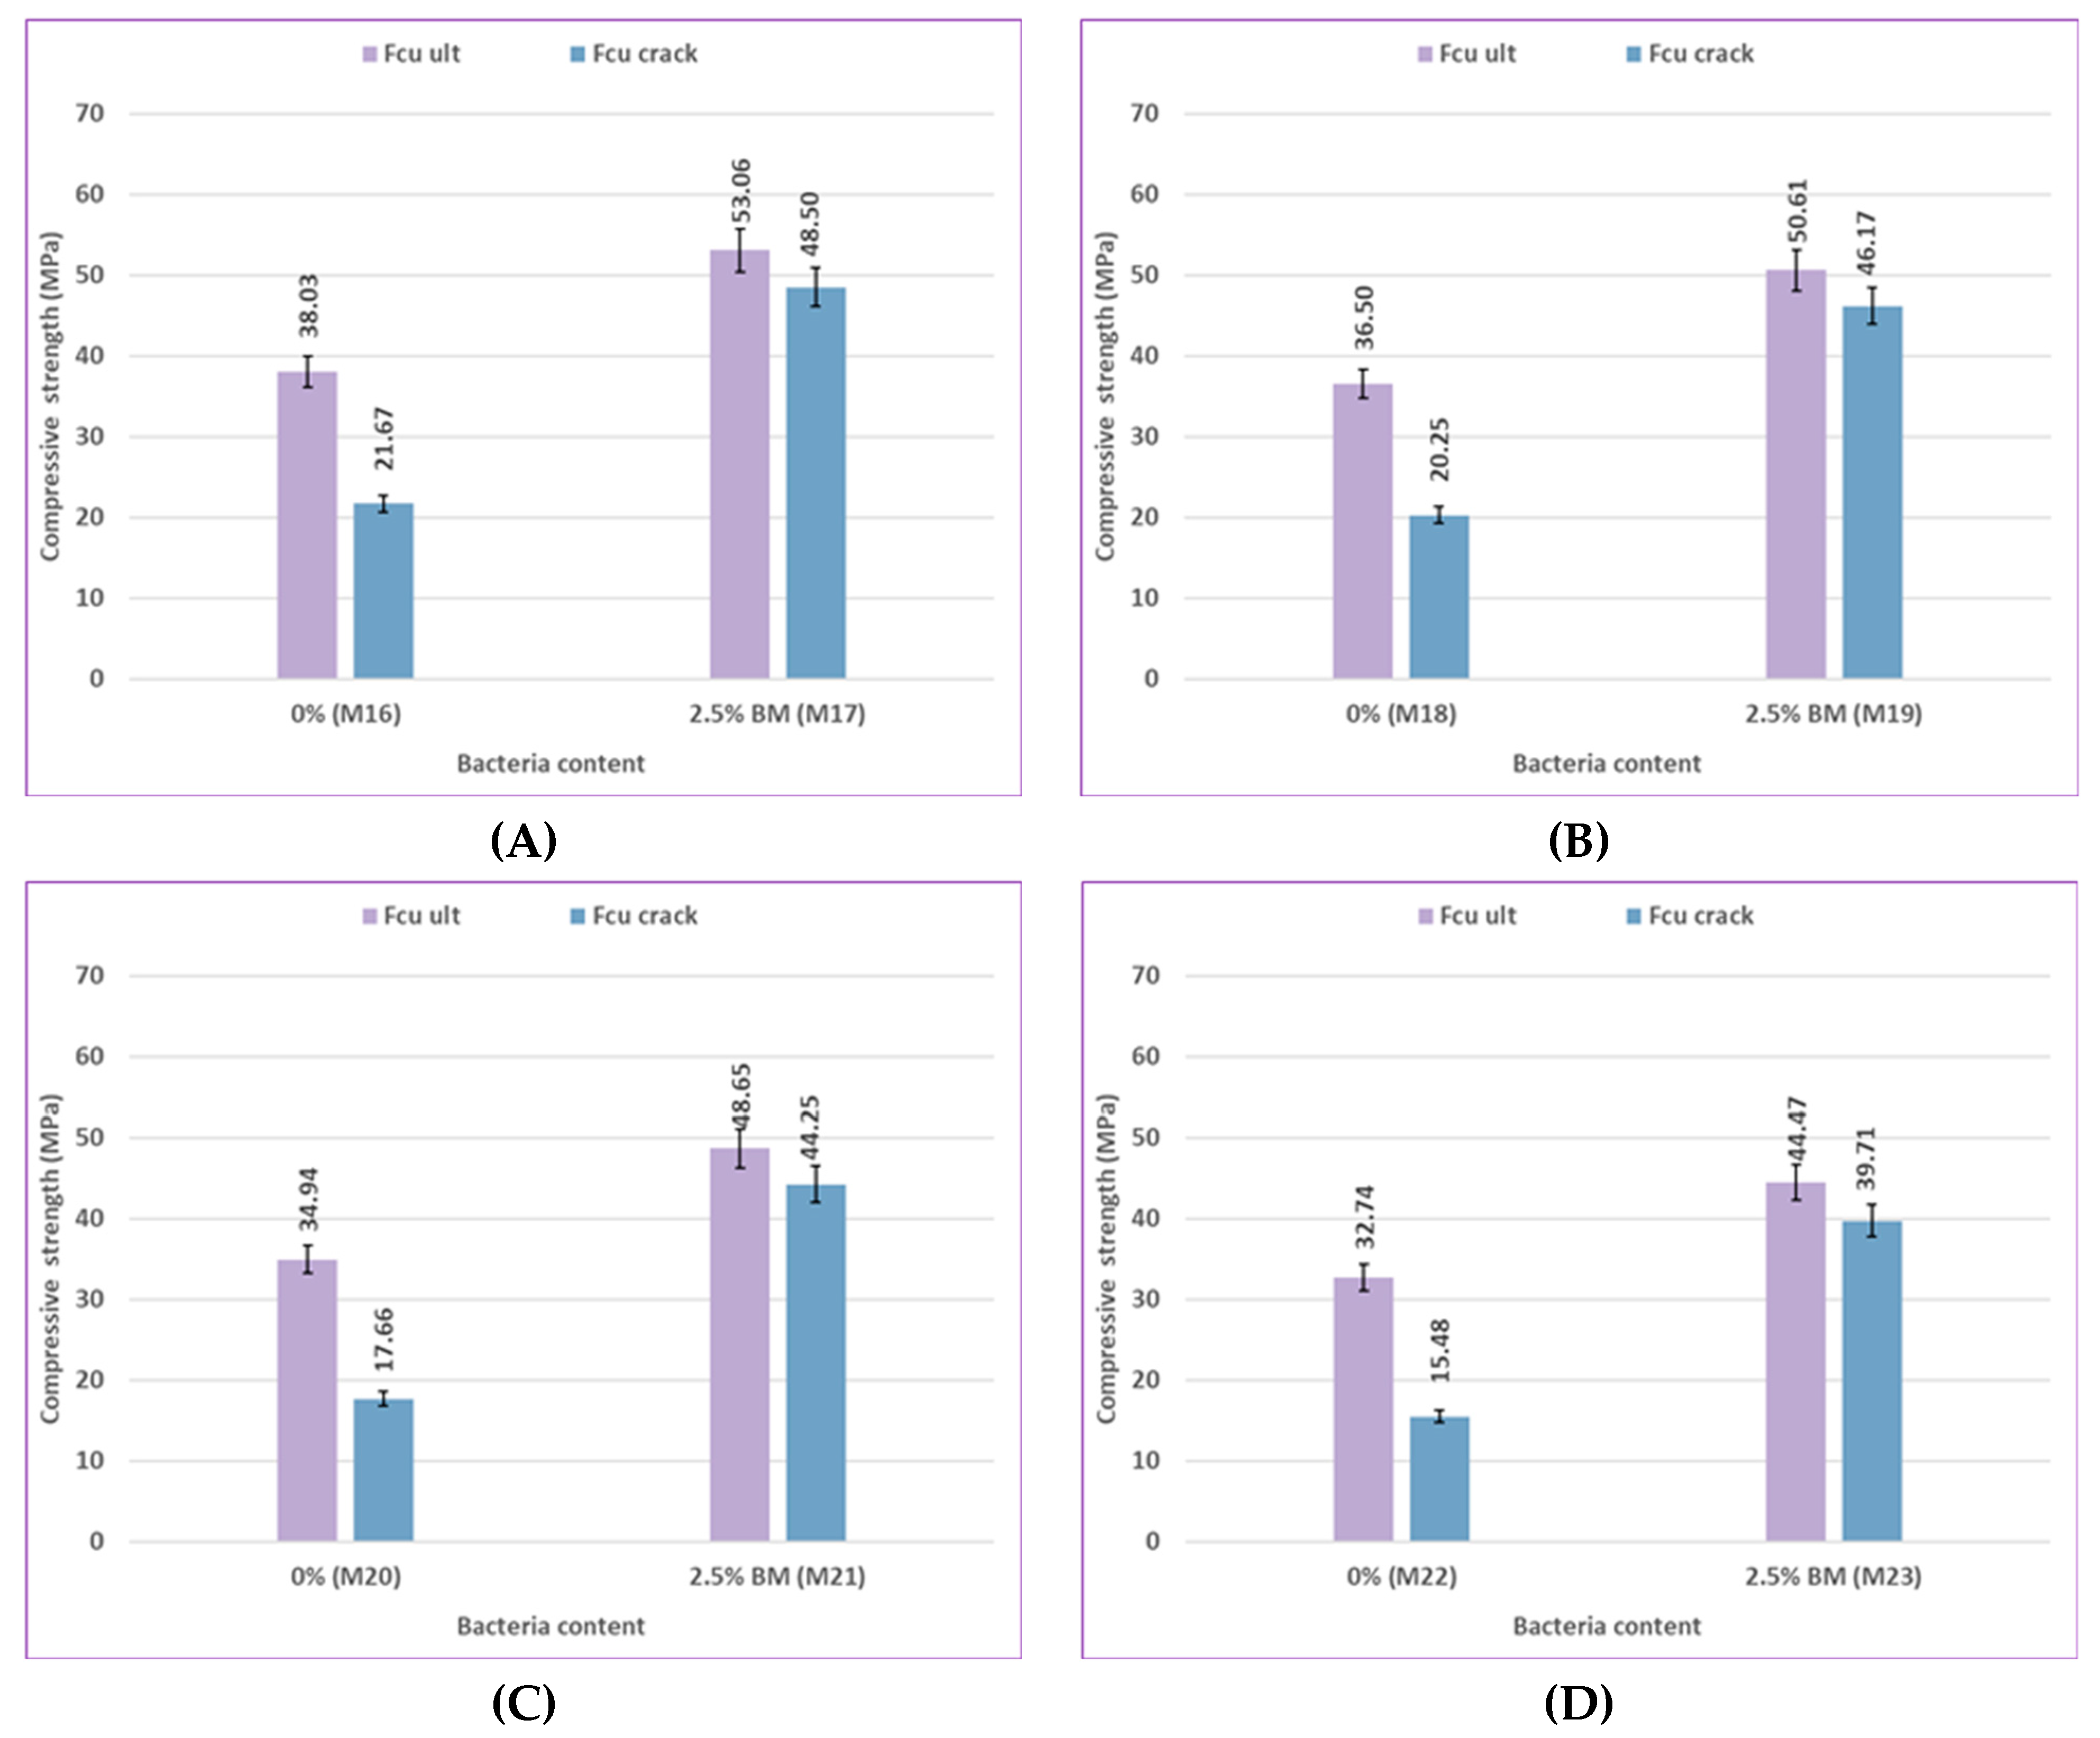
Figure 23.
Impact of bacterial content on concrete compressive strength for uncracked specimens and pre-cracked specimens for fly ash at 120 days: (A) at 0% sulfate, (B) at 2% sulfate, (C) at 5% sulfate, and (D) at 10% sulfate.
Figure 23.
Impact of bacterial content on concrete compressive strength for uncracked specimens and pre-cracked specimens for fly ash at 120 days: (A) at 0% sulfate, (B) at 2% sulfate, (C) at 5% sulfate, and (D) at 10% sulfate.
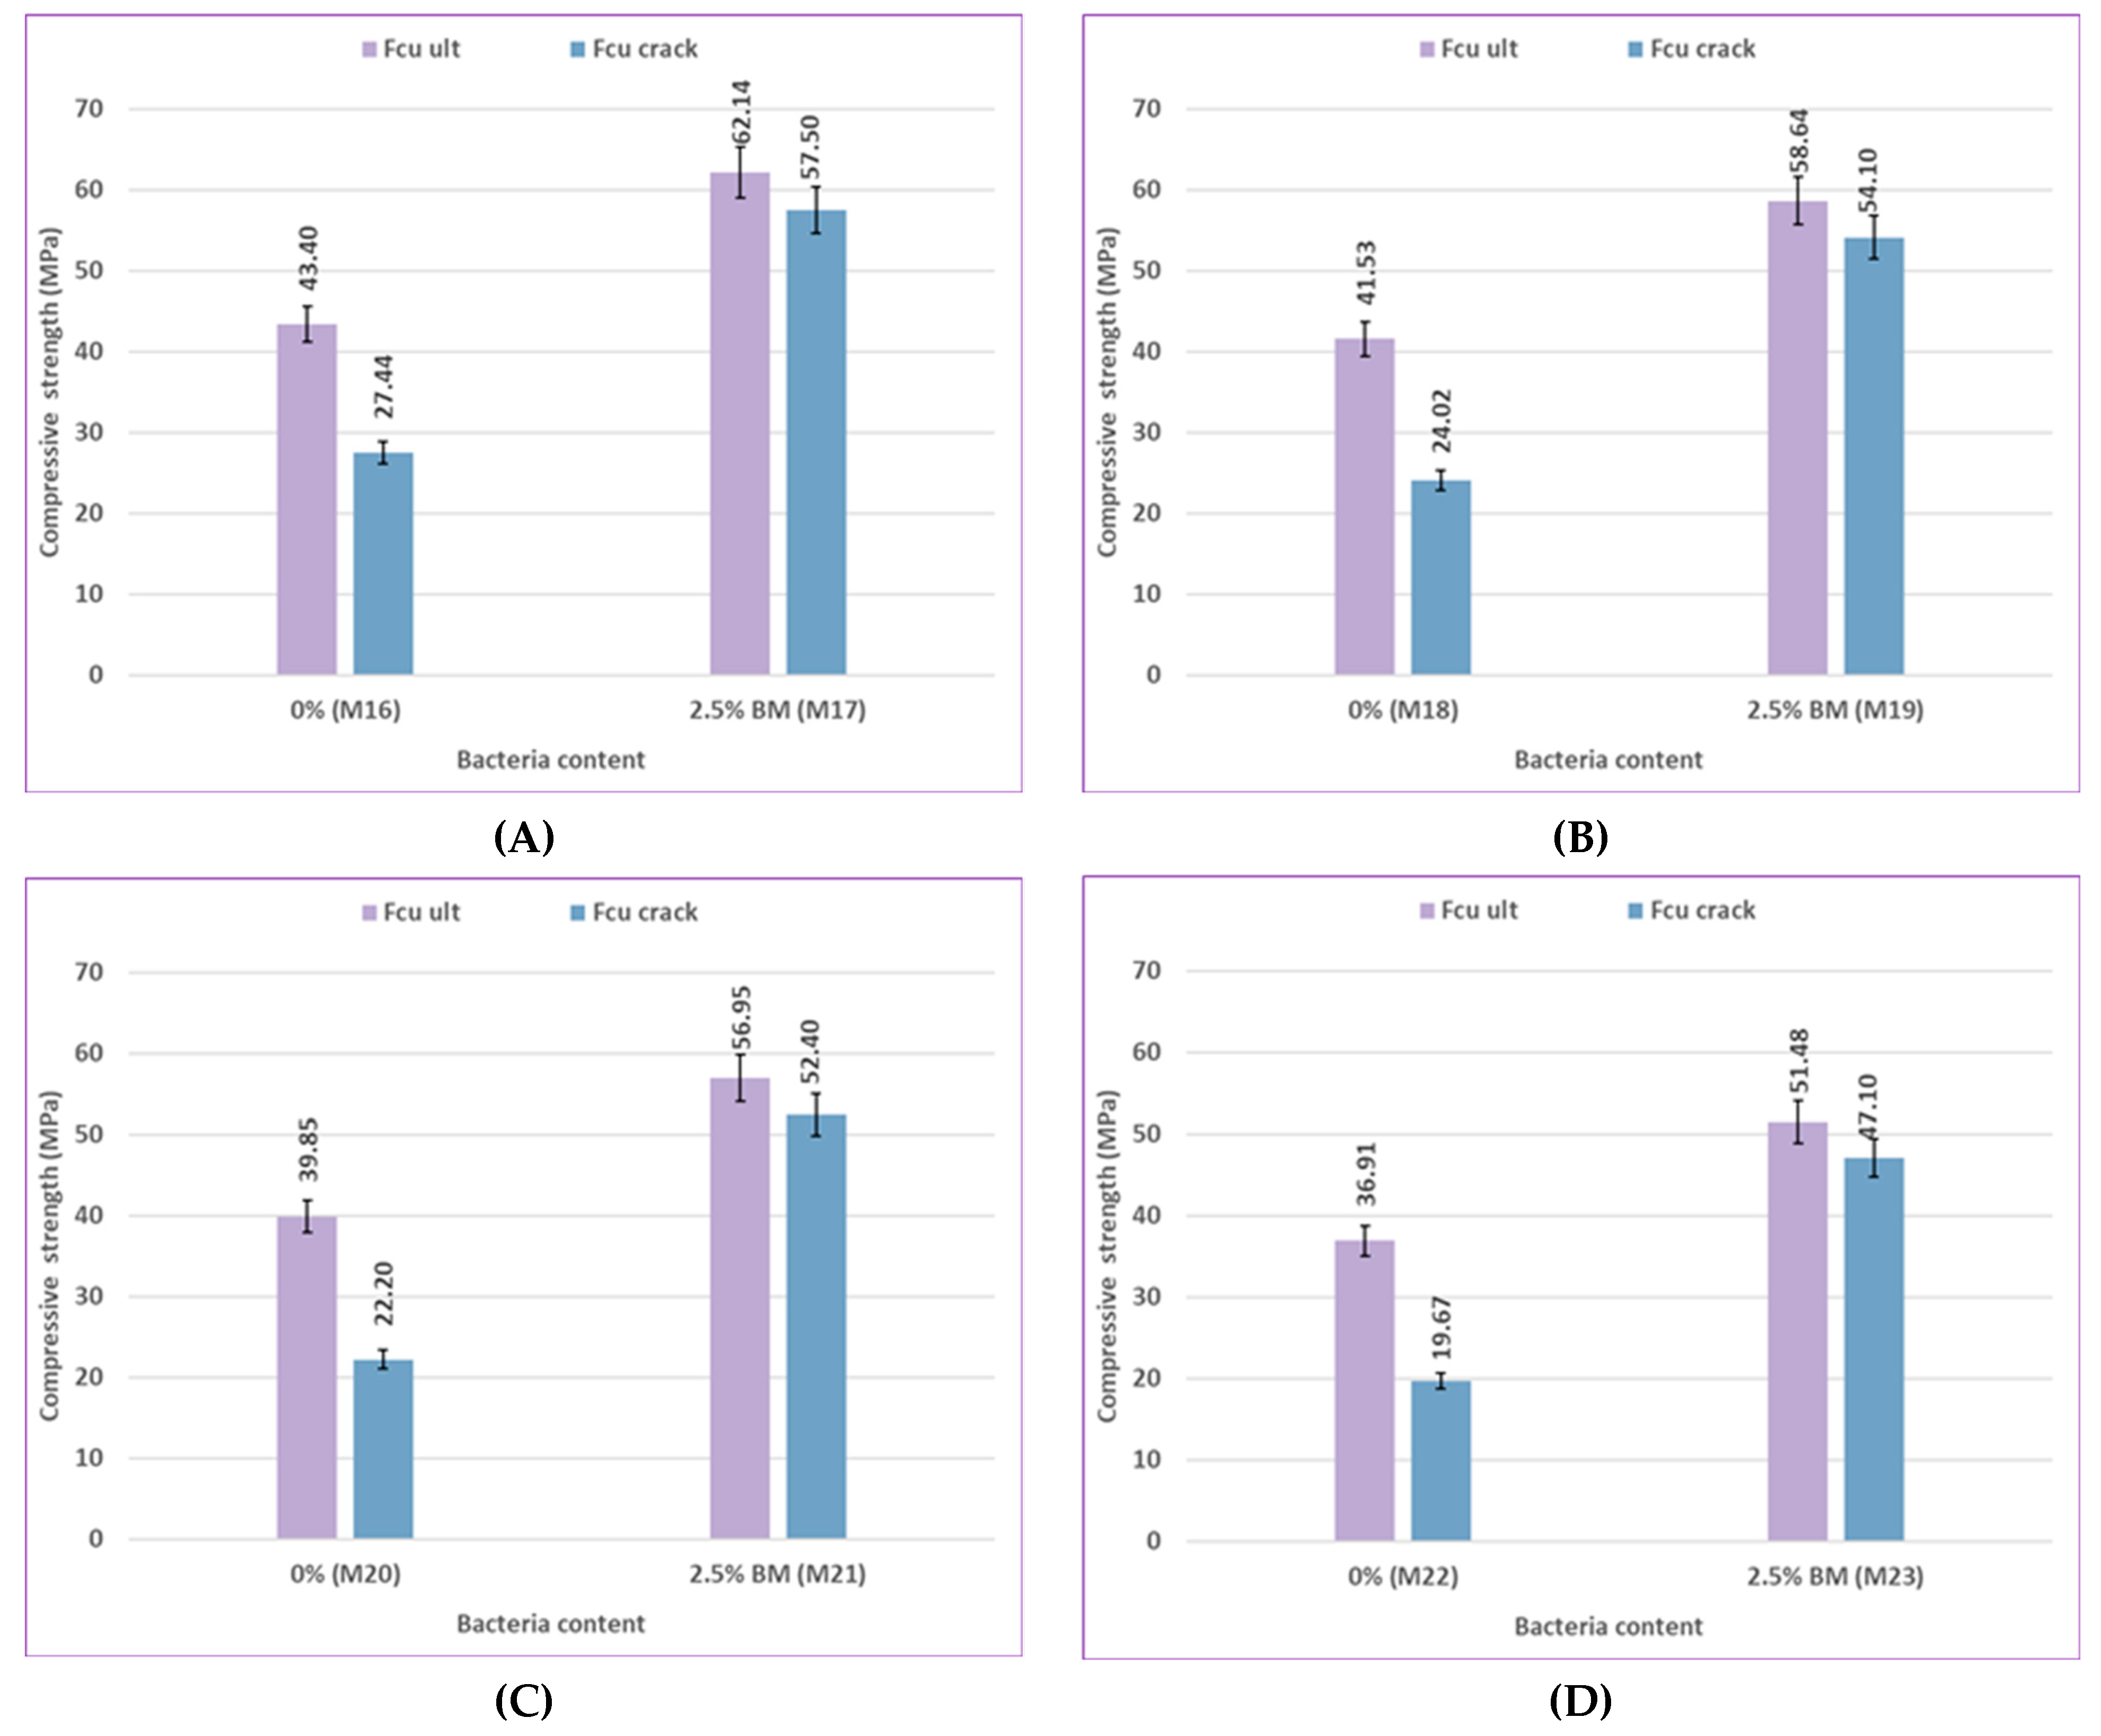
Figure 24.
Impact of bacterial type on concrete compressive strength for uncracked specimens and pre-cracked specimens for silica fume at 56 days: (A) at 0% sulfate, (B) at 2% sulfate, (C) at 5% sulfate, and (D) at 10% sulfate.
Figure 24.
Impact of bacterial type on concrete compressive strength for uncracked specimens and pre-cracked specimens for silica fume at 56 days: (A) at 0% sulfate, (B) at 2% sulfate, (C) at 5% sulfate, and (D) at 10% sulfate.
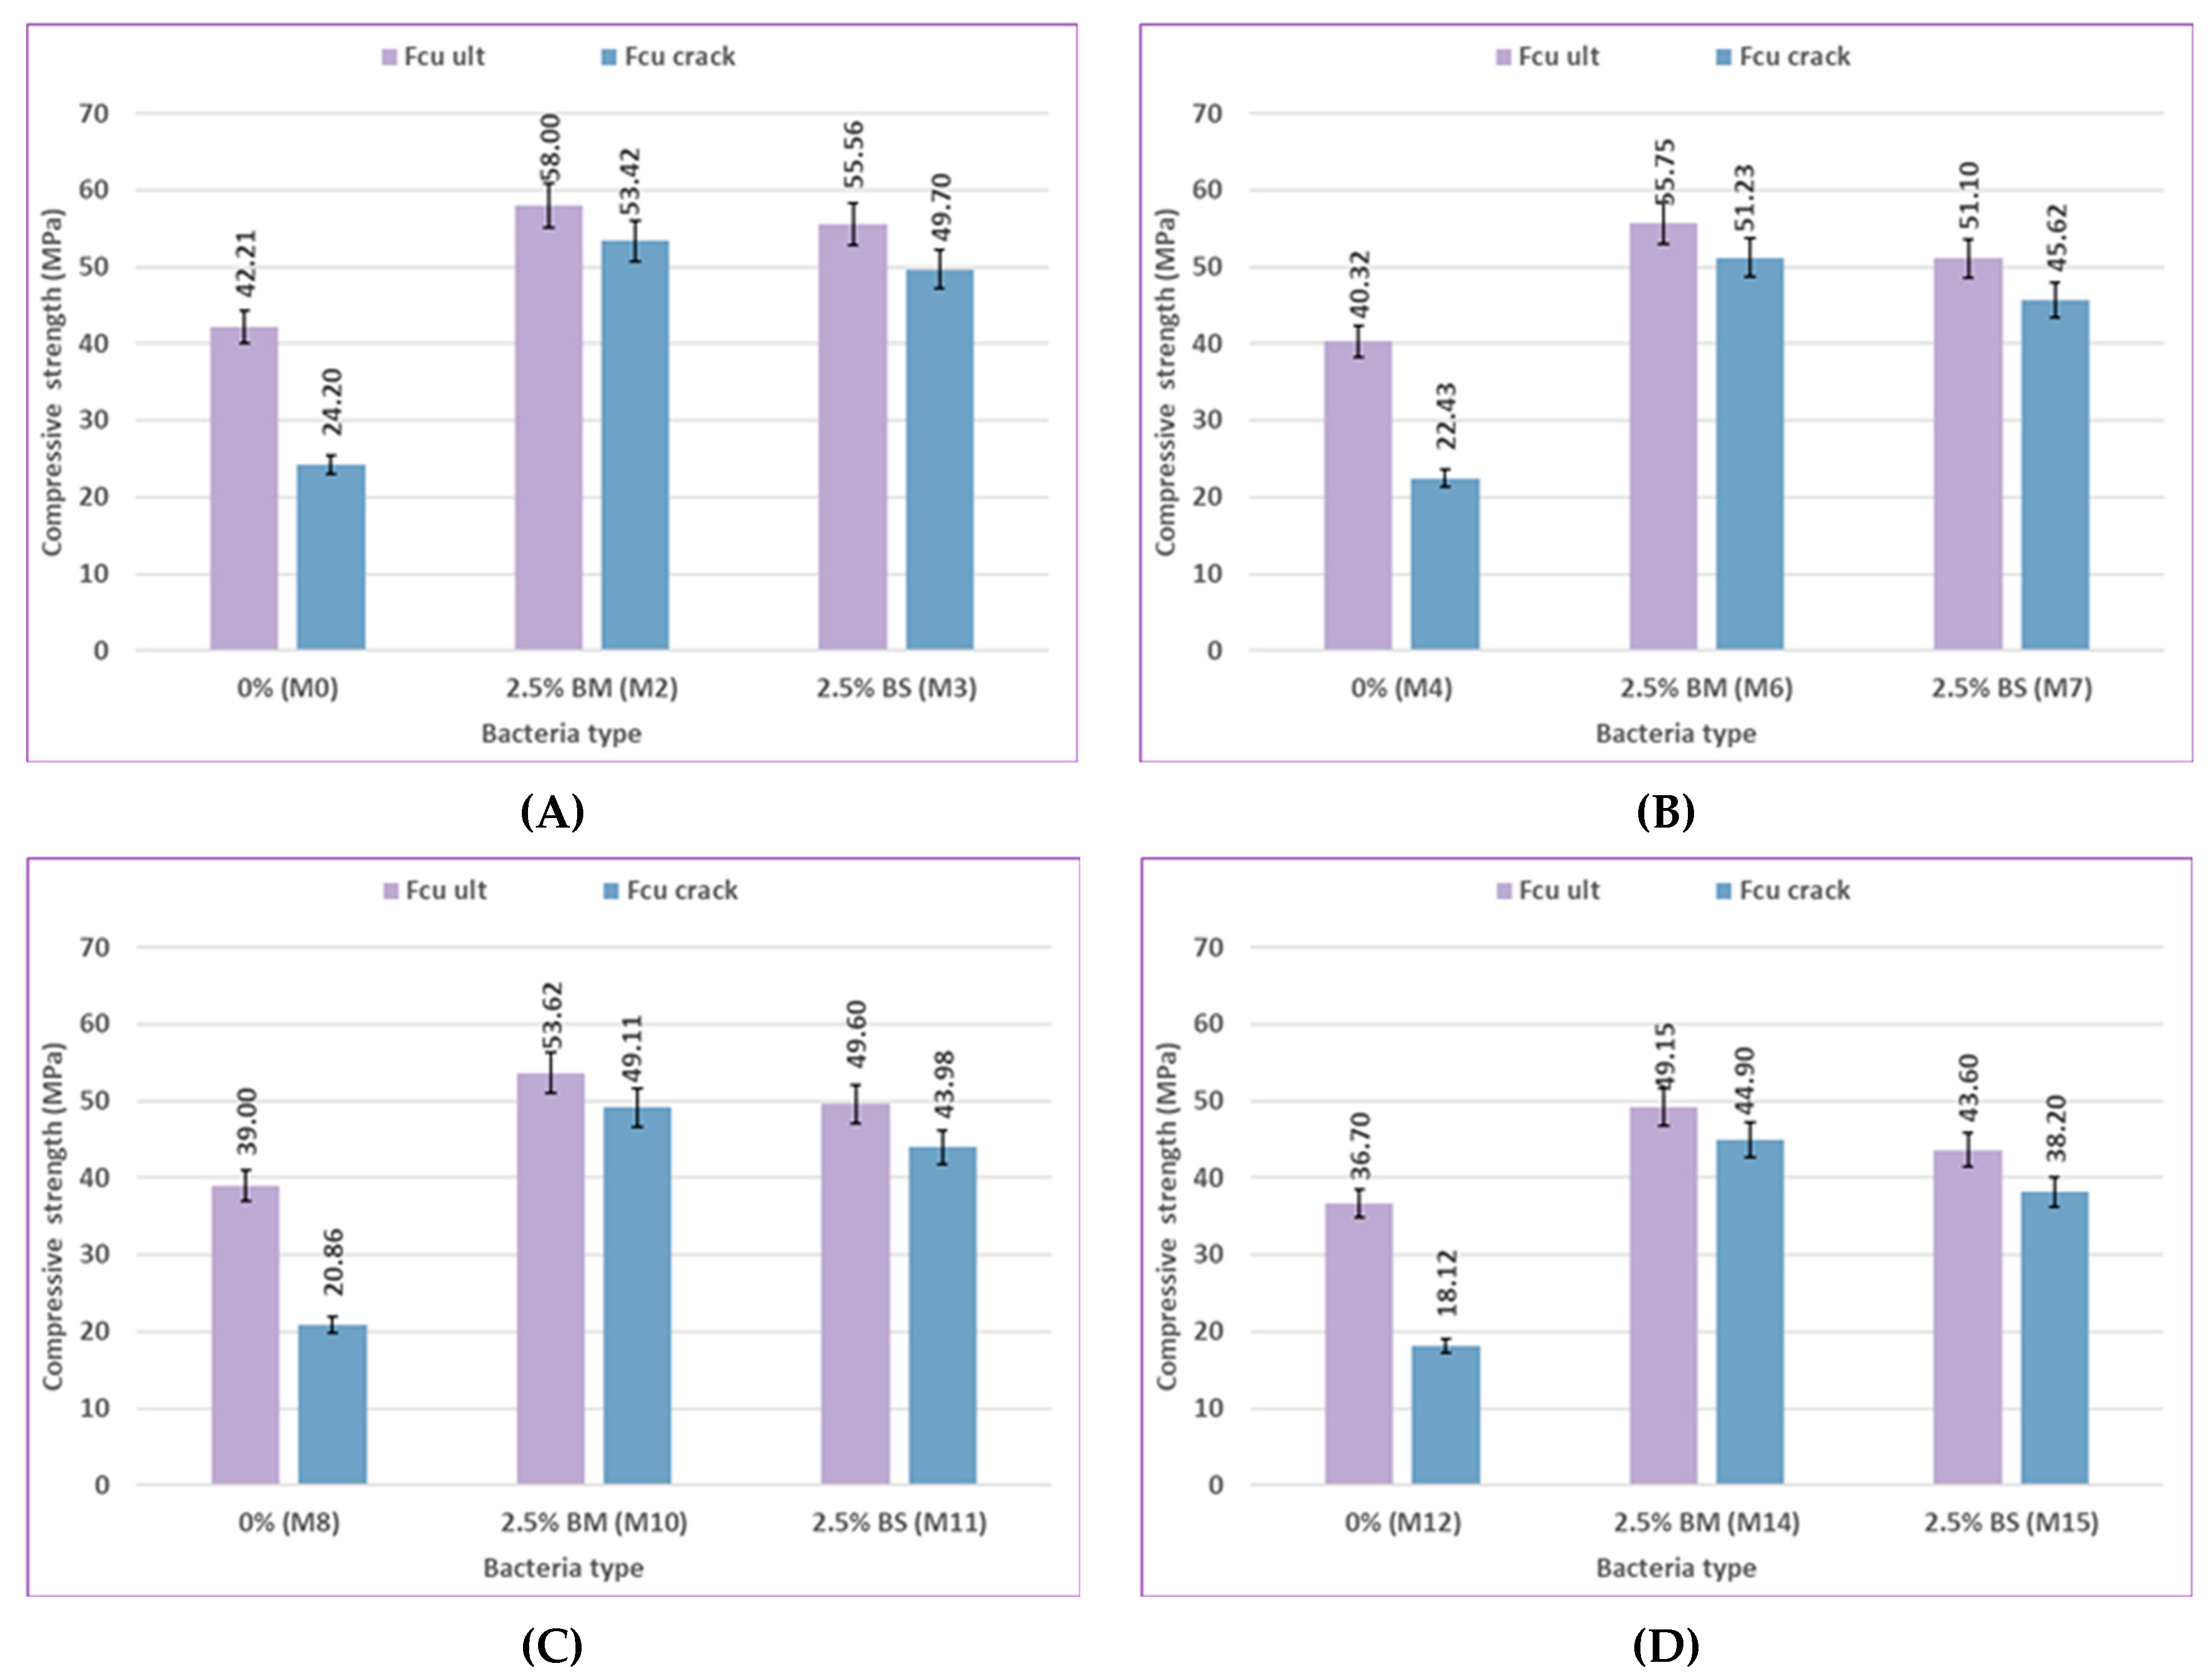
Figure 25.
Impact of bacterial type on concrete compressive strength for uncracked specimens and pre-cracked specimens for silica fume at 120 days: (A) at 0% sulfate, (B) at 2% sulfate, (C) at 5% sulfate, and (D) at 10% sulfate.
Figure 25.
Impact of bacterial type on concrete compressive strength for uncracked specimens and pre-cracked specimens for silica fume at 120 days: (A) at 0% sulfate, (B) at 2% sulfate, (C) at 5% sulfate, and (D) at 10% sulfate.
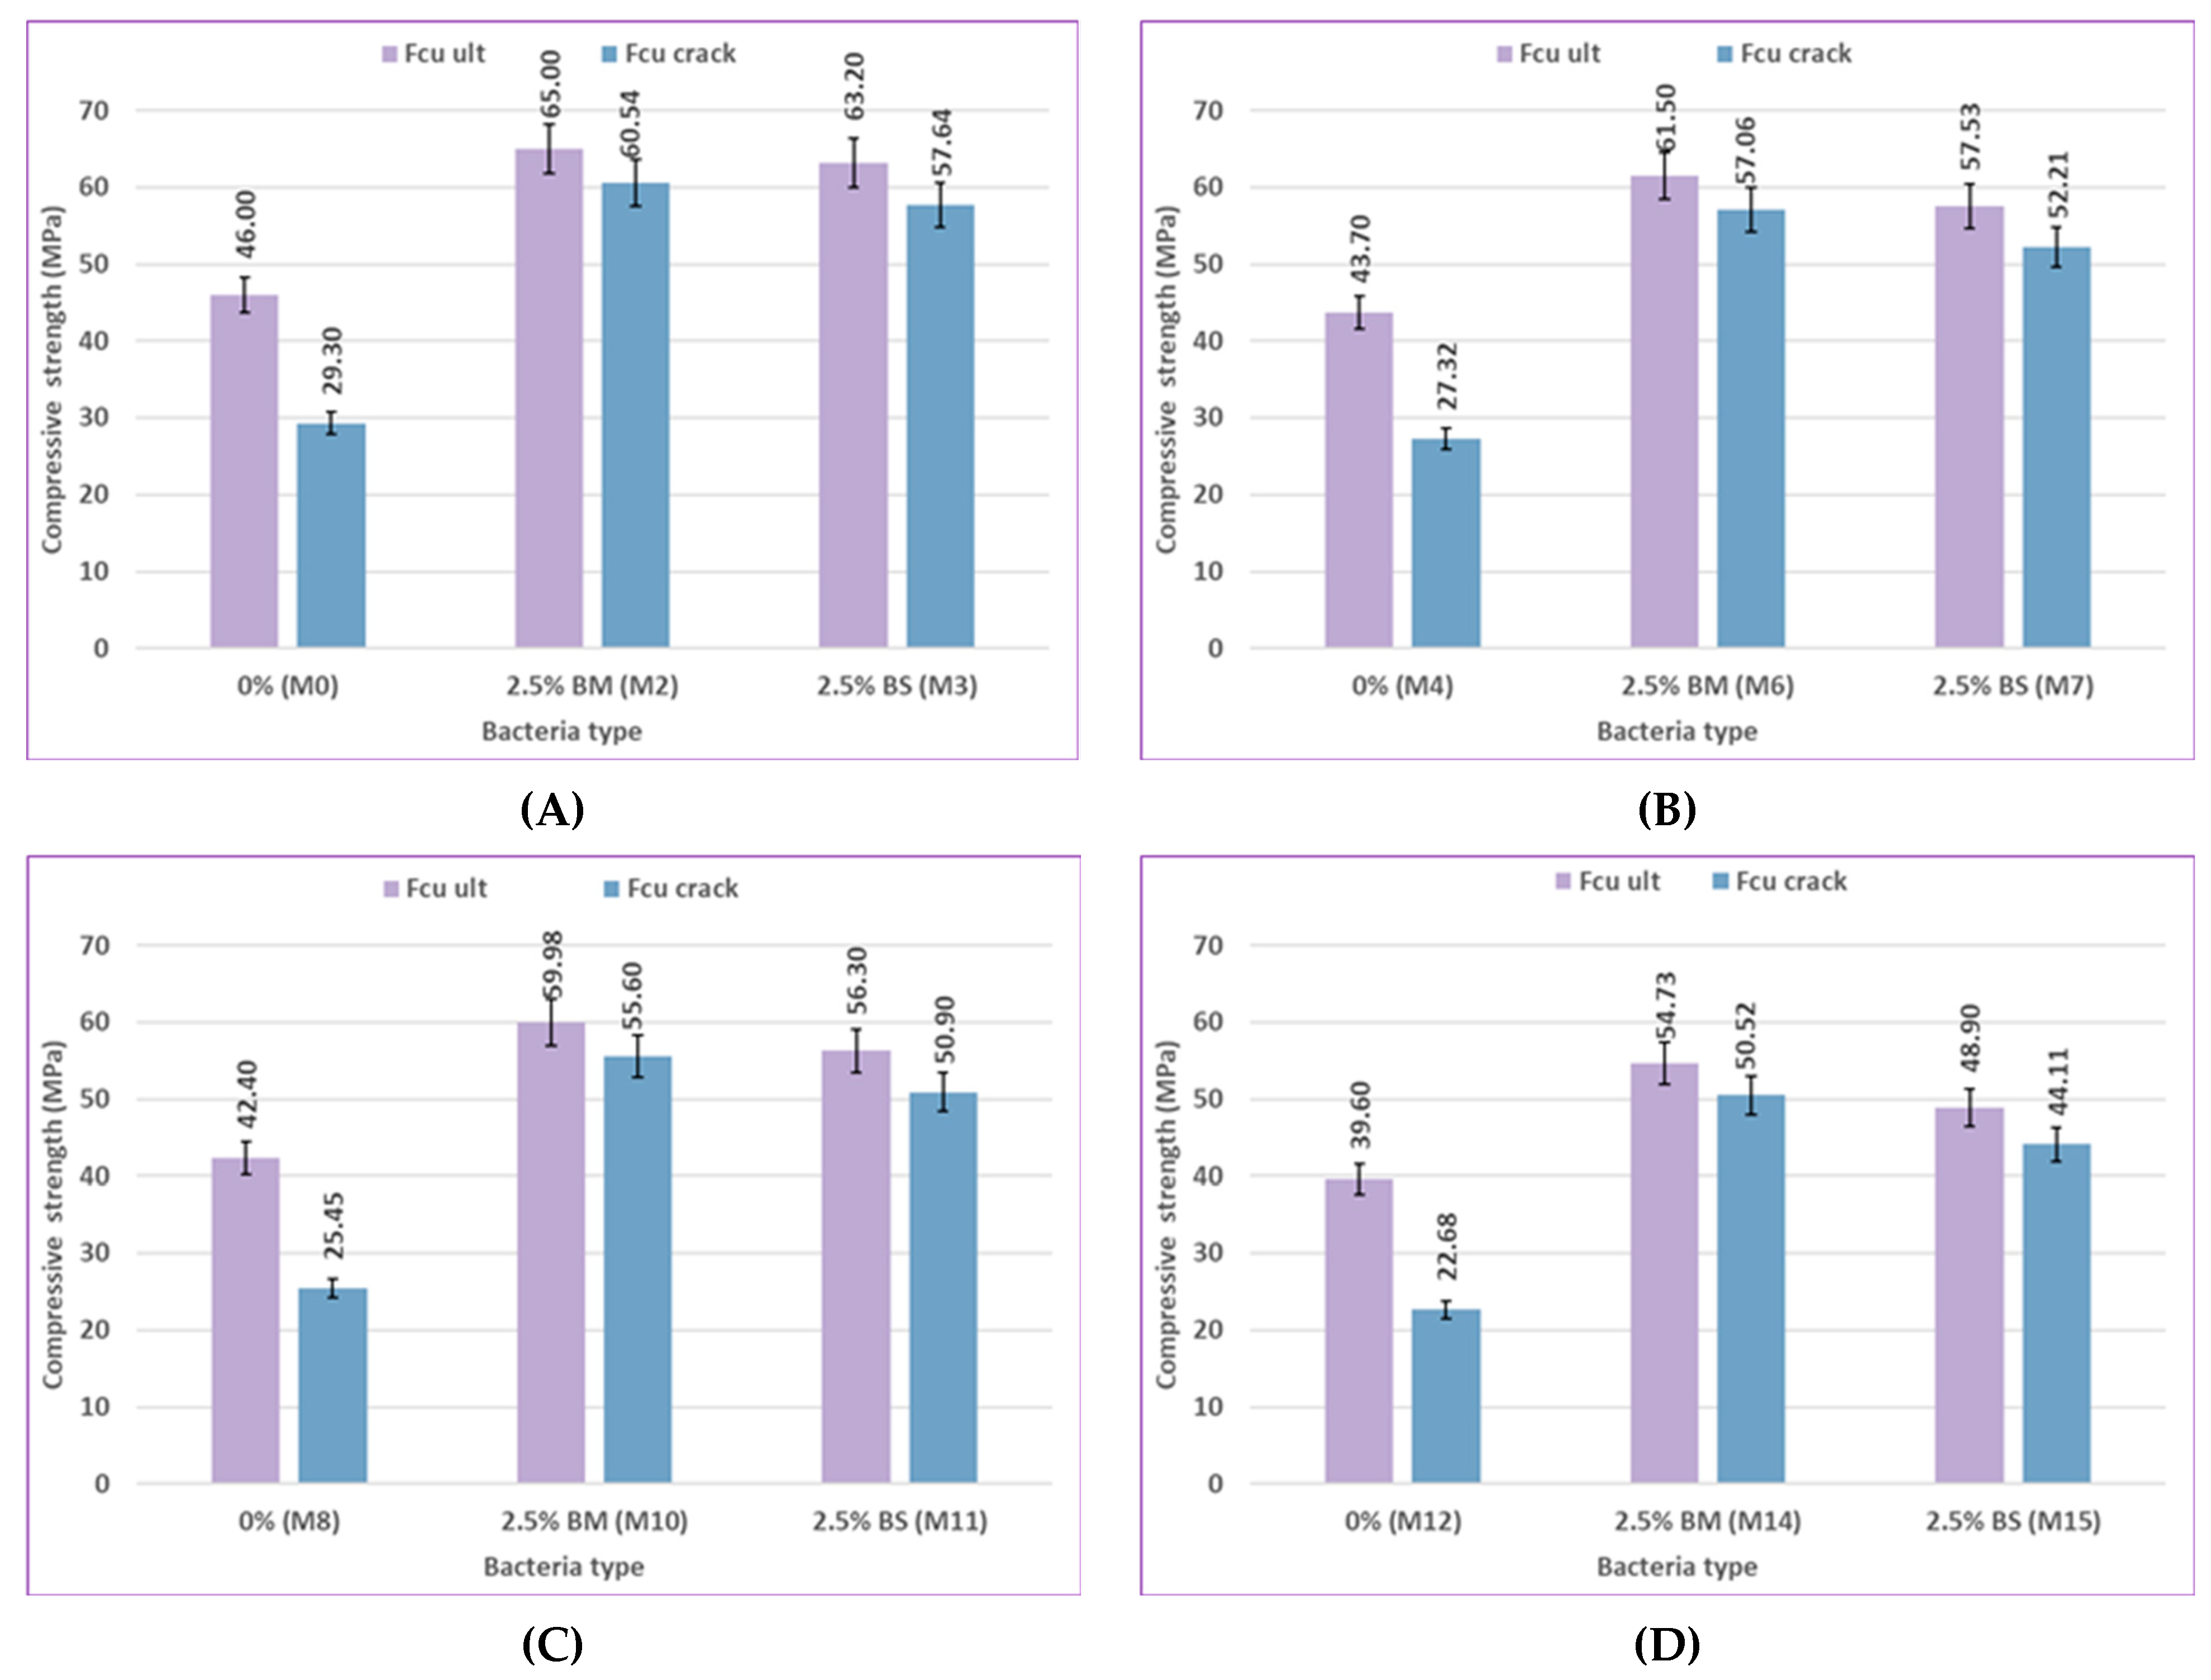
Figure 26.
Impact of pozzolanic material type on concrete compressive strength for uncracked specimens and pre-cracked specimens at 56 days: (A) at 0% sulfate, (B) at 2% sulfate, (C) at 5% sulfate, and (D) at 10% sulfate.
Figure 26.
Impact of pozzolanic material type on concrete compressive strength for uncracked specimens and pre-cracked specimens at 56 days: (A) at 0% sulfate, (B) at 2% sulfate, (C) at 5% sulfate, and (D) at 10% sulfate.
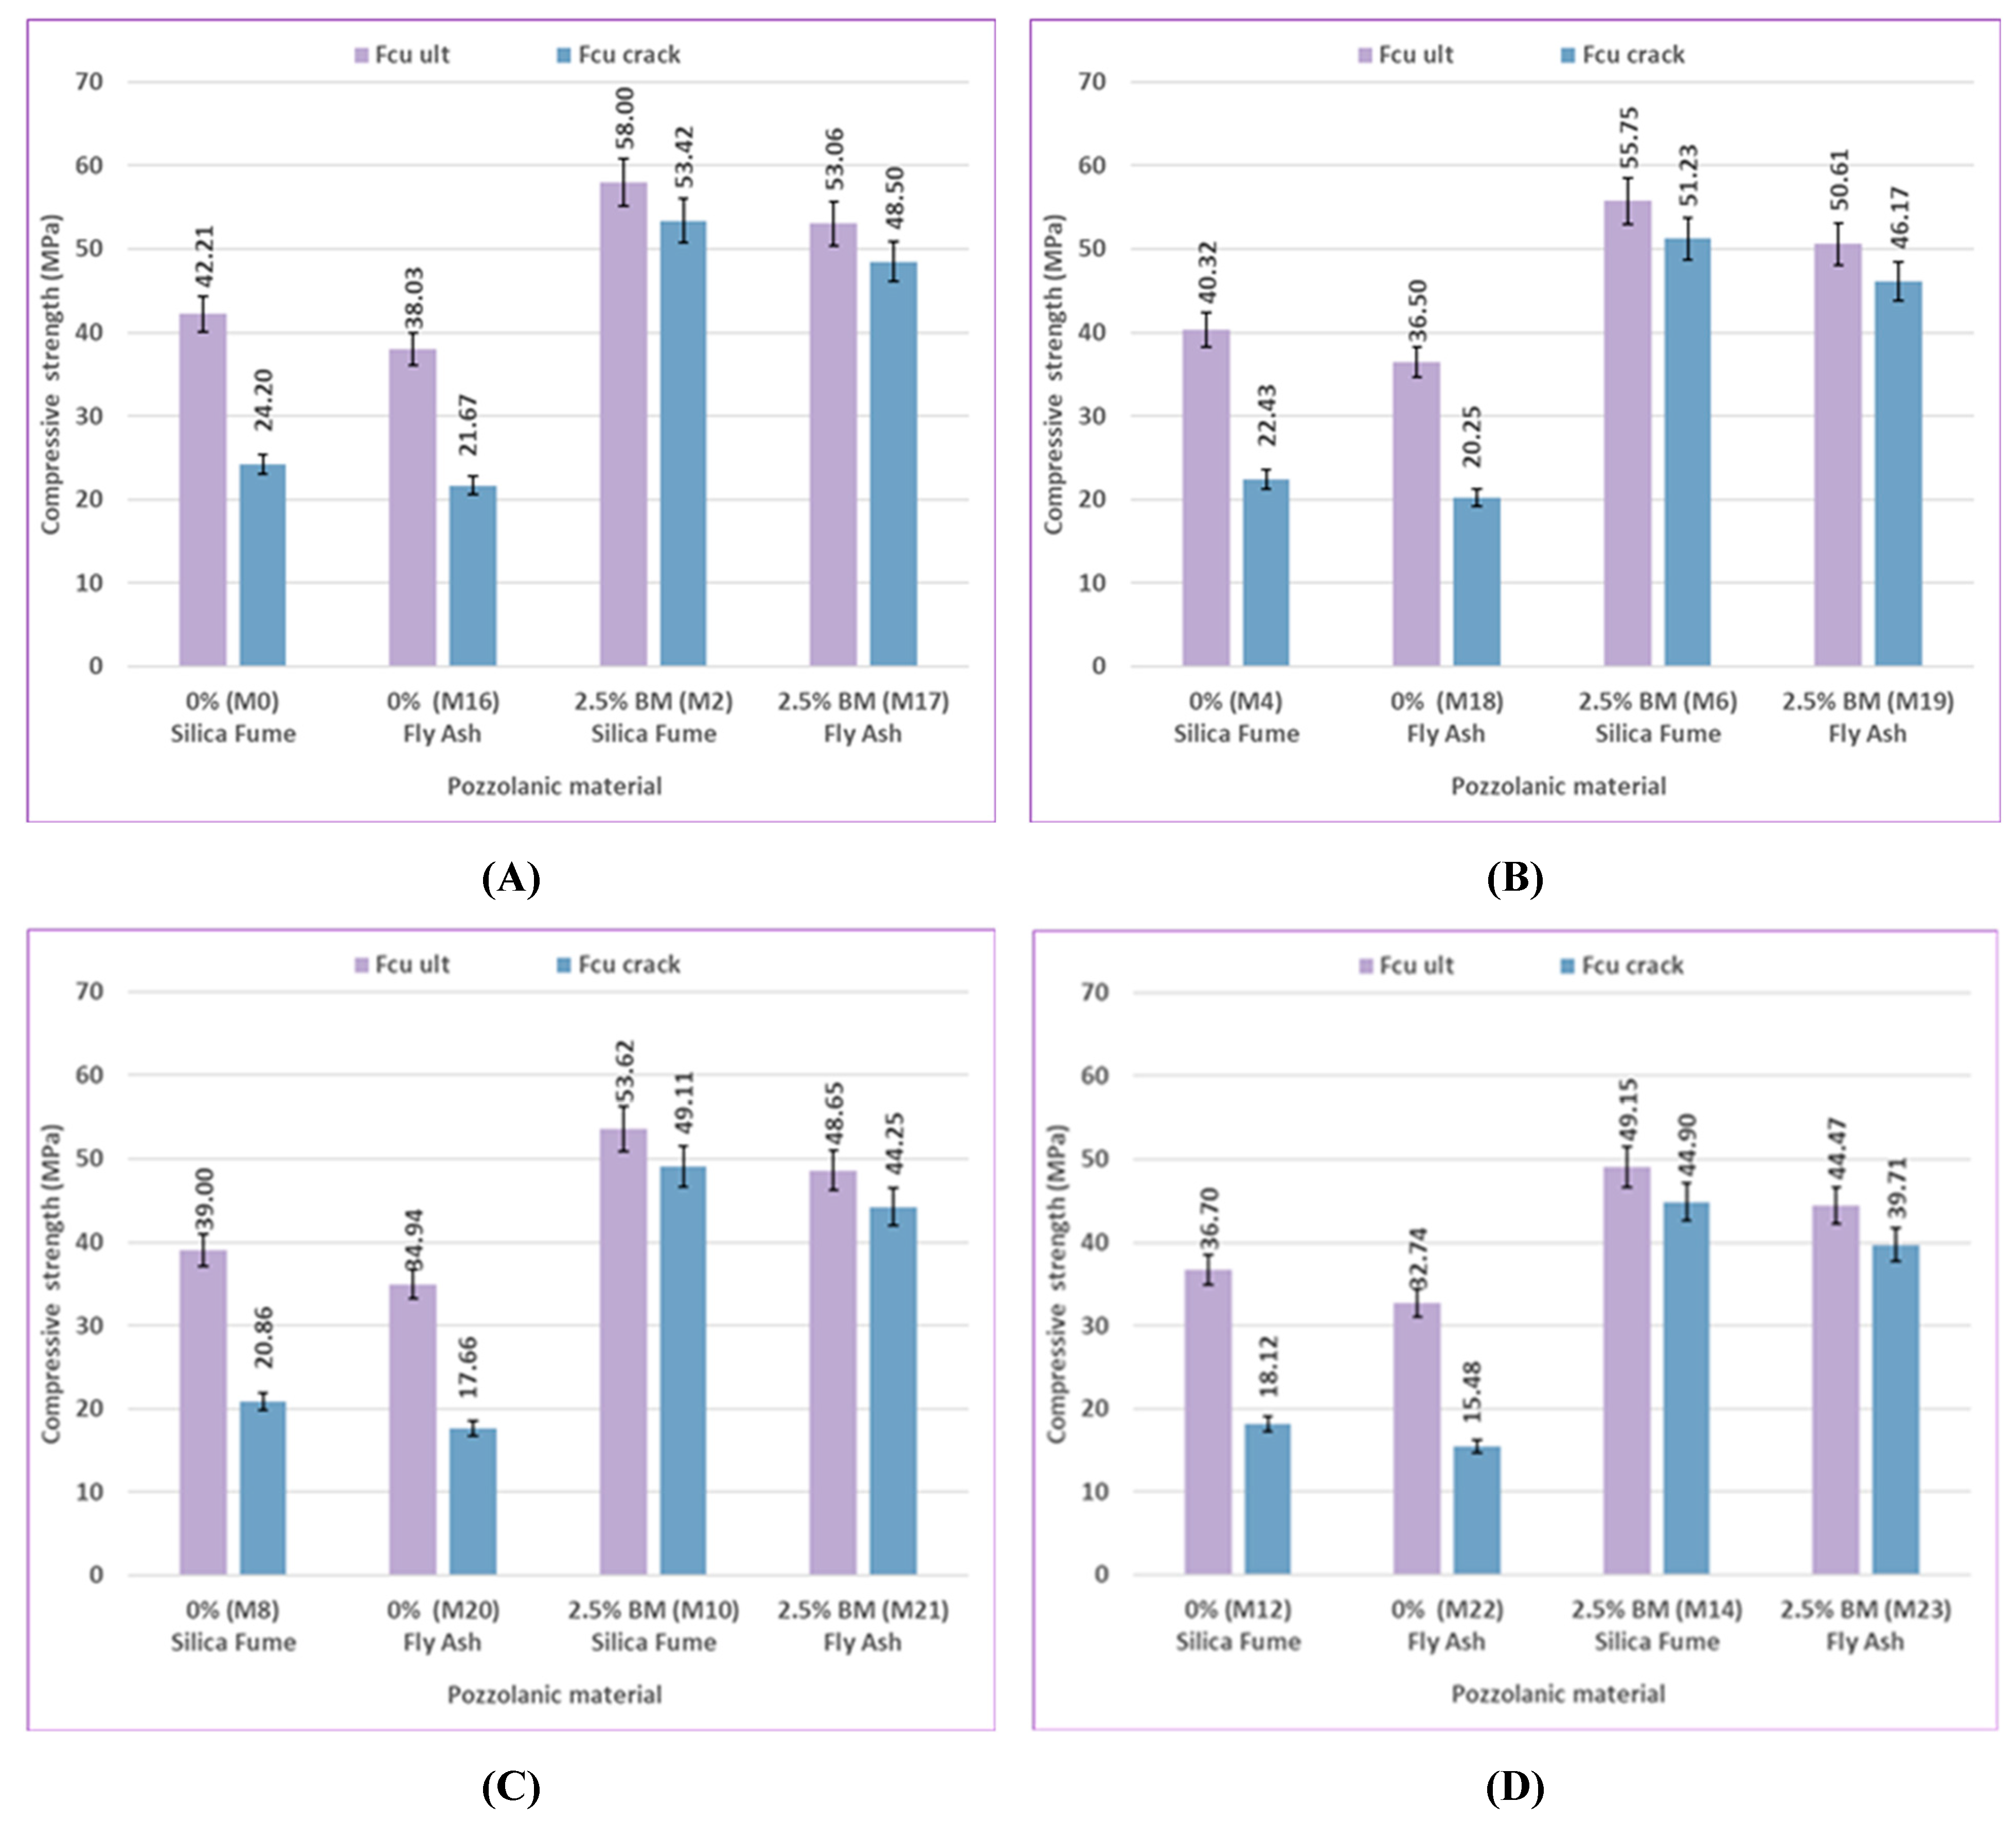
Figure 27.
Impact of pozzolanic material type on concrete compressive strength for uncracked specimens and pre-cracked specimens at 120 days: (A) at 0% sulfate, (B) at 2% sulfate, (C) at 5% sulfate, and (D) at 10% sulfate.
Figure 27.
Impact of pozzolanic material type on concrete compressive strength for uncracked specimens and pre-cracked specimens at 120 days: (A) at 0% sulfate, (B) at 2% sulfate, (C) at 5% sulfate, and (D) at 10% sulfate.
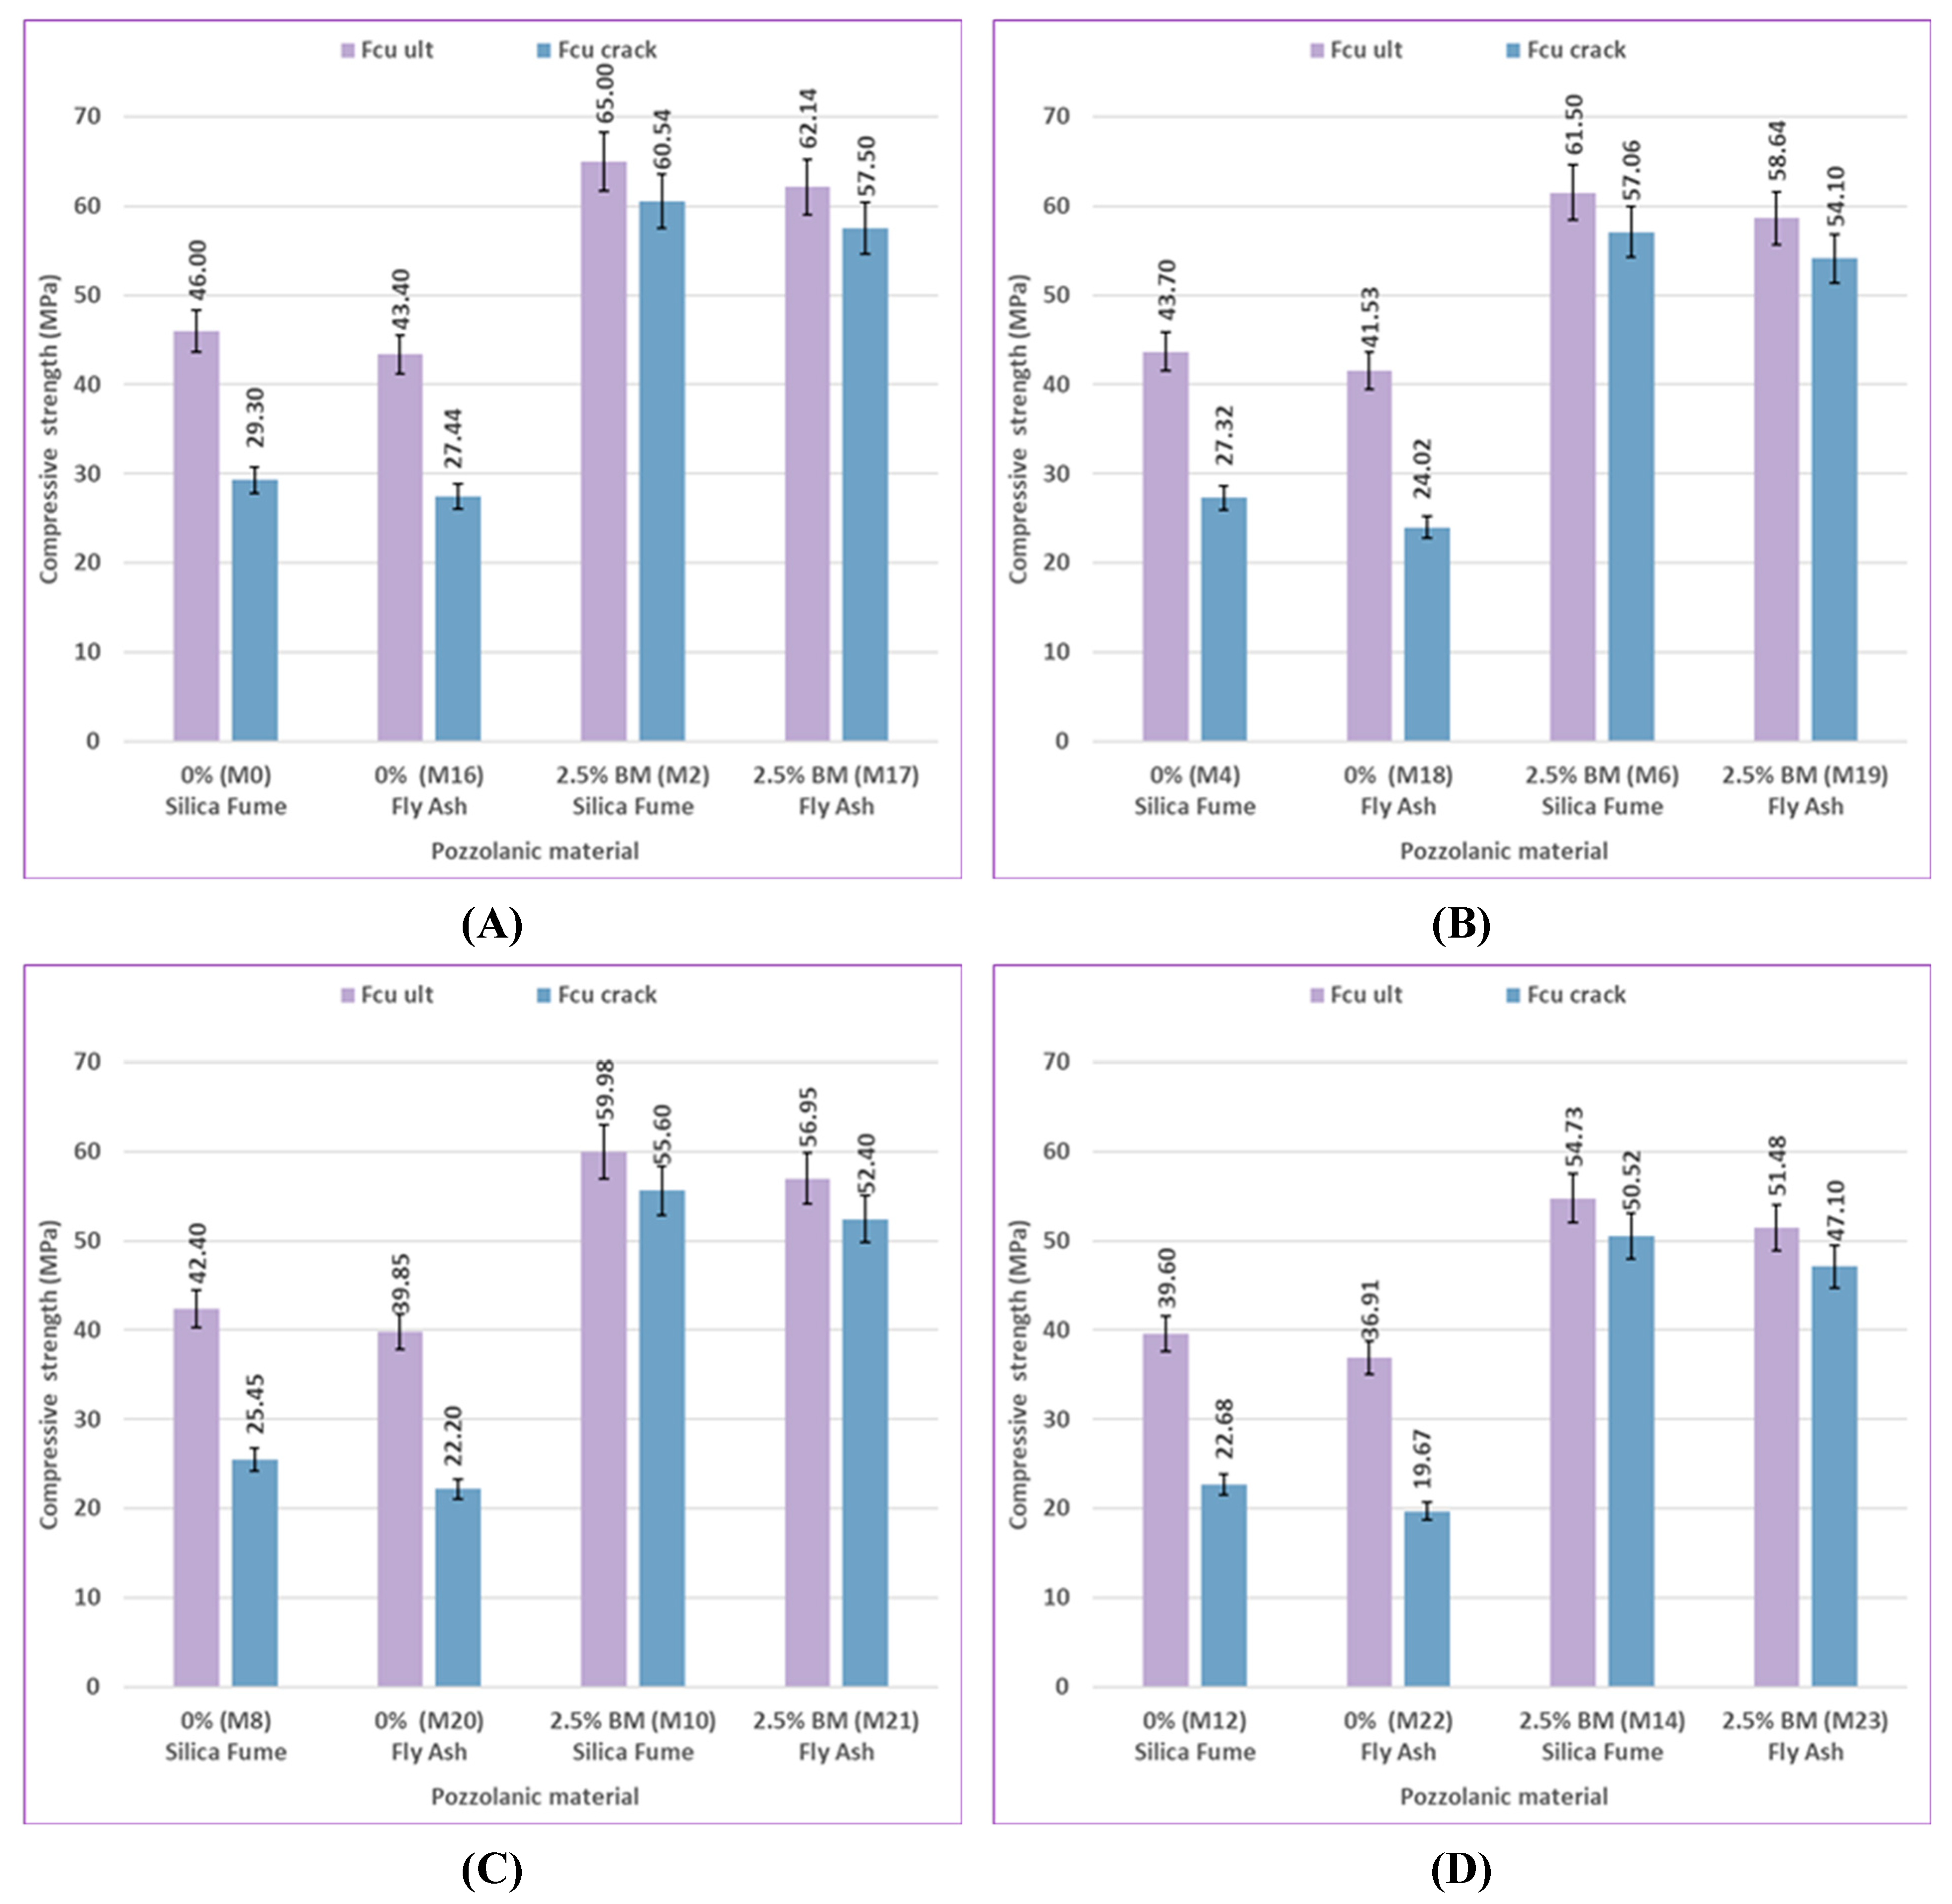
Figure 28.
Impact of curing type on concrete compressive strength for uncracked specimens and pre-cracked specimens for silica fume at 56 days: (A) at 0% bacteria, (B) at 1% bacteria BM, (C) at 2.5% bacteria BM, and (D) at 2.5% bacteria.
Figure 28.
Impact of curing type on concrete compressive strength for uncracked specimens and pre-cracked specimens for silica fume at 56 days: (A) at 0% bacteria, (B) at 1% bacteria BM, (C) at 2.5% bacteria BM, and (D) at 2.5% bacteria.
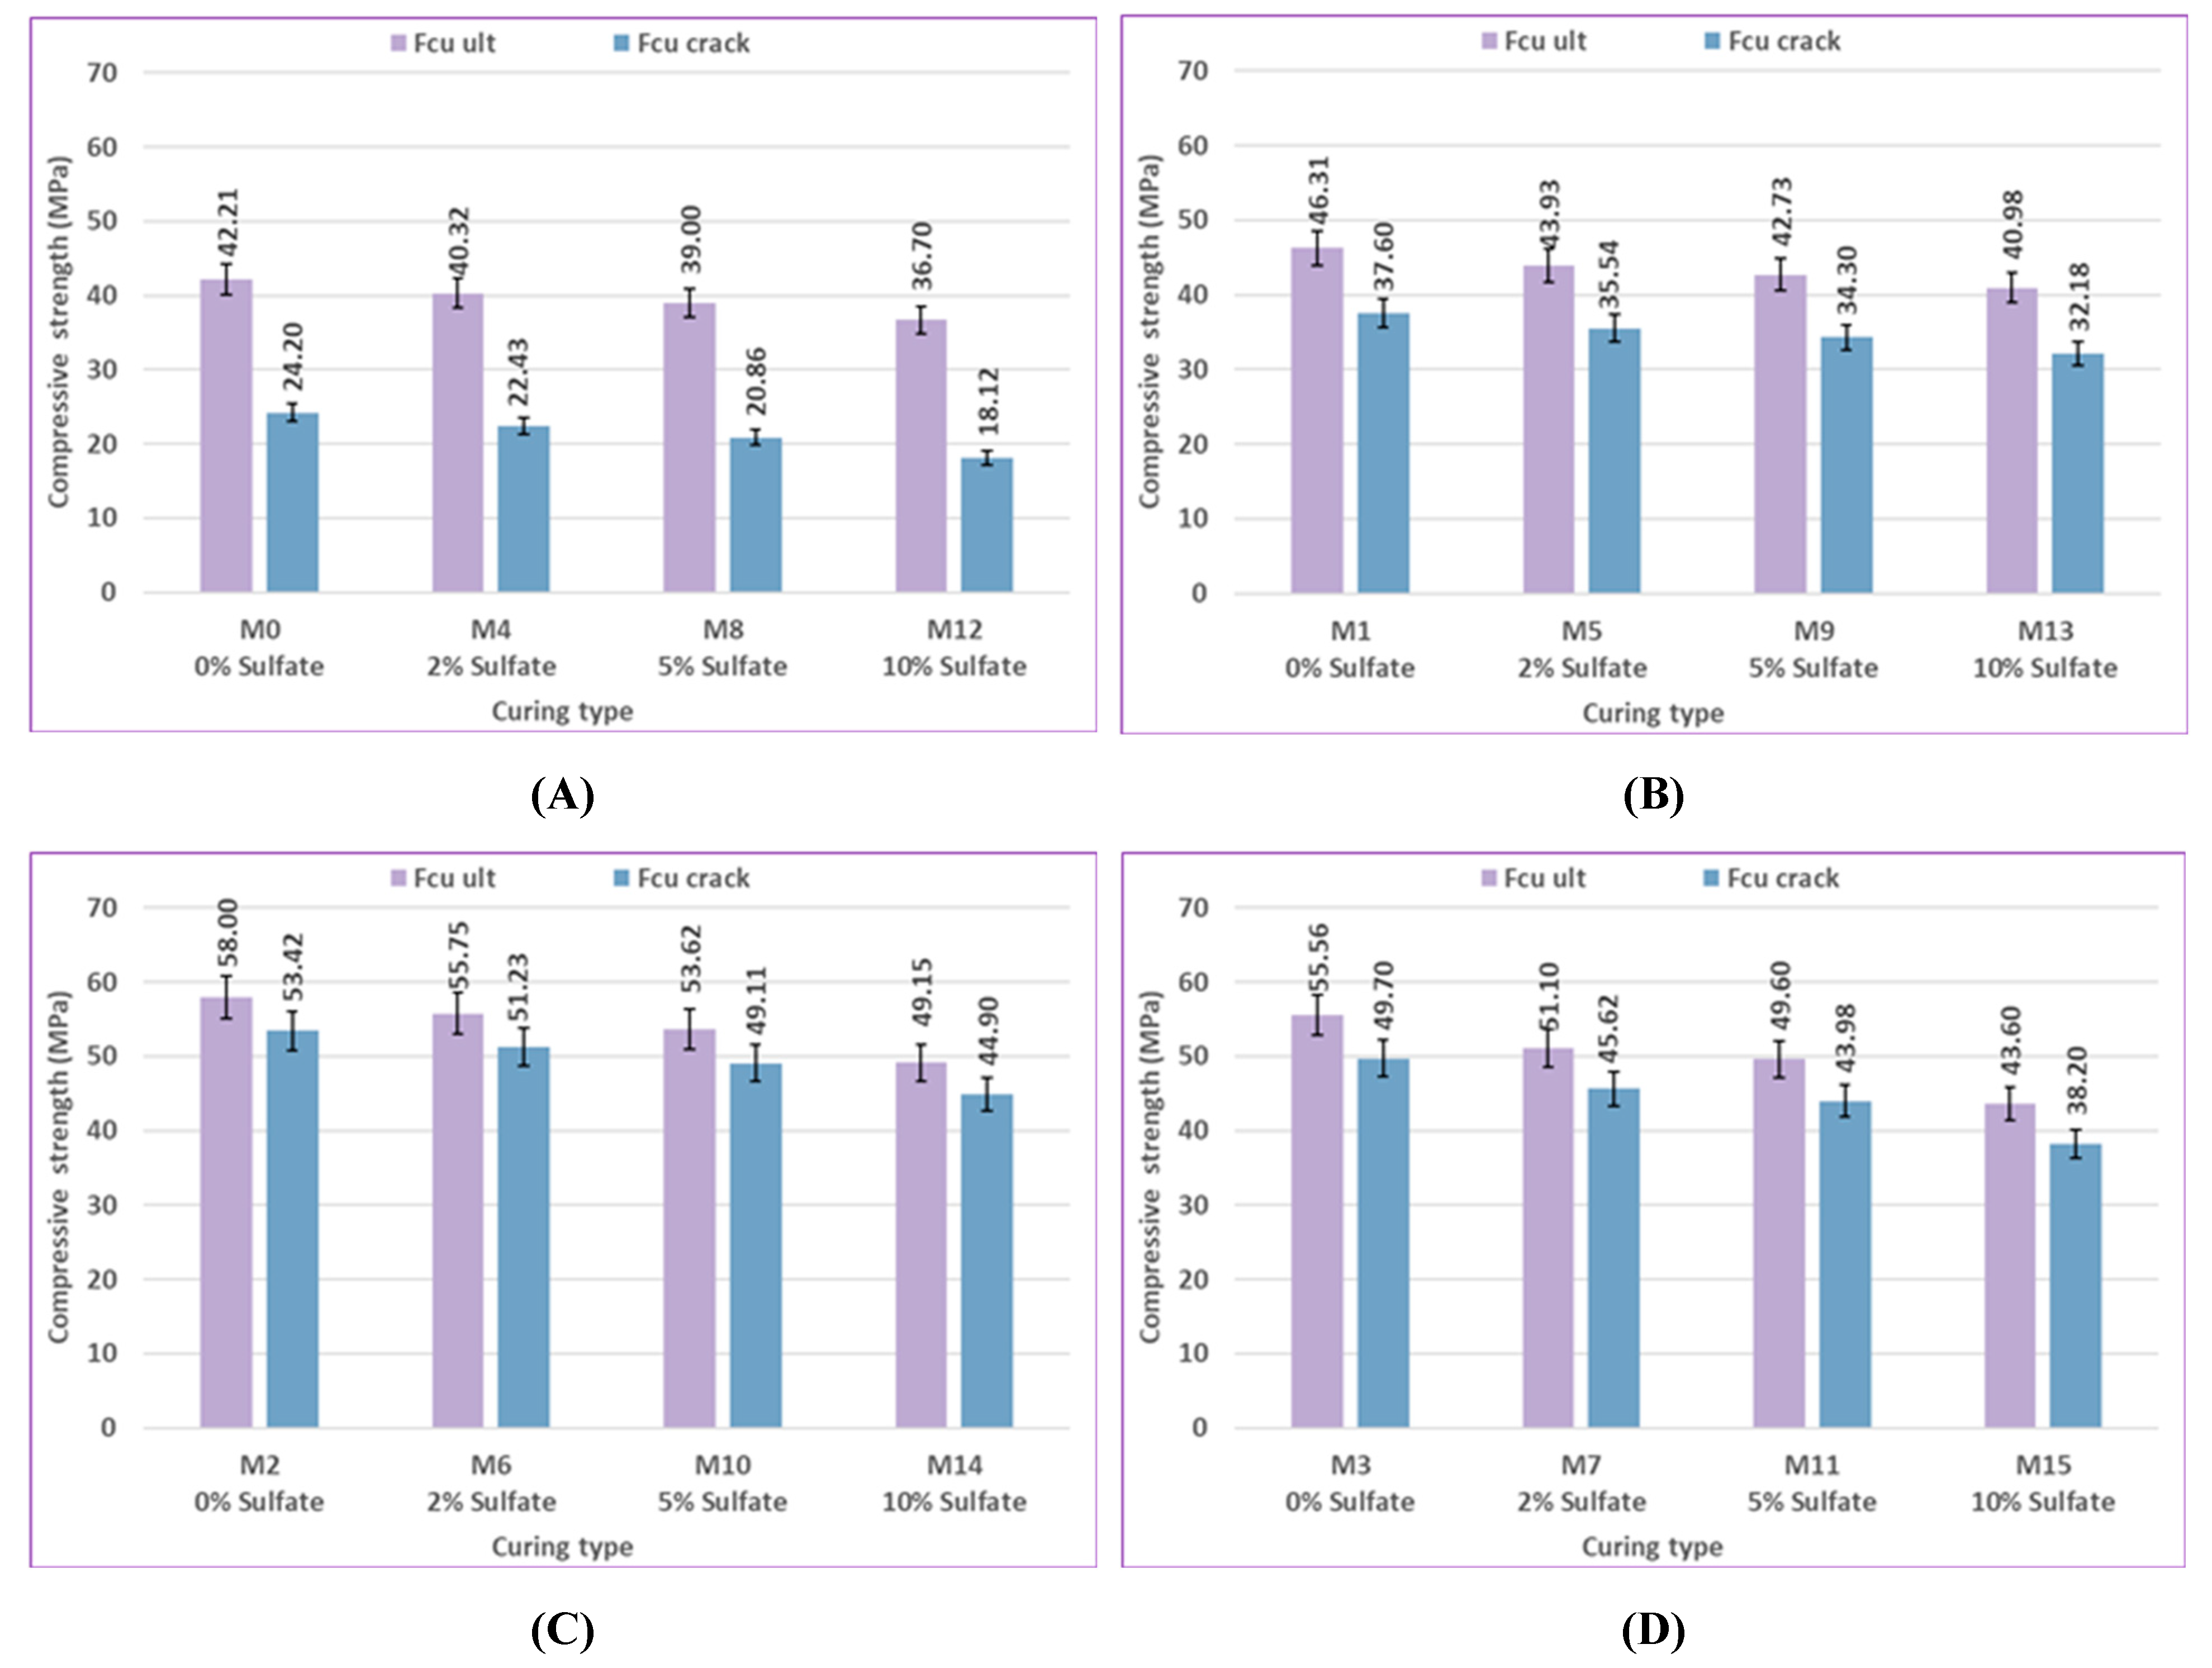
Figure 29.
Impact of curing type on concrete compressive strength for uncracked specimens and pre-cracked specimens for silica fume at 120 days: (A) at 0% bacteria, (B) at 1% bacteria BM, (C) at 2.5% bacteria BM, and (D) at 2.5% bacteria BS.
Figure 29.
Impact of curing type on concrete compressive strength for uncracked specimens and pre-cracked specimens for silica fume at 120 days: (A) at 0% bacteria, (B) at 1% bacteria BM, (C) at 2.5% bacteria BM, and (D) at 2.5% bacteria BS.
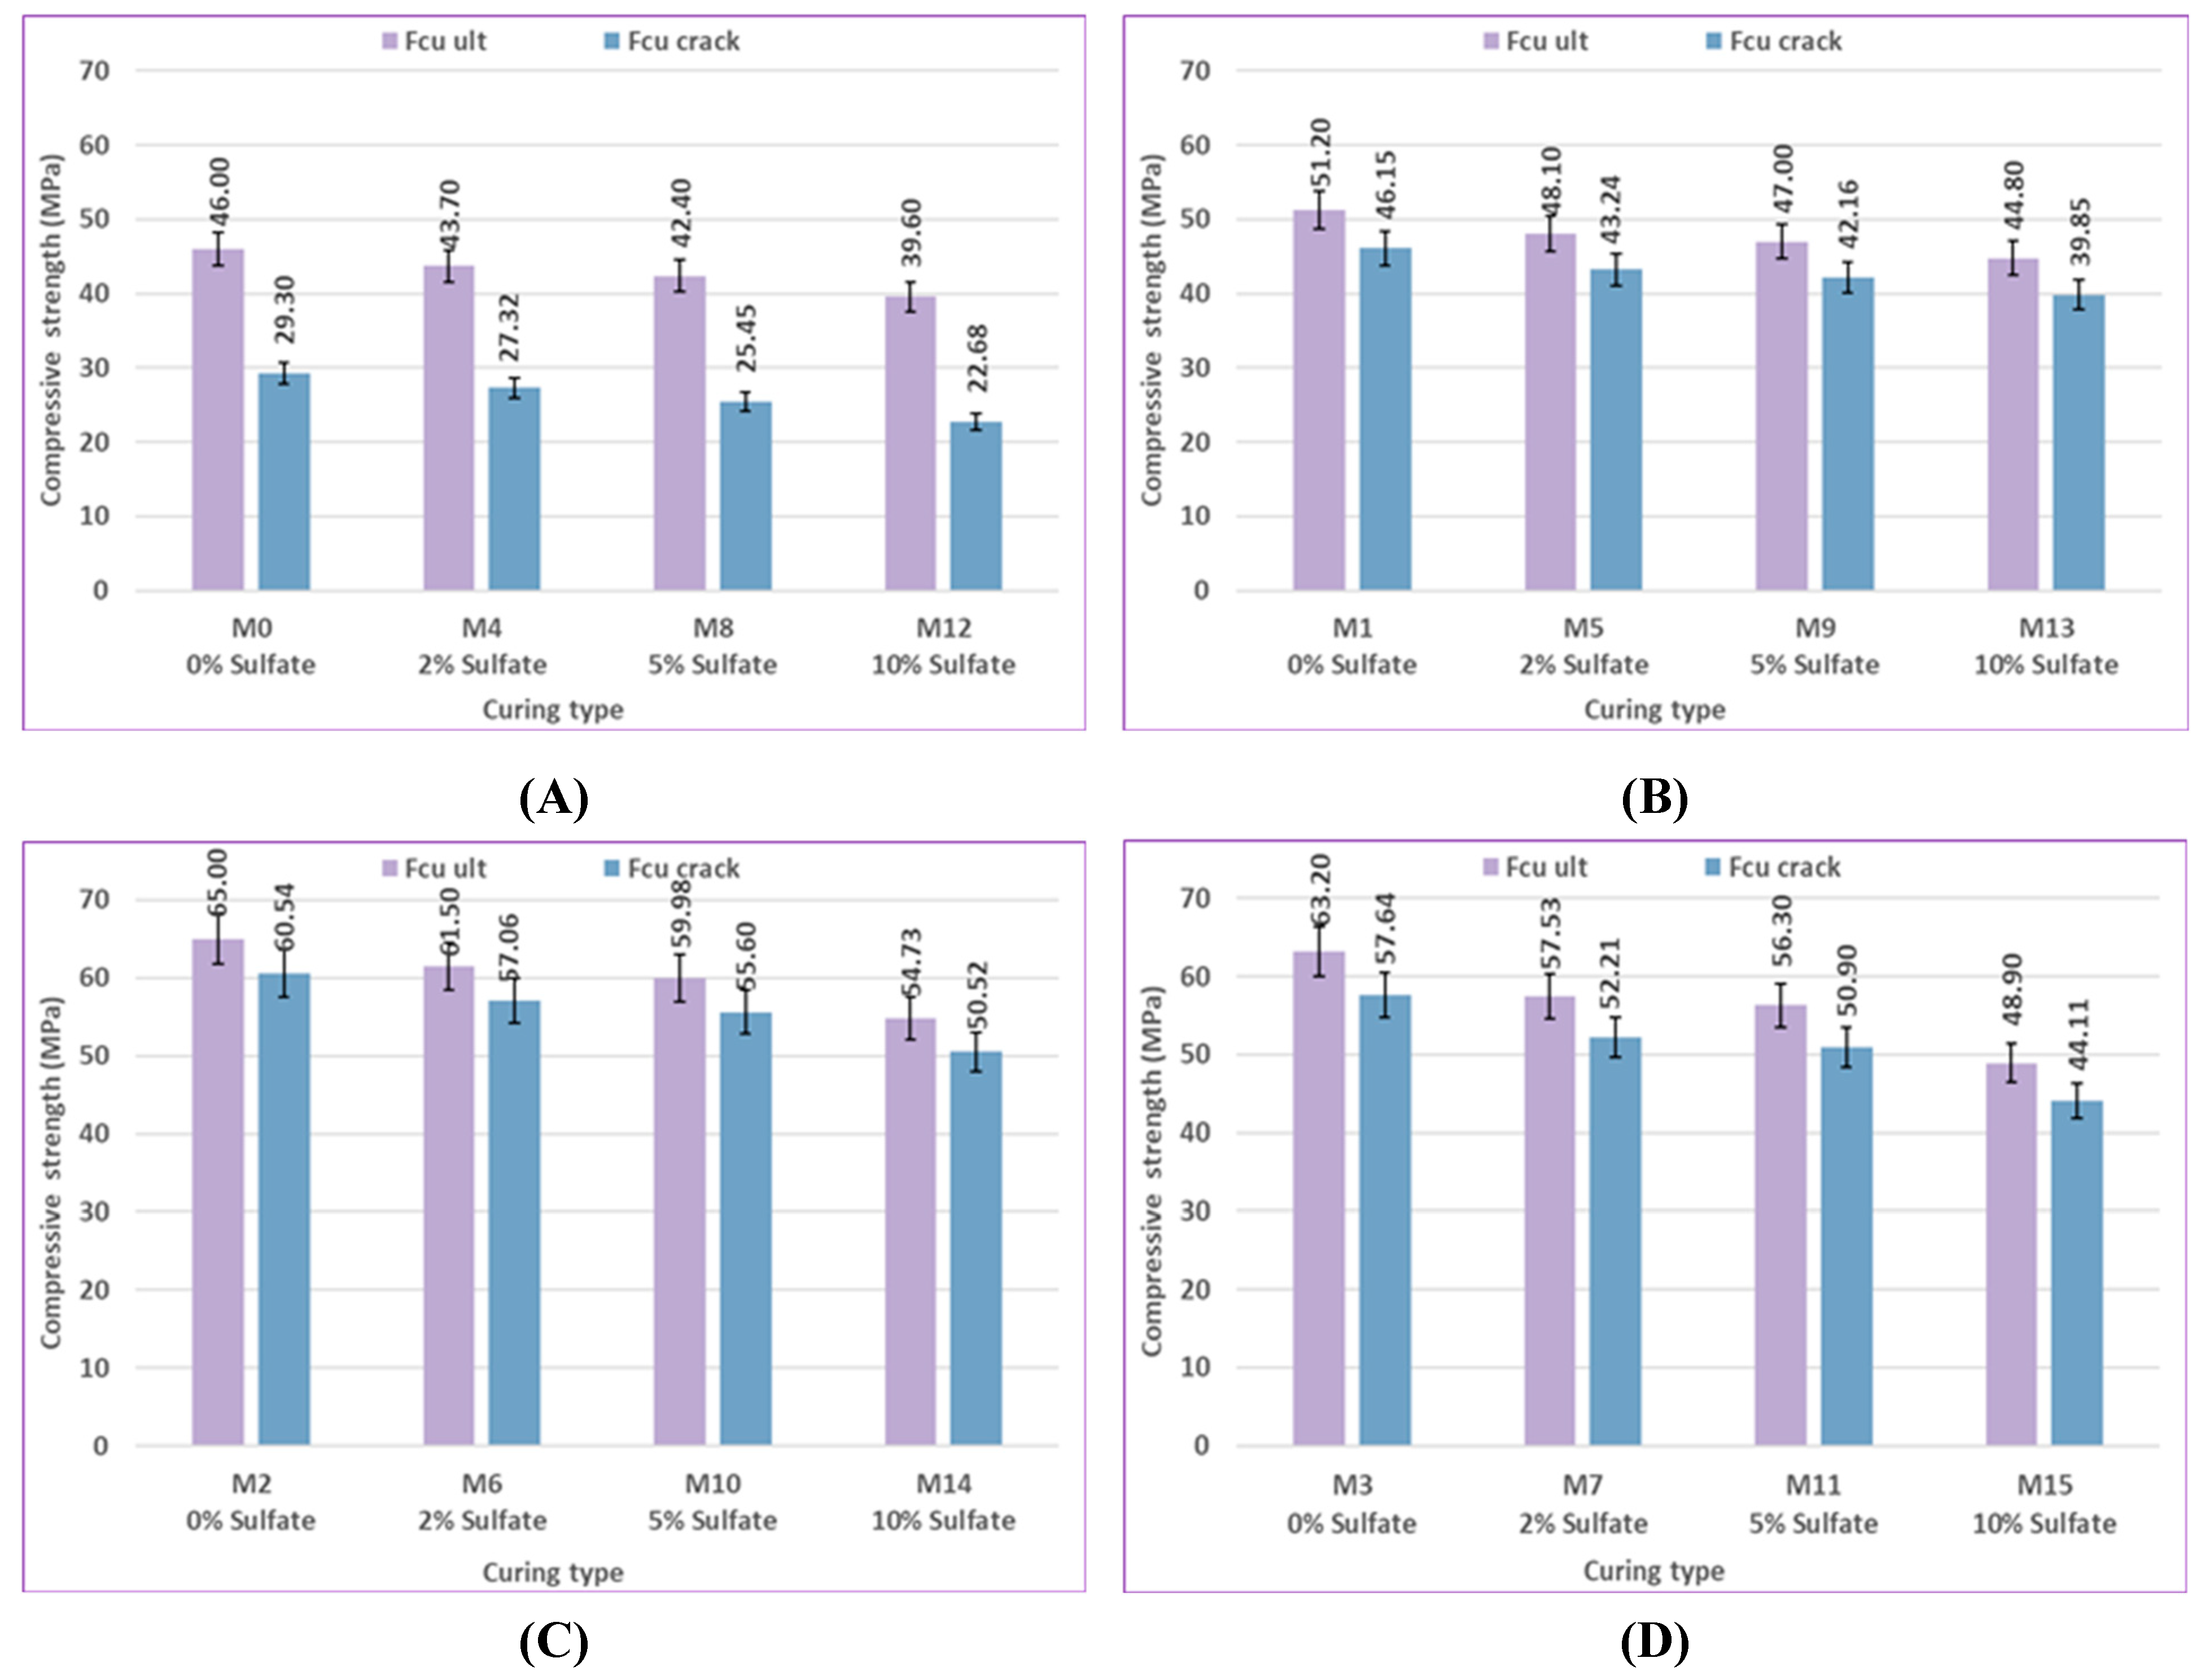
Figure 30.
Impact of curing type on concrete compressive strength for uncracked specimens and pre-cracked specimens for fly ash at 56 days: (A) at 0% bacteria, and (B) at 2.5% bacteria BM.
Figure 30.
Impact of curing type on concrete compressive strength for uncracked specimens and pre-cracked specimens for fly ash at 56 days: (A) at 0% bacteria, and (B) at 2.5% bacteria BM.

Figure 31.
Impact of curing type on concrete compressive strength for uncracked specimens and pre-cracked specimens for fly ash at 120 days: (A) at 0% bacteria, and (B) at 2.5% bacteria BM.
Figure 31.
Impact of curing type on concrete compressive strength for uncracked specimens and pre-cracked specimens for fly ash at 120 days: (A) at 0% bacteria, and (B) at 2.5% bacteria BM.
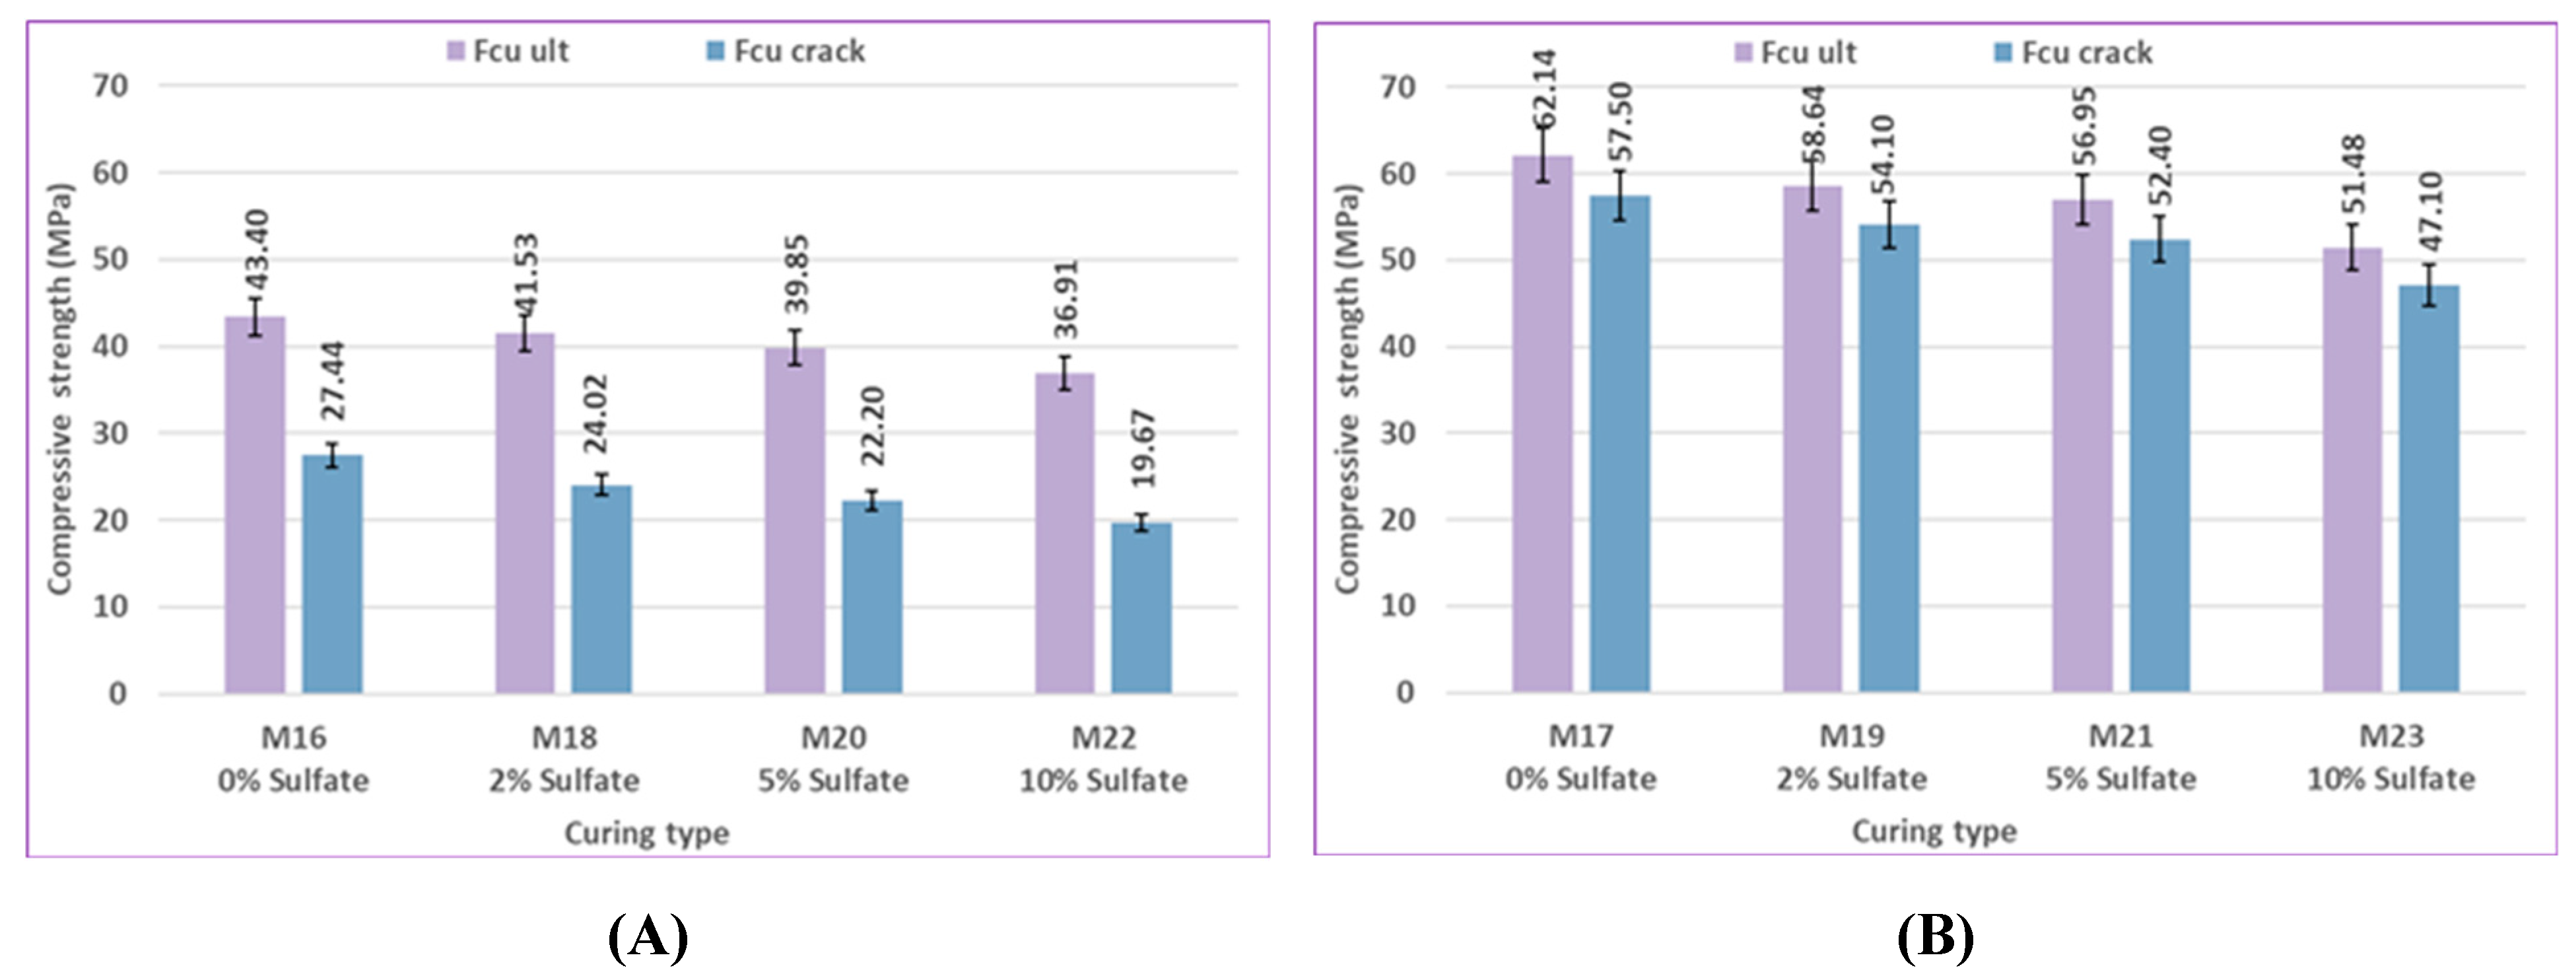
Figure 32.
SEM images (4000X) for (A)M0, (B)M2, (C)M3, (D)M8,(E)M10,(F)M11,(G)M16,(H)M17,(K)M21, and (L)M20.
Figure 32.
SEM images (4000X) for (A)M0, (B)M2, (C)M3, (D)M8,(E)M10,(F)M11,(G)M16,(H)M17,(K)M21, and (L)M20.
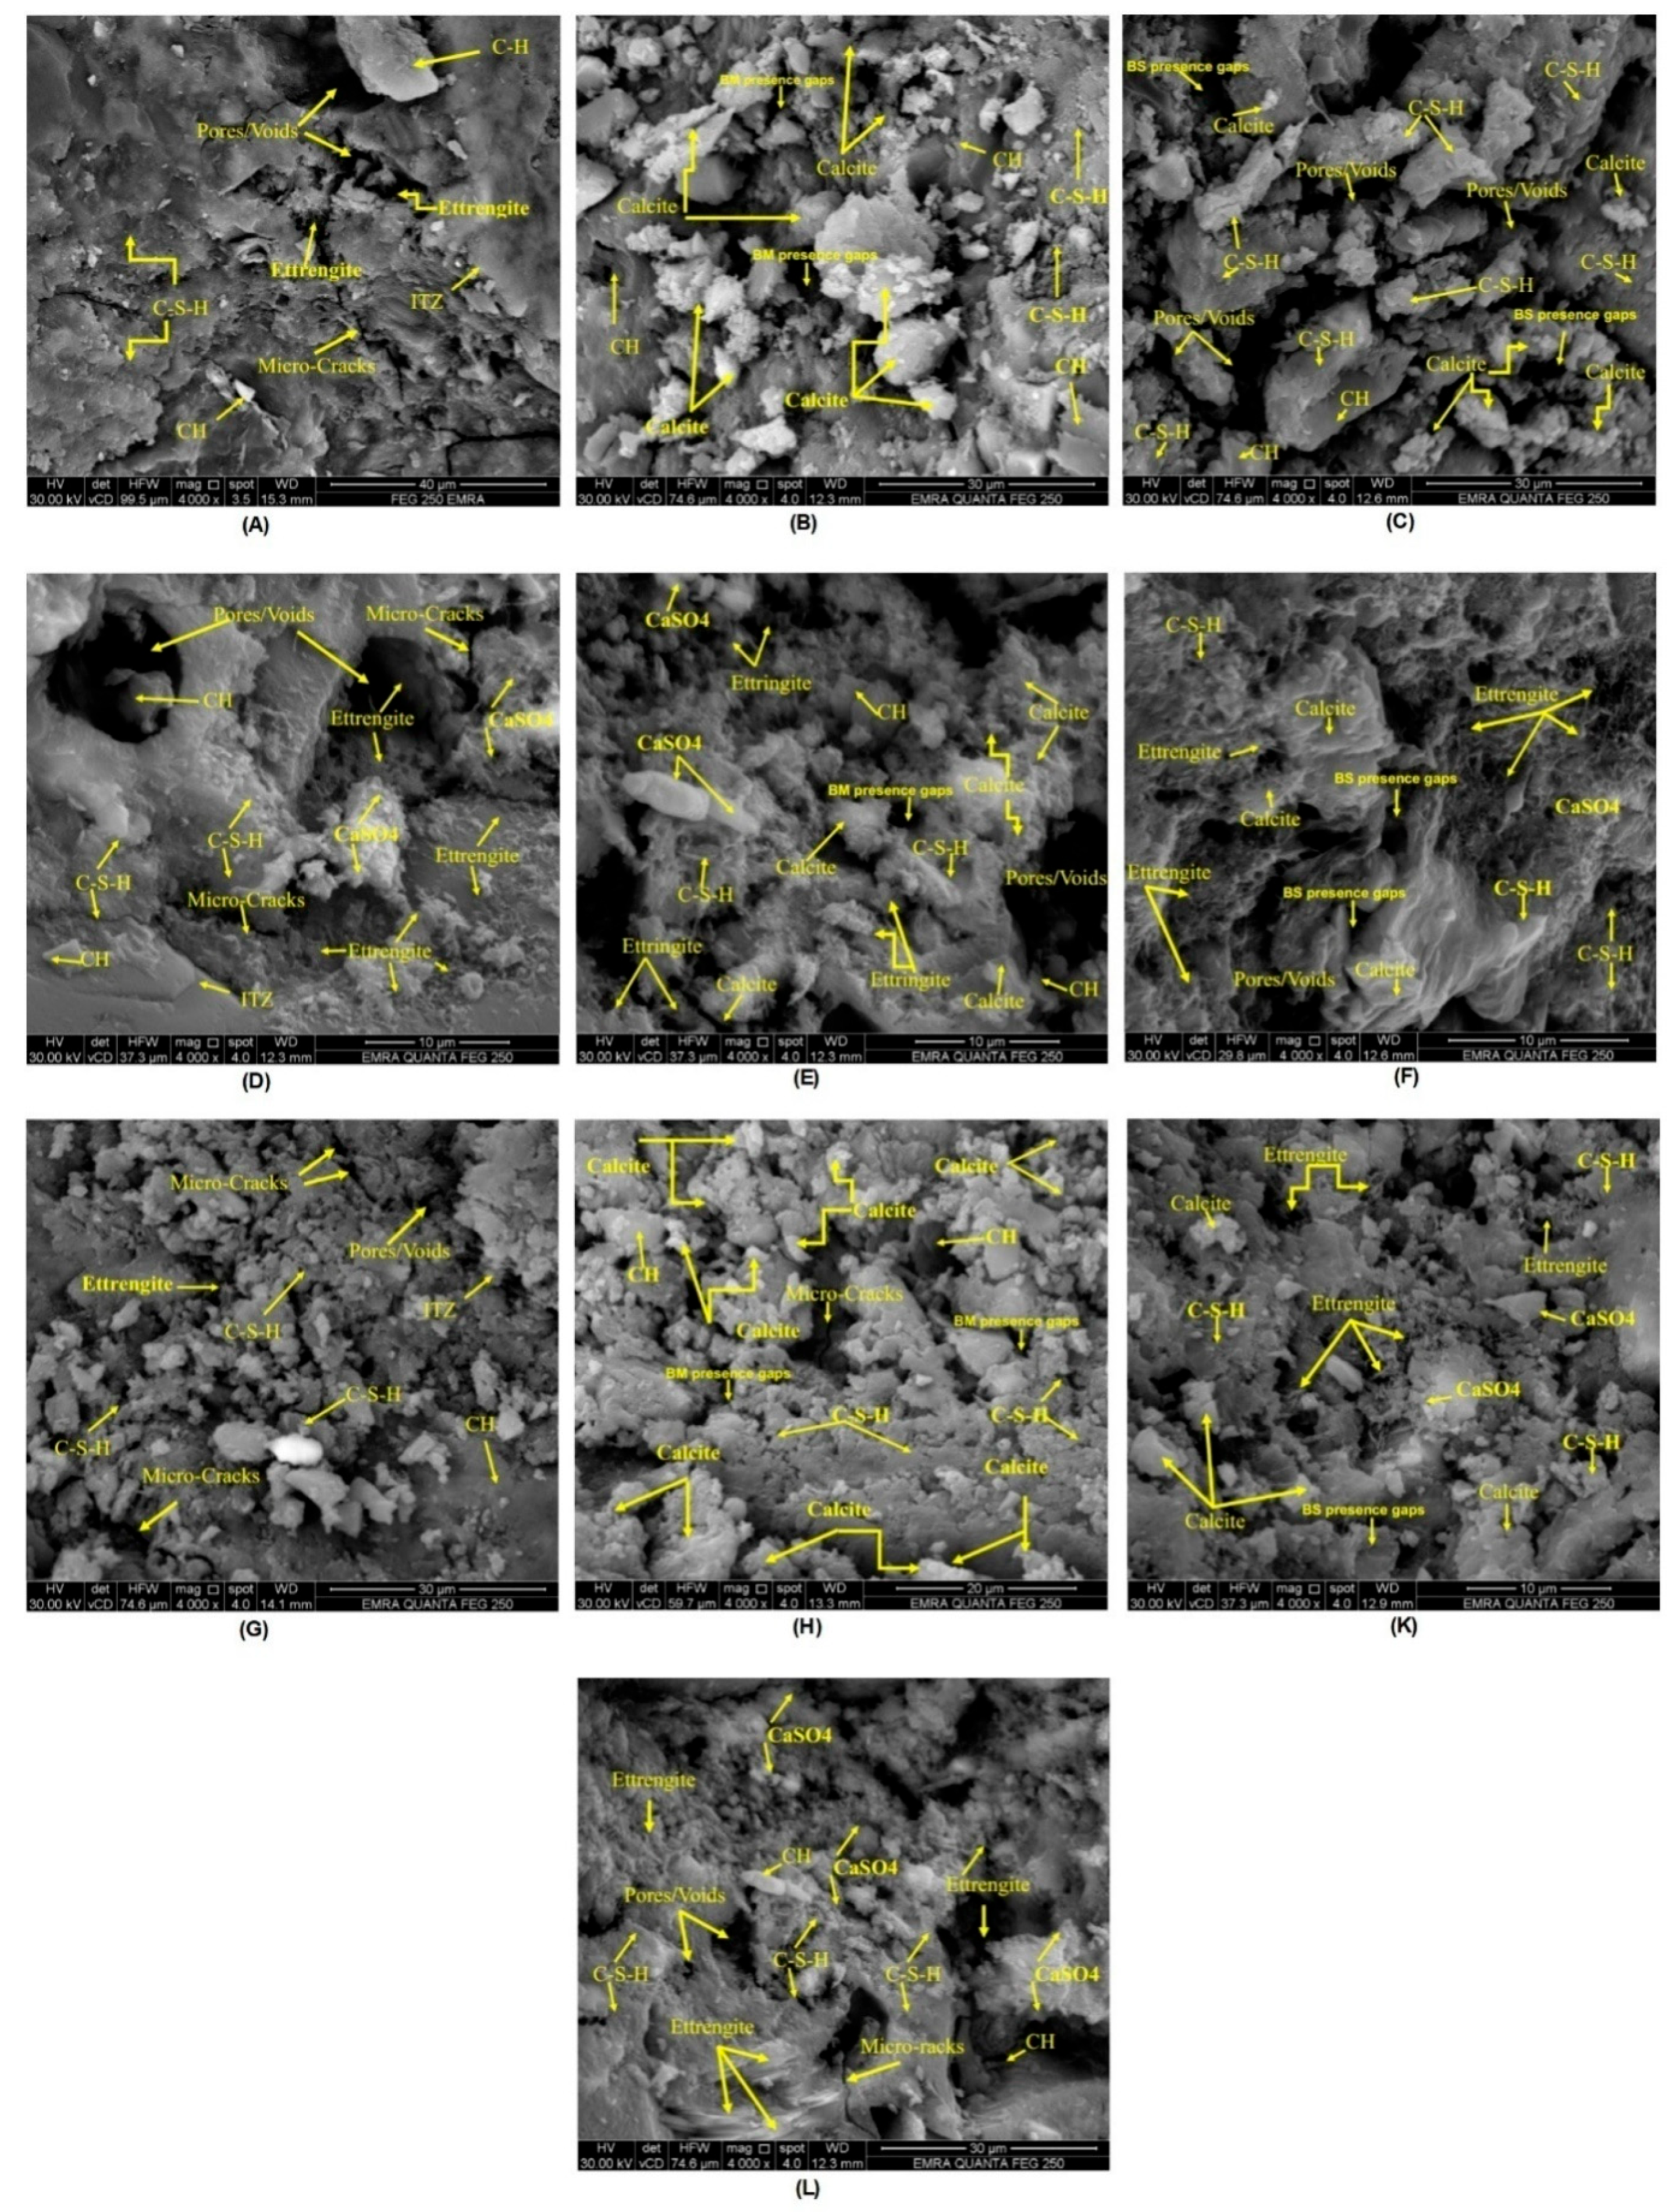
Figure 33.
SEM images (5000X) for (A)M0, (B)M2, (C)M3, (D)M8,(E)M10,(F)M11,(G)M16,(H)M17,(K)M21, and (L)M20.
Figure 33.
SEM images (5000X) for (A)M0, (B)M2, (C)M3, (D)M8,(E)M10,(F)M11,(G)M16,(H)M17,(K)M21, and (L)M20.
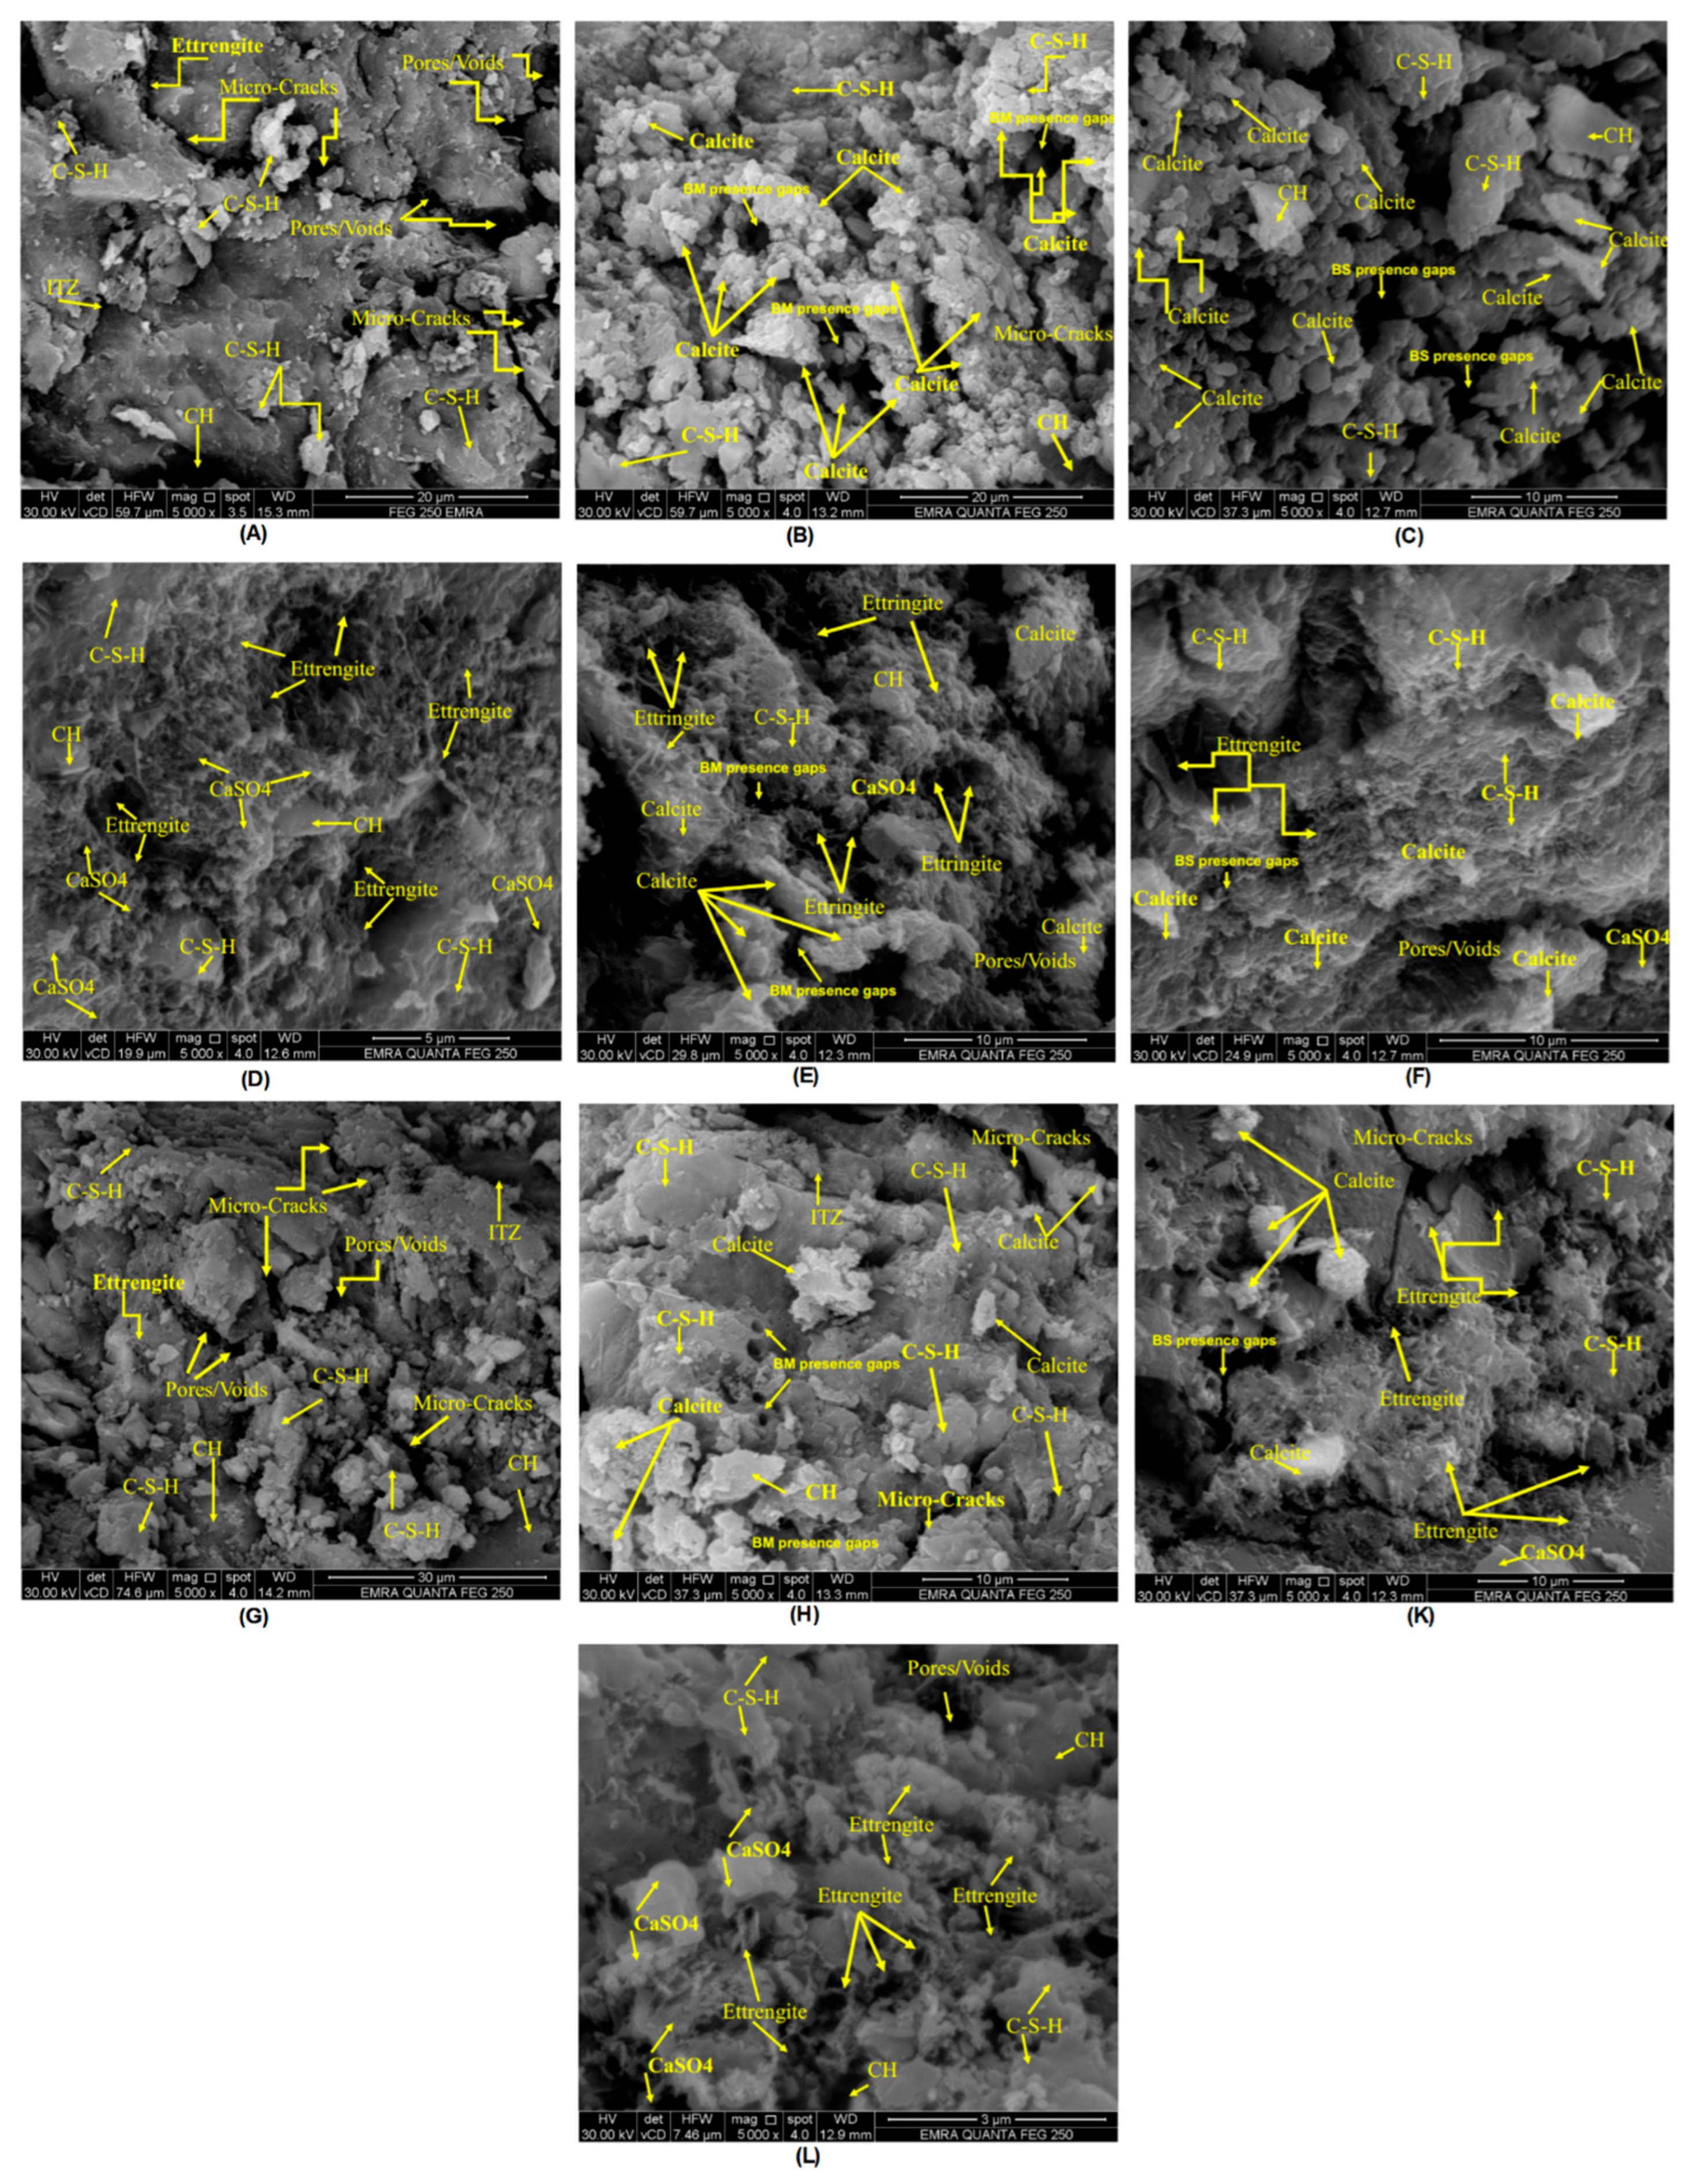
Figure 34.
EDS Spectra at 120 days for(A)M0, (B) M2, (C) M3, (D) M8, (E) M10, (F) M11, (G) M16, (H) M17, (K) M21, and (L) M20.
Figure 34.
EDS Spectra at 120 days for(A)M0, (B) M2, (C) M3, (D) M8, (E) M10, (F) M11, (G) M16, (H) M17, (K) M21, and (L) M20.
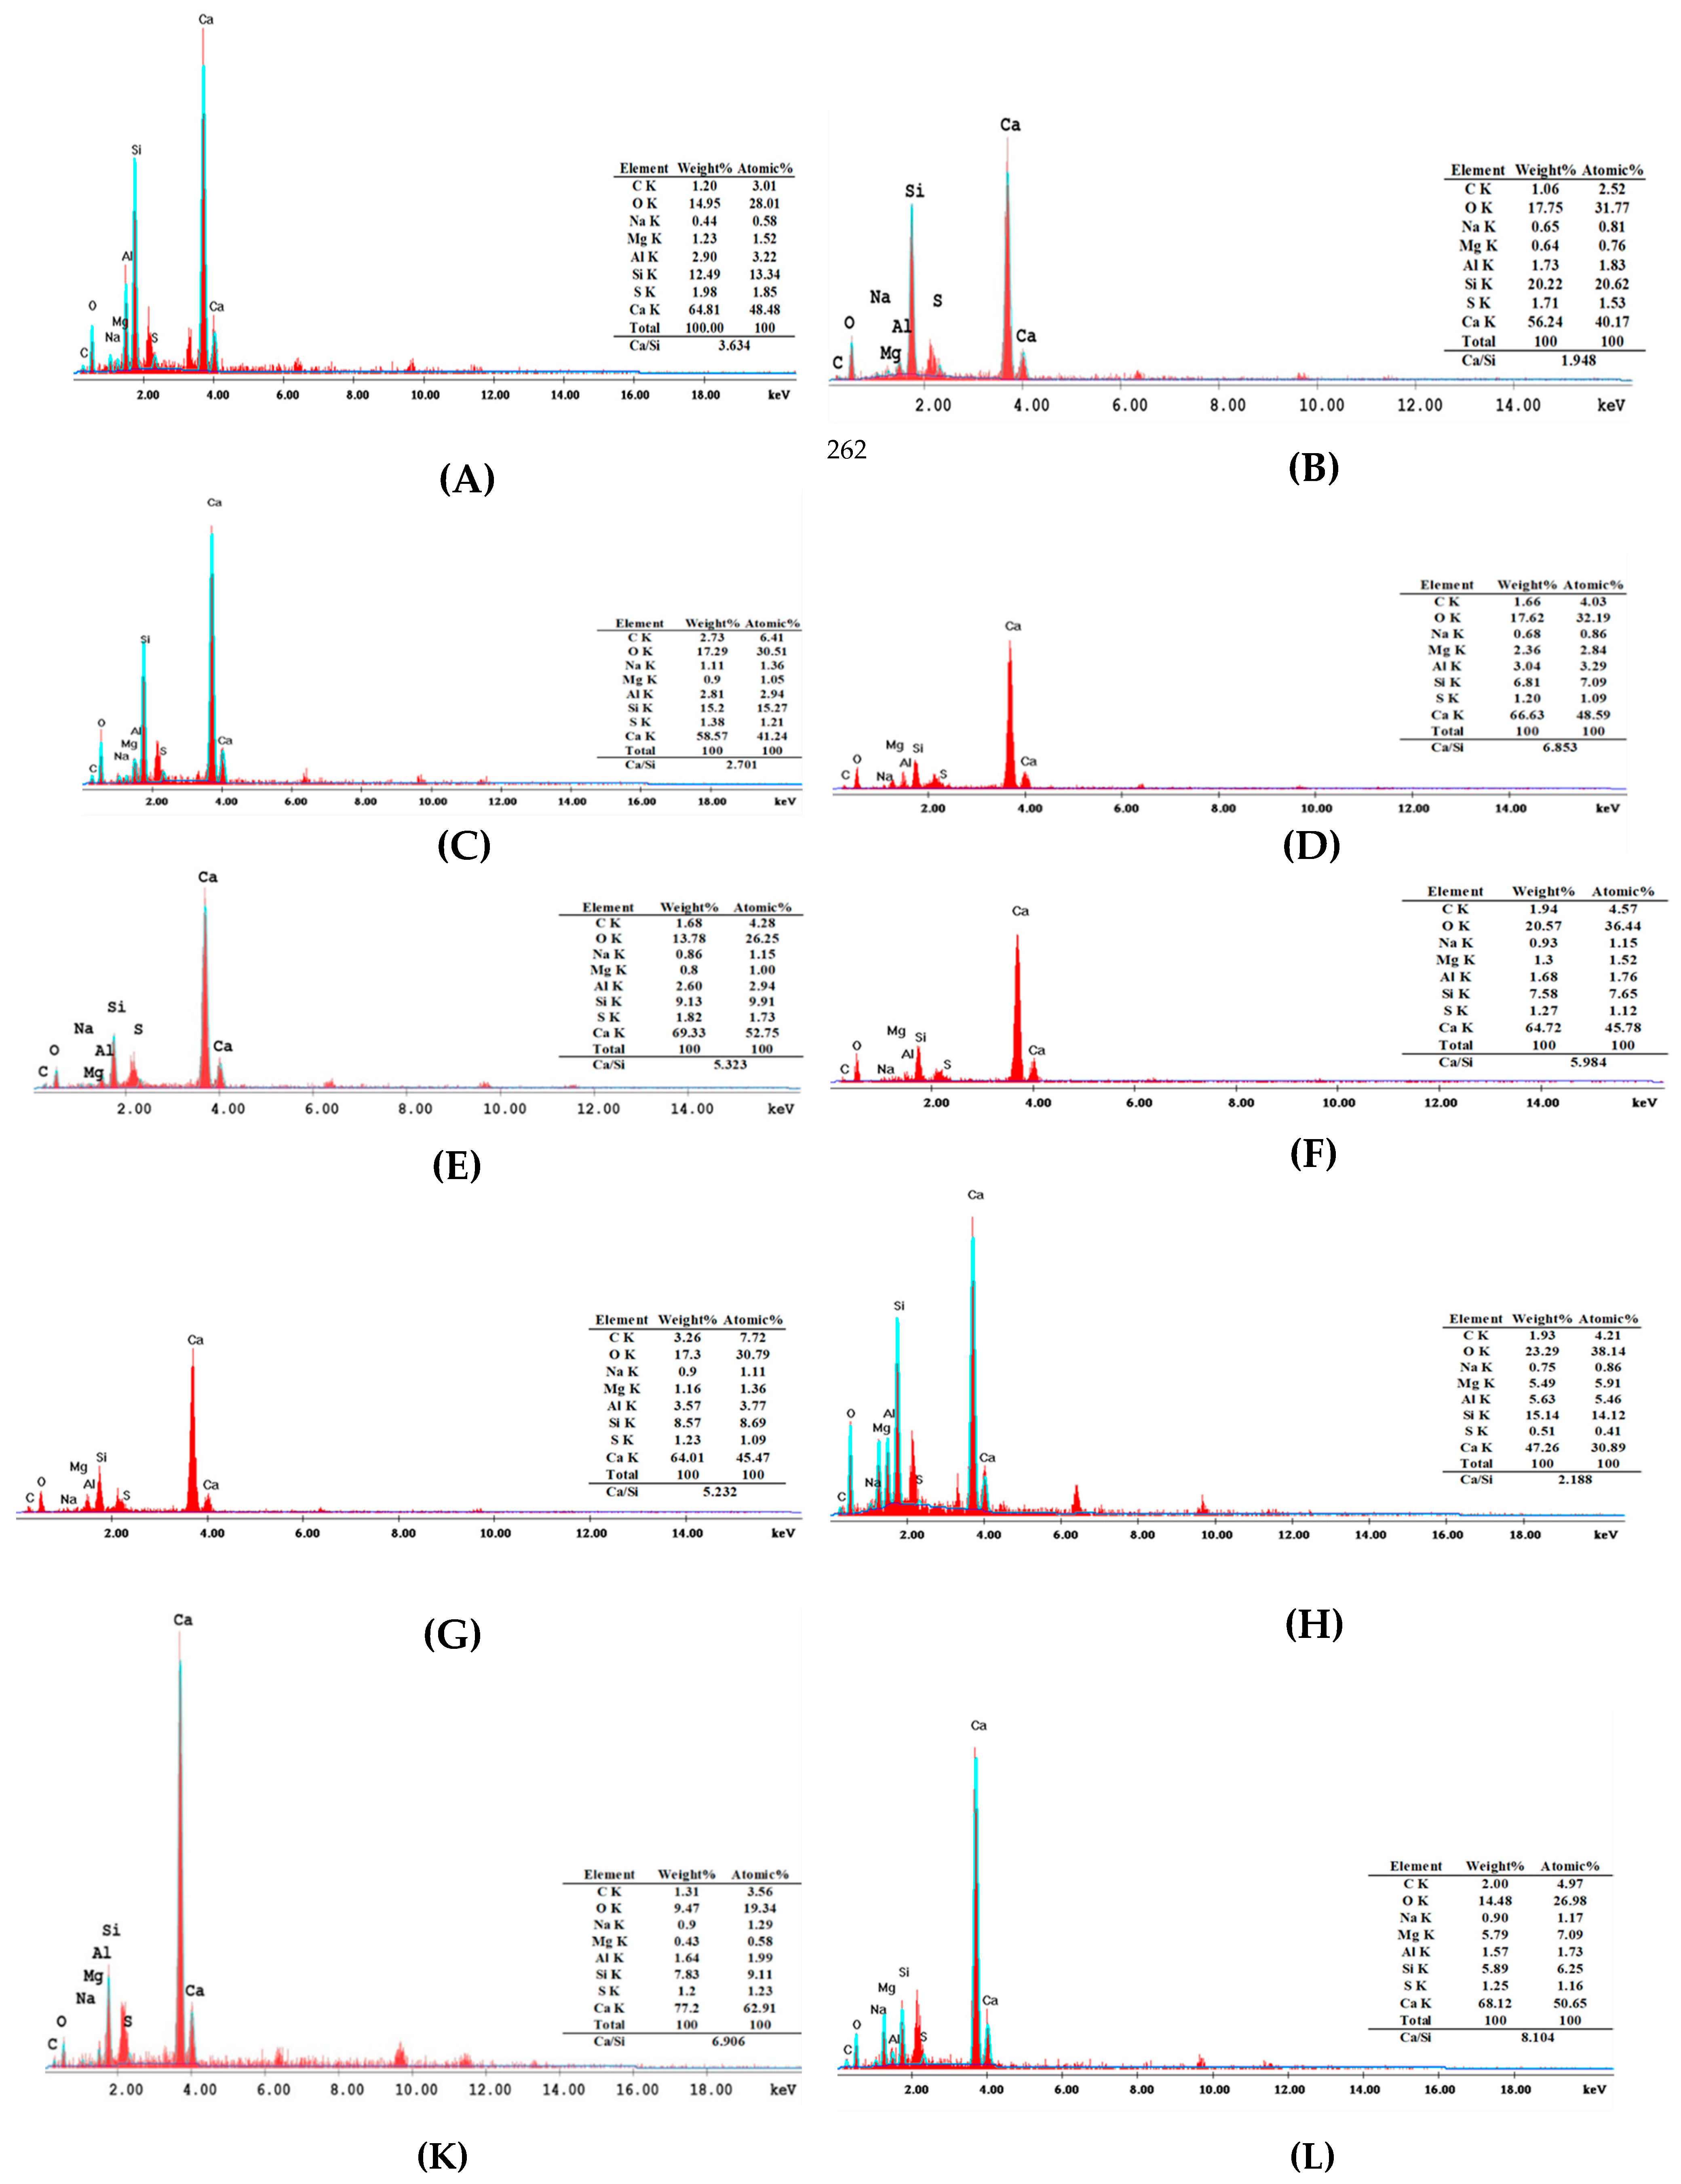
Figure 35.
X-ray diffraction analysis for (A) M0, (B) M2, (C) M3, (D) M8, (E) M10, (F) M11, (G) M16, (H) M17, (K) M21, and (L) M20.
Figure 35.
X-ray diffraction analysis for (A) M0, (B) M2, (C) M3, (D) M8, (E) M10, (F) M11, (G) M16, (H) M17, (K) M21, and (L) M20.
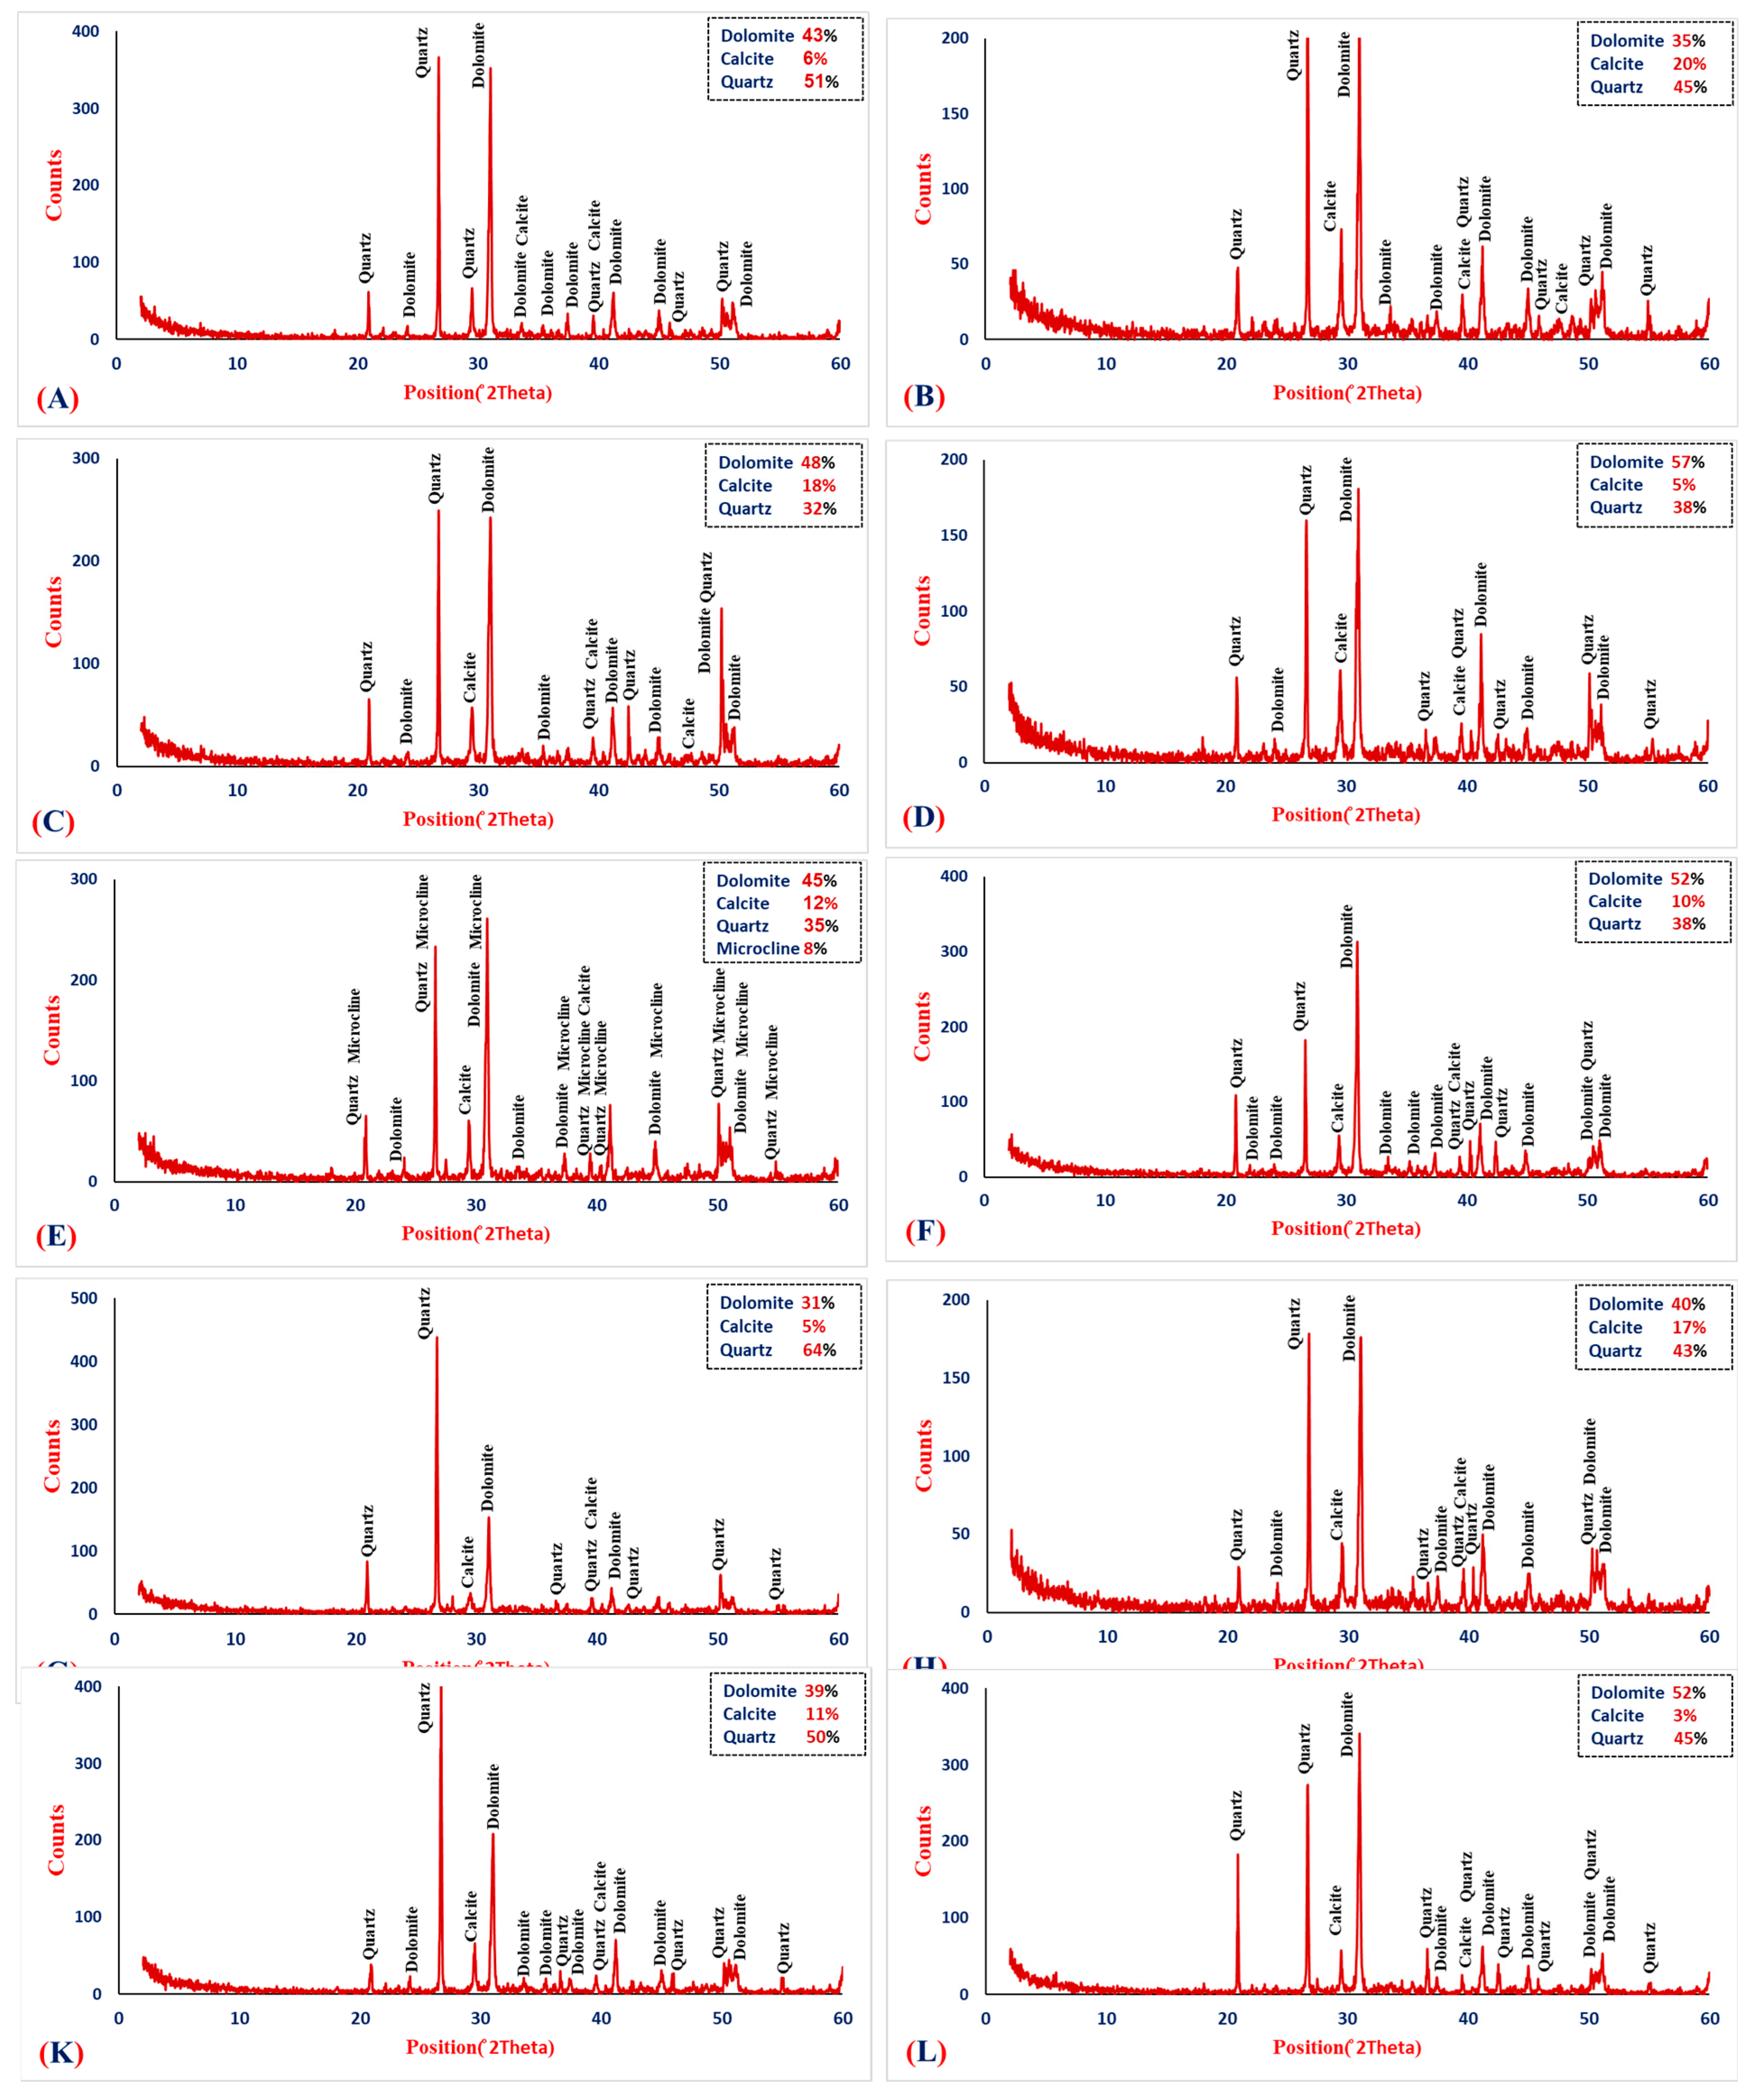
Figure 36.
The effect of bacteria (BM and BS)on crack healing progress under different environmental conditions.
Figure 36.
The effect of bacteria (BM and BS)on crack healing progress under different environmental conditions.
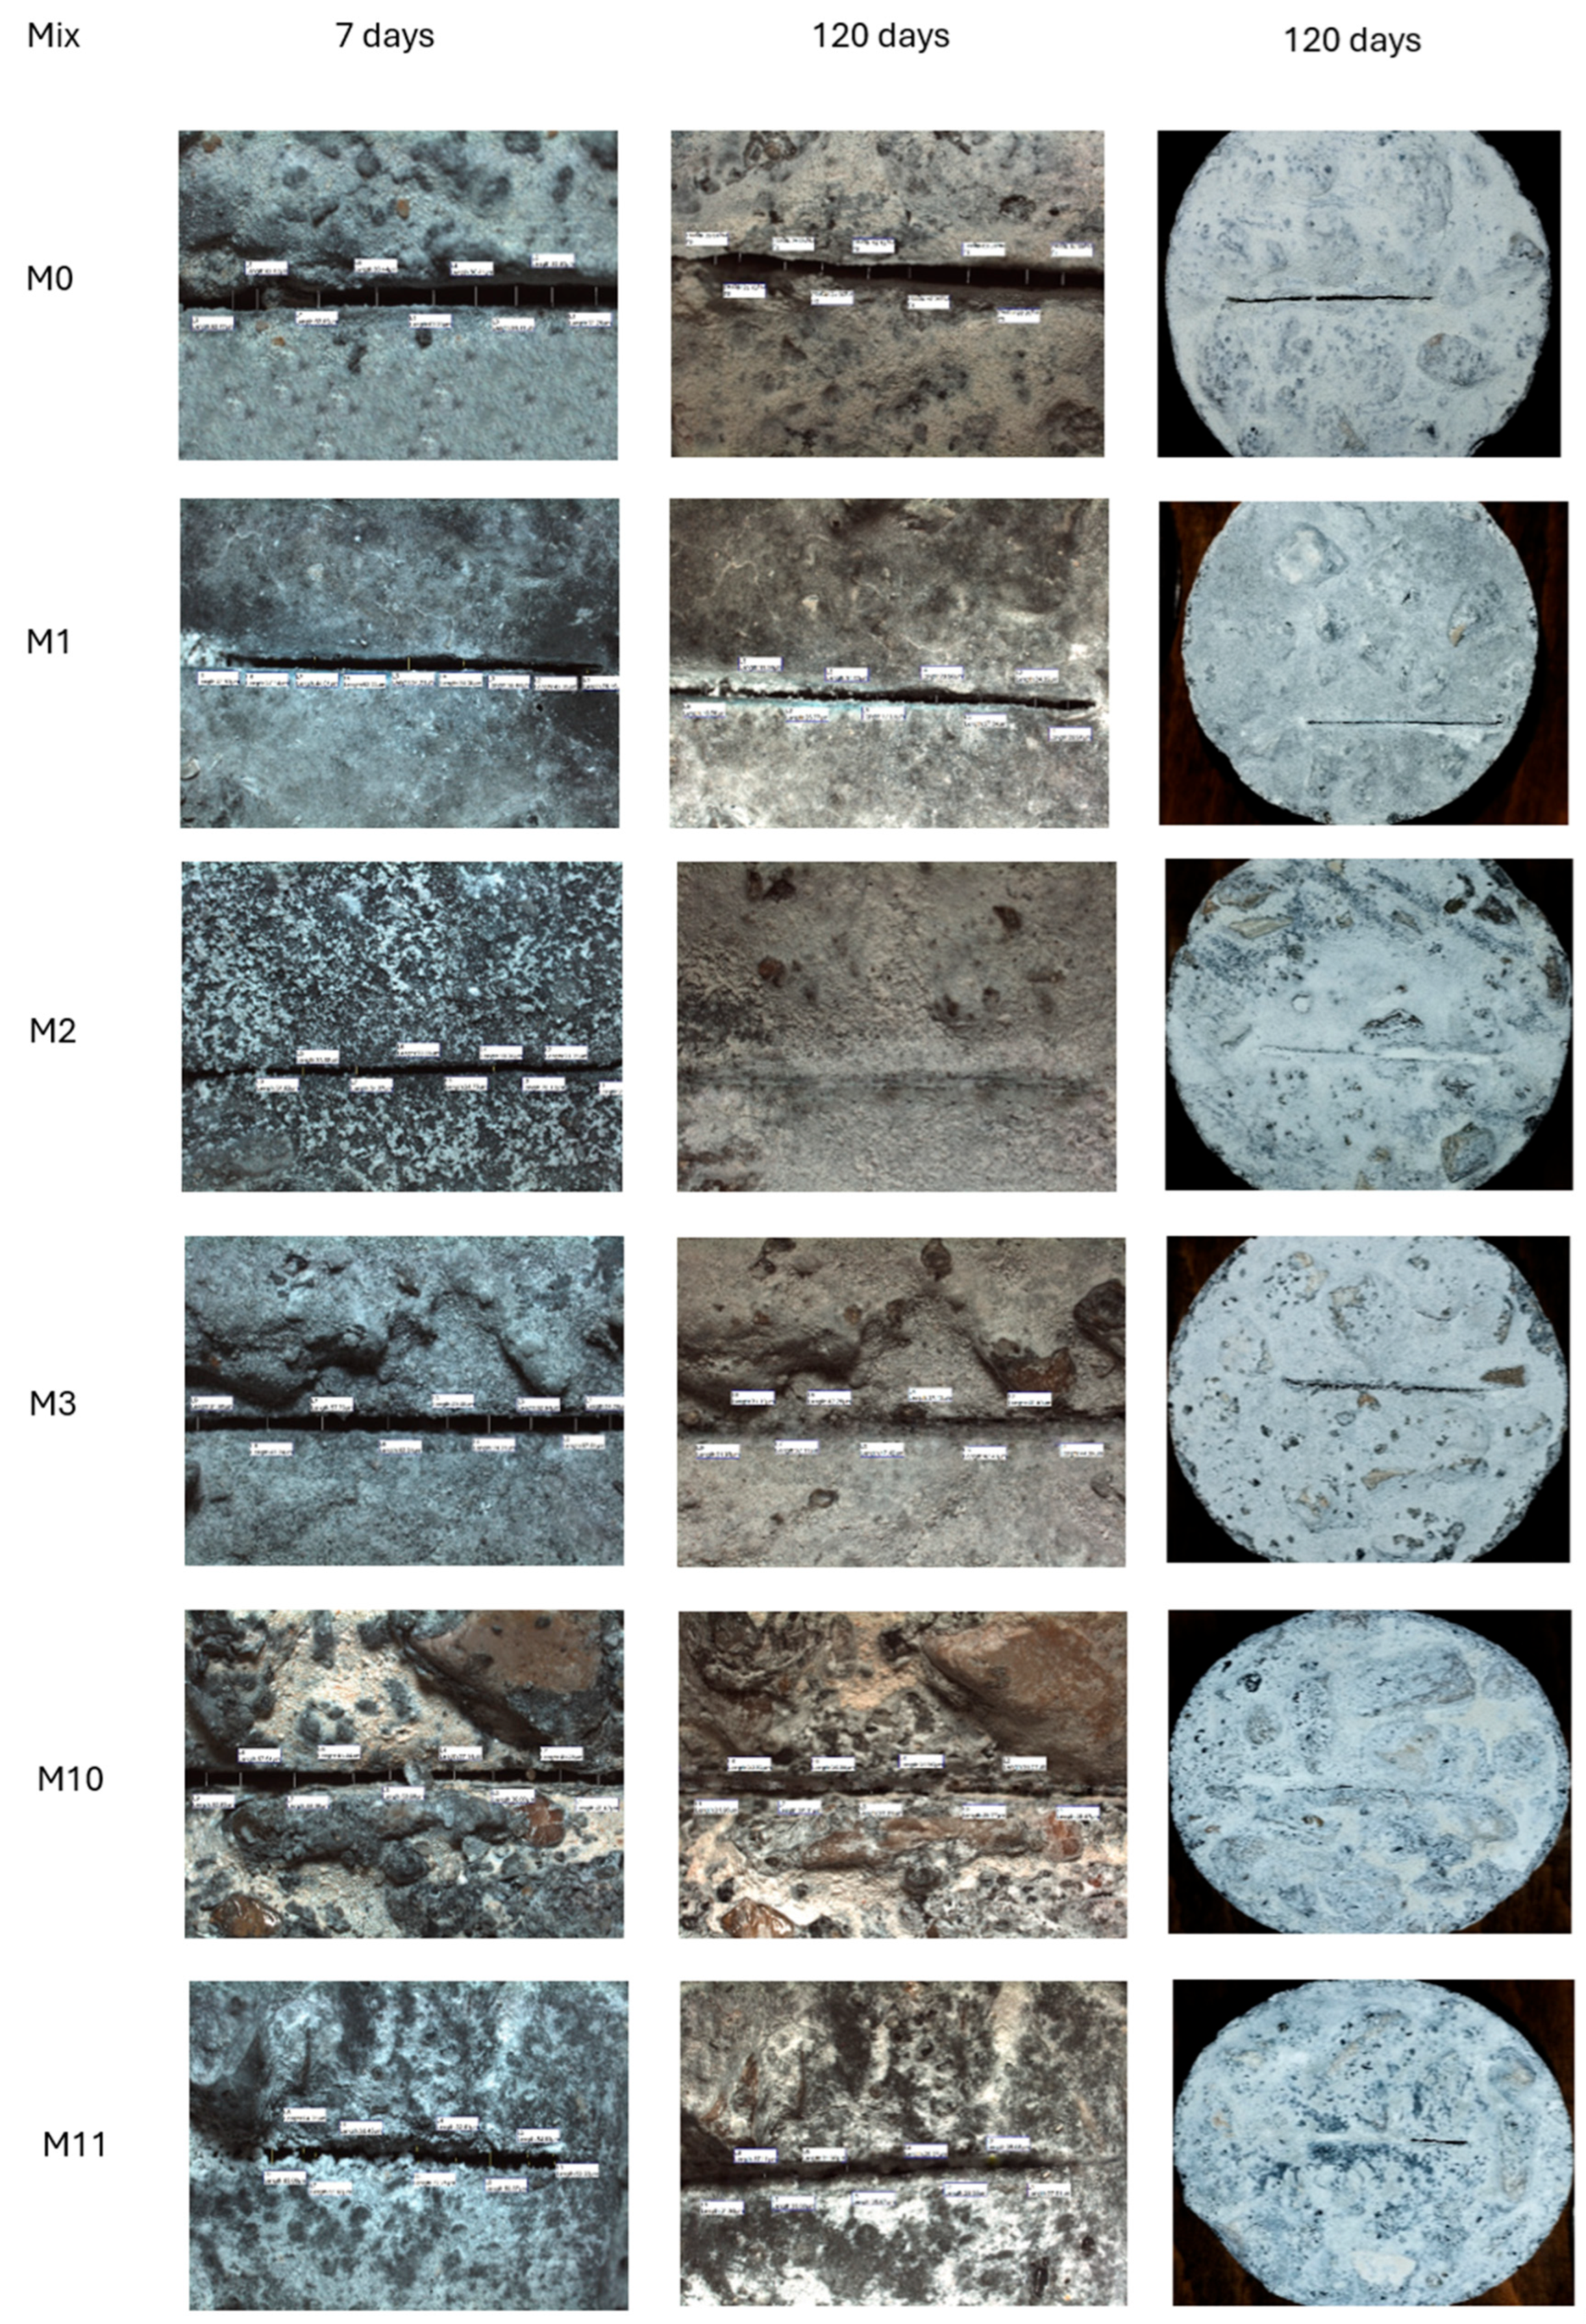
Table 6.
The proportions of the concrete mixes.
| Mix | Types of bacteria | Bacteria/cement(%) | Nutrient/cement(%) | ||||||
|---|---|---|---|---|---|---|---|---|---|
| M0 | - | 0.0% | 0.00% | 0 | 0 | 40 | - | 618 | 1236 |
| M1 | BM | 1.0% | 0.50% | 4 | 2 | 40 | - | 618 | 1236 |
| M2 | BM | 2.5% | 0.50% | 10 | 2 | 40 | - | 618 | 1236 |
| M3 | BS | 2.5% | 0.50% | 10 | 2 | 40 | - | 618 | 1236 |
| M4 | - | 0.0% | 0.00% | 0 | 0 | 40 | - | 618 | 1236 |
| M5 | BM | 1.0% | 0.50% | 4 | 2 | 40 | - | 618 | 1236 |
| M6 | BM | 2.5% | 0.50% | 10 | 2 | 40 | - | 618 | 1236 |
| M7 | BS | 2.5% | 0.50% | 10 | 2 | 40 | - | 618 | 1236 |
| M8 | - | 0.0% | 0.00% | 0 | 0 | 40 | - | 618 | 1236 |
| M9 | BM | 1.0% | 0.50% | 4 | 2 | 40 | - | 618 | 1236 |
| M10 | BM | 2.5% | 0.50% | 10 | 2 | 40 | - | 618 | 1236 |
| M11 | BS | 2.5% | 0.50% | 10 | 2 | 40 | - | 618 | 1236 |
| M12 | - | 0.0% | 0.00% | 0 | 0 | 40 | - | 618 | 1236 |
| M13 | BM | 1.0% | 0.50% | 4 | 2 | 40 | - | 618 | 1236 |
| M14 | BM | 2.5% | 0.50% | 10 | 2 | 40 | - | 618 | 1236 |
| M15 | BS | 2.5% | 0.50% | 10 | 2 | 40 | - | 618 | 1236 |
| M16 | - | 0.0% | 0.00% | 0 | 0 | - | 40 | 618 | 1236 |
| M17 | BM | 2.5% | 0.50% | 10 | 2 | - | 40 | 618 | 1236 |
| M18 | - | 0.0% | 0.00% | 0 | 0 | - | 40 | 618 | 1236 |
| M19 | BM | 2.5% | 0.50% | 10 | 2 | - | 40 | 618 | 1236 |
| M20 | - | 0.0% | 0.00% | 0 | 0 | - | 40 | 618 | 1236 |
| M21 | BM | 2.5% | 0.50% | 10 | 2 | - | 40 | 618 | 1236 |
| M22 | - | 0.0% | 0.00% | 0 | 0 | - | 40 | 618 | 1236 |
| M23 | BM | 2.5% | 0.50% | 10 | 2 | - | 40 | 618 | 1236 |
Table 5.
Types of bacteria used.
| Type | Name | Code | Designations | Form |
|---|---|---|---|---|
| 1 | Bacillus Sphaericus (BS) |
EMCC 1253. | DSM 396 – NCTC 9602. |
Solution |
| 2 | Bacillus Megaterium (BM) | ATCC 14581 | BCRC 10608 – CCM 2007 – CCUG 1817 – CIP 66.20 – DSM 32. | Solution |
Table 7.
Crack healing efficiency at 120 days.
| Mix | Average healing % | ||
|---|---|---|---|
| 7 Days | 120 Days | 120 Days | |
| M0 | 86.73 | 30.96 | 64.30 |
| M1 | 79.56 | 21.33 | 73.19 |
| M2 | 54.05 | 0 | 100 |
| M3 | 98.67 | 15.46 | 84.33 |
| M10 | 95.29 | 9.5 | 90.03 |
| M11 | 82.14 | 16.42 | 80 |
Disclaimer/Publisher’s Note: The statements, opinions and data contained in all publications are solely those of the individual author(s) and contributor(s) and not of MDPI and/or the editor(s). MDPI and/or the editor(s) disclaim responsibility for any injury to people or property resulting from any ideas, methods, instructions or products referred to in the content. |
© 2025 by the authors. Licensee MDPI, Basel, Switzerland. This article is an open access article distributed under the terms and conditions of the Creative Commons Attribution (CC BY) license (http://creativecommons.org/licenses/by/4.0/).
Copyright: This open access article is published under a Creative Commons CC BY 4.0 license, which permit the free download, distribution, and reuse, provided that the author and preprint are cited in any reuse.


