
Submitted:
13 June 2025
Posted:
17 June 2025
You are already at the latest version
Abstract
Renewable Energy Communities (RECs) have significant potential for the energy transition. Since RECs rely on citizen participation, their success heavily depends on the level of engagement among citizens. However, if users are not provided with transparent and accurate information, they may abandon the project when outcomes fail to align with unrealistic expectations. To address this challenge, this paper presents a thorough comparative study which identifies recommendations and actionable guidance, providing crucial information to prevent failures. We compared scenarios defined by fixed energy allocation parameters, based on installation costs and number of participants, and variable ones which consider user patterns, economic agreements, and allocation criteria. This approach enabled a comprehensive analysis of how different characteristics affect key outcomes, such as payback difference and surplus. To ensure the scenarios were realistic, the building blocks were obtained using clustering techniques on a real dataset of residential users. This allowed us to simulate 240 scenarios of different REC configurations. The methodology is designed for applicability in countries where RECs are governed by energy allocation coefficients, such as Spain and France. This paper aims to highlight both the limitations and the best possible outcomes, setting clear expectations and helping to curb the spread of disinformation, thereby facilitating RECs’ decision-making.
Keywords:
Renewable Energy Communities
; solar energy
; optimisation
; Genetic Algorithm
1. Introduction
The United Nations Sustainable Development Goals (SDGs) represent the most significant global agreement on what a desirable future looks like. These goals capture the priorities which have been agreed upon as a horizon. They include: “ensuring access to affordable, secure, sustainable and modern energy for all" (Goal 7), “making cities inclusive, safe, resilient and sustainable" (Goal 11) and “taking urgent action to combat climate change and its impacts" [1].
Renewable Energy Communities (REC) represent the involvement of a collective in the power system through distributed renewable energy generation facilities placed near end-users [2]. These communities empower individuals through the innovative concept of co-ownership of energy sources, resulting in simultaneous environmental and economic benefits [3]. The environmental advantages derive from a substantial impact on the decarbonization of the power system. And, regarding economic benefits, they manifest in direct financial returns for participating members. Thus fostering a mutually beneficial relationship between citizens and sustainable energy solutions. In addition, the decentralised model helps to avoid transmission losses and decongests the transmission network.
To maximise energy generation, given the high heterogeneity of daily electricity consumption patterns, collaborative efforts in sharing schemes become crucial [4]. Minelli et al. [5] analysed the importance of energy sharing dynamics by studying the exchange between two buildings with shifted load schedules. On the other hand, Luzzati et al. [6] highlighted that the success of RECs depends on how well aligned participants’ loads and energy production are. This spirit of collaboration not only enables better capitalisation of the energy generation but also enhances consumer empowerment, fortifies energy sovereignty, alleviates energy poverty and injects vitality into the local economy [7]. Last but not least, RECs have the potential to foster energy independence at the national level and enhance city sustainability [8].
However, it is not that easy; the intricate interplay of stochastic consumer behaviour, intermittent photovoltaic (PV) energy generation and fluctuating electricity prices require well-defined policy frameworks to fully unlock the anticipated benefits of energy sharing [9]. Historically, RECs faced a legal void within European Union (EU) legislation, but recent regulatory enhancements have filled this gap, propelling the widespread adoption of RECs across Europe [4]. The current EU legal framework now presents a distinct opportunity for collective prosumers, as it explicitly defines energy communities in the Clean Energy Package. At the same time, the Renewable Energy Directive 2018/2001 outlines the REC framework [3].
However, despite these significant advances in EU regulation, RECs continue to face obstacles. To fully realise the benefits of RECs, the entire field must be prepared. It’s not just a matter of creating new legislation. For example, pricing policies are key factors for the profitability of RECs [8]. Nowadays, the most common obstacles include bureaucratic barriers, a lack of clear, quantifiable benefits for participants, and a lack of comprehensive analyses that consider all possible options for establishing a REC. Tackling these gaps is a strategic imperative for realising community goals and ensuring the widespread success of RECs. For RECs to develop correctly, all variables must be considered holistically [10].
At the same time, although there is an abundance of literature presenting novel technical tools to implement energy trading models, most do so in the context of Peer-to-Peer (P2P) in online markets [11,12], whose practical application faces formidable regulatory hurdles. For example, in the case of Spain, real-time updating of energy allocation procedures or peer-to-peer (P2P) transactions is far from being possible under the current legal framework. These studies are vital for academic progress. However, it is essential to recognise that guiding citizens within the existing regulatory framework is also fundamental. Today, people are disoriented due to the influx of misinformation exacerbated by greenwashing practices that mislead them about environmental benefits [13]. Against this backdrop of complexities, there is a dire need for clarity.
In a seminal study, we introduced a tool utilising Genetic Algorithms (GAs) to optimise the allocation of solar energy generated within RECs [14]. This pioneering tool has undergone rigorous experimental validation, demonstrating its effectiveness in solar electricity installations and enhancing the experience for residential consumers. The study showed impressive results, including low solar energy surplus, high self-consumption rates, and decreased emissions, which contributed to favourable payback periods for all participants. Although this initial study provided a strong proof of concept, a more comprehensive investigation is necessary to explore the full potential and limitations of optimised energy allocation coefficients, especially considering the study’s limited scope, which involved only seven specific residential users.
To contribute to clarity and ease RECs’ decision-making, we present an in-depth comparative analysis in this study. The analysis considers a large number of different possible scenarios, with variations in consumption typology, economic agreements, and energy allocation procedures (both using optimal dynamic coefficients, as presented in our seminal study, and simpler static coefficients). In this way, this paper contributes to a better understanding, highlighting both the limitations and the best possible outcomes in each scenario, thereby setting clear expectations and curbing the spread of disinformation.
RECs have emerged as an innovative and cooperative strategy to facilitate the sharing of renewable energy among participants [15,16], contributing to climate change mitigation efforts, and fostering a sense of community spirit [17,18]. Also, RECs aim to reduce energy consumption from non-renewable sources, optimise grid loading, and leverage the energy flexibility of active consumers [19]. We assert that RECs can serve as potent agents for the energy transition, provided that they are accompanied by advice and appropriate pricing policies [20]. In this sense, a comprehensive analysis covering various scenarios is essential to fully exploit their potential. Therefore, to fully explore the multifaceted nature of RECs, we advocate for a thorough comparative study that covers a wide and extensive range of situations, examining both the possibilities and challenges of this new energy approach.
The significance of equipping energy communities with appropriate tools and guidance cannot be overstated. While a myriad of methods exist to establish and manage energy communities and distribute resources, a thorough examination of these options is imperative. This analysis ensures that RECs effectively carry out their pivotal role as catalysts in the ongoing energy transition. The outcomes of such assessments can then be furnished to decision-makers, enabling them to navigate through various scenarios and, ultimately, empower citizens.
Our primary objective is to thoroughly compare various types of RECs, utilising different energy allocation models, to provide clarity amidst the complexity of the field. This is especially crucial in today’s landscape, marked by diverse interests and an overflow of information often clouded by greenwashing practices.
The methodology presented in this paper is developed from a prosumer-driven perspective, providing vital information for consumers eager to create a REC.
1.1. A Priori Regulation
Since there is no standard regulation and each country defines their specific technical implementation, we will focus on the electricity market of Spain as an example of implementation. However, the presented assessment can be applied to other countries with minor modifications. In Spain, the RD 244/2019 decree presents new possibilities for prosumers by enabling collective self-consumption [21]. It simplifies administrative procedures and improves the economic viability of the PV installations by recognising the right of prosumers to sell the surplus electricity to the grid [4]. The decree presents different regimes according to the installed capacity [22]. Among these, we will focus on the scenario for installations from 15 to 100 kW, which is the most attractive for the residential sector.
In this case, the regulation allows a simplified monthly net billing remuneration mechanism. The difference between PV generation and the energy consumption is obtained hourly. A positive result is considered a surplus (or excess) that benefits from a revenue price. Negative values are subtracted from the hourly consumption. The computation of these differences is made monthly. The customer will obtain an energy-saving benefit when the energy generated exceeds the consumed, and an income from the surplus sold to the grid. These revenues are limited to the same quantity as the monthly energy cost. This mechanism is called compensation.
To avoid difficulties in the interaction between DSOs and electricity traders, the energy allocation coefficients must be established a priori, before energy is generated and consumed. They can be modified every 4 months. All these rules and regulations have been taken into consideration hereafter.
1.2. Energy Allocation
According to the regulation, the energy in a REC for billing purposes shall be calculated in accordance with the following provisions. The hourly solar electricity generation assigned to each participant , is:
where is the total hourly energy generated by the PV system; and is the normalized hourly allocation coefficient in time t (in hours) for participant i. The sum of them over all K participants for every time step in the analysed period (Y time steps, in hours) in the REC equals one (eq (2)). Henceforth, the analysis period will be considered as one year ().
The energy allocation coefficients are agreed upon by all participants in an agreement and notified to the DSO. can vary by hour. The most common practices are to determine the coefficients according to: the economic contribution to the PV installation (equitable) or the hourly consumption (environmental). In this study, we will add the allocation procedure presented in our previous study (optimised) [14] to these two typical forms of energy allocation. The objective of our previous study was to find the optimum assigned to each participant i in an hourly granularity that minimises the difference among individual paybacks and the solar energy excess. The driver for developing the optimisation algorithm was to provide participants in a REC with an improved allocation strategy that considers both energy sustainability and economic equity.
The energy consumed by each participant i at time t is defined as (eq. (3)). This energy consumption is directly measured by the fiscal smart home electricity meter.
where is the grid energy purchased from the electricity trader company, is the allocated solar energy generated by the PV system, and is the solar energy excess dispatched to the grid. and are known data. Notice that .
is defined as the hourly mean of the solar energy generated, calculated over each hour slot within each month. is also defined as the hourly mean of the energy consumption for each participant, calculated over hourly slots within each month. Still, here, two types of days are distinguished for calculating the hourly means: weekdays and weekends. This categorisation is done because consumption behaviour significantly differs between these two periods.
To calculate the profit provided by the REC to a participant, both the old and new costs are required. is the cost per time unit (i.e. hour), for each participant i, of the energy consumed from old sources (the grid), without considering solar energy (eq. 4). It is calculated considering the energy consumed and the time-varying electricity purchase price .
The energy cost for each participant, once the solar energy is allocated, is defined as the cost of new sources per time unit (eq. 5). This energy cost is affected by the revenues of the solar excess dispatched to the grid, which is sold at the solar excess sale price .
In general, . This implies that self-consuming solar energy is always more convenient than selling it.
When considering the compensation mechanism defined in the Spanish regulation, the revenues are limited to the same quantity as the monthly energy cost. Therefore, the new cost can’t be negative. This is shown in eq. 6, where are the hourly steps for a month. When compensation is not being considered, then this relation doesn’t have to comply, the new cost can be negative.
The profit () for a whole year and payback () of each participant with an investment, are defined in eq. 7 and eq. 8 respectively.
For the case not using compensation, could be higher than . While, when using compensation this will never occur.
1.3. Main Contributions
This research presents an assessment to compare different energy allocation procedures for various community settings powered by renewable energy. This research makes several contributions to the state of the art of REC evaluation and provides clarity. The main distinctions from state-of-the-art studies are the following.
- A complete assessment is developed, drawing global conclusions which are vital as a source of advice to prevent common failures.
- Even though RECs are at a stage of deployment, meaning that there are few RECs in operation with accessible data, we recreate 240 realistic REC scenarios with different configurations.
- The scenarios were designed to accurately represent real consumption patterns by utilising clustering techniques on a real data set.
- The method is replicable in countries where the legal framework establishes that the distribution of RES generation must be based on allocation coefficients (such as the Spanish and French legal frameworks).
- The study is developed with a prosumer-driven perspective, instead of the typical DSO’s point of view. Providing vital information for consumers eager to form a REC and inform their decision-making.
2. Methodology
To develop a comprehensive assessment, it is necessary to evaluate as many scenarios as possible and draw global conclusions, which requires various REC configurations. However, most RECs in Spain are at a stage of deployment, meaning that there are few RECs in operation with accessible data (generally incomplete). Given this condition, working with real data would limit the study to a limited number of configurations. In addition, we are interested in including “non-common” configurations to evaluate. Therefore, to facilitate a broader analysis, it was essential to recreate realistic scenarios based on synthetic user profiles generated from the initial real data sets.
The number of possibilities for forming a REC is unlimited because the number of variables involved is large, and the values each variable can take are indefinite. Each scenario configuration needs individual analysis, but global conclusions are necessary as a source of advice to prevent common failures.
To generate this thorough analysis, the following procedure was followed: a) clustering of the real data set, b) generating the synthetic profiles and the REC configurations, c) evaluation using different KPIs. The clustering stage (a) consists of running an unsupervised learning technique to obtain the typical load pattern characteristics from a real data set. The REC configuration design (b) is the construction of scenarios using the previous clusters as building blocks. Finally, in the evaluation (c) different KPIs are considered to analyse the viability and sustainability of each REC configuration.
2.1. Clustering
A REC can be formed by citizens with diverse daily and seasonal electricity consumption behaviours and various electrical appliances. For example, heating systems in households can include a wide range of options such as furnaces, boilers, heat pumps (both water-source and air-source), and gas-fired or electric (resistance) heaters.
Each heating system has a distinct energy source, varying from natural gas to pellets or electricity. Even among heating appliances that use electricity, their consumption patterns differ significantly, impacting how electricity is used throughout the day. Therefore, when analysing RECs, it is crucial to consider the electrical consumption patterns of the different participants. Before grouping participants in a REC, it is essential to understand the possible forms of the load profile at a given site to ensure effective energy sharing.
To define the participant’s archetype, the electrical consumption time series were analyzed. Electrical consumption time series can be characterised by differences in shape and overall annual consumption. To identify the different overall annual consumption, quantiles were calculated over the aggregated consumption. On the other hand, the typical shape was obtained by applying clustering techniques.
Clustering was applied to all datasets to identify groups with similar characteristics. Two clustering instances were defined: seasonal patterns and daily patterns for each month. To detect the seasonal patterns, firstly, the mean monthly consumption was calculated. To analyse the annual curve of the mean monthly consumption for each contract, a clustering technique was employed. To define typical daily patterns for each month, the days were separated into weekdays and weekend days. Afterwards, for each group of days, normalisation was applied to remove the differences in aggregated consumption and stay only with the shape.
For both instances, the Mclust technique was used. Mclust is a distribution-based clustering technique. If is a sample of n independent identically distributed electrical consumption measurements and, the elements follow a finite mixture of a number G of Gaussian probability densities, the function f representing the distribution in the 24-dimensional space (length of variable h) is defined in eq. 9.
where are the parameters of the mixture model, is the Gaussian density component with parameter vector , evaluated at element , are the mixing weights or probabilities (with , ), and G is the number of clusters. The and G parameters must be estimated. Since the component densities are Gaussian, the clusters are ellipsoidal and centred at the mean vector . They possess geometric features such as volume, shape, and orientation, which are determined by the covariance matrix .
In order to find the parameters of the mixture model () and the number of clusters (G) which best fit the model described by eq. 9, the R package Mclust was used. This package provides libraries to estimate the parameters of the multi-dimensional Gaussian probability distributions which best fit the data set. The way of achieving this is via the expectation-maximisation algorithm [23].
After doing the clustering, the daily characteristic curve for each cluster s at hour h is obtained, as defined in eq. 10.
where is the number of days belonging to cluster s and is the daily normalized consumption data of day d at hour , grouped in cluster s.
The clustering enabled us to interpret the dataset and understand the different consumer typologies. Once the clustering was complete, synthetic members, defined by synthetic profiles, were recreated from the typical patterns obtained from the real dataset. To generate these new members from the information obtained, the following parameters were randomly taken: the daily and seasonal characteristic curves for the shape, and the overall annual consumption. This methodology provides realistic synthetic participants which are then used, together with other parameters, to create a complete REC configuration scenario.
2.2. Configuration Scenarios Design
Different and representative scenarios were constructed for the comparative study. Each scenario consists of a REC, composed of synthetically created participants, and a given energy allocation method. Some common fixed parameters were defined for all scenarios: the cost of the collective PV installation is 1400 euros per kWp, the number of participants is 5 (the assumption is that everything scales linearly, so we decided to use a small number of participants in order to facilitate the interpretation of the results), and in all cases the participants invest proportional to their annual aggregated electricity consumption.
The following are the variable parameters to create a REC configuration. The synthetic participants are characterised in terms of their consumption typology and the economic agreements with their electricity trader company. The RECs are characterised by the energy allocation criteria.
Foremost, to define the participants’ time series, the following consumption parameters were considered:
- Aggregated consumption: annual accumulated electricity consumption.
- Shape:made by daily and seasonal consumption patterns.
The possible values for these variables were identified through the clustering study mentioned above. White noise was added to the curves to represent the natural variability of human behaviour, and in this way, avoid having two participants with the same electricity load pattern.
Once the participants were characterised by their electricity load time series, the economic agreements with their electricity trader companies were set. These were based on the following economic parameters:
- Prices:
- Two prices are assigned to every participant for the energy: purchase price of the electricity delivered by the power grid, and sale price of the solar surplus dispatched to the power grid. The ratio between these two prices was always set to , with always the largest. The values for varied randomly among participants, ranging from 0.20 to 0.28. This study focused on the relationship between prices among participants: similar prices indicate that all participants have the same tariffs, while different prices indicate that all participants have different tariffs.
- Compensation:
- The possibilities are to operate with or without a compensation mechanism. All participants in the Renewable Energy Community (REC) must use the same compensation method. According to the Spanish regulation, it is not permitted for one participant to use compensation while another does not.
Finally, after the participants are completely defined, they are grouped within a REC, and each REC is assessed using the three following energy allocation criteria:
- Equitable: proportional to the individual’s initial investment.
- Environmental: proportional to the hourly electricity consumption.
- Optimised: considering both equity (minimal difference between paybacks) and sustainability (minimal PV generation surplus) [14].
The analysis methodology comprises eight cases. In the first four cases, the economic parameters were fixed to similar compensation & price. That means all the participants use the compensation mechanism and all have the same electricity tariffs (for and ). Only the consumption parameters varied. These first four cases are defined as the binary combination of similar aggregated consumption and similar shape:
- Case 1: similar shape & similar consumption. It represents the homogeneous case, in which all the participants forming the REC are similar.
- Case 2: different shape & similar consumption. It represents the case in which the participants have the same electric appliances but have different consumption habits. For example, consider a case of a REC composed of residential users whose most significant electric consumption comes from electric-driven ovens and water heating systems, but whose consumption behaviour is considerably different (some of them cook and have baths in the morning, while others do so at night).
- Case 3: similar shape & different consumption. It represents the antagonist of the previous one. Here, the habits are similar, but the net yearly amount of energy consumed is different. For example, this could be the case of a REC formed by households with air conditioning systems for space cooling, but the sizes of the households are different. We expect that the days and hours for using air conditioners will remain the same; however, the number of devices used will vary according to the size of the houses, leading to different levels of total consumption.
- Case 4: different shape & different consumption. It represents the most heterogeneous case. All participants perform completely differently.
The remaining cases, up to eight, were created with the same consumption parameters as Case 3 (similar shape & different consumption), while varying the economic parameters for the participants forming the REC. The decision to use similar shapes and varying consumption levels as fixed consumption parameters while adjusting the economic parameters is deliberate. The reason for maintaining a similar shape is to ensure that hourly differences in consumption are solely due to variations in price. Additionally, participants with different consumption levels were selected because their investments are proportional to their total annual consumption. This approach incorporates variability in investment and enhances the overall completeness of the economic study.
The last four cases are defined as binary combinations of compensation and similar price:
- Case 5: similar compensation & similar price. It represents the case where all participants have similar agreements with their electricity traders. Therefore, they have the same purchase tariffs and the same compensation mechanisms
- Case 6: Without compensation & similar price. It represents the case in which the participants have the same purchase tariffs and do not use the compensation mechanism. This means they can sell as much energy as they export, without limit.
- Case 7: compensation & different price. It represents the case where all participants have different purchase tariffs. Moreover, all of them apply the compensation mode.
- Case 8: not compensation & not similar price. It represents the case in which prices are different for all participants and no one applies the compensation mechanism.
For each of these 8 cases, 10 different RECs were constructed. For each of the 10 RECs, the three allocation criteria were tested, resulting in 30 scenarios per REC and a total of 300 scenarios across all RECs.
2.3. Evaluation
To evaluate the scenarios, two key statistics were analysed: the overall surplus and the payback difference. The surplus reflects the share of renewable energy generated that is not self-consumed within the community, which is crucial for assessing its environmental performance. Minimising surplus ensures that the energy produced is used effectively, helping to decongest the grid and maximising the environmental benefits of RECs. On the other hand, the payback difference measures the variation in the economic returns experienced by participants, which is essential for evaluating fairness in profit distribution. Maintaining this difference at a low level ensures equitable benefits for all community members, regardless of their individual energy consumption, which is crucial for fostering trust and engagement. Obtaining low values for these two parameters ensures that both environmental and economic goals are met.
2.4. Dataset
The dataset on which the construction of synthetic RECs is based includes electricity consumption data from smart meter hourly readings of 800 households and solar generation data from a single photovoltaic (PV) installation located in the city of Barcelona. The dataset contains information from the year 2022.
3. Results
3.1. Participants Archetypes
By applying the clustering technique, distinct clusters were identified. The seasonality instance resulted in two main cluster profiles. They are shown in Figure 1.
In Figure 1, we can see that Cluster 1 displays a flat curve, indicating that consumption is not influenced by seasonal factors. In contrast, Cluster 2 reveals a distinct relationship between season and consumption, suggesting that these homes are equipped with electric heating systems.
The outcomes of the clustering on the daily profile instance are shown in Figure 2. It can be seen that four different daily characteristic patterns (clusters) were obtained. Clusters 1 and 4 exhibit a widespread consumption pattern characteristic of the Mediterranean climate zone, with peaks at lunchtime and at the time of returning home after work (20 hours) [24]. Cluster 2 is a plateau, showing that consumption is evenly distributed throughout the day. Finally, cluster 3 exhibits a distinct typology, characterised by a pronounced valley during the typical working day.
3.2. Scenarios Comparison
A general evaluation of the obtained scenarios is carried out. Regarding the environmental objectives, the parameter studied is the overall surplus. For the economic assessment, the parameter considered is the payback difference among the participants. The aim is to obtain low values for both parameters. Results are presented in violin plots to facilitate a more readable comparison between the assessed 120 scenarios.
The outcomes of the initial four cases, which involve variations in the consumption parameters, are visually represented in two figures. Figure 3 shows the surplus, and Figure 4 shows the payback difference outcomes. The results for Case 1 are depicted in the top-left quadrant, Case 2 in the top-right quadrant, Case 3 in the bottom-left quadrant, and Case 4 in the bottom-right quadrant.
First, we will analyse the results obtained for Surplus on cases 1 to 4 (Fig. Figure 3) with the three energy allocation strategies.
Case 1: identical outcomes are observed across all allocations, with most scenarios remaining below 10%, an acceptable threshold.
In contrast, the subsequent cases revealed varying results for each allocation strategy. For these latter cases, as predicted, the environmental allocation outperformed the others significantly, whereas the equitable allocation exhibited the poorest performance in terms of surplus.
Case 2 and Case 3: the results for the optimal and equitable energy allocations were similar, though the optimal allocation achieved slightly better surplus outcomes. The environmental allocation outperformed.
Case 4: the surplus for the equitable energy allocation ranged between 10% and 20%. Meanwhile, the optimal energy allocation successfully reduced the lower and upper bounds to 7% and 12%, respectively.
Additionally, when examining Case 1 and Case 3, a potential issue arises with scenarios that share similar consumption patterns. The fact that simultaneously all participants are consuming low amounts of energy could potentially lead to excessively high surpluses, approximately 40%. Such instances underscore the need for caution; although the sizing of the photovoltaic installation may be accurate, the synchronous consumption among participants can precipitate unexpectedly high surplus levels.
The Payback difference is shown in Figure 4, for the four cases (1 to 4) and three energy allocation strategies.
Case 1: Uniform null results across all allocation methods indicate there is no difference in payback periods. This suggests that in scenarios with similar consumption patterns, the choice of the energy allocation strategy might be less critical, allowing for a truly equitable distribution of profit.
Case 2: Both the equitable and optimal allocation methods yield similar results, with some scenarios showing no difference in payback periods. Conversely, the environmental allocation demonstrates poor performance.
Case 3: Similar to Case 2, the equitable and optimal methods achieved comparable outcomes, although in this case, no scenarios result in a zero payback difference. Again, the environmental allocation shows poor performance.
Case 4: This case highlights the most pronounced differences between energy allocation methods. While the optimal energy allocation approaches the results of the equitable configuration, the environmental approach shows unacceptably large differences in payback periods, reaching up to a maximum of 18 years in some scenarios.
These findings highlight the impact of various energy allocation strategies on the financial viability of projects, indicating that decision-makers should carefully consider the specific conditions of each case when selecting an energy allocation method.
The analysis of Figure 3 and Figure 4 indicates that Case 1 consistently provides the best results when the goal is to achieve a Payback difference near zero, regardless of the energy allocation method used. This suggests that, under conditions of similar shape and consumption, the choice of energy allocation method does not significantly impact zero payback difference outcomes.
For Surplus outcomes, Case 4, which is characterised by a different shape, different consumption and environmental oriented energy allocation, demonstrates the best performance. This case ensures a low surplus for all scenarios (although it does not achieve a zero surplus), indicating superior efficiency in terms of sustainability and resource management.
When seeking a case with balanced results, regardless of the energy allocation method, Case 2 (with similar consumption and different shapes) stands out. This case exhibits both a reasonable surplus and an acceptable payback difference across all allocations. Therefore, Case 2 can be considered a robust REC case, where the parameters consistently perform well regardless of the energy allocation method employed.
The analysis also reveals that Case 4 is particularly sensitive to the energy allocation method. Depending on the allocation method used, the results for surplus and payback difference can vary significantly, producing either very favourable or very unfavourable outcomes. This suggests that, in this case, the choice of energy allocation method is crucial and can dramatically impact the final results.
In summary, Figure 3 and Figure 4 provide a clear understanding of how different cases and energy allocation methods can impact outcomes in terms of payback difference and surplus. When seeking low and stable results, Case 1 is notable for its payback difference, and Case 4 (with an environmental allocation) excels in terms of surplus. However, it is crucial to consider the sensitivity of Case 4 to the energy allocation methods to optimise results effectively. Finally, Case 2 is the most balanced and robust scenario.
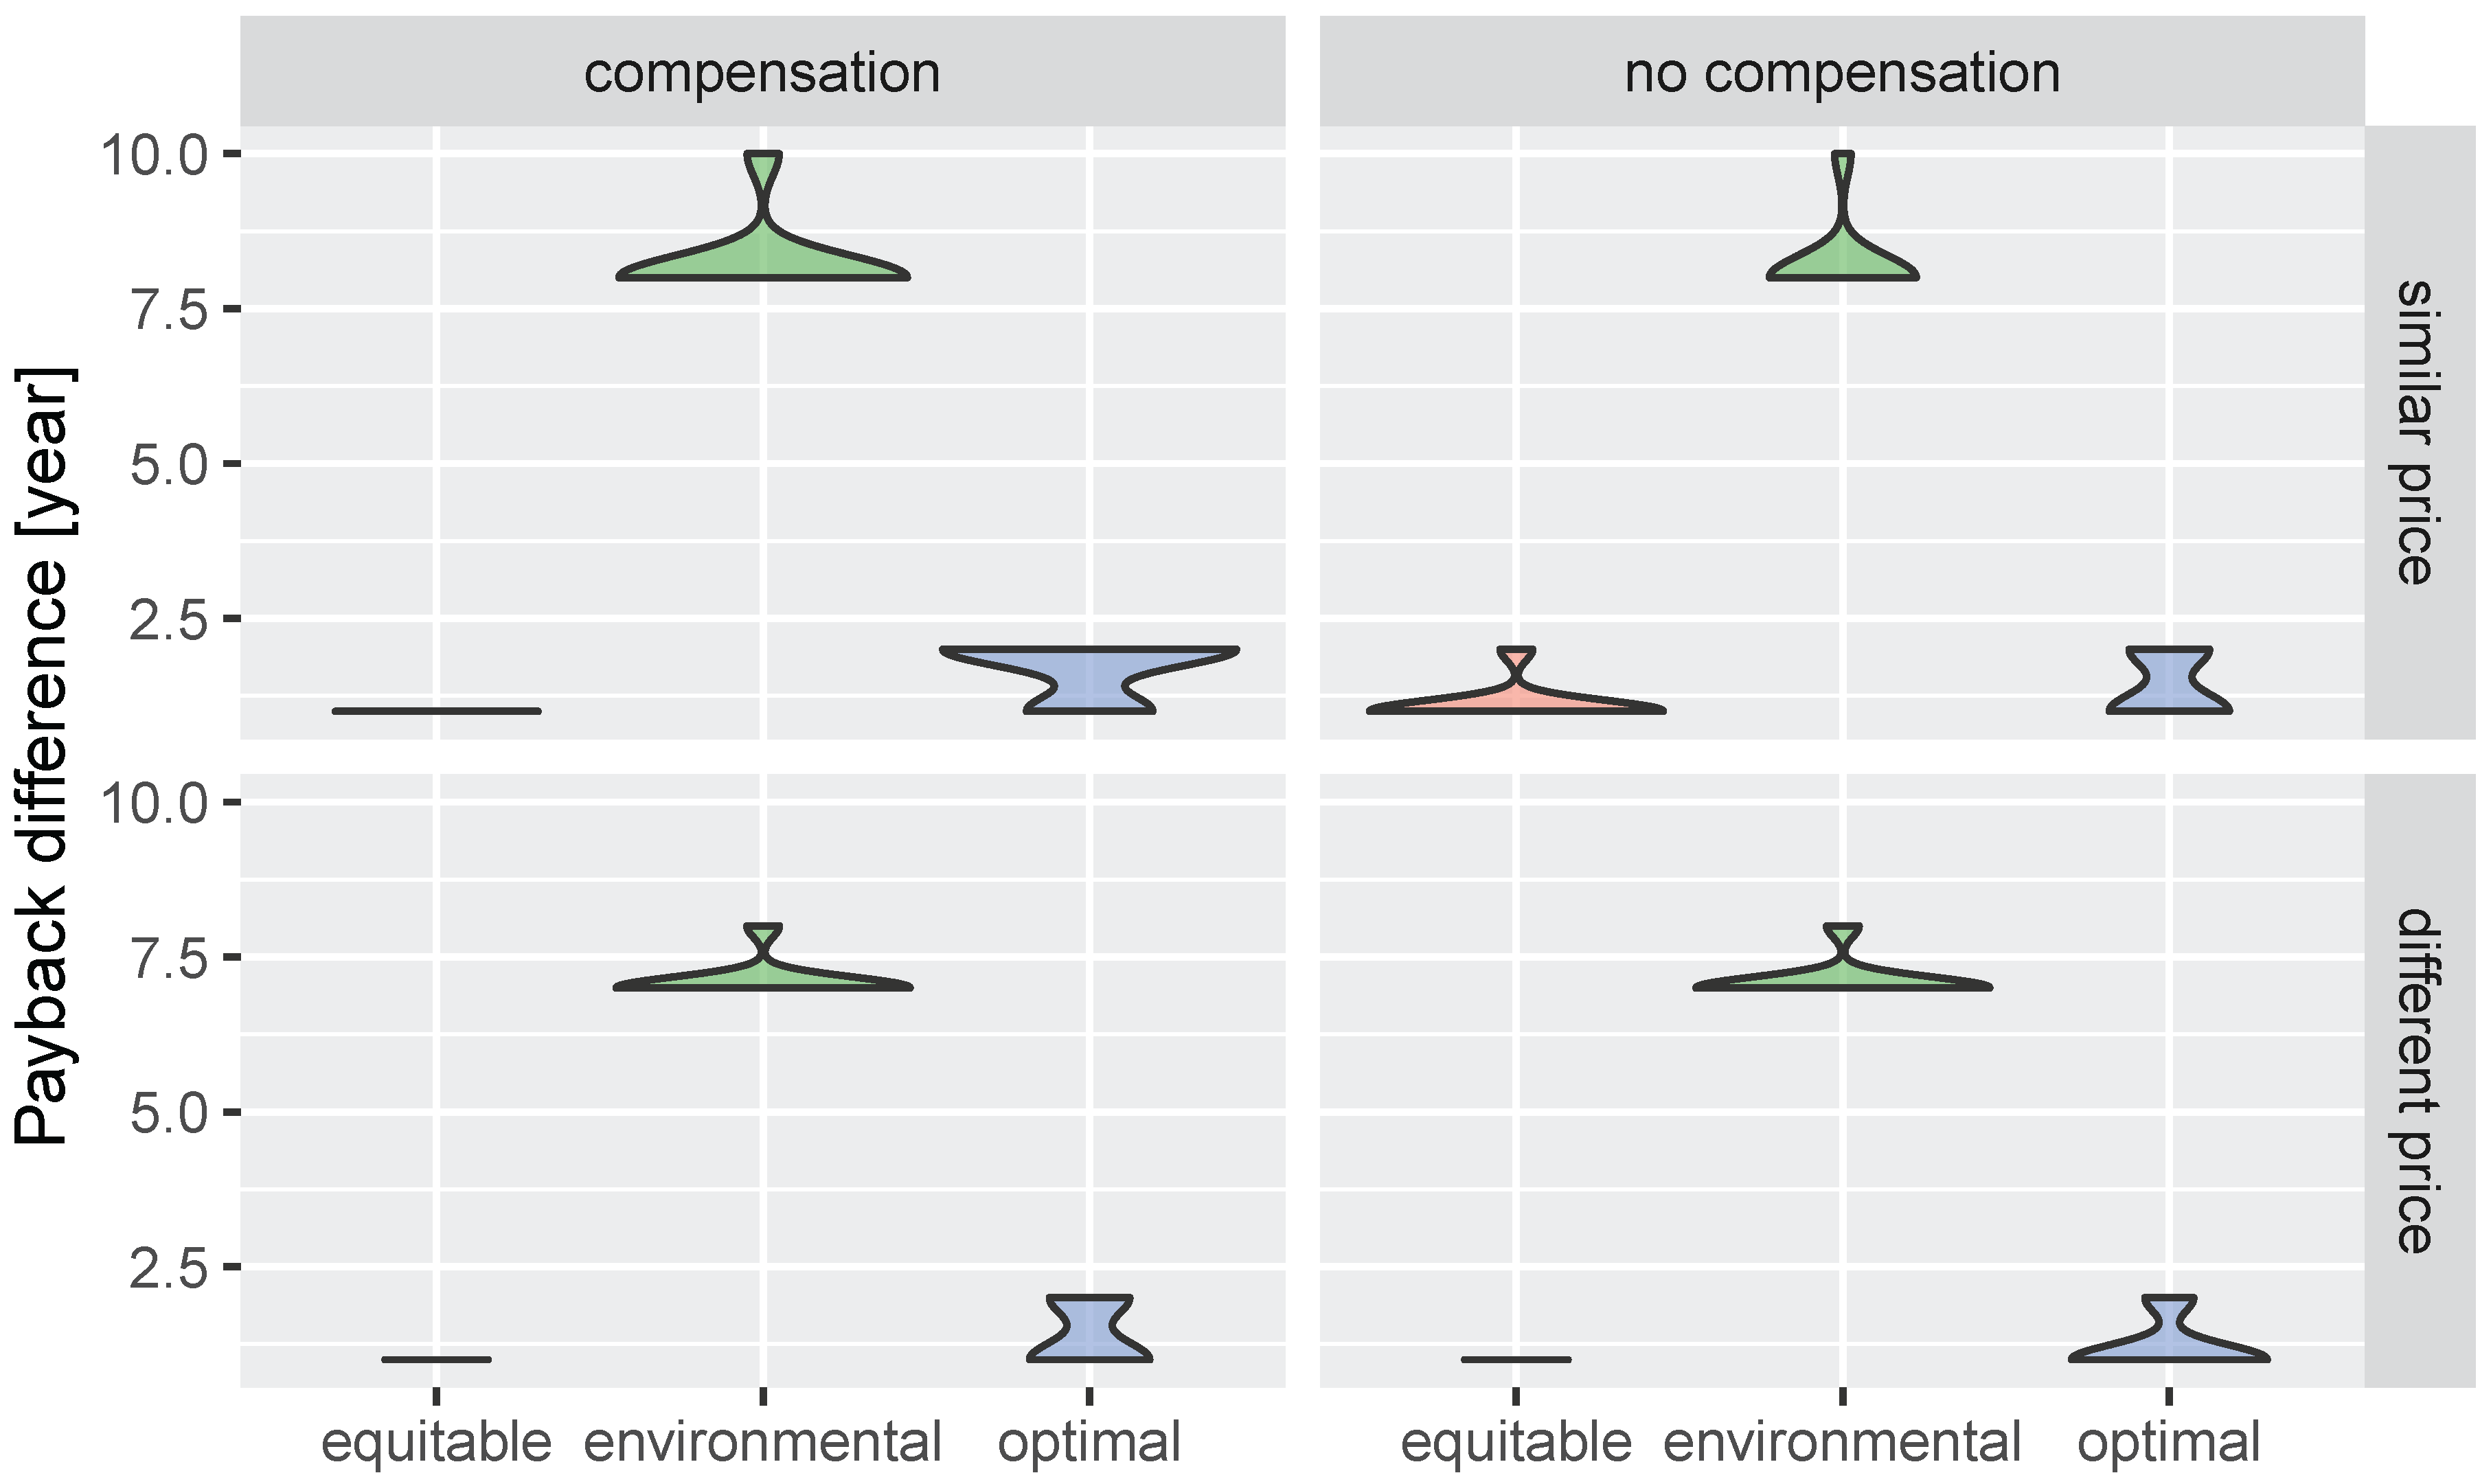
The results for the following four cases (varying the economic parameters) are shown in Figure 5 (surplus) and Figure 6 (payback difference). The presentation of the results is as follows: Case 5, top left; Case 6, top right; Case 7, bottom left and Case 8, bottom right.
Figure 5 shows results which remain consistent across all cases: the environmental energy allocation yields the lowest surplus, while the equitable and optimal produce similar outcomes. In conclusion, cases 5 to 8 yield nearly identical results in terms of surplus, indicating that the compensation method and price differences do not significantly impact the surplus.
Figure 6 shows that, across all cases, the equitable energy allocation consistently produces the best results, with a payback difference close to 1 year for all scenarios. The optimal energy allocation also yields acceptable results, with payback periods under 2.5 years. In contrast, the environmental energy allocation always produces unacceptable results.
When comparing cases with similar and different prices, the most significant impact is observed in the environmental energy allocation. Under different price conditions, the payback difference decreases, although it remains high across all cases.
Regarding case-specific observations, for optimal energy allocation, Case 5 yields the worst result, while Case 8 is the one that performs best. For equitable energy allocation, Case 6 gives still acceptable, results.
All in all, the best payback difference results (close to 0) are achieved in the equitable energy allocation for Cases 5, 7, and 8. Moreover, the best surplus results are obtained with the environmental energy allocation; however, in all cases, there are scenarios with a 40% surplus, which is unacceptable.
Finally, as a global conclusion, when varying consumption and shape and keeping economic parameters fixed, the system’s sensitivity is more determined by the configuration of the case than by the energy allocation method. Conversely, when adjusting compensation and price and keeping consumption parameters fixed, the system is more sensitive to the energy allocation method than to the specific case.
4. Discussion
RECs represent a promising approach to fostering citizen-driven contributions to the energy transition. However, each REC has its own diverse economic and environmental goals, and the success of RECs depends heavily on aligning their frameworks with these goals. This study highlights the importance of tailoring REC energy allocation coefficients to reflect the specific objectives of the community, thereby preventing dissatisfaction among participants whose expectations are not met. This paper presents general conclusions comparing a set of diverse scenarios providing vital information to RECs’ participants. A lack of initial guidance and information risks leading to suboptimal outcomes, potentially dampening motivation and slowing the growth of new RECs. Given the high expectations surrounding RECs and their potential to involve non-traditional actors in the energy transition, it is crucial to provide clear, customised advice during the setup phase and to closely monitor outcomes. This ensures that RECs’ goals are achieved, and the success of early adopters can inspire wider adoption, fostering a robust and sustainable energy community ecosystem.
However, while customised energy allocation coefficients are crucial for the success of RECs, they are not sufficient. As previously mentioned, each community’s unique circumstances must be carefully analysed to achieve the best outcomes, addressing the lack of knowledge and uncertainty that often discourages potential participants. But, beyond this, it is imperative to tackle other barriers, notably the slow and cumbersome administrative procedures that fall outside the scope of this study but are critical to building trust and confidence in RECs. Lengthy processes, such as those involving multiple energy suppliers in the legalisation of a single REC, significantly delay project implementation, undermining momentum and discouraging future participants. Streamlining these processes is essential for ensuring that RECs can realise their full potential as efficient and appealing instruments in the energy transition.
At this stage, it is paramount to emphasise that reducing energy consumption is essential for mitigating greenhouse gas emissions [25]. While the promotion of renewable energy use is beneficial, it must not overshadow the primary goal of reducing overall consumption, a principle that challenges the prevailing consumerist mindset. Nowadays, understanding this goal is complicated due to widespread disinformation [13], which obscures the true priorities of environmental action. Misleading messages regarding sustainable practices have become penetrating, undermining efforts to foster genuine action. Greenwashing, characterised by poor environmental performance coupled with misleading positive messaging, erodes trust and exacerbates scepticism among consumers, who struggle to discern credible claims from false ones. Therefore, clear communication about environmental impact should be a priority for everyone involved in the development of RECs, emphasising that the REC is environmentally beneficial, but that reducing overall consumption is entirely complementary and urgent.
Overall, as a result of our work, and focusing on the results obtained, the case where the electricity consumption level and the load profile shape are similar for all the participants (Case 1), payback differences consistently provide near-zero results across all energy allocation methods, making it ideal for the case when the goal of the community is to have low payback difference without caring about the surplus generated. This could be useful, for example, in cases where the community is recruiting new participants with similar consumption and shape, such as those in residential apartments within the same building, but doesn’t know which energy allocation mechanism will be used.
Conversely, when electricity consumption levels and load profile shapes differ (Case 4), the variation in payback periods is highly sensitive to energy allocation methods, resulting in outcomes that can range dramatically from favourable to unfavourable. This highlights the need for a detailed analysis of the energy allocation method selection. A realistic example of Case 4 could be a rural REC, encompassing a diverse range of energy consumers, where individual households have different heating systems, some using electric heat pumps, others relying on biomass or traditional wood-burning stoves. Additionally, this REC configuration may involve different production facilities, such as a cheese factory with high refrigeration needs and an agricultural producer operating irrigation systems at specific times. In this scenario, where energy demands and usage patterns vary significantly, it is crucial to select the appropriate energy allocation method.
5. Conclusions
This investigation provides a clear understanding of how different REC configuration cases and energy allocation methods impact key outcomes, such as payback difference among participants and surplus energy delivered to the electricity network.
When studying the differences among energy allocation methods, the results align with expectations. The advantage of the equitable energy allocation criteria is that it delivers the best payback difference results (close to 1 year in all scenarios), but the surplus is high. Regarding the environmental energy allocation method, it consistently produces the lowest surplus, emphasising its effectiveness in improving sustainability; however, it widens payback differences. When a balance between surplus and payback difference is sought, optimal energy allocation provides better and more consistent performance.
By varying consumption levels and the shape of electricity profiles while keeping economic parameters constant, we find that the sensitivity of both environmental and economic performance is more significantly influenced by the inherent characteristics of each REC than by the method of energy allocation. However, when we vary compensation and pricing parameters while keeping consumption parameters fixed, the system’s sensitivity shifts. In this case, the methods of energy allocation become more critical for achieving the desired outcomes.
These conclusions provide a clear understanding of how energy allocation strategies should be tailored to the specific REC configurations and case conditions to optimally achieve environmental and economic objectives.
Future work could aim to explore REC in greater depth and provide a more complete insight into their potential role in future power systems. This expanded scope could incorporate both internal and external parameters to better understand and optimize REC performance.
Regarding internal parameters, demand management mechanisms such as energy storage systems—batteries or electric vehicles—could be explored. While batteries can address allocation challenges by storing surplus energy for later use, their widespread adoption should be approached cautiously due to sustainability concerns. Prioritising robust community structuring to reduce reliance on batteries may offer a more sustainable solution. Additionally, integrating alternative energy sources, such as wind power, into hybrid systems could enhance energy reliability and diversification within RECs.
On the other hand, within the external parameters, the effect of different relations between the grid and energy sales prices could be considered. In real-world scenarios, surplus energy is sold at fixed prices that are typically lower than purchase prices, incentivising self-consumption and potentially encouraging consumers to adopt demand-side management strategies, such as shifting nighttime consumption to daytime. Conversely, in hypothetical scenarios where surplus sale prices match purchase prices, the financial advantage of self-consumption diminishes, potentially undermining the community’s purpose and the validity of prior analyses. Future studies could delve into these dynamics to inform policy and operational strategies that support REC sustainability and participant engagement.
To conclude, we presented a comprehensive assessment comparing energy allocation procedures across realistic REC configuration scenarios, contributing to the state-of-the-art by bridging theoretical methodologies and practical tools, offering global insights to prevent common organisational failures, and providing prosumer-focused guidance for decision-making in line with current legal frameworks.
Author Contributions
Writing—original draft, F.L.; writing—review and editing, J.C. and F.S. All authors have read and agreed to the published version of the manuscript.
Funding
This research was funded by the Interreg V funded projects: EFA312/19/EKATE: Gestión de Energía Eléctrica Fotovoltaica y Autoconsumo Compartido en la zona transfronteriza Francia-España, utilizando tecnología “Blockchain” e “Internet of Things (IoT) and EFA41/1-EKATE+ Digitalización y optimización de Comunidades Energéticas Renovables en la zona transfronteriza España-Francia, utilizando tecnologías de acumulación energética y sistemas compartidos de electromovilidad y nuevas cargas flexible. It has been also partially funded by the Ministerio de Ciencia, Innovación y Universidades of the Spanish Government, through the Generación del Conocimiento project: PREP2023-001521-OMELET Métodos avanzados de grafos semánticos para la integración masiva de renovables y almacenamiento en redes de distribución eléctrica a nivel de distrito
Data Availability Statement
The data that support the findings of this study are available from the corresponding author upon reasonable request.
Acknowledgments
The authors of this article thank the Department of Computer Science of the University of Lleida, and the Buildings Energy and Environment Innovation Unit of CIMNE, for their strong support.”
Conflicts of Interest
The authors declare no conflicts of interest.
Abbreviations
| cost of new sources per time unit | |
| Old energy cost per time unit for each participant | |
| DSO | Distribution System Operator |
| Solar energy excess dispatched to the grid | |
| Energy purchased from the electricity trader company | |
| Hourly solar electricity generation assigned to each participant | |
| Total hourly energy generated by the PV system | |
| Normalized hourly energy allocation coefficient | |
| GAs | Genetic Algorithms |
| Investment | |
| KPI | Key Performance Indicator |
| Yearly economic profit | |
| Time-varying electricity purchase price | |
| Time-varying electricity price of the solar surplus dispatched to the grid | |
| Time-varying electricity purchase price | |
| PV | Photovoltaic |
| Payback of each participant | |
| RD | Real Decreto |
| REC | Renewable Energy Community |
| SDGs | United Nations Sustainable Development Goals |
| t | time in hours |
References
- United Nations, the Sustainable Development Goals Report – June 2024. New York, USA. https://unstats. un.org/sdgs/report/2024/. Accessed: 2024.
- Capellán-Pérez, I.; Campos-Celador, Á.; Terés-Zubiaga, J. Renewable Energy Cooperatives as an instrument towards the energy transition in Spain. Energy Policy 2018, 123, 215–229. [Google Scholar] [CrossRef]
- Caramizaru, A.; Uihlein, A. Energy communities: an overview of energy and social innovation; Publications Office of the European Union, 2020.
- Prol, J.L.; Steininger, K.W. Photovoltaic self-consumption is now profitable in Spain: Effects of the new regulation on prosumers’ internal rate of return. Energy Policy 2020, 146, 111793. [Google Scholar] [CrossRef]
- Minelli, F.; Ciriello, I.; Minichiello, F.; D’Agostino, D. From net zero energy buildings to an energy sharing model-The role of NZEBs in renewable energy communities. Renewable Energy, 2024; 120110. [Google Scholar]
- Luzzati, T.; Mura, E.; Pellegrini, L.; Raugi, M.; Salvati, N.; Schito, E.; Scipioni, S.; Testi, D.; Zerbino, P. Are energy community members more flexible than individual prosumers? Evidence from a serious game. Journal of Cleaner Production, 2024; 141114. [Google Scholar]
- Hanke, F.; Guyet, R.; Feenstra, M. Do renewable energy communities deliver energy justice? Exploring insights from 71 European cases. Energy Research & Social Science 2021, 80, 102244. [Google Scholar]
- D’Adamo, I.; Gastaldi, M.; Koh, S.L.; Vigiano, A. Lighting the future of sustainable cities with energy communities: An economic analysis for incentive policy. Cities 2024, 147, 104828. [Google Scholar] [CrossRef]
- Walker, A.; Kwon, S. Design of structured control policy for shared energy storage in residential community: A stochastic optimization approach. Applied Energy 2021, 298, 117182. [Google Scholar] [CrossRef]
- Gruber, L.; Kockar, I.; Wogrin, S. Towards resilient energy communities: Evaluating the impact of economic and technical optimization. International Journal of Electrical Power & Energy Systems 2024, 155, 109592. [Google Scholar]
- Wu, D.; Liu, A.; Ma, L.; Guo, J.; Ma, F.; Han, Z.; Wang, L. Multi-parameter cooperative optimization and solution method for regional integrated energy system. Sustainable Cities and Society 2023, 95, 104622. [Google Scholar] [CrossRef]
- Kweon, J.; Jing, H.; Li, Y.; Monga, V. Small-signal stability enhancement of islanded microgrids via domain-enriched optimization. Applied Energy 2024, 353, 122172. [Google Scholar] [CrossRef]
- de Freitas Netto, S.V.; Sobral, M.F.F.; Ribeiro, A.R.B.; Soares, G.R.d.L. Concepts and forms of greenwashing: A systematic review. Environmental Sciences Europe 2020, 32, 1–12. [Google Scholar] [CrossRef]
- Lazzari, F.; Mor, G.; Cipriano, J.; Solsona, F.; Chemisana, D.; Guericke, D. Optimizing planning and operation of renewable energy communities with genetic algorithms. Applied Energy 2023, 338, 120906. [Google Scholar] [CrossRef]
- Gruber, L.; Bachhiesl, U.; Wogrin, S. The current state of research on energy communities. Elektrotechnik und Informationstechnik 2021, 138, 515–524. [Google Scholar] [CrossRef]
- Yiasoumas, G.; Psara, K.; Georghiou, G. A Review of Energy Communities: Definitions, Technologies, Data Management. In Proceedings of the The 2022 2nd International Conference on Energy Transition in the Mediterranean Area (SyNERGY MED). IEEE: New York, NY, USA; 2022; pp. 1–6. [Google Scholar]
- Hanke, F.; Guyet, R.; Feenstra, M. Do renewable energy communities deliver energy justice? Exploring insights from 71 European cases. Energy Research & Social Science 2021, 80, 102244. [Google Scholar] [CrossRef]
- Warbroek, B.; Hoppe, T.; Coenen, F.; Bressers, H. The Role of Intermediaries in Supporting Local Low-Carbon Energy Initiatives. Sustainability 2018, 10. [Google Scholar] [CrossRef]
- Weckesser, T.; Dominković, D.F.; Blomgren, E.M.; Schledorn, A.; Madsen, H. Renewable Energy Communities: Optimal sizing and distribution grid impact of photo-voltaics and battery storage. Applied Energy 2021, 301, 117408. [Google Scholar] [CrossRef]
- Ahmed, S.; Ali, A.; D’Angola, A. A Review of Renewable Energy Communities: Concepts, Scope, Progress, Challenges, and Recommendations. Sustainability 2024, 16, 1749. [Google Scholar] [CrossRef]
- Inês, C.; Guilherme, P.L.; Esther, M.G.; Swantje, G.; Stephen, H.; Lars, H. Regulatory challenges and opportunities for collective renewable energy prosumers in the EU. Energy Policy 2020, 138, 111212. [Google Scholar] [CrossRef]
- Manso-Burgos, Á.; Ribó-Pérez, D.; Alcázar-Ortega, M.; Gómez-Navarro, T. Local Energy Communities in Spain: Economic Implications of the New Tariff and Variable Coefficients. Sustainability 2021, 13, 10555. [Google Scholar] [CrossRef]
- Scrucca, L.; Fraley, C.; Murphy, T.B.; Raftery, A.E. Model-based clustering, classification, and density estimation using mclust in R; Chapman and Hall/CRC, 2023.
- Mora, D.; Carpino, C.; De Simone, M. Energy consumption of residential buildings and occupancy profiles. A case study in Mediterranean climatic conditions. Energy Efficiency 2018, 11, 121–145. [Google Scholar] [CrossRef]
- Li, Z.; Guo, J.; Gao, X.; Yang, X.; He, Y.L. A multi-strategy improved sparrow search algorithm of large-scale refrigeration system: Optimal loading distribution of chillers. Applied Energy 2023, 349, 121623. [Google Scholar] [CrossRef]
Figure 1.
Monthly aggregation of energy throughout the year for the two seasonality clusters.
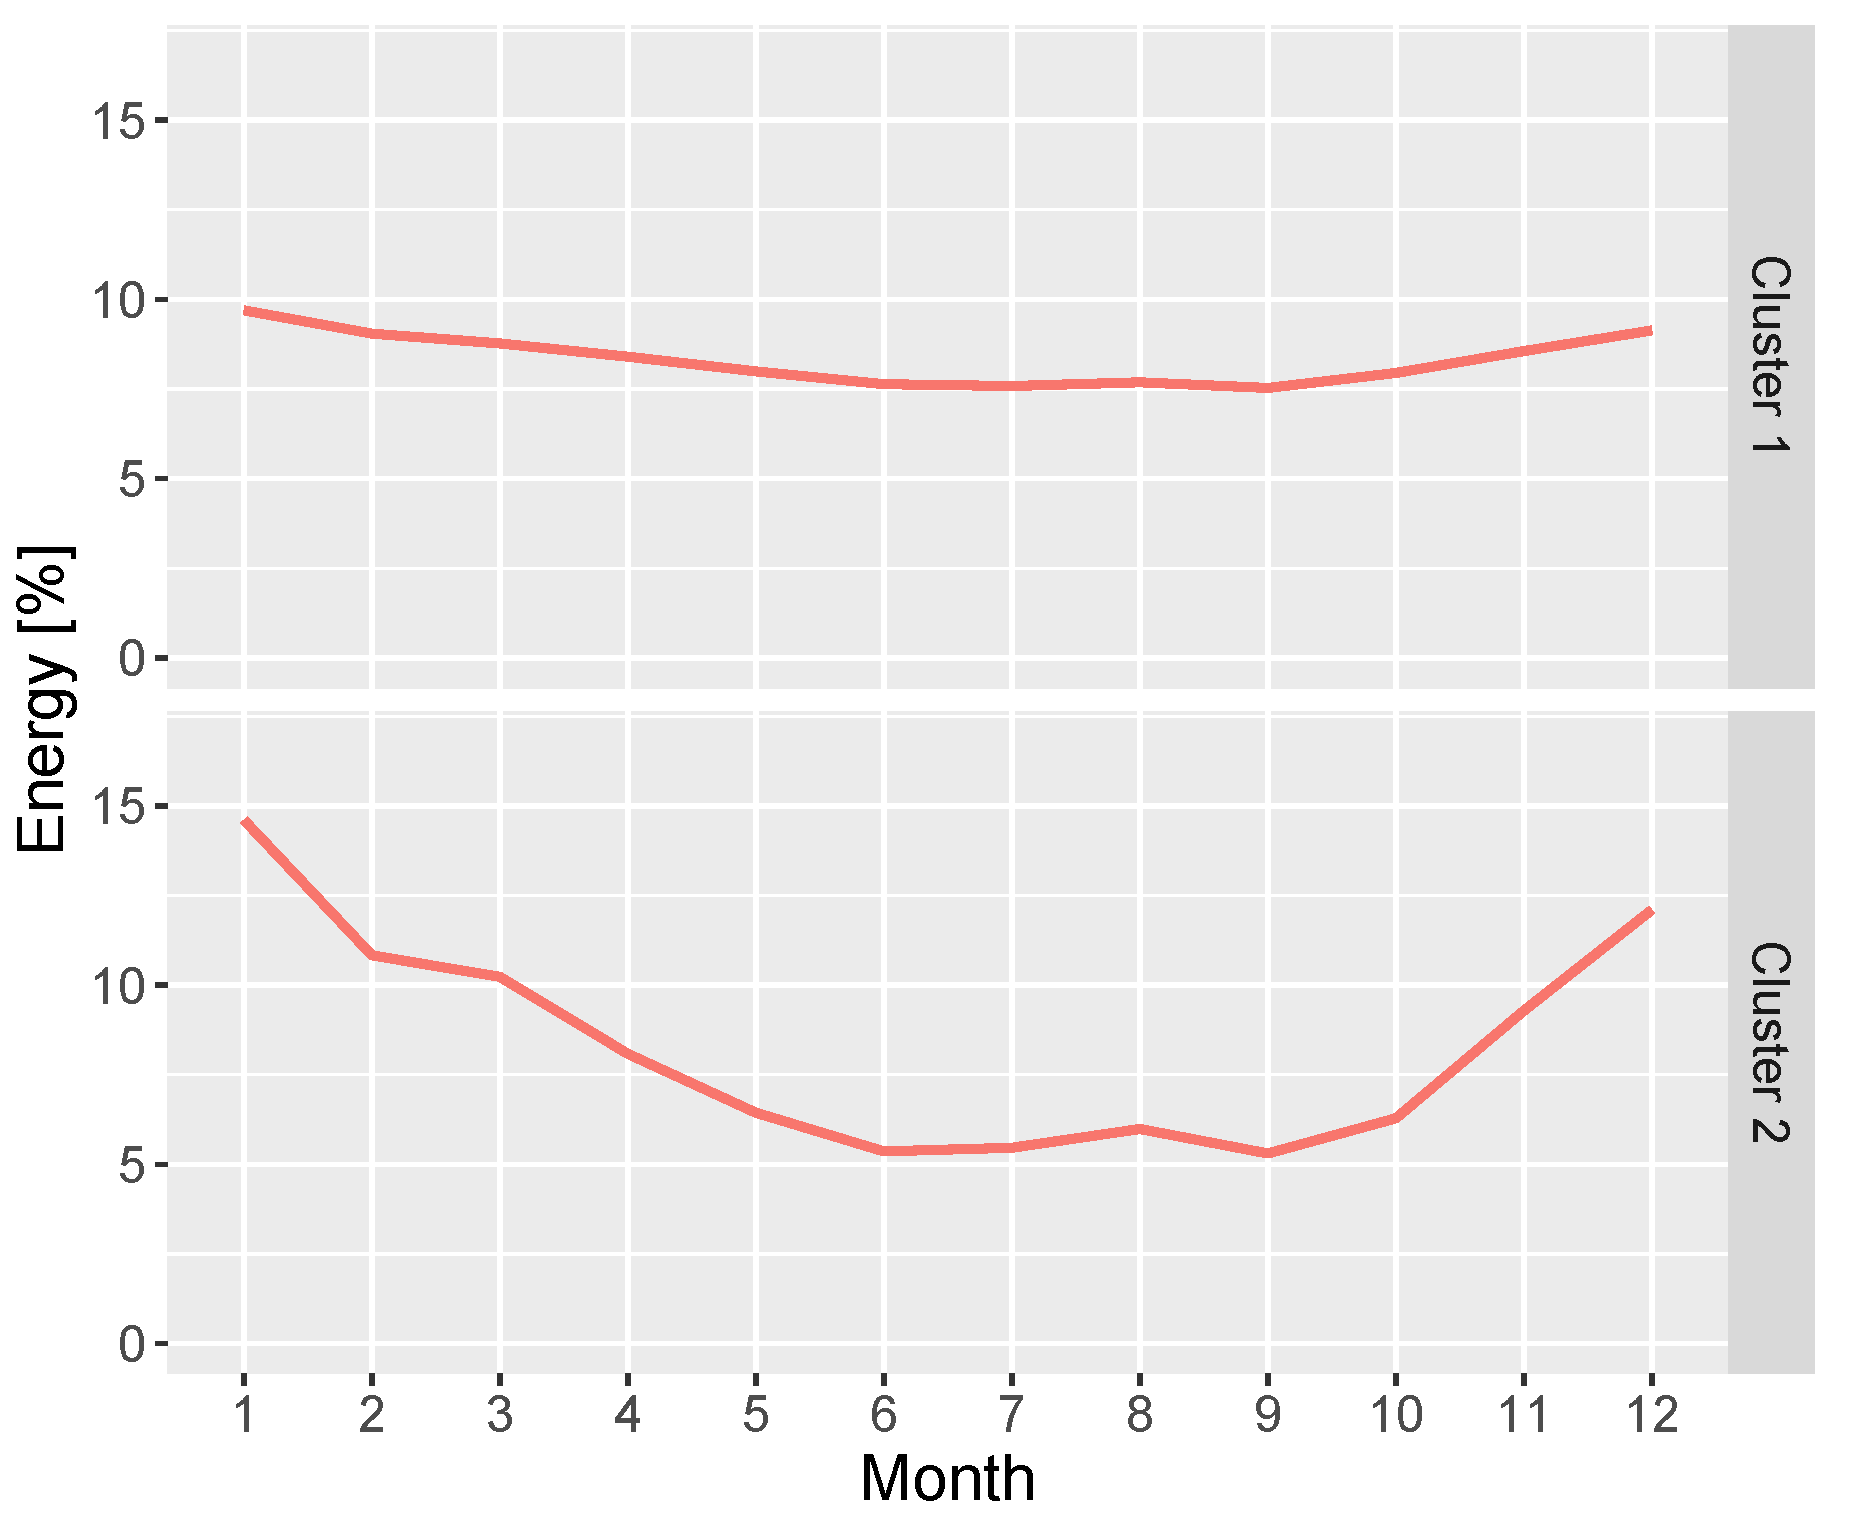
Figure 2.
Patterns.
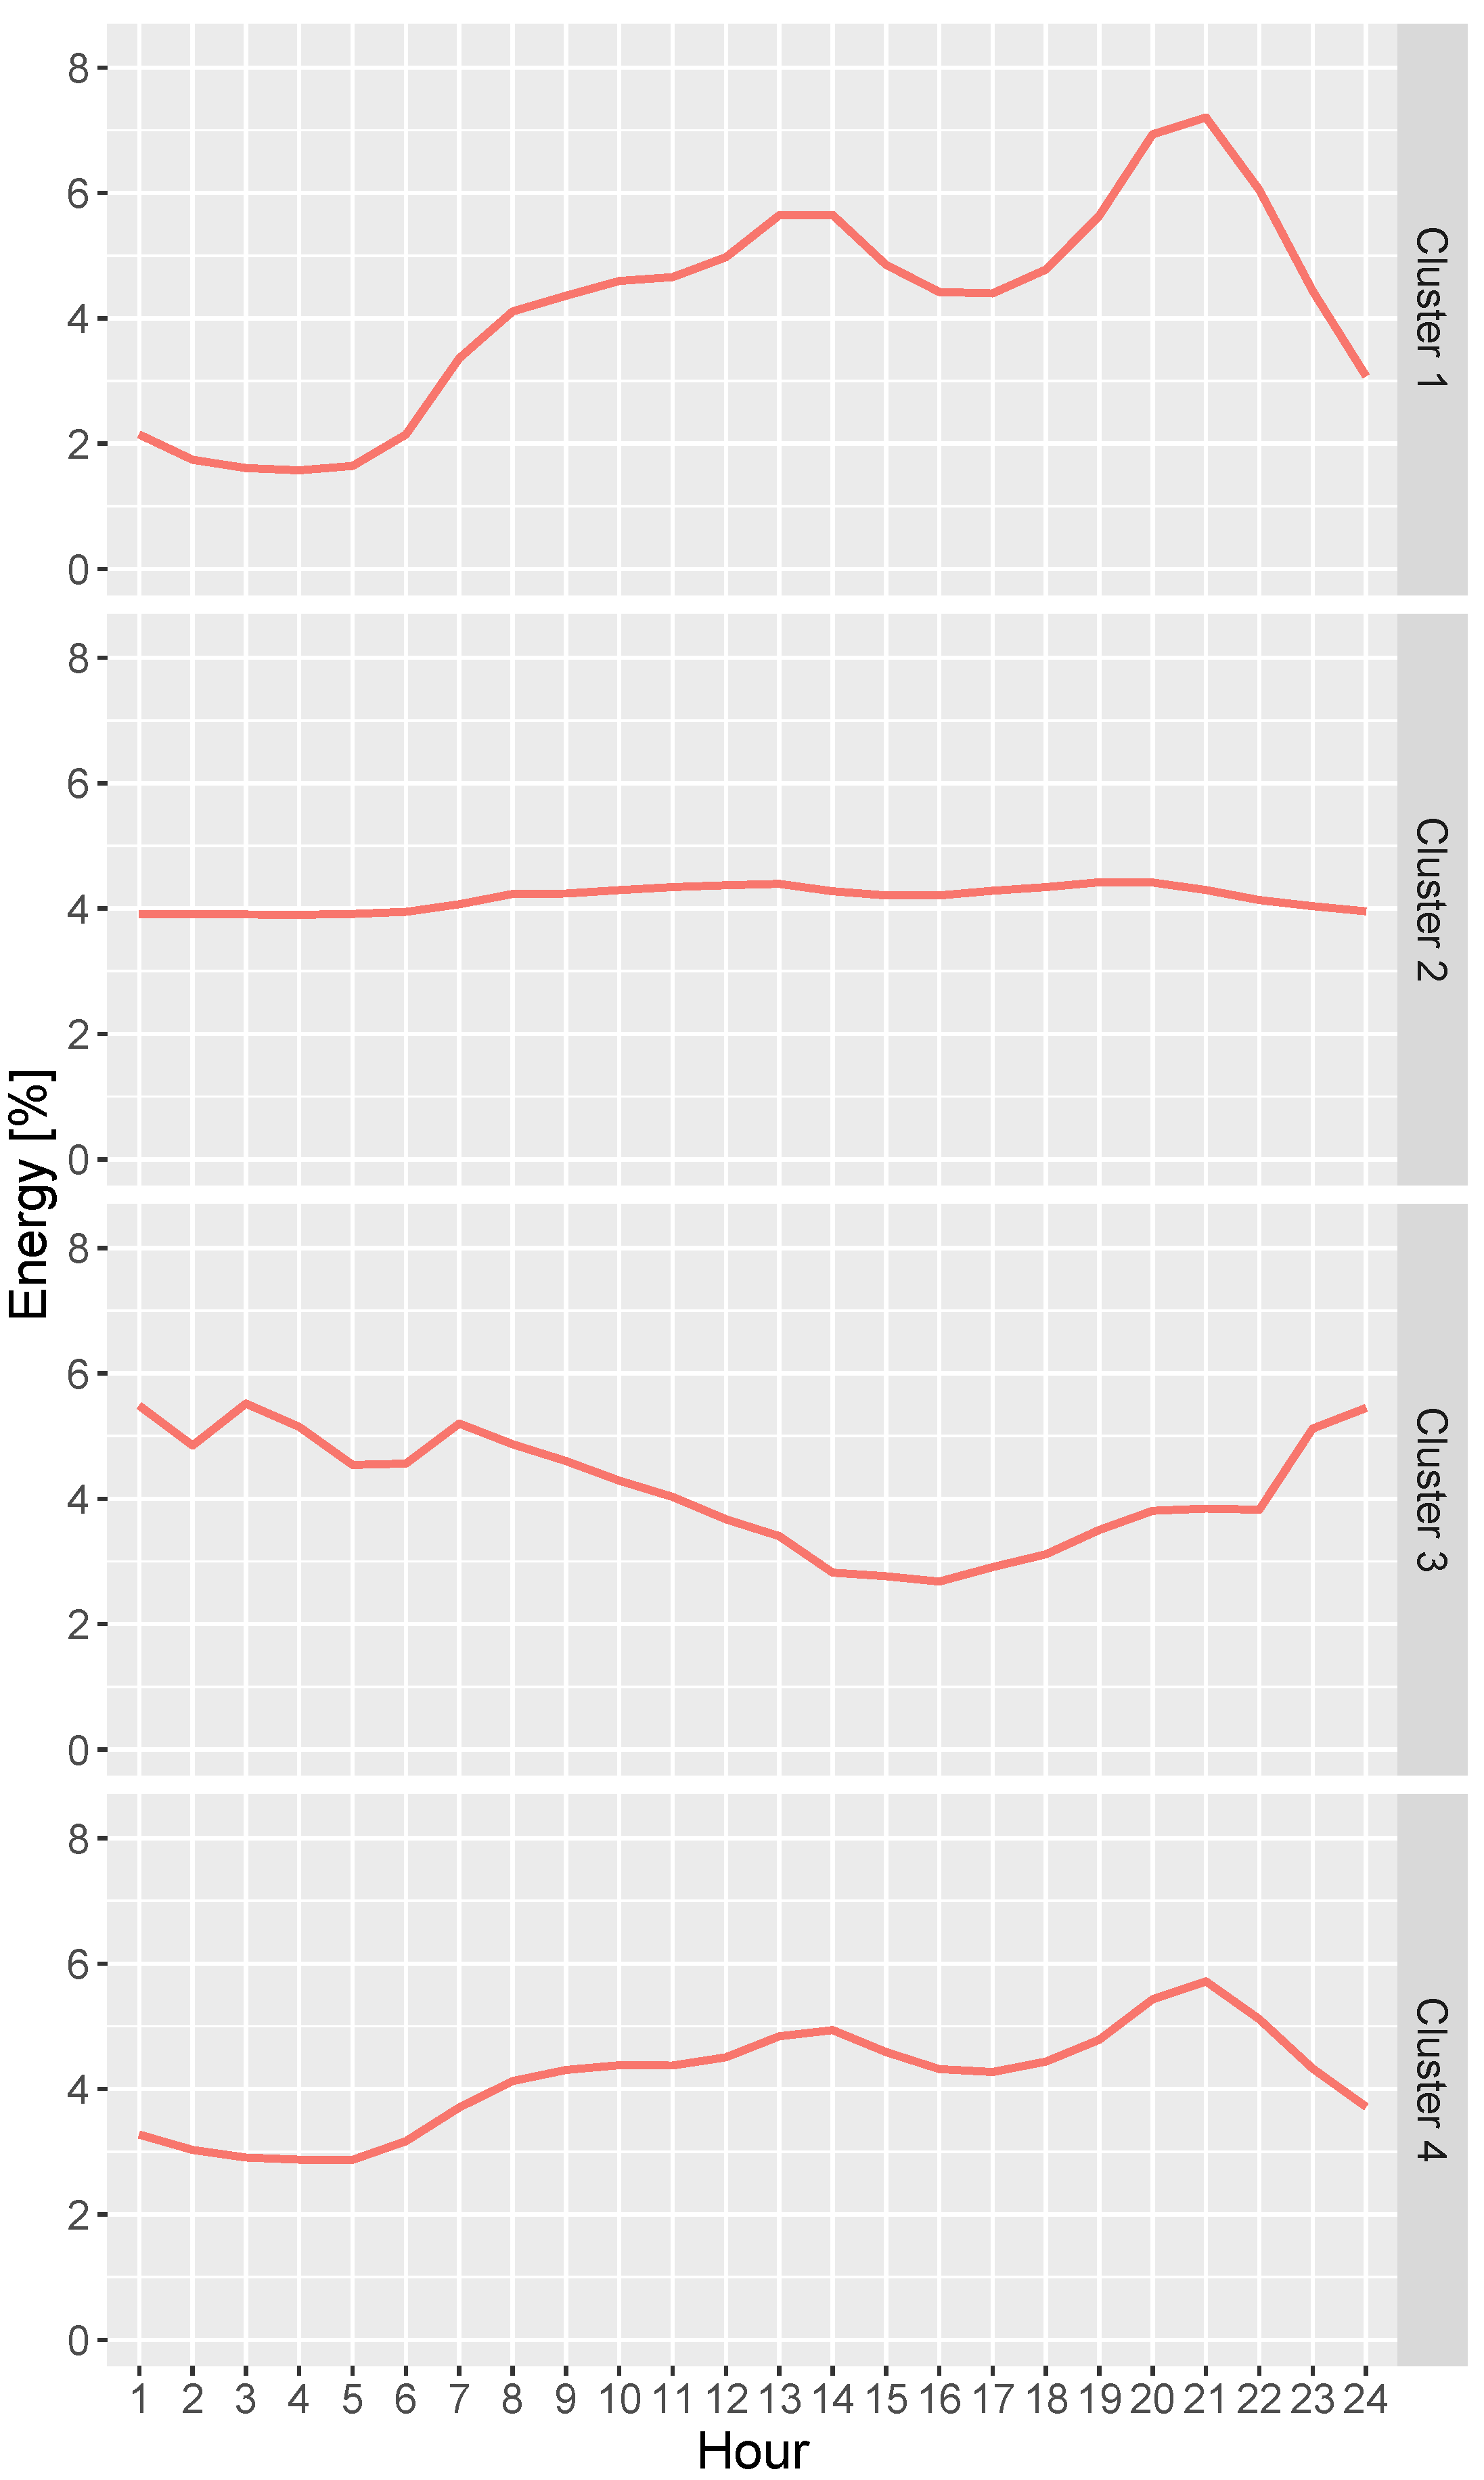
Figure 3.
Surplus for Case 1 (top-left), Case 2 (top-right), Case 3 (bottom-left), and Case 4 (bottom-right), when using the three energy allocation methods.
Figure 3.
Surplus for Case 1 (top-left), Case 2 (top-right), Case 3 (bottom-left), and Case 4 (bottom-right), when using the three energy allocation methods.
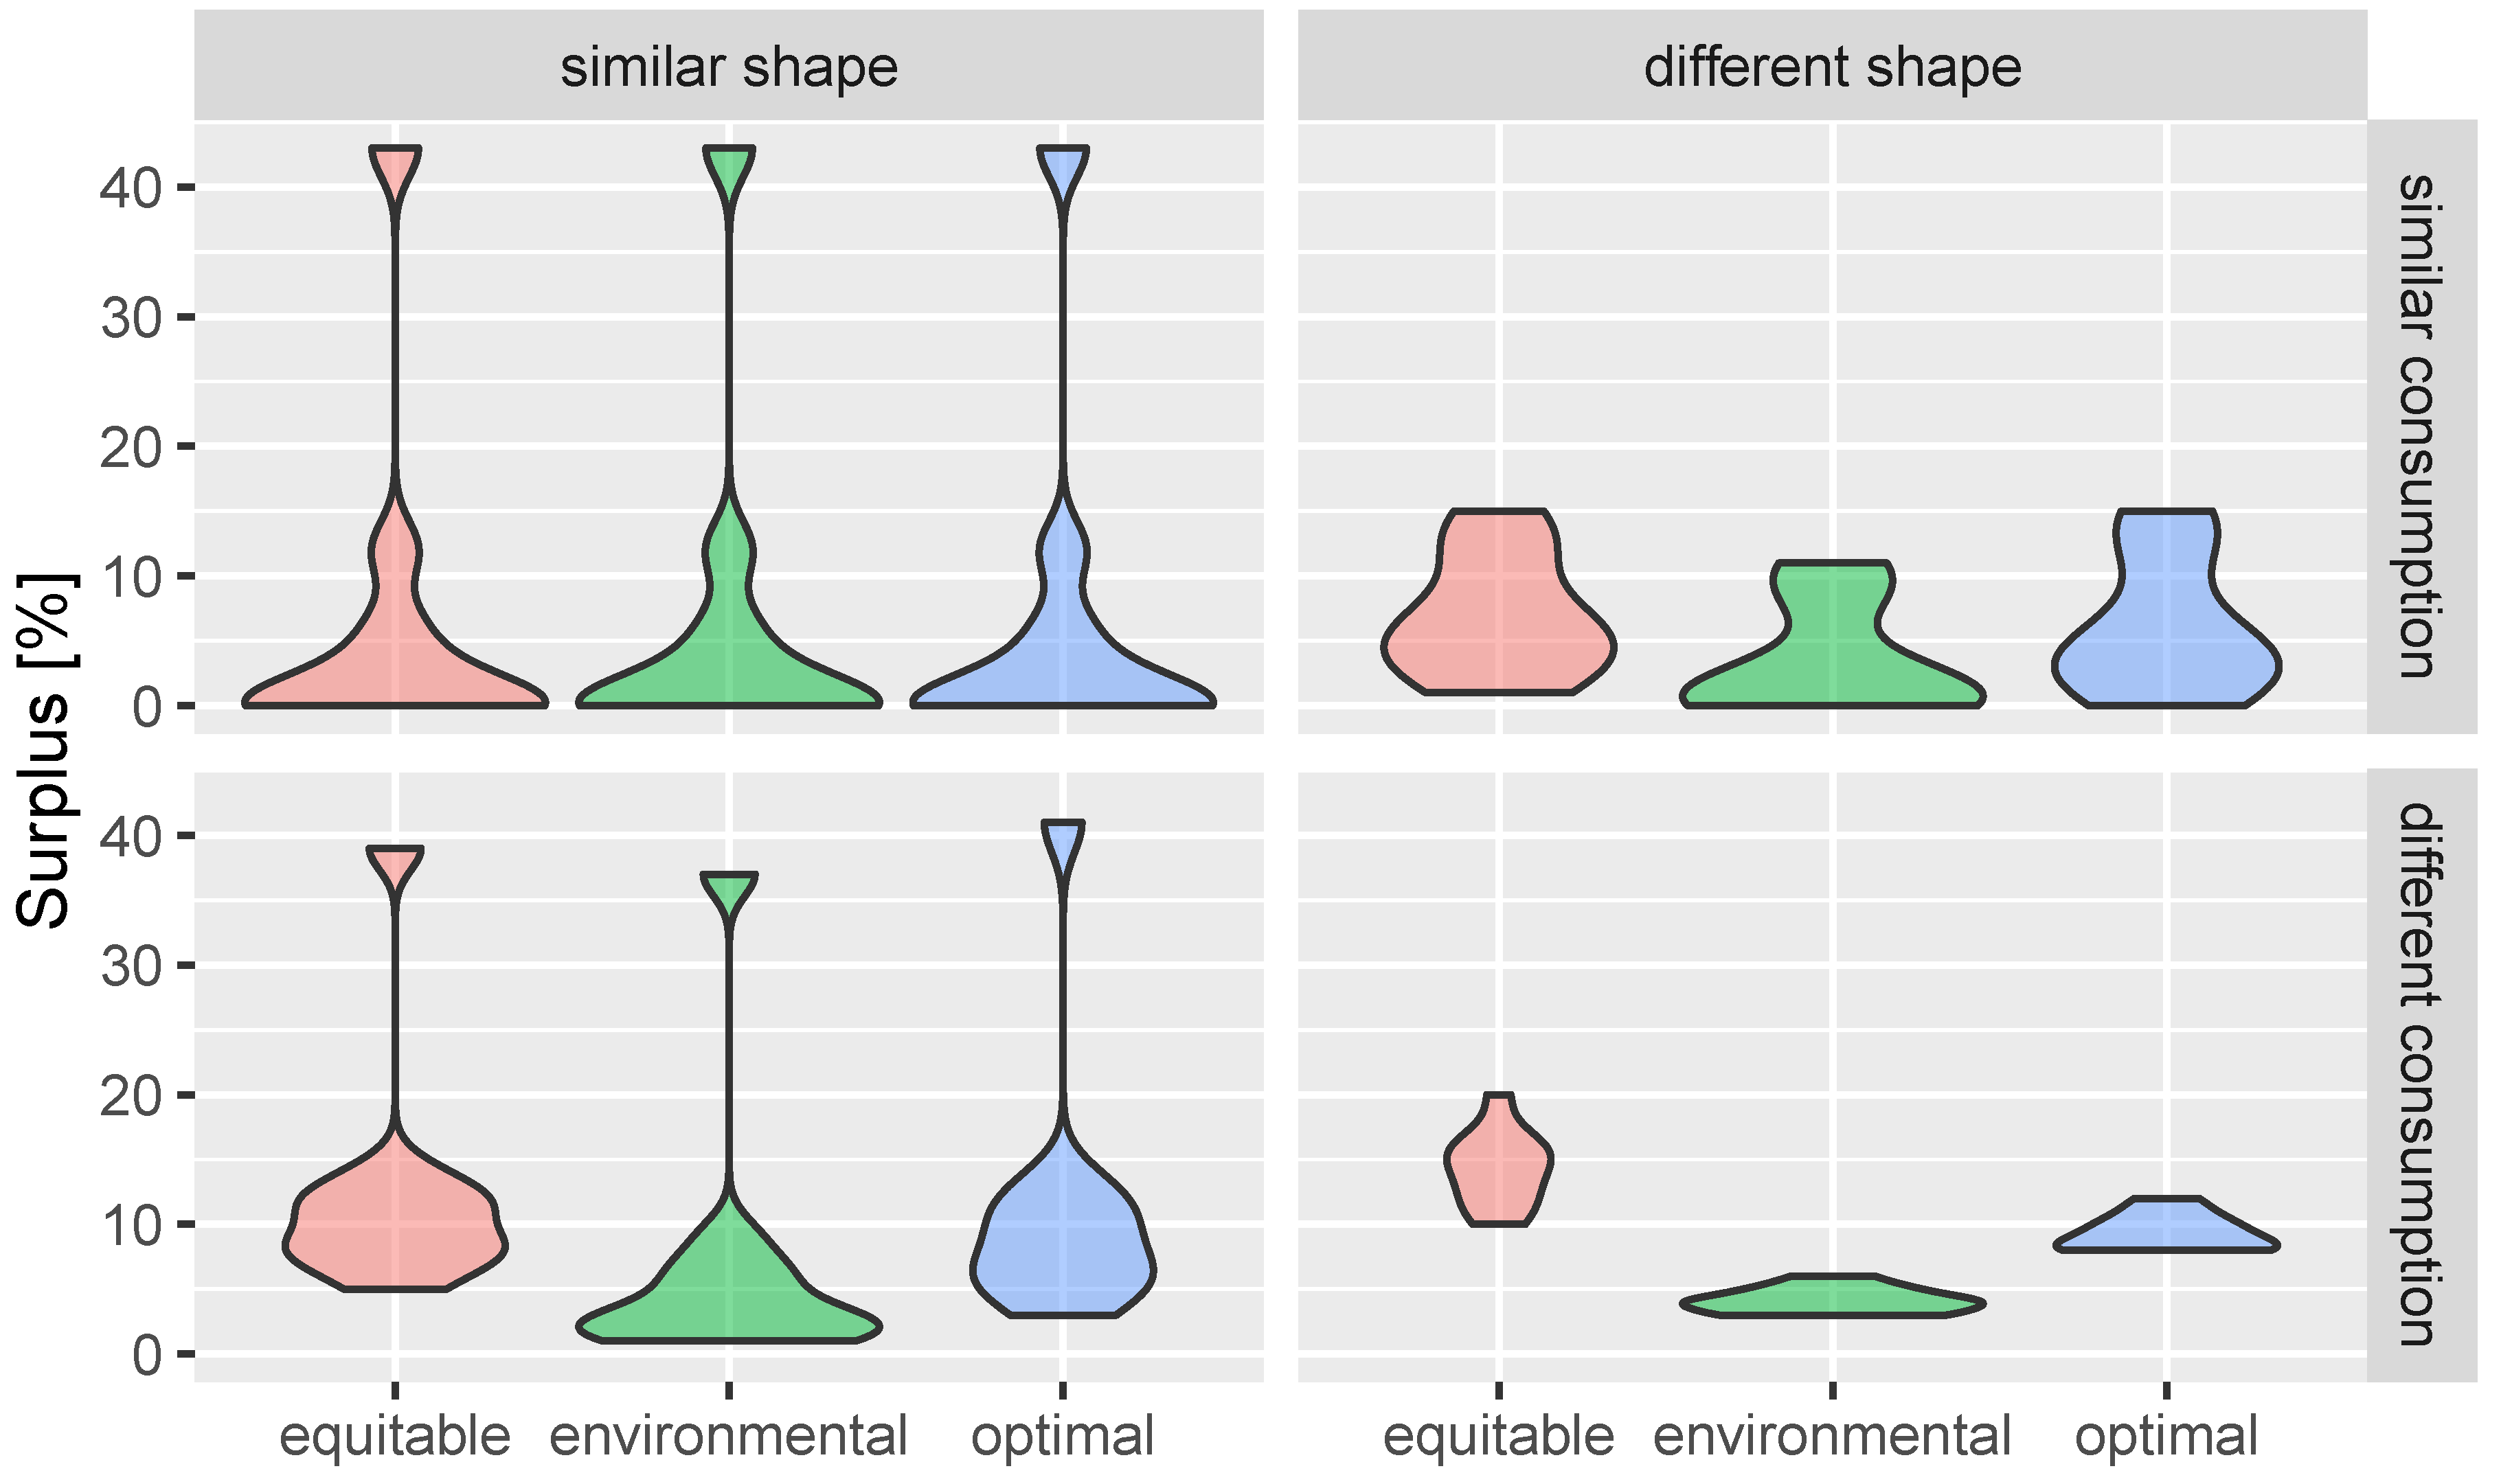
Figure 4.
Payback difference for Case 1 (top-left), Case 2 (top-right), Case 3 (bottom-left), and Case 4 (bottom-right), when using the three energy allocation methods.
Figure 4.
Payback difference for Case 1 (top-left), Case 2 (top-right), Case 3 (bottom-left), and Case 4 (bottom-right), when using the three energy allocation methods.
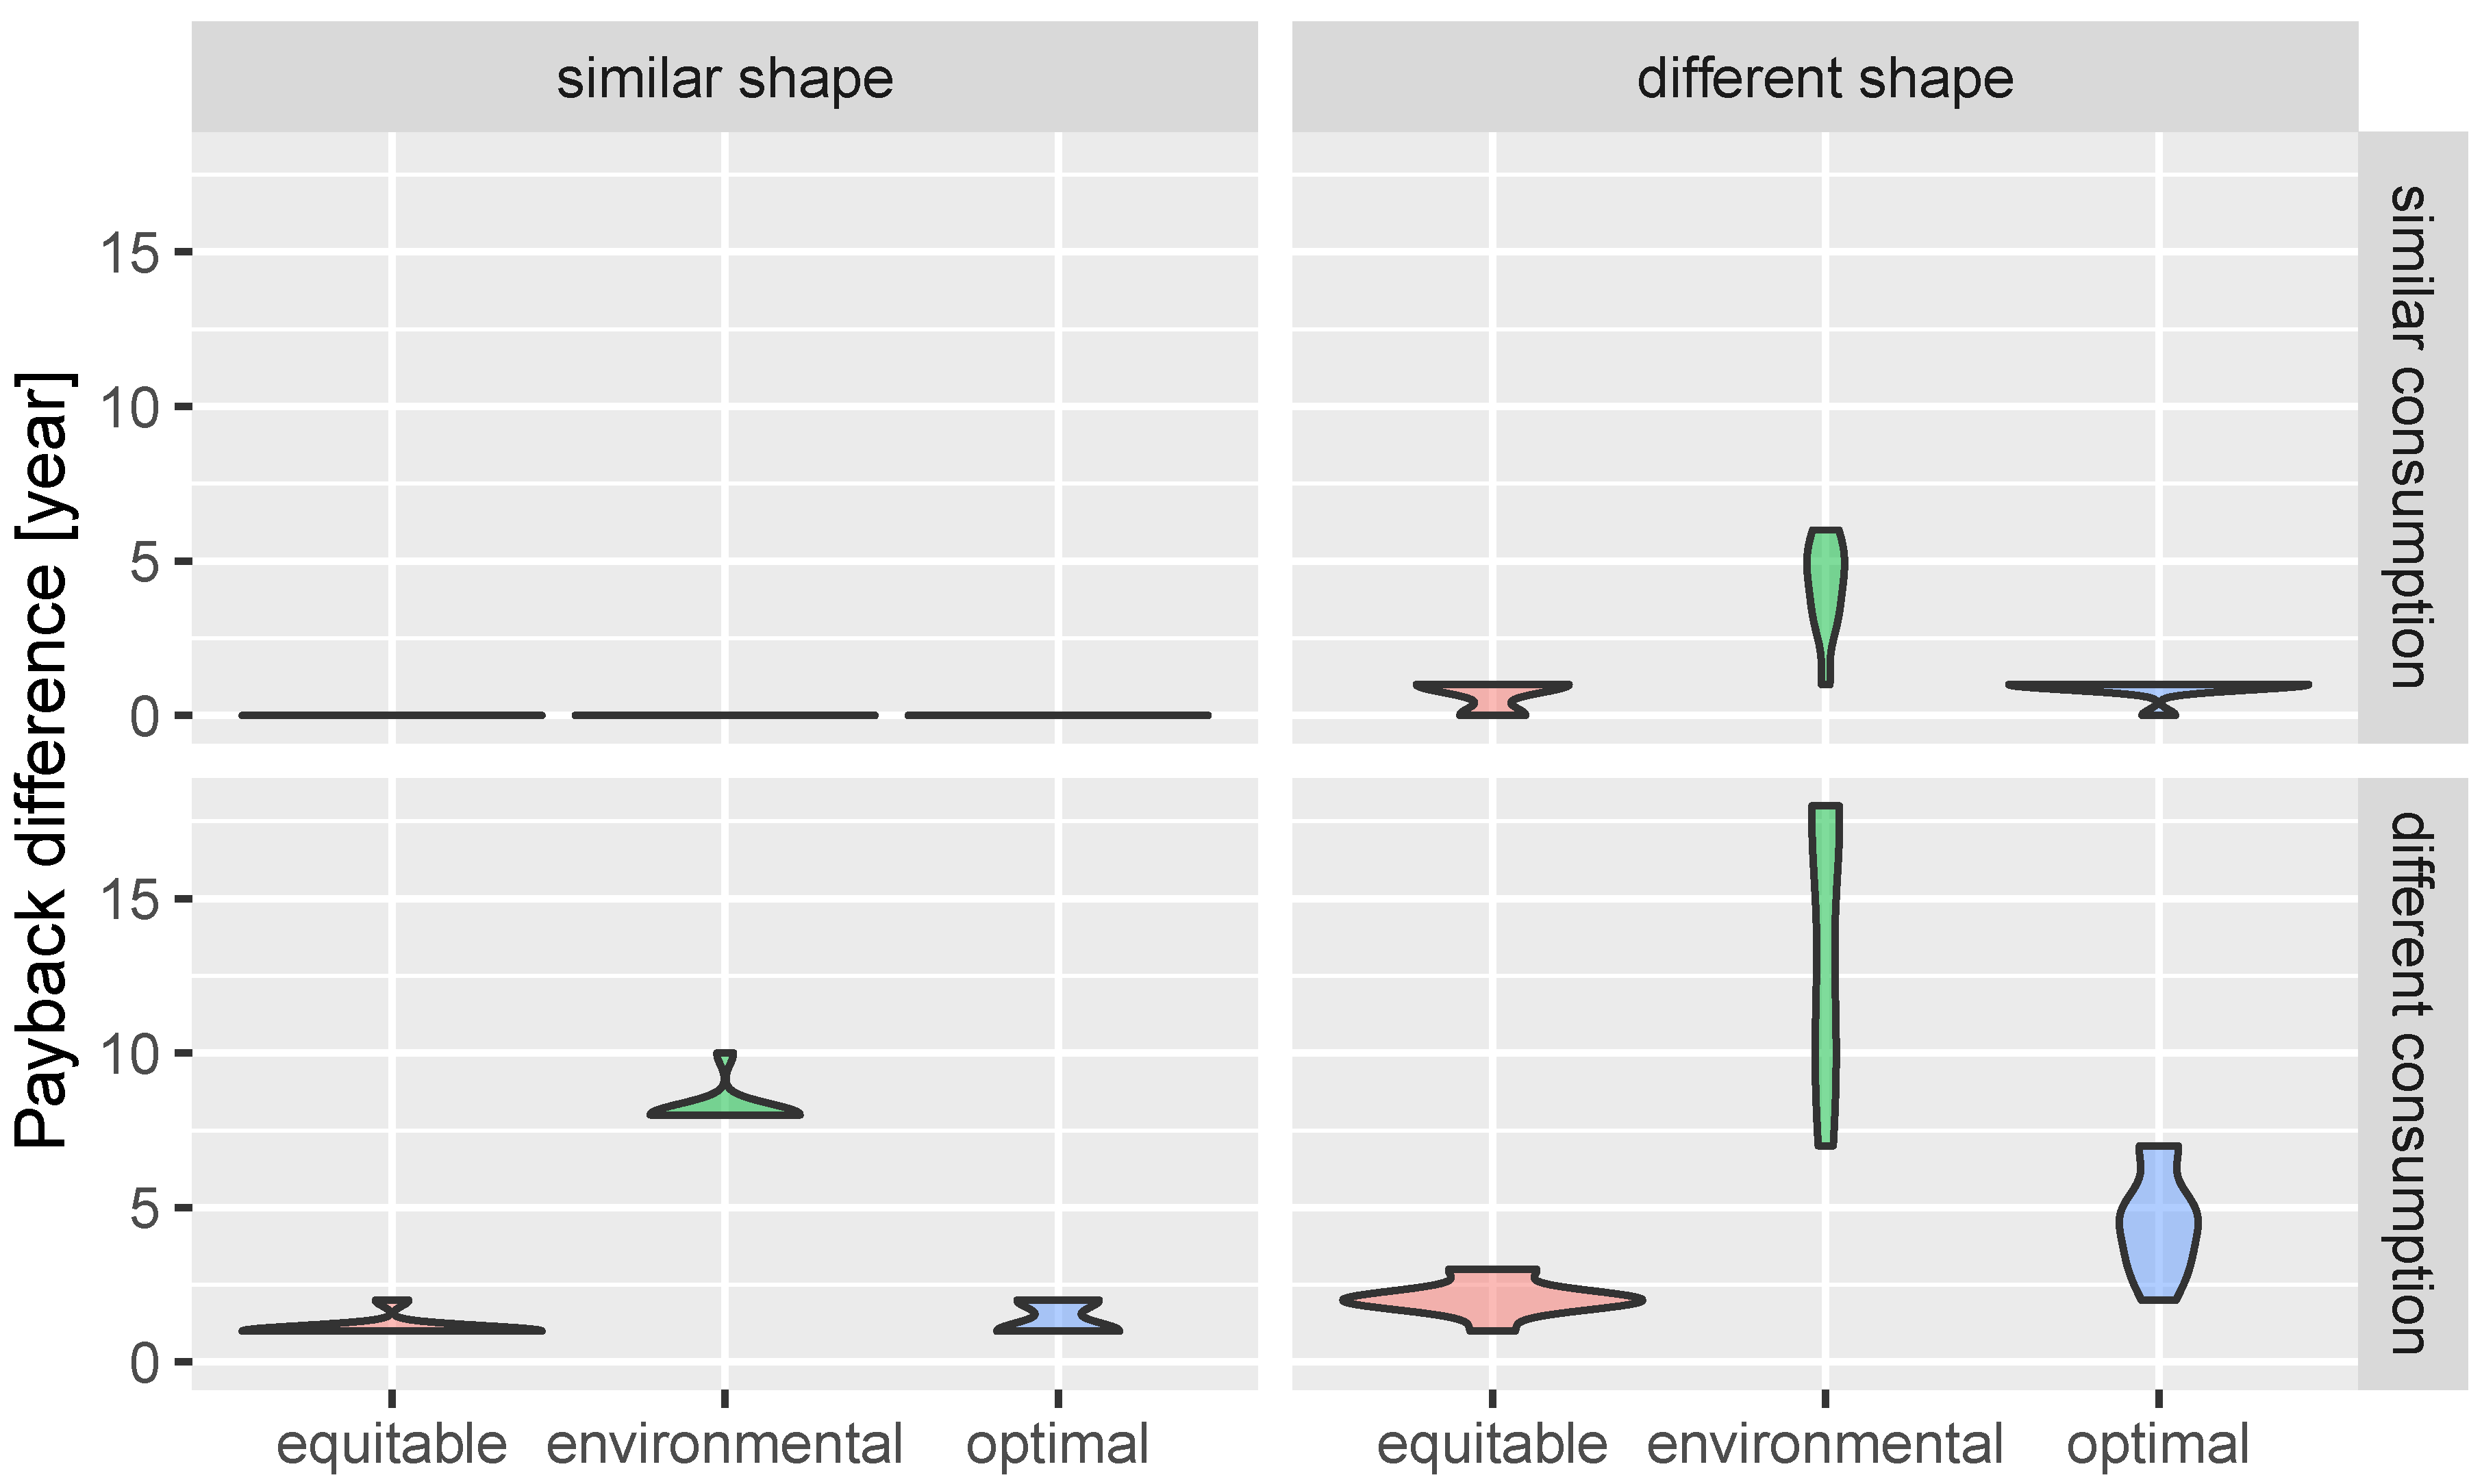
Figure 5.
Surplus for Case 5 (top-left), Case 6 (top-right), Case 7 (bottom-left), and Case 8 (bottom-right), when using the three allocation methods.
Figure 5.
Surplus for Case 5 (top-left), Case 6 (top-right), Case 7 (bottom-left), and Case 8 (bottom-right), when using the three allocation methods.
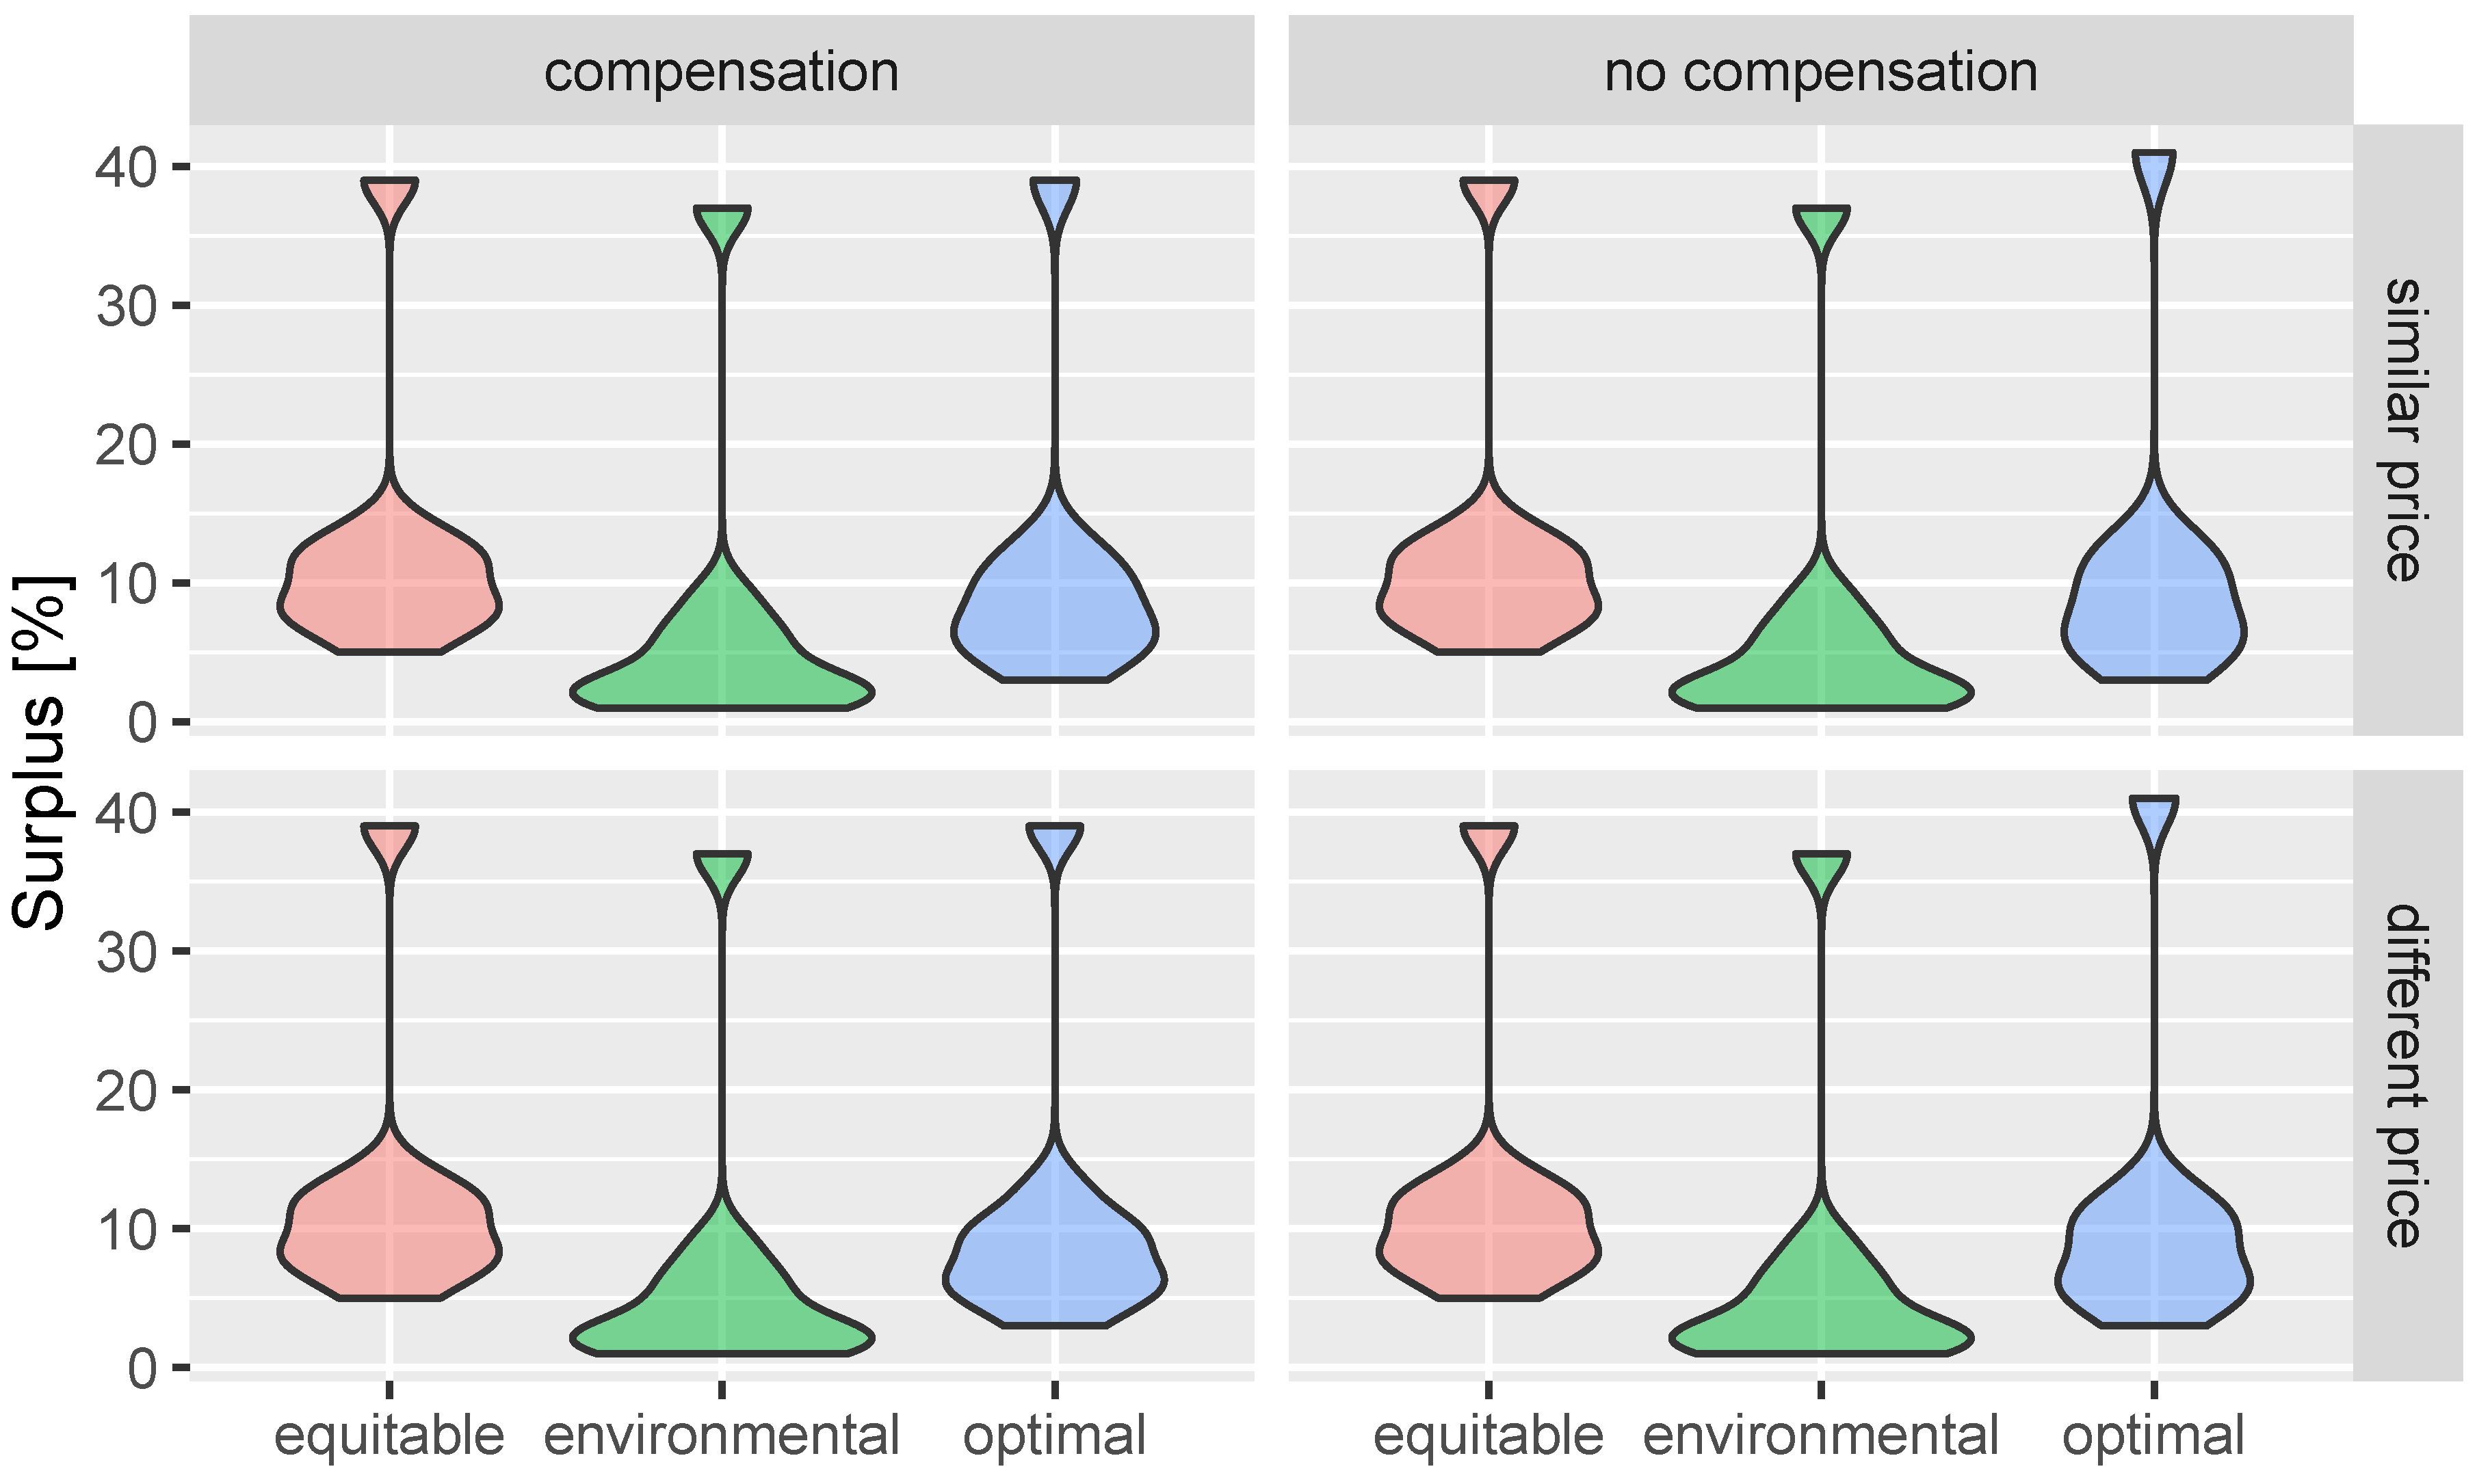
Figure 6.
Payback difference for Case 5 (top-left), Case 6 (top-right), Case 7 (bottom-left), and Case 8 (bottom-right), when using the three energy allocation methods.
Figure 6.
Payback difference for Case 5 (top-left), Case 6 (top-right), Case 7 (bottom-left), and Case 8 (bottom-right), when using the three energy allocation methods.
Disclaimer/Publisher’s Note: The statements, opinions and data contained in all publications are solely those of the individual author(s) and contributor(s) and not of MDPI and/or the editor(s). MDPI and/or the editor(s) disclaim responsibility for any injury to people or property resulting from any ideas, methods, instructions or products referred to in the content. |
© 2025 by the authors. Licensee MDPI, Basel, Switzerland. This article is an open access article distributed under the terms and conditions of the Creative Commons Attribution (CC BY) license (http://creativecommons.org/licenses/by/4.0/).
Copyright: This open access article is published under a Creative Commons CC BY 4.0 license, which permit the free download, distribution, and reuse, provided that the author and preprint are cited in any reuse.


