
Submitted:
16 June 2025
Posted:
17 June 2025
You are already at the latest version
Abstract
In recent years, microalgae have gained significant biotechnological importance as a sustainable source of various metabolites of industrial interest. Among these, paramylon, a polysaccharide produced by the microalga Euglena gracilis, stands out for its diverse applications in biomedicine and pharmaceuticals. E. gracilis is an adaptable secondary eukaryote capable of growing photoautotrophically, heterotrophically and mixotrophically. During photoautotrophic growth, varying light conditions impact biomass and paramylon production. To investigate the effects of varying illumination more thoroughly, we designed and built a modular photobioreactor that allowed us to evaluate simultaneously the photoautotrophic growth of E. gracilis under twelve different light conditions: seven single spectrum lights (Ultraviolet, Royal Blue, Blue, Green, Red, Far-Red, and Infrared) and five composite spectra lights (3,000K, 10,000K, 30,000K white lights, Amber, and “Full-spectrum”). 24-day growing kinetics were recorded, and growth parameters calculated for each light regime. Additionally, pigment composition, photosystem II oxygen evolution, and paramylon production were determined under each light condition. The designed Ankaa photobioreactor enabled us to follow the adaptation of E. gracilis to several specific light regimes. Our results suggest a differential paramylon production profile between logarithmic and stationary phases that is strongly dependent on illumination. Additionally, far-red component enhances paramylon production, specially, during stationary phase.
Keywords:
Euglena gracilis
; paramylon production
; photobioreactor
; spectrum optimization
; light adaptations
; far-red light
1. Introduction
Population growth inherently generates an increasing energy demand, which is supplied in approximately 90% by burning fossil fuels [1]. This activity, along with the economic progress of societies based on industrialization, are the leading causes of the excessive increase in greenhouse gas emissions, with atmospheric CO2 being the most abundant, strongly contributing to global warming, which unleashes extreme weather events that destabilize the ecological balance and lead to the destruction of biodiversity [2]. One way to reduce large amounts of atmospheric CO2 is through its fixation into organic compounds. In this sense, photosynthetic organisms have great importance, since they are capable of synthesizing nutrients and biomass from CO2 and water using light energy. Indeed, the conversion of energy through oxygenic photosynthesis is what sustains all living forms on the planet [3]. From the current climate situation perspective, photosynthetic capacity plays an essential role, since microalgae have 10-50 times greater carbon-fixing capacity than terrestrial plants [4,5]. Microalgae are therefore considered important producers of biotechnological relevant compounds interest due to their rapid growth, ease of cultivation, and high photosynthetic efficiency, which contributes significantly to biomass production [6]. Furthermore, the generated biomass is an excellent source of biofuels and bioactive metabolites, such as pigments, proteins, fatty acids, and carbohydrates, whose synthesis is closely related to growth conditions [7].
E. gracilis is one of the most characterized organisms in the euglenoid group due to its metabolic versatility and biotechnological potential. It is a free-living, biflagellate, photosynthetic eukaryote with one active emergent flagellum and the other short and sheltered in a deep pocket or reservoir [8,9]. This species can be grown in heterotrophic, mixotrophic, or photoautotrophic conditions; its ability to adapt to various environments allows its ubiquitous distribution in freshwater. These adaptations come from the genetic diversity attributed to its secondary endosymbiotic origin [10]. E. gracilis can produce a variety of metabolites, including polyunsaturated fatty acids, provitamin A, vitamins C and E, wax esters, and paramylon, which is a carbohydrate β-1,3-glucan [11,12], similar to curdlan synthesized by Rhizobium species [13]. Paramylon serves as an energy reserve carbohydrate stored in membrane-bound granules within the cytoplasm. These granules are 1-6 µm long, surrounded by a biomembrane, and exist in various numbers and species-specific forms [9,11]. The amount of paramylon accumulated in the cells of E. gracilis can represent up to 60-70% of its dry weight [14], reaching its maximum levels in heterotrophic and mixotrophic cultures by supplementing the growth media with carbon sources such as acetate, ethanol, pyruvate, propionate, lactate, succinate, glutamate, and glucose [15,16,17,18,19].
The biomedical applications of paramylon have attracted interest due to its potential as a non-metabolizing fiber that helps reduce obesity, facilitates the healing of acute liver injuries, and exhibits immunostimulatory and antimicrobial activities [17,20,21]. In addition, paramylon hydrogels demostrated to possess anti-inflammatory properties and the ability to accelerate wound repair by promoting angiogenesis [22,23]. One of the main factors affecting the growth and production of compounds in microalgae is the quantity and quality of light [24]. Previous analyses have shown that E. gracilis biomass and paramylon production are enhanced during photoautotrophic growth under mixed red and blue light ratios [25]. Considering that only composite spectra have been evaluated, various light conditions still require ecploration. The aim of this work was to design and construct a system to assess biomass and paramylon production of E. gracilis evaluating twelve different light spectra simultaneously: seven single spectra and five composite spectra. Furthermore, oxygen evolving capacity, cellular respiration, and paramylon production were determined under each light condition.
2. Culture System Design
Figure 1A presents a schematic illustration of the Ankaa Photobioreactor System (PBR). This PBR consists of twelve compartments measuring 11.5 x 15.5 x 14.5 cm (length x width x height), designed to culture twelve 25-125 mL Erlenmeyer flasks simultaneously. Each compartment is equipped with (1) a chiller plate to maintain a constant temperature inside each flask, (2) an air-based heat sink and (3) a specific light-emitting diode (LED) module. A 24-L water tank connected to a C-250 water chiller (Boyu) regulates the temperature (16–35 °C) of the entire system. Chilled water recirculates (1400 L/h) through each heat sink plate located under the culture flask with the assistance of a SP-2500 water pump (Boyu). The heat dissipation system features 4 x 4 cm fans located in the upper polycarbonate cover at the center of each compartment. Additionally, a fan is positioned next to each LED to extract any heat generated by the LED module (Figure 1A). Finally, the light system features twelve different 3W LED modules which can be classified as either single or composite spectrum (Figure 1B). Seven compartments contain single spectrum lights distributed throughout the visible light spectrum: Ultraviolet (UV, emission peak: 395 nm), Royal Blue (RB, emission peak: 437 nm), Blue (B, emission peak: 460 nm), Green (G, emission peak: 520 nm), Red (R, emission peak: 635 nm), Far Red (FR, emission peak: 733 nm), and Infrared (IR, emission peak: 850 nm) (Figure 1B, upper panel). The other five compartments contain the composite spectrum lights: 3,000 K (3K), 10,000 K (10K) and 30,000 K (30K) white lights, Amber light (A), and “Full-spectrum” light (F) (Figure 1B, lower panel).
3. Material and Methods
3.1. Culture Conditions and Growth Curves
Euglena gracilis (SAG 1224-5/25) was obtained from the University of Göttingen (Sammlung von Algenkulturen, Germany). Cells were grown in continuous light conditions, illuminated with the corresponding LED module at an intensity of 10 μmol photons m-2 s-1. Cells were cultured using 125 mL Erlenmeyer flasks containing 50 mL of liquid Tris-minimum-phosphate medium (TMP) at pH 7.0, supplemented with a vitamin mix (biotin 10-7%, B12 vitamin 10-7%, and B1 vitamin 2x10⁻⁵% w/v) at 20 °C. The culture cell development was followed in a Neubauer double-ruled counting chamber. A volume of 10 μl of cell suspension was loaded into the chamber, and counting was performed in a microscope (Olympus CH2) with an EA 40x objective. Growth data were adjusted to a Gompertz growth model using GraphPrism software.
3.2. Pigment Quantification
Two milliliter samples (~8 x 10⁵ cells) were collected from each culture during the logarithmic growth phase and room-temperature absorbance spectra were recorded using a Cary 6000 UV-vis spectrophotometer (Agilent). After harvesting the cells, 1 mL of absolute methanol was added, and the pellet was vortexed. The pellet was then incubated in an ice bath in complete darkness for 12 h. After this period, centrifugation was performed at 6700 xg/10 min to separate the insoluble material, the supernatant was recovered and room-temperature absorbance spectra were measured. The amounts of chlorophyll a/chlorophyll b and total carotenoids were determined according to Ritchie [26] and Caspers [27], respectively.
3.3 Oxygen Evolution and Oxygen Consumption
Oxygen production was measured in each light condition using the corresponding growth-light, with a Clark-type oxygen electrode (Oxygraph+, Hansatech) as previously described [28]. In short, 1.5 x 10⁷ cells were harvested in their logarithmic phase by centrifugation (2200 xg/5 min) and resuspended in 1 mL of fresh culture medium (TMP) supplemented with 2 mM NaHCO3 from a freshly prepared 20 mM stock solution and filtered by a 0.22 µm PVDF membrane. All measurements were carried out at 25 ±1 °C and followed for 10 min. Rates for mitochondrial respiration were measured over a 10 minutes period by dark incubation after oxygen production measurements. Finally, the cell suspension was recovered and chl a was quantified as above described.
3.4. Paramylon Quantification
The extraction and total paramylon quantification were determined as described by Rodríguez-Zavala et al. [19] with slight modifications. Briefly, 7.6 x 10⁵ cells from logarithmic and stationary culture phases were collected by centrifugation at 2200 xg/20 min. 1 mL of 1% SDS was added to the pellet and vortexed for 1 min prior to a 15 min incubation in boiling water. Then, the samples were incubated in an ice bath for 10 min, the paramylon pellet was recovered by centrifugation at 2200 xg/20 min, and the supernatant was discarded. This step was repeated twice with an additional 1% SDS wash. The clean paramylon pellets were resuspended in 1 mL of NaOH 1 M and vortexed. Samples of 40 μL were transferred to a clean tube, followed by the addition of 600 μL phenol 5% and 2.5 mL of 95% H2SO4. The samples were incubated for 20 min at 25°C, and the absorbance at 490 nm was determined. The concentration of paramylon was determined against a calibration curve (0-100 μg) of dextrose (USP standard).
3.5. Statistical Analysis
A total of three biological replicates were analyzed. One-way ANOVA tests were performed followed by post-hoc Dunnett's multiple comparisons test between each condition against the rest. For statistical significance p-value thresholds were defined as ns: 0.1234, *: 0.0332, **: 0.0021, ***:0.0002, ****: <0.0001. Statistical analysis was performed using GraphPrism software. Full statistical analysis raw data is presented in Supplementary Information, for clarity, the p-value threshold of 0.0002 was used to define statistical significance in the graphs presented in the main text.
4. Results
- Light wavelength as an environmental factor of Euglena gracilis growth
In order to evaluate the light-adaptation capacity of E. gracilis, we tested phototrophic growth using twelve different light conditions. An inoculum of 7x10⁵ 3K-acclimated cells 7x10⁵ was transferred to fresh medium and grown under seven single wavelengths and five composite spectra lights. Twenty-four-day growth kinetics were followed for each condition. Typical three-phased growth curves were observed for most of the conditions (Figure 2A and 2B), logarithmic growth phase was followed between days 5-14 for UV, RB, B, FR, 3K, 10K, 30K, A, and F light regimes, while logarithmic phase was shifted to 7-20 day and above day 20, for R and G light conditions, respectively. No detectable growth can be achieved with IR light regime. Among the single spectra lights, RB and FR reached the largest biomass production (above 8.5 x 10⁵ cells/mL) followed by B light (~7.5 x 10⁵ cells/mL), UV and R regimes overcame the 3.5 x 10⁵ cells/mL value at the start of the stationary phase (Figure 2A). The largest cell density was reached with 3K, 10K and F composite spectra (above 9 x 10⁵ cells/mL), while A and 30K light regimes overcame the 7.0 x 10⁵ cells/mL value at the start of the stationary phase (Figure 2B). Growth parameters, i.e., growth rate and doubling time, were calculated. The larger growth rate values were observed in RB, B, FR lights (Figure 2C) and 3K, 10K, 30K and F composite spectra conditions (Figure 2E), followed by UV, R and A spectra, leaving G condition with the lower value (Figure 2C). In this way, doubling time under green light is the largest (~5.6 ± 0.9 days) among all the tested light regimes (Figure 2D/F).
- E. gracilis adapts its Pigment composition as an acclimatization strategy to specific light regimes
To get insights about the light adaptation consequences in E. gracilis, we characterized the pigment composition of cells grown under each light regime. Room temperature absorption spectra indicate a slightly different pigment content between each growth condition (Figure 3A and 3E). Interestingly, the spectra from single wavelength adapted cells to B, G, and R conditions present differences in the Soret band (~480 nm) compared to UV, RB and FR conditions (Figure 3A, dark arrowhead). Likewise, an absorption valley between 530-560 nm is deeper in R and B adapted cells (Figure 3A, purple arrowhead). Additionally, a red-shifted absorption signal above 710 nm is observed mainly in the FR condition, especially when compared to UV and R spectra (Figure 3A, red arrowhead). In contrast, no difference in absorption above 710 nm was distinguishable when comparing composite spectra adapted cells (Figure 3E, red arrowhead). In this way, the difference around Soret band is only noteworthy in 3K-adapted cells (Figure 3E, dark arrowhead) and the 530-560 nm absorption valley is deeper under A and 3K regimes (Figure 3E, purple arrowhead). To further explore these differences in pigment composition, chlorophyll a (chl a), chlorophyll b (chl b) and total carotenoid content were determined (Figure 3B and 3F). No notable difference was observed between the single wavelength (Figure 3B) and composite spectra treatments (Figure 3F). In the same line, chl a/b ratio was similar among all light treatments (Figure 3C and 3G). Total carotenoids quantification revealed that the content of these pigments is distributed between 16-22% among all the samples without any striking difference (Figure 3D and 3H) being the UV adapted cells which present the larger carotenoid accumulation.
- E. gracilis photosystem II can use different wavelengths for oxygen evolution
To evaluate the photosynthetic capacity, especially regarding photosystem II functionality of the specific-light acclimated cells, oxygen evolution was measured in the middle of the logarithmic phase using the same light conditions where each culture had grown (Figure 4A). With the exception of IR, all the tested light spectra promoted oxygen production when irradiated with their corresponding LED. Moreover, mitochondrial functionality was tested as O2 consumption by the electron transport chain (mitochondrial respiration) when cells were incubated in the dark (Figure 4B). The composite spectrum 30K along with the single spectrum G had the highest rates of oxygen production. Oxygen production rate was followed by the composite spectra F, A, 10K, and the single spectra B and FR. Finally, the least prominent lights for O2 production were R, 3K, and RB (Figure 4C and 4E). Error bars in Figure 4C-F represent the average rate of O2 production or consumption among the first three minutes, where photosynthesis oxygen evolution and respiration were followed. In this context, it is evident that while some light spectra, such as 3K, UV, and RB, show only minor deviations, other light regimes exhibited large fluctuations in the rate of O2 production over time. Also, mitochondrial respiration rates were the highest for the composite spectra 10K, 30K and A along with the single spectra UV, G and R, followed by the 3K and F composite spectra and the RB, B and FR single spectra (Figure 4D/F). Rounding up, both photosynthesis and respiration machinery were functional and there was a net production of O2 in all light regimes.
- Far-red improves paramylon production in photoautotrophically grown E. gracilis
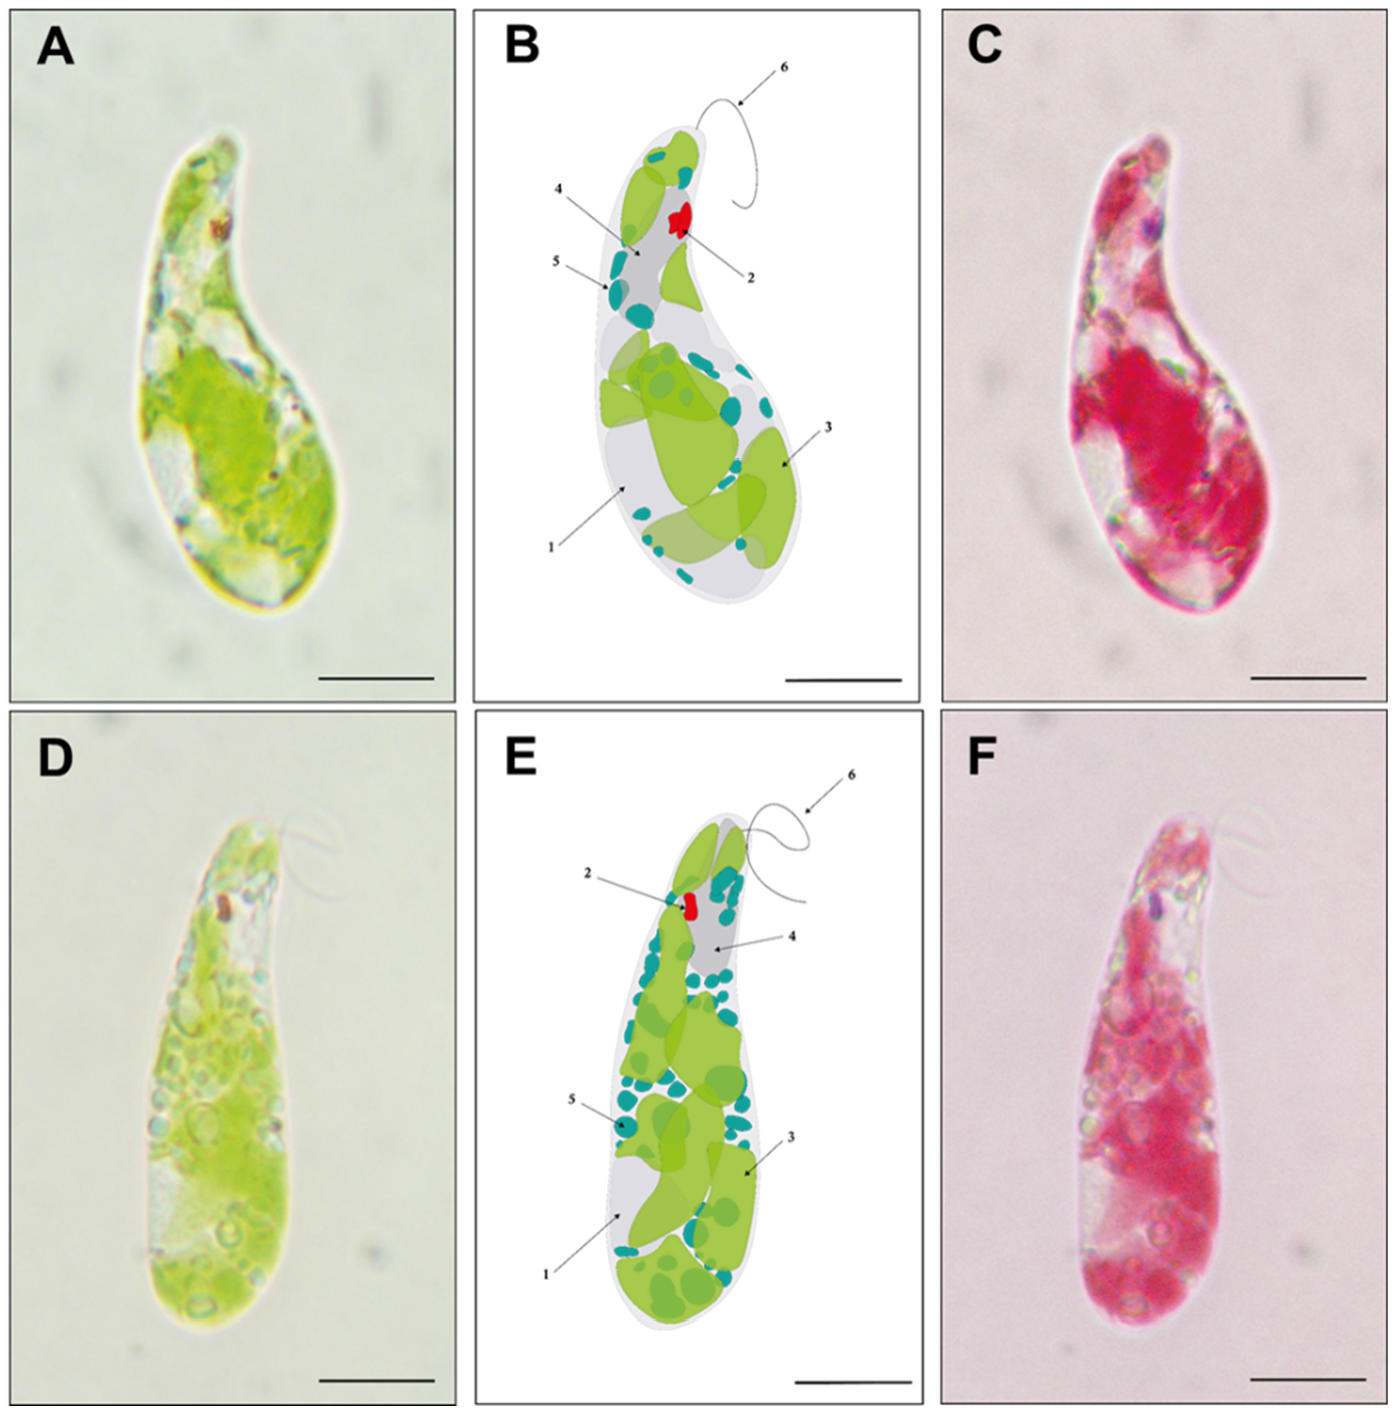
Paramylon production (pg/cell) was determined from cells grown in TMP minimal medium under twelve light regimes during both the logarithmic and stationary phases (Figure 5). During logarithmic growth under single light spectra, paramylon concentration ranged from 4 to 45 pg per cell, with the lowest values obtained under G, R, and UV conditions, and the highest under RB, followed by B and FR conditions (Figure 5A). Under composite light spectra, the achieved values were more constant, ranging from 21 to 33 pg/cell, with no significant differences among them (Figure 5B). Contrastingly, during the stationary phase, paramylon production in cells grown under single light spectra was at least doubled compared to the logarithmic phase with these light sources, resulting in values between 72 and 134 pg/cell, with the highest value recorded in FR, which is triple the amount obtained in the logarithmic phase under the same condition (Figure 5C). Regarding the quantity of paramylon obtained in cells grown under composite light spectra during the stationary phase, the values ranged from 79 to 122 pg/cell, with the highest values found in A and F, whose emission spectra are shifted above 680 nm (Figure 1B). Again, it is observed that the paramylon concentrations reached in the stationary phase under composite light conditions are approximately three times higher than those obtained in the logarithmic phase, and in the case of A, they are up to 5 times higher (Figure 5D). Among both growth phases, the condition in which the highest paramylon production was obtained was FR spectrum, reinforcing the fact that the >680 nm light component enhances paramylon production (Figure 5E). To microscopically evaluate the differences in paramylon production among live cells, representative photomicrographs were taken from E. gracilis grown in R (Figure 6A-C) and FR (Figure 6D-F). Brightfield microscopy makes evident that cells grown with FR augment both the number and size of paramylon granules (Figure 6D-F) compared to R grown cells (Figure 6A-C).
5. Discussion
Short term light-adaptations and long-term light-acclimations are complex processes that ensure survival of photosynthetic organisms under changing environmental conditions. Classically, photosynthetically active radiation (PAR) has been defined between 400 and 700 nm [29], but development of light-emitting diodes (LED) that emit monochromatic light allows the study of photosynthetic activity using narrow spectra [30]. Our in-house designed Ankaa PBR (Figure 1) allowed us to evaluate in a simple, but reliable manner the simultaneous effect of 12 different light regimes over the growth and paramylon production of Euglena gracilis. Recently, it has been shown that E. gracilis can grow using different ratios of red:blue wavelengths [25]. This is in line with our observation of the capacity of this microorganism to grow photoautotrophically using slightly variant composite light spectra (Figure 2B), which are mainly composed of a mixture of blue/red lights (Figure 1B). Indeed, our results showed that composite spectra enriched with blue components (10K, 30K and F) strongly contribute to reach higher cell densities compared to those where the blue component is lower (3K and A) (Figure 2B). Additionally, our results evidenced a large flexibility of this species to grow when irradiated with a single wavelength (Figure 2A). Similar acclimation capacity to a wide diversity of specific wavelengths has been observed in other microalgae like Chlamydomonas reinhardtii [31], Scenedesmus sp [32] and Nannochloropsis sp [24]. Interestingly, our data suggest that this species survives infrared radiation, although no detectable growth was observed under IR regime along the 25-day experiment. Nevertheless, subsequent transfer of the IR-irradiated cells to fresh culture medium and the reillumination with 3K light conditions allowed the culture to develop similar growth kinetics as the one shown in Figure 2B (data not shown). This adaptation capacity was described in several diatom species a long time ago [33] but, to our knowledge, this is the first observation that E. gracilis survives a long period without extended-PAR regime (395-750 nm) in the absence of any carbon source.
Through evolution, genetic drift, and speciation, the light-harvesting machinery of microalgae has given rise to adaptation mechanisms that enable these organisms to thrive in diverse environments. Chlorophyll-based light harvesting complexes (LHC), absorb efficiently blue and red light, although in the green gap (between 500 and 600 nm) their absorption is rather low; this is in line with the cell absorption profile among all the evaluated light regimes (Figures 3A and 3B purple arrow heads). Green light has been proposed as a suitable growth condition in highly dense PBR due to its augmented penetrability compared to blue or red light [34,35]. Additionally, it has been shown that green wavelengths are required for optimal growth in many microalgae species [36]. Furthermore, in the chlorophyte Picochlorum sp [37], green light (510 nm) is sufficient for the efficient growth of cultures that exhibit a two-day prolonged initial lag phase and chemical modifications in chlorophyll a and chlorophyll b characterized by an unsaturation in the phytol side chain. Similarly, our results showed that E. gracilis can grow under a green light regime, with the presence of a 12-day prolonged initial lag phase compared to the other light regimes (Figure 2A). Nevertheless, further research is needed to characterize any fine-tuned pigment modifications in this growth condition.
In E. gracilis, the principal pigments are chlorophyll a and diadinoxanthin, while chlorophyll b content is low [38]. Recently, it has been shown that this microalga has a species-specific mobile antenna, named LHCE. This antenna complex, whose main contents are chlorophyll a and a PSI super complex, explains the far-red absorption capacity of E. gracilis cells [39]. Even though this red-shifted absorption signal above 710 nm is only slightly visible in B, G and FR conditions (Figure 3A, red arrow heads), this could indicate a differential expression of a species-specific LHCE complex among the different light regimes. The slightly differences on chlorophyll a/b ratio observed in B, G and FR adapted cells could be due to differential expression of this antenna complex (Figure 3C). On the other hand, carotenoid biosynthesis and accumulation in E. gracilis are regulated by different intensities of blue or red-light [40]. These photosynthetic pigments protect against photoexcitation from the excess light absorbed by the LHCs [41] and stabilize the structural integrity of LHCs [42]. Our pigment determination of Euglena cells from all the evaluated light regimes showed only a slight increase in total carotenoids in UV-treated cells in comparison to the rest of the conditions (Figure 3D), this carotenogenic effect was also observed in Coccomyxa sp and Chromochloris sp irradiated with UV-A [43].
For optimal photosynthesis, it is imperative to have a balanced excitation in both photosystems [44], which depends on the rate of photon absorption and on the efficiency of conversion of light into chemical energy. Even though a highly efficient excitation energy is achievable at a particular wavelength, the photosynthetic efficiency can still be limited by the rate of carbon fixation [45]. The oxygen evolving complex within the PSII catalyzes the reduction of water to oxygen. Since the main pigments in PSII, chl a and chl b, better capture light in red and blue lights, higher oxygen production rates are expected at those wavelengths. Accordingly, 30K, A, and F light regimes, which have a blue and red component, had the highest oxygen production rates along with G lights (Figure 4A and 4C). The crosstalk between chloroplastic photosynthesis and mitochondrial respiration in photosynthetic eukaryotic cells is crucial for optimum cell metabolism. During the different light treatments, the oxygen production rates were in concordance with the observed mitochondrial respiration rates (Figure 4B and 4D). An interesting exception was the R and FR-adapted cells, where even though PSII oxygen evolution rate is low in R, the respiration rate is larger, and vice versa in the FR treatment. A similar increase in photosynthetic CO2 assimilation due to the far-red component was described previously for soybean [46]. The evaluation of oxygen evolution (Figure 4A and 4C) and mitochondrial respiration (Figure 4B and 4D) indicates that both bioenergetic organelles maintain fully functional energy pathways under all our treatments.
Biotechnologically, E. gracilis is particularly interesting for the direct conversion of CO2 into biomass under several stress conditions, including acidic media, high salt concentrations and the presence of heavy metals [47,48]. Paramylon biosynthesis in photoautotrophic conditions only uses the excess energy captured by the cells [49] and requires aerobic conditions [50]. Because our cultivation conditions were under continuous light regimes, paramylon production was not limited. Nevertheless, growth rates during the logarithmic phase (Figure 2C) and paramylon production were lower under UV, G, and R light regimes (Figure 5A), indicating a restriction of available energy under these conditions. In contrast, red light regime (620-680 nm) induces starch accumulation in Chlamydomonas sp [51] and Chlorella vulgaris without affecting photosynthetic efficiency [52]. In contrast, when light utilization was optimal (RB, B, FR and composite spectra), paramylon production increased notably (Figure 5A). Furthermore, under the stationary phase, when the production of secondary metabolites is favored, paramylon production increased notably under all light regimes (figure 5C and 5D). In agreement with previous reports, FR-acclimated cells exhibited the largest paramylon production [16] which gave rise to large granules directly visible under brightfield microscopy [53] (see also Figure 6).
6. Conclusions
Taken together, our data reinforces the idea that E. gracilis possesses light adaptation capabilities exhibiting a robust plasticity. This characteristic allows it to grow and produce important metabolites under several divergent light regimes. Interestingly, paramylon production was enhanced by far-red light component, especially during the stationary phase. Our findings pave the way to further explore fine structural modifications in E. gracilis photosynthetic machinery under different illumination conditions. In addition, the flexible light utilization exhibited by this species shows that it has a privileged place as a producer of metabolites of biotechnological interest and that it may also contribute to alleviating the current climate crisis.
Supplementary Materials
The following supporting information can be downloaded at the website of this paper posted on Preprints.org
Author Contributions
Conceptualization, Héctor Miranda-Astudillo; Data curation, Héctor Miranda-Astudillo and Anaiza Rico-Luna; Formal analysis, Héctor Miranda-Astudillo and Anaiza Rico-Luna; Funding acquisition, Héctor Miranda-Astudillo; Investigation, Zhaida Aguilar-Gonzalez, Anaiza Rico-Luna and Toshiko Takahashi-Íñiguez; Methodology, Héctor Miranda-Astudillo and Anaiza Rico-Luna; Resources, Héctor Miranda-Astudillo; Supervision, Héctor Miranda-Astudillo; Visualization, Héctor Miranda-Astudillo and Anaiza Rico-Luna; Writing – original draft, Héctor Miranda-Astudillo, Anaiza Rico-Luna and Toshiko Takahashi-Íñiguez; Writing – review & editing, Héctor Miranda-Astudillo, Zhaida Aguilar-Gonzalez, Anaiza Rico-Luna and Toshiko Takahashi-Íñiguez. All authors have read and agreed to the published version of the manuscript.
Funding
This research was supported by Universidad Nacional Autónoma de México under DGAPA-PAPIIT Program [grant number IA204524 to H.M.A.] and the Instituto de Investigaciones Biomédicas under the Institutional Program [“Production of biomolecules of biomedical interest in microorganisms” to H.M.A.].
Acknowledgments
We are grateful to Dr. Diego González Halphen (UNAM, Mexico) and Dr. Pierre Cardol (ULg, Belgium) for their critical review of the original manuscript. A.R.L. is a PhD student at “Doctorado en Ciencias Biomédicas” at UNAM and has been granted a doctorate fellowship by Secihti (CVU: 927622).
Conflicts of Interest
The authors declare no conflicts of interest.
Abbreviations
The following abbreviations are used in this manuscript:
| UV | Ultraviolet light |
| RB | Royal Blue light |
| B | Blue light |
| G | Green light |
| R | Red light |
| FR | Far-Red light |
| IR | Infrared light |
| 3K | White light 3000K temperature |
| 10K | White light 10000K temperature |
| 30K | White light 30000K temperature |
| A | Amber light |
| F | Full-spectrum light |
| Chl a | Chlorophyll a |
| Chl b | Chlorophyll b |
| TMP | Tris-minimum-phosphate medium |
References
- Yen, H.W.; Hu, I.C.; Chen, C.Y.; Ho, S.H.; Lee, D.J.; Chang, J.S. Microalgae-based biorefinery--from biofuels to natural products. Bioresour Technol 2013, 135, 166–174. [Google Scholar] [CrossRef]
- Rial, R.C. Biofuels versus climate change: Exploring potentials and challenges in the energy transition. Renewable and Sustainable Energy Reviews 2024, 196, 114369. [Google Scholar] [CrossRef]
- Nelson, N.; Ben-Shem, A. The complex architecture of oxygenic photosynthesis. Nat Rev Mol Cell Biol 2004, 5, 971–982. [Google Scholar] [CrossRef] [PubMed]
- Hussain, S.; Ulhassan, Z.; Brestic, M.; Zivcak, M. ; Weijun Zhou; Allakhverdiev, S. I.; Yang, X.; Safdar, M.E.; Yang, W.; Liu, W. Photosynthesis research under climate change. Photosynth Res 2021, 150, 5–19. [Google Scholar] [CrossRef]
- Xu, P.; Li, J.; Qian, J.; Wang, B.; Liu, J.; Xu, R.; Chen, P.; Zhou, W. Recent advances in CO. Chemosphere 2023, 319, 137987. [Google Scholar] [CrossRef]
- Sutherland, D.L.; McCauley, J.; Labeeuw, L.; Ray, P.; Kuzhiumparambil, U.; Hall, C.; Doblin, M.; Nguyen, L.N.; Ralph, P.J. How microalgal biotechnology can assist with the UN Sustainable Development Goals for natural resource management. Current Research in Environmental Sustainability 2021, 3, 100050. [Google Scholar] [CrossRef]
- Sousa, V.; Pereira, R.N.; Vicente, A.A.; Dias, O.; Geada, P. Microalgae biomass as an alternative source of biocompounds: New insights and future perspectives of extraction methodologies. Food Res Int 2023, 173, 113282. [Google Scholar] [CrossRef]
- Leander, B.S.; Lax, G.; Karnkowska, A.; Simpson, A.G.B. Euglenida. In Handbook of the Protists, Archibald, J.M., Simpson, A.G.B., Slamovits, C.H., Margulis, L., Melkonian, M., Chapman, D.J., Corliss, J.O., Eds.; Springer International Publishing: Cham, 2017; pp. 1–42. [Google Scholar] [CrossRef]
- Monfils, A.K. ; E. , T.R.; and Bellairs, E.F. Characterization of paramylon morphological diversity in photosynthetic euglenoids (Euglenales, Euglenophyta). Phycologia 2011, 50, 156–169. [Google Scholar] [CrossRef]
- Ebenezer, T.E.; Low, R.S.; O'Neill, E.C.; Huang, I.; DeSimone, A.; Farrow, S.C.; Field, R.A.; Ginger, M.L.; Guerrero, S.A.; Hammond, M.; et al. Euglena International Network (EIN): Driving euglenoid biotechnology for the benefit of a challenged world. Biol Open 2022, 11. [Google Scholar] [CrossRef]
- Gissibl, A.; Sun, A.; Care, A.; Nevalainen, H.; Sunna, A. Bioproducts From. Front Bioeng Biotechnol 2019, 7, 108. [Google Scholar] [CrossRef]
- Bedard, S.; Roxborough, E.; O'Neill, E.; Mangal, V. The biomolecules of Euglena gracilis: Harnessing biology for natural solutions to future problems. Protist 2024, 175, 126044. [Google Scholar] [CrossRef] [PubMed]
- Feuzing, F.; Mbakidi, J.P.; Marchal, L.; Bouquillon, S.; Leroy, E. A review of paramylon processing routes from microalga biomass to non-derivatized and chemically modified products. Carbohydr Polym 2022, 288, 119181. [Google Scholar] [CrossRef] [PubMed]
- Sugiyama, A.; Hata, S.; Suzuki, K.; Yoshida, E.; Nakano, R.; Mitra, S.; Arashida, R.; Asayama, Y.; Yabuta, Y.; Takeuchi, T. Oral administration of paramylon, a beta-1,3-D-glucan isolated from Euglena gracilis Z inhibits development of atopic dermatitis-like skin lesions in NC/Nga mice. J Vet Med Sci 2010, 72, 755–763. [Google Scholar] [CrossRef]
- Kim, S.; Lim, D.; Lee, D.; Yu, J.; Lee, T. Valorization of corn steep liquor for efficient paramylon production using Euglena gracilis: The impact of precultivation and light-dark cycle. Algal Research 2022, 61, 102587. [Google Scholar] [CrossRef]
- Rodríguez-Bolaños, M.; Vargas-Romero, G.; Jaguer-García, G.; Aguilar-Gonzalez, Z.I.; Lagos-Romero, V.; Miranda-Astudillo, H.V. Antares I: a Modular Photobioreactor Suitable for Photosynthesis and Bioenergetics Research. Applied Biochemistry and Biotechnology 2024, 196, 2176–2195. [Google Scholar] [CrossRef] [PubMed]
- Xie, Y.; Li, J.; Qin, H.; Wang, Q.; Chen, Z.; Liu, C.; Zheng, L.; Wang, J. Paramylon from. Front Immunol 2021, 12, 797096. [Google Scholar] [CrossRef]
- Rubiyatno; Matsui, T. ; Mori, K.; Toyama, T. Paramylon production by Euglena gracilis via mixotrophic cultivation using sewage effluent and waste organic compounds. Bioresource Technology Reports 2021, 15, 100735. [CrossRef]
- Rodríguez-Zavala, J.S.; Ortiz-Cruz, M.A.; Mendoza-Hernández, G.; Moreno-Sánchez, R. Increased synthesis of α-tocopherol, paramylon and tyrosine by Euglena gracilis under conditions of high biomass production. J Appl Microbiol 2010, 109, 2160–2172. [Google Scholar] [CrossRef]
- Aoe, S.; Yamanaka, C.; Koketsu, K.; Nishioka, M.; Onaka, N.; Nishida, N.; Takahashi, M. Effects of Paramylon Extracted from Euglena gracilis EOD-1 on Parameters Related to Metabolic Syndrome in Diet-Induced Obese Mice. Nutrients 2019, 11. [Google Scholar] [CrossRef]
- Nakashima, A.; Sugimoto, R.; Suzuki, K.; Shirakata, Y.; Hashiguchi, T.; Yoshida, C.; Nakano, Y. Anti-fibrotic activity of. Food Sci Nutr 2019, 7, 139–147. [Google Scholar] [CrossRef]
- Yasuda, K.; Ogushi, M.; Nakashima, A.; Nakano, Y.; Suzuki, K. Accelerated Wound Healing on the Skin Using a Film Dressing with β-Glucan Paramylon. In Vivo 2018, 32, 799–805. [Google Scholar] [CrossRef] [PubMed]
- Lei, H.; Zhao, J.; Li, H.; Fan, D. Paramylon hydrogel: A bioactive polysaccharides hydrogel that scavenges ROS and promotes angiogenesis for wound repair. Carbohydr Polym 2022, 289, 119467. [Google Scholar] [CrossRef]
- Vadiveloo, A.; Moheimani, N.R.; Cosgrove, J.J.; Parlevliet, D.; Bahri, P.A. Effects of different light spectra on the growth, productivity and photosynthesis of two acclimated strains of Nannochloropsis sp.
- Xin, K.; Guo, R.; Wang, X.; Yu, Z.; Mao, W.; Cheng, C.; Che, G.; Qian, L.; Cheng, J.; Yang, W.; et al. Photoautotrophic Growth and Cell Division of Euglena gracilis with Mixed Red and Blue Wavelengths. Industrial & Engineering Chemistry Research 2024, 63, 4746–4755. [Google Scholar] [CrossRef]
- Ritchie, R.J. Consistent Sets of Spectrophotometric Chlorophyll Equations for Acetone, Methanol and Ethanol Solvents. Photosynthesis Research 2006, 89, 27–41. [Google Scholar] [CrossRef] [PubMed]
- Caspers, H. J. D. H. Strickland and T. R. Parsons: A Practical Handbook of Seawater Analysis. Ottawa: Fisheries Research Board of Canada, Bulletin 167, 1968. 293 pp. Internationale Revue der gesamten Hydrobiologie und Hydrographie 1970, 55, 167–167. [Google Scholar] [CrossRef]
- Gain, G.; Vega de Luna, F.; Cordoba, J.; Perez, E.; Degand, H.; Morsomme, P.; Thiry, M.; Baurain, D.; Pierangelini, M.; Cardol, P. Trophic state alters the mechanism whereby energetic coupling between photosynthesis and respiration occurs in Euglena gracilis. New Phytol 2021, 232, 1603–1617. [Google Scholar] [CrossRef]
- Zhen, S.; van Iersel, M.W.; Bugbee, B. Photosynthesis in sun and shade: the surprising importance of far-red photons. New Phytol 2022, 236, 538–546. [Google Scholar] [CrossRef]
- Schulze, P.S.; Barreira, L.A.; Pereira, H.G.; Perales, J.A.; Varela, J.C. Light emitting diodes (LEDs) applied to microalgal production. Trends Biotechnol 2014, 32, 422–430. [Google Scholar] [CrossRef]
- Li, X.; Slavens, S.; Crunkleton, D.W.; Johannes, T.W. Interactive effect of light quality and temperature on Chlamydomonas reinhardtii growth kinetics and lipid synthesis. Algal Research 2021, 53, 102127. [Google Scholar] [CrossRef]
- Kim, T.H.; Lee, Y.; Han, S.H.; Hwang, S.J. The effects of wavelength and wavelength mixing ratios on microalgae growth and nitrogen, phosphorus removal using Scenedesmus sp. for wastewater treatment. Bioresour Technol 2013, 130, 75–80. [Google Scholar] [CrossRef]
- Smayda, T.J.; Mitchell-Innes, B. Dark survival of autotrophic, planktonic marine diatoms. Marine Biology 1974, 25, 195–202. [Google Scholar] [CrossRef]
- Mattos, E.R.; Singh, M.; Cabrera, M.L.; Das, K.C. Enhancement of biomass production in Scenedesmus bijuga high-density culture using weakly absorbed green light. Biomass and Bioenergy 2015, 81, 473–478. [Google Scholar] [CrossRef]
- Kubín, Š.; Borns, E.; Doucha, J.; Seiss, U. Light Absorption and Production Rate of Chlorella vulgaris in Light of Different Spectral Composition. Biochemie und Physiologie der Pflanzen 1983, 178, 193–205. [Google Scholar] [CrossRef]
- Ievina, B.; Romagnoli, F. Unveiling underlying factors for optimizing light spectrum to enhance microalgae growth. Bioresour Technol 2025, 418, 131980. [Google Scholar] [CrossRef] [PubMed]
- Paper, M.; Glemser, M.; Haack, M.; Lorenzen, J.; Mehlmer, N.; Fuchs, T.; Schenk, G.; Garbe, D.; Weuster-Botz, D.; Eisenreich, W.; et al. Efficient Green Light Acclimation of the Green Algae. Front Bioeng Biotechnol 2022, 10, 885977. [Google Scholar] [CrossRef]
- Cunningham, F.X.; Schiff, J.A. Chlorophyll-Protein Complexes from Euglena gracilis and Mutants Deficient in Chlorophyll b: II. Polypeptide Composition. Plant Physiol 1986, 80, 231–238. [Google Scholar] [CrossRef]
- Miranda-Astudillo, H.; Arshad, R.; Vega de Luna, F.; Aguilar-Gonzalez, Z.; Forêt, H. ; Feller, T; Gervasi, A.; Nawrocki, W.; Counson, C.; Morsomme, P.; Degand, H.; Baurain, D.; Kouřil, R.; Cardol, P., A Unique LHCE Light-Harvesting protein Family is involved in Photosystem I and II Far-Red Absorption in Euglena gracilis 2025, bioRxiv 2025.05.07.652572; [CrossRef]
- Tanno, Y.; Kato, S.; Takahashi, S.; Tamaki, S.; Takaichi, S.; Kodama, Y.; Sonoike, K.; Shinomura, T. Light dependent accumulation of β-carotene enhances photo-acclimation of Euglena gracilis. J Photochem Photobiol B 2020, 209, 111950. [Google Scholar] [CrossRef]
- Maoka, T. Carotenoids as natural functional pigments. J Nat Med 2020, 74, 1–16. [Google Scholar] [CrossRef]
- Cunningham, F.X. and Gantt, E. One ring or two? Determination of ring number in carotenoids by lycopene ɛ-cyclases. PNAS 2001, 98(5) 2905-2910. [CrossRef]
- Mutschlechner, M.; Walter, A.; Colleselli, L.; Griesbeck, C.; Schöbel, H. Enhancing carotenogenesis in terrestrial microalgae by UV-A light stress. J Appl Phycol 2022, 34, 1943–1955. [Google Scholar] [CrossRef]
- Zhen, S.; van Iersel, M. W.; Bugbee, B. Photosynthesis in sun and shade: the surprising importance of far-red photons. New Phytologist 2022, 236: 538–546. [CrossRef]
- Xu, Y.; Harvey, P.J. Carotenoid Production by Dunaliella salina under Red Light. Antioxidants 2019, 8, 123; [Google Scholar] [CrossRef]
- Yang, F.; Liu, Q.; Cheng, Y.; Feng, L.; Wu, X.; Fan, Y.; Raza, M.; Wang, X. , Yong, T.; Liu, W.; Liu, J.; Du, J.; Shu, K.; Yang, W. Low red/far-red ratio as a signal promotes carbon assimilation of soybean seedlings by increasing the photosynthetic capacity. BMC Plant Biol 2020, 20: 148. [CrossRef]
- Piiparinena, J.; Barthb, D.; Eriksenc, N.T.; Teirb, S.; Spillinga, K.; Wiebeb, M.G. Microalgal CO2 capture at extreme pH values. Algal Research 2018, 32: 321–328. [CrossRef]
- Krajcovic, J.; Vestega, M.; Schwartzbachc, S.D. Euglenoid flagellates: A multifaceted biotechnology platform. Journal of Biotechnology 2015, 202: 135–145. [CrossRef]
- Grimm, P.; Risse, J.M.; Cholewa, D.; Müller, J.M.; Beshay, U.; Friehs, K.; Flaschel, E. Applicability of Euglena gracilis for biorefineries demonstrated by the production of -tocopherol and paramylon followed by anaerobic digestion. Journal of Biotechnology 2015, 215: 72–79. [CrossRef]
- Inui, H.; Miyatake, K.; Nakano, Y.; Kitaoka, S. Production and Composition of Wax Esters by Fermentation of Euglena gracilis. Agricultural and Biological Chemistry 1983, 47:11, 2669-2671. [CrossRef]
- Yagi, K.; Hamada, K.; Hlrata, K.; Miyamoto, K.; Miura, Y.; Akano, T.; Fukatu, K.; Ikuta, Y.; Nakamura, H. Stimulatory effect of red light on starch accumulation in a marine green alga, Chlamydomonas sp. strain MGA161. Appl Biochem Biotechnol 1994, 45, 225–232. [Google Scholar] [CrossRef]
- Six, A.; Dimitriades-Lemaire, A.; Lancelon-Pin, C.; Putaux, J.; Dauvillée, D.; Petroutsos, D.; Alvarez Diaz, P.; Sassi, J.; Li-Beisson, Y.; Fleury, G. Red light induces starch accumulation in Chlorella vulgaris without affecting photosynthesis efficiency, unlike abiotic stress. Algal Research 2024, 80: 103515. [CrossRef]
- 5Meeuse, B.J.D. Breakdown of paramylon and laminarin by digestive enzymes of Lamellibranchs - an important ecological feature. Basteria 1964, 28, 5: 67–86. [Google Scholar]
Figure 1.
Schematic representation of Ankaa Photobioreactor System. A) Diagram of one compartment seen laterally (upper panel) or from above (lower panel). Each compartment is composed of: (1) a chiller plate, (2) a heat dissipation system, (3) a LED module, and a 25-125 mL Erlenmeyer flask B) Normalized emission spectra from twelve different 3W LED modules from Ankaa separated as single (upper panel) or composite spectrum (lower panel).
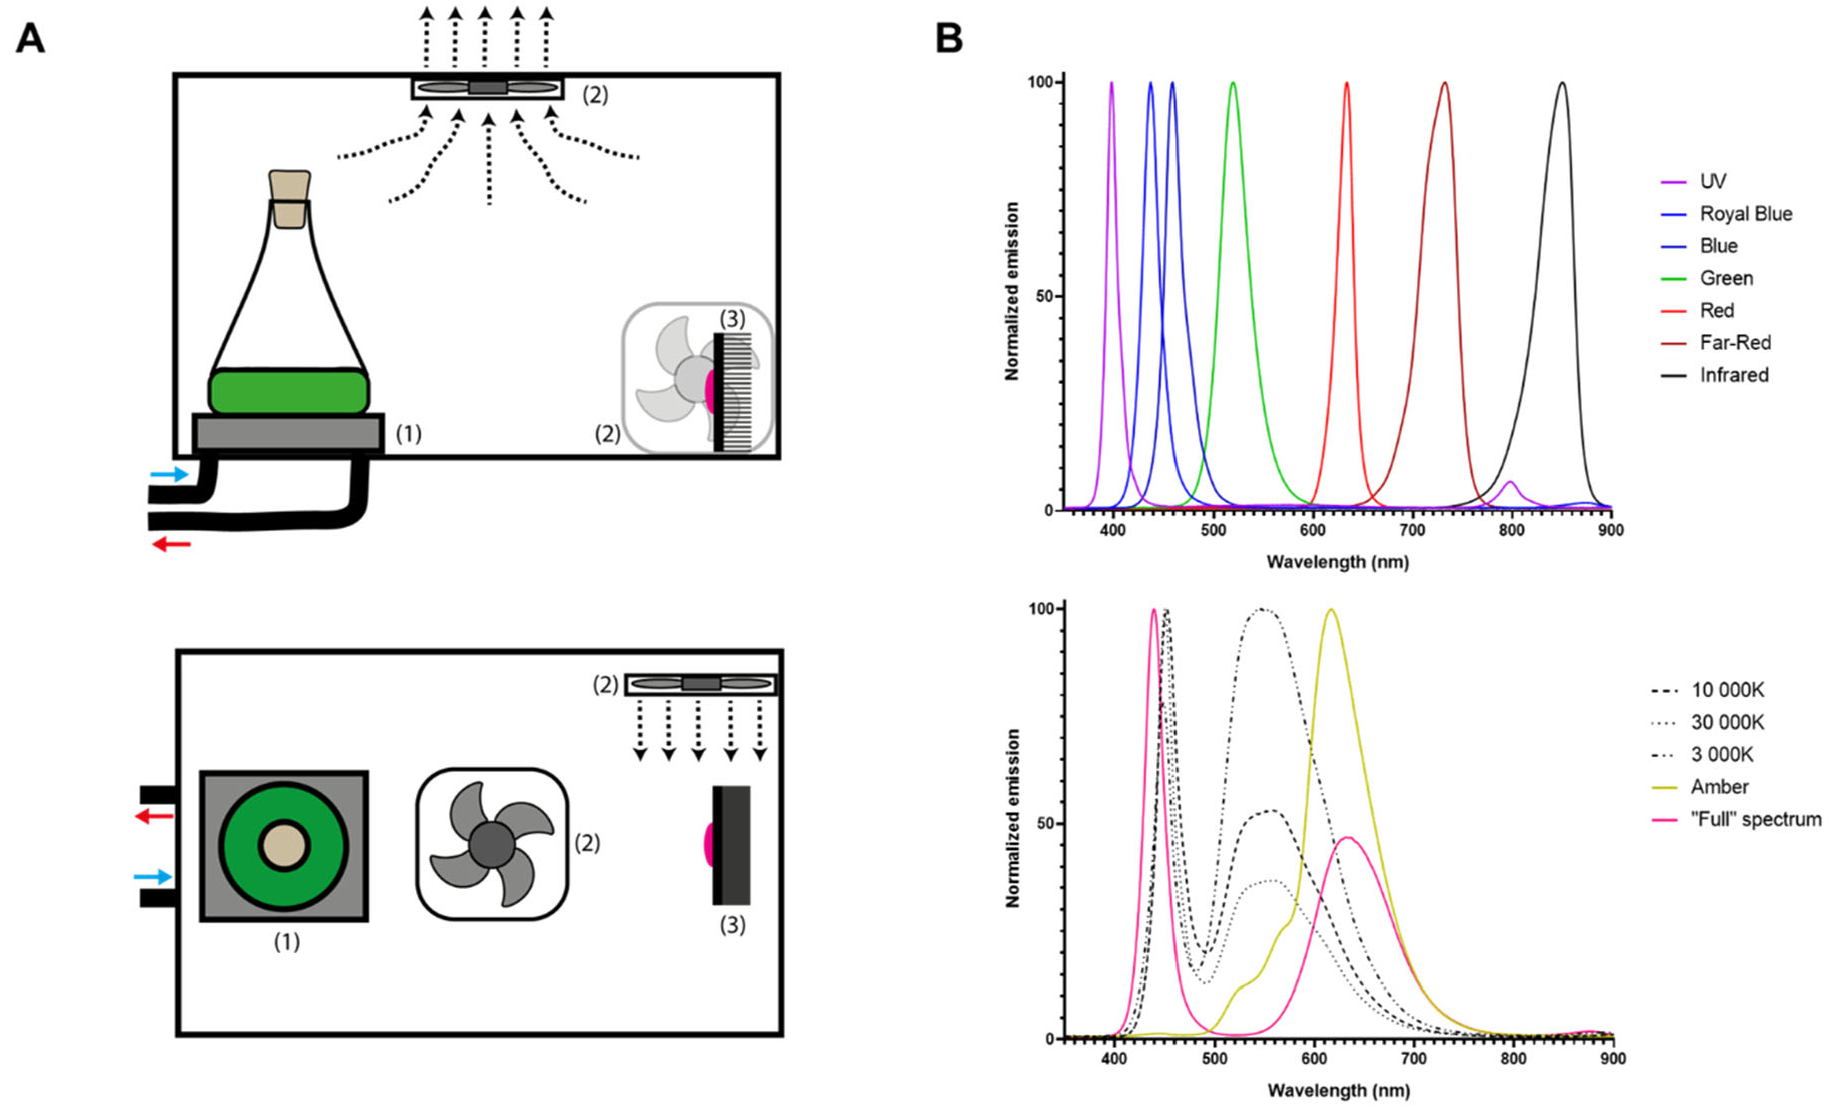
Figure 2.
Effect of different light spectra on Euglena gracilis growth. Growth curves under single (A) and composite (B) light spectra, growth data were adjusted to a Gompertz growth model. Growth rate (C/E) and doubling time (D/F) are depicted with error bars representing SD for single (C/D) and composite (E/F) light spectra. Values with the same letter on the column indicate no significant difference between those conditions (p < 0.002).
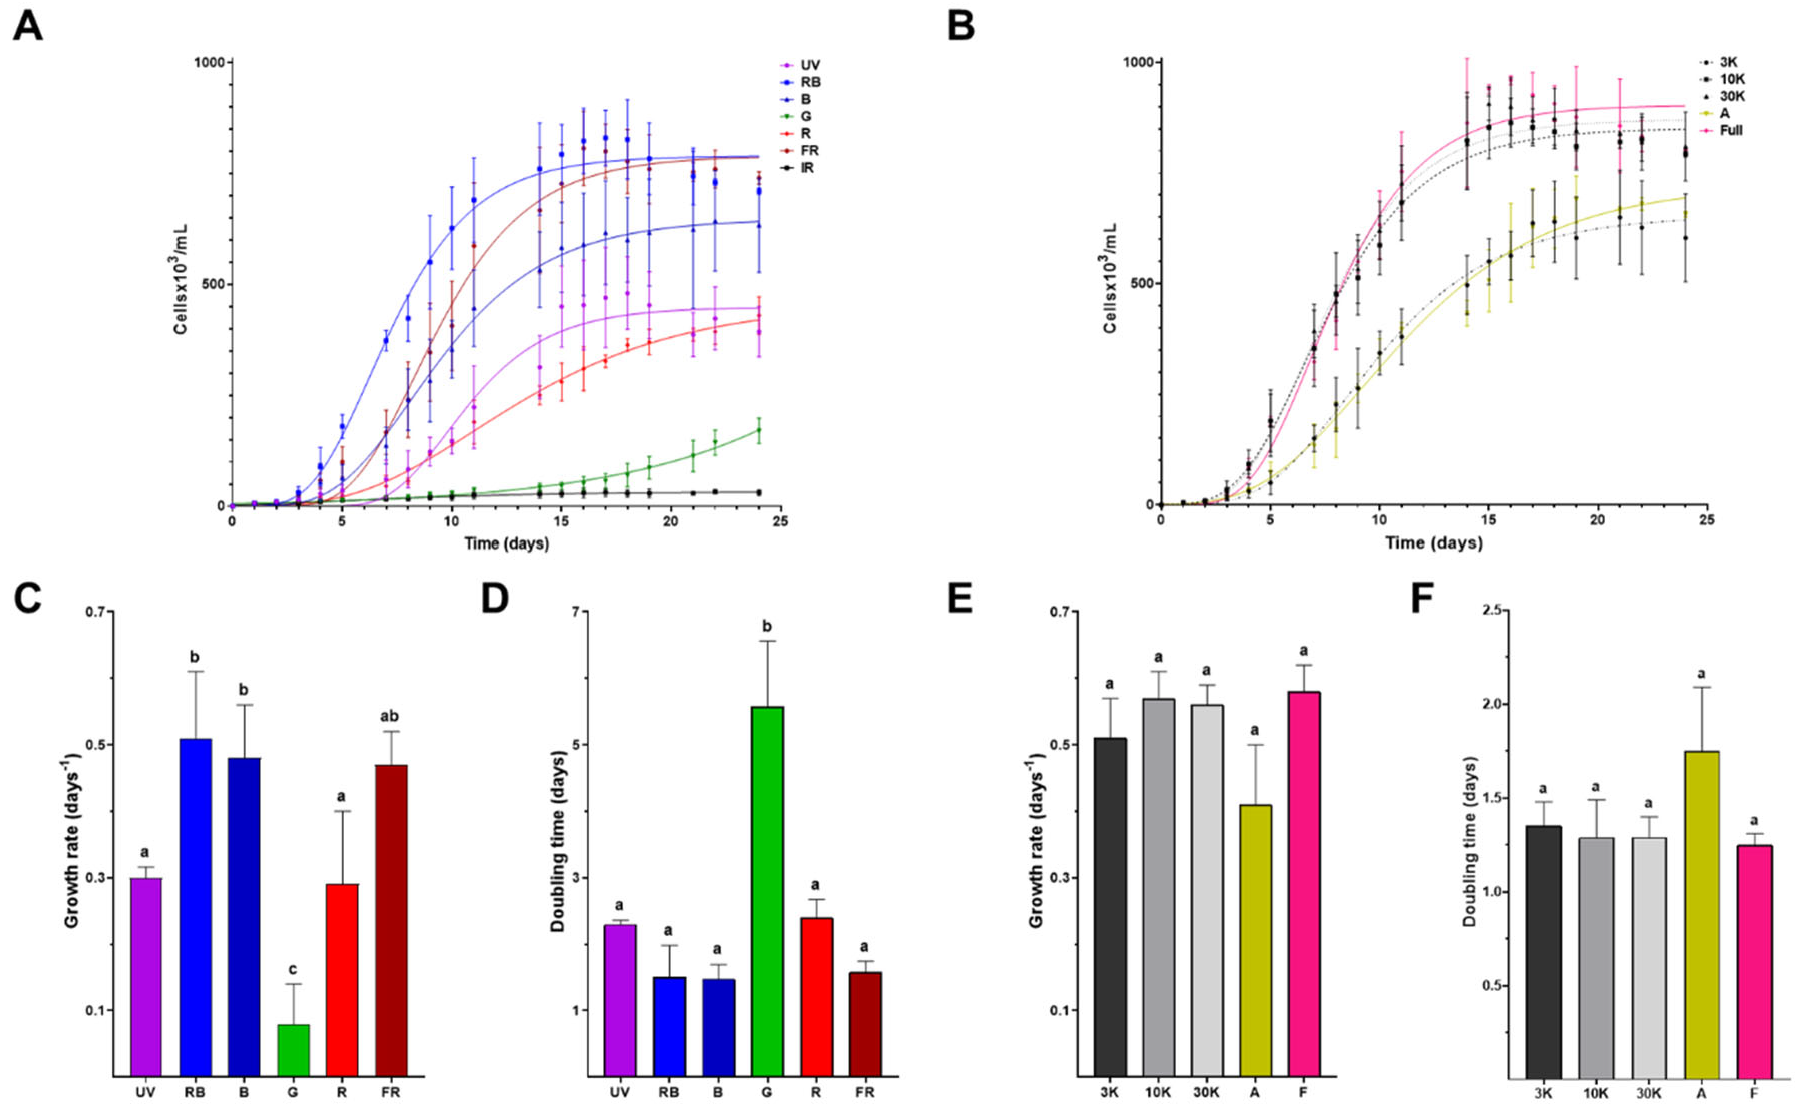
Figure 3.
Differences in pigment composition due to light growth conditions. Normalized room temperature absorption spectra of Euglena gracilis growth under single (A) or composite (E) light spectra. Total pigment distribution for single (B) and composite (F) light spectra. Chlorophyll a/b ratio (C/G) and carotenoids percentage (D/H) for single (C/D) and composite (G/H) light spectra. Error bars represent SEM for all panels. Values with the same letter on the column indicate no significant difference between those conditions (p < 0.002).
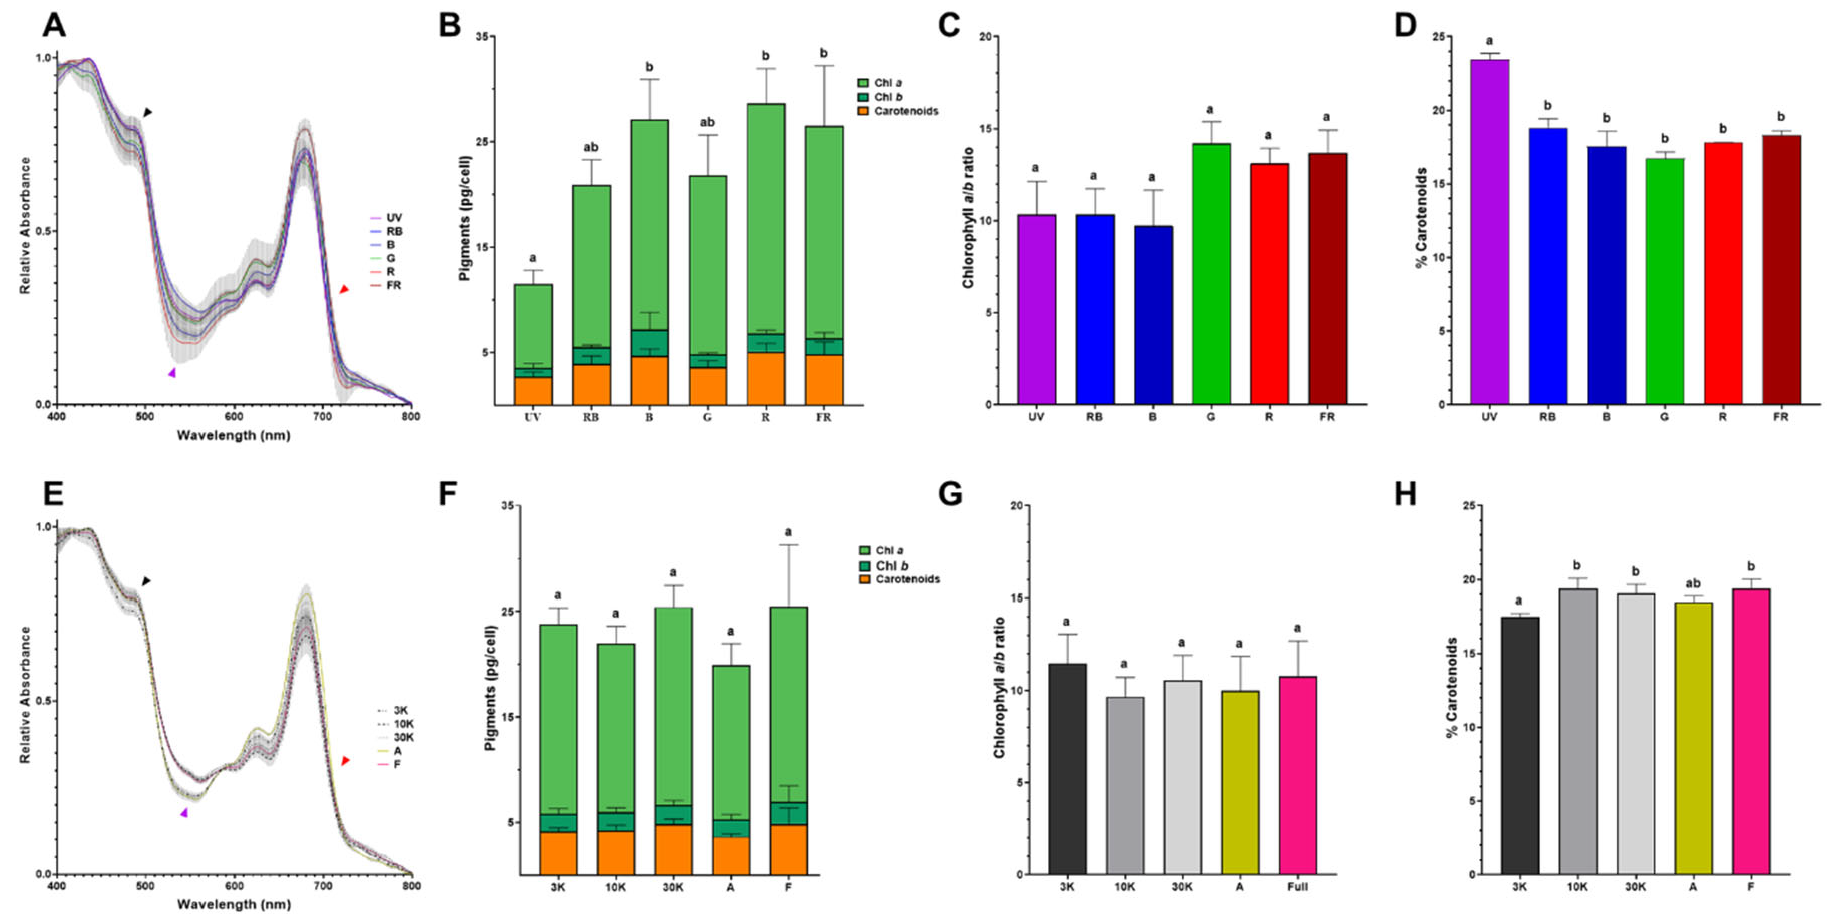
Figure 4.
Oxygen-evolving activity and dark respiration in Euglena gracilis acclimated to distinct light regimes. Oxygen evolution (A) and dark-respiration (B) of phototrophic cells (15x106) grown in distinct light spectra. Average of O2 production (C/E) and consumption per minute (3 minutes) (D/F). Error bars represent SD among the first three minutes.
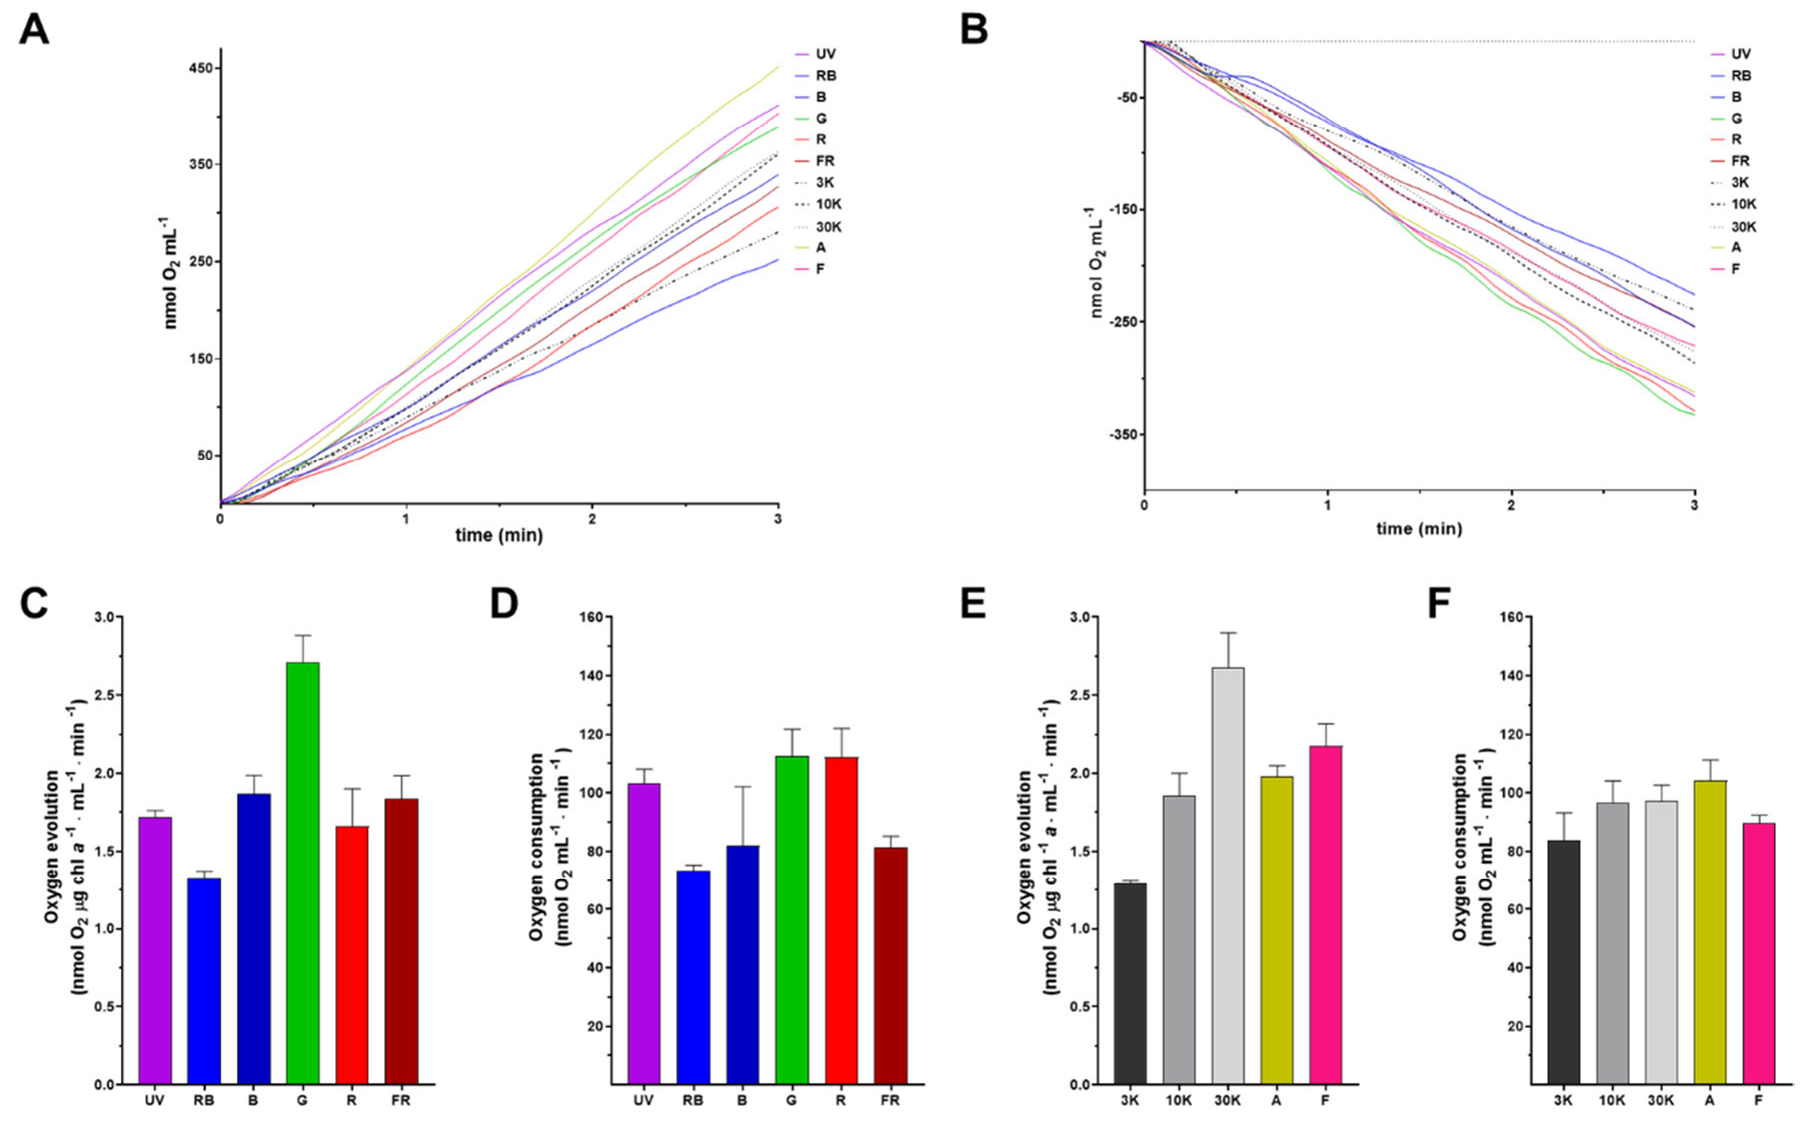
Figure 5.
Paramylon production in the logarithmic (A/B) or stationary growth phase (C/D) under single (A/C) or composite light spectra (B/D). Error bars represent SEM. Values with the same letter on the column indicate no significant difference between those conditions (p < 0.002). Far-red component (>680 nm) is present among A, F and FR light regimes (E).
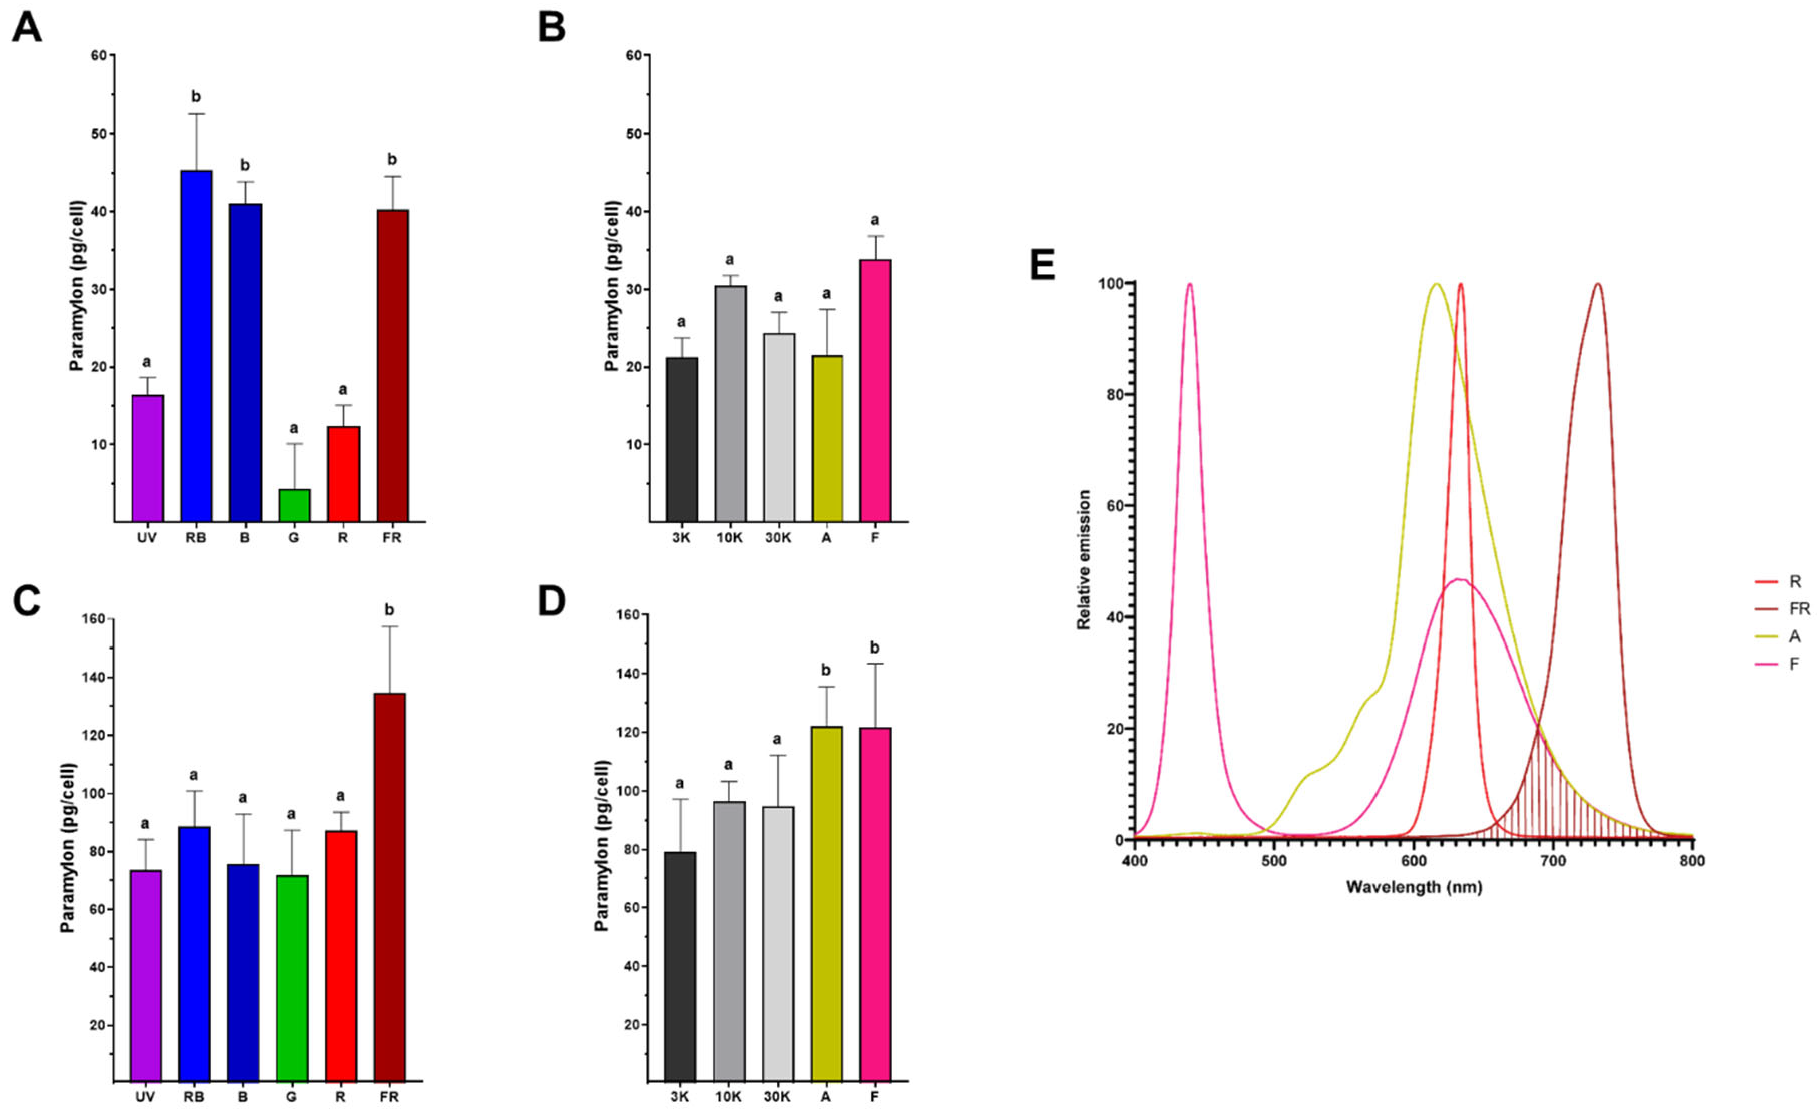
Figure 6.
Paramylon accumulation in Euglena gracilis. Representative microphotography of cells containing paramylon granules grown under R (A-C) and FR (D-F) light regimes. Both the quantity and size of paramylon granules augment when grown in FR light. Bright-field microscopy of E. gracilis (A/D) and its schematic representation (B/E) where distinct cell elements are indicated by the arrows: (1) nucleus, (2) eyespot, (3) chloroplast, (4) vacuole, (5) paramylon granule, and (6) flagellum. Digital process of bright-field microscopy for chloroplasts highlighting (C/F). Scale bar represents 10 μm.
Disclaimer/Publisher’s Note: The statements, opinions and data contained in all publications are solely those of the individual author(s) and contributor(s) and not of MDPI and/or the editor(s). MDPI and/or the editor(s) disclaim responsibility for any injury to people or property resulting from any ideas, methods, instructions or products referred to in the content. |
© 2025 by the authors. Licensee MDPI, Basel, Switzerland. This article is an open access article distributed under the terms and conditions of the Creative Commons Attribution (CC BY) license (http://creativecommons.org/licenses/by/4.0/).
Copyright: This open access article is published under a Creative Commons CC BY 4.0 license, which permit the free download, distribution, and reuse, provided that the author and preprint are cited in any reuse.


