
Submitted:
14 June 2025
Posted:
16 June 2025
You are already at the latest version
Abstract
Understanding how plant functional strategies scale from species to communities is critical for guiding restoration in tropical disturbed areas by unsustainable livestock grazing, yet the patterns and drivers of functional composition along successional trajectories remain poorly understood. Here, we investigated functional spectra based on eight traits related to leaf, stem, and seed morphology in 226 tree species and 33 forest communities across a chronosequence of natural regeneration following cattle ranching abandonment in de-forested landscapes from Colombian Amazon. We identified three species-level functional spectra—namely, the Size–Seed Investment Spectrum, the Woodiness–Toughness Gradient, and the Leaf Economic Spectrum—and two community-level spectra: the Colonization–Longevity Trade-Off Spectrum and the Persistence–Acquisition Spectrum. These spectra aligned with the life-history strategies of short-lived pioneers, long-lived pioneers, and old-growth species, and reflected their relationships with key environmental drivers. Community-level functional composition reflected species-level patterns, but was also shaped by soil properties, microclimate, and tree species richness. Forest age and precipitation promoted conservative strategies, while declining soil fertility suggested a decoupling between above- and belowground recovery. Functional richness and divergence were highest in mid-successional forests dominated by long-lived pioneers. Our findings highlight the role of environmental and successional filters in shaping functional composition, and emphasize the value of functionally diverse communities—including persistent, long-lived species— to support monitoring and restoration efforts in regenerating Amazonian forests.
Keywords:
functional traits
; trait spectra
; ecological restoration
; Amazonian forests
; secondary succession
; community assembly
1. Introduction
The Amazon plays a critical role in global biodiversity conservation and carbon storage [1]. However, it is increasingly threatened by deforestation and ecological transformation [2,3]. While forest fragmentation in regions such as the Brazilian and Ecuadorian Amazon is primarily driven by road expansion (e.g., fishbone patterns) [4,5], in the Colombian Amazon—particularly in the department of Caquetá—two contrasting dynamics are observed: one linked to agricultural expansion along river corridors as the main access route, leading to progressive forest conversion [6,7], and another associated with human settlements that fragment connectivity between the Andes and the Amazon lowlands, where less than 12% of the territory retains primary or secondary forest cover, and cattle ranching predominates as the main land use (68%) [8,9].
Within this context, secondary tropical forests play a central role in ecological recovery and biodiversity conservation in landscapes affected by extensive land-use change. Areas undergoing natural regeneration after cattle ranching abandonment offer a key opportunity to understand how ecological strategies reorganize along successional trajectories [10,11]. However, these trajectories are highly variable due to legacy effects (e.g., seed bank), environmental conditions (soil, climate, topography), and past land use, which complicates the identification of clear recovery patterns [12,13,14].
Functional traits—morphological, physiological, and reproductive attributes that influence species performance—offer a mechanistic framework for evaluating ecosystem recovery [15,16]. These traits are effective descriptors of plant ecological strategies [17,18], as they reflect presence, dominance, and adaptation to different environments over time [19,20]. However, it remains unclear how land cover changes affect key components of functional diversity, such as composition, richness, evenness, and divergence [21,22].
Trait-based ecology posits that plant species are organized along coordinated functional spectra reflecting trade-offs between resource acquisition, structural investment, and reproductive effort [16,23]. These spectra span gradients such as the leaf economic spectrum (e.g., specific leaf area, leaf dry matter content, leaf thickness), structural or hydraulic spectra (e.g., wood density), and reproductive trade-offs (e.g., seed size and number), all linked to life-history strategies. Understanding how these spectra manifest in regeneration contexts is key to identifying dominant functional archetypes. This leads to our first research question: (1) What species-level functional strategy spectra are exhibited by tree species in secondary forests regenerating after cattle ranching abandonment?
At the community level, shifts in functional composition may reflect not only species turnover but also environmental filtering and functional convergence or divergence throughout succession [24,25]. However, it remains uncertain whether community-level strategy spectra faithfully reflect aggregated species-level patterns or are transformed by local processes. Moreover, it has been proposed that communities with greater functional diversity exhibit higher resilience to environmental fluctuations [26,27,28], as the coexistence of multiple functional strategies provides a buffering effect against disturbance [29,30]. This leads to our second question: (2) Do community-level functional strategy spectra resemble those observed at the species level across a successional gradient? Answering this question is key to evaluating scale dependence in functional patterns and the validity of trait-based monitoring across organizational levels.
Several frameworks have been proposed to explain how functional diversity influences ecosystem functioning. The niche complementarity hypothesis suggests that higher trait diversity enables more efficient and complementary resource use [31,32], while the mass ratio hypothesis proposes that traits of dominant species (e.g., community-weighted means) drive ecosystem functions [33,34]. Both perspectives emphasize the importance of characterizing community-level functional patterns using metrics such as community-weighted means (CWMs) [35].
During succession, it is expected that secondary forests will shift from dominance by acquisitive species to those with more conservative strategies, which can be assessed through combinations of traits associated with the leaf economic spectrum, plant structural traits, and reproductive parameters [15,36]. These combinations also enable classification into Competitor–Stress-tolerator–Ruderal (CSR) strategies [37].
The environmental context in which forests regenerate influences both trait expression and functional assembly. Soil conditions, microclimate, topography, and land-use legacies all affect functional composition [38,39]. This brings us to our final question (3) ¿How do environmental variables, successional stage, and community composition interact to shape functional assembly?. This question aim to evaluate how abiotic gradients influence the distribution of functional traits and life-history strategies thorough chronosequence.
By integrating species- and community-level trait data with environmental and successional gradients, this study provides a mechanistic understanding of forest recovery dynamics in a critically deforested region of the Colombian Amazon. This functional perspective is particularly valuable for supporting ecological restoration and monitoring practices, as it facilitates the identification of trait-based indicators and syndromes associated with forest structure, function, and resilience. Ultimately, our findings offer robust evidence to inform restoration strategies in tropical landscapes affected by extensive cattle ranching, highlighting the value of functional traits as tools to assess successional trajectories and restoration outcomes.
2. Materials and Methods
2.1. Study Area and Sampling Design
The study was conducted in the department of Caquetá, located in the northwestern Colombian Amazon, encompassing the municipalities of Florencia (1°36′50″ N; 75°36′46″ W), Morelia (1°29′09″ N; 75°43′28″ W), Belén de los Andaquíes (1°24′59.1″ N; 75°52′21.2″ W), San José del Fragua (1°19′52″ N; 75°58′28″ W), and Albania (1°19′44″ N; 75°52′42″ W) (Supplementary Figure S1). The sampling sites are in a humid-warm tropical climate with a unimodal precipitation regime, an average annual rainfall of 3,376 mm, and a mean temperature of 25.04 °C. Soils in the region are predominantly Oxisols and Ultisols, characterized by low fertility and aeration, acidic conditions (pH < 6), high aluminum saturation (>60%), and clayey texture [40]. Physiographically, the landscape is mainly composed of hilly and mountainous terrain, with land cover dominated by pastures used for cattle ranching, crops, remnants of SFs, and mature forest, as described by Rodríguez et al. [41,42].
A total of 33 plots measuring 50 × 50 m (0.25 ha each) were established across two landscape types: hill (14 plots) and mountain (19 plots). Within each landscape unit, plots were classified along a chronosequence of abandoned pastures (based on time since abandonment as a proxy for secondary forest age) up to mature forest, into five successional categories, as defined by Rodríguez-Léon et al. [42]: (i) time since abandonment less than 10 years (<10), corresponding to secondary forests dominated by shrub and pioneer vegetation; (ii) time since abandonment between 11 and 20 years (10–20), corresponding to young secondary forests; (iii) time since abandonment between 21 and 30 years (21–30), corresponding to intermediate secondary forests; (iv) time since abandonment between 31 and 40 years (31–40), corresponding to advanced secondary forests; and (v) mature or old-growth forest (OF) (~ 100 years). A total of five, six, six, six, and ten plots were evaluated in the <10, 10–20, 21–30, 31–40, and OF categories, respectively, across the two landscape types. Forest age was defined as time since abandonment for secondary forests, while OF were considered as reference sites with no known history of recent disturbance.
2.2. Floristic Data Collection
Within each plot, all trees with a diameter at breast height (DBH) ≥ 10 cm were tagged and identified. Total height (TH) and commercial height (CH) were measured using a Suunto PM-5 clinometer. Collected specimens were processed, taxonomically identified, and deposited at the Colombian Amazon Herbarium (COAH) of the Instituto SINCHI in Bogotá, Colombia. For functional analysis, species representing at least 55% of the cumulative importance value index (IVI) in each successional category were selected. From a total of 541 fully identified species, those with a minimum of 10 replicate individuals were prioritized, resulting in a final subset of 226 species.
2.3. Trait Sampling and Life-History Strategies
On average, one individual per plot was sampled, as recommended for species-rich plant communities [43]. Individuals were randomly selected from the known individuals within 0.25 ha plots for each successional category. Leaf and wood traits were measured following the standardized protocols of Pérez-Harguindeguy et al. [44]. The following traits were measured: leaf area (LA, mm²), leaf thickness (LTh, mm), leaf dry matter content (LDMC, mg dry mass g⁻¹), specific leaf area (SLA, mm² mg⁻¹), tree height (H, m), and wood density (WD, g cm⁻³). Reproductive traits, including seed mass (SM, mg) and seed size (SS, mm³), were obtained from secondary sources [45,46,47,48,49,50,51,52]
Life-history strategies represent coherent sets of functional traits that describe how species grow, survive, and reproduce in their environment over time [53,54]. In this study, we compared three functional life-history types, defined by differences in longevity, growth rate, and successional position, following ter Steege et al. [25,55] and Finegan [56]: short-lived pioneers (SLP), which establish in the early stages of succession; long-lived pioneers (LLP), which arrive later and persist over extended periods; and old-growth species (OGS), typical of stable, undisturbed environments, where they persist long-term and compete efficiently for ecosystem resources.
2.3. Environmental Parameters
Sixteen environmental parameters were assessed in each plot, following methodologies comparable to those reported in previous studies [41,57]: (i) Four variables related to aboveground conditions: slope (%) measured with a laser hypsometer (Forestry Pro II); elevation (m a.s.l.) obtained with a GPS-enabled digital altimeter (GPSMAP 64CSX); ambient temperature (°C) and precipitation (mm year⁻¹), both extracted from the WorldClim dataset [58]. (ii) Twelve soil physicochemical properties: penetration resistance (MPa) measured in situ using a 3-meter Eijkelkamp hand penetrometer; texture (sand, clay, and silt) (%) determined via direct analysis/Bouyoucos method; bulk density (g cm⁻³) using an Eijkelkamp hand auger; soil moisture (%) via saturation paste/gravitational method (USDA S.L.); pH measured by saturation paste/conductometric method (USDA S.L.); cation exchange capacity (CEC) (meq 100 g⁻¹) via NaOH 1 M titration; electrical conductivity (EC) (dS m⁻¹) using saturation paste/conductometric method (USDA S.L.); exchangeable acidity (EA) (mg kg⁻¹) via 1N KCl volumetric method (NTC 5263); soil organic carbon (SOC) (%) determined using the potassium dichromate colorimetric method (NTC 5403, Walkley–Black); and total nitrogen (N) content via the Kjeldahl method.
2.4. Data Analysis
To quantify and visualize functional trait space across different organizational levels: (i) all tree species, (ii) a subset of species from the most representative plant families (i.e., those with the highest number of species), and (iii) plant communities along the chronosequence, we performed a series of principal component analyses (PCAs) based on the average trait values of all species, the average values for a subset of species from selected families, and the community-weighted means of each trait across the 33 plots, respectively. These analyses were performed using the princomp and funspace functions from the stats [59] and funspace [60,61] packages in R language version 4.3.3 [62], respectively. PCAs were used to identify the fundamental functional dimensions (i.e., functional spectra) along which species, families, or plots are segregated [16,21,25,61,63]. Prior to PCAs, trait data were log10-transformed and scaled to a mean of 0 and a standard deviation of 1. Horn’s parallel analysis, implemented with the paran function from the R package paran [64], was used to determine the optimal dimensionality of each PCA [63].
Life-history characteristics and environmental factors were subsequently incorporated into the functional trait space as supplementary variables using the envfit function from the R package vegan [65]. Life-history strategies and chronosequence were also used as grouping criteria in the global PCA-based functional spaces. To compare trait associations at the species and community levels, Mantel test was performed on the trait distance matrices derived from the PCA space using the mantel function from the vegan R package.
Linear mixed-effects models (LMMs) were fitted to assess the effect of chronosequence on functional composition (i.e., PC and PC2 scores, and traits of the community-level) using the lme function from the nlme R package [66], implemented through the InfoStat v.2020 interface [67]. Landscape (hill and mountain) was included as a random effect (1|Landscape). Normality and homoscedasticity were evaluated thorough exploratory analysis of the models residuals. Post hoc comparisons of means across chronosequence were conducted using Fisher’s LSD test (α=0.05).
To explore the relationship between functional spectra (i.e., PC1 and PC2), age forest, tree species richness, and environmental factors (i.e., soil properties and aboveground conditions), pairwise Pearson correlation matrices and Mantel tests were performed using the pairs.panels and mantel_test functions from the psych [68] and LinkET [69] R packages, respectively. Subsequently, LMMs were fitted using the lmer function from the lme4 [70] and lmerTest [71] R packages to evaluate how tree species richness, forest age, and environmental factors influenced the functional spectra. Landscape was again included as a random effect. All predictors were scaled prior to fitting the LMMs to enable direct comparison of effect sizes. To evaluate multicollinearity among predictors, variance inflation factor (VIF) analysis was conducted using the vif function from the car R package [72]. After removing collinear variables, the resulting full models for PC1 and PC2 were used in a model averaging procedure to identify the best combination of predictors explaining variation in functional spectra. Model selection was based on all possible combinations of the predictors using the dredge, subset, and model.avg functions in the MuMIn R package [73], following a maximum likelihood approach and ranked according to the Akaike Information Criterion (ΔAIC ≤ 2) [38,63]. Standardized fixed-effect coefficients from the final models were visualized using the ggplot2 R package [74].
Additionally, Horn’s parallel analysis and PCA were applied to the matrix of environmental factors to extract principal components, which were then used as predictors of functional spectra through linear regression using the lm function from the stats R package. Resulting models were visualized using the ggplot2 R package.
Finally, structural equation models (SEMs) were used to explore direct and indirect effects among tree species richness, forest age, environmental factors, and community-level functional spectra (PC1 and PC2). The best SEMs were selected based on the Chi-square test (χ²), degrees of freedom (df), Comparative Fit Index (CFI), Tucker-Lewis Index (TLI), Root Mean Square Error of Approximation (RMSEA), and Standardized Root Mean Square Residual (SRMR). SEMs were performed using the sem and semPaths functions from the lavaan [75] and semPlot [76] R packages, respectively. All statistical analyses in R were conducted using the RStudio v.2025.05.0 interface [77].
3. Results
3.1. Plant-Strategy Spectra at Species Level
To address the first research question—regarding the species-level functional spectra in secondary forests regenerating after cattle ranching abandonment—we conducted two PCAs: one based on all 226 species, and another on a subset of 81 species from the five most representative families (i.e., Fabaceae, Melastomataceae, Burseraceae, Lauraceae, and Moraceae) (Figure 1 and Figure 2, respectively). In both cases, Horn’s parallel analysis retained the first three principal components (PCs) (Supplementary Figures S2 and S4). Life-history strategies (SLP, LLP, OGS) were included as supplementary variables in the PCAs to aid interpretation of the functional gradients.
Figure 1.
Functional trait space of 226 tree species in regenerating Amazonian forests following livestock abandonment. (A) Trait space defined by the PC1–PC2 plane. PC1 (eigenvalue = 1.64) represents the ‘Size–Seed Investment Spectrum’ (H, SS, SM). PC2 (eigenvalue = 1.40), captures the ‘Woodiness–Toughness Gradient’ (WD, LA, LTh). PC1 was strongly associated to SLP species (negatively), whereas PC2 was linked to LLP and OGS (positively and negatively, respectively). (B) Trait space defined by the PC1–PC3 plane. PC3 (eigenvalue = 1.20), represents the Leaf Economic Spectrum (SLA, LDMC), and was mainly associated with SLP species (negatively). Colors indicate the probability density of functional trait combinations in multivariate space (red = high probability; yellow = low), while contour lines represent the 0.99, 0.50, and 0.25 quantiles of that distribution. Functional Richness (FRic) and Functional Divergence (FDiv) indices are shown, representing the volume of trait space occupied and the dispersion of species within that space, respectively. Life-history strategies are depicted in brown: Old-Growth Species (OGS), Long-Lived Pioneers (LLP), and Short-Lived Pioneers (SLP). Trait vectors are shown in black: Wood Density (WD), Tree Height (H), Leaf Area (LA), Specific Leaf Area (SLA), Leaf Dry Matter Content (LDMC), Leaf Thickness (LTh), Seed Mass (SM), and Seed Size (SS).
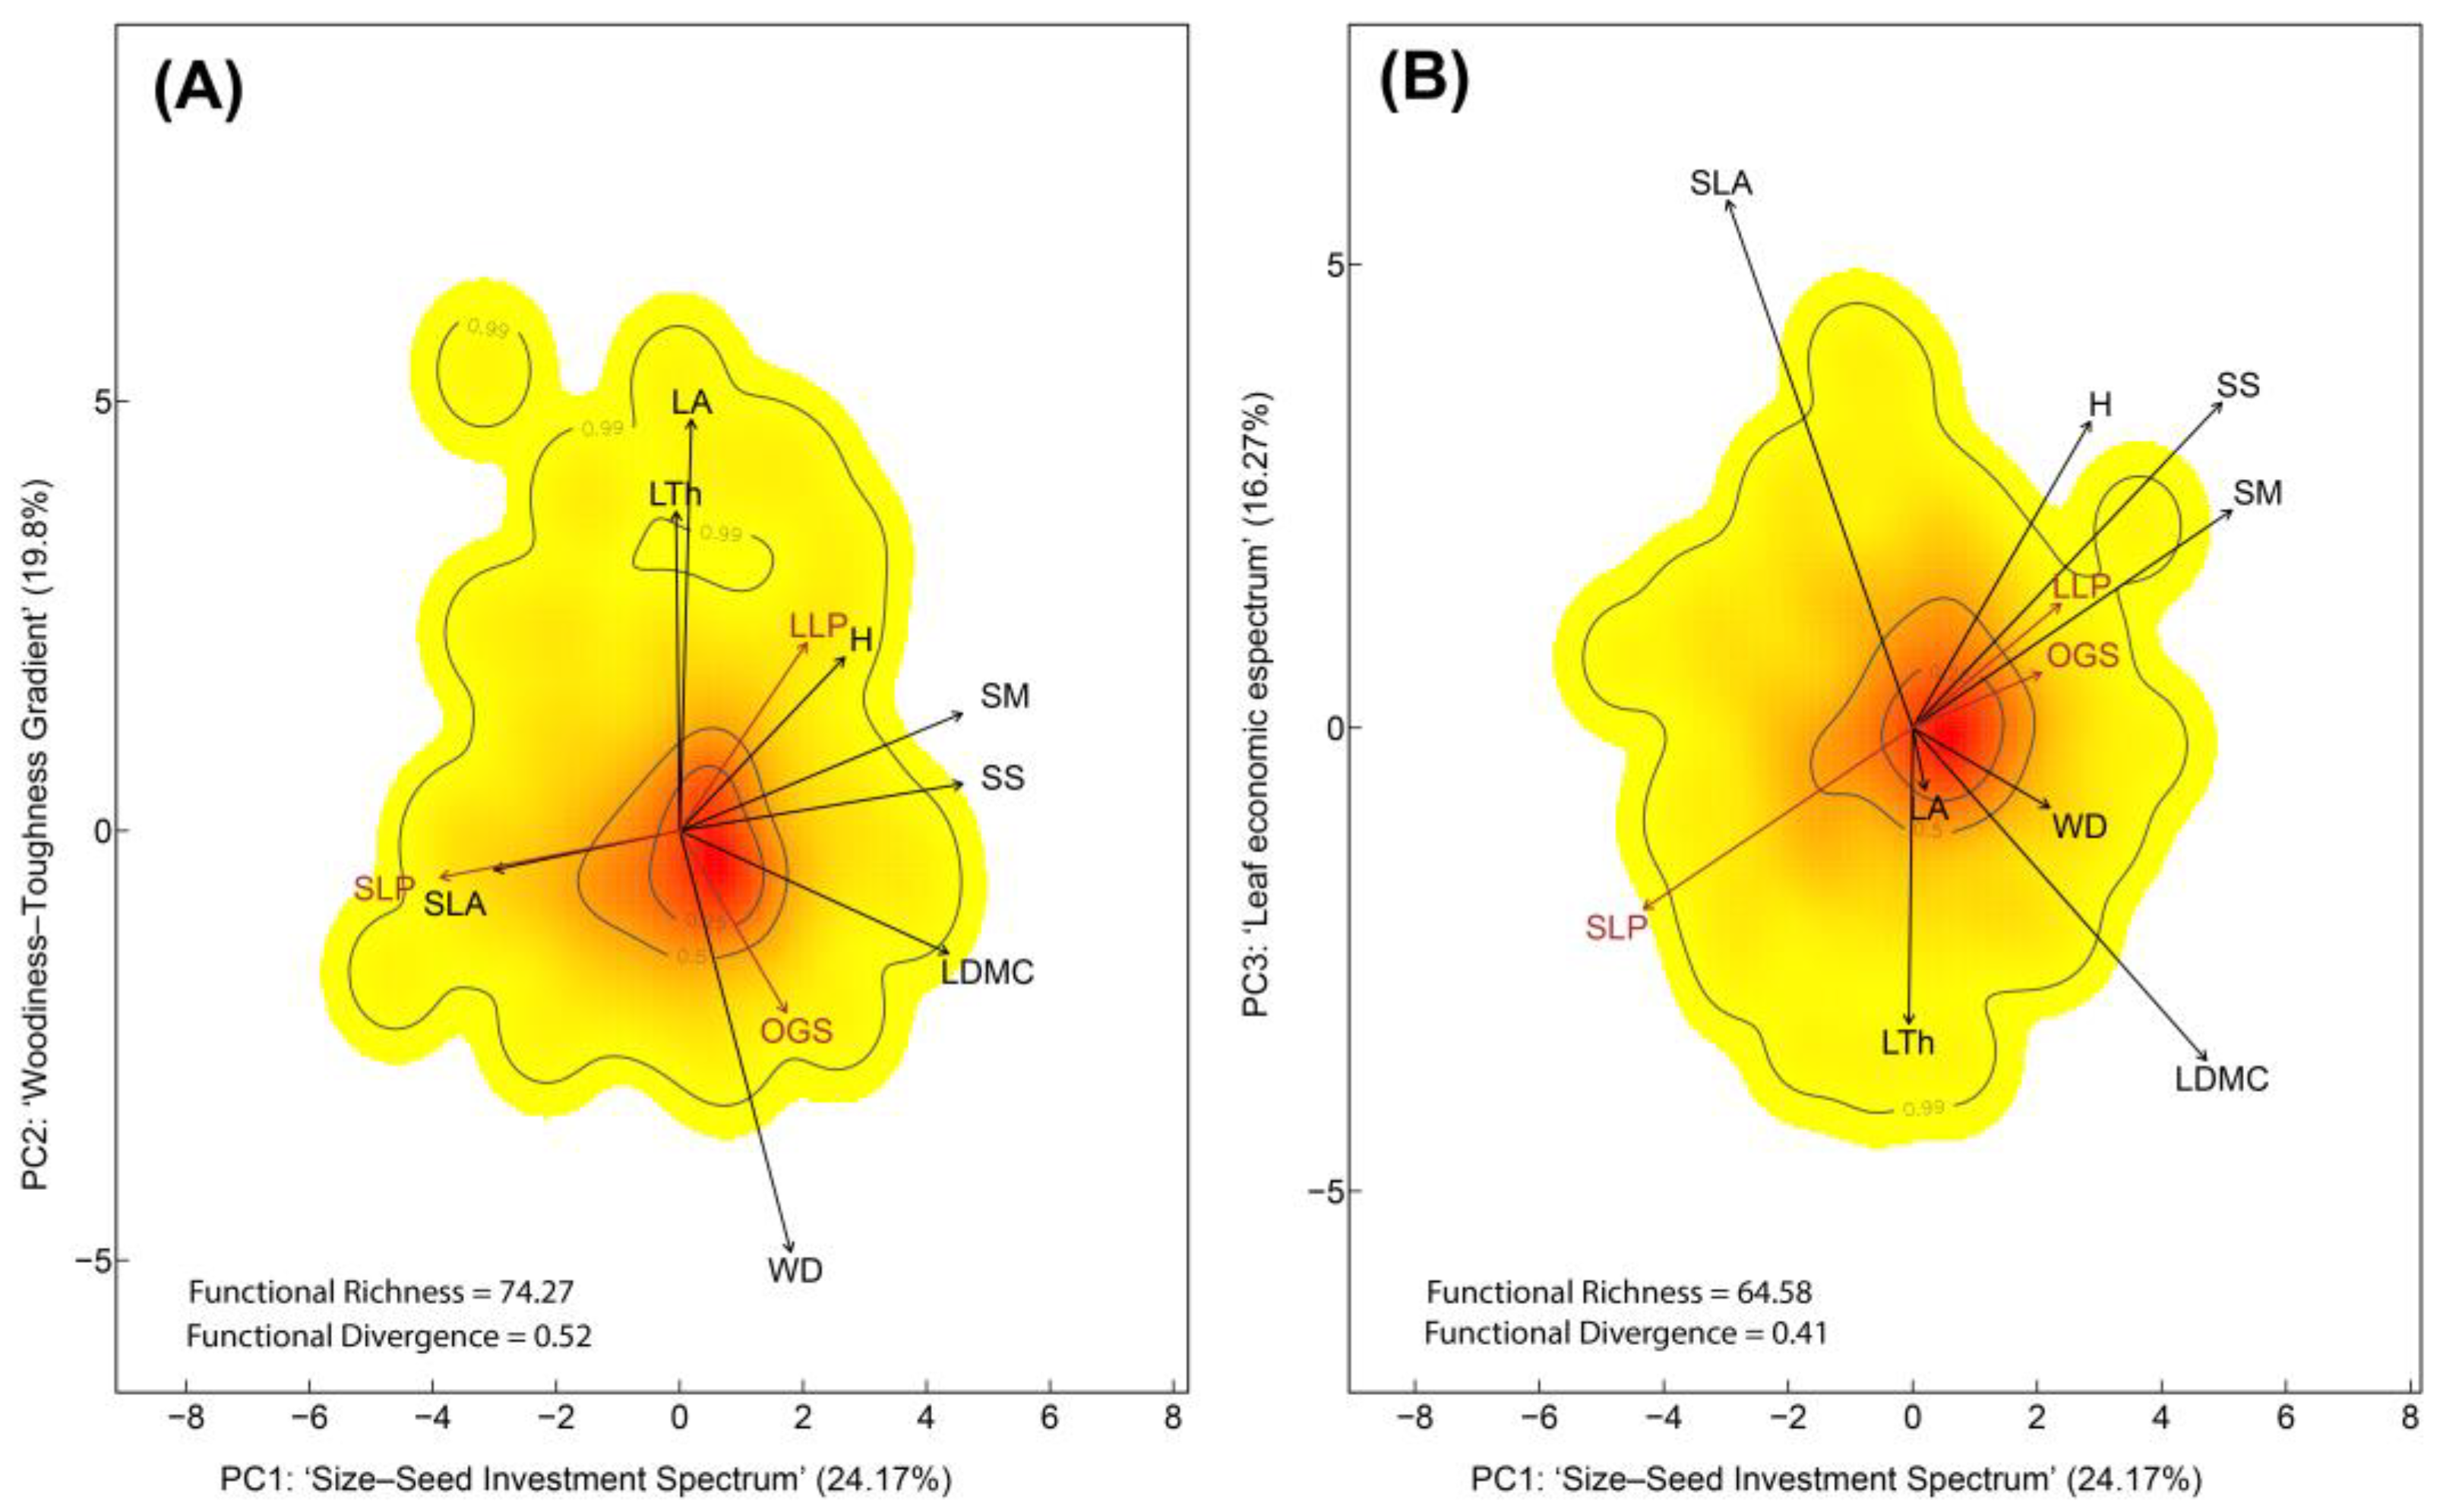
In the first PCA (Figure 1), PC1 explained 24.17% of the total variance (Supplementary Table S1) and represented the ‘Size–Seed Investment Spectrum’, with high loadings for H, SM and SS (Table 1). This axis was primarily associated with SLP (72 species) (Supplementary Table S2). Species such as Albizia pedicellaris (DC.) L.Rico, Croton lechleri Müll.Arg., and Miconia aurea (D. Don) Naudin —representatives of SLP were positioned at the lower end of PC1, characterized by high SLA and low values of H, SS and SM, reflecting acquisitive resource-use strategies. In contrast, LLP and OGS, including Astrocaryum chambira Burret, Pouteria campanulata Baehni and Licania heteromorpha Benth., were located at the upper end of PC1, exhibiting high values of H, SM, and SS, and low SLA, which are trait combinations indicative of conservative life-history strategies. PC2 accounted for 19.8% of the variance and represented the ‘Woodiness–Toughness Gradient’, defined by LA, LTh, and WD and predominantly associated with LLP (109 species) and OGS (45 species). Species such as Endlicheria robusta (A.C.Sm.) Kosterm., Perebea mollis (Poepp. & Endl.) Hube, and Pseudolmedia macrophylla Trécul —representatives of LLP as well as Talisia cerasina (Benth.) Radlk, Calliandra surinamensis Benth., and Licania harlingii Prance, typical of OGS, were positioned at the lower end of PC2, characterized by high WD and low values of LA and LTh. PC3 captured 16.27% of the variance and reflected the ‘Leaf Economic Spectrum’ (LES), distinguishing acquisitive species (e.g., high SLA) from conservative species (e.g., high LDMC).
Functional richness (FRich) and functional divergence (FDiv) were higher in the PC1–PC2 trait space (FRich = 74.27%, FDiv = 0.52) (Figure 1A) than in the PC1–PC3 space (FRich = 64.58%, FDiv = 0.41) (Figure 1B). FRich and FDiv were also calculated for each life history within the global trait space (Supplementary Figure S3). Thus, LLP and SLP exhibited higher FRic and FDiv values in both trait spaces compared to OGS. This pattern indicated that pioneer species exhibited more varied and divergent functional strategies than those typical of OGS.

Table 1.
Percentage of variance explained by each trait within each functional spectrum, based on the full-species PC1–PC2 and PC1–PC3 trait spaces.
Table 1.
Percentage of variance explained by each trait within each functional spectrum, based on the full-species PC1–PC2 and PC1–PC3 trait spaces.
| Trait | Trait variation PC1-PC2 = 43.97% | Trait variation PC1-PC3 = 40.44% | Spectrum | ||||||
|---|---|---|---|---|---|---|---|---|---|
| PC1 | PC2 | R2 | p-value | PC1 | PC3 | R2 | p-value | ||
| WD | 0.091 | 0.551 | 0.641 | 0.001 | 0.091 | 0.009 | 0.100 | 0.001 | WTG |
| LA | 0.001 | 0.538 | 0.539 | 0.001 | 0.001 | 0.008 | 0.009 | 0.368 | WTG |
| SM | 0.500 | 0.037 | 0.536 | 0.001 | 0.500 | 0.071 | 0.570 | 0.001 | SSIS |
| SS | 0.496 | 0.006 | 0.501 | 0.001 | 0.496 | 0.167 | 0.662 | 0.001 | SSIS |
| LDMC | 0.454 | 0.040 | 0.494 | 0.001 | 0.454 | 0.176 | 0.630 | 0.001 | LES |
| LTh | 0.000 | 0.325 | 0.325 | 0.001 | 0.000 | 0.183 | 0.183 | 0.001 | WTG |
| H | 0.179 | 0.084 | 0.263 | 0.001 | 0.179 | 0.162 | 0.341 | 0.001 | SSIS |
| SLA | 0.213 | 0.004 | 0.217 | 0.001 | 0.213 | 0.526 | 0.739 | 0.001 | LES |
Wood Density (WD), Tree Height (H), Leaf Area (LA), Specific Leaf Area (SLA), Leaf Dry Matter Content (LDMC), Leaf Thickness (LTh), Seed Mass (SM), and Seed Size (SS). PC1: Size–Seed Investment Spectrum (SSIS), PC2: Woodiness–Toughness Gradient (WTG), PC3: Leaf Economic Spectrum (LES). R² values indicate the proportion of variance explained by each trait within the functional space, and p denotes the level of statistical significance.
In the second PCA (Figure 2), the relative contribution of traits to the first three PCs shifted compared to the full-species PCA. PC1 (eigenvalue = 1.61) explained 26.33% of the total variance (Supplementary Table S3) and was primarily defined by SM and SS, representing the ‘Size–Seed Investment Spectrum’ (Table 2), consistent with the full-species PCA. This axis contrasted SLP with LLP and OGS (Supplementary Table S4). In this case, PC2 (eigenvalue = 1.42) accounted for 21.56% of the variance and grouped traits related to the ‘Leaf Economic Spectrum’, with acquisitive species showing higher SLA and LDMC wood density (WD), and leaf thickness (LTh). Finally, PC3 (eigenvalue = 1.22) explained 16.27% of the variance and captured traits associated with the ‘Woodiness–Toughness Gradient’, particularly in OGS, which exhibited higher values of WD and LDMC.
FRich was greater in the trait space defined by PC1 and PC2, with a value of 63.35, compared to 55.20 in the PC1–PC3 space. Conversely, FDiv was slightly lower in the PC1–PC2 space (0.51) than in PC1–PC3 (0.58). These results suggest that greater functional richness—but somewhat lower trait dispersion—is expressed along the PC1–PC2 axes, primarily reflecting the wide range of strategies associated with LLP. Conversely, the higher FDiv observed in the PC1–PC3 plane may reflect the greater structural trait differentiation typical of OGS (Supplementary Figure S5).
Figure 2.
Functional trait space of 81 tree species from the five most representative families in regenerating Amazonian forests following livestock abandonment. (A) Trait space defined by the PC1–PC2 plane. PC1 (eigenvalue = 1.61) represents the ‘Size–Seed Investment Spectrum’ (H, SS, SM). PC2 (eigenvalue = 1.42), captures the ‘Leaf Economic Spectrum’ (SLA, LDMC). PC1 showed a strong negative association with SLP species, and a positive association with both LLP and OGS species. (B) Trait space defined by the PC1–PC3 plane. PC3 (eigenvalue = 1.22), represents the ‘Woodiness–Toughness Gradient’ (WD, LA, LTh) and was strongly associated with OGS (positively). Colors indicate the probability density of functional trait combinations in multivariate space (red = high probability; yellow = low), while contour lines represent the 0.99, 0.50, and 0.25 quantiles of that distribution. Functional Richness (FRic) and Functional Divergence (FDiv) indices are shown. Life-history strategies are depicted in brown: Old-Growth Species (OGS), Long-Lived Pioneers (LLP), and Short-Lived Pioneers (SLP). Trait vectors are shown in black: Wood Density (WD), Tree Height (H), Leaf Area (LA), Specific Leaf Area (SLA), Leaf Dry Matter Content (LDMC), Leaf Thickness (LTh), Seed Mass (SM), and Seed Size (SS).
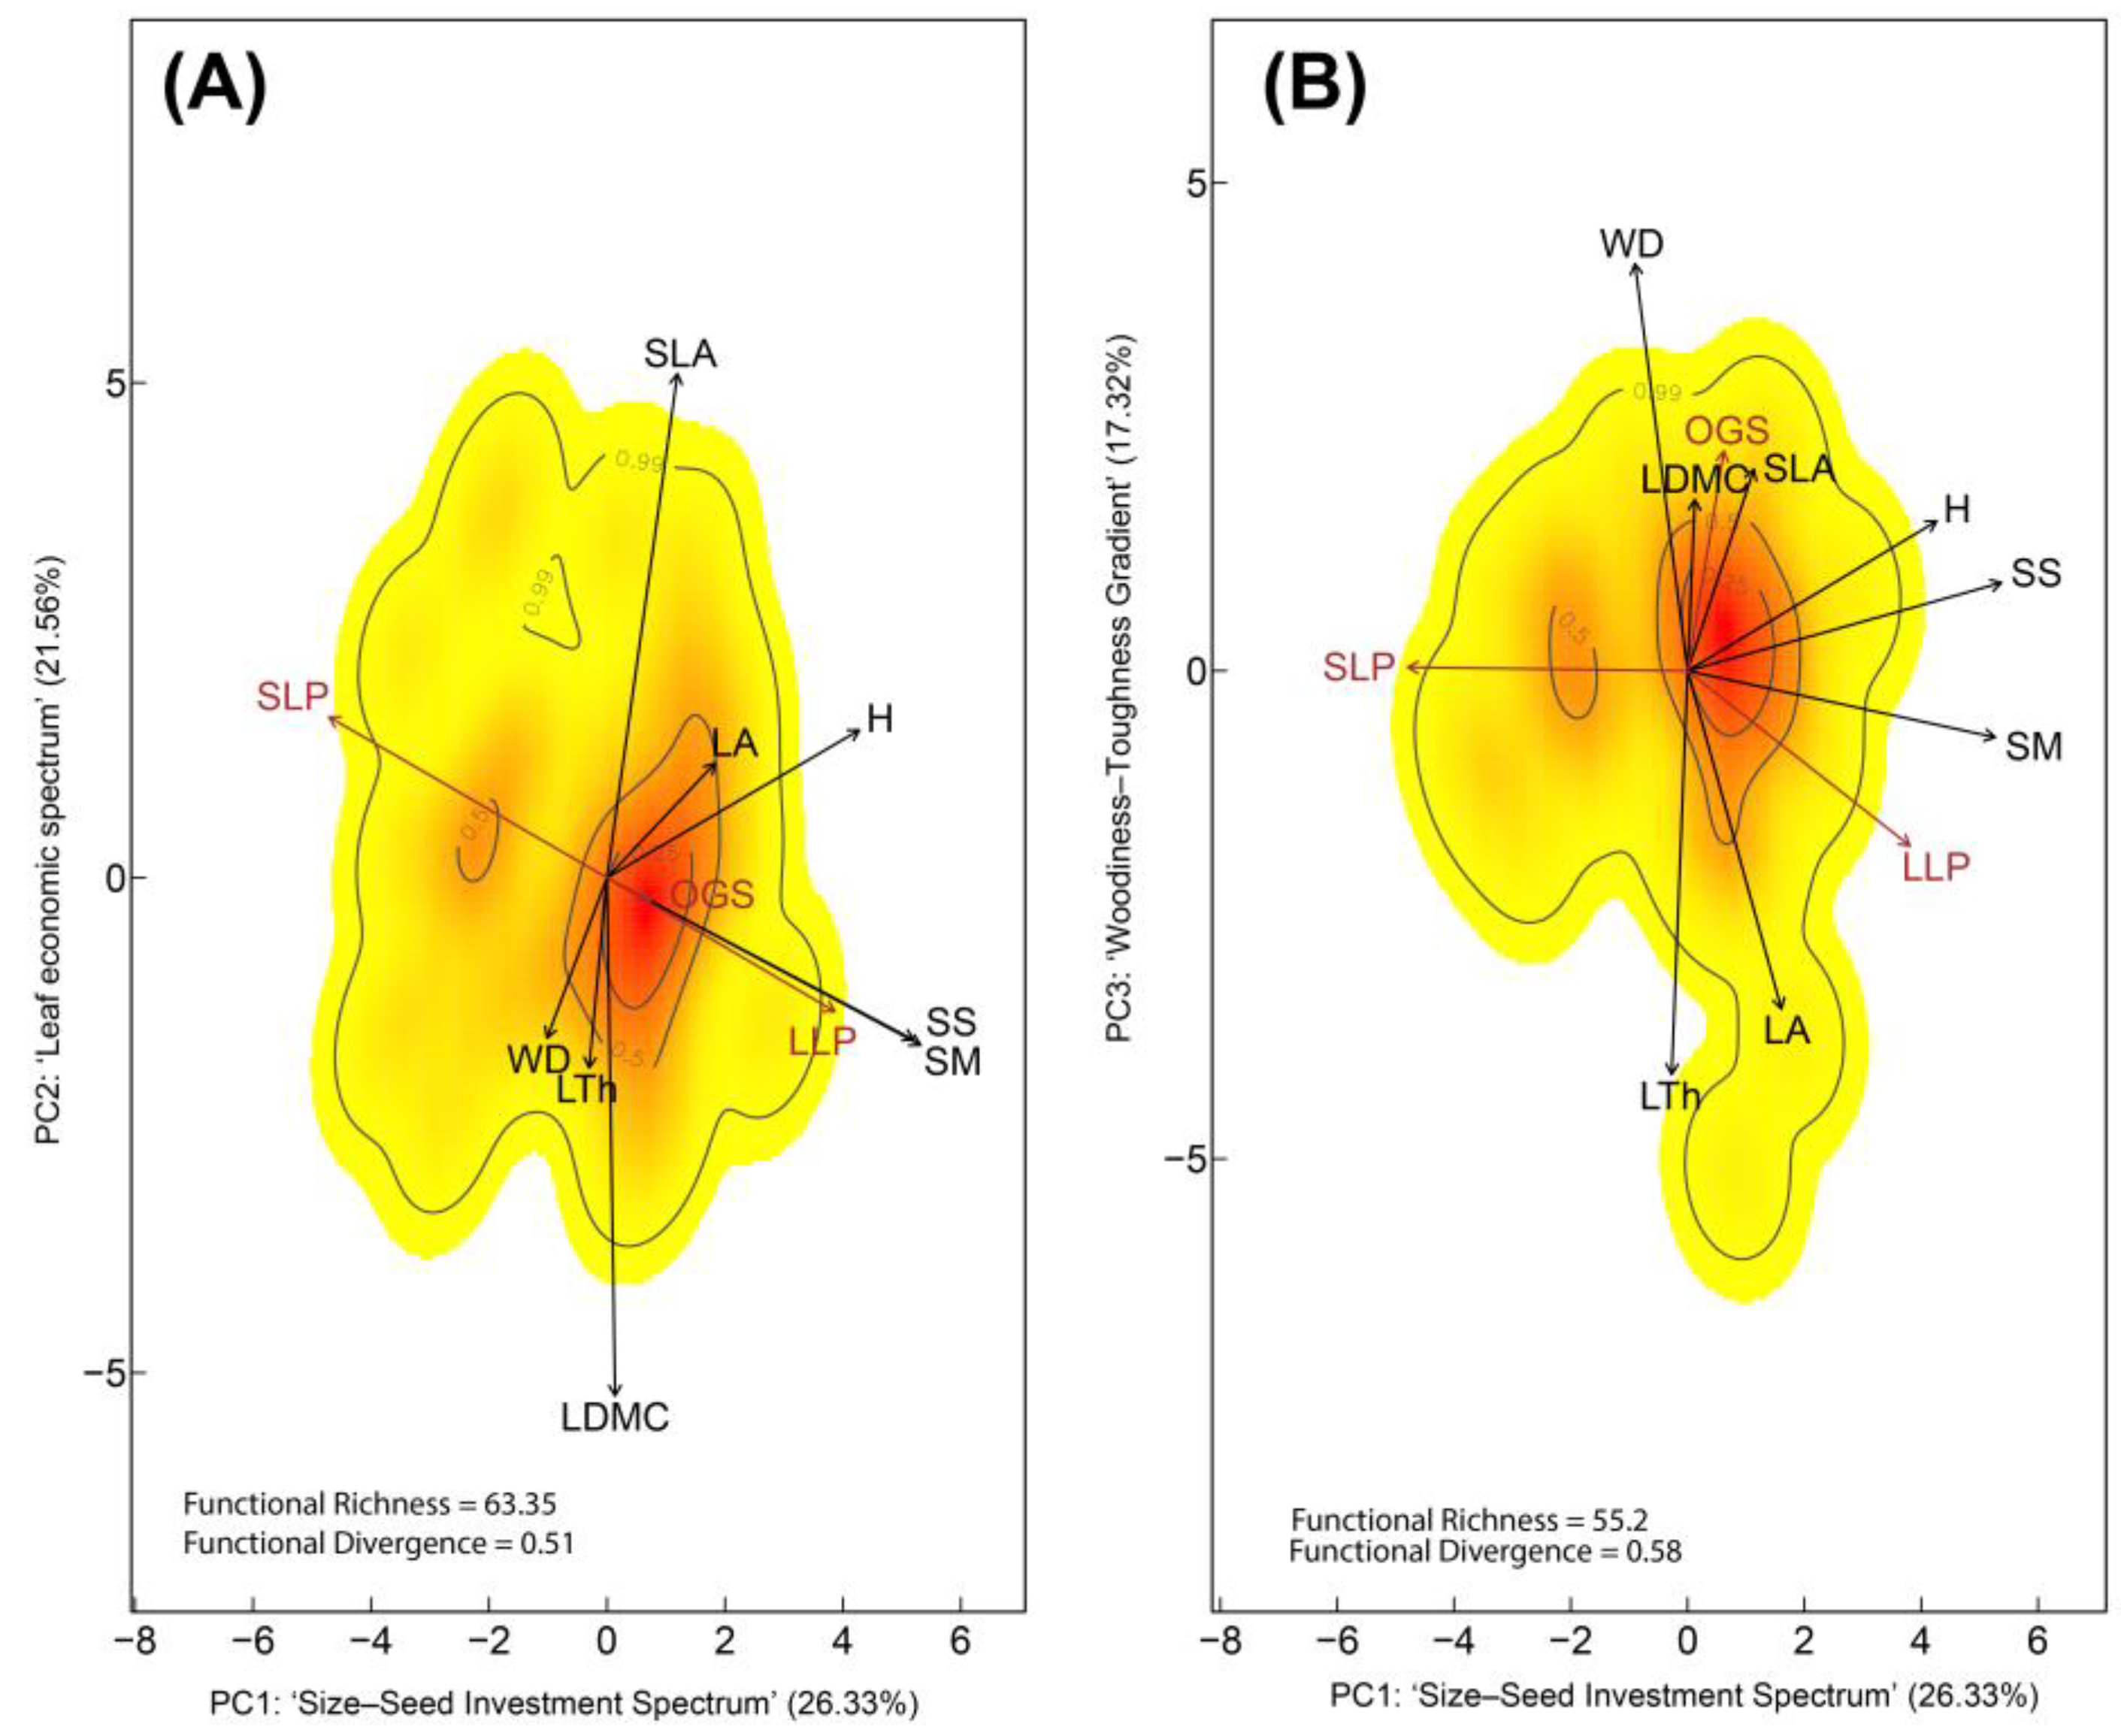
Table 2.
Percentage of variance explained by each trait within each functional spectrum, based on the PC1–PC2 and PC1–PC3 trait spaces constructed from a subset of 81 tree species belonging to the five most representative families.
Table 2.
Percentage of variance explained by each trait within each functional spectrum, based on the PC1–PC2 and PC1–PC3 trait spaces constructed from a subset of 81 tree species belonging to the five most representative families.
| Trait | Trait variation PC1-PC2 = 47.90% | Trait variation PC1-PC3 = 43.60% | Spectrum | ||||||
|---|---|---|---|---|---|---|---|---|---|
| PC1 | PC2 | R2 | p-value | PC1 | PC3 | R2 | p-value | ||
| SS | 0.743 | 0.061 | 0.804 | 0.001 | 0.743 | 0.014 | 0.757 | 0.001 | SSIS |
| SM | 0.711 | 0.058 | 0.768 | 0.001 | 0.711 | 0.008 | 0.719 | 0.001 | SSIS |
| H | 0.482 | 0.048 | 0.53 | 0.001 | 0.482 | 0.041 | 0.523 | 0.001 | SSIS |
| WD | 0.031 | 0.064 | 0.094 | 0.021 | 0.031 | 0.433 | 0.464 | 0.001 | WTG |
| LTh | 0.003 | 0.095 | 0.098 | 0.021 | 0.003 | 0.435 | 0.437 | 0.001 | WTG |
| LA | 0.092 | 0.03 | 0.122 | 0.007 | 0.092 | 0.28 | 0.371 | 0.001 | WTG |
| SLA | 0.045 | 0.662 | 0.707 | 0.001 | 0.045 | 0.097 | 0.142 | 0.005 | LES |
| LDMC | 0.001 | 0.707 | 0.708 | 0.001 | 0.001 | 0.078 | 0.079 | 0.040 | LES |
Wood Density (WD), Tree Height (H), Leaf Area (LA), Specific Leaf Area (SLA), Leaf Dry Matter Content (LDMC), Leaf Thickness (LTh), Seed Mass (SM), and Seed Size (SS). PC1: Size–Seed Investment Spectrum (SSIS), PC2: Woodiness–Toughness Gradient (WTG), PC3: Leaf Economic Spectrum (LES). R² values indicate the proportion of variance explained by each trait within the functional space, and p denotes the level of statistical significance.
When exploring the functional space for each family in the PC1–PC2 plane, the families with the highest functional richness and divergence (FRich; FDiv) were: Melastomataceae (36.63; 0.48), Fabaceae (32.97; 0.43), Moraceae (32.77; 0.43), Lauraceae (25.39; 0.38), and Burseraceae (25.60; 0.50). Traits most strongly associated with PC1 in this plane were SM and SS. In contrast, in the PC1–PC3 plane, the families with the highest functional contributions were Fabaceae (36.43; 0.47), Moraceae (34.17; 0.44), Burseraceae (29.47; 0.57), Melastomataceae (22.20; 0.43), and Lauraceae (22.02; 0.37). In this space, the traits most strongly associated with PC1 were LA and LTh, and with PC3 were SLA and LDMC (Supplementary Figure S6).
3.2. Plant-Strategy Spectra at Community-Level
In response to question two—whether community-level functional strategy spectra resemble those observed at the species level—we first identified the functional strategy spectra at the community level observed in secondary forests regenerating after livestock abandonment. Then, we compared the similarity between the two functional spaces by correlating their pairwise distance matrices.
To identify community-level functional strategy spectra, a third PCA was performed on the community-weighted means (CWMs) of eight traits from 33 plant communities distributed along the chronosequence. Additionally, 16 environmental variables and three life-history strategies were included as supplementary variables (Figure 3 and Table 3). In this case, Horn’s parallel analysis retained only the first two principal components (Supplementary Figure S7).
PC1 (eigenvalue = 2.69; 43.81% of the variance) represented the ‘Colonization–Longevity Trade-off Spectrum’ (Supplementary Table S5), contrasting SLP with LLP (Supplementary Table S6). Communities dominated by SLP (negative PC1 axis) with specie such as A. pedicellaris, Henriettea fascicularis (Sw.) M. Gómez and Jacaranda copaia (Aubl.) D.Don identified at secondary forests with < 10 years old, were characterized with highly acquisitive traits (e.g., high SLA, rapid colonization), while LLP-dominated communities (positive PC1 axis) with specie such as A. chambira, Astrocaryum cuatrecasasianum Dugand and P. campanulata identified in secondary forests ranging from 10 to 40 years old, were associated with structurally persistent traits, such as greater height and heavier seeds (Table 3). Thus, SLP communities reflect acquisitive colonization strategies, whereas LLP assemblages are defined by competitive and persistent trait investment.
PC2 (eigenvalue = 1.10; 19.78% of the variance) represented the ‘Persistence–Acquisition Spectrum’, separating OGS from both pioneer types (SLP and LLP). OGS with species such as Compsoneura capitellata (Poepp. ex A.DC.) Warb., T. cerasina, C. surinamensis, L. harlingii, Hymenaea oblongifolia Huber, Dialium guianense (Aubl.) Sandwith and Cedrela odorata L. identified in mature forests, were associated with traits linked to structural persistence and conservative resource use (e.g., high WD and LDMC), consistent with their dominance in stable, late-successional forest environments.
Figure 3.
Trait space based on the community-weighted means of eight traits from 33 tree communities in regenerating Amazonian forests following livestock abandonment. Trait space defined by PC1 and PC2 (eigenvalues = 2.69 and 1.10, respectively). PC1 represents the ‘Colonization–Longevity Trade-Off Spectrum’, contrasting SLP species—with fast-acquisition traits such as high SLA—with LLP species characterized by taller stature and larger, heavier seeds. PC2 reflects the ‘Persistence–Acquisition Spectrum’, separating OGS from both pioneer types based on conservative structural traits such as WD and LDMC. Colors indicate the probability density of functional trait combinations in multivariate space (red = high probability; yellow = low), while contour lines represent the 0.99, 0.50, and 0.25 quantiles of that distribution. Functional Richness (FRic) and Functional Divergence (FDiv) indices are shown. Life-history strategies are depicted in brown: Old-Growth Species (OGS), Long-Lived Pioneers (LLP), and Short-Lived Pioneers (SLP). Environmental factors displayed in blue: elevation, ambient temperature (Temp), precipitation (Prec), penetration resistance, texture (sand, clay, and silt), bulk density, soil moisture, pH, cation exchange capacity (CEC), electrical conductivity (EC), exchangeable acidity (EA), soil organic carbon (SOC), total nitrogen (N). Trait vectors are shown in black: Wood Density (WD), Tree Height (H), Leaf Area (LA), Specific Leaf Area (SLA), Leaf Dry Matter Content (LDMC), Leaf Thickness (LTh), Seed Mass (SM), and Seed Size (SS).
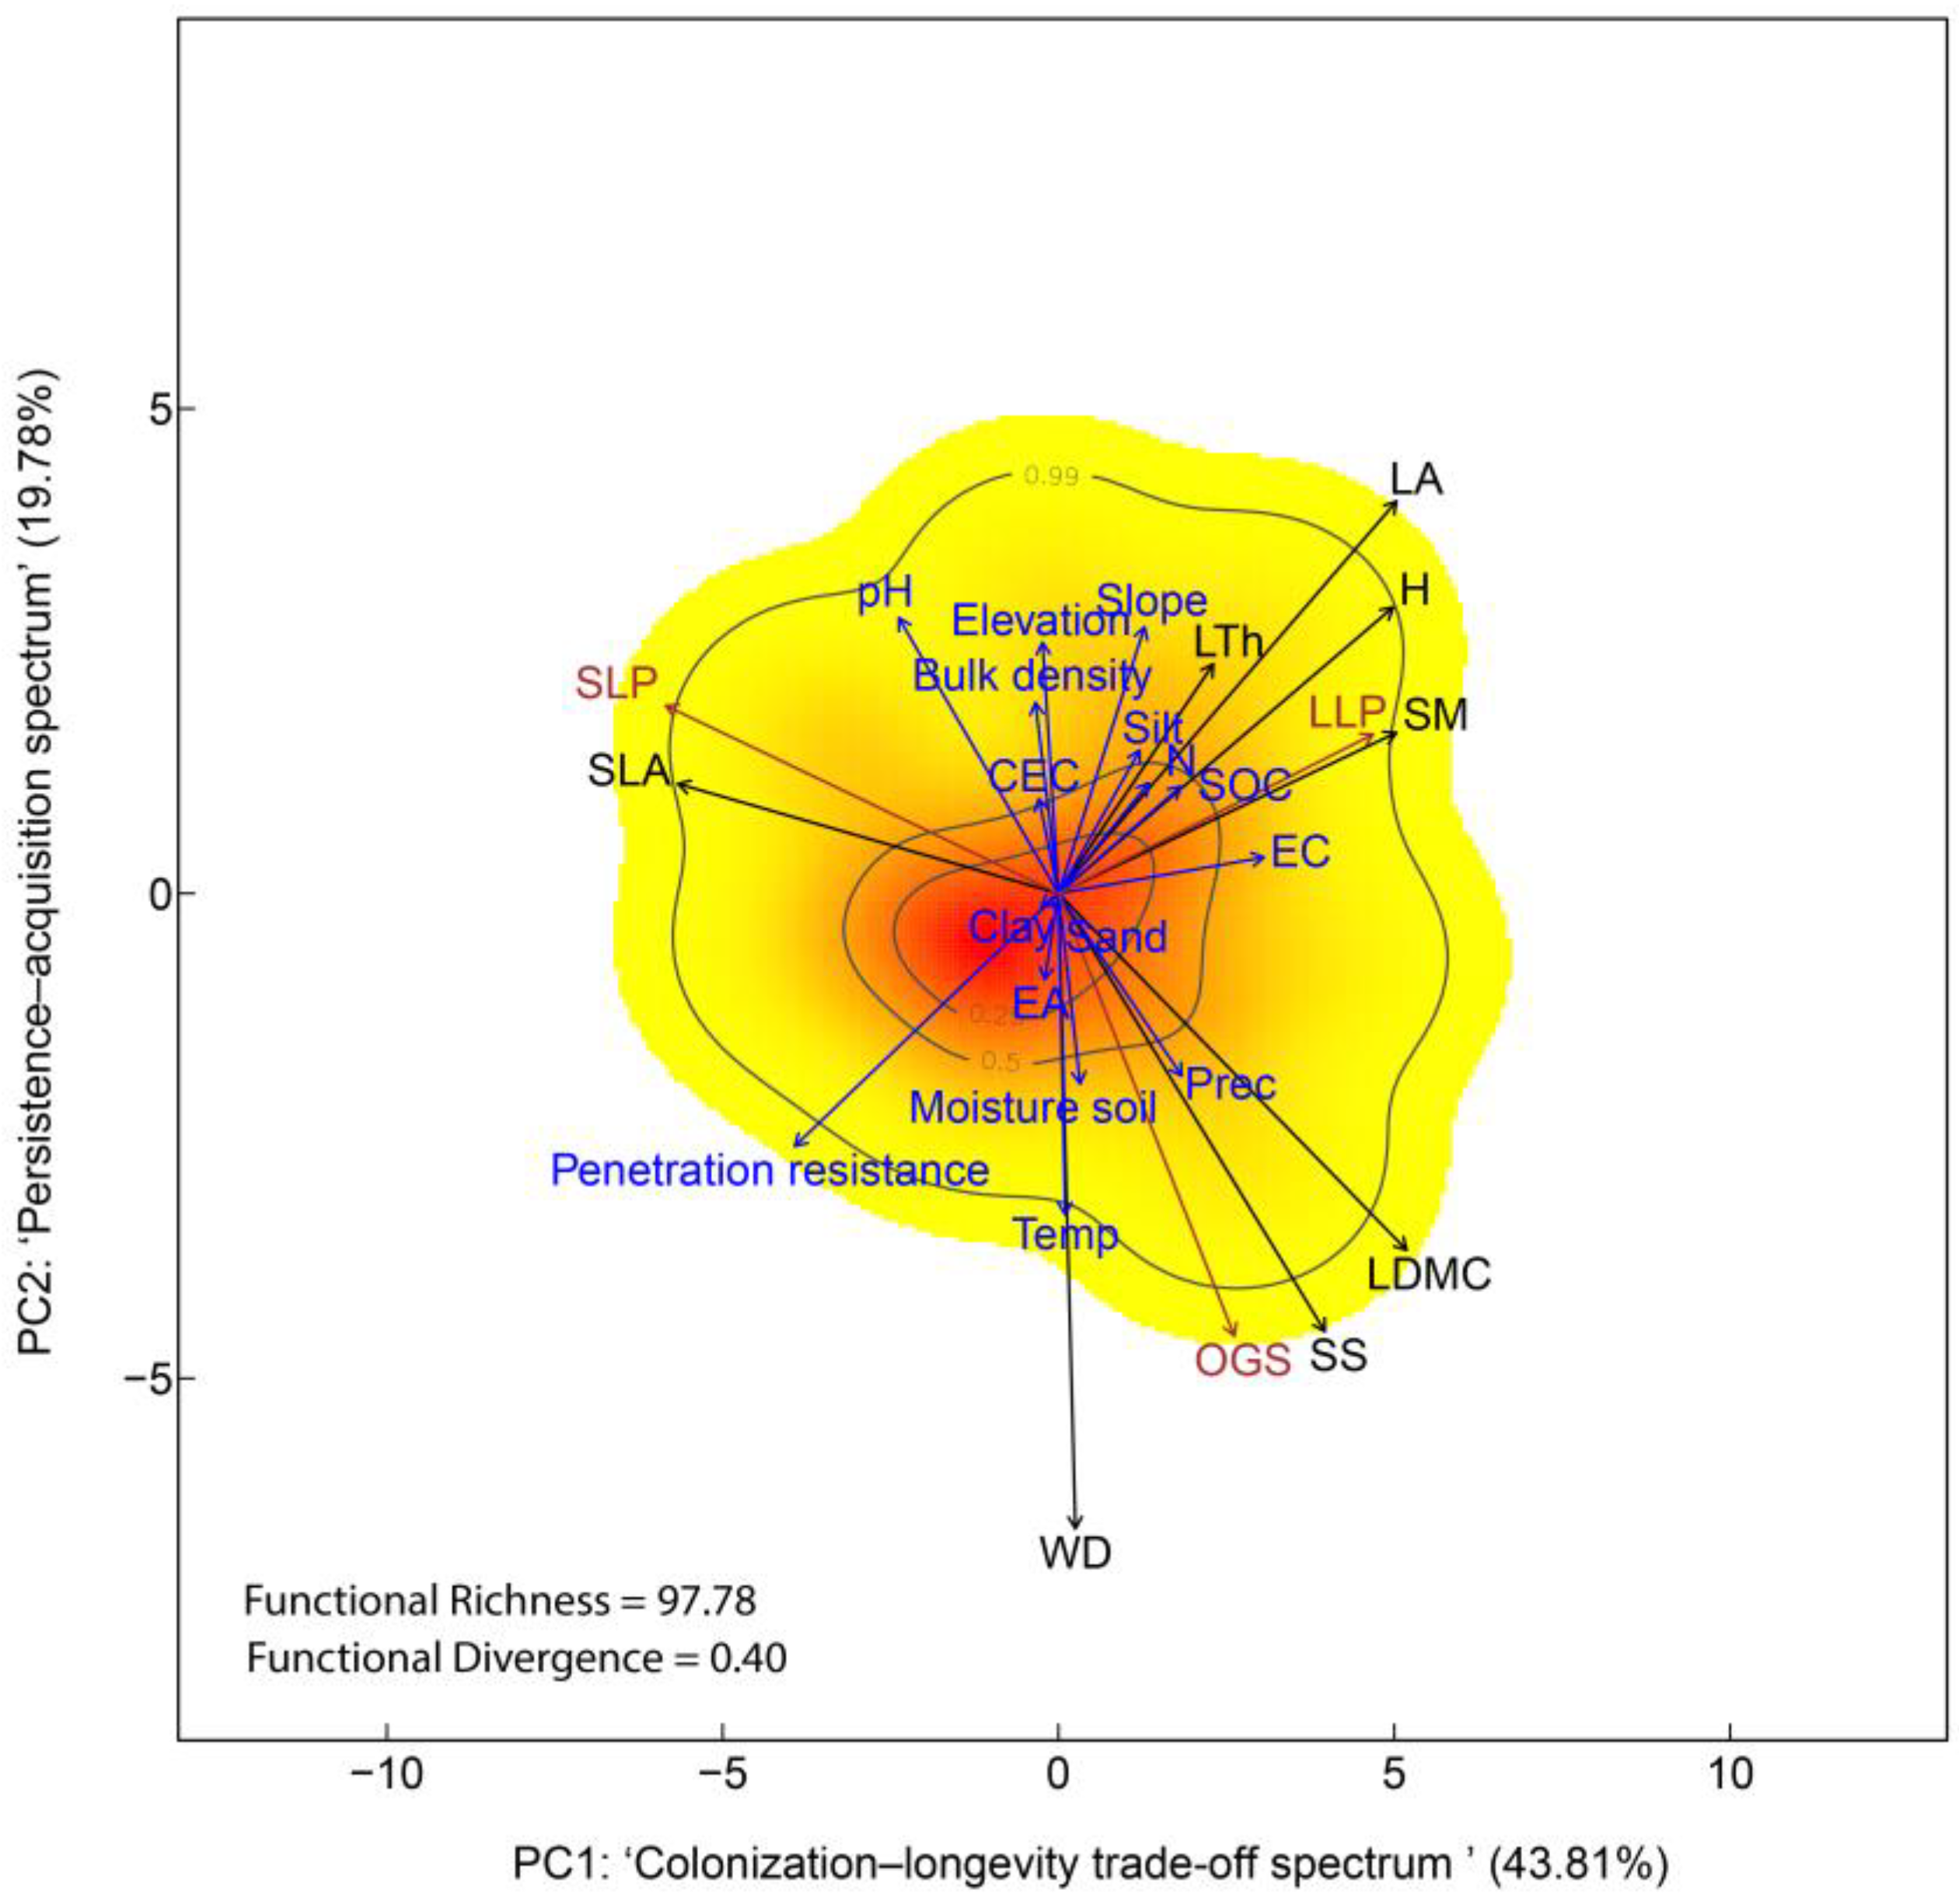
Table 3.
Percentage of variance explained by the community-weighted mean (CWM) of each trait within each functional spectrum, based on community-level PC1–PC2 trait space.
Table 3.
Percentage of variance explained by the community-weighted mean (CWM) of each trait within each functional spectrum, based on community-level PC1–PC2 trait space.
| Trait | PC1 | PC2 | R2 | p-value | Spectrum |
|---|---|---|---|---|---|
| WD | 0.003 | 0.816 | 0.819 | 0.001 | PAS |
| LA | 0.615 | 0.179 | 0.794 | 0.001 | CLTS |
| LDMC | 0.191 | 0.578 | 0.769 | 0.001 | PAS |
| SS | 0.067 | 0.621 | 0.688 | 0.001 | PAS |
| H | 0.551 | 0.087 | 0.639 | 0.001 | CLTS |
| SLA | 0.625 | 0.011 | 0.636 | 0.001 | CLTS |
| SM | 0.509 | 0.025 | 0.534 | 0.001 | CLTS |
| LTh | 0.141 | 0.067 | 0.208 | 0.027 | CLTS |
Wood Density (WD), Tree Height (H), Leaf Area (LA), Specific Leaf Area (SLA), Leaf Dry Matter Content (LDMC), Leaf Thickness (LTh), Seed Mass (SM), and Seed Size (SS). PC1: Colonization–Longevity Trade-Off Spectrum (CLTS), PC2: Persistence–Acquisition Spectrum (PAS). R² values indicate the proportion of variance explained by the CWM of each trait within the functional space, and p denotes the level of statistical significance.
Regarding the environmental variables projected into global functional space, stronger associations were found with PC1 for penetration resistance, SOC, and N. In contrast, ambient temperature, pH, bulk density, and EA were primarily associated with PC2 (Supplementary Table S6).
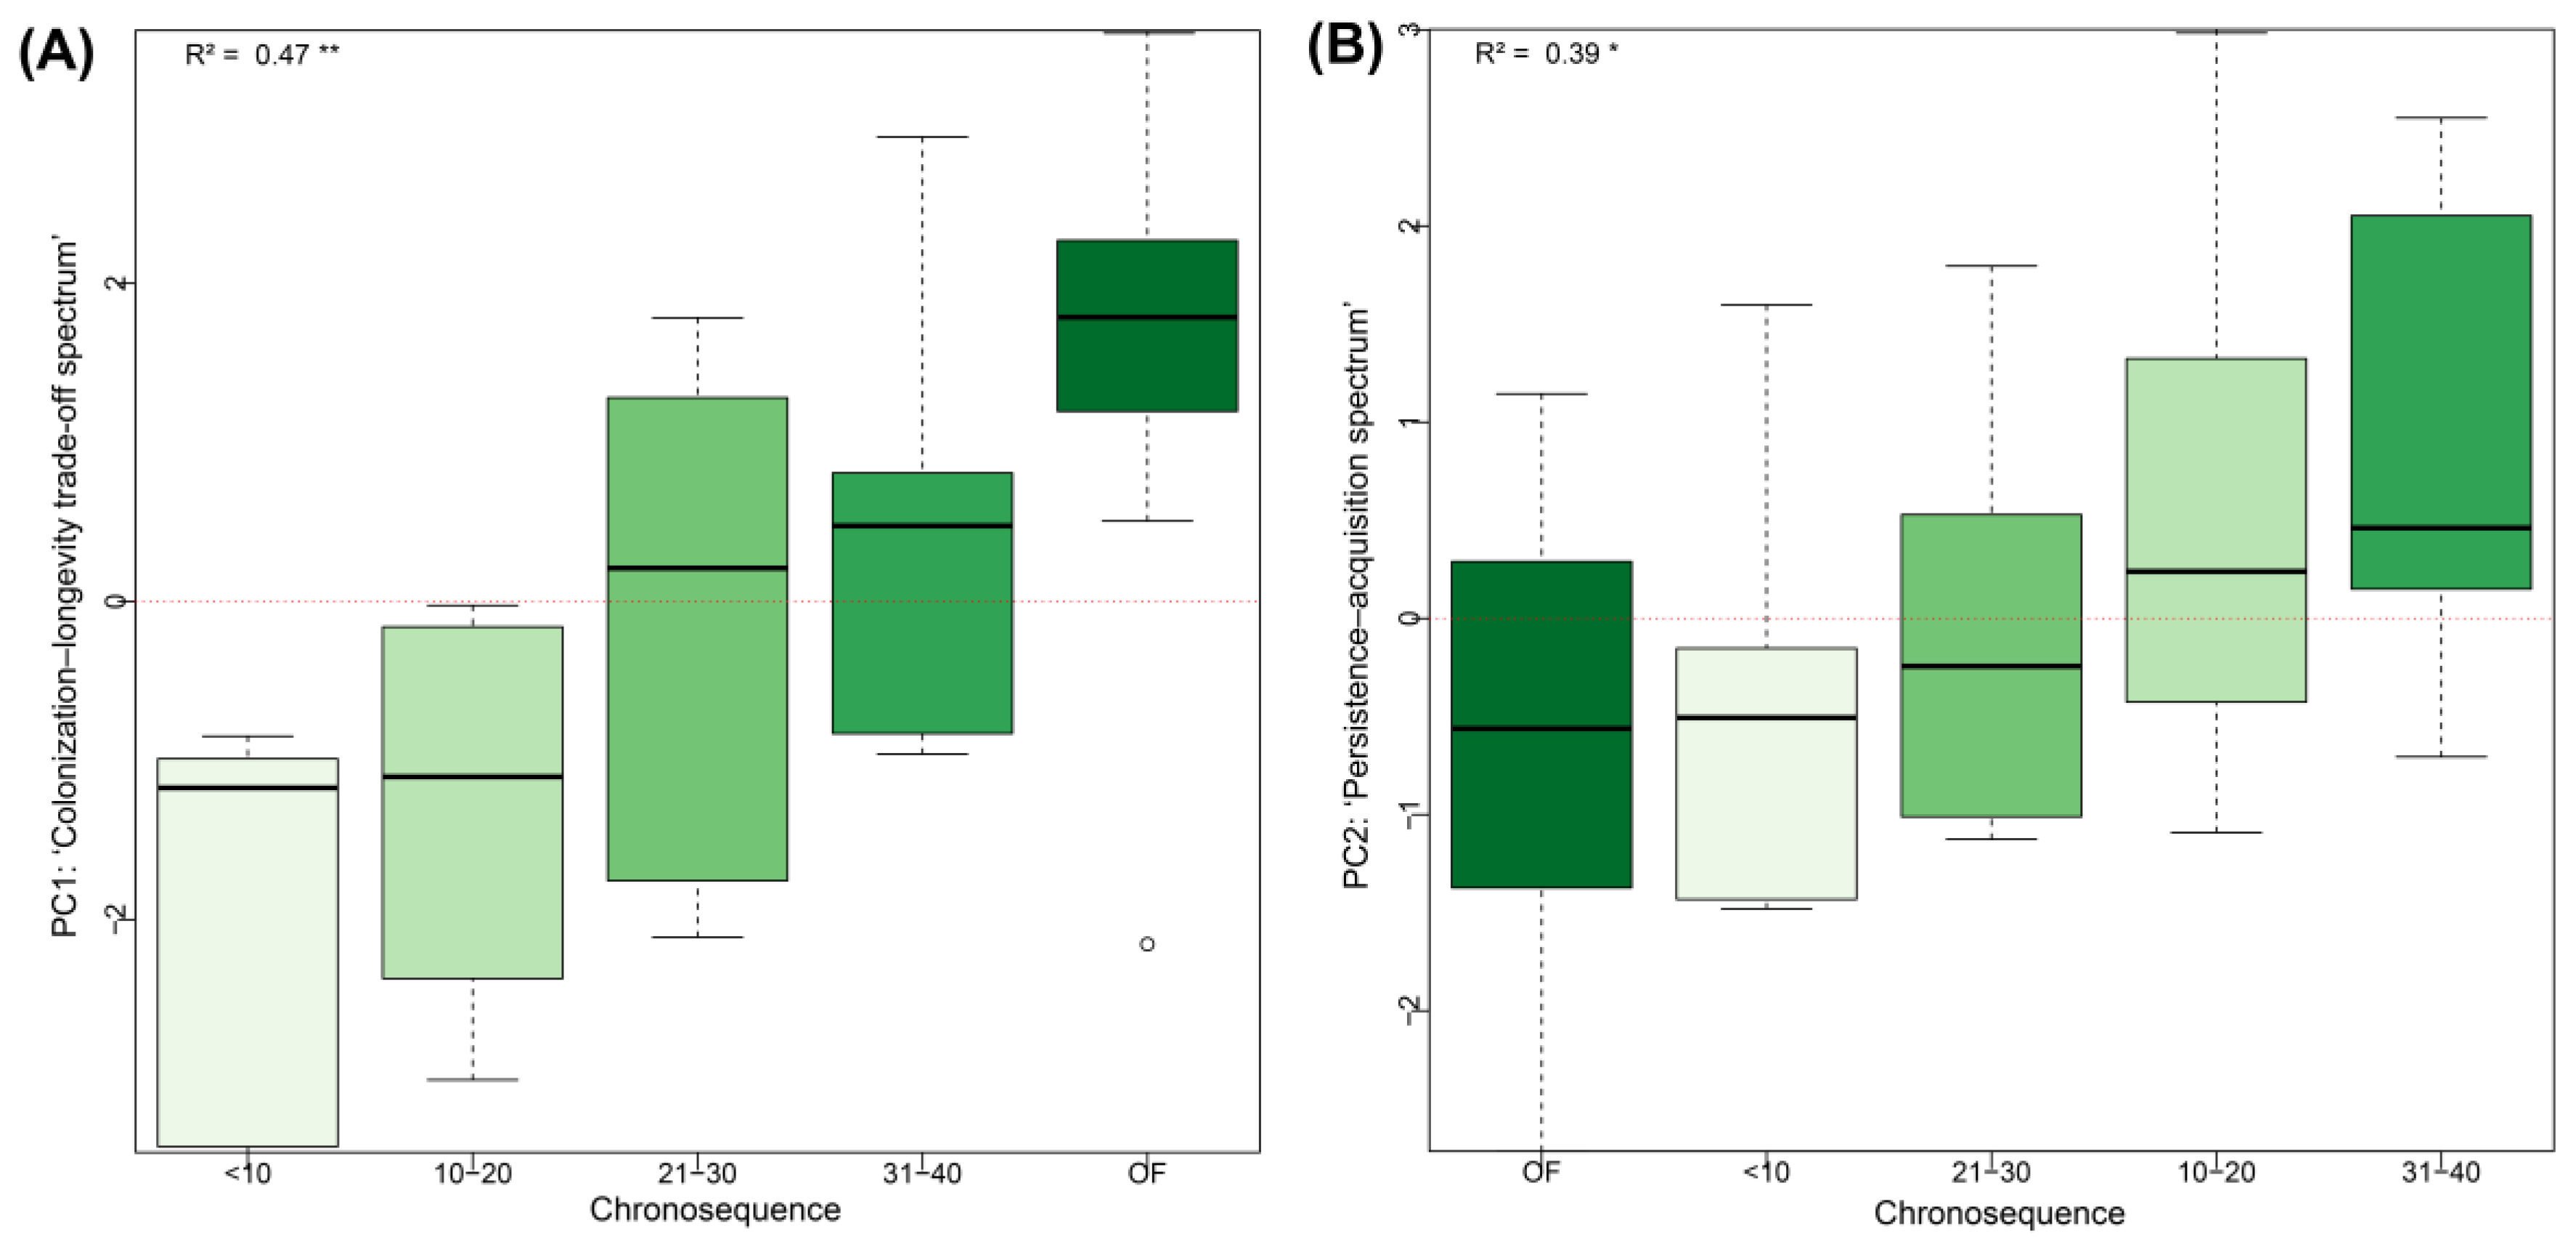
When exploring the successional categories projected into the global trait space defined by the PCA (Supplementary Figure S8), the greatest FRich was observed in OF (FRich = 71.33) and in secondary forests aged 10–20 years (FRich = 68.41), while the lowest FRich was found in the youngest forests (<10 years; FRich = 58.5). This trend paralleled tree species richness patterns, which mean values generally decreased from OF to early-successional forests: 22.40 species (OF), 20.17 (31–40 years), 12.67 (10–20 years), 9.67 (21–30 years), and 10.1 species (<10 years). These observations suggest that, despite selective logging interventions, old-growth fragments retain a structurally and functionally richer composition compared to early-successional forests. In this context, significant changes were observed in PC1 and PC2 scores along the chronosequence (Figure 4 and Supplementary Table S7).
Early-stage secondary forests (<10 and 10–20 years), with pioneer colonizing species, exhibited higher SLA values associated with negative scores on the PC1 axis (i.e., the ‘colonization–longevity trade-off spectrum’). Conversely, forests dominated by long-lived pioneer species (>20 years) and old-growth species showed higher values for traits such as H,LA, LTh and SM, and were associated with positive scores of PC1 (Figure 4A and Supplementary Figure S9 and Table S8). Meanwhile, traits such as WD, LDMC, and SS, associated with the negative end of PC2 (i.e., the ‘persistence–acquisition spectrum’), were more prevalent in OF which are dominated by persistent species. In contrast, acquisitive traits linked to the positive end of PC2 were characteristic of pioneer species in secondary forests (Figure 4B; Supplementary Figure S9 and Table S8).
Figure 4.
Changes in functional spectrum scores (PC1 and PC2) along a natural regeneration chronosequence following livestock abandonment. (A) Plot-level PC1 scores representing the ‘Colonization–Longevity Trade-Off Spectrum’. (B) Plot-level PC2 scores representing the ‘Persistence–Acquisition Spectrum’. **p < 0.01; *p < 0.05.
3.3. Correspondence Betweeen Plant-Strategy Spectra at Species and Community Levels
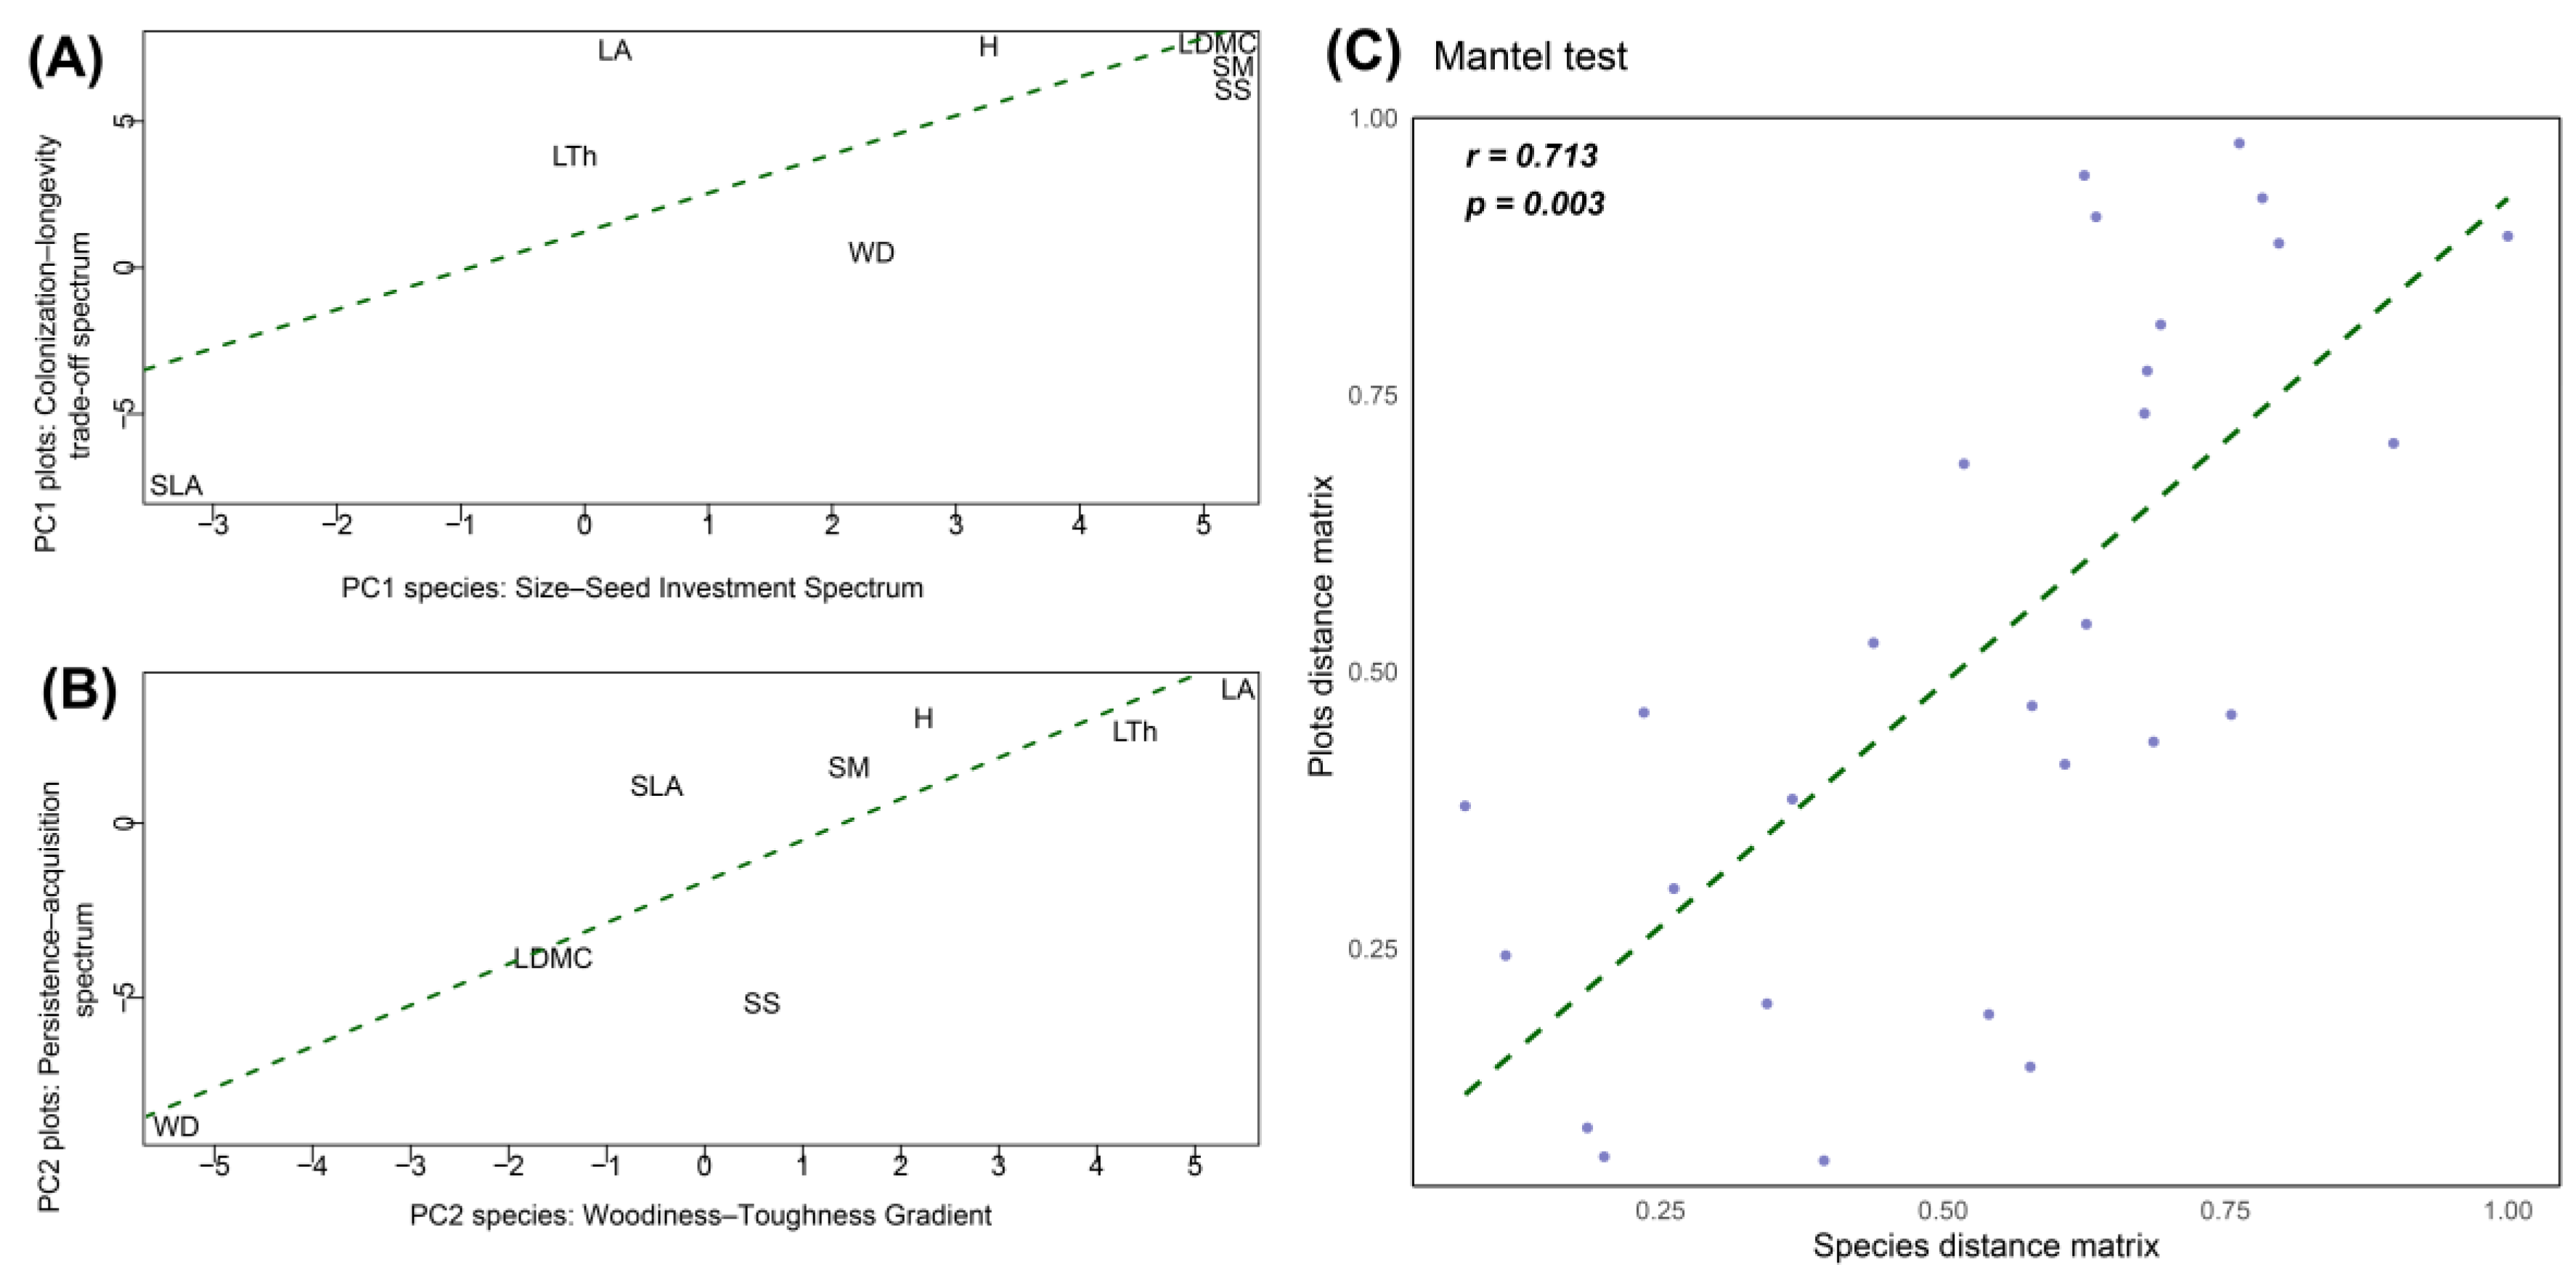
To address the similarity between community-level functional strategy spectra and those observed at the species level (question two)—a Mantel test was conducted (Figure 5). The Mantel correlation coefficient revealed a significant association between trait distance matrices at the species level and the community-weighted means (CWM) at the plot level (r = 0.713, p = 0.003). This pattern of correspondence was mainly explained by similar PC1 and PC2 scores across species and community-level trait spaces. Specifically, PC1 scores for species and plots were significantly similar (R² = 0.51, p = 0.028) (Figure 5A), and very similar for PC2 scores (R² = 0.73, p = 0.004) (Figure 5B). These results suggest that functional axes derived from species-level traits are consistently reflected at the community level, supporting the validity of trait-based monitoring across organizational scales.
Figure 5.
Correspondence between species-level and community-level functional spectra. (A) Comparison between species-level PC1 scores and plot-level PC1 scores (R² = 0.51, p < 0.05). (B) Comparison between species-level PC2 scores and plot-level PC2 scores (R² = 0.73, p < 0.01). (C) Mantel test between distance matrices of species-level and plot-level functional trait spaces (r = 0.71, p < 0.01). Wood Density (WD), Tree Height (H), Leaf Area (LA), Specific Leaf Area (SLA), Leaf Dry Matter Content (LDMC), Leaf Thickness (LTh), Seed Mass (SM), and Seed Size (SS).
3.4. Relationships Between Environmental Factors, Forest Age, Richness, and Functional Strategy Spectra
To address question three, regarding the relationships between environmental factors, successional stage, and community functional composition, we analyzed the degree of association, dependency relationships, and the structured direct and indirect effects among variables.
We initially examined the degrees of association among compositional (i.e., tree species richness), structural (i.e., forest age), and functional attributes (i.e., PC1: ‘colonization–longevity trade-off spectrum’, and PC2: ‘persistence–acquisition spectrum’) of the community using bivariate correlation matrices (Supplementary Figure S10). A similar approach was applied to associations among environmental parameters (Supplementary Figure S11). Significant positive correlations (Pearson’s r ranging from 0.35 to 0.80, p < 0.05) were found between PC1 and SS, SM, LDMC, LA, H, species richness, and forest age. Conversely, SLA was negatively correlated with PC1 (r = –0.80, p < 0.001). PC2 showed significant negative correlations with SS, WD and LDMC (Pearson’s r from –0.37 to –0.90, p < 0.05), while LA was positively correlated with PC2 (r = 0.50, p < 0.01).
Bivariate correlations among environmental parameters revealed strong positive associations (Pearson’s r between 0.70 and 0.87, p < 0.001) for SOC vs. N, CEC vs. EA, N vs. silt, and EA vs. clay. The strongest negative correlations (Pearson’s r between –0.71 and –0.99, p < 0.001) were found between bulk density and soil moisture, clay with sand and EC, elevation with ambient temperature, precipitation and clay, and pH vs. EC.
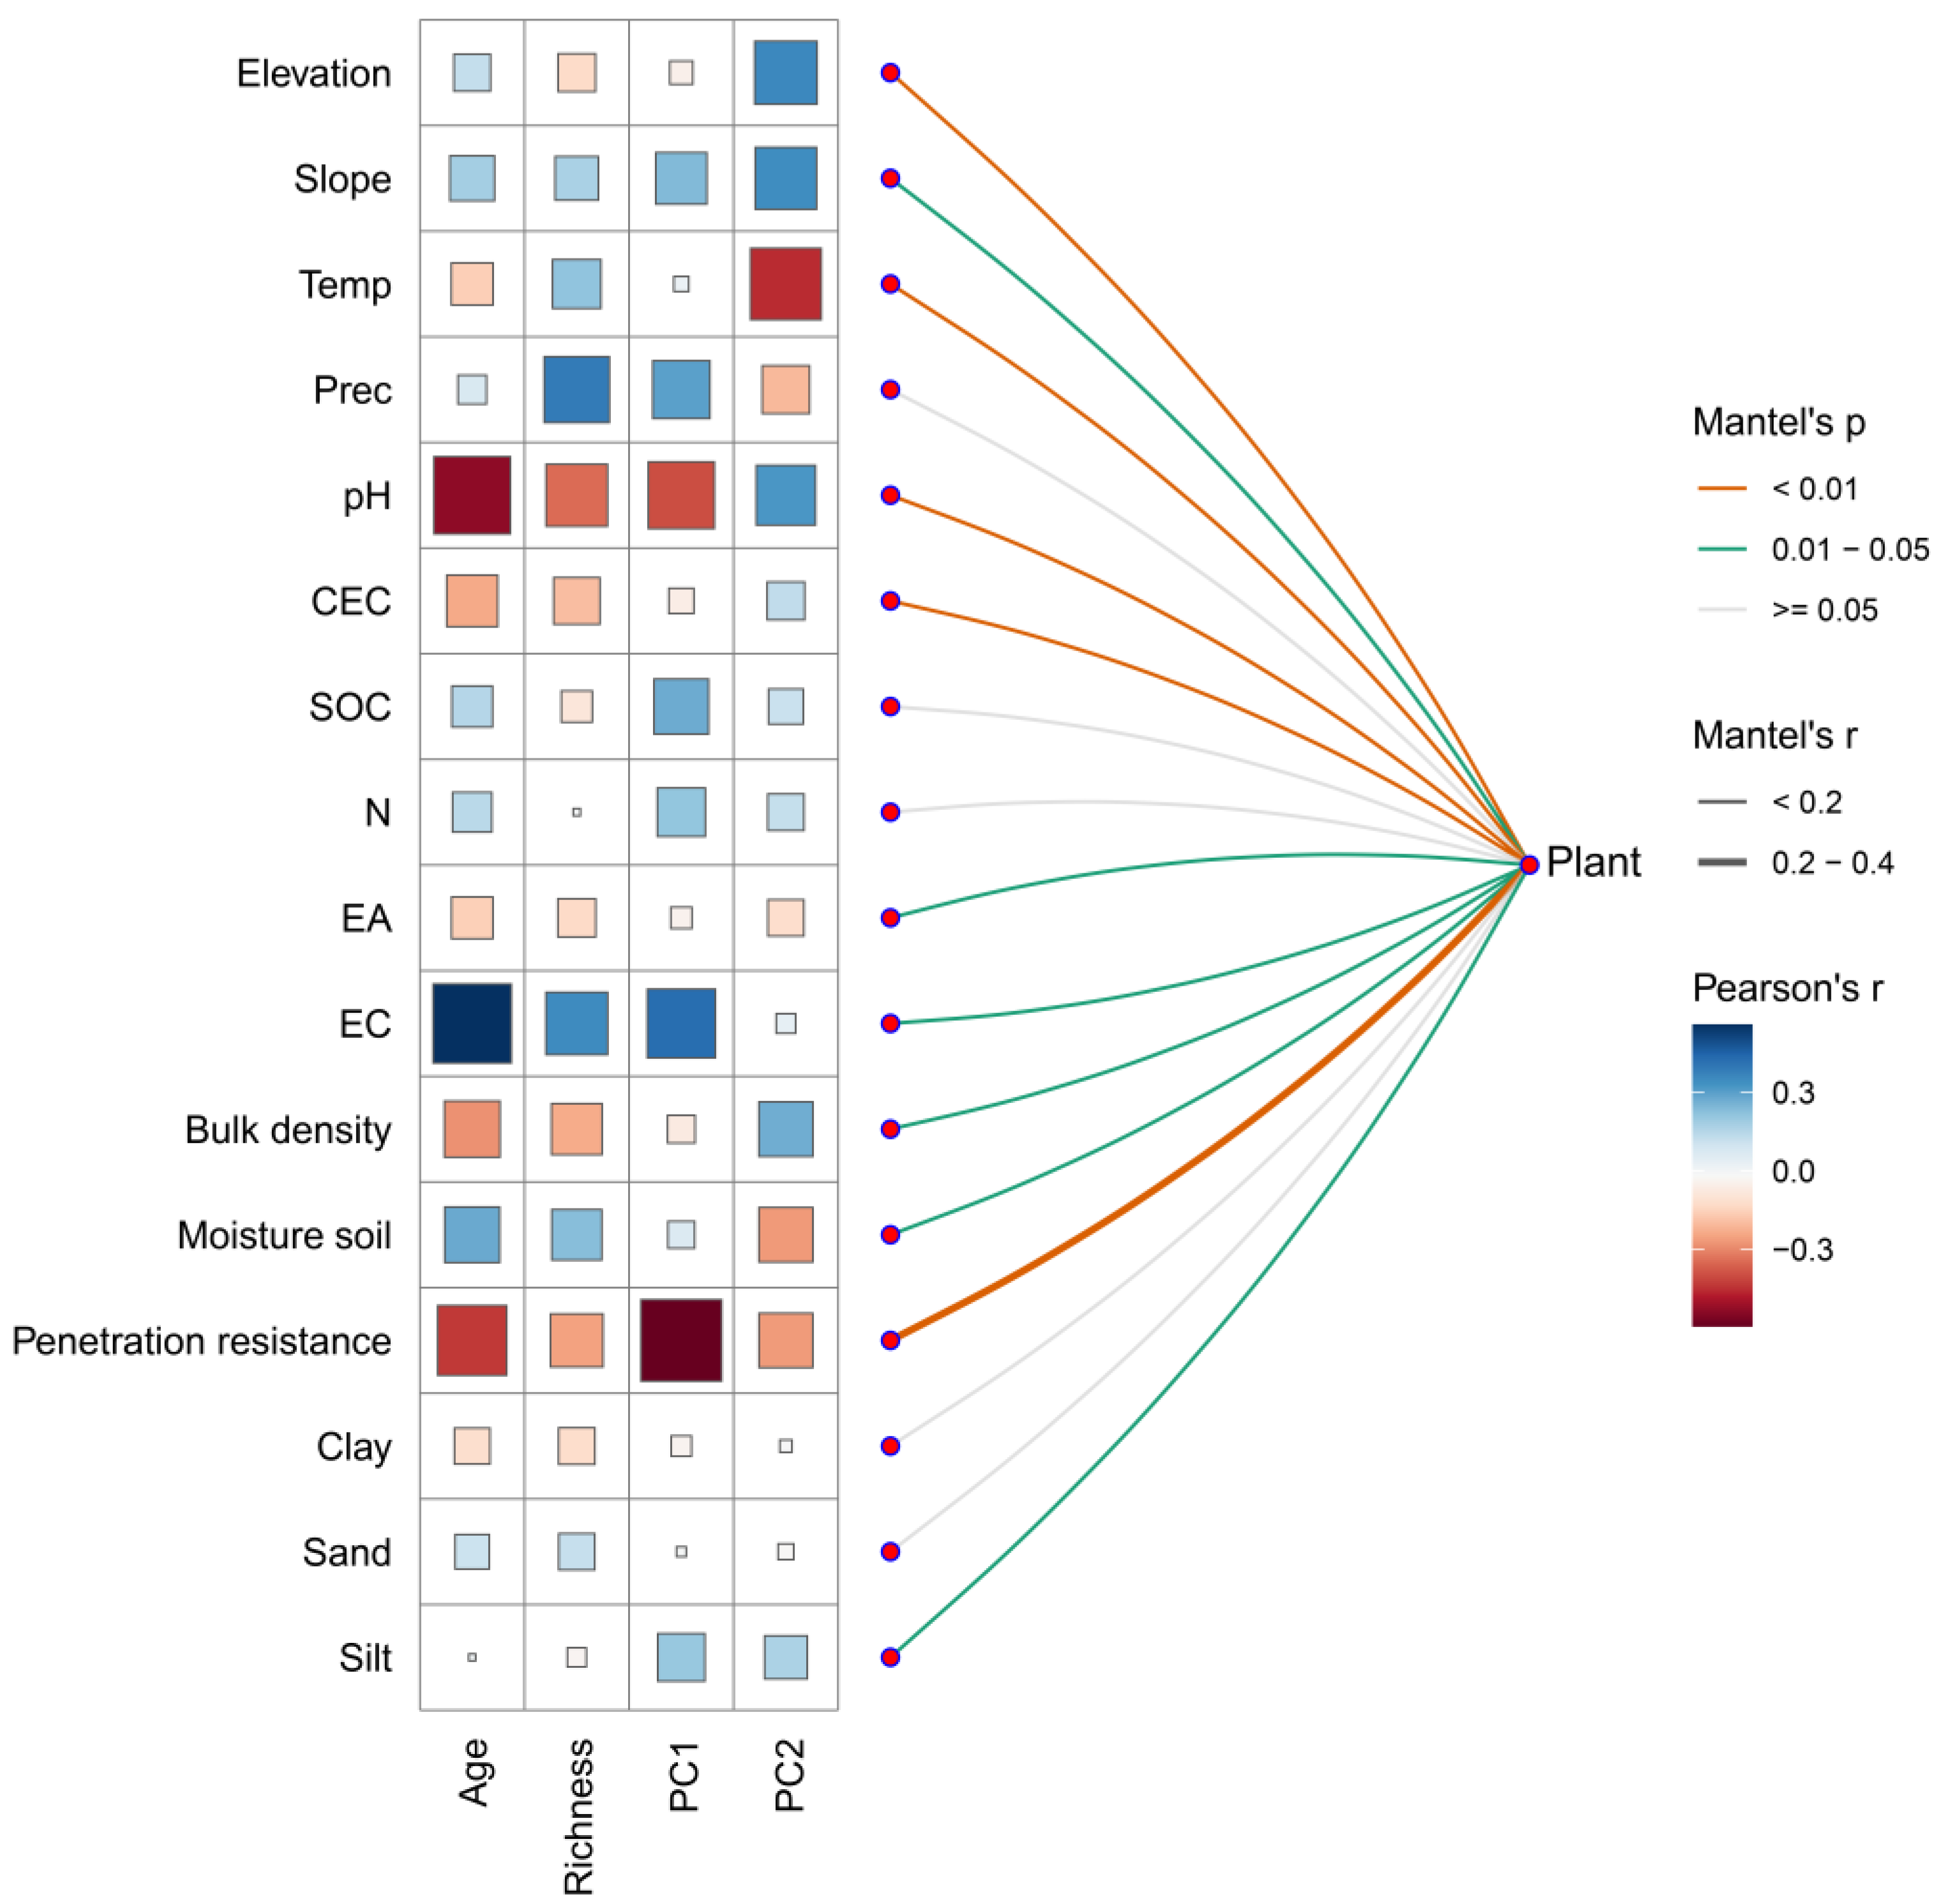
The Mantel test revealed significant correlations (p < 0.05) between community composition (based on Bray–Curtis dissimilarity) and 11 environmental variables (Figure 6; Supplementary Table S9). The strongest correlations (Mantel’s r ranging from 0.14 to 0.23; p < 0.01) were found for penetration resistance, pH, ambient temperature, CEC, and elevation. These variables also showed stronger Pearson correlations with the community-level functional strategy spectra (PC1 and PC2). EC and elevation were positively and significantly correlated with PC1 (r = 0.42, p < 0.001) and PC2 (r = 0.36, p < 0.05), respectively. In contrast, penetration resistance and pH were negatively and significantly correlated with PC1 (r = –0.59, p < 0.001 and r = –0.40, p < 0.001, respectively), while ambient temperature was negatively correlated with PC2 (r = –0.45, p < 0.01). Strong correlations were also observed between precipitation, CEC, and pH with tree species richness, and between EC, pH, and penetration resistance with forest age. These results suggest that both abiotic conditions and community-level properties—including forest age, tree species richness, and functional axes (PC1 and PC2)—are linked to variations in species composition across sites.
Figure 6.
Mantel tests between community composition (based on species abundances) and 16 environmental factors, and Pearson correlations between community-level functional spectra (PC1: Colonization–Longevity Trade-Off Spectrum; PC2: Persistence–Acquisition Spectrum), forest age (Age), and tree species richness (Richness) with environmental variables. Edge thickness represents the strength of the Mantel correlation (r), while color indicates the level of statistical significance. For Pearson correlations, both the size and color of the squares indicate the strength and direction of the bivariate association, respectively. Environmental factor acronyms as defined in Figure 3.
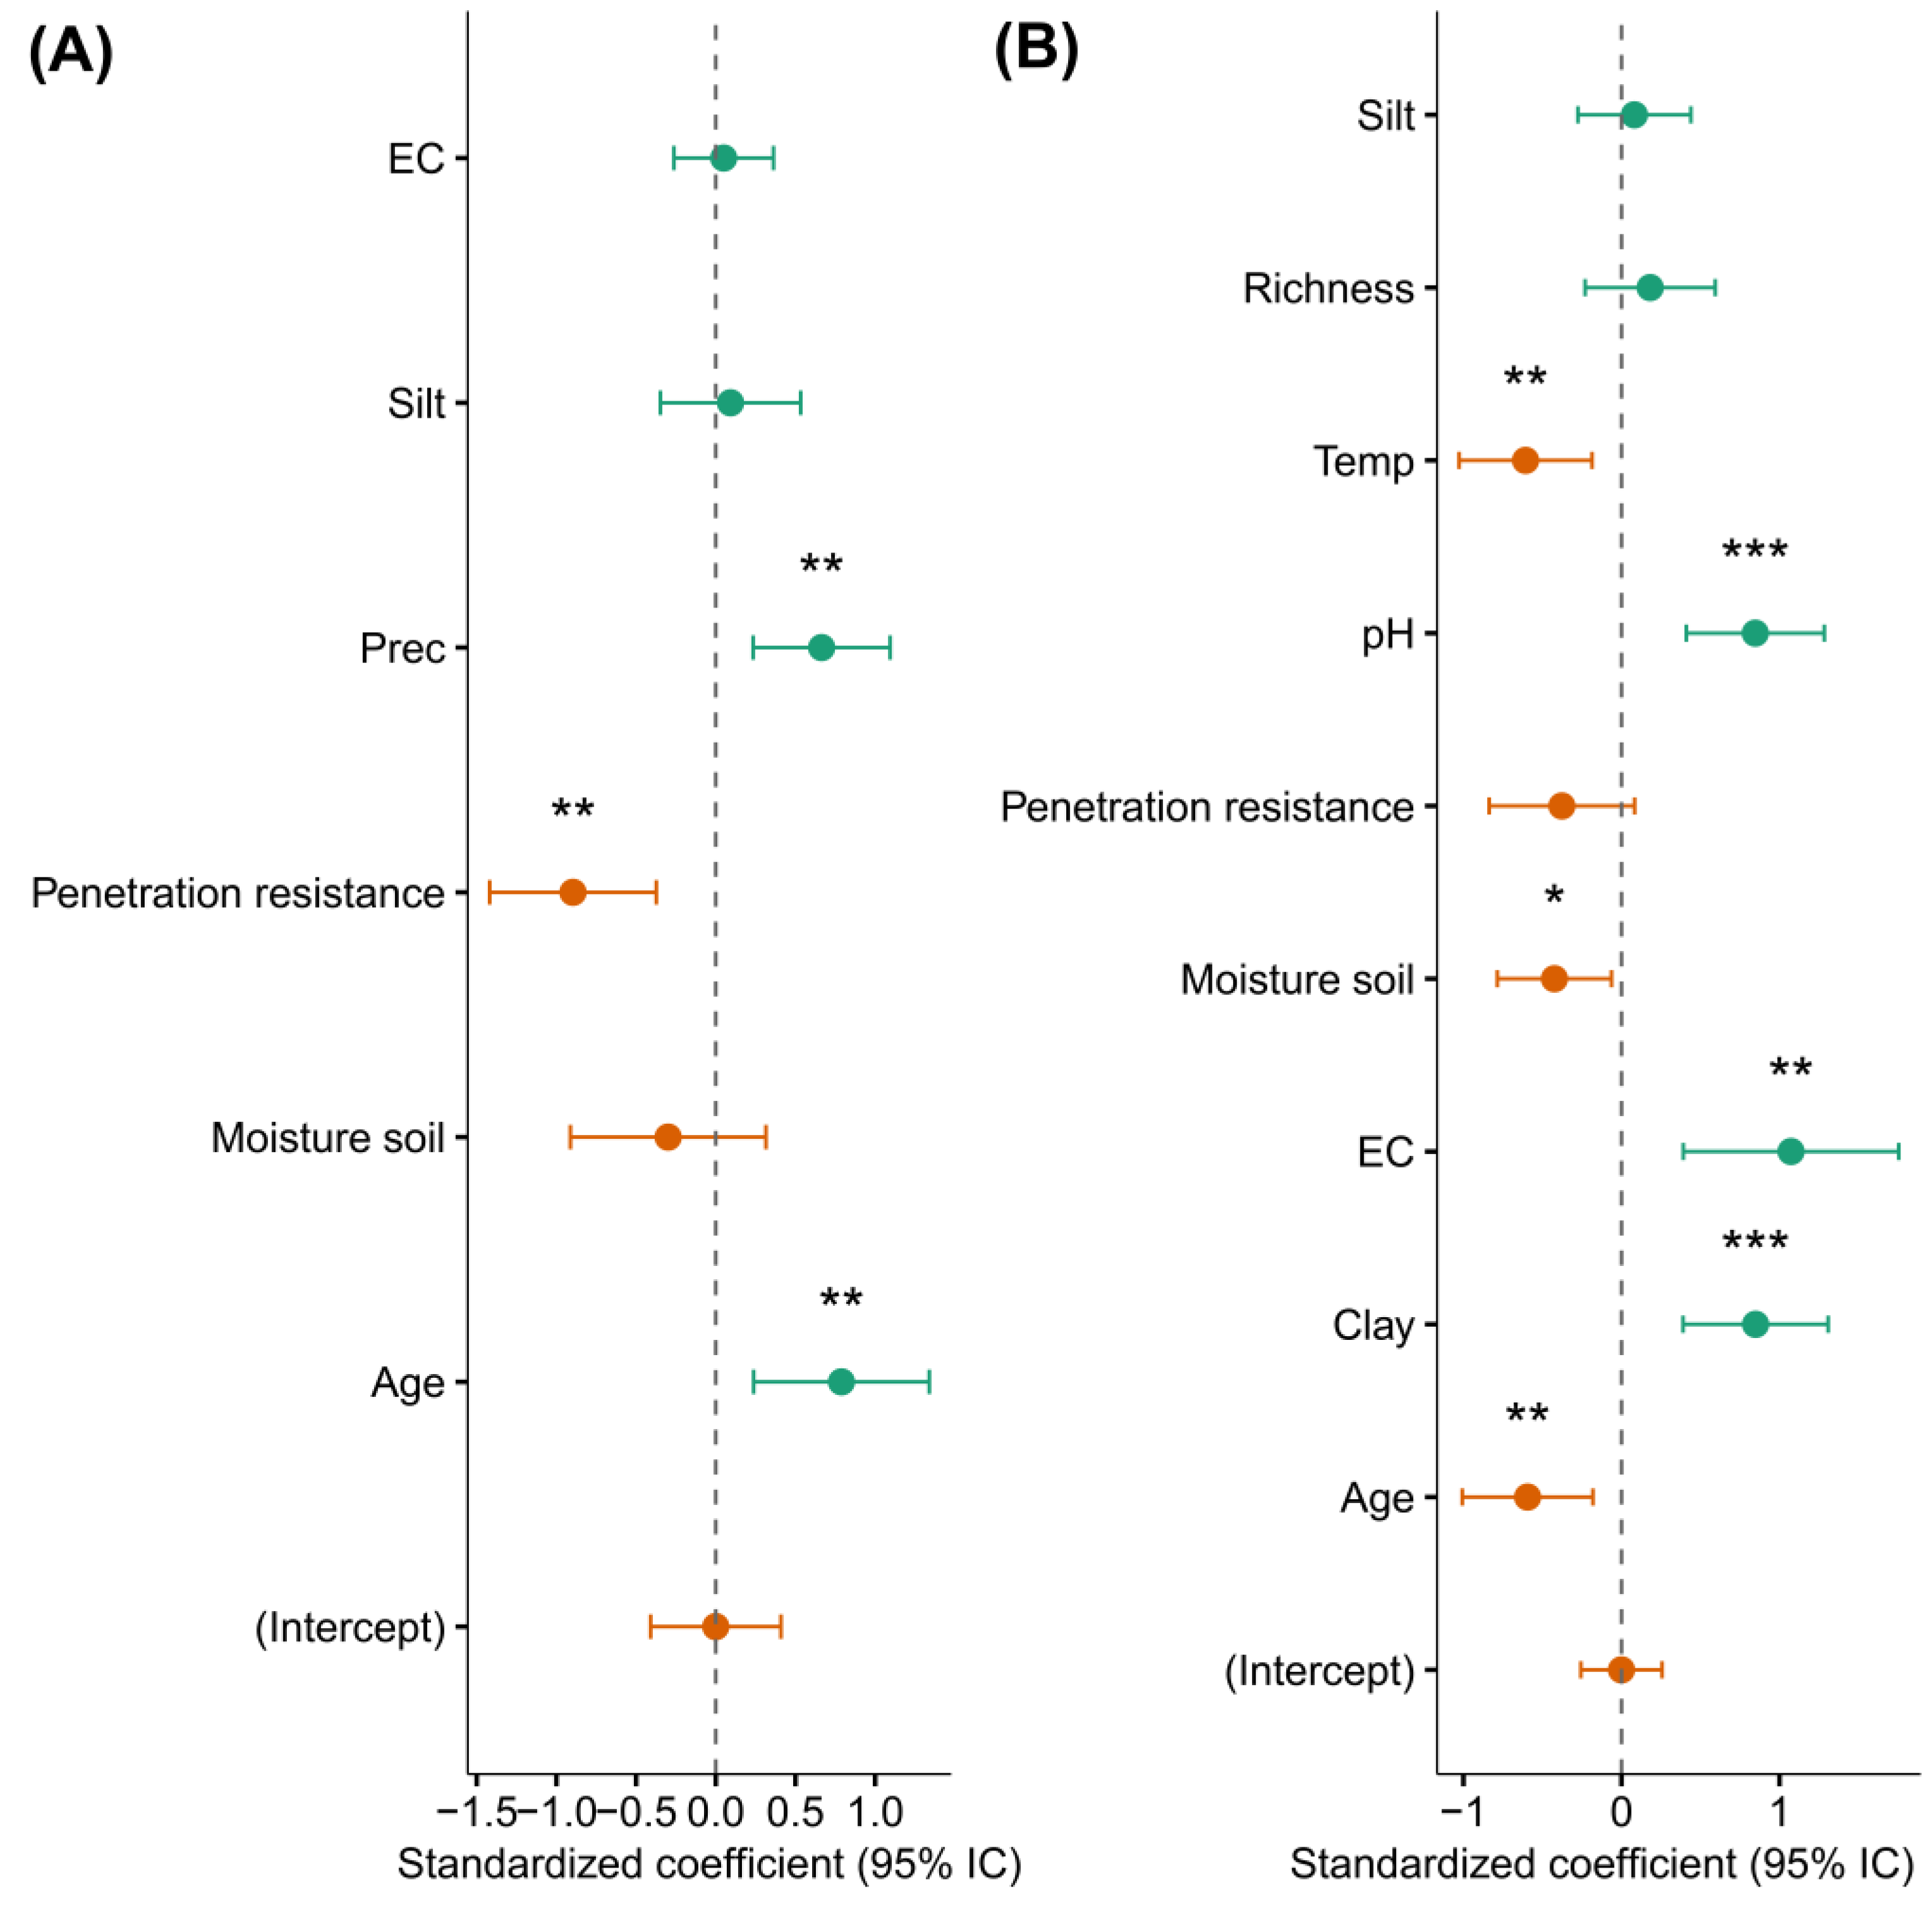
We used LMMs to assess the influence of environmental variables, forest age, and tree species richness on the community-level functional spectra PC1 and PC2. The results showed a significant positive effect of forest age and precipitation on PC1, whereas penetration resistance had a significant negative effect (Figure 7A; Supplementary Table S10). In contrast, PC2 was positively and significantly influenced by pH, EC and clay content, and negatively influenced by forest age, ambient temperature, and soil moisture (Figure 7B; Supplementary Table S11). Our results indicated that EC, silt, and soil moisture did not significantly affect PC1, while variables such as silt, tree species richness, and penetration resistance had no significant impact on PC2.
Figure 7.
Model-averaged parameters for different predictors of community-level functional spectrum scores (PC1 and PC2) (n = 33 plots). (A) PC1: Colonization–Longevity Trade-Off Spectrum. (B) PC2: Persistence–Acquisition Spectrum. Green dots represent positive coefficients, while orange dots indicate negative coefficients. Asterisks above each dot denote statistically significant coefficients (*p < 0.05, **p < 0.01, ***p < 0.001). Dots without asterisks indicate non-significant coefficients (p > 0.05). Vertical dashed lines represent the mean threshold location, and horizontal error bars show 95% confidence intervals. Environmental factor acronyms as defined in Figure 3.
A fourth PCA was conducted to capture the maximum variability among environmental factors, with the first two PCs retained based on Horn’s parallel analysis (Supplementary Figure S12). Subsequently, simple linear regressions were used to evaluate the dependency relationships between the functional scores (PC1 and PC2) and the first two environmental PCs (Supplementary Figure S13). The analysis revealed that only the environmental PC2 axis which was strongly associated with elevation, slope, and temperature, showed a significant positive association with the functional PC1 axis.
Finally, we implemented two separate SEMs to examine how environmental factors, and structural and compositional attributes of the community influenced the two main axes of functional strategy spectra (i.e., PC1 and PC2) (Figure 8A-B and Supplementary Tables S12 and S13). Each model included four latent variables: soil properties (SOI), aboveground conditions (ENV), forest age (AGE), and tree species richness (RIC). Both models showed good fit to the data (PC1 model: χ² = 4.99, df = 8, p = 0.76; CFI = 1.00; TLI = 1.10; RMSEA = 0.00; SRMR = 0.05; PC2 model: χ² = 21.68, df = 13, p = 0.06; CFI = 0.91; TLI = 0.80; RMSEA = 0.14; SRMR = 0.11).
In the PC1 model (Figure 8A and Supplementary Table S12), functional strategies were positively influenced by AGE (β = 0.47, p = 0.00) and ENV (β = 0.32, p = 0.04). Notably, ENV was defined exclusively by precipitation, indicating the importance of rainfall in shaping the functional variation captured by PC1. In addition, SOI was negatively and significantly associated with AGE (covariance = -0.59, p = 0.01), whereas RIC-mediated positive covariation with both AGE (covariance = 0.37, p = 0.04) and ENV (covariance = 0.39, p = 0.04). These results indicate that soil variables such as pH, CEC, and EC declined with forest age, while tree species richness increased throughout succession and with higher precipitation levels.
Figure 8.
Structural equation models (SEMs) illustrating the relationships between functional spectra (PC1, PC2), forest age, tree species richness and environmental factors. (A) PC1: Colonization–Longevity Trade-Off Spectrum as a function of soil properties (SOI: pH, CEC, EC), aboveground conditions (ENV: Prec), forest age (AGE: Age), and species richness (RIC: Rchn). (B) PC2: Persistence–Acquisition Spectrum as a function of SOI (pH, CEC, clay), ENV (temp and slope), AGE, and RIC. Arrow thickness and color indicate the strength and direction of the relationship, respectively—green for positive and orange for negative associations. Solid arrows indicate statistically significant paths (p < 0.05), while dashed arrows represent either fixed loadings (set to 1.0) or non-significant paths (p > 0.05). Environmental factor acronyms as defined in Figure 3.
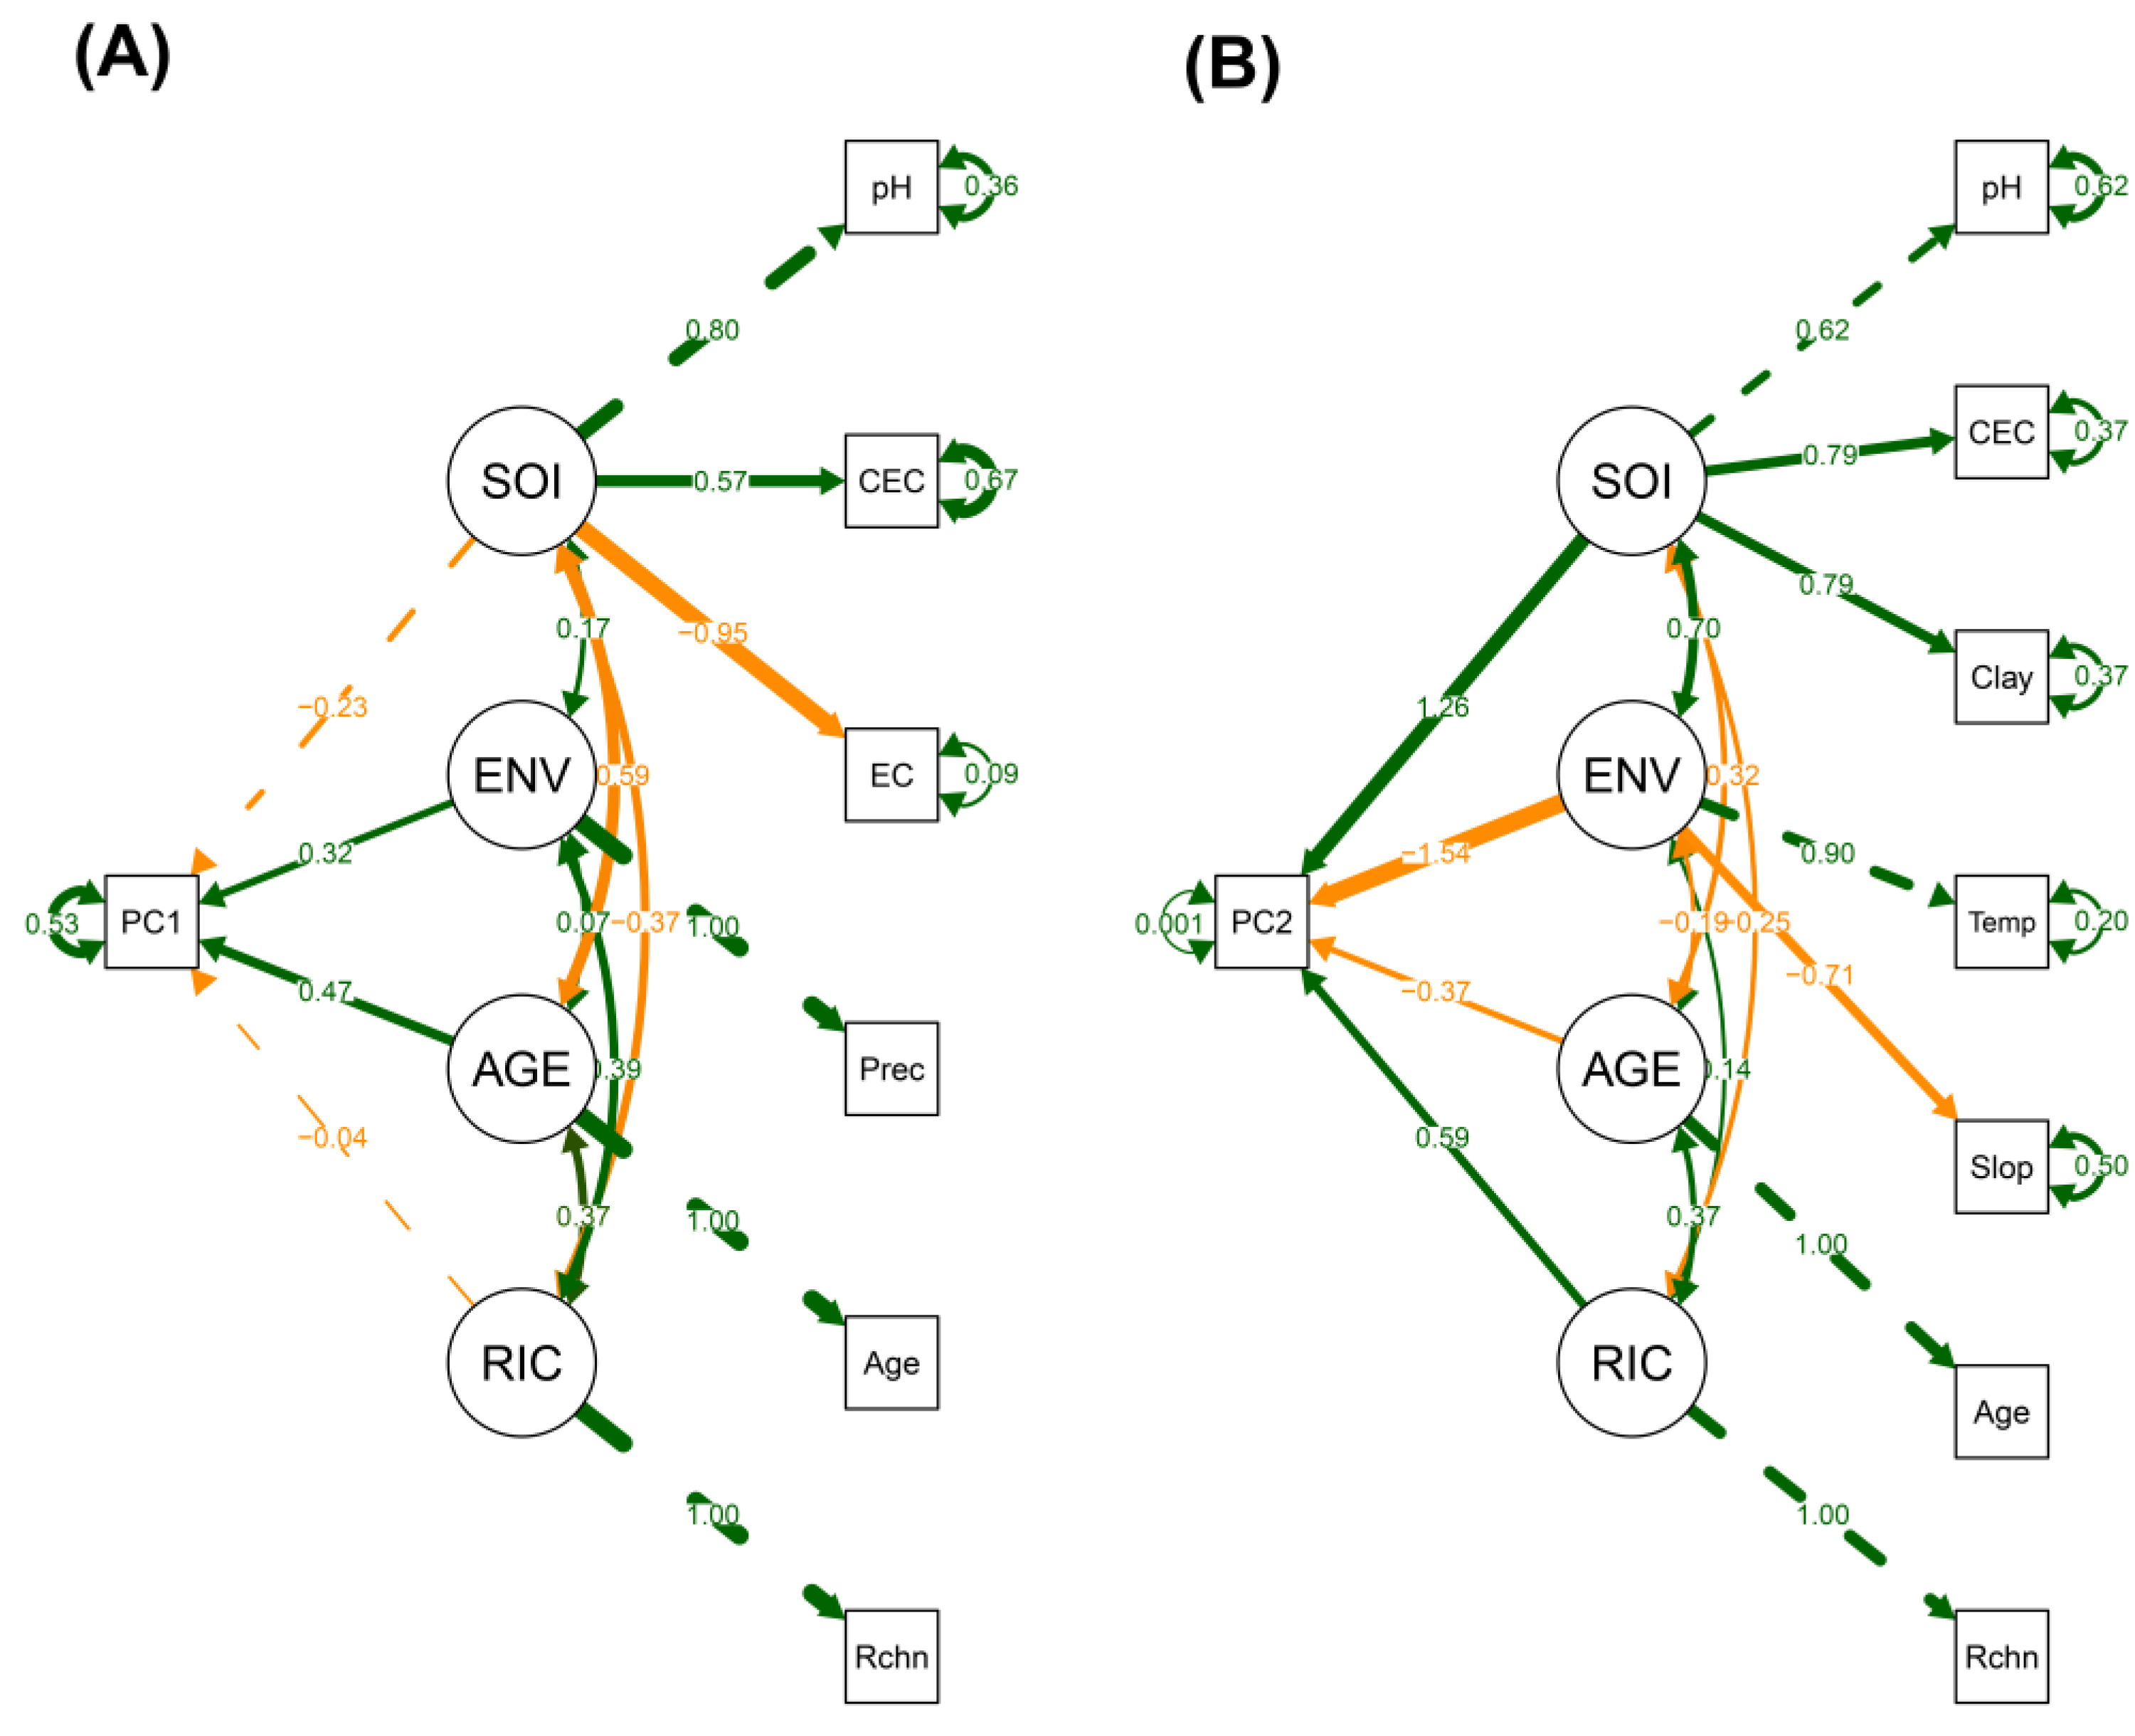
In the PC2 model (Figure 8B and Supplementary Table S13), functional strategies were significantly impacted by all latent predictors: positively by SOI (β = 1.26, p = 0.04) and RIC (β = 0.59, p = 0.04), and negatively by ENV (β = -1.54, p = 0.01) and AGE (β = -0.37, p = 0.04). The positive effect of SOI on PC2 underscores the key role of soil properties—such as pH, CEC and clay content—in shaping the functional strategies represented along this axis. In contrast, the negative effect of ENV on PC2 emphasizes the joint influence of temperature and slope, with the direction of their contributions reflected in the composition of the ENV latent variable (i.e., positive loading for temperature and negative loading for slope). Among the covariances, only the relationships between AGE and RIC (covariance = 0.37, p = 0.01), and between SOI and ENV (covariance = 0.70, p = 0.02), were statistically significant.
4. Discussion
4.1. Species-Level Functional Spectra Reflect Life-History Trade-Offs
The organization of functional trait space at the species level revealed three orthogonal spectra that capture key ecological trade-offs in plant strategies: the ‘Size–Seed Investment Spectrum’ (SSIS), the ‘Woodiness–Toughness Gradient’ (WTG); and the ‘Leaf Economics Spectrum’ (LES). These axes are consistent with theoretical expectations of multidimensional trait organization in tropical forests [53,78,79]. (i) the SSIS shaped by investment in size and dispersal capacity; (ii) the WGT reflected here in woodiness and toughness traits (i.e., stem mechanical or economic spectrum); and (iii) the LES, related to resource acquisition and conservation. Their separation confirms that trait variation in tropical trees is structured along independent yet ecologically coherent gradients.
The SSIS, defined by plant height, seed mass, and seed size, captures the classical trade-off between colonization potential and structural persistence. It differentiates SLP species characterized by rapid growth and small seeds, from LLP and OGS species which invest more in stature and reproductive output. This axis reflects how reproductive allocation covaries with competitive dominance and longevity—an ecological pattern well documented in tropical secondary succession [54,80,81].
The WTG, shaped by traits such as wood density, leaf thickness, and leaf area, reflects investment in anatomical robustness and mechanical resistance. These traits contribute to stress tolerance and tissue durability, and their prominence among LLP and OGS species highlights the increasing relevance of conservative structural strategies in resource-limited or competitive environments [82,83,84].
The LES describes variation in resource-use strategies, contrasting acquisitive species—marked by high SLA, fast photosynthesis, and short leaf lifespan—with conservative species that exhibit high LDMC, slow growth, and long tissue turnover. Its strong expression among SLP species aligns with global trait coordination patterns related to light capture, nutrient cycling, and rapid regeneration [53,82,85].
From a life-history perspective, the clustering of species into distinct regions of trait space according to their classification as SLP, LLP, or OGS reinforces the ecological validity of this framework. SLP species occupy the acquisitive end of both the SSIS and LES, while LLP and OGS species express higher wood density and seed investment—traits associated with persistence and later successional dominance. This supports the idea that life-history categories reflect multidimensional trait syndromes shaped by ecological filtering [83,86,87].
The high values of FRich and FDiv observed in the Size–Seed × Woodiness–Toughness space (PC1–PC2) suggest that these forests harbor a broad spectrum of trait combinations. This dispersion implies strong potential for niche differentiation, which may enhance species coexistence and functional resilience through trait complementarity [88,89]. Interestingly, this functional heterogeneity was highest among LLP species, suggesting that mid-successional assemblages play a central role in maintaining trait diversity and facilitating regeneration.
The consistent emergence of the SSIS across both the complete species set and subsets of dominant families underscores the generality of these patterns across taxonomic groups. Some families, such as Fabaceae and Melastomataceae, exhibited particularly broad functional occupation, consistent with their ecological versatility and structural dominance in Neotropical forests [81,90].
From a restoration perspective, identifying these functional strategies has direct implications. First, it supports selecting species not only by taxonomic identity but also by their ecological roles and positions in trait space. Second, it highlights that early-successional assemblages dominated by SLP species may be insufficient to meet long-term restoration goals related to biomass recovery, carbon storage, or structural resilience. Therefore, restoration planning in deforested Amazonian landscapes should integrate functionally diverse species pools, ensuring the inclusion of LLP and OGS strategies to promote successional transitions and enhance ecosystem resilience.
4.2. Community-Level Functional Composition Mirrors Species-Level Patterns
At the community level, trait composition followed clear successional trajectories, structured primarily along two functional axes: the Colonization–Longevity Trade-Off Spectrum (CLTS) and the Persistence–Acquisition Spectrum (PAS). These axes captured changes in the dominance of life-history strategies (SLP, LLP, OGS) and were shaped by both species’ traits and environmental filters.
The CLTS (PC1) differentiated communities dominated by SLP species—with acquisitive traits such as high SLA and small seeds—from those dominated by LLP, characterized by increased investment in height, wood density, and seed mass. This shift reflects the replacement of fast-growing, opportunistic species by structurally persistent types as succession progresses, in line with findings across Neotropical forests [80,81,90].
Functional convergence along this axis was most evident in forests dominated by LLP. In these communities, high values of FRich and FDiv suggest the co-occurrence of multiple strategies—particularly those combining structural investment with moderate acquisitive capacity. This trait complementarity may contribute to both forest persistence and resilience under variable environmental conditions.
The PAS (PC2) further separated OGS species from pioneer types, based on traits such as wood density, LDMC, and seed size. These traits were more frequent in plots with stable environmental conditions, lower temperature, and higher clay content—typical of later successional stages. This pattern underscores the role of edaphic conditions in promoting the establishment of species with conservative, persistence-oriented strategies [53,83,91].
Importantly, both axes showed strong associations with life-history strategies: SLP communities occupied the acquisitive end of both spectra, while OGS and LLP communities were increasingly dominant in later stages. FRich and FDiv peaked in mid- to late-successional plots, suggesting higher trait dispersion and niche complementarity in more structurally complex forests. This supports the hypothesis that functional diversity increases with successional age, potentially enhancing ecosystem resilience and multifunctionality [89,92,93].
Our results also indicate that community-level trait spectra mirror the aggregation of species-level strategies but are further shaped by local environmental conditions. The strong correlation between forest age and the abundance of conservative traits suggests that successional time acts as a primary ecological filter, but that soil properties and microclimate modulate the rate and direction of functional recovery [83,94].
From a restoration perspective, these findings reinforce the value of monitoring community-weighted means of key traits (e.g., SLA, WD, seed size) to assess functional recovery over time. They also highlight the importance of promoting functionally diverse assemblages that include LLP and OGS species to accelerate the convergence toward mature forest structure and function.
The strong correspondence observed between species- and community-level functional spectra confirms that patterns of trait variation scale coherently from individuals to entire assemblages. The significant Mantel correlation (r = 0.713, p < 0.003) between species trait distances and community-weighted means indicates that community-level functional composition largely reflects the aggregated expression of species-level strategies, shaped by life-history attributes and filtered by succession.
This alignment was particularly evident along the two principal functional axes. The SSIS (PC1) at both levels revealed similar gradients from acquisitive SLP species to long-lived species with greater investment in reproduction and structural dominance (LLP, OGS). Similarly, the WTG (PC2) captured increasing investment in tissue density and leaf construction across both organizational levels. The close correspondence between PC1 and PC2 scores at both scales (R² = 0.51 and 0.73, respectively) demonstrates that trait-based signals are maintained through community assembly, supporting the use of community-weighted trait means as proxies for functional structure [79,83,95].
These findings reinforce the concept that species-level strategies are not decoupled from community-level dynamics but instead shape and constrain the trajectory of forest regeneration. They also validate the ecological relevance of the life-history classification (SLP–LLP–OGS), which consistently explains trait aggregation patterns across scales. Such consistency suggests that the main drivers of trait expression—successional time, environmental conditions, and ecological trade-offs—operate similarly at both levels [53,86].
From a methodological perspective, this cross-scale congruence provides a robust foundation for monitoring and restoration. Trait-based indicators measured at the species level can inform the expected functional composition of communities, and vice versa. This is particularly relevant in highly diverse systems where full community-level trait sampling is logistically challenging. Relying on species-level trait data can provide reliable inferences about the functional state of regenerating forests.
Overall, these results support the integration of hierarchical trait-based approaches in tropical forest ecology, where species traits inform community function, and community-weighted strategies reflect the cumulative outcome of ecological filtering and successional processes.
4.3. Community Functional Spectra driven by Environmental Factors, Forest Age and Species Richness
The composition of functional strategies in regenerating communities is shaped by complex interactions among successional stage, environmental filters, and species richness. Our results show that forest age exerts a dominant influence on functional composition, particularly along the SSIS (PC1), where older plots are increasingly dominated by species with greater structural and reproductive investment (LLP and OGS). This trajectory is facilitated by declining soil compaction (i.e., penetration resistance), suggesting that the physical recovery of soils enhances the transition from acquisitive to conservative trait strategies.
The WTG (PC2), by contrast, was more strongly influenced by soil chemistry, texture, and microclimatic conditions. Traits associated with structural persistence (e.g., high WD, LDMC, SS) were more frequent in plots with higher clay content, lower pH, and lower temperatures, reflecting the importance of edaphic stability in supporting conservative strategies [53,83].
Interestingly, the SEM revealed a negative covariance between forest age and soil fertility (SOI)—particularly variables like pH and CEC—indicating that as forests recover, soil chemical quality may not improve in parallel with vegetation structure. This decoupling may reflect nutrient depletion, leaching, or legacy effects of land-use history, and challenges the assumption that passive regeneration inherently restores soil conditions. Such findings highlight the need for active soil management (e.g., organic amendments, erosion control) in degraded Amazonian landscapes undergoing restoration.
Tree species richness also played a mediating role. SEMs showed that richness increased with forest age and precipitation, and positively influenced PC2, suggesting that more diverse communities support a broader array of structurally persistent strategies. This supports the insurance hypothesis, where biodiversity buffers against environmental variability and promotes long-term functional stability [89,96].
Moreover, environmental variables had both direct and indirect effects on functional composition. For instance, precipitation enhanced PC1 scores, while temperature and slope negatively influenced PC2. Soil variables influenced both axes, either directly or via interactions with forest age and species richness. These patterns underscore the need to view community assembly as the outcome of interacting abiotic and biotic processes, rather than unidirectional succession.
From a restoration perspective, these findings call for context-aware interventions. Functional recovery depends not only on successional time but also on the specific combination of soil quality, climatic constraints, and species pool composition. Monitoring and improving belowground conditions should be considered essential components of long-term restoration strategies, especially in chronically degraded or compacted sites.
5. Conclusions
This study provides a multiscale functional analysis of regenerating Amazonian forests, demonstrating that plant communities assemble along consistent trait-based spectra that reflect ecological trade-offs, life-history strategies, and environmental filtering. At the species level, three dominant functional axes—Size–Seed Investment, Woodiness–Toughness, and the Leaf Economic Spectrum—capture key dimensions of plant ecological strategies in tropical systems. These spectra aligned closely with life-history types (SLP, LLP, OGS), confirming their relevance for interpreting successional processes and guiding ecological restoration.
At the community level, trait composition followed predictable trajectories along the successional gradient, mirroring species-level patterns. Early-stage assemblages were dominated by acquisitive, short-lived pioneer species, while older plots were increasingly composed of long-lived pioneers and old-growth species exhibiting structurally conservative traits—consistent with the Colonization–Longevity Trade-Off Spectrum and the Persistence–Acquisition Spectrum. Functional richness and divergence peaked in mid- to late-successional stages, highlighting the critical role of intermediate forests dominated by long-lived pioneers as functional bridges that support both biodiversity accumulation and structural transition toward mature forest conditions.
The observed congruence between species- and community-level trait spectra supports the use of community-weighted means as indicators of functional assembly and ecosystem recovery. These metrics retain ecological signal across scales and offer a practical tool for monitoring restoration outcomes, especially in data-limited contexts.
Crucially, our findings reveal that functional recovery is not determined by forest age alone, but results from the interplay of successional processes, tree species richness, and environmental filtering. Soil compaction, nutrient availability, texture, and climatic factors (e.g., precipitation, temperature, slope) significantly influenced trait expression across the landscape. Structural equation models showed that while forest age promoted conservative strategies, soil fertility tended to decline over time, suggesting that passive regeneration may not fully restore belowground function.
These insights emphasize the importance of matching species’ functional traits to site-specific environmental conditions, particularly in relation to soil physical and chemical properties and local microclimate. Restoration outcomes can be enhanced by selecting species adapted to the constraints and opportunities of each site, rather than relying on generalized successional expectations. This trait–environment matching is especially relevant in degraded Amazonian landscapes, where edaphic legacies can hinder functional convergence. Such trait–environment matching represents a critical principle in designing context-aware restoration strategies in degraded Amazonian landscapes.
From a restoration planning perspective, our results support the intentional design of functionally diverse species pools that reflect target ecosystem functions. This includes not only early colonizers (e.g., A. pedicellaris, H. fascicularis, J. copaia), but also long-lived pioneers (e.g., A. chambira, A. cuatrecasasianum, P. campanulata) and old-growth species (e.g., C. capitellata, T. cerasina, C. surinamensis, L. harlingii, H. oblongifolia, D. guianense, Cedrela odorata) that contribute to carbon storage, canopy complexity, and ecological and disturbance resilience.
Prioritizing mid-successional forests as transitional stages for intervention and enrichment can significantly enhance ecological recovery. These systems harbor key functional traits and structural features that are essential for the consolidation of mature forest dynamics, thereby supporting long-term monitoring and restoration efforts in regenerating Amazonian landscapes.
Supplementary Materials
The following supporting information can be downloaded at the website of this paper posted on Preprints.org, Figure S1. Location of the 33 study plots in the northwestern Colombian Amazon. Abbreviations: <10, secondary forest regenerating for less than 10 years after livestock abandonment; 10–20, secondary forest regenerating for 10–20 years; 21–30, regenerating for 21–30 years; 31–40, regenerating for 31–40 years; OF, old-growth forest. Figure S2. Horn’s parallel analysis based on a simulated dataset with 5,000 permutations using mean eight functional trait values of 226 tree species in regenerating Amazonian forests. Figure S3. Functional trait space of three life-history strategies projected onto the global trait space defined by a PCA based on all 226 tree species in regenerating Amazonian forests. Figure S4. Horn’s parallel analysis based on a simulated dataset with 5,000 permutations using mean eight functional trait values of 81 tree species from the five most representative families in regenerating Amazonian forests. Figure S5. Functional trait space of three life-history strategies projected onto the global trait space defined by a PCA based on 81 tree species from the five most representative families in regenerating Amazonian forests. Figure S6. Functional trait space of the five most representative families projected onto the global trait space defined by a PCA based on 81 tree species in regenerating Amazonian forests. Figure S7. Horn’s parallel analysis based on a simulated dataset with 5,000 permutations using the community-weighted means of eight traits from 33 tree communities in regenerating Amazonian forests following livestock abandonment. Figure S8. Functional trait space of five successional categories projected onto the global trait space defined by a PCA based on the community-weighted means of eight traits from 33 tree communities in regenerating Amazonian forests. Figure S9. Changes in functional traits along a natural regeneration chronosequence following livestock abandonment. Figure S10. Pairwise correlation matrix among forest age, tree species richness, communi-ty-weighted means (CWM) of eight functional traits, and scores of community-level functional spectra (PC1 and PC2). Figure S11. Pairwise correlation matrix among 16 environmental factors related to aboveground conditions and soil properties. Figure S12. Horn’s parallel analysis based on a simulated dataset with 5,000 permutations using the means of 16 environmental factors from 33 study plots. Figure S13. Relationship between community-level functional spectra (PC1 and PC2) and the first two principal components of the environmental variables (environmental PC1 and PC2). Table S1. Summary of the principal component analysis (PCA) applied to eight functional traits of 226 tree species in regenerating Amazonian forests following livestock abandonment. Table S2. Loadings and explained variance of three life-history strategies for 226 species in the functional space defined by the first three principal components of the PCA. Table S3. Summary of the principal component analysis (PCA) applied to eight functional traits of 81 tree species belonging to the five most representative families in regenerating Amazonian forests following livestock abandonment. Table S4. Loadings and explained variance of three life-history strategies for 81 species belonging to the five most representative families in the functional space defined by the first three principal components of the PCA. Table S5. Summary of the principal component analysis (PCA) applied to the community-weighted mean (CWM) of eight traits of 33 plots in regenerating Amazonian forests following livestock abandonment. Table S6. Loadings and explained variance of 16 environmental factors and three life-history strategies for 33 tree communities in the functional space defined by the first two principal com-ponents of the PCA. Table S7. Adjusted means and standard errors of PC1 and PC2 scores across different successional categories, derived from linear mixed-effects model analysis. Table S8. Adjusted means and standard errors of the community-weighted means (CWM) of eight traits across different successional categories, derived from linear mixed-effects model analysis. Table S9. Pearson correlation coefficients among environmental variables, forest age, tree species richness, and functional space scores (PC1 and PC2). Table S10. Summary of the estimated coefficients from the selected averaged model for PC1: Colonization-longevity trade-off spectrum (CLTS). ***p < 0.01; **p < 0.01; *p < 0.05. Table S11. Summary of the estimated coefficients from the selected averaged model for PC2: Persistence-acquisition spectrum (PAS).: ***p < 0.001; **p < 0.01; *p < 0.05. Table S12. Details of structural equation model in PC1. Table S13. Details of structural equation model in PC2.
Author Contributions
Conceptualization, C.H.R.-L., A.S., and L.L.R.-F.; methodology, C.H.R.-L., A.S., and L.L.R.-F.; software, A.S.; validation, A.S., and L.L.R.-F.; formal analysis, A.S.; investigation, C.H.R.-L., A.S.; and L.L.R.-F., resources, C.H.R.-L.; data curation, D.D.D-G., Y.D.S.-C., and A.S.; writing—original draft preparation, A.S., D.D.D-G., Y.D.S.-C., and L.L.R.-F.; writing—review and editing, C.H.R.-L., L.L.R.-F., A.S., and D.D.D-G., visualization, A.S. D.D.D-G., and Y.D.S.-C.; supervision, C.H.R.-L., A.S., and L.L.R.-F.; project administration, C.H.R.-L.; funding acquisition, C.H.R.-L. All authors have read and agreed to the published version of the manuscript.
Funding
This research was part of the project: “Restauración de áreas disturbadas por implementación de sistemas productivos agropecuarios en zonas de alta intervención en el Caquetá”, funded by the Fondo de Ciencia, Tecnología e Innovación FCTeI—SGR, the Amazonian Scientific Research Institute Sinchi, the Government of Caquetá, the Universidad de la Amazonía, the Asociación de Reforestadores y Cultivadores de Caucho del Caquetá ASOHECA, and the Federación Departamental de Ganaderos del Caquetá FEDEGANGA. Contract 60/2013; and by the Government of Colombia through the project BPIN 202300000000285 “Investigación científica transformativa para potenciar el bienestar, la conservación y la gobernanza ambiental en la Amazonia colombiana Amazonas, Caquetá, Guainía, Guaviare, Meta, Putumayo, Vaupés”.
Data Availability Statement
Data are available from the authors upon request.
Acknowledgments
The authors thank all the farmers in the study area for their help and support during the fieldwork.
Conflicts of Interest
The authors declare no conflicts of interest. The funders had no role in the design of the study; in the collection, analyses, or interpretation of the data; in the writing of the manuscript, or in the decision to publish the results.
References
- Peres, C.A.; Emilio, T.; Schietti, J.; Desmoulière, S.J.M.; Levi, T. Dispersal Limitation Induces Long-Term Biomass Collapse in Overhunted Amazonian Forests. Proc Natl Acad Sci U S A 2016, 113, 892–897. [Google Scholar] [CrossRef] [PubMed]
- Laurance, W.F.; Laurance, S.G.; Delamonica, P. Tropical Forest Fragmentation and Greenhouse Gas Emissions. For Ecol Manage 1998, 110, 173–180. [Google Scholar] [CrossRef]
- De Lima, M.G.; Gascon, C. The Conservation Value of Linear Forest Remnants in Central Amazonia, 1999.
- Sierra, R. Dynamics and Patterns of Deforestation in the Western Amazon: The Napo Deforestation Front, 1986-1996. Applied Geography 2000, 20, 1–16. [Google Scholar] [CrossRef]
- Batistella, M.; Brondizio, E.S.; Moran, E.F. COMPARATIVE ANALYSIS OF LANDSCAPE FRAGMENTATION IN RONDÔNIA, BRAZILIAN AMAZON. International Archives of Photogrammetry and Remote Sensing 2000, XXXIII. Part B7, 148–155. [Google Scholar]
- Armenteras, D.; Rudas, G.; Rodriguez, N.; Sua, S.; Romero, M. Patterns and Causes of Deforestation in the Colombian Amazon. Ecol Indic 2006, 6, 353–368. [Google Scholar] [CrossRef]
- Armenteras, D.; Murcia, U.; González, T.M.; Barón, O.J.; Arias, J.E. Scenarios of Land Use and Land Cover Change for NW Amazonia: Impact on Forest Intactness. Glob Ecol Conserv 2019, 17, e00567. [Google Scholar] [CrossRef]
- Jiménez, J.G.; Mantilla, L.M.; Barrera, J.A. Enfoque Agroambiental: Una Mirada Distinta a Las Intervenciones Productivas En La Amazonia. Caquetá y Guaviare; Instituto Amazónico de Investigaciones Científicas SINCHI: Bogotá, D.C, 2019. [Google Scholar]
- González-González, A.; Villegas, J.C.; Clerici, N.; Salazar, J.F. Spatial-Temporal Dynamics of Deforestation and Its Drivers Indicate Need for Locally-Adapted Environmental Governance in Colombia. Ecol Indic 2021, 126, 107695. [Google Scholar] [CrossRef]
- Poorter, L.; Craven, D.; Jakovac, C.C.; van der Sande, M.T.; Amissah, L.; Bongers, F.; Chazdon, R.L.; Farrior, C.E.; Kambach, S.; Meave, J.A.; et al. Multidimensional Tropical Forest Recovery. Science (1979) 2021, 374, 1370–1376. [Google Scholar] [CrossRef]
- Chazdon, R.L.; Broadbent, E.N.; Rozendaal, D.M.A.; Bongers, F.; Zambrano, A.M.A.; Aide, T.M.; Balvanera, P.; Becknell, J.M.; Boukili, V.; Brancalion, P.H.S.; et al. Carbon Sequestration Potential of Second-Growth Forest Regeneration in the Latin American Tropics. Sci Adv 2016, 2. [Google Scholar] [CrossRef]
- Rozendaal, D.M.A.; Bongers, F.; Aide, T.M.; Alvarez-Dávila, E.; Ascarrunz, N.; Balvanera, P.; Becknell, J.M.; Bentos, T. V.; Brancalion, P.H.S.; Cabral, G.A.L.; et al. Biodiversity Recovery of Neotropical Secondary Forests. Sci Adv 2019, 5, eaau3114. [Google Scholar] [CrossRef]
- Elias, F.; Ferreira, J.; Resende, A.F.; Berenguer, E.; França, F.; Smith, C.C.; Schwartz, G.; Nascimento, R.O.; Guedes, M.; Chesini Rossi, L.; et al. Comparing Contemporary and Lifetime Rates of Carbon Accumulation from Secondary Forests in the Eastern Amazon. For Ecol Manage 2022, 508. [Google Scholar] [CrossRef]
- Arroyo-Rodríguez, V.; Melo, F.P.L.; Martínez-Ramos, M.; Bongers, F.; Chazdon, R.L.; Meave, J.A.; Norden, N.; Santos, B.A.; Leal, I.R.; Tabarelli, M. Multiple Successional Pathways in Human-Modified Tropical Landscapes: New Insights from Forest Succession, Forest Fragmentation and Landscape Ecology Research. Biological Reviews 2017, 92, 326–340. [Google Scholar] [CrossRef] [PubMed]
- Wright, I.J.; Reich, P.B.; Westoby, M.; Ackerly, D.D.; Baruch, Z.; Bongers, F.; Cavender-Bares, J.; Chapin, T.; Cornelissen, J.H.C.; Diemer, M.; et al. The Worldwide Leaf Economics Spectrum. Nature 2004, 428, 821–827. [Google Scholar] [CrossRef] [PubMed]
- Díaz, S.; Kattge, J.; Cornelissen, J.H.C.; Wright, I.J.; Lavorel, S.; Dray, S.; Reu, B.; Kleyer, M.; Wirth, C.; Prentice, I.C.; et al. The Global Spectrum of Plant Form and Function. Nature 2016, 529, 167–171. [Google Scholar] [CrossRef]
- Violle, C.; Navas, M.-L.; Vile, D.; Kazakou, E.; Fortunel, C.; Hummel, I.; Garnier, E. Let the Concept of Trait Be Functional! Oikos 2007, 116, 882–892. [Google Scholar] [CrossRef]
- Reich, P.B. The World-Wide “fast-Slow” Plant Economics Spectrum: A Traits Manifesto. Journal of Ecology 2014, 102, 275–301. [Google Scholar] [CrossRef]
- Maracahipes, L.; Carlucci, M.B.; Lenza, E.; Marimon, B.S.; Marimon, B.H.; Guimarães, F.A.G.; Cianciaruso, M. V How to Live in Contrasting Habitats? Acquisitive and Conservative Strategies Emerge at Inter- and Intraspecific Levels in Savanna and Forest Woody Plants. Perspect Plant Ecol Evol Syst 2018, 34, 17–25. [Google Scholar] [CrossRef]
- Maynard, D.S.; Bialic-Murphy, L.; Zohner, C.M.; Averill, C.; van den Hoogen, J.; Ma, H.; Mo, L.; Smith, G.R.; Acosta, A.T.R.; Aubin, I.; et al. Global Relationships in Tree Functional Traits. Nat Commun 2022, 13. [Google Scholar] [CrossRef]
- Carmona, C.P.; de Bello, F.; Mason, N.W.H.; Lepš, J. Traits Without Borders: Integrating Functional Diversity Across Scales. Trends Ecol Evol 2016, 31, 382–394. [Google Scholar] [CrossRef]
- Mason, N.W.H.; Mouillot, D.; Lee, W.G.; Wilson, J.B. Functional Richness, Functional Evenness and Functional Divergence: The Primary Components of Functional Diversity. Oikos 2005, 111, 112–118. [Google Scholar] [CrossRef]
- Westoby, M.; Falster, D.S.; Moles, A.T.; Vesk, P.A.; Wright, I.J. Plant Ecological Strategies: Some Leading Dimensions of Variation between Species. Annu Rev Ecol Syst 2002, 33, 125–159. [Google Scholar] [CrossRef]
- Carmona, C.P.; De Bello, F.; Mason, N.W.H.; Lep S, J. Trait Probability Density (TPD): Measuring Functional Diversity across Scales Based on TPD with R. 2019.
- ter Steege, H.; Poorter, L.; Aguirre-Gutiérrez, J.; Fortunel, C.; Magnusson, W.E.; Phillips, O.L.; Pos, E.; Luize, B.G.; Baraloto, C.; Guevara, J.E.; et al. Functional Composition of the Amazonian Tree Flora and Forests. Commun Biol 2025, 8, 355. [Google Scholar] [CrossRef] [PubMed]
- Cadotte, M.W.; Carscadden, K.; Mirotchnick, N. Beyond Species: Functional Diversity and the Maintenance of Ecological Processes and Services. Journal of Applied Ecology 2011, 48, 1079–1087. [Google Scholar] [CrossRef]
- Sakschewski, B.; Von Bloh, W.; Boit, A.; Poorter, L.; Peña-Claros, M.; Heinke, J.; Joshi, J.; Thonicke, K. Resilience of Amazon Forests Emerges from Plant Trait Diversity. Nat Clim Chang 2016, 6, 1032–1036. [Google Scholar] [CrossRef]
- Schmitt, S.; Maréchaux, I.; Chave, J.; Fischer, F.J.; Piponiot, C.; Traissac, S.; Hérault, B. Functional Diversity Improves Tropical Forest Resilience: Insights from a Long-Term Virtual Experiment. Journal of Ecology 2020, 108, 831–843. [Google Scholar] [CrossRef]
- Fauset, S.; Johnson, M.O.; Gloor, M.; Baker, T.R.; M., A.M.; Brienen, R.J.W.W.; Feldpausch, T.R.; Lopez-Gonzalez, G.; Malhi, Y.; Steege, H. Ter; et al. Hyperdominance in Amazonian Forest Carbon Cycling. Nat Commun 2015, 6, 6857. [Google Scholar] [CrossRef]
- Lohbeck, M.; Bongers, F.; Martinez-Ramos, M.; Poorter, L. The Importance of Biodiversity and Dominance for Multiple Ecosystem Functions in a Human-Modifed Tropical Landscape. Ecology 2016, 97, 2772–2779. [Google Scholar]
- Ali, A.; Yan, E.R.; Chang, S.X.; Cheng, J.Y.; Liu, X.Y. Community-Weighted Mean of Leaf Traits and Divergence of Wood Traits Predict Aboveground Biomass in Secondary Subtropical Forests. Science of the Total Environment 2017, 574, 654–662. [Google Scholar] [CrossRef]
- Tilman, D.; Knops, J.; Wedin, D.; Reich, P.; Ritchie, M.; Siemann, E. The Influence of Functional Diversity and Composition on Ecosystem Processes. Science (1979) 1997, 277, 1300–1302. [Google Scholar] [CrossRef]
- Yuan, Z.; Wang, S.; Gazol, A.; Mellard, J.; Lin, F.; Ye, J.; Hao, Z.; Wang, X.; Loreau, M. Multiple Metrics of Diversity Have Different Effects on Temperate Forest Functioning over Succession. Oecologia 2016, 182, 1175–1185. [Google Scholar] [CrossRef]
- Yuan, Z.; Wang, S.; Ali, A.; Gazol, A.; Ruiz-Benito, P.; Wang, X.; Lin, F.; Ye, J.; Hao, Z.; Loreau, M. Aboveground Carbon Storage Is Driven by Functional Trait Composition and Stand Structural Attributes Rather than Biodiversity in Temperate Mixed Forests Recovering from Disturbances. Ann For Sci 2018, 75. [Google Scholar] [CrossRef]
- Prado-Junior, J.A.; Schiavini, I.; Vale, V.S.; Raymundo, D.; Lopes, S.F.; Poorter, L. Functional Traits Shape Size-Dependent Growth and Mortality Rates of Dry Forest Tree Species. Journal of Plant Ecology 2016, 10, rtw103. [Google Scholar] [CrossRef]
- Pothasin, P.; Paradis, E.; Brockelman, W.Y.; Nathalang, A.; Khemrugka, T.; Lomwong, N.; Thripob, P.; Saenprasert, R.; Chanthorn, W. Seed Size Variation of Trees and Lianas in a Tropical Forest of Southeast Asia: Allometry, Phylogeny, and Seed Trait - Plant Functional Trait Relationships. Front Plant Sci 2022, 13. [Google Scholar] [CrossRef] [PubMed]
- Grime, J.P. Plant Strategies, Vegetation Processes and Ecosystem Properties.; Grime, J.P., Ed.; John Wiley & Sons Ltd, 2001; ISBN 0471496014.
- Wang, W.; Zhao, J.; Zhang, B.; Deng, G.; Maimaiti, A.; Guo, Z. Patterns and Drivers of Tree Species Diversity in a Coniferous Forest of Northwest China. Frontiers in Forests and Global Change 2024, 7. [Google Scholar] [CrossRef]
- Laughlin, D.C. The Intrinsic Dimensionality of Plant Traits and Its Relevance to Community Assembly. Journal of Ecology 2014, 102, 186–193. [Google Scholar] [CrossRef]
- IGAC, I.G.A.C. Caquetá, Características Geográficas; Imprenta nacional de Colombia: Bogotá, DC, 2010. [Google Scholar]
- Rodríguez-León, C.H.; Peña-Venegas, C.P.; Sterling, A.; Castro, D.; Mahecha-Virguez, L.K.; Virguez-Díaz, Y.R.; Silva-Olaya, A.M. Soil Quality Restoration during the Natural Succession of Abandoned Cattle Pastures in Deforested Landscapes in the Colombian Amazon. Agronomy 2021, 11, 2484. [Google Scholar] [CrossRef]
- Rodríguez-León, C.H.; Sterling, A.; Trujillo-Briñez, A.; Suárez-Córdoba, Y.D.; Roa-Fuentes, L.L. Forest Attribute Dynamics in Secondary Forests: Insights for Advancing Ecological Restoration and Transformative Territorial Management in the Amazon. Diversity (Basel) 2025, 17. [Google Scholar] [CrossRef]
- Baraloto, C.; Timothy Paine, C.E.; Patiño, S.; Bonal, D.; Hérault, B.; Chave, J. Functional Trait Variation and Sampling Strategies in Species-Rich Plant Communities. Funct Ecol 2010, 24, 208–216. [Google Scholar] [CrossRef]
- Pérez-Harguindeguy, N.; Díaz, S.; Garnier, E.; Lavorel, S.; Poorter, H.; Jaureguiberry, P.; Bret-Harte, M.S.; Cornwell, W.K.; Craine, J.M.; Gurvich, D.E.; et al. Corrigendum to: New Handbook for Standardised Measurement of Plant Functional Traits Worldwide. Aust J Bot 2016, 64, 715. [Google Scholar] [CrossRef]
- Grubb, P.J.; Coomes, D.A. Seed Mass and Nutrient Content in Nutrient-Starved Tropical Rainforest in Venezuela. Seed Sci Res 1997, 7, 269–280. [Google Scholar] [CrossRef]
- Green, P.T.; Juniper, P.A. Seed-Seedling Allometry in Tropical Rain Forest Trees: Seed Mass-Related Patterns of Resource Allocation and the “Reserve Effect. ” Journal of Ecology 2004, 92, 397–408. [Google Scholar] [CrossRef]
- Kelly, C.K.; Kelly, C.K. Seed Size in Tropical Trees: A Comparative Study of Factors Affecting Seed Size in Peruvian Angiosperms; Springer-Verlag, 1995; Vol. 102;
- Ley-López, J.M.; Wawrzyniak, M.K.; Chacón-Madrigal, E.; Chmielarz, P. Seed Traits and Tropical Arboreal Species Conservation: A Case Study of a Highly Diverse Tropical Humid Forest Region in Southern Costa Rica. Biodivers Conserv 2023, 32, 1573–1590. [Google Scholar] [CrossRef]
- Norden, N.; Chave, J.; Belbenoit, P.; Caubère, A.; Châtelet, P.; Forget, P.M.; Riéra, B.; Viers, J.; Thébaud, C. Interspecific Variation in Seedling Responses to Seed Limitation and Habitat Conditions for 14 Neotropical Woody Species. Journal of Ecology 2009, 97, 186–197. [Google Scholar] [CrossRef]
- Prado-Junior, J.A.; Schiavini, I.; Vale, V.S.; Raymundo, D.; Lopes, S.F.; Poorter, L. Functional Traits Shape Size-Dependent Growth and Mortality Rates of Dry Forest Tree Species. Journal of Plant Ecology 2016, 1–12. [Google Scholar] [CrossRef]
- Sautu, A.; Baskin, J.M.; Baskin, C.C.; Condit, R. Studies on the Seed Biology of 100 Native Species of Trees in a Seasonal Moist Tropical Forest, Panama, Central America. For Ecol Manage 2006, 234, 245–263. [Google Scholar] [CrossRef]
- Svenning, J.C.; Wright, S.J. Seed Limitation in a Panamanian Forest. Journal of Ecology 2005, 93, 853–862. [Google Scholar] [CrossRef]
- Díaz, S.; Kattge, J.; Cornelissen, J.H.C.; Wright, I.J.; Lavorel, S.; Dray, S.; Reu, B.; Kleyer, M.; Wirth, C.; Colin Prentice, I.; et al. The Global Spectrum of Plant Form and Function. Nature 2016, 529, 167–171. [Google Scholar] [CrossRef]
- Ter Steege, H.; Welch, I.; Zagt, R. Long-Term Effect of Timber Harvesting in the Bartica Triangle, Central Guyana. For Ecol Manage 2002, 170, 127–144. [Google Scholar] [CrossRef]
- Steege, H. Ter; Welch, I.; Zagt, R.; Ter Steege, H.; Welch, I.; Zagt, R. Long-Term Effect of Timber Harvesting in the Bartica Triangle, Central Guyana; 2002; Vol. 170, pp. 127–144;
- Finegan, B. Pattern and Process in Neotropical Secondary Rain Forests: The First 100 Years of Succession. Trends Ecol Evol 1996, 11, 119–124. [Google Scholar] [CrossRef]
- Rodríguez-León, C.H.; Roa-Fuentes, L.L.; Sterling, A.; Suárez, J.C. Plant Biodiversity Homogenization across the Chronosequence in Highly Fragmented Landscapes in the Colombian Andean–Amazonian Transition. Forests 2022, 13, 1422. [Google Scholar] [CrossRef]
- Fick, S.E.; Hijmans, R.J. WorldClim 2: New 1-Km Spatial Resolution Climate Surfaces for Global Land Areas. International Journal of Climatology 2017, 37, 4302–4315. [Google Scholar] [CrossRef]
- Worldwide, R.C.T. and contributors The R Stats Package. Version 4.3.3 2024.
- Carmona, C.P.; Pavanetto, N.; Puglielli, G. Funspace: Creating and Representing Functional Trait Spaces. R Package Version 0.2.2. CRAN: Contributed Packages, 2024. [Google Scholar]
- Carmona, C.P.; Pavanetto, N.; Puglielli, G. Funspace: An R Package to Build, Analyse and Plot Functional Trait Spaces. Divers Distrib 2024, 30, e13820. [Google Scholar] [CrossRef]
- R Core Team R: A Language and Environment for Statistical Compunting 2024.
- Gross, N.; Maestre, F.T.; Liancourt, P.; Berdugo, M.; Martin, R.; Gozalo, B.; Ochoa, V.; Delgado-Baquerizo, M.; Maire, V.; Saiz, H.; et al. Unforeseen Plant Phenotypic Diversity in a Dry and Grazed World. Nature 2024, 632, 808–814. [Google Scholar] [CrossRef]
- Dinno, A. Paran: Horn’s Test of Principal Components/Factors. R Package Version 1.5.4. CRAN: Contributed Packages, 2025. [Google Scholar]
- Dixon, P. VEGAN, a Package of R Functions for Community Ecology. J. Veg. Sci. 2009, 14. [Google Scholar] [CrossRef]
- Pinheiro, J.; Bates, D.; DebRoy, S.; Sarkar, D. Nlme: Linear and Nonlinear Mixed Effects Models. R Package Version 3.1-131. 2018. [Google Scholar]
- Di Rienzo, J.A.; Casanoves, F.; Balzarini, M.G.; Gonzalez, L.; Tablada, M.; Robledo, C.W. InfoStat Versión 2020 2020.
- Revelle, W. Package: Psych - Procedures for Psychological, Psychometric, and Personality Research - R Package Version 2.4.6.26. Repository: CRAN, 2024. [Google Scholar]
- Huang, H. LinkET: Everything Is Linkable. R Package Version 0.0.3. CRAN Contributed 2021.
- Bates, D.; Maechler, M.; Bolker, B.; Walker, S.; Bojesen, R.H.; Singmann, H.; Dai, B.; Scheipl, F.; Grothendieck, G.; Green, P.; et al. Package Lme4:Linear Mixed-Effects Models Using “Eigen” and S4 Package Version: 1.1-27. 2021.
- Kuznetsova, A.; Bruun Brockhoff, P.; Haubo Bojesen Christensen, R.; Pødenphant Jensen, S. LmerTest: Tests in Linear Mixed Effects Models. R Package Version 3.1-3. CRAN: Contributed Packages, 2020. [Google Scholar]
- Fox, J.; Weisberg, S.; Price, B.; et al. R-Core Car: Companion to Applied Regression. R Package Version 3.1-3. CRAN: Contributed Packages, 2024. [Google Scholar]
- Bartoń, K. MuMIn: Multi-Model Inference. R Package Version 1.43. 2020.
- Wickham, H.; Chang, W.; Henry, L.; Pedersen, T.; Takahashi, K.; Wilke, C.; Woo, K.; Yutani, H. [aut]; Dunnington, D. Package ‘Ggplot2’: Create Elegant Data Visualisations Using the Grammar of Graphics Version 3.3.3. 2020.
- Rosseel, Y. Lavaan : An R Package for Structural Equation Modeling. J Stat Softw 2012, 48. [Google Scholar] [CrossRef]
- Epskamp, S.; Stuber, S.; Nak, J.; Veenman, M.; Jorgensen, T.D. SemPlot: Path Diagrams and Visual Analysis of Various SEM Packages’. Output. R Package Version 1.1.6. CRAN: Contributed Packages, 2022. [Google Scholar]
- RStudio RStudio Version 2025.05.0 2025.
- Westoby, M.; Falster, D.S.; Moles, A.T.; Vesk, P.A.; Wright, I.J. Plant Ecological Strategies: Some Leading Dimensions of Variation Between Species. Annu Rev Ecol Evol Syst 2002, 33, 125–159. [Google Scholar] [CrossRef]
- ter Steege, H.; Poorter, L.; Aguirre-Gutiérrez, J.; Fortunel, C.; Magnusson, W.E.; Phillips, O.L.; Pos, E.; Luize, B.G.; Baraloto, C.; Guevara, J.E.; et al. Functional Composition of the Amazonian Tree Flora and Forests. Commun Biol 2025, 8, 355. [Google Scholar] [CrossRef] [PubMed]
- Finegan, B. Pattern and Process in Neotropical Secondary Rain Forests: The First 100 Years of Succession. Trends Ecol Evol 1996, 11, 119–124. [Google Scholar] [CrossRef] [PubMed]
- Poorter, L.; Craven, D.; Jakovac, C.C.; van der Sande, M.T.; Amissah, L.; Bongers, F.; Chazdon, R.L.; Farrior, C.E.; Kambach, S.; Meave, J.A.; et al. Multidimensional Tropical Forest Recovery. Science (1979) 2021, 374, 1370–1376. [Google Scholar] [CrossRef] [PubMed]
- Wright, I.J.; Reich, P.B.; Westoby, M.; Ackerly, D.D.; Baruch, Z.; Bongers, F.; Cavender-Bares, J.; Chapin, T.; Cornelissen, J.H.C.; Diemer, M.; et al. The Worldwide Leaf Economics Spectrum. Nature 2004, 428, 821–827. [Google Scholar] [CrossRef]
- Carmona, C.P.; de Bello, F.; Mason, N.W.H.; Lepš, J. Traits Without Borders: Integrating Functional Diversity Across Scales. Trends Ecol Evol 2016, 31, 382–394. [Google Scholar] [CrossRef]
- Cope, O.L.; Lindroth, R.L.; Helm, A.; Keefover-Ring, K.; Kruger, E.L. Trait Plasticity and Trade-Offs Shape Intra-Specific Variation in Competitive Response in a Foundation Tree Species. New Phytologist 2021, 230, 710–719. [Google Scholar] [CrossRef]
- Reich, P.B. The World-Wide ‘Fast–Slow’ Plant Economics Spectrum: A Traits Manifesto. Journal of Ecology 2014, 102, 275–301. [Google Scholar] [CrossRef]
- Violle, C.; Navas, M.-L.; Vile, D.; Kazakou, E.; Fortunel, C.; Hummel, I.; Garnier, E. Let the Concept of Trait Be Functional! Oikos 2007, 116, 882–892. [Google Scholar] [CrossRef]
- Martínez-Ramos, M.; Barragán, F.; Mora, F.; Maza-Villalobos, S.; Arreola-Villa, L.F.; Bhaskar, R.; Bongers, F.; Lemus-Herrera, C.; Paz, H.; Martínez-Yrizar, A.; et al. Differential Ecological Filtering across Life Cycle Stages Drive Old-Field Succession in a Neotropical Dry Forest. For Ecol Manage 2021, 482, 118810. [Google Scholar] [CrossRef]
- Mason, N.W.H.; Mouillot, D.; Lee, W.G.; Wilson, J.B. Functional Richness, Functional Evenness and Functional Divergence: The Primary Components of Functional Diversity. Oikos 2005, 111, 112–118. [Google Scholar] [CrossRef]
- Cadotte, M.W.; Carscadden, K.; Mirotchnick, N. Beyond Species: Functional Diversity and the Maintenance of Ecological Processes and Services. Journal of Applied Ecology 2011, 48, 1079–1087. [Google Scholar] [CrossRef]
- Rozendaal, D.M.A.; Bongers, F.; Aide, T.M.; Alvarez-Dávila, E.; Ascarrunz, N.; Balvanera, P.; Becknell, J.M.; Bentos, T. V; Brancalion, P.H.S.; Cabral, G.A.L.; et al. Biodiversity Recovery of Neotropical Secondary Forests. Sci Adv 2022, 5, eaau3114. [Google Scholar] [CrossRef] [PubMed]
- Rodríguez-León, C.H.; Roa-Fuentes, L.L.; Sterling, A.; Suárez, J.C. Plant Biodiversity Homogenization across the Chronosequence in Highly Fragmented Landscapes in the Colombian Andean–Amazonian Transition. Forests 2022, 13. [Google Scholar] [CrossRef]
- Lohbeck, M.; Bongers, F.; Martinez-Ramos, M.; Poorter, L. The Importance of Biodiversity and Dominance for Multiple Ecosystem Functions in a Human-Modified Tropical Landscape. Ecology 2016, 97, 2772–2779. [Google Scholar]
- Poorter, L.; Bongers, F.; Aide, T.M.; Almeyda Zambrano, A.; Balvanera, P.; Becknell, J.M.; Boukili, V.; Brancalion, P.H.S.; Broadbent, E.N.; Chazdon, R.L.; et al. Biomass Resilience of Neotropical Secondary Forests. Nature 2016, 530, 211–214. [Google Scholar] [CrossRef]
- Oliver, T.H.; Heard, M.S.; Isaac, N.J.B.; Roy, D.B.; Procter, D.; Eigenbrod, F.; Freckleton, R.; Hector, A.; Orme, C.D.L.; Petchey, O.L.; et al. Biodiversity and Resilience of Ecosystem Functions. Trends Ecol Evol 2015, 30, 673–684. [Google Scholar] [CrossRef]
- Garnier, E.; Cortez, J.; Billès, G.; Navas, M.-L.; Roumet, C.; Debussche, M.; Laurent, G.; Blanchard, A.; Aubry, D.; Bellmann, A.; et al. Plant Functional Markers Capture Ecosystem Properties during Secondary Succession. Ecology 2004, 85, 2630–2637. [Google Scholar] [CrossRef]
- Loreau, M.; de Mazancourt, C. Biodiversity and Ecosystem Stability: A Synthesis of Underlying Mechanisms. Ecol Lett 2013, 16, 106–115. [Google Scholar] [CrossRef]
Disclaimer/Publisher’s Note: The statements, opinions and data contained in all publications are solely those of the individual author(s) and contributor(s) and not of MDPI and/or the editor(s). MDPI and/or the editor(s) disclaim responsibility for any injury to people or property resulting from any ideas, methods, instructions or products referred to in the content. |
© 2025 by the authors. Licensee MDPI, Basel, Switzerland. This article is an open access article distributed under the terms and conditions of the Creative Commons Attribution (CC BY) license (https://creativecommons.org/licenses/by/4.0/).
Copyright: This open access article is published under a Creative Commons CC BY 4.0 license, which permit the free download, distribution, and reuse, provided that the author and preprint are cited in any reuse.


