
Submitted:
15 June 2025
Posted:
16 June 2025
You are already at the latest version
Abstract
Organic carbon (C) storage is a key factor in ensuring the provision of ecosystem services such as biodiversity conservation, especially in nature reserves. C storage and its changes in China’s Nature Reserves (NRs) are important to act on its role in ecosystem conservation. We based on NDVI values to assess the spatial and temporal variations of vegetation C storage in NRs from 2000 to 2015 in China. Results showed that the C storage in NRs increased by 63.06% within 15 years, of which the C storage of forest vegetation and grassland vegetation increased by 60.05% and 86.33% respectively. 90% of the NRs generally showed positive growth rate, and the growth rate of the northeast and west part NRs of China was higher than other regions. The carbon density of forest vegetation in nature reserves was higher than the region outside nature reserves, however, the grassland showed an opposite result. In general, the vegetation C storage in NRs showed an increasing trend in 15 years, and nature reserves played an important role in protecting forest carbon function, but the effect on protecting grassland vegetation carbon function was not obvious.
Keywords:
forest
; nature reserves
; vegetation carbon storage
; grassland
1. Introduction
Nature reserves (NRs) are widely considered as main approach for protecting biodiversity, which is threatened by human activities and environment polution (Strassburg et al. 2020; Jenkins et al. 2009). Since the establishment of first NR in 1956 in mainland China, the number and area of NRs increased rapidly (Chen et al. 2009). By the end of 2015, China established 2,763 NRs, accounting for 15.68% of China’s land area. Of all NRs, 428 are national level (covering 10.04% of China’s land surface) and the remaining are local reserves. Evidence showed that NRs not only secured biodiversity (Weiskopf, et al. 2024; Bruner et al. 2001), but also provided ecosystem services such as mitigating climate change (Soares-Filho et al. 2010), and enhance ecosystem resilience (Game et al. 2009). Among these ESs, sequestration and storage of C are incredibly important, given the long-term threat that climate change poses for global biodiversity and ecosystems (Thomas et al. 2013, Anderson-Teixeira 2018, Hisano et al. 2018), particularly when acting jointly with other ecosystem pressure such as habitat fragmentation (Isbell et al. 2015). Furthermore, C sequestration and storage are strongly linked with other ecosystem traits and processes (Thompson et al. 2014, Adhikari et al. 2016). Plant diversity and ecosystem productivity (Tang et al. 2016) for example are strongly linked to C storage. An analysis of C storage alone therefore already represents an effective basis for ecosystem function assessments (Mo et al. 2023; Juan et al. 2015). In China, the rapid increase in C emissions since the early 21st century is posing very serious problems both locally and globally. Between the years 2000 and 2012, China’s C emissions more than doubled from 3350.3 m t to 8250.8 m t (Li et al. 2017), and per capita emission rate of 7.2 t surpassed that of Europe by 2013. A great enhancement of C storage is seen as one potential mitigation measure for C emissions. Therefore, analysing the change trend of C stocks in nature reserves is conducive to judging whether nature reserves have played an important role in improving ecosystem services and alleviating C release in recent years.
Studies have reported that the spatial distribution of carbon sequestration was mismatch with nature reserve locations in China. In comparison with the nature reserve network’s 15.1% coverage of China’s total land surface, it contributes only 11.0% of carbon sequestration (Xu et al. 2017). Other relevant research was mainly implemented in a separate nature reserve. There are few studies on the temporal and spatial variation of vegetation carbon storage in nature reserves on a national scale in recent decades.
In order to expolat spatial and temporal variations of C stocks of NRs, we try to addresses the following issues, how C stocks were changing in NRs from 2000 to 2015? in which areas, the C storage of NRs have improved or degraded?
2. Methods
The data sets from Luo et al. (2013) and Song et al (2018) were used to obtain national forest and grassland vegetation biomass and 1:1 000000 Chinese vegetation atlas vector data was used to extract forest and grassland vegetation types. These data were combined with monthly MODIS-NDVI imagery (250m resolution) between 2000 and 2015 in multivariate linear regression models that allowed us to estimate the overall vegetation biomass across China in both ecosystems in this 15 years. The final C stock was calculated using a conversion factor of 0.5 between biomass and C stock (Fang et al. 2001). And each vegetation type was calculated separately, so we obtained different regression models for different vegetation types. We then used the NR spatial layer to specifically extract the C storage and its temporal dynamics for the NR network, alone. The resulting specific linear regression equations used in each year to estimate the C storage across China for both forests and grassland ecosystems (Appendix A).
3. Results
3.1. Change of Vegetation C Storage in NRs from 2000 to 2015
The C storage of all vegetation in NRs increased by 63.06% in 15 years, of which the C storage of forest vegetation and grassland vegetation increased by 60.05% and 86.33% respectively (Figure 1A). The C storage in forest vegetation of NRs increased between 2000 and 2015. Warm temperate deciduous broad-leaved forest had the largest increase (3607.79%), followed by temperate needles, deciduous broad-leaved mixed forest (2214.93%), cold temperate coniferous forest (913.13%) and subtropical evergreen broad-leaved forests (37.44%), whereas tropical monsoon forest decreased (-50.68%) (Figure 1B). C storage in grassland vegetation of NRs showed an increasing trend in addition to the tropical shrub-grassland. Alpine grassland had the largest improve (7882.38%), followed by desert steppe (486.78%), meadow (134.64%) and typical grassland (112.51%), whereas tropical shrub-grassland decreased slightly (-12.49%) (Figure 1C).
The increase proportion of total vegetation C storage in NRs to the national overall C storage is 2.01%, with forest and grassland increased 2.12% and 1.75% respectively (Figure 2A). The proportion of all types of forest vegetation C storage to the whole country was increased from 2000 to 2015, with tropical monsoon forest had the largest increase (14.97%), followed by warm temperate deciduous broad-leaved forest (2.35%), cold temperate coniferous forest (1.51%), subtropical evergreen broad-leaved forests (1.39%) and temperate needles, deciduous broad-leaved mixed forest (0.19%) (Figure 2B). The proportion of two types of grassland vegetation C storage to the whole country was decreased, while the other three types were improved. Among them, alpine grassland had the largest increase (23.81%), followed by tropical shrub-grassland (5.77%) and desert steppe (3.71%), whereas the meadow had larger decreased (-12.51%) than the typical grassland (-0.64%).
3.2. Spatial Distribution of C growth Rates in Various NRs
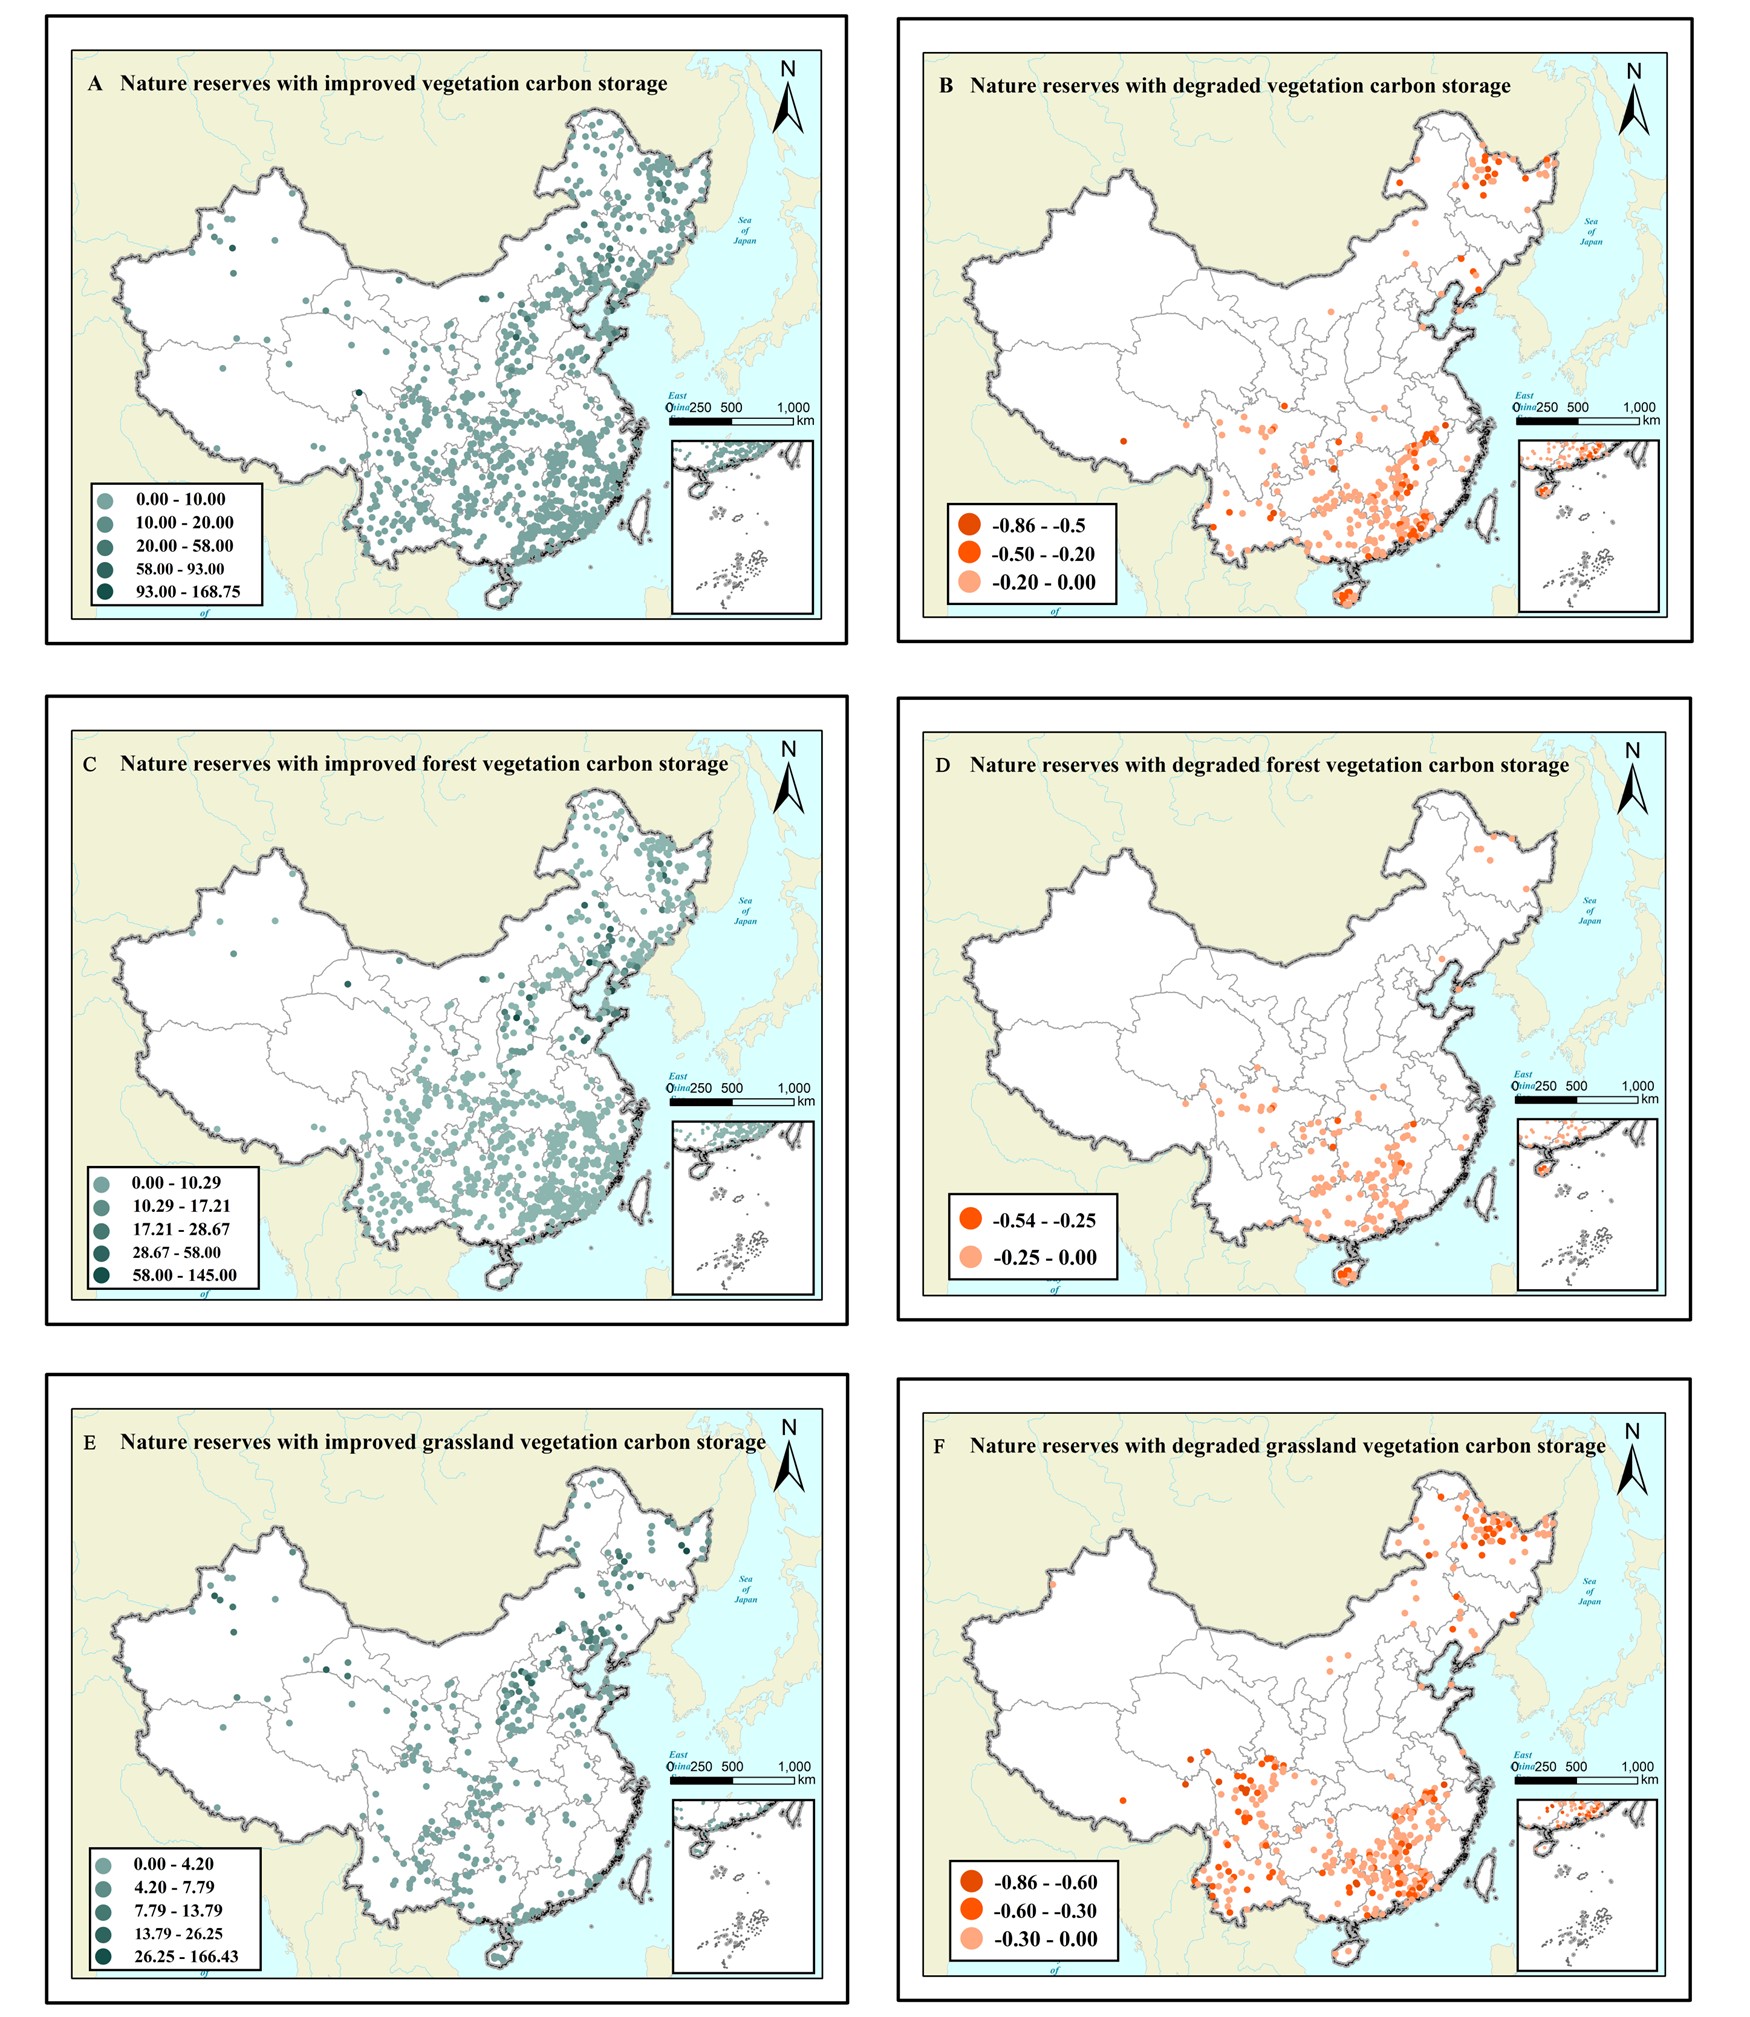
Not all NRs had a positive trend. 90% of the NRs generally showed positive growth, and the growth rate of the northeast and west part of China was higher than other regions (Figure 3A). The other NRs C storage showed a decline trend in 15 years, mainly in the northern part of Heilongjiang Province and the southern part of China, among which the NRs in the tropical monsoon rainforest area have declined more (Figure 3B). As far as forest C stocks in NRs were concerned, the growth rate in warm temperate deciduous broad-leaved forest region was higher than other vegetation regions (Figure 3C), while there were some NRs showed decreased C storage in subtropical evergreen broad-leaved forests regions in 15 years (Figure 3D). Only about 50% of NRs had a positive growth rate of grassland C storage. The NRs with relatively higher grassland C growth rate were distributed in the western and central regions (Figure 3E), while most of the NRs in the southeastern region showed negative growth status. In Heilongjiang provinces, the protected areas also showed a negative growth state (Figure 3F).
3.3. Differences in Carbon Density Between Inside and Outside of Nature Reserves
The total of NRs in China was 138.76 million ha, with a total vegetation carbon storage of 1395.08Tg in 2015 (1212.85Tg for forest vegetation and 182.23Tg for grassland). The carbon density of forest vegetation in nature reserves was higher than the region outside nature reserves, and similar results were found for different forest types. However, the grassland showed an
opposite result to forest that the carbon density outside nature reserves was higher than the protected areas, and different grassland types also showed the same (except tropical shrub-grassland) (Table 1). Therefore, nature reserves played an important role in protecting forest carbon function, but the effect on protecting grassland vegetation carbon function was not obvious.
4. Discussion
4.1. There Are Some Differences in the Changes of Carbon Storage in Different Vegetation Types
Overall, the vegetation C storage in NRs showed an increasing trend in 15 years. Grassland growth rate was higher than that of forest. However, different vegetation types had different change trends. The forest vegetation C stocks of NRs in cold temperate zone, temperate zone and warm temperate zone had an increasing trend. One of the causes of this result was the increase in the area and number of the forestland NRs. In addition, before 2010, the Six Key Forestry Programs (SKFPs) were established to promote a more sustainable forest policy (Wang et al. 2007) and all had a positive effect on the development of NRs, such as Natural Forest Protection Program (NEPP) (Wang et al. 2007). These programs on forestry have contributed more or less to the protection and development of forest ecosystems in NRs, increasing the area of forest land, reducing the amount of wood felling, using economic compensation to return farmers to forests, and soil erosion, desertification has been treated to a certain extent. However, it is worth noting that the tropical monsoon forests carbon stocks in NRs was particularly striking which had a 190.92Tg reduction from 2000 to 2015. We all know that the increase in tree species diversity will increase the carbon stocks and ecosystem services of forest ecosystems (Ruiz-Jaen et al. 2011), but the lack of differentiation in forest quality has led to a large number of deforestation and plantation expansion, including the occupation of protected areas in Hainan (Zhai et al. 2013). In the study period, Rubber and pulp plantations were extensively expanded, and the higher economic benefits made the plantation status higher than the natural tropical rainforest, which made the biodiversity become single and greatly reduced the carbon storage capacity of the ecosystem(Zhai et al. 2012). And many studies have proved that the regeneration of tropical secondary forests and plantations cannot offset the carbon emissions caused by tropical deforestation, thus determining the net carbon loss of tropical lands, so plantations cannot replace natural forests as large carbon sinks (Song et al. 2014). At the same time, invasive species in tropical regions of China also strongly influence the stability of ecosystem function. They present a major conservation concern, strongly affecting native communities via competition, predation and disease(Axmacher et al. 2013). For example, Ganshiling Nature Reserve has 46 species of invasive alien species, accounting for 3.5% of the number of seed plants, and there are 38 invasive species in Hainan Bawangling Nature Reserve which belonging to 17 families(Rongjing Zhang et al. 2011, Xuehua Hu et al. 2011). These NRs were critical to the protection of tropical rainforests, but there were still serious problems. Although there were many problems in the protection of tropical rain forests, the coverage of carbon storage in China’s nature reserves was much higher than other types of forests. This truth indicated that in the case of the destruction of tropical monsoon forests throughout the country, NRs reduced the extent of damage to tropical monsoon forests within their scope.
The alpine grassland had the largest growth rate of all types of grassland. The NRs vegetation C in the alpine grassland in 2000 was very small (0.28Tg), so it has a very large growth rate after increasing to 22.36 Tg in 2015. Besides, the fractional vegetation coverage of NNRs in the Qinghai-Tibet Plateau increased by 0.6%, from 31.5% to 32.1%, and the NPP in NNRs also showed an increasing trend in 15 years. At the same time, human disturbance dramatically decreased from 6.46% to 5.32% in NNRs of the Qinghai-Tibet Plateau due to limiting human activities in NNRs, especially in the NNRs of Qiangtang, Altun Mountains, Selin Co, and Haizi Mountain (Zhu et al. 2018). In addition, biomass in grasslands of the Qinghai-Tibet Plateau has displayed an overall increasing trend, which was profoundly influenced by climate change(WANG et al. 2018). The temperature directly influenced the starting date of the vegetation growing season, and it may expand the length of the plant growing season, which is closely related to biomass and C storage (Zhu et al. 2018). The C stocks of tropical shrub-grassland in NRs showed a slight decrease, which was mainly distributed in the southeast of China. Most of the NRs in this area were mainly pay attention to the wetlands and forest ecosystems, and little attention was paid to the protection of tropical shrub-grassland. The strong interference of human activities, such as urbanization, leaded to the fragmentation of irrigation areas, which affected the integrity of the ecosystem (Liu et al. 2017b). However, the protection ratio of NRs to grassland in the country was increasing, indicating that the protection of grassland ecosystems in NRs was gradually improving. Since grassland is the largest terrestrial ecosystem globally and in China, it has a large amount of ecological and economic value. The grassland restoration improved biodiversity by 32.44% and ecosystem services by 30.43%(Ren et al. 2016), so it is very important for China to improve protecting and managing grassland ecosystem in NRs.
4.2. The Growth Rate Distribution of NRs C Storage
90% of NRs generally showed positive growth. The NRs with high growth rate of C storage were distributed in the northwest and northeast of China. Moreover, the change rate of forest and grassland C stocks in NRs was similar to the overall. From 2000 to 2015, the northeast region of China not only increased the number and area of NRs, but also strengthened the improvement and protection of NRs. At the same time, climate change also has a certain impact on vegetation biomass and C storage in NRs. Overall the frequency of drought was decreasing in Northeast China in the study period(Cong et al. 2017, Zhou et al. 2017), which means the precipitation was improving in these years. That condition was very helpful for plants growing(Yang et al. 2009). Especially for grassland, the precipitation had significantly positive correlation with NDVI because the precipitation could provided the required moisture for vegetation growth(Mao et al. 2012). Northwest China belongs to arid and semi-arid areas, and the NRs with higher C storage growth rate was mainly concentrated in the Loess Plateau regions, where the C sequestration markedly increased in the tableland of Loess Plateau during this 15 years. The mixed broadleaf-conifer forest ranked first, and the bare land and sparse vegetation also presented a few C storage (Zhang et al. 2019). The construction of ThreeNorth Shelter Forest Program (TNSFP) and the “Grain for Green” also have made a big contribution for forest protection(Sun et al. 2016b, Zhang et al. 2019). The increase of the forest C storage in 15 years can confirm that the NRs and afforestation policy have a certain positive effect on the protection of the ecosystem in the Loess Plateau.
The growth rate of C stocks in eastern and southeast NRs was low, and some NRs showed a negative growth trend. We foungd that the management system of NRs was still imperfect, which was one of the important reasons for impeding the improvement of the efficiency of NRs in the east and southeast part of China (Xu et al. 2007). First, the impact of population growth and human activity disturbances on nature reserves, including decrease in the per capita ecological carrying capacity, and dramatic increase in ecological footprints(Liu et al. 2016). Second, the area of nature reserves limits the scope of protection, medium and small nature reserves compose 92.32% of all nature reserves. And the areas contained in nature reserves in each province are not proportional to the areas of the provinces, particularly for national NRs, with higher protection rates in Southwest and Northwest China than in other regions(Guo et al. 2015). Third, the conflict between economic and natural resource protection has seriously affected the construction of nature reserves. The eastern and southeastern parts are important areas for China’s economic development, and the economic factors have a greater impact on the construction of nature reserves than ecological factors in these regions(Wu et al. 2018). Besides, The fragmentation of the nature reserves, the conflicts of responsibilities between governments at all levels and the overlapping management of different types of protected areas also impacted the development of NRs in southeast of China. It is believed that biodiversity and ecosystem conservation will be further successful after coordinating and balancing the relationships between different protected areas.
4.3. The Nature Reserve Played an Important Role in Forest C Conservation in China
Our results indicated that the forest C density in NRs was higher than the outside, while the grassland showed an opposite result. In addition, with the decline of tropical seasonal rainforests C storage in both the country and NRs, the proportion of tropical monsoon forests C storage in NRs to the whole country has been rising during study period. That truth means NRs have the function of slowing down the decline of C storage in tropical monsoon forests, so that the tropical monsoon forest within NRs scope suffer less damage than the outside. And the increasing of the proportion was more than other forest types. Therefore, the nature reserves played an important role in forest carbon functions in China.
In order to improve the environmental degradation caused by industrial and economic development, China has not only established the nature reserve system, but also key ecological functional areas and biodiversity priority conservation areas. But after calculation, from the perspective of carbon density, the nature reserves were higher than other types of ecological function areas, including key ecological function areas, important ecological function areas and biodiversity priority protected area (Figure 7). The main reason of this situation was that the newly added NRs have been strictly set with boundary and managed hierarchically, including strict laws and regulations and planning purposes(Guo et al. 2015). Some scholars have confirmed that strict nature reserve management, that is, not allowing the use of natural resources in protected areas, can provide more value for ecosystem services. In contrast, nature reserves offer greater benefits in terms of carbon storage, carbon sequestration and recreation at the national and global levels(Liu et al. 2017a).
5.Conclusion
The vegetation C storage showed a clear upward trend in NRs from 2000 to 2015, and the proportion of organic carbon stocks in NRs to total carbon storage in China’s ecosystem increased in recent decades. NRs have the function of slowing down the decline of C storage in tropical monsoon forests, so that the tropical monsoon forest within NRs scope suffer less damage than the outside. The C stock growth rate of the northeastern and western NRs was higher than that of other regions. Nature reserves played an important role in protecting forest carbon function, but do not found the same result from grassland.
Based on this situation, we recommend that strengthen the construction and management of grassland ecosystems type nature reserves in Inner Mongolia; Improve the planation of the eastern and southeastern NRs, and expand the protected area to cover more forest ecosystems; Reduce the impact of human and economic activities on NRs, balance the conflict between NRs and urban construction, control the invasive species especially in tropical rainforests and subtropical evergreen broad-leaved forests; Increase connectivity between smaller and more dispersed protected areas, and reduce ecosystem fragmentation. For decision makers, it is very important to balance the construction of various types of NRs according to the natural resources of China. Although the NRs are managed according to different grades of government, it is more important to judge the rationality of the protected areas construction on a national scale.
Acknowledgments
We thank Dr. Xiaojun Kou in Beijing Normal University who give many suggestions and comments on this paper which are very helpful to improve it. This study was supported by the National Key R&D Program of China (2024YFE0210600).
Appendix A
Appendix A.1 Carbon Storage Calculation Model for Different Forest Vegetation Types (Mg/ha)
| Vegetation type | year | Stepwise linear regression model |
| Temperate needle and deciduous broad-leaved mixed forest | 2000 | y=96. 59+222.63x3-287.34x4+404.88x5-334.14x6-217.22x10+257.08x11 |
| 2015 | y=66.31+73.33x2+98.38x6-145.78x8-84.48x10-65.43x11 | |
| Subtropical evergreen broad-leaved forest | 2000 | y=10.049-71.307x2+75.923x3-59.199x4+128.159x5-88.66x6+74.742x7-150.962x8+161.085x9 |
| 2015 | y=13.748+44.422x5-55.584x8+26.475x10+13.440x11+42.723x12 | |
| Cold temperate coniferous forest | 2000 | y=120.83+718.92x3-592.93x4+857.76x5-1277.34x7+678.67x8-324.84x9+143.85x11 |
| 2015 | y=551.82+392.79x1-459.45x3-180.40x5-524.87x8+258.99x10 | |
| Tropical rainforest, rainforest | 2000 | y=-1050.6-4307.7x2+6206.4x3-2296.7x4+2915.6x5-2783.3x6+1340.7x7+1433.9x10-1146.5x11 |
| 2015 | y=4109.3-804.5x1-572.0x2-1321.2x3+9068.9x4+1982.9x6-6828.0x7+475.7x8+1291.4x10+3422.7x11-11218.2x12 | |
| Warm temperate deciduous broad-leaved forest | 2000 | y=65.711-94.681x2+168.834x3-101.352x8 |
| 2015 | y=40.05+32.01x1+38.31x2+32.17x4-86.79x5+73.47x6+56.24x7-117.51x8+61.02x9-49.29x10 | |
| Note: y represents vegetation biomass | ||
Appendix A.2 Carbon Storage Calculation Model for Different Grassland Vegetation Types (g/m3)
| Grassland type | Steppe regionalization | Distribution area | Unitary linear nodel |
| Meadow steppe | Northeast grassland | Central part of northeast | y =8708.54 NDVI - 2218.58 |
| Desert steppe | Inner Mongolia grassland | Xilin Gol League, Inner Mongolia Autonomous Region | y =6874.37 NDVI -2154.14 |
| typical steppe | y =4830.21 NDVI -1837.76 | ||
| Meadow steppe | y =7963.35 NDVI -3393.17 | ||
| Desert steppe | Loess Plateau grassland | Inner Mongolia, Gansu and Ningxia | y =5673.47 NDVI - 463.63 |
| Semi-arid warm shrub | Warm temperate grassland in North China | Hebei, Shanxi and Shaanxi | y = 10305.05 NDVI - 2255.59 |
| desert steppe and montane steppe | Xinjiang grassland | Xinjiang | y = 6916.80 NDVI - 553.00 |
| Meadow steppe | Xinjiang grassland | The southern mountain area of Urumqi in the middle section of the northern slope of the Tianshan Mountains | y =10490.51 NDVI -1881.69 |
| Alpine meadow | Qinghai-Tibet Plateau grassland | y = 7485.98 NDVI - 2301.23 | |
| Humid tropical shrub-grassland | Southern meadow | y = 12418.85 NDVI - 4353.07 | |
| Yew grass meadow | Qinghai-Tibet Plateau grassland | Mountainous area in the southern suburbs of Urumqi, the northern slope of the Tianshan Mountains | y =66.72 NDVI- 1142.19 |
| Alpine wormwood meadow | y = 65.31 NDVI- 780.70 | ||
| Moss meadow | y = 70.54 NDVI- 1374.84 | ||
| Alpine meadow | y=1030.06 NDVI | ||
| Note: y represents vegetation biomass | |||
References
- Adhikari, K., and A. E. Hartemink. 2016. Linking soils to ecosystem services — A global review. Geoderma 262:101-111. [CrossRef]
- Anderson-Teixeira, K. J. 2018. Prioritizing biodiversity and carbon. Nature Climate Change 8:667-668. [CrossRef]
- Axmacher, J. C., and W. Sang. 2013. Plant invasions in China - challenges and chances. PLoS One 8:e64173. [CrossRef]
- Bruner, A. G., R. E. Gullison, R. E. Rice, et al. 2001. Effectiveness of parks in protecting tropical biodiversity. Science 291:125-128. [CrossRef]
- Chen, X., F. Lupi, and J. Liu. 2017. Accounting for ecosystem services in compensating for the costs of effective conservation in protected areas. Biological Conservation 215:233-240. [CrossRef]
- Chen, Y., Z. Tang, and J. Fang. 2009. Distribution of nature reserves and status of biodiversity protection in China. Biodiversity Science 17:664-674. [CrossRef]
- Cong, D., S. Zhao, C. Chen, et al. 2017. Characterization of droughts during 2001–2014 based on remote sensing: A case study of Northeast China. Ecological Informatics 39:56-67. [CrossRef]
- Corona, P., E. Badalamenti, S. Pasta, et al. 2016. Carbon storage of Mediterranean grasslands. Anales del Jardín Botánico de Madrid 73:e029. [CrossRef]
- Costanza, R., R. d’Arge, R. De Groot, et al. 1997. The value of the world’s ecosystem services and natural capital. Nature 387:253. [CrossRef]
- Fang, J., A. Chen, C. Peng, et al. 2001. Changes in Forest Biomass Carbon Storage in China Between 1949 and 1998. Science 292:2320-2322 . [CrossRef]
- Game, E. T., M. Bode, E. McDonald-Madden, et al. 2009. Dynamic marine protected areas can improve the resilience of coral reef systems. Ecology Letters 12:1336-1346. [CrossRef]
- Guo, Z., and G. Cui. 2015. Establishment of Nature Reserves in Administrative Regions of Mainland China. PLoS One 10:13. [CrossRef]
- Hisano, M., E. B. Searle, and H. Y. H. Chen. 2018. Biodiversity as a solution to mitigate climate change impacts on the functioning of forest ecosystems. Biological Reviews 93:439-456. [CrossRef]
- Isbell, F., D. Tilman, S. Polasky, et al. 2015. The biodiversity-dependent ecosystem service debt. Ecology Letters 18:119-134. [CrossRef]
- Jenkins, C. N., and L. Joppa. 2009. Expansion of the global terrestrial protected area system. Biological Conservation 142:2166-2174. [CrossRef]
- Juan, C. Á.-Y., and D. Martin. 2015. Enhancing ecosystem function through conservation threatened plants increase local carbon storage in tropical dry forests. Tropical Conservation Science 8:10.
- Juffe-Bignoli, D., N. D. Burgess, H. Bingham, et al. 2014. Protected planet report 2014. UNEP-WCMC: Cambridge, UK 11.
- Li, A., A. Zhang, Y. Zhou, et al. 2017. Decomposition analysis of factors affecting carbon dioxide emissions across provinces in China. Journal of Cleaner Production 141:1428-1444. [CrossRef]
- Liu, P., S. Jiang, L. Zhao, et al. 2017a. What are the benefits of strictly protected nature reserves? Rapid assessment of ecosystem service values in Wanglang Nature Reserve, China. Ecosystem Services 26:70-78. [CrossRef]
- Liu, S., Y. Yin, F. Cheng, et al. 2017b. Spatio-temporal variations of conservation hotspots based on ecosystem services in Xishuangbanna, Southwest China. PLoS One 12:e0189368. [CrossRef]
- Liu, X., D. Jiang, Q. Wang, et al. 2016. Evaluating the Sustainability of Nature Reserves Using an Ecological Footprint Method: A Case Study in China. Sustainability 8:1272. [CrossRef]
- Ma, W., G. Feng, and Q. Zhang. 2016. Status of Nature Reserves in Inner Mongolia, China. Sustainability 8:889. [CrossRef]
- Mao, D., Z. Wang, L. Luo, et al. 2012. Integrating AVHRR and MODIS data to monitor NDVI changes and their relationships with climatic parameters in Northeast China. International Journal of Applied Earth Observation and Geoinformation 18:528-536. [CrossRef]
- Mo, L., Zohner, C.M., Reich, P.B. et al. 2023. Integrated global assessment of the natural forest carbon potential. Nature 624, 92–101 (2023). [CrossRef]
- Putz, F. E., P. A. Zuidema, T. Synnott, et al. 2012. Sustaining conservation values in selectively logged tropical forests: the attained and the attainable. Conservation Letters 5:296-303. [CrossRef]
- Ren, Y. J., Y. H. Lu, and B. J. Fu. 2016. Quantifying the impacts of grassland restoration on biodiversity and ecosystem services in China: A meta-analysis. Ecological Engineering 95:542-550. [CrossRef]
- Rongjing Zhang, and F. Xing. 2011. The Composition and Origin of Alien Plants in Ganshiling Nature Reserve in Hainan, China. Guizhou Agricultural Science 39:31-33.
- Ruiz-Jaen, M. C., and C. Potvin. 2011. Can we predict carbon stocks in tropical ecosystems from tree diversity? Comparing species and functional diversity in a plantation and a natural forest. New Phytol 189:978-987. [CrossRef]
- Soares-Filho, B., P. Moutinho, D. Nepstad, et al. 2010. Role of Brazilian Amazon protected areas in climate change mitigation. Proceedings of the National Academy of Sciences 107:10821-10826. [CrossRef]
- Song, Q. H., Z. H. Tan, Y. P. Zhang, et al. 2014. Do the rubber plantations in tropical China act as large carbon sinks? iForest - Biogeosciences and Forestry 7:42-47. [CrossRef]
- Strassburg, B. B. N. et al. 2020. Global priority areas for ecosystem restoration. Nature 586, 724–729. [CrossRef]
- Sun, Y., L. Meng, L. Tian, et al. 2016a. Assessing current stocks and future sequestration potential of forest biomass carbon in Daqing Mountain Nature Reserve of Inner Mongolia, China. Journal of Forestry Research 27:931-938. [CrossRef]
- Sun, Y., J. Zhu, Q. Yan, et al. 2016b. Changes in vegetation carbon stocks between 1978 and 2007 in central Loess Plateau, China. Environmental Earth Sciences 75. [CrossRef]
- Tang, Z., H. An, L. Deng, et al. 2016. Effect of desertification on productivity in a desert steppe. Sci Rep 6:27839. [CrossRef]
- Thomas, C. D., B. J. Anderson, A. Moilanen, et al. 2013. Reconciling biodiversity and carbon conservation. Ecology Letters 16:39-47. [CrossRef]
- Thompson, I. D., K. Okabe, J. A. Parrotta, et al. 2014. Biodiversity and ecosystem services: lessons from nature to improve management of planted forests for REDD-plus. Biodiversity and Conservation 23:2613-2635. [CrossRef]
- Wang, G., J. L. Innes, J. Lei, et al. 2007. China’s forestry reforms. American Association for the Advancement of Science.
- WANG, L., H. YU, Q. ZHANG, et al. 2018. Responses of aboveground biomass of alpine grasslands to climate changes on the Qinghai-Tibet Plateau. Journal of Geographical Sciences 28:1953-1964. [CrossRef]
- Wang, Y., J. Gao, J. Wang, et al. 2014. Evaluating losses in ecosystem services in nature reserves in Sichuan, China. International Journal of Sustainable Development & World Ecology 21:290-301. [CrossRef]
- Weiskopf, S.R., Isbell, F., Arce-Plata, M.I. et al. 2024. Biodiversity loss reduces global terrestrial carbon storage. Nature Communication 15, 4354. [CrossRef]
- Wu, J., Y. Gong, and J. Wu. 2018. Spatial distribution of nature reserves in China: Driving forces in the past and conservation challenges in the future. Land Use Policy 77:31-42. [CrossRef]
- Xu, J., and D. R. Melick. 2007. Rethinking the effectiveness of public protected areas in southwestern China. Conservation biology 21:318-328. [CrossRef]
- Xu, W., Y. Xiao, J. Zhang, et al. 2017. Strengthening protected areas for biodiversity and ecosystem services in China. Proc Natl Acad Sci U S A 114:1601-1606. [CrossRef]
- Hu Xuehua, Xiao Yian, Zeng Jianjun, et al. 2011. INVESTIGATION AND ANALYSIS ON ALIEN PLANTS IN BAWANGLING NATIONAL NATURE RESERVE IN HAINAN PROVINCE. Journal of Jinggangshan University (Natural Science Edition) 32:131-136.
- Yang, G., A. Bao, X. Chen, et al. 2009. Study of the vegetation cover change and its driving factors over Xinjiang during 1998–2007. Journal of Glaciology & Geocryology 3:436-445.
- Zhai, D.L., J.C. Xu, Z.C. Dai, et al. 2013. Increasing tree cover while losing diverse natural forests in tropical Hainan, China. Regional Environmental Change 14:611-621. [CrossRef]
- Zhai, D. L., C. H. Cannon, J. W. Slik, et al. 2012. Rubber and pulp plantations represent a double threat to Hainan’s natural tropical forests. J Environ Manage 96:64-73. [CrossRef]
- Zhang, J., M. Liu, M. Zhang, et al. 2019. Changes of vegetation carbon sequestration in the tableland of Loess Plateau and its influencing factors. Environ Sci Pollut Res Int 26:22160-22172. [CrossRef]
- Zhang, J., W. Xu, L. Kong, et al. 2018. Strengthening protected areas for giant panda habitat and ecosystem services. Biological Conservation 227:1-8. [CrossRef]
- Zhou, L., J. Wu, X. Mo, et al. 2017. Quantitative and detailed spatiotemporal patterns of drought in China during 2001-2013. Sci Total Environ 589:136-145. [CrossRef]
- Zhu, P., L. Huang, T. Xiao, et al. 2018. Dynamic changes of habitats in China’s typical national nature reserves on spatial and temporal scales. Journal of Geographical Sciences 28:778-790. [CrossRef]
Figure 1.
C storage in tropical monsoon forest and tropical shrub-grassland in NRs from 2000 to 2015. (A) The growth rate of all vegetation C storage in the NRs, including the forest and the grass. (B) Aggregate change in C storage of different forest vegetation types, for the five types: TNDBMF, temperate needles, deciduous broad-leaved mixed forest; TMF, tropical monsoon forest; WTDBF, warm temperate deciduous broad-leaved forest; CTCF, cold temperate coniferous forest; and SEBF, subtropical evergreen broad-leaved forests. (C) Aggregate change in C storage of different grassland vegetation types, for the five types: M, meadow; TG, typical grassland; AG, alpine grassland; DS, desert steppe; and TSG, tropical shrub-grassland.
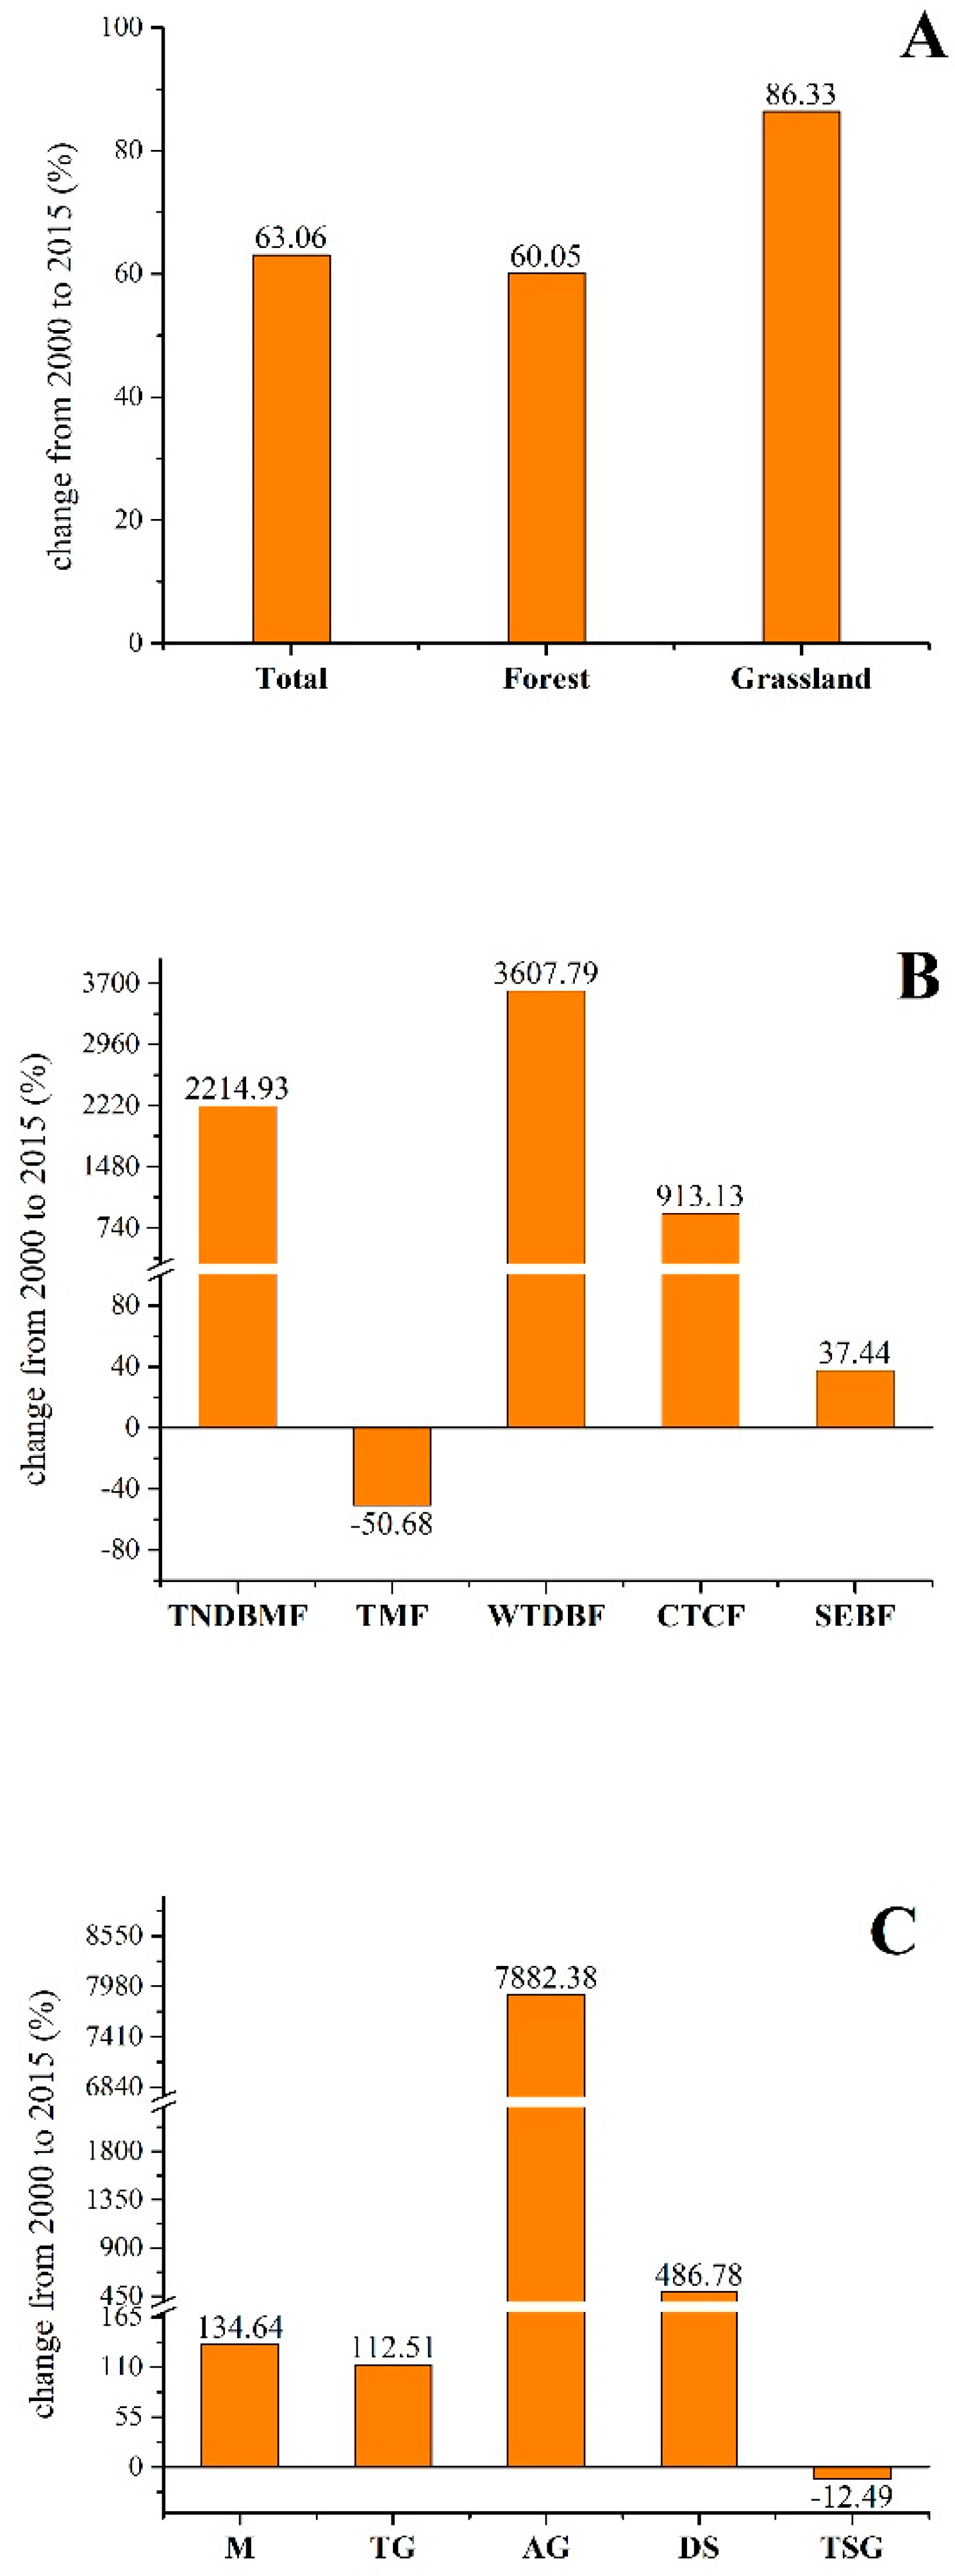
Figure 2.
Changes in the proportion of C storage in NRs to the whole country and decline in some of the grassland types from 2000 to 2015. (A) The growth proprotion of all vegetation C storage in the NRs, including the forest and the grass. (B) Aggregate change in the proportion of different forest vegetation types, for the five types: TNDBMF, temperate needles, deciduous broad-leaved mixed forest; TMF, tropical monsoon forest; WTDBF, warm temperate deciduous broad-leaved forest; CTCF, cold temperate coniferous forest; and SEBF, subtropical evergreen broad-leaved forests. (C) Aggregate change in the proportion of different grassland vegetation types, for the five types: M, meadow; TG, typical grassland; AG, alpine grassland; DS, desert steppe; and TSG, tropical shrub-grassland.
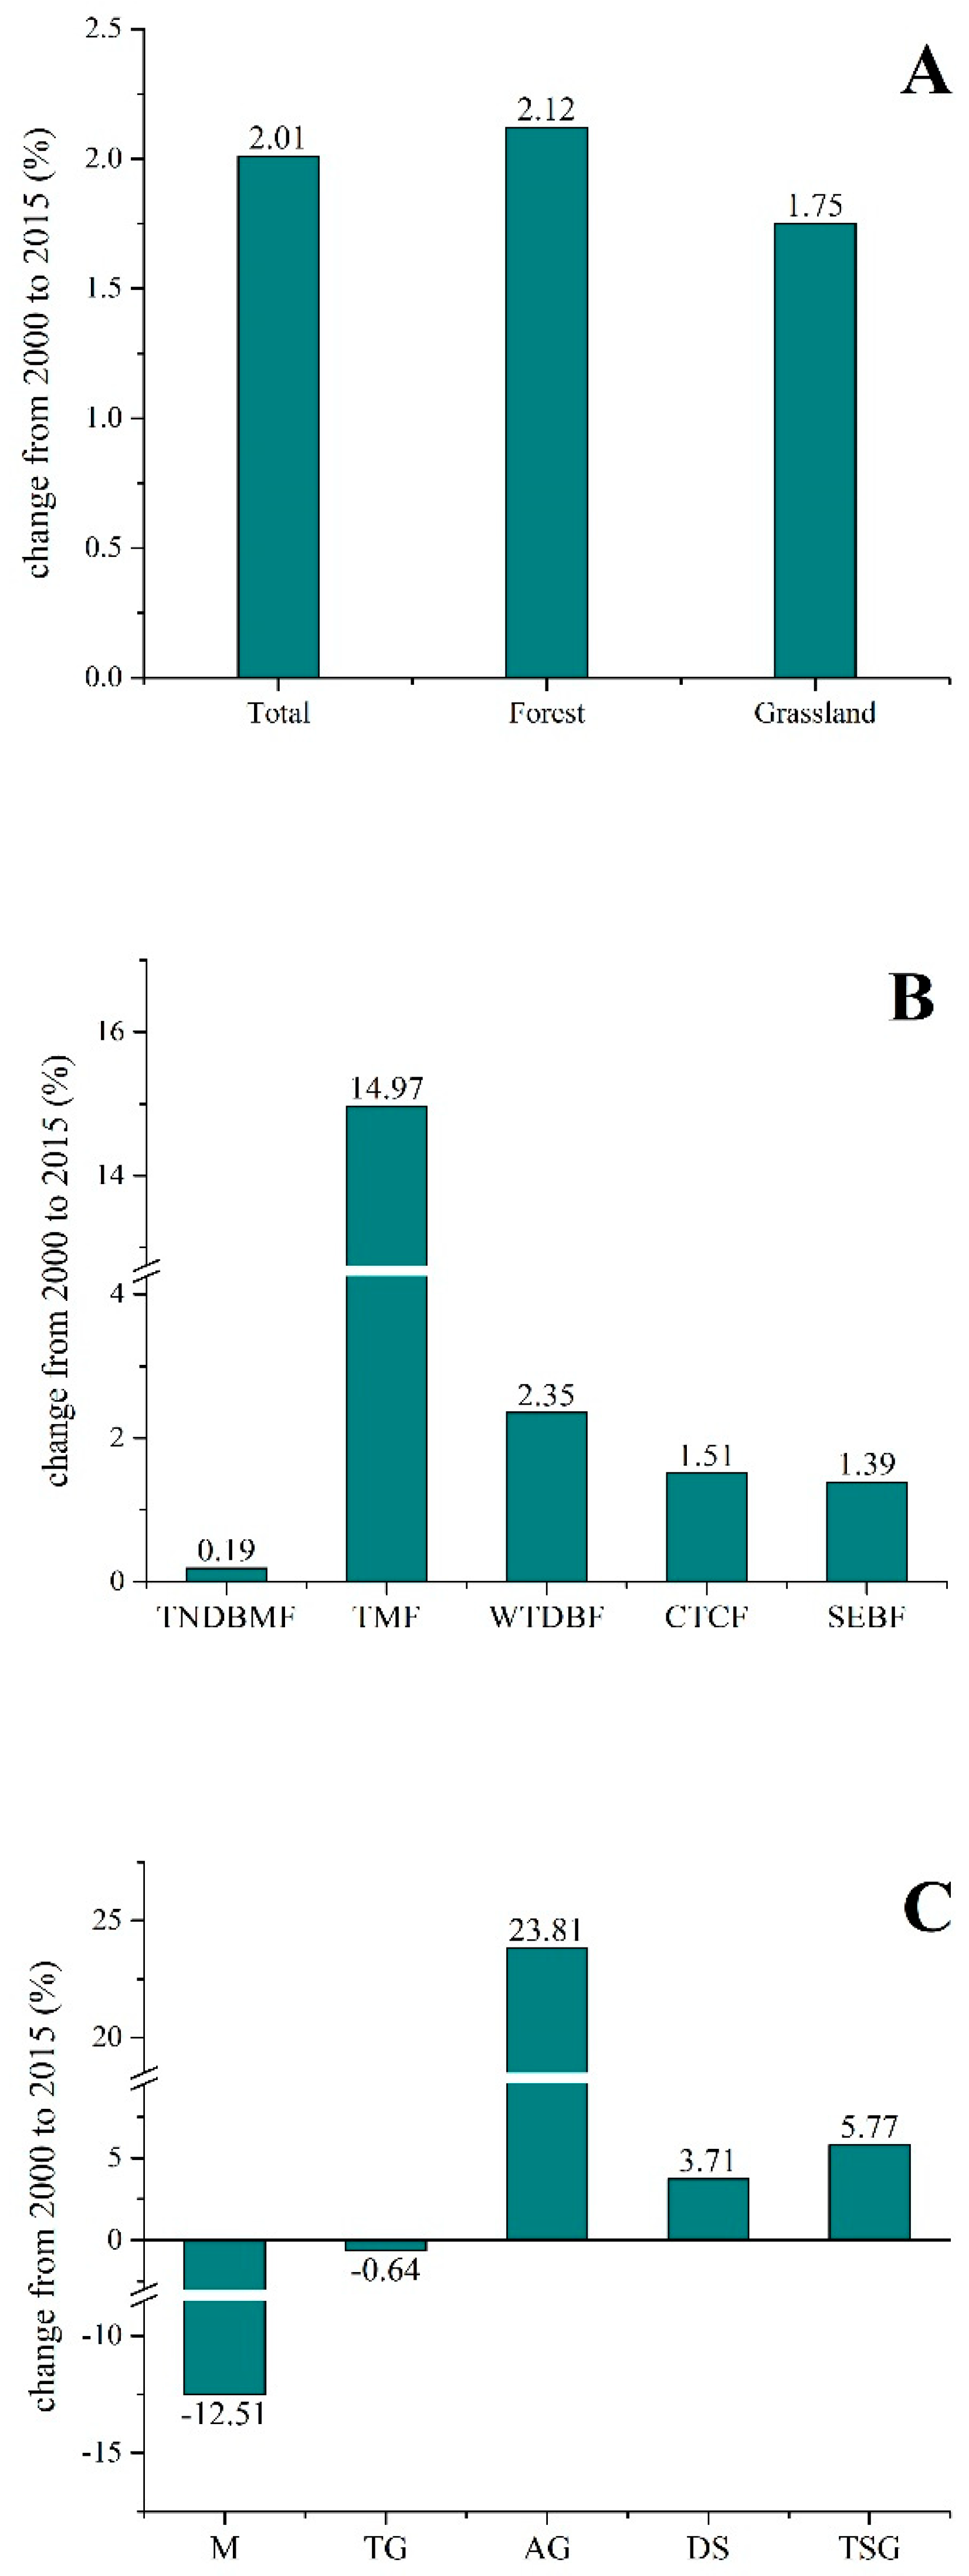
Figure 3.
Spatial distribution of total (A, B)/ forest (C, D)/ grassland (E, F) C storage growth rate in each nature reserve within 15 years.
Figure 7.
Comparison of vegetation carbon density in four kinds of protected areas in China.
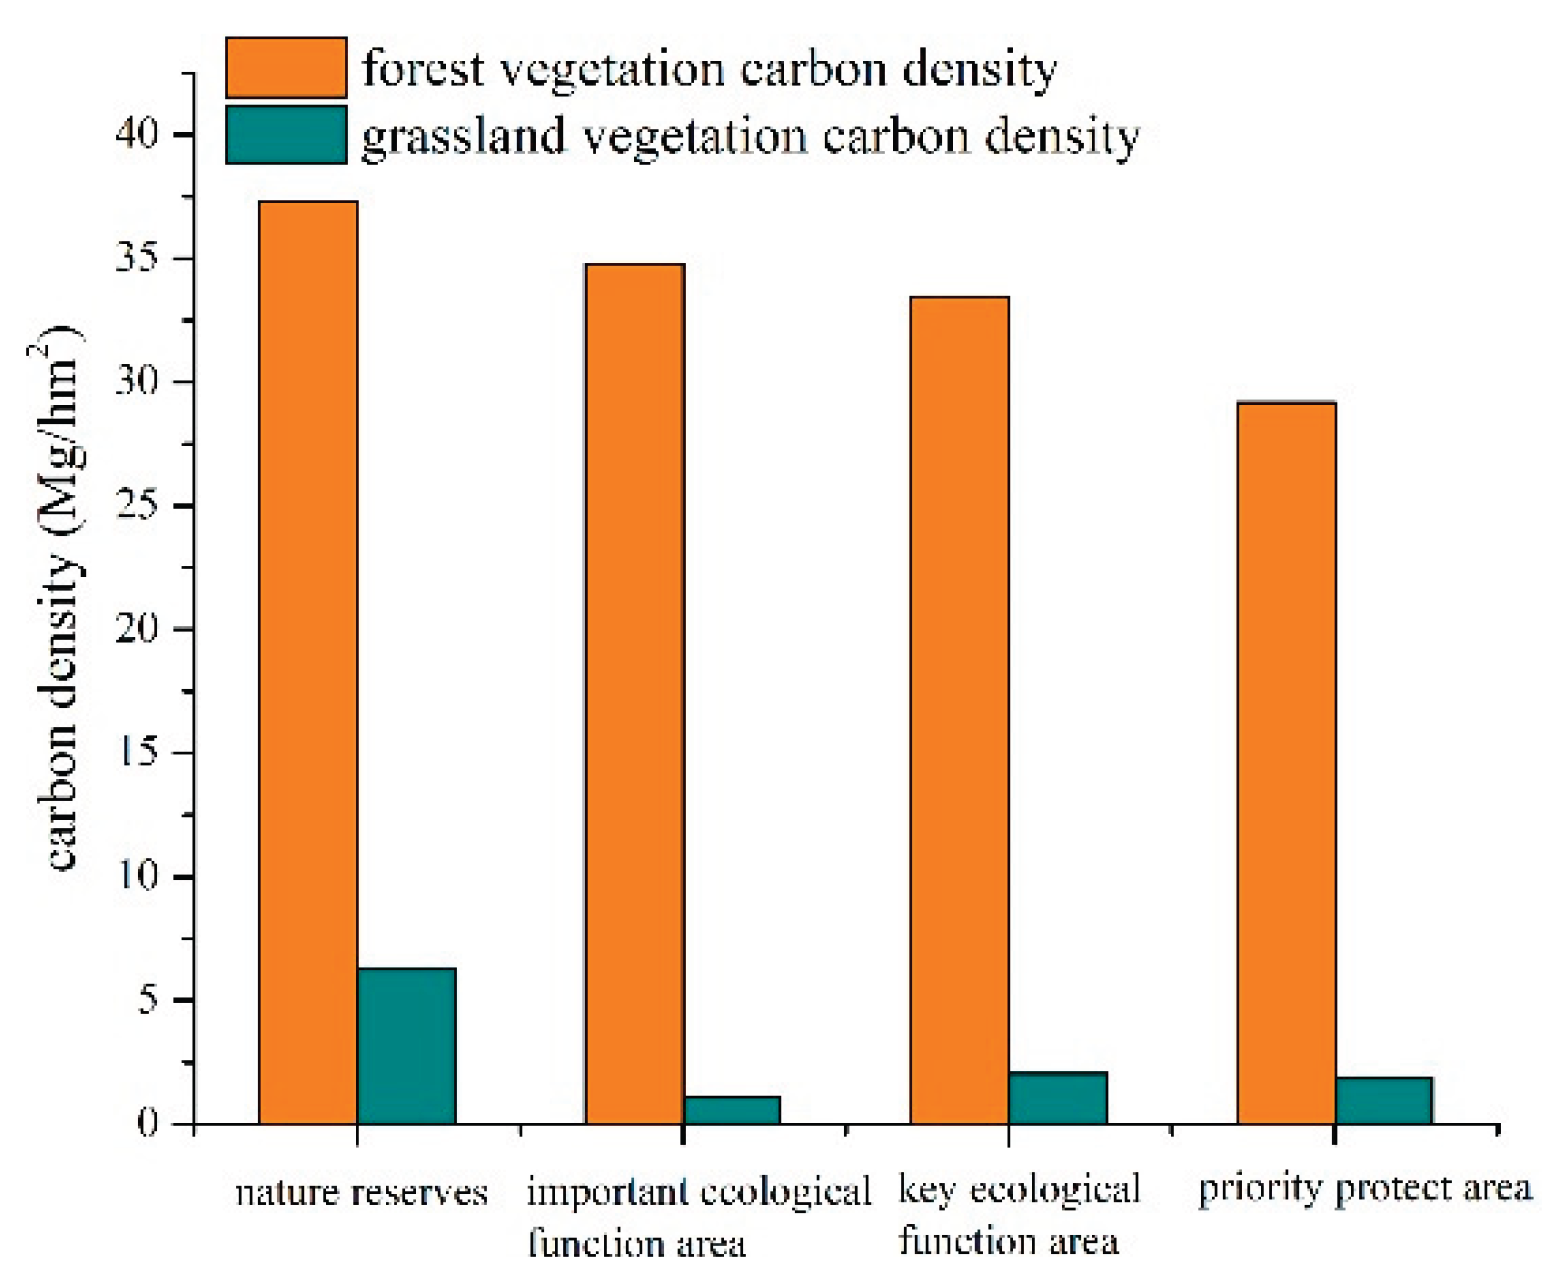

Table 1.
Comparison of vegetation carbon density between inside and outside of nature reserves.
| Forest C density (Mg/ha) | Grassland C density (Mg/ha) | ||||
|---|---|---|---|---|---|
| Inside NRs | Outside NRs | Inside NRs | Outside NRs | ||
| Total | 0.80*10-2 | 0.68*10-2 | Total | 0.03*10-2 | 0.08*10-2 |
| Temperate needles, deciduous broad-leaved mixed forest | 0.57*10-2 | 0.49*10-2 | meadows | 0.03*10-2 | 0.05*10-2 |
| Tropical monsoon forest | 5.41*10-2 | 2.31*10-2 | Desert steppe | 0.06*10-2 | 0.07*10-2 |
| Warm temperate deciduous broad-leaved forest | 0.50*10-2 | 0.47*10-2 | alpine grasslands | 0.006*10-2 | 0.02*10-2 |
| Cold temperate coniferous forest | 1.29*10-2 | 1.12*10-2 | tropical shrub-grassland | 0.34*10-2 | 0.33*10-2 |
| Subtropical evergreen broad-leaved forests | 0.63*10-2 | 0.60*10-2 | typical grasslands | 0.05*10-2 | 0.08*10-2 |
Disclaimer/Publisher’s Note: The statements, opinions and data contained in all publications are solely those of the individual author(s) and contributor(s) and not of MDPI and/or the editor(s). MDPI and/or the editor(s) disclaim responsibility for any injury to people or property resulting from any ideas, methods, instructions or products referred to in the content. |
© 2025 by the authors. Licensee MDPI, Basel, Switzerland. This article is an open access article distributed under the terms and conditions of the Creative Commons Attribution (CC BY) license (http://creativecommons.org/licenses/by/4.0/).
Copyright: This open access article is published under a Creative Commons CC BY 4.0 license, which permit the free download, distribution, and reuse, provided that the author and preprint are cited in any reuse.


