
Submitted:
10 June 2024
Posted:
11 June 2024
You are already at the latest version
Abstract
As the largest carbon pool on Earth, forest ecosystems are essential to maintaining carbon sink balance. However, accurately estimating the carbon sequestration and carbon storage of forest resources remains an urgent issue to address. Plot investigation, model estimation, and machine learning are examples of current approaches. Nevertheless, because of variables such as regional characteristics and plot size, large-scale and extensive region estimates are comparatively scarce. This study, which focuses on Tianzhu County, aims to comprehensively analyze and estimate the Net Primary Productivity (NPP), carbon storage, and carbon density of the forest ecosystem in this area by integrating data from forest resource inventory and the CASA model. The main conclusions are as follows: (1) The main vegetation types in Tianzhu County include coniferous forests, broad-leaved forests, mixed forests, and shrub forests; (2) Accordin g to the CASA model calculations, the annual cumulative NPP in Tianzhu County in 2020 ranges from a maximum of 249.63 gC/m² to a minimum of 3.40 gC/m², with the forest NPP amounting to 134,674.65 tons of carbon. Based on MODIS observation data, the forest’s NPP is 171,728.32 tons of carbon, with a maximum of 325.36 gC/m² and a minimum of 0.02 gC/m²; (3) At the pixel scale, the carbon storage of forests in Tianzhu County is 361,700 tons. Specifically, 46,500 tons of carbon are stored in coniferous forests, 1,100 tons in broad-leaved forests, 500 tons in mixed forests, and 313,600 tons in shrub forests.
Keywords:
Tianzhu County
; CASA model
; NPP
; forest carbon storage
; carbon density.
1. Introduction
Forest ecosystems, as one of the most critical ecosystems on Earth, are essential to the preservation of biodiversity, soil protection, water conservation, and the global carbon cycle[1]. Net Primary Productivity (NPP) is a crucial indicator for assessing the functionality of forest ecosystems, directly reflecting the efficiency of vegetation in converting solar energy and the rate of biomass accumulation[2]. Furthermore, forest carbon storage and carbon density are significant ecological indicators, directly tied to the capacity of carbon sinks and the reduction of carbon emissions. Thus, in order to assess the health of ecosystems and develop efficient policies for ecological protection and carbon reduction, it is crucial to accurately estimate and analyze the NPP, carbon storage, and carbon density of forest ecosystems[3].
Tianzhu County, as a model for typical forest ecosystems in Northwest China, has rich forest resources but is also affected by climate change and human activities. Therefore, for the purpose of maximizing the management of forest resources and safeguarding the ecological environment, in-depth research on the Net Primary Productivity (NPP), carbon storage, and carbon density of the forest ecosystem in this area is of great significance[4]. This study aims to conduct an in-depth analysis of the NPP, carbon storage, and carbon density of Tianzhu County’s forest ecosystem by thoroughly applying the CASA model and the plant mortality model, offering a scientific foundation for forest resource management and ecological protection in the area [5].
2. Materials and Methods
2.1. Overview of the Research Area
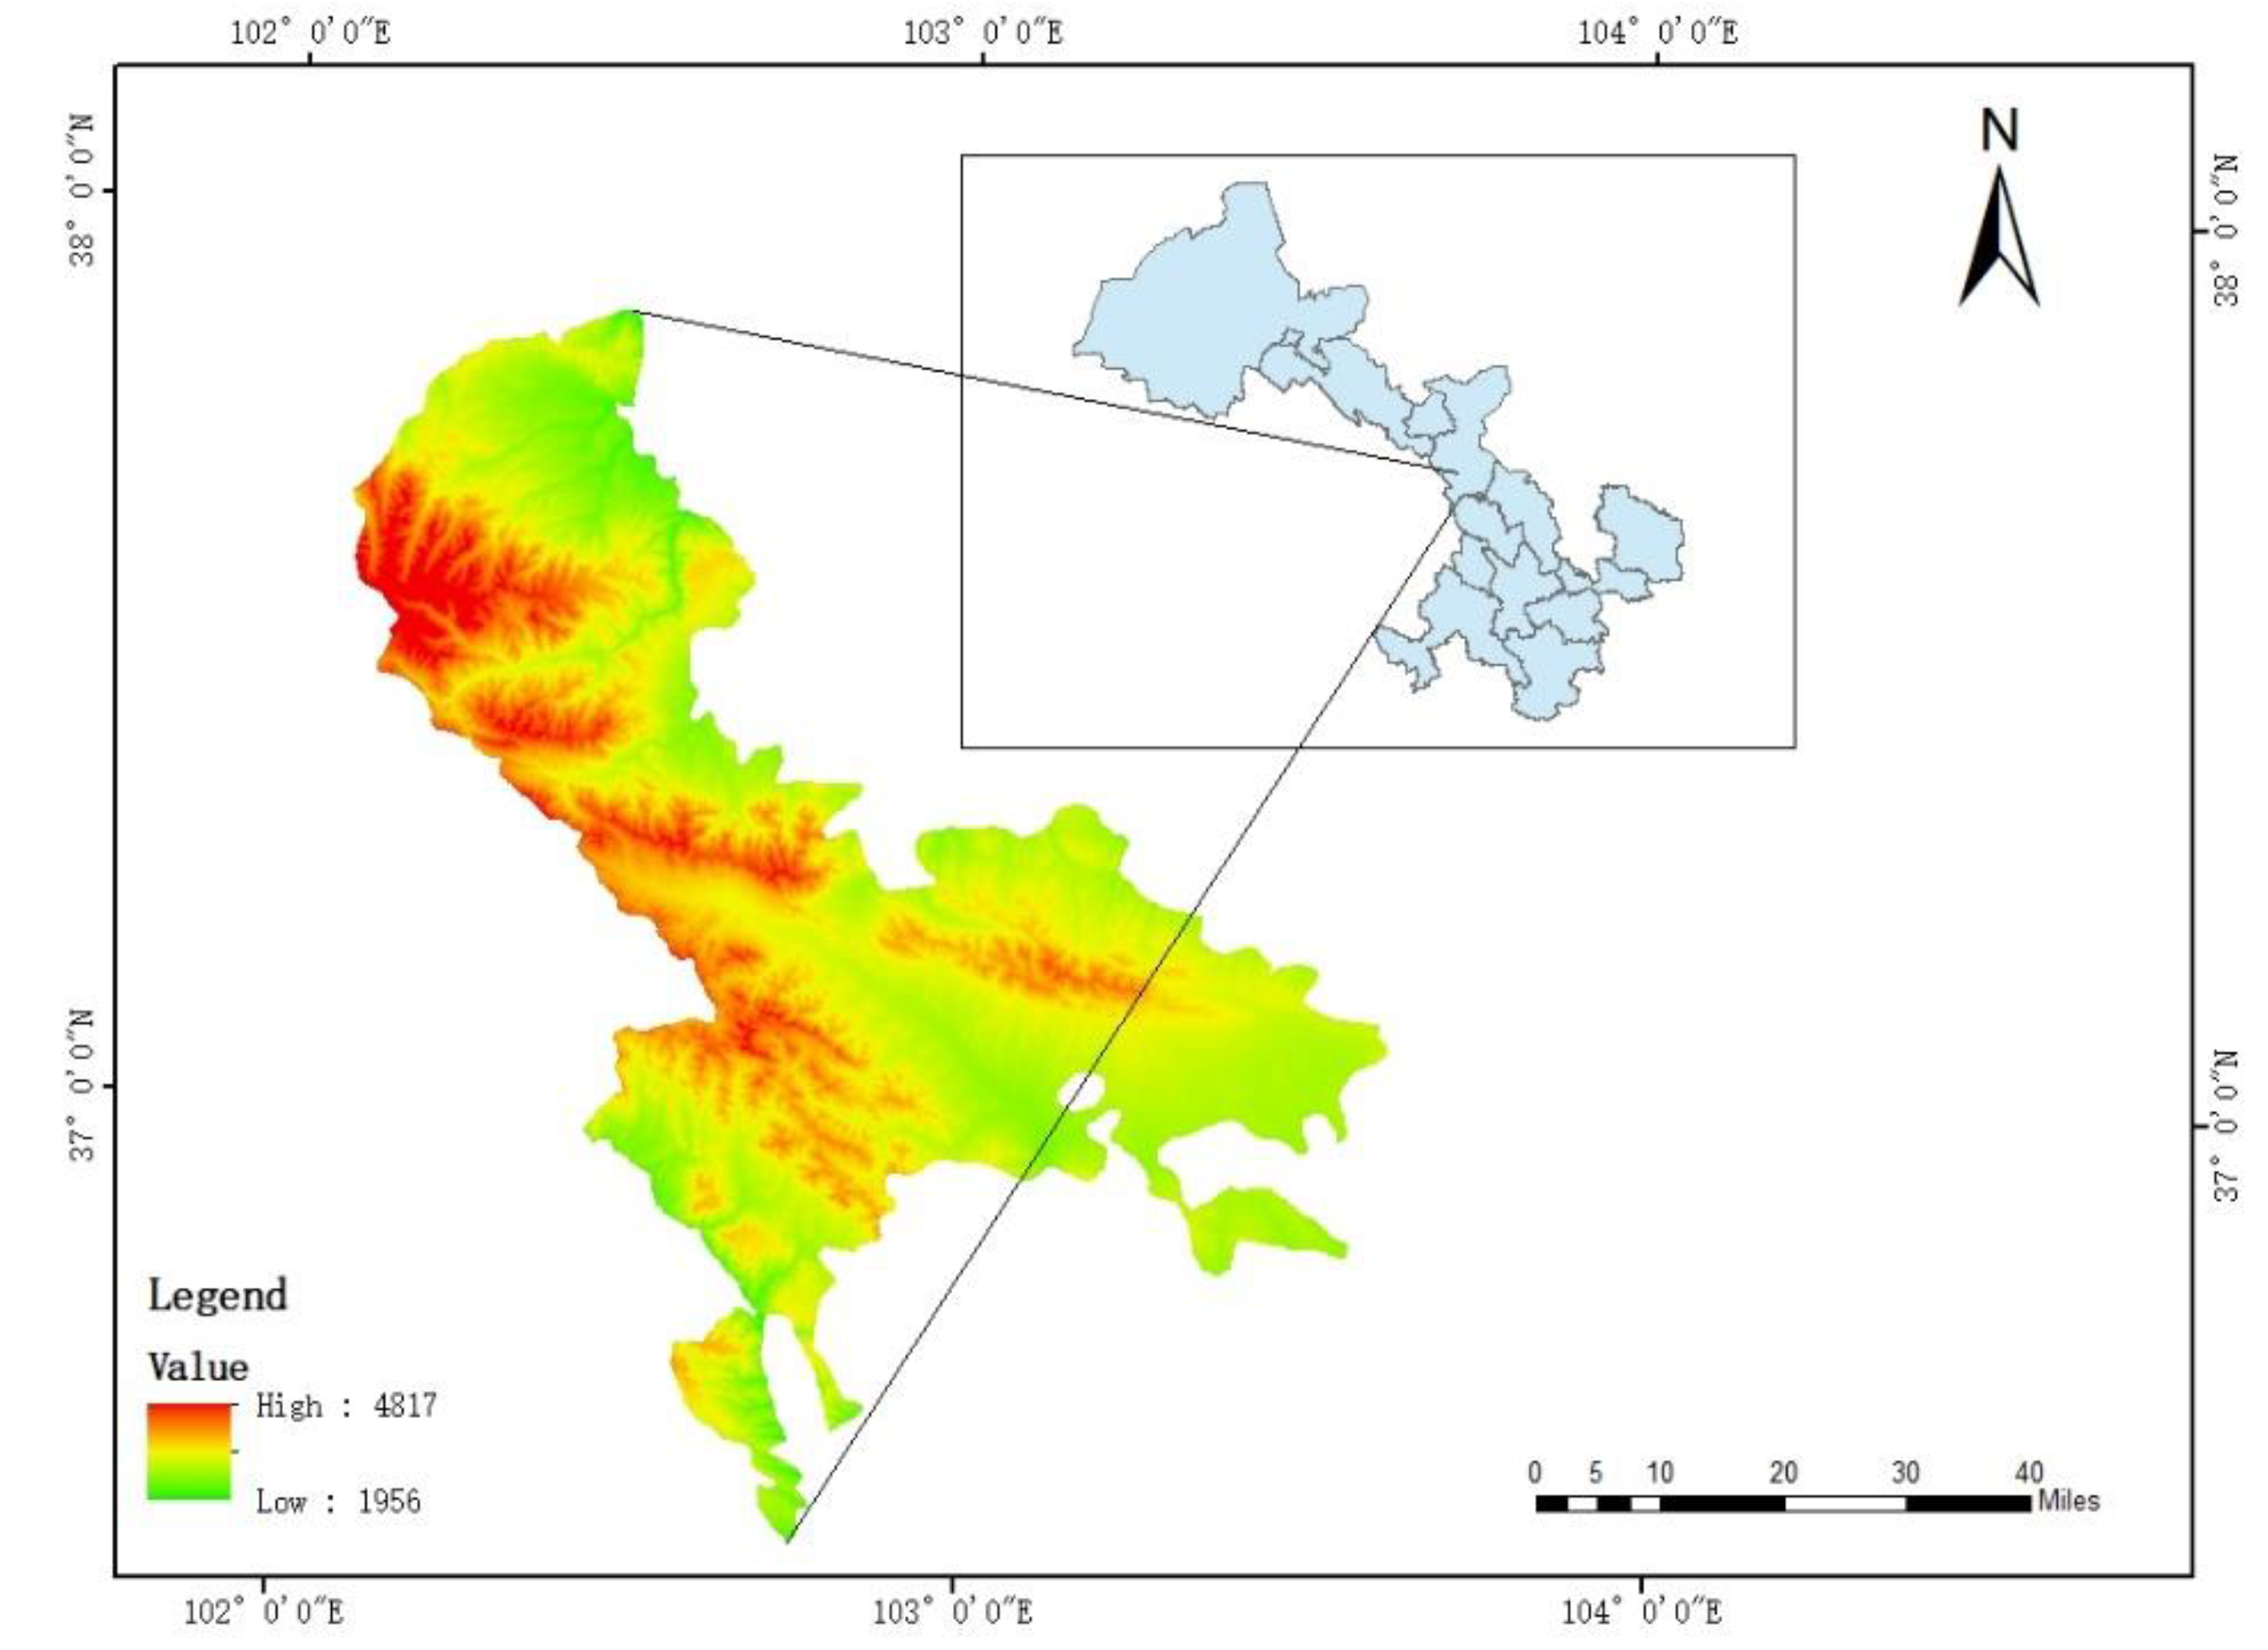
Tianzhu Tibetan Autonomous County is situated at the eastern end of the Hexi Corridor, forming part of the northeastern edge of the Qinghai-Tibet Plateau. The geographical coordinates of the county range from 102°07′to 103°46′ E longitude and from 36°31′ to 37°55′ N latitude. Tianzhu County borders Jingtai County to the east, Yongdeng County to the south, Liangzhou District of Wuwei City and Gulang County to the north, Subei Mongol Autonomous County to the northwest, and Menyuan, Huzhu, and Ledu Counties of Qinghai Province to the west[6]. The county covers a a total area of 7,150 square kilometers, spanning 142.6 kilometers from east to west and 158.4 kilometers from north to south. The terrain of Tianzhu County is characterized by higher elevations in the northwest and lower elevations in the southeast, with altitudes ranging from 1,956 meters to 4,817 meters above sea level. The landscape is predominantly mountainous, with the Wushaoling Mountain running through the county from west to east[7].
Tianzhu County is home to 37 tree species across 15 families and 22 genera. Natural arboreal forests and shrublands are the main types of vegetation. The main tree species are Qinghai spruce, aspen, white birch, Qilian juniper, with smaller populations of slender-leaved spruce, Chinese pine, and Chinese arborvitae. The shrub species include rhododendron, barberry, mountain willow, alpine willow, and yellow willow. Natural arboreal forests are most found on the northern slopes and semi-shaded slopes of mountainous areas such as Shama, Haxi, and Qilian north of the Wushaoling-Maomaoshan range, and on the southern ridges of Sairalong, Saishis, Tanshanling, Tiantang, and Shimen[8]. Coniferous forests, mostly Qinghai spruce, with scattered populations of juniper, aspen, and birch predominate in the area north of Wushaoling. South of Wushaoling, mixed forests dominate, with main species including Qinghai spruce, slender-leaved spruce, aspen, red birch, and white birch, along with Chinese pine and juniper[7]. Natural shrublands mainly grow on the humid, shaded, and semi-shaded slopes of high mountains. These are primarily found south of Wushaoling, in areas such as Tuchenggou, Ma’ya Snow Mountain, Zhuaxixiulongtan, and north of the ridges, including Maomaoshan, Wushaoling, and the northern slopes of Leigong Mountain extending to the East-West Taizi area[8].
Figure 1.
Elevation Map of the Research Area.
2.2. Data Acquisition and Pre-Processing
- Digital Elevation Model (DEM): The data overview map of the research area is made using data from the ASTER GDEM 30m product available on the Geospatial Data Cloud (http://www.gscloud.cn)[9];
- Monthly total precipitation and average temperature are sourced from the National Tibetan Plateau Data Center (https://data.tpdc.ac.cn). The data has a resolution of 1 km and is stored in nc file format[10,11];
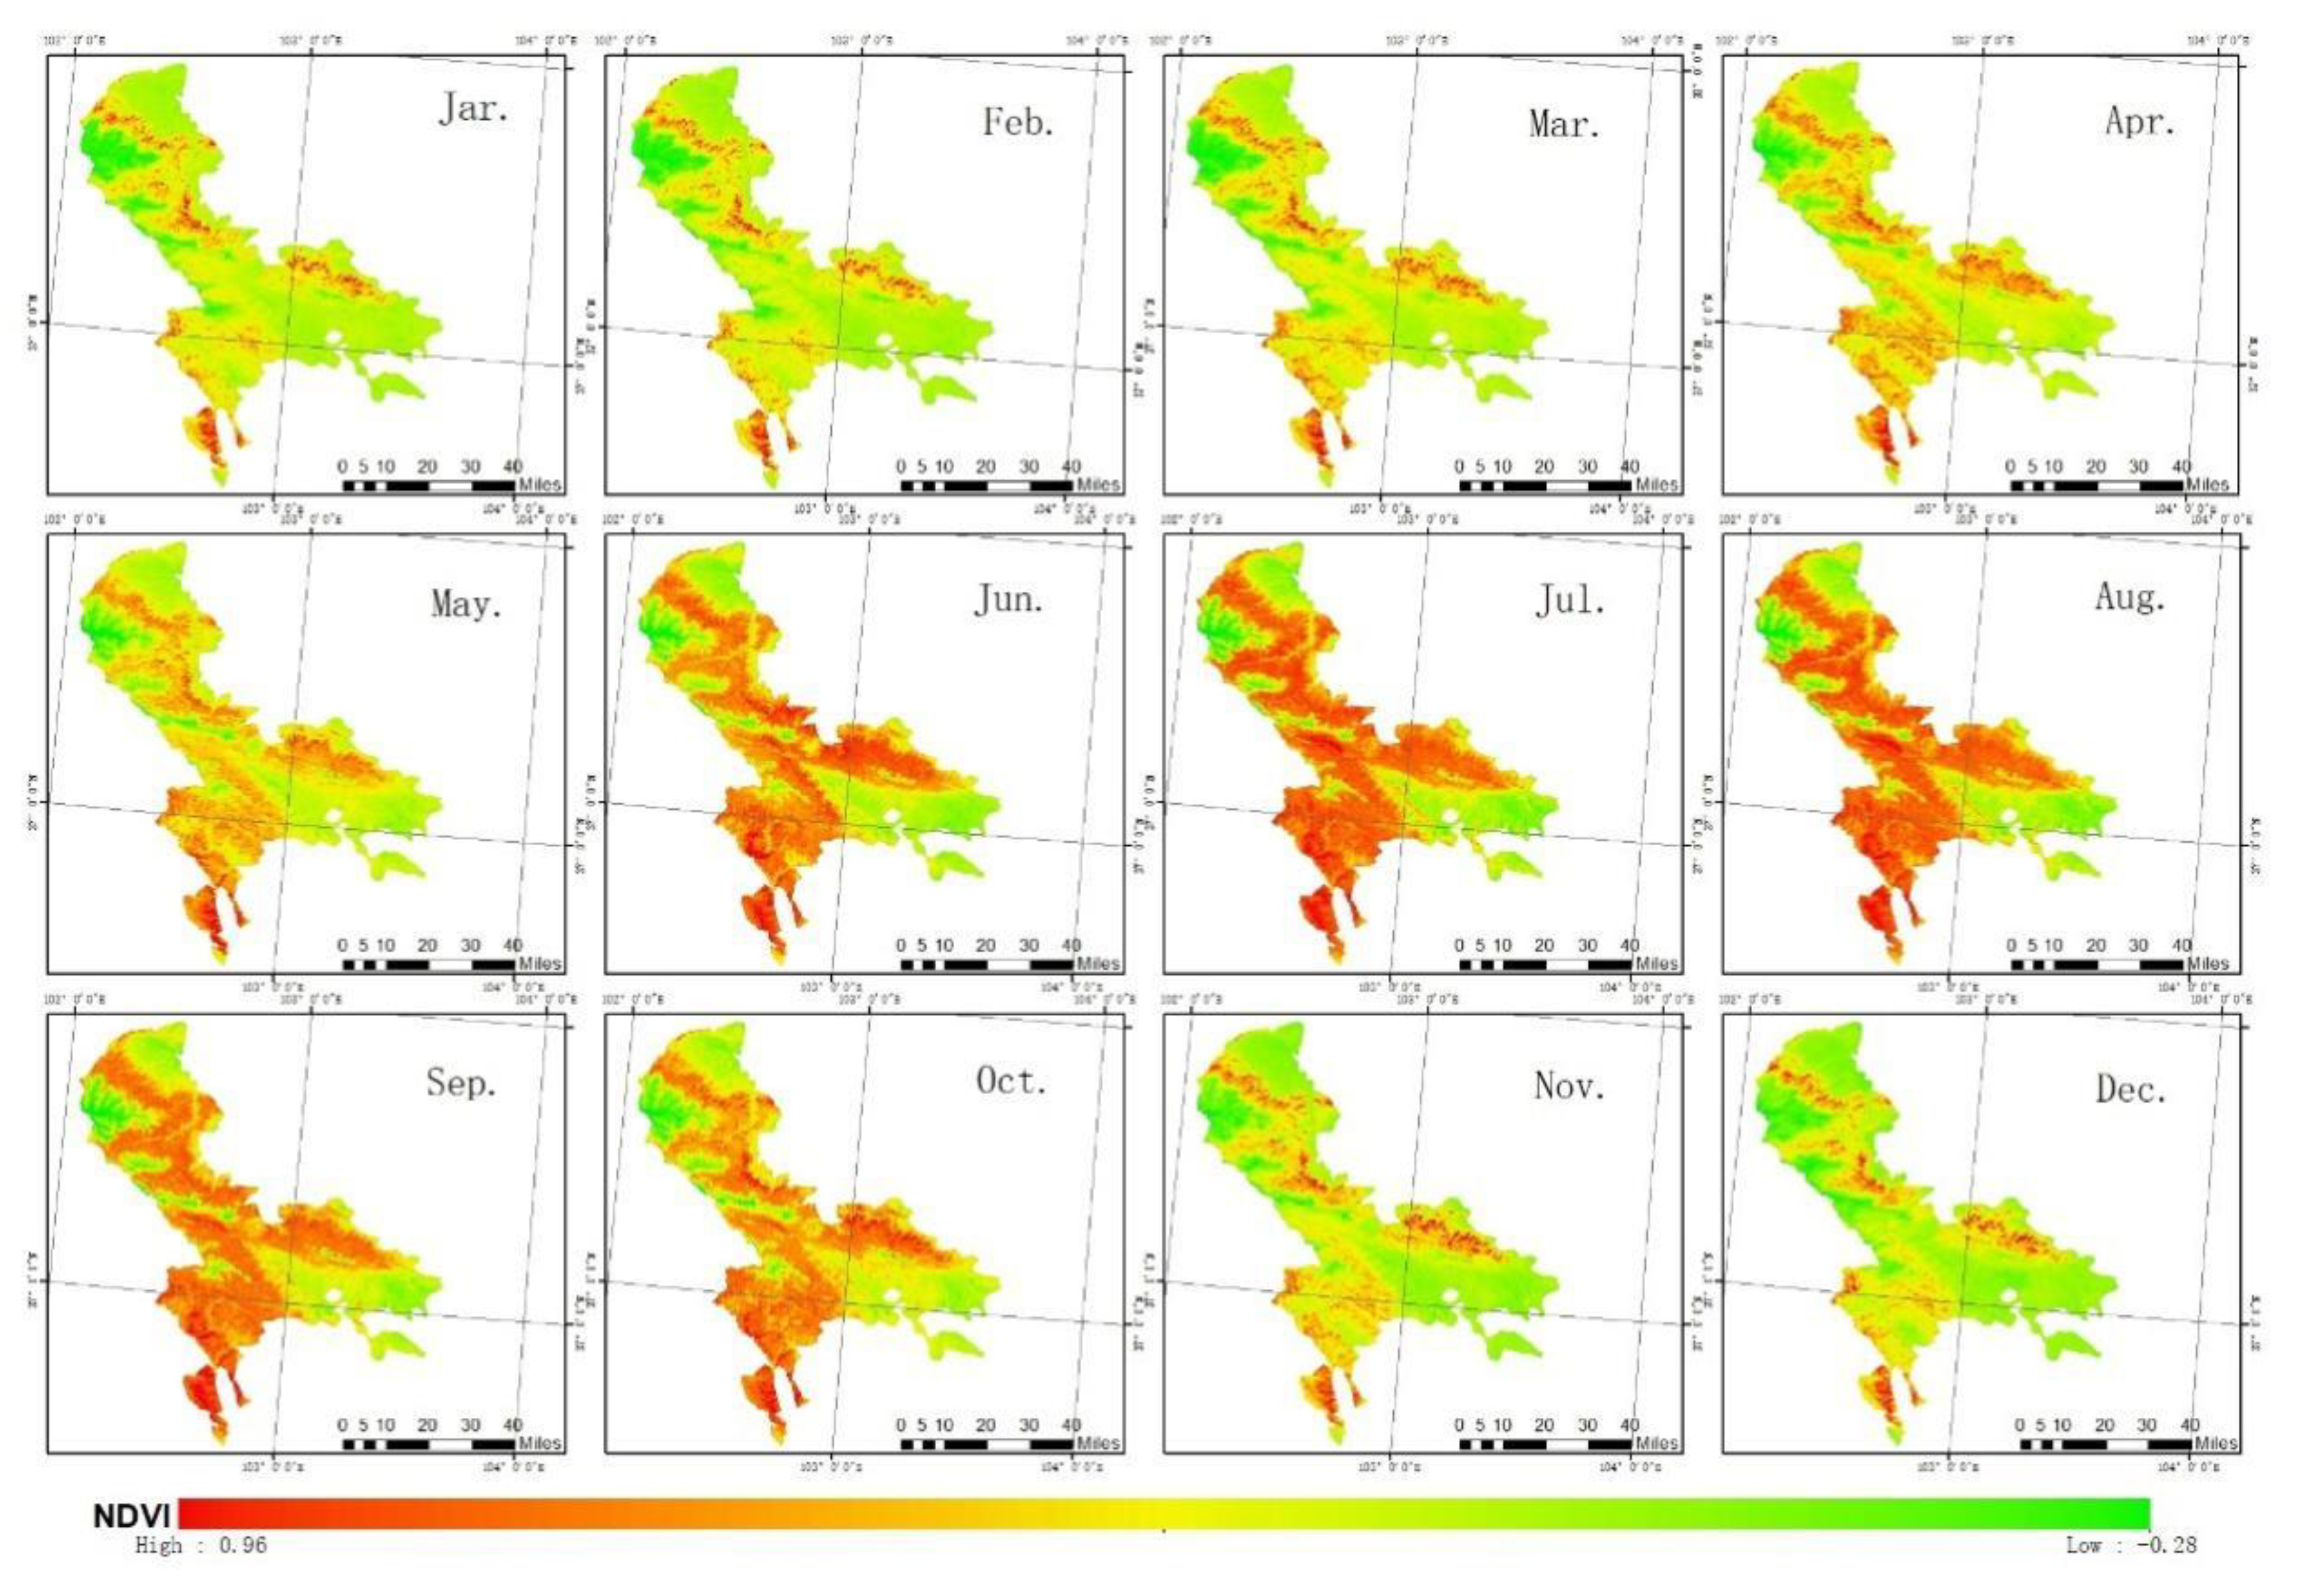
- Monthly NDVI for 2020 is sourced from the National Tibetan Plateau Data Center (https://data.tpdc.ac.cn). The data has a spatial resolution of 250 meters and is synthesized using the monthly maximum value composite method based on the 16-day composite monthly products provided by the MOD13Q1 product of the Aqua/Terra-MODIS satellite sensor[12];
- Monthly total solar radiation data is sourced from the single-level ERA5 hourly data from 1940 to the present provided by Copernicus Climate Change Service of European Space Agency (https://cds.climate.copernicus.eu/). The data is stored in GRIB file format and has a resolution of 0.1° × 0.1°[13];
- The MODIS17A13v061 product is sourced from the MODIS/Terra Gross Primary Productivity 8-Day L4 Global 500m SIN Raster V061. This data was distributed by the NASA’ s Earth Observing System Data and Information System (NASA EOSDIS) in 2021[14].
- Forest resource data is sourced from the Management Center of Gansu Qilian Mountain National Nature Reserve;
It is necessary to clarify that the data from the forest resource survey is not available on the internet for public use because it is classified as land resources survey data. Discussions and the corresponding usage permissions, however, were obtained with the Zhangye branch of the Management Center of Gansu Qilian Mountain National Nature Reserve during the early phases of data collection and processing for this paper.

Table 1.
Data Resources.
| Data Name | Data Type | Format | Data Resource |
| DEM | Raster | Tif(30m×30m) | Geospatial Data Cloud(http://www.gscloud.cn) |
| Monthly Average Temperature Monthly Total Precipitation |
Raster | nc(1km×1km) | National Tibetan Plateau Data Center (https://data.tpdc.ac.cn) |
| NDVI | Raster | nc(250m×250m) | National Tibetan Plateau Data Center(https://data.tpdc.ac.cn) |
| Monthly Total Solar Radiation | Raster | GRIB(0.1°×0.1°) | Copernicus Climate Change Service of European Space Agency (https://cds.climate.copernicus.eu/) |
| MODIS17A | Raster | hdr | NASA’s Earth Observing System Data and Information System (https://lpdaac.usgs.gov/) |
| Forest Resource Inventory | Vector | Shp | Zhangye Branch of the Gansu Administration Bureau, Qilian Mountain National Park |
The NPP simulation plugin[17], which is based on the IDL language on the ENVI platform and was developed by Professor Zhu Wenquan of Beijing Normal University and released on the website of the school[15,16], will be used in this study. ArcGIS 10.2 [16] will be used to read raster files and perform operations such as mask extraction and resampling. The net solar radiation data GRIB files from ERA5 will be interpreted hourly using QGIS 3.36.0 [18]. These hourly data will be aggregated to create monthly data to meet calculation requirements, and then converted to DAT files. R 4.3.3 [19], utilizing the Raster [20], Sf [21], and rgdal [22] packages, will be used to read the nc files containing monthly total precipitation and average temperature data. To make room for storage, these files will be converted to 12-band TIFF files. Resampling the data and preparing previously processed reference files for clipping are two steps in this process. Eventually, DAT files containing the data will be output for computations.The NDVI data has already been preprocessed by researchers in the country, so the only operations that will be carried out to align it with the other data are mask extraction and resampling, without further elaboration. Finally, all the aforementioned raster and vector data will employ the WGS1984 UTM Zone 49N coordinate reference system, with a spatial resolution of 30m×30m. The results obtained are shown in Figure 2, Figure 3, Figure 4 and Figure 5. Data will be analyzed using Python 3.12 [23], PyCharm Community Edition 2024.1.1 [24], Anaconda Navigator [25], and Microsoft Excel 2021 [26] for summation and statistical computations. The results will be compiled, and the paper will be written in Microsoft Word 2021 [27].
The data is used as the input parameter for the CASA model to calculate the NPP value after being unified and normalized, thereby providing data assurance for the calculation of carbon storage and carbon density.
Figure 2.
Monthly Total Precipitation in Tianzhu County in 2020.
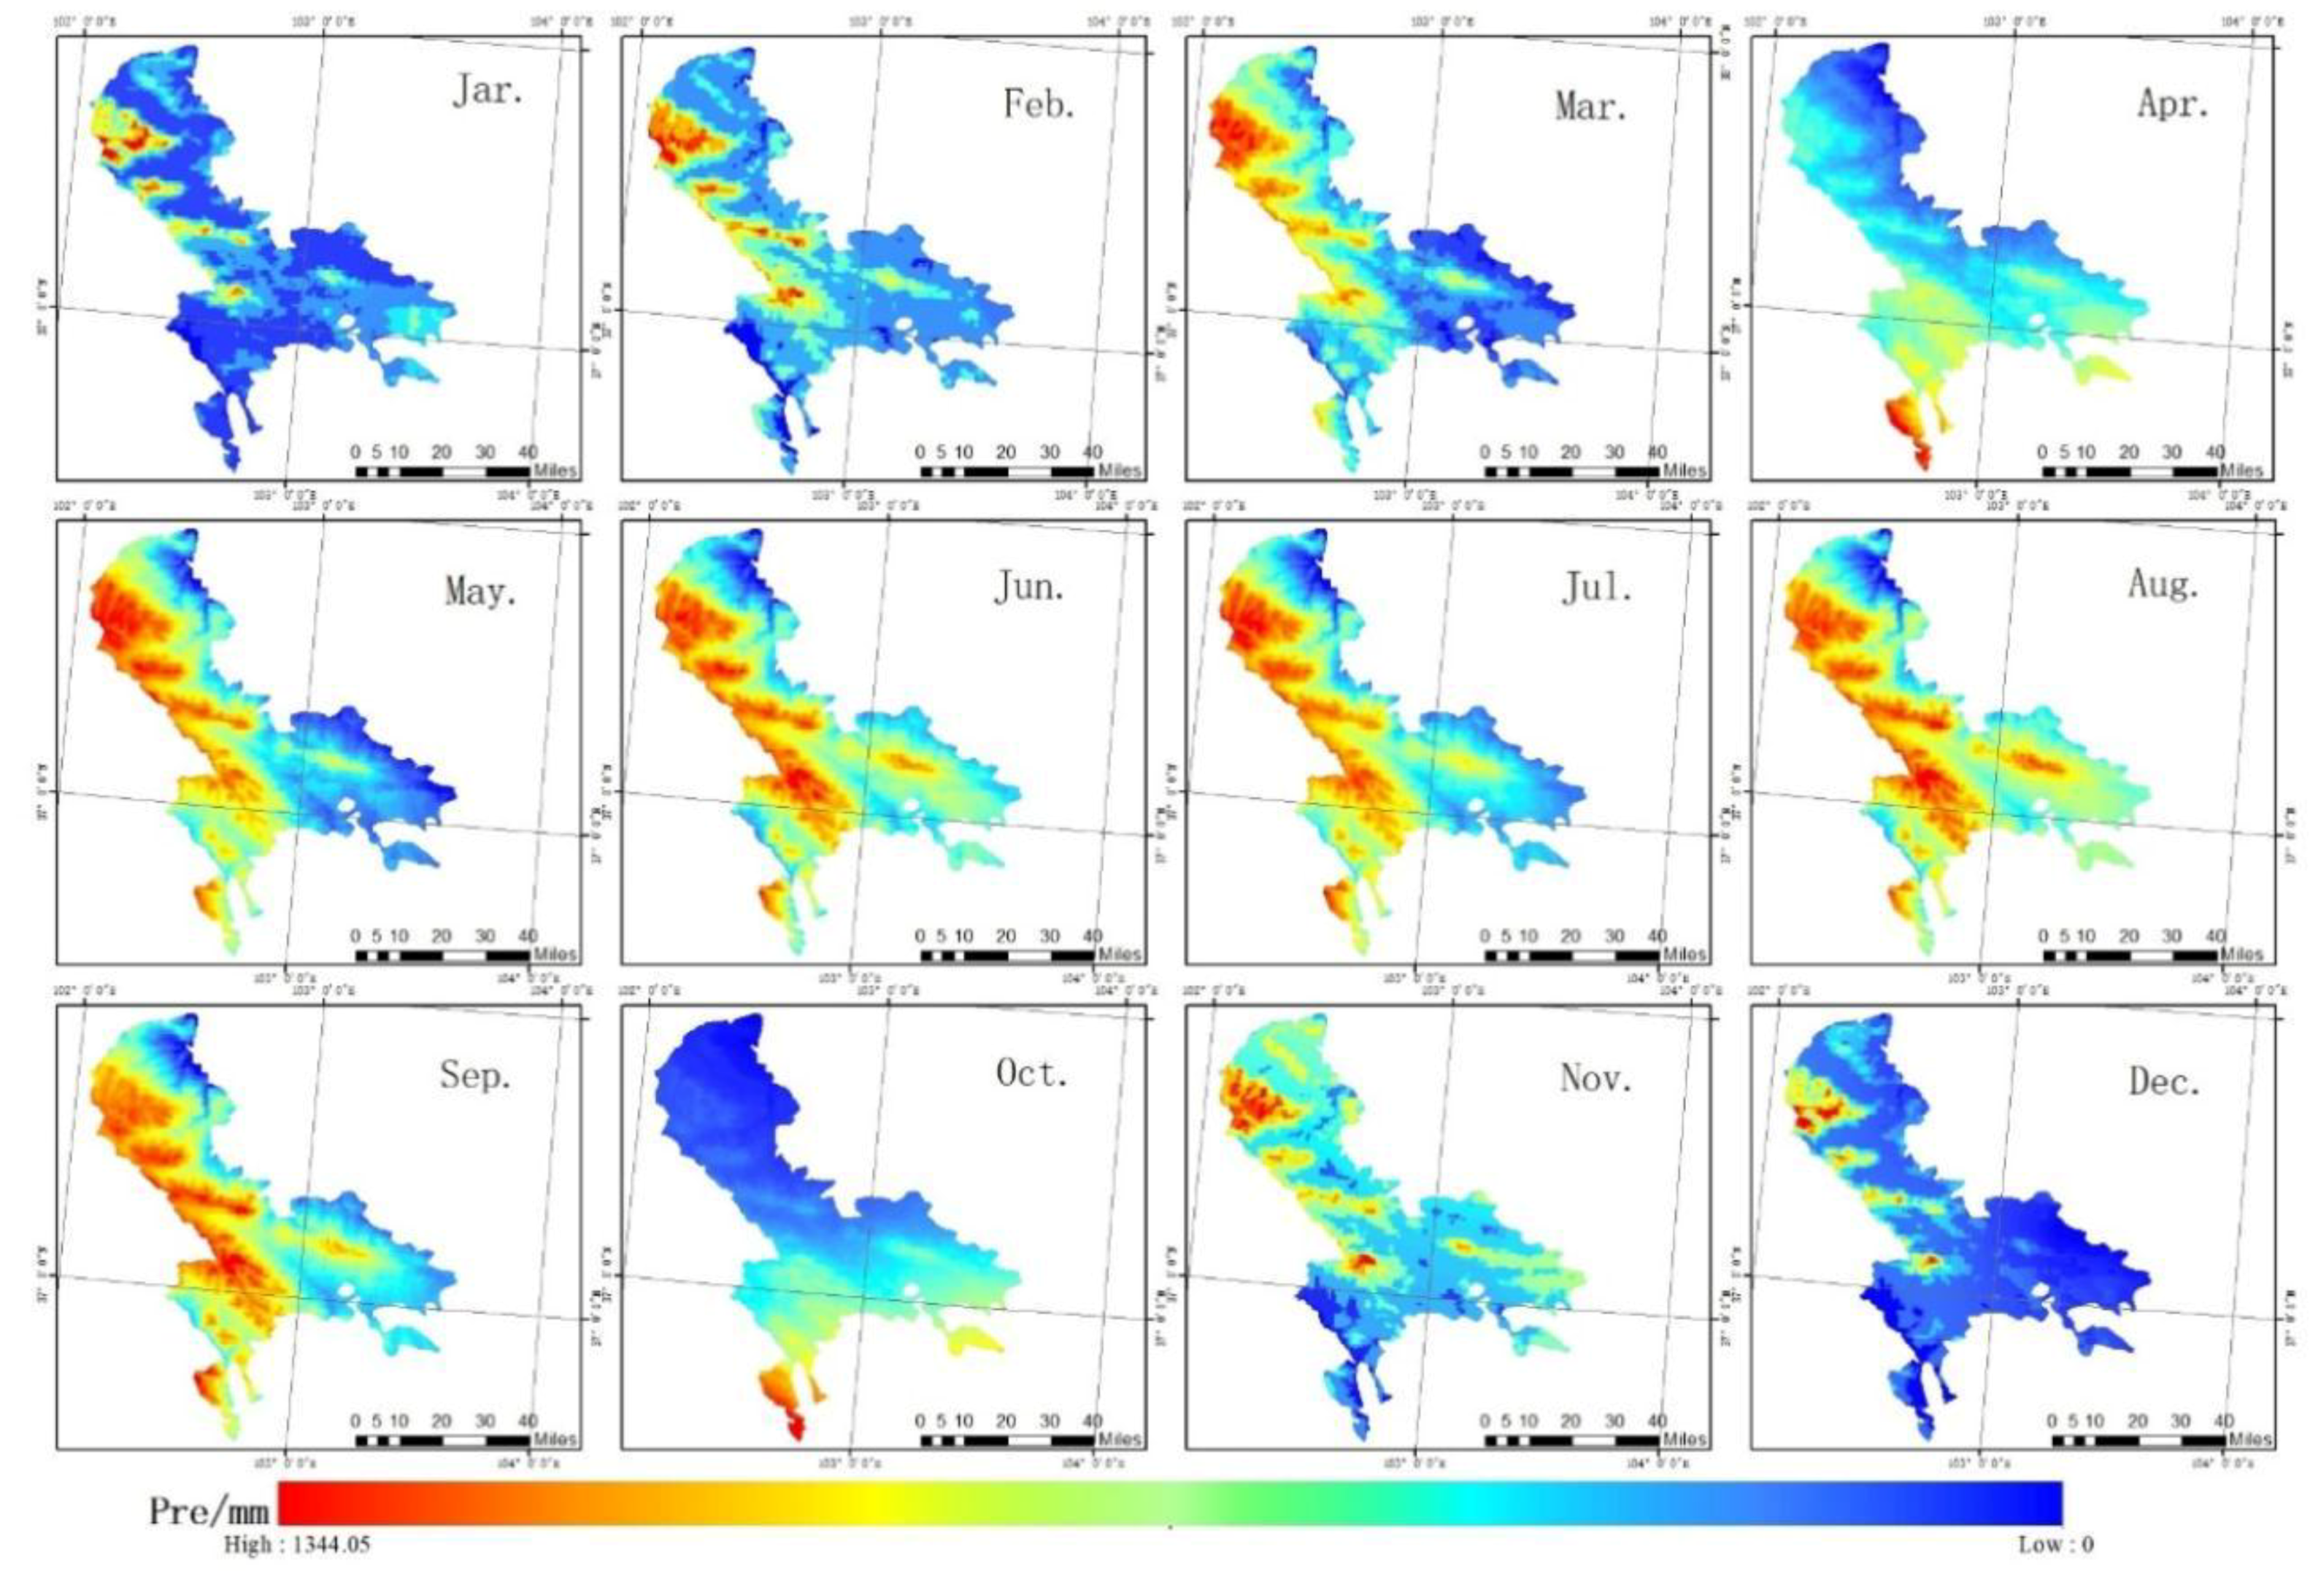
Figure 3.
Monthly Average Temperature in Tianzhu County in 2020.
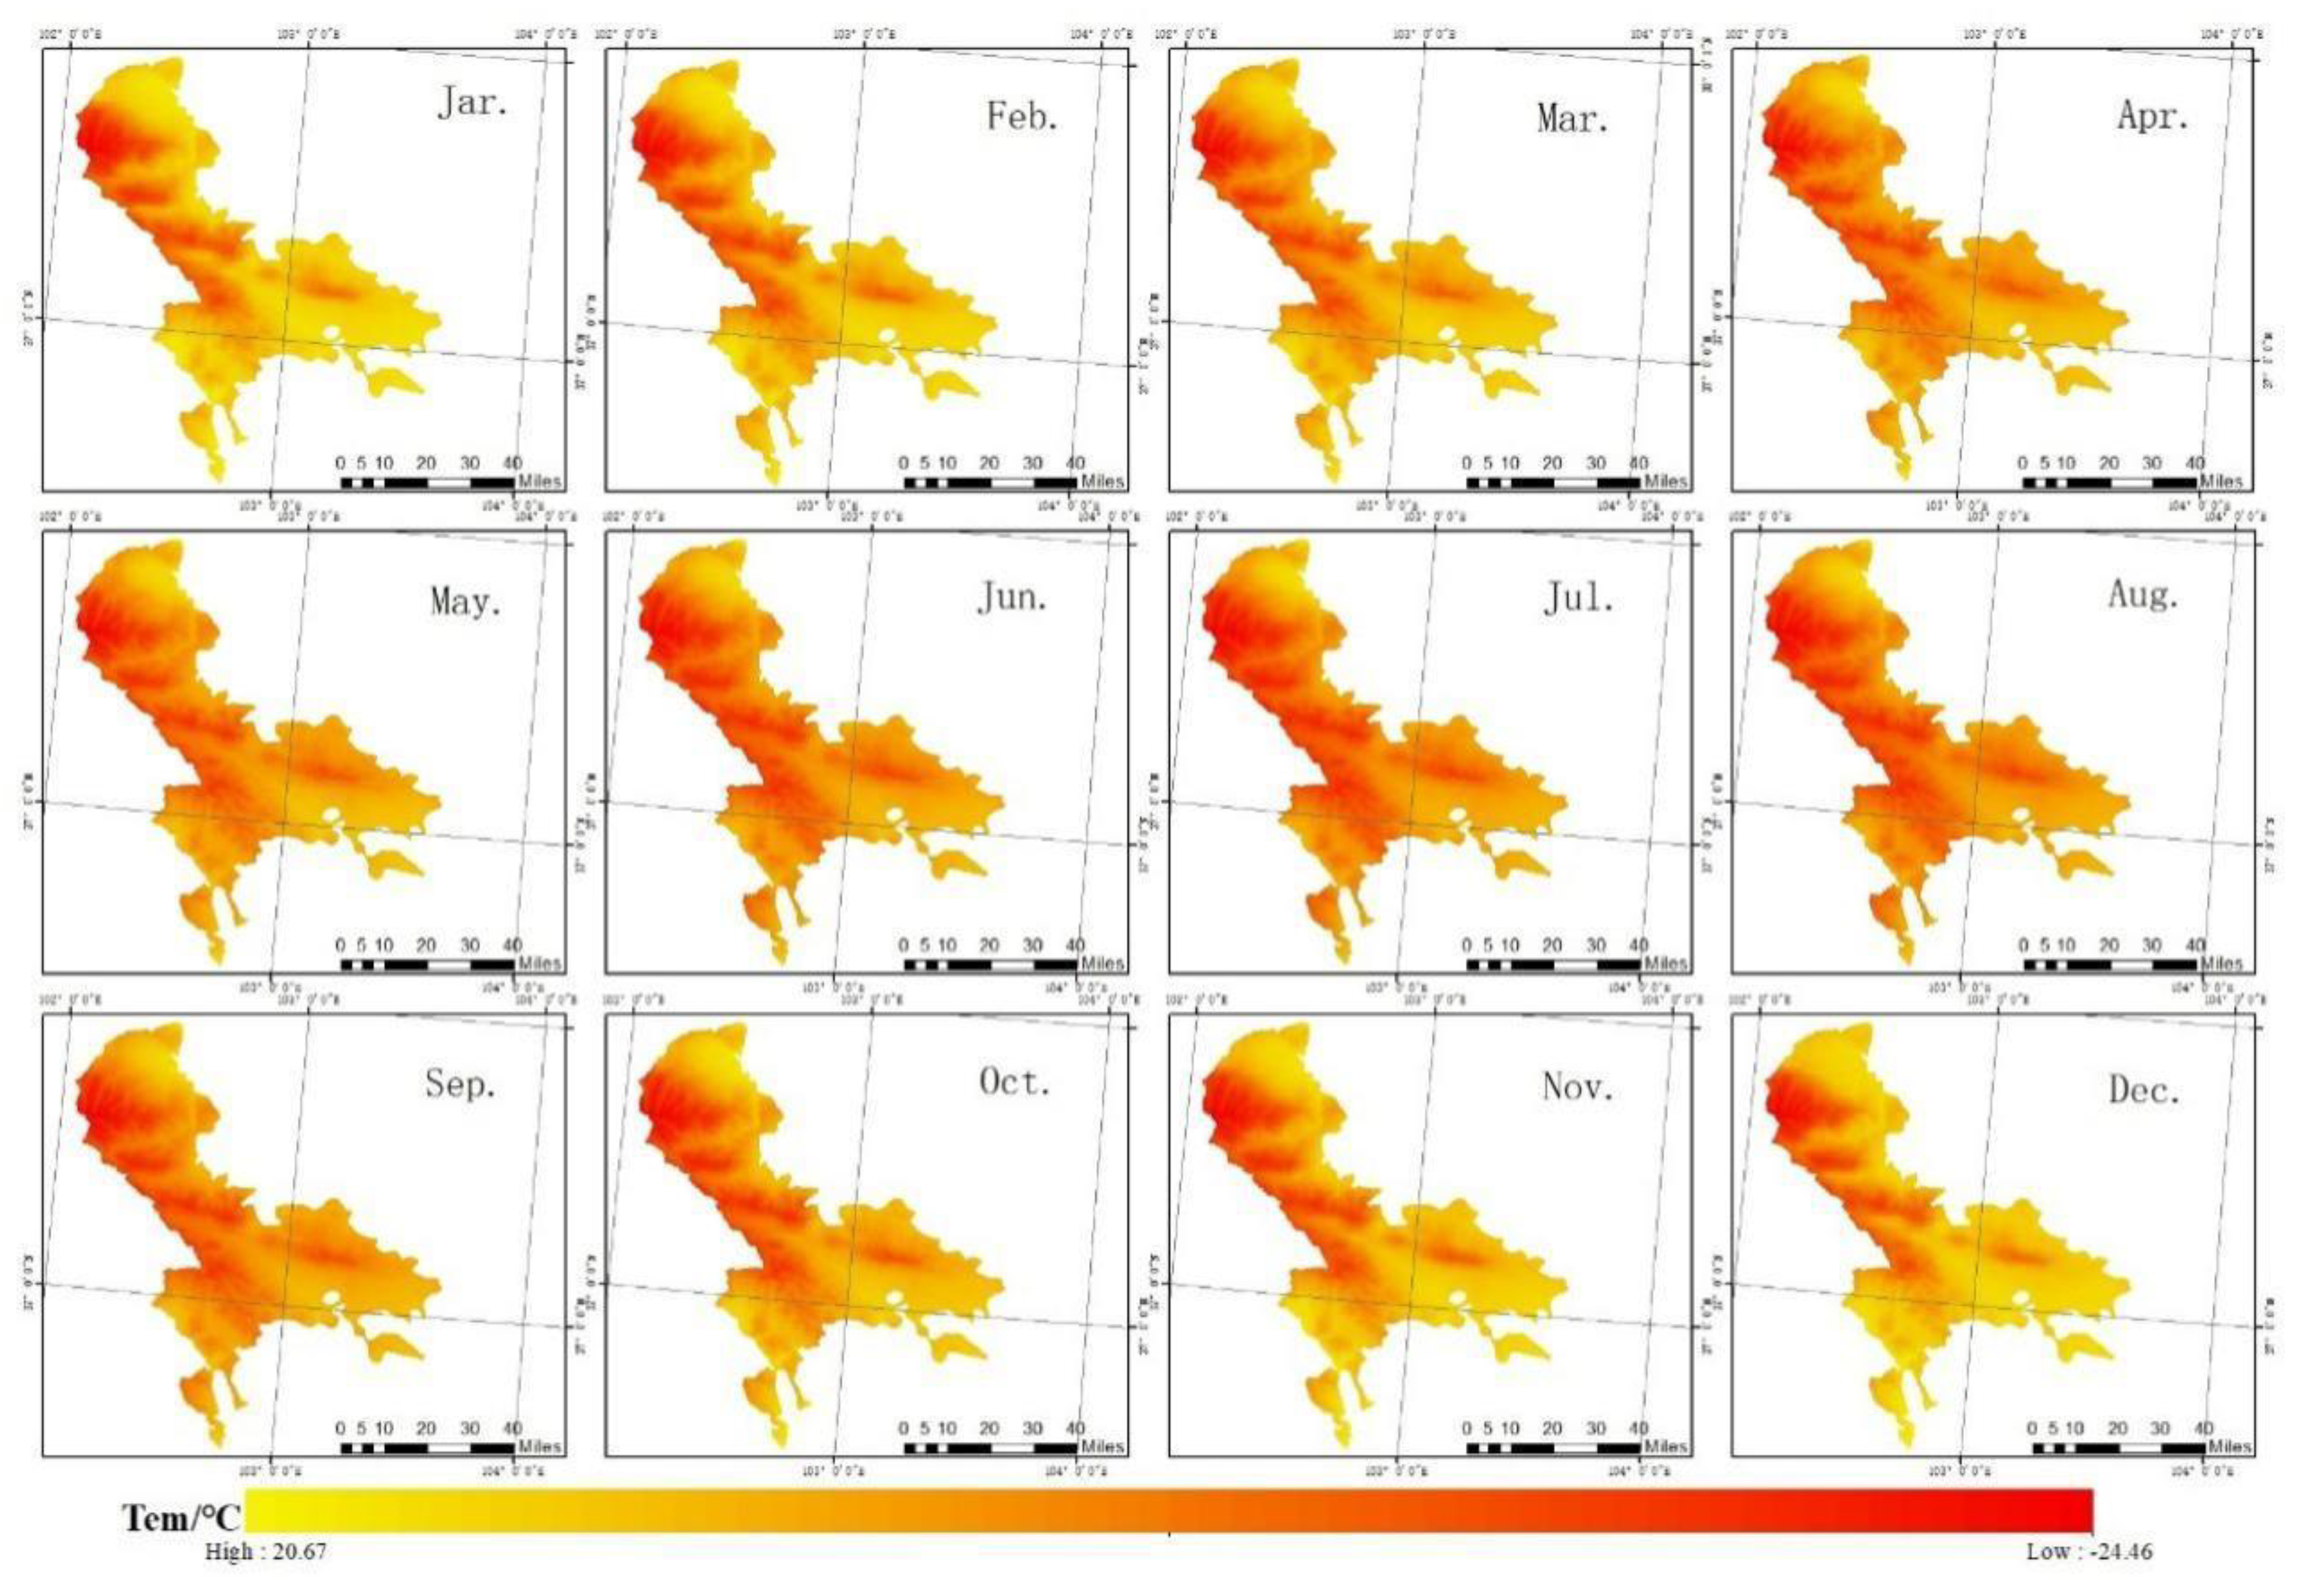
Figure 4.
Monthly Total Net Solar Radiation in Tianzhu County in 2020.
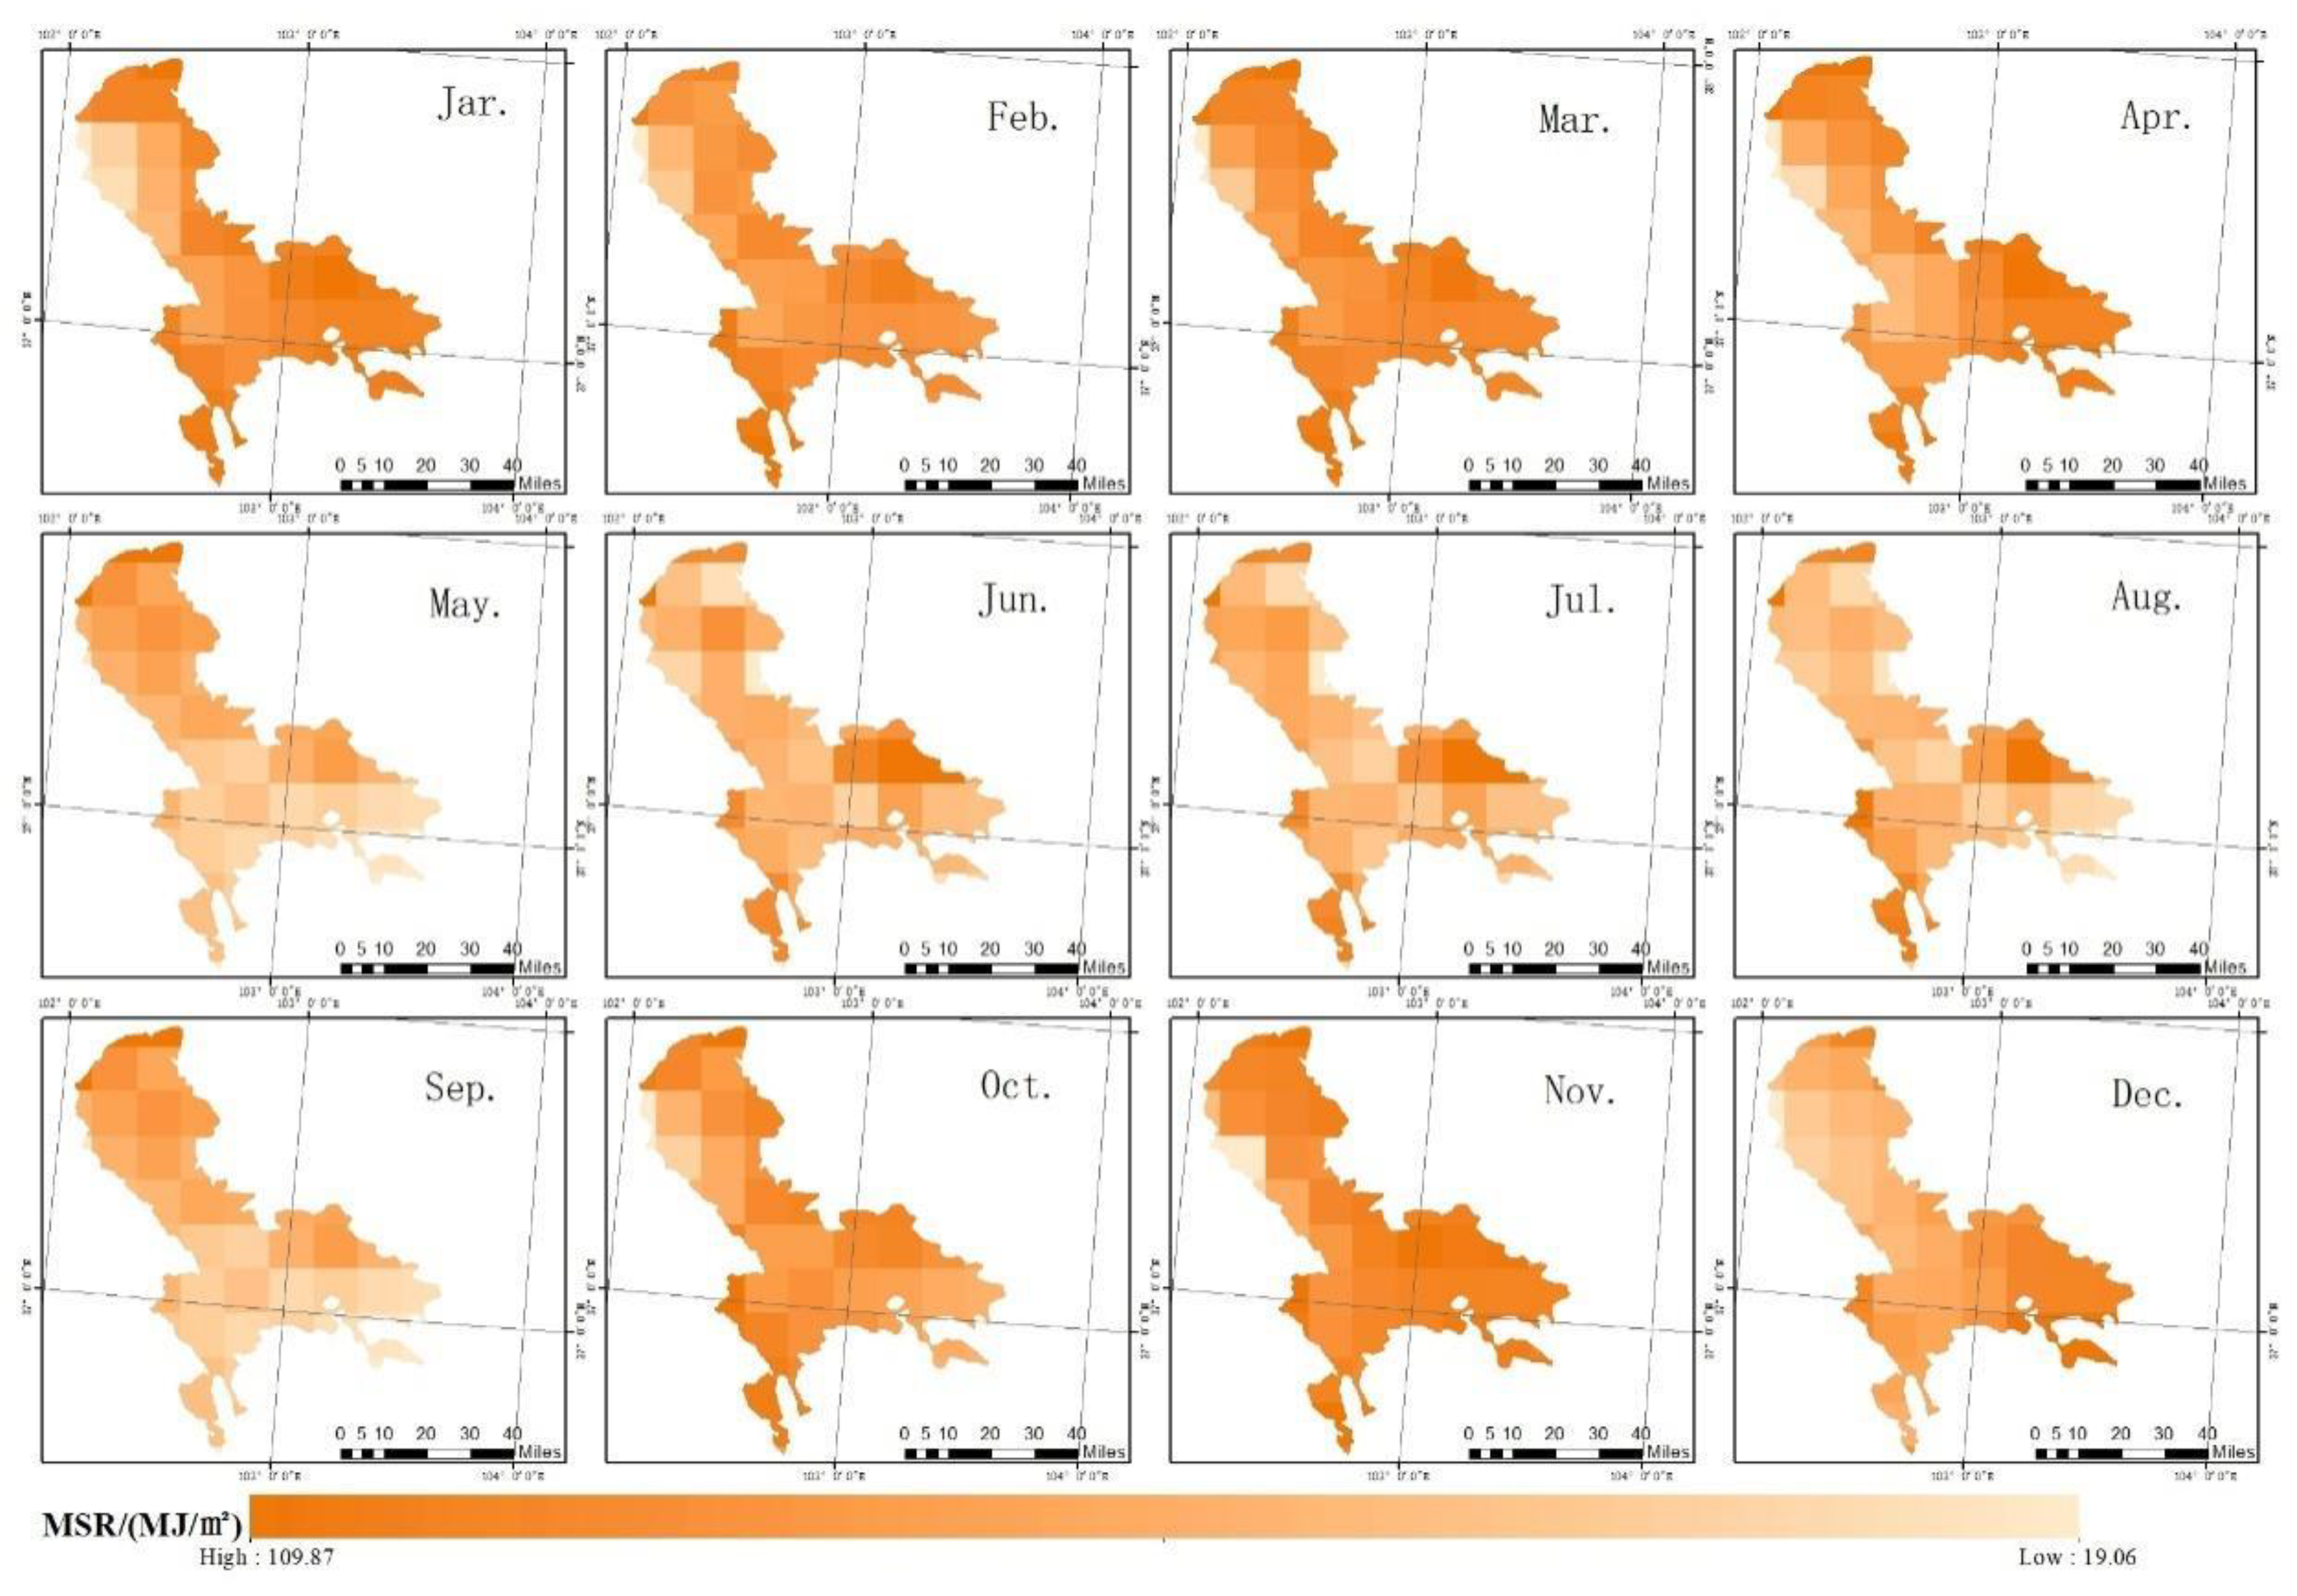
Figure 5.
Monthly NDVI Values in Tianzhu County in 2020.
2.3. Research Method
2.3.1. Classification of Forest Vegetation
Land use and cover data, which is frequently acquired through remote sensing, has been the main source of data for previous research on forest carbon storage and carbon density[28]. However, the impact of tree crown width, canopy cover, and diameter at breast height on forest shrubbery must be taken into account in order to calculate forest carbon storage accurately. This study intends to use data from the forest resource inventory to avoid the overshadowing effect of tree forests on shrubbery. Land use will be the priority conversion field when rasterizing vector data. The priority field will be used to convert the vector to raster, which will produce the area and distribution of forest resources in Tianzhu County. Forestland will be classified accordingly (as shown in Table 2). No discussion of cultivated land, grassland, water bodies, construction land, or unused land will be included as this study only focuses on forests.
Figure 6.
Forest Distribution Map of Tianzhu County.
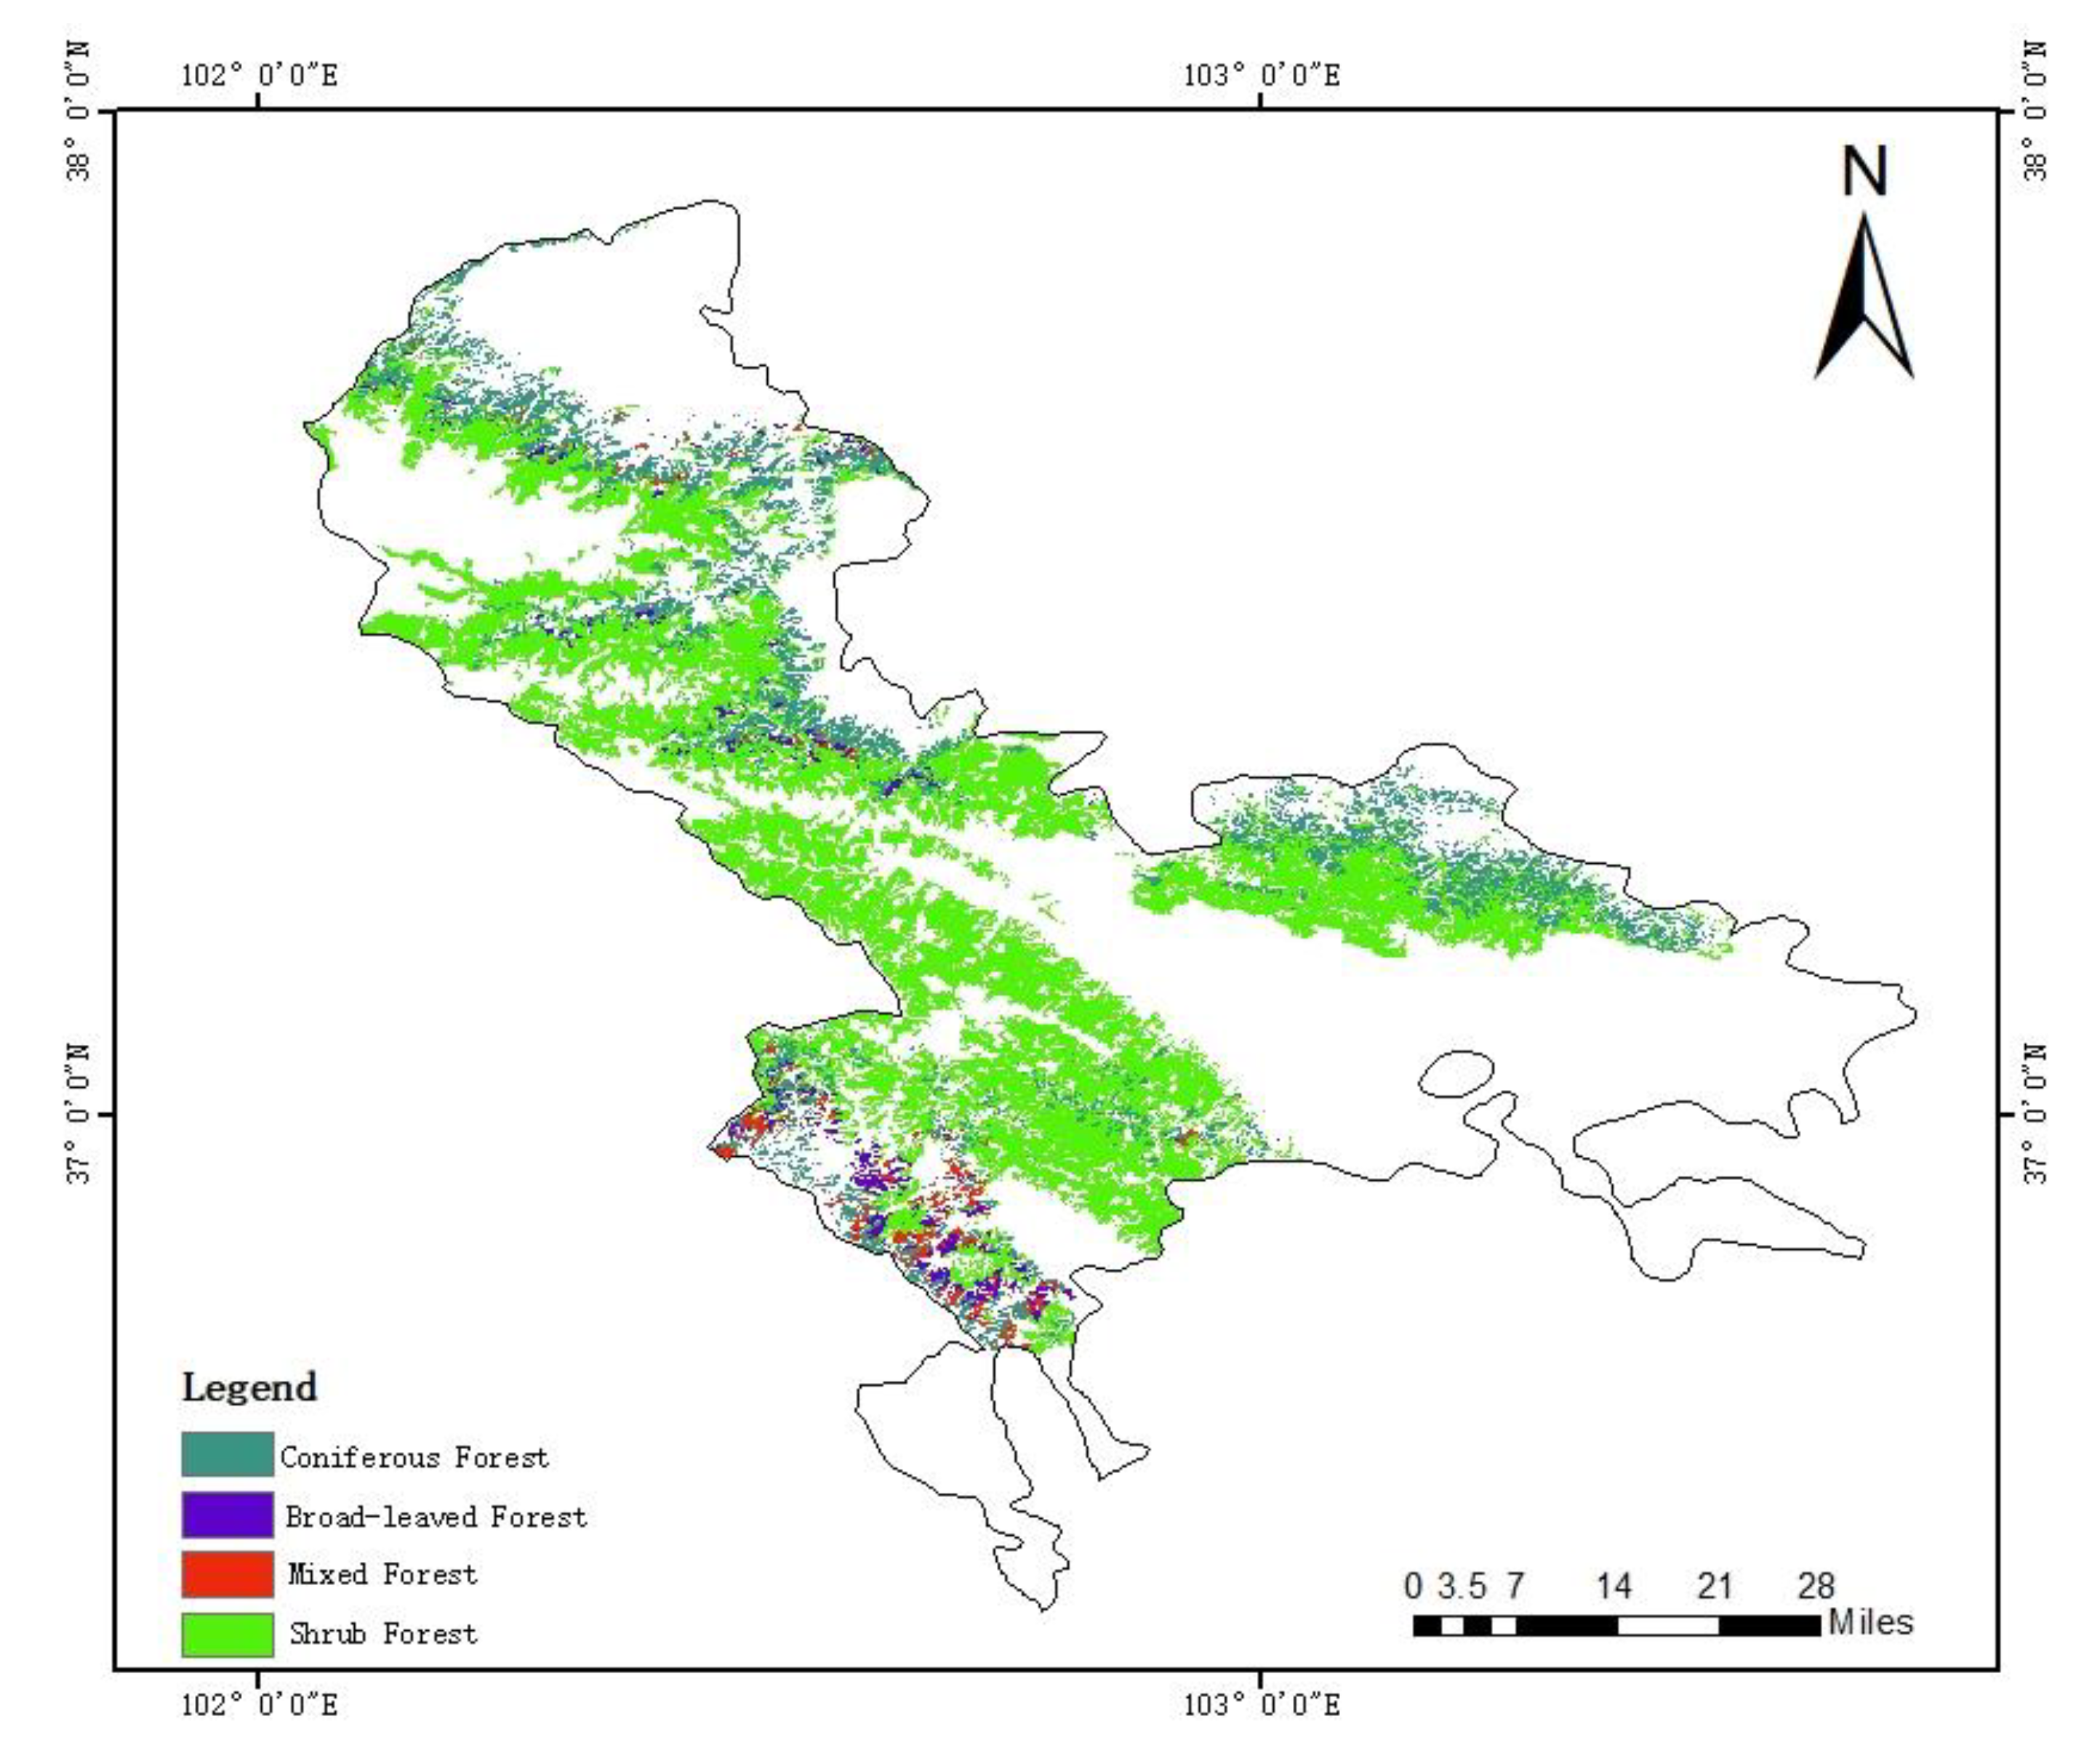
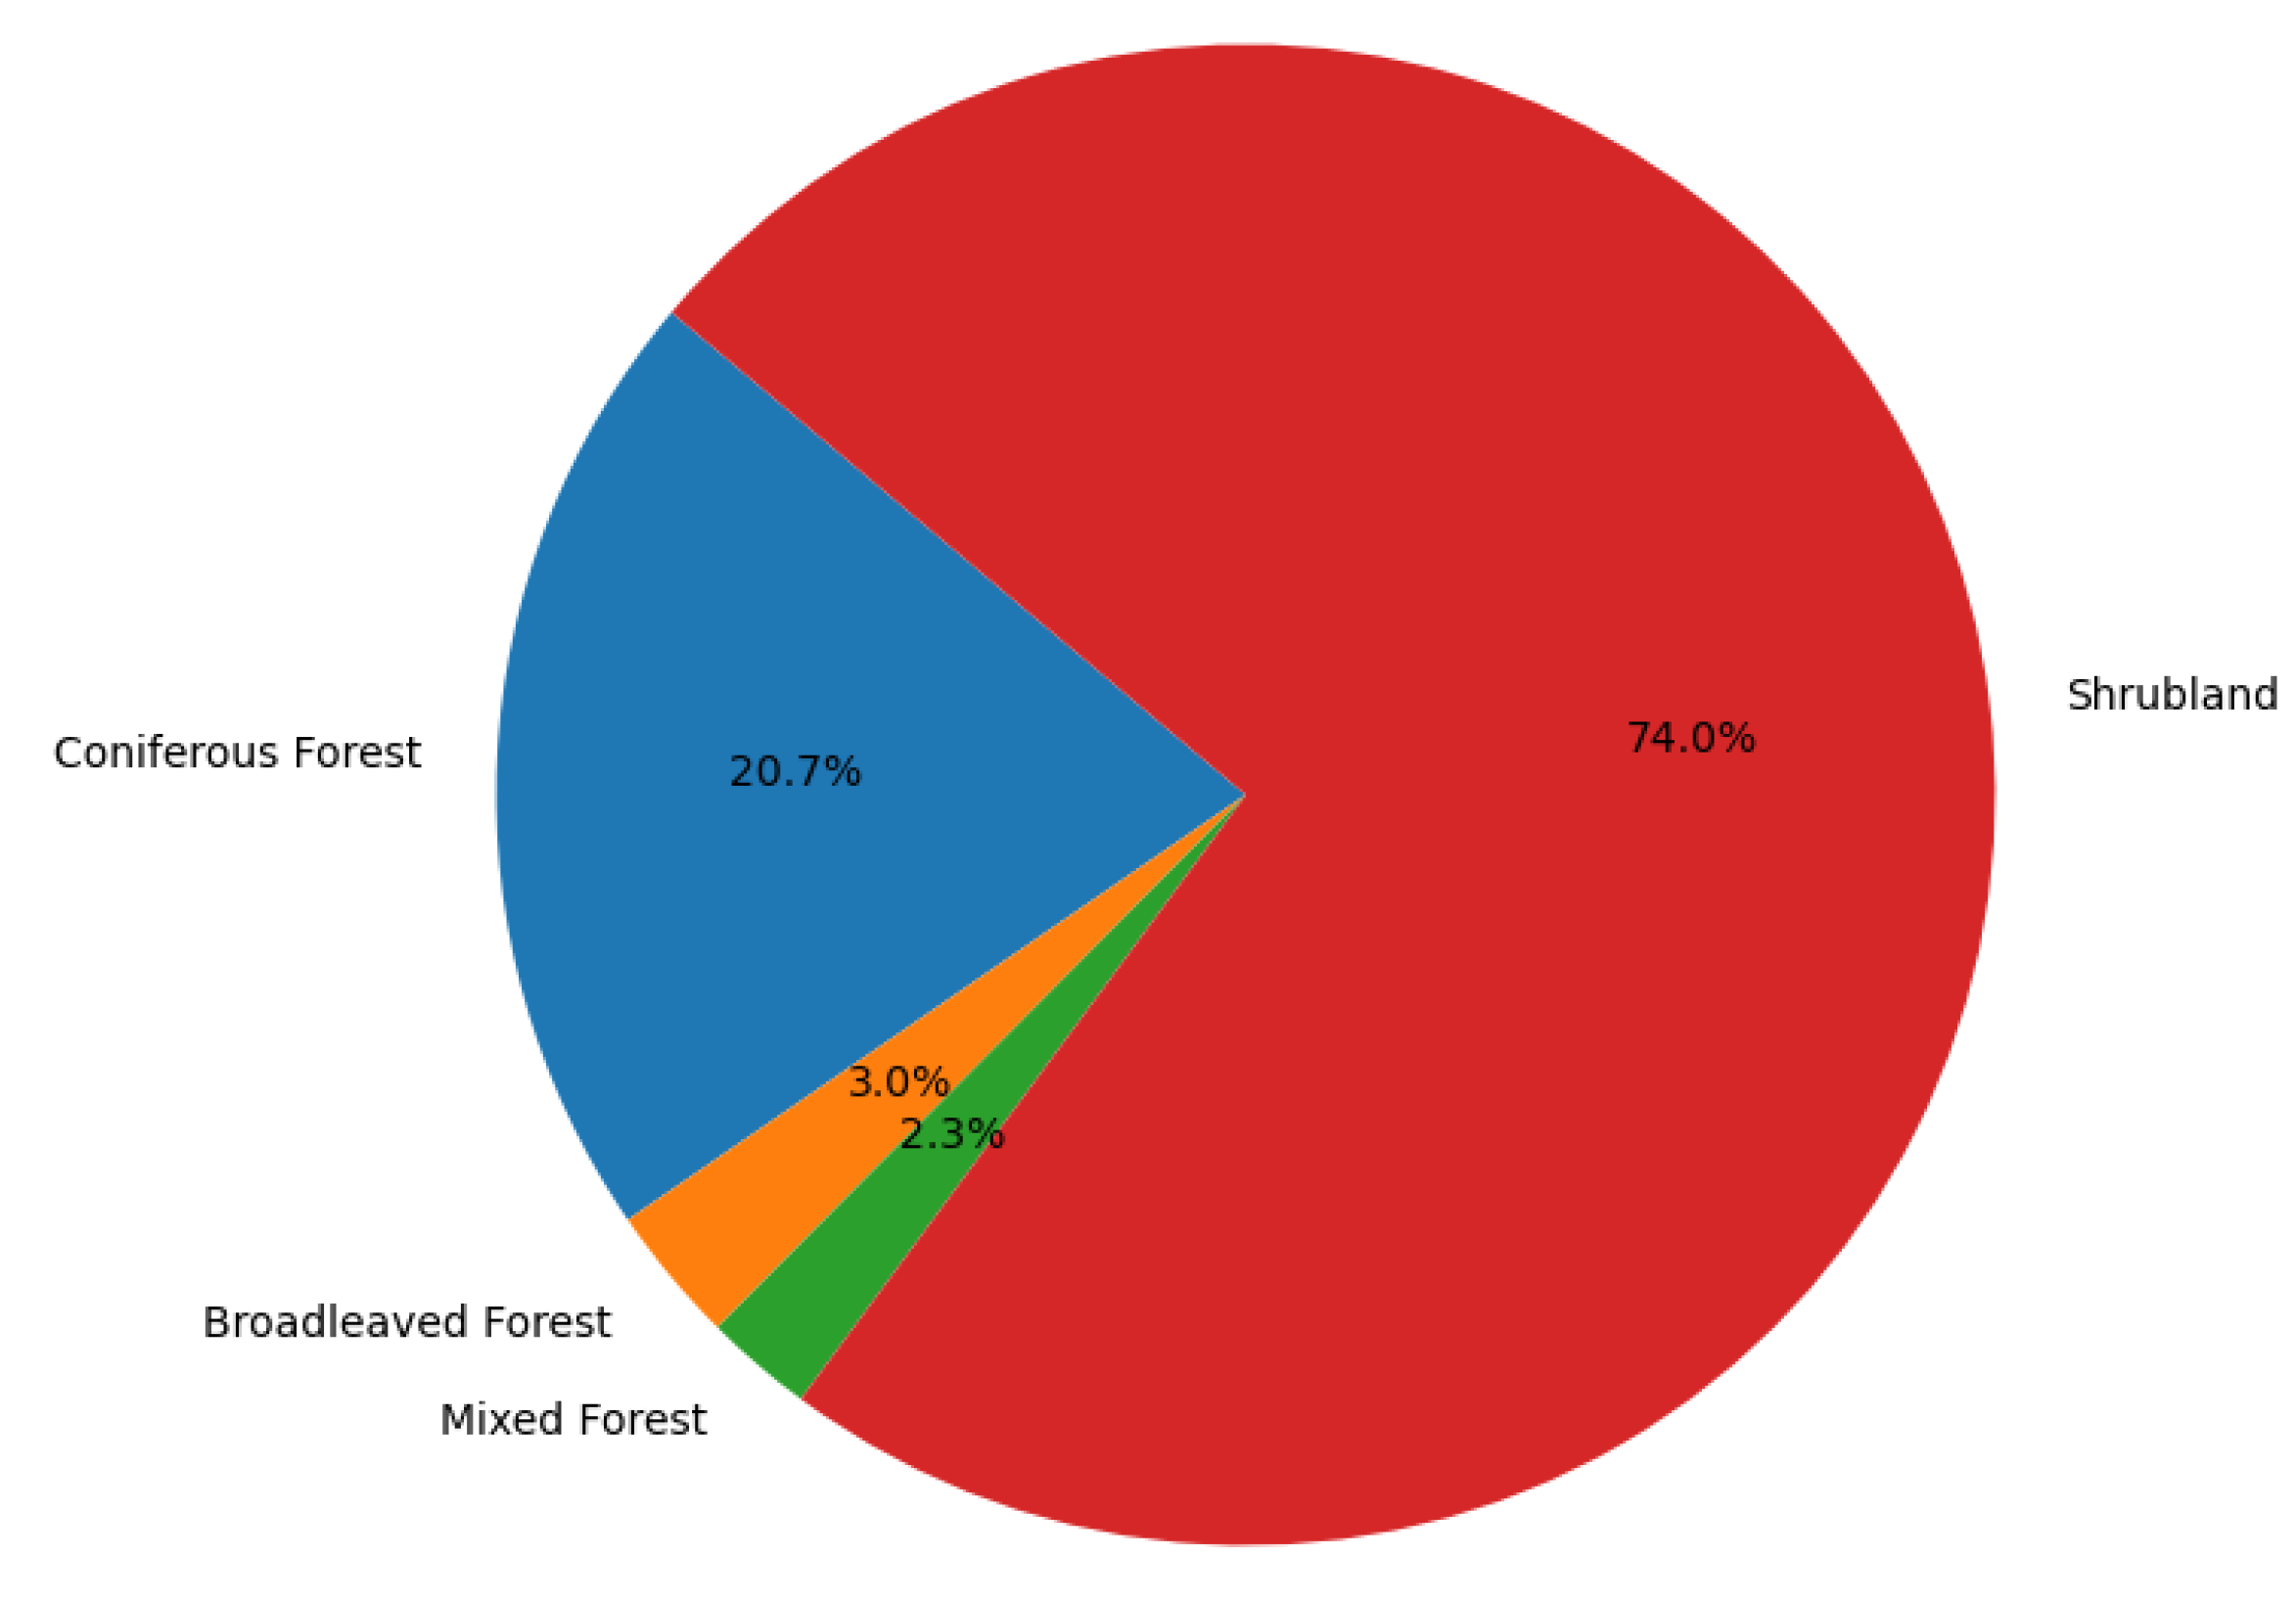
According to data from the forest resource inventory, the total area of forest land in Tianzhu County is 25,606.325 km². Among them: Coniferous forests make up 20.69% of Tianzhu County’s total forest area, covering an area of about 5,298.346 km², mainly consisting of dominant tree species such as Qinghai spruce, larch, and Qilian juniper; Broad-leaved forests make up 2.78% of the total forest area, covering an area of about 761.232 km², mainly consisting of species such as poplar and birch; Mixed forests, including both coniferous and broadleaved species, make up 2.34% of the total forest area, covering an area of 598.133 km². Shrub forests dominated by species such as willow and barberry make up 74% of the total forest area, covering a total area of 18,948.614 km². Additionally, the county contains a few small areas planted with economic crops like Sichuan pepper trees. They are included in the calculation under mixed forests due to their limited extent and negligible impact on the results.
Figure 7.
Distribution of Different Types of Forest Land in Tianzhu County.
2.3.2. CASA Model
The CASA (Carnegie Ames Stanford Approach) model is first proposed by American scholar Potter in 1993. This model is a photosynthetic efficiency process model based on the physiological properties of vegetation. It calculates vegetation Net Primary Productivity (NPP) based on the Absorbed Photosynthetically Active Radiation (APAR) and the light use efficiency (ε) of different types of vegetation. The formula of the model is as follows[29–32]:
𝑁𝑃𝑃(𝑥, 𝑡) = 𝐴𝑃𝐴𝑅(𝑥, 𝑡) × 𝜀(𝑥, 𝑡)
In the equation: “t” refers to the time period during which vegetation undergoes photosynthesis;
“x” refers to the spatial location of the vegetation.
The amount of Absorbed Photosynthetically Active Radiation (APAR) that vegetation can use is determined by both the total solar radiation and the absorption ratio of different vegetation types to solar radiation[33]. The relationship is expressed by the following formula:
APAR(𝑥, 𝑡) = SOL(𝑥, 𝑡) × 𝐹PAR(𝑥, 𝑡) × 0.5
In the equation: “SOL(x, t)” refers to the total solar radiation at location x during month t (MJ · m−2);
“FPAR(x, t)” refers to the proportion of incident photosynthetically active radiation absorbed by the vegetation;
“0.5” is a fixed coefficient (representing the actual proportion of usable solar radiation by vegetation).
Under actual circumstances, the absorption and utilization of solar radiation by vegetation are determined by the type of vegetation cover. Normalized Difference Vegetation Index (NDVI) can be used in practical studies to calculate the proportion of incident Photosynthetically Active Radiation (FPAR) and vegetation cover. The formulas are as follows[34]:
In the equation: “FPAR(x, t)” refers to the effective absorption ratio of Photosynthetically Active Radiation by vegetation at position x at the moment t;
“FPARmax and FPARmin” refers to fixed parameters of the model (independent of vegetation type).
In practical research, parameters such as 0.95 and 0.001 can be set based on previous studies. “SRi,max” and “SRi,min” here represent the 95th and 5th percentiles of the NDVI for the i-th vegetation type respectively. This NDVI ratio is a vegetation index obtained from remote sensing data. The vegetation index SR can be calculated by the following formula:
The efficiency of solar energy utilization, ε, is calculated by dividing the chemical energy contained in the dry matter produced by vegetation per unit area during a certain period by the Photosynthetically Active Radiation energy projected onto that area during the same period. Environmental elements such as temperature, soil moisture content, and atmospheric water vapor pressure differential affect the photosynthetic efficiency of vegetation in ecosystems. The degree of net productivity of vegetation is also influenced by the interaction of these factors. Potter et al. suggest that, in ideal circumstances, vegetation can maximize its use of solar energy. However, in reality, the actual solar energy utilization of various vegetation types depends on specific environmental factors in which the vegetation grows[29]. The formula for calculating solar energy utilization is as follows:
𝜀(𝑥, 𝑡) = 𝑇𝜀1(𝑥, 𝑡) × 𝑇𝜀2(𝑥, 𝑡) × 𝑊𝜀 (𝑥, 𝑡) × 𝜀𝑚𝑎𝑥
In the equation: “Tε1(x, t)” refers to vegetation at position x at the moment t experiences low temperatures;
“Tε2(x, t)” refers to the temperature stress experienced by vegetation in a high-temperature environment;
“Wε (x, t)” refers to the coefficient representing the influence of water stress on vegetation at position x at the moment t;
“εmax” refers to the maximum light energy utilization achievable by different types of vegetation under ideal environmental conditions.
3. Pixel-Scale Calculation of NPP, Carbon Density, and Carbon Storage
3.1. Calculation of NPP with CASA Model
Vegetation net primary productivity (NPP) plays a crucial role in assessing global climate change, carbon balance, and vegetation’s ability to fix carbon. NPP is essential to studying the transformation of materials and energy in ecosystems since it is a key indicator of biomass change. It also forms the basis for studying the material and energy conversion in ecosystems [35,36,37], directly reflecting the natural conditions of vegetation productivity[36], and therefore, compared to biomass, it can more accurately represent the dynamic changes in vegetation’s carbon fixation capacity[38].Tianzhu Tibetan Autonomous County is the subject of this study. To estimate the forest net primary productivity in Tianzhu County, we use the CASA model and input long-term series parameters such as monthly average temperature, monthly total precipitation, monthly total net solar radiation, and NDVI. The NASA-released MODIS17A dataset (GPP/NPP) is compared to the CASA model at the pixel scale in order to ensure the objectivity of the results. To do pixel-scale calculation of NPP, the data will be reclassified into 20 categories using the natural breaks classification method in ArcGIS10.2.
Figure 8.
Pixel-Scale Distribution Proportion of NPP.
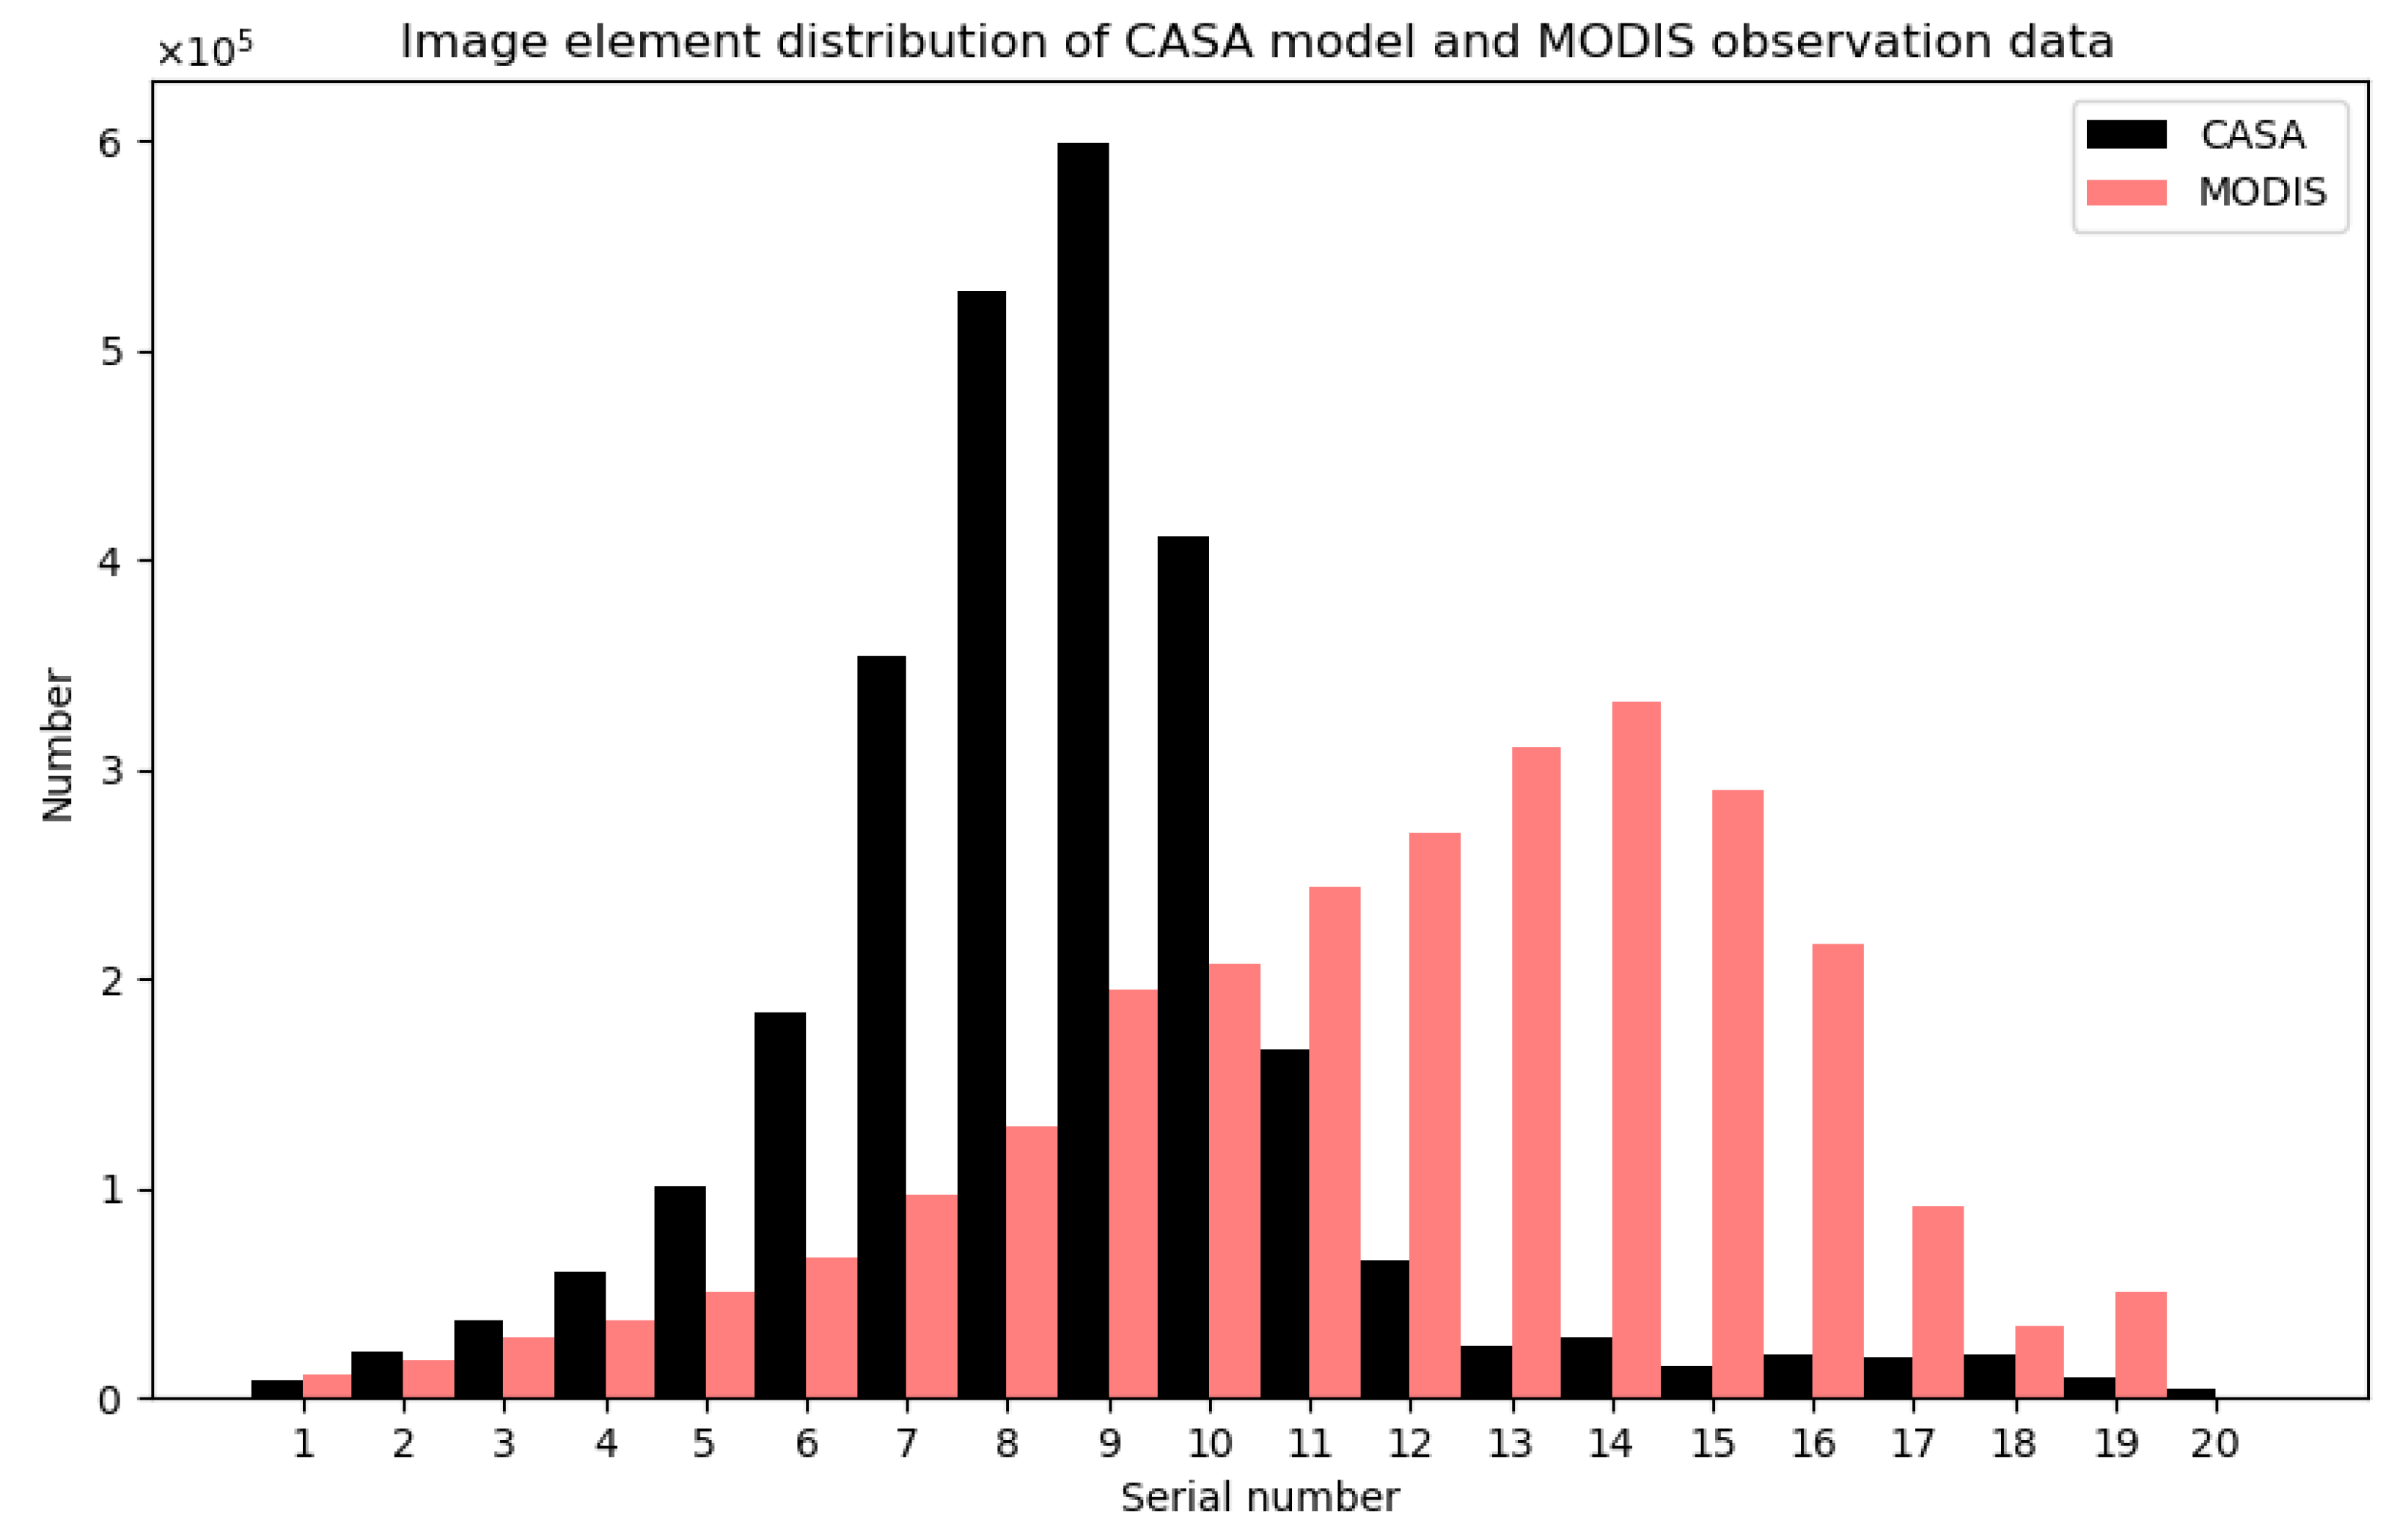
Figure 9.
Pixel Statistics Results.
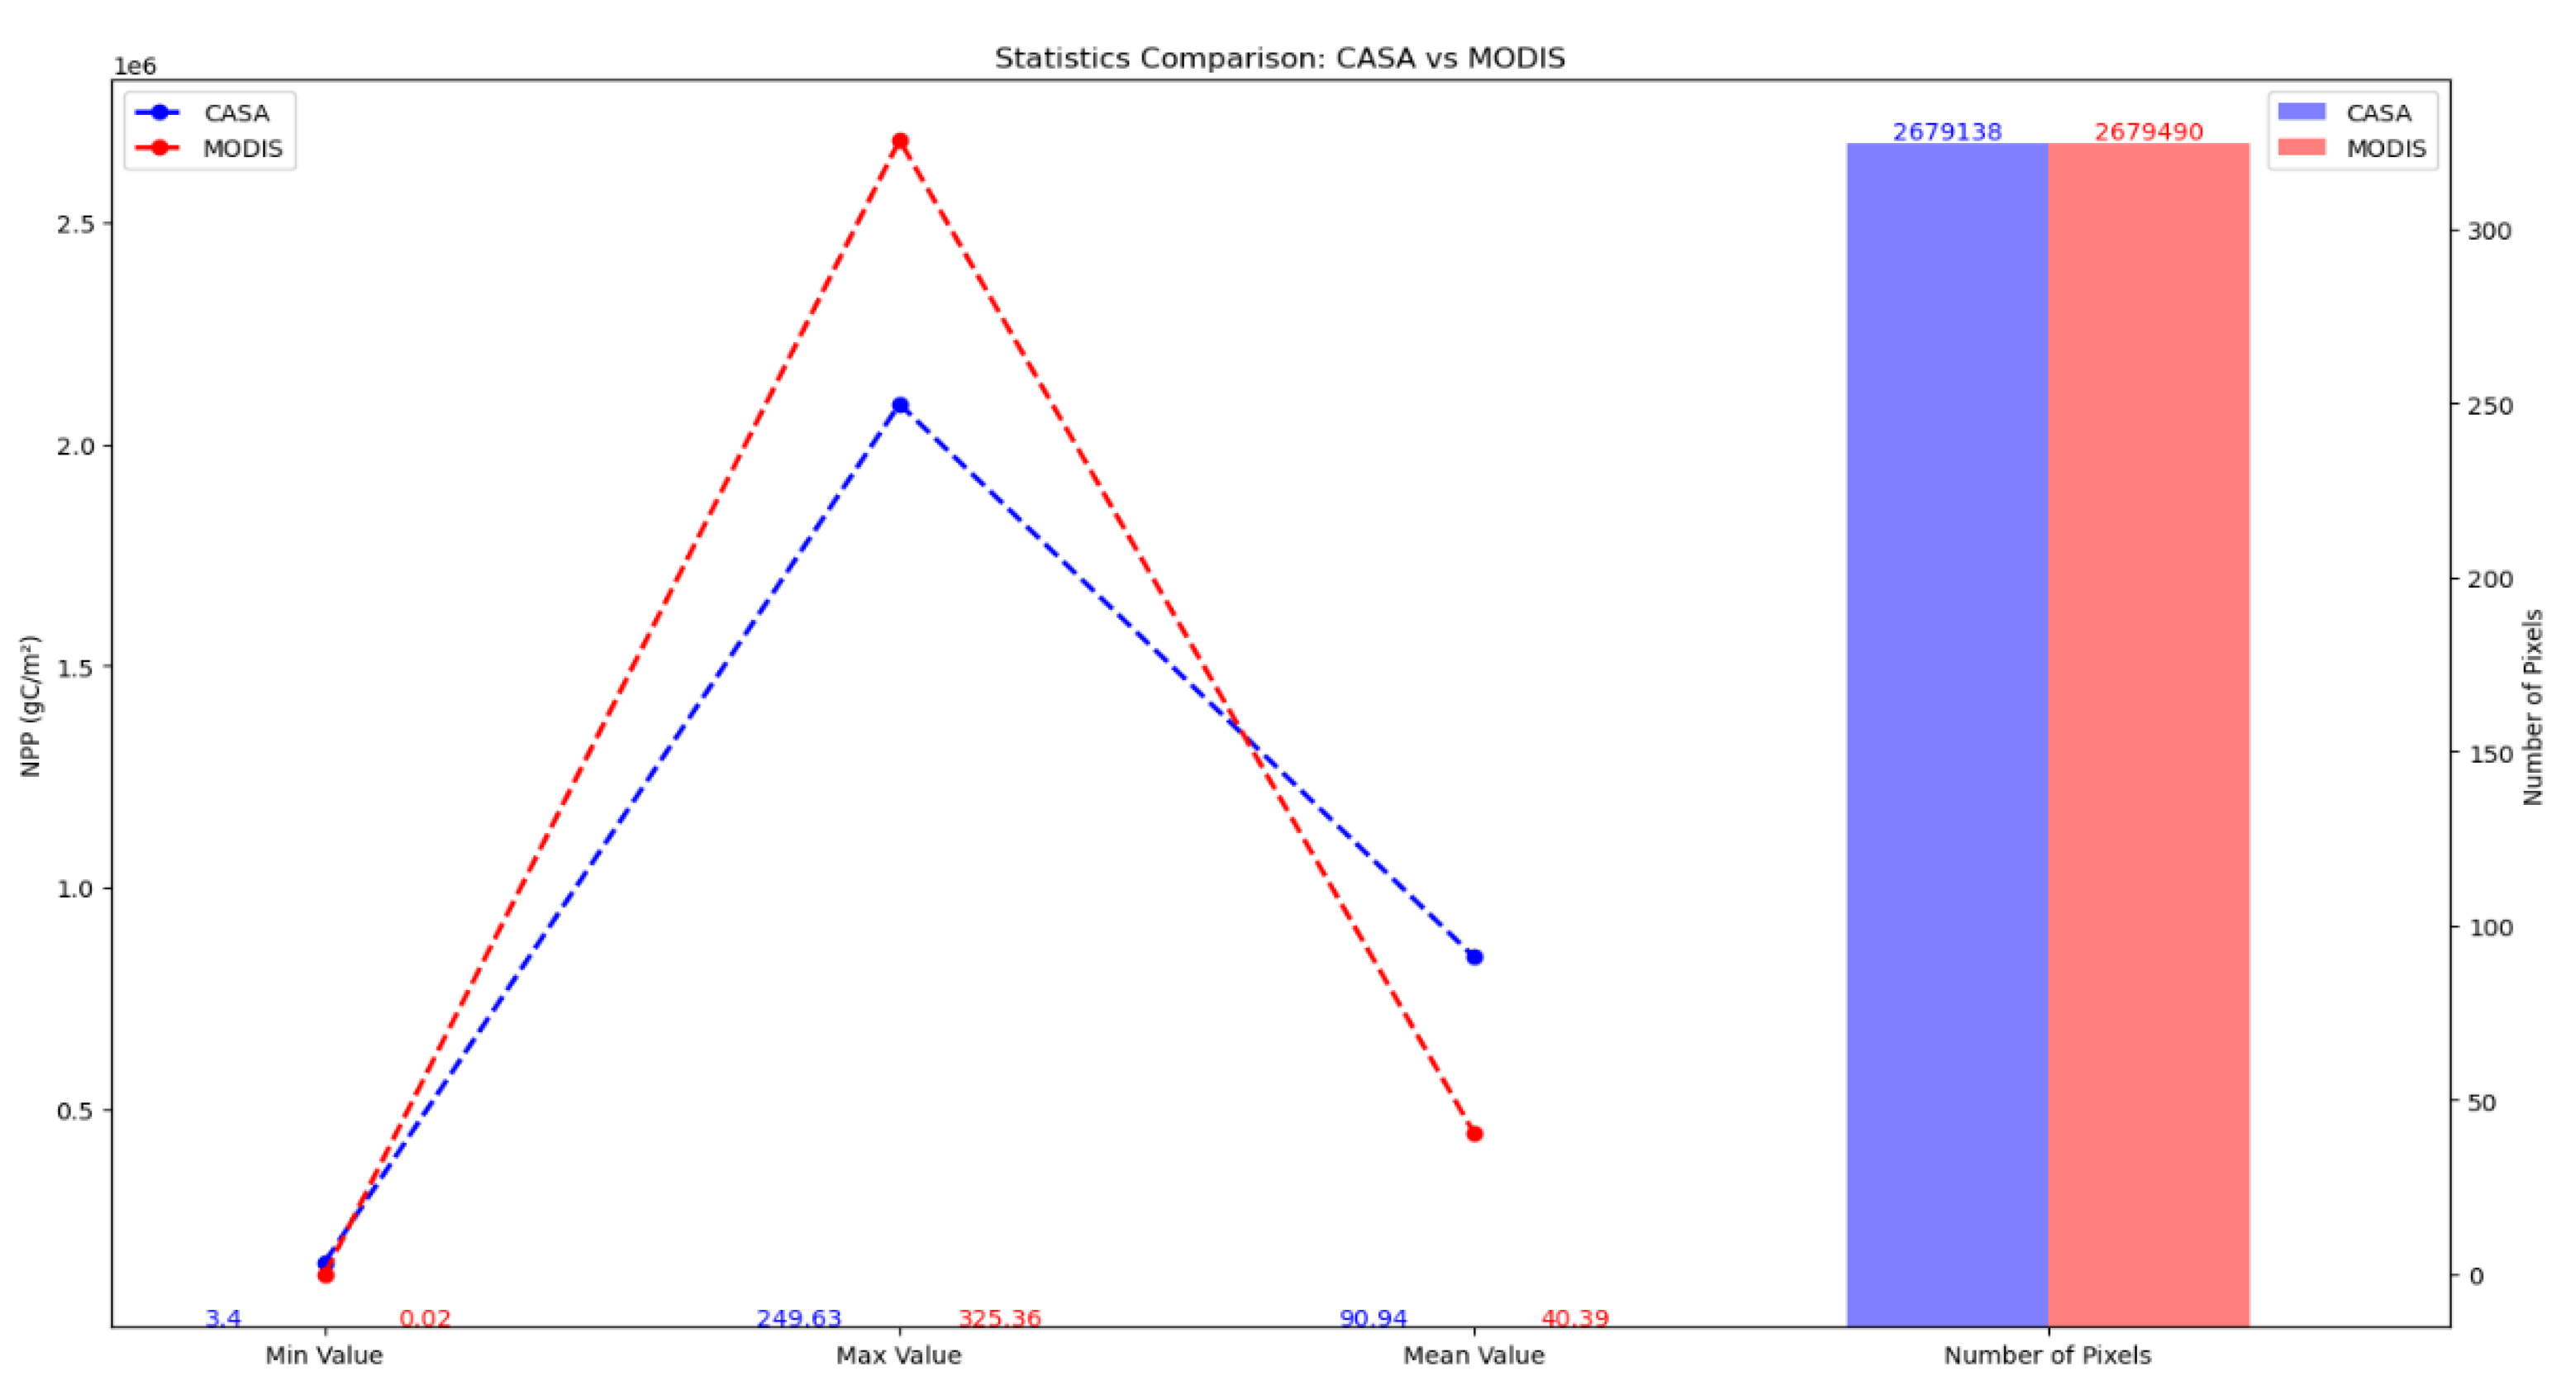
The annual cumulative NPP for Tianzhu County in 2020 was computed using the CASA model. The results show that in 2020, Tianzhu County had annual cumulative net primary productivity (NPP) ranging from 249.63 gC/m² to 3.40 gC/m² in 2020, with a total of 134,674.65 tons of carbon produced by the forest. The highest NPP of these was found in shrub forests, which accounted for 85.34% of the county’s total forest NPP with 114,925.93 tons of carbon. Following with 18,590.86 tons of carbon, or 13.80%, were coniferous forests. Because of their smaller distribution area, broad-leaved forests accounted for 0.57% of total tons, or 765.41 tons. With a total area of 392.44 tons, mixed forests accounted for the smallest percentage of the county’s total forest NPP.
By clipping and extracting of the MODIS17A data, it was discovered that in 2020, the annual cumulative NPP for Tianzhu County ranged from a maximum of 325.36 gC/m² to a minimum of 0.02 gC/m². The highest values were mostly concentrated in coniferous forests, followed by shrub forests. Compared to the results from the CASA model, the maximum value was roughly 75.73 gC/m² higher. The forest net primary productivity totaled 171,728.32 tons of carbon. Among these, broad-leaved forests had the highest NPP, totaling 94,737.11 tons of carbon, accounting for 55.17% of the county’s total forest NPP. Coniferous forests followed with 45,488.07 tons of carbon, accounting for 26.47%. Mixed forests totaled 6,212.94 tons, accounting for 3.62%. Shrub forests totaled 25,290.20 tons, accounting for 14.73%.
Figure 10 shows that the NPP values calculated using the CASA model primarily fall into the following ranges: 67.13 gC/m² to 75.82 gC/m², 75.82 gC/m² to 83.55 gC/m², 83.55 gC/m² to 89.35 gC/m², 89.35 gC/m² to 95.13 gC/m², 95.13 gC/m² to 102.86 gC/m², and 102.86 gC/m² to 111.55 gC/m². Observational data from MODIS, on the other hand, shows that the NPP values are more evenly distributed, with the highest values ranging between 43.18 gC/m² and 44.72 gC/m². The disparity arises primarily because the MOD17A dataset comes from the BIOME-BGC model, which uses Terra satellite observations for surface reflectance, surface temperature, and vegetation indices[39]. To estimate NPP, this model simulates the photosynthesis process of vegetation by considering variables like light absorption, photosynthesis rate, and stomatal conductance. It also makes adjustments for regional climate conditions, soil types, and vegetation types. Conversely, the CASA model is an ecosystem process-based model that uses more intricate ecological theories and mathematical equations to simulate vegetation growth and photosynthesis. The CASA model might incorporate more ecosystem processes and regional characteristics compared to the MODIS17A dataset, which focuses on using remote sensing data for global ecosystem monitoring and estimation. To ensure more precise results, this study estimated the amount of forest carbon storage in Tianzhu County using data from the forest resource inventory without relying on land cover data. Consequently, compared to MODIS observational data, the CASA model is relatively better at accurately reflecting the NPP values of Tianzhu’s forests. As a result, the carbon density and storage estimates are more accurate.
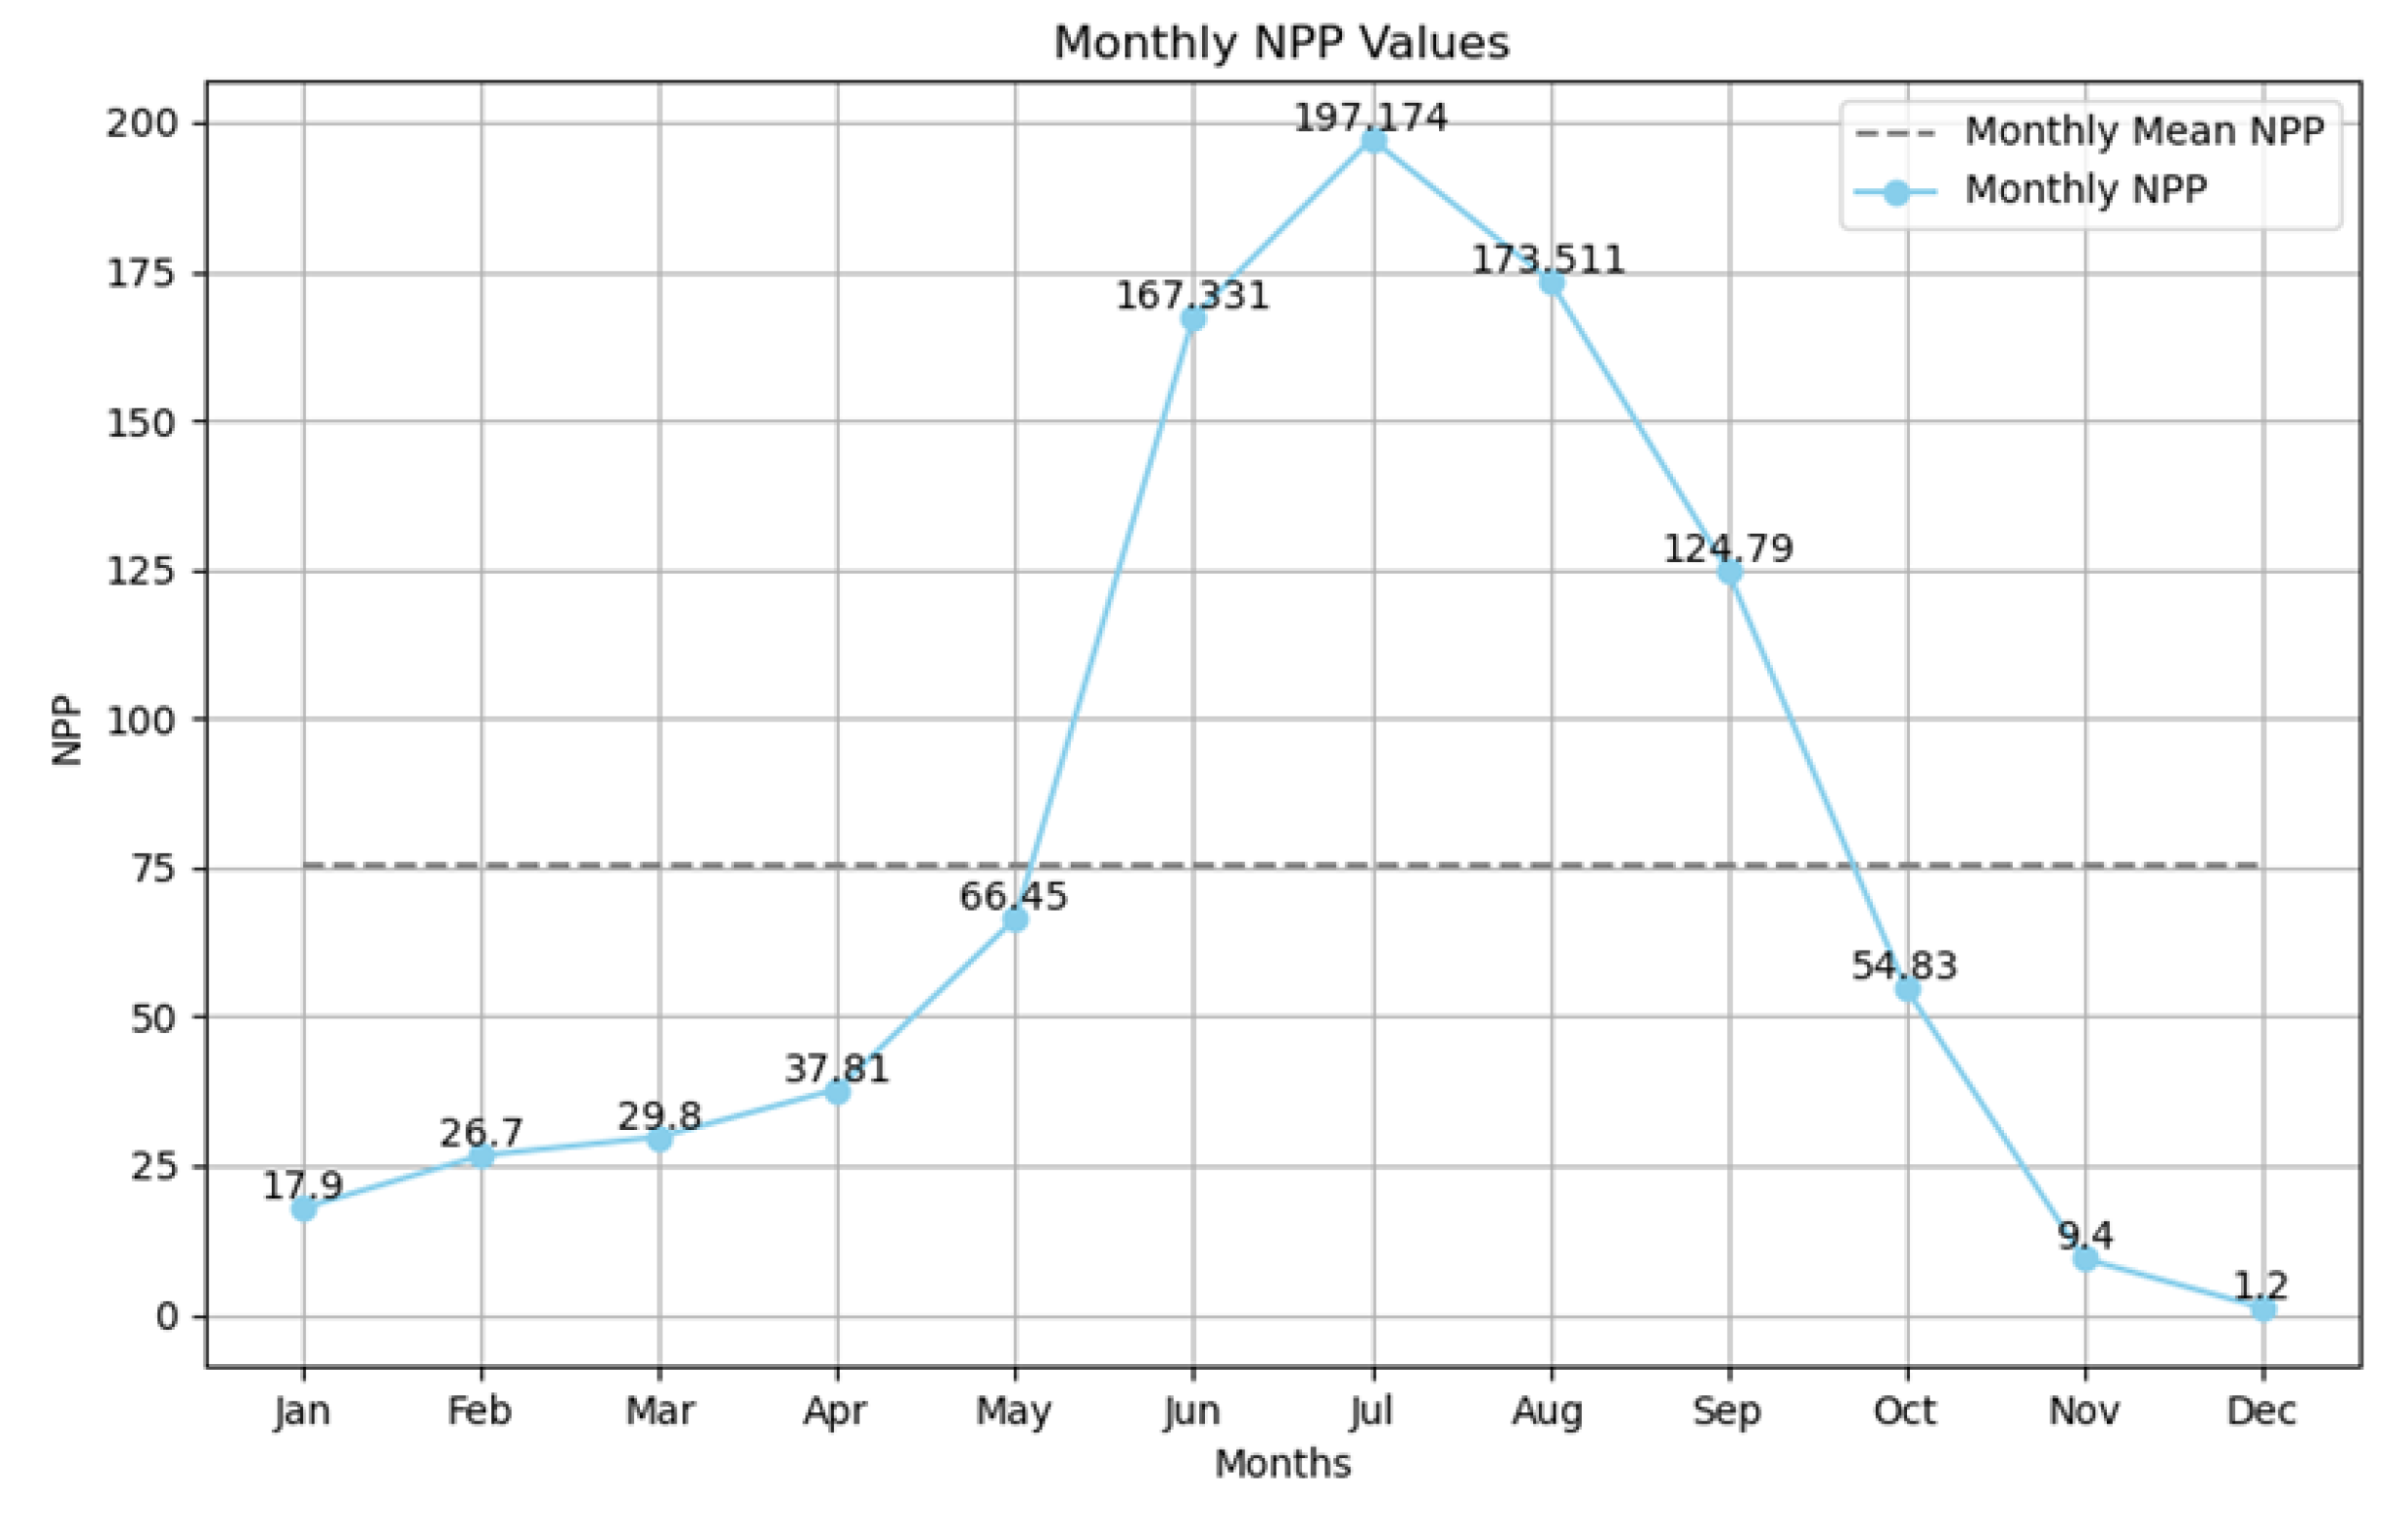
According to the NPP estimation results from January to December 2020, the overall trend of the NPP in Tianzhu County was first rising and then declining. In January, the average NPP was relatively low at 17.9 gC/m². The NPP displayed a dispersed distribution in terms of geography. High-value areas were mostly found in some mixed forest regions, while extremely low NPP values were found in coniferous forests, broad-leaved forests, and shrub forests. Based on the 2020 data, the NPP in Tianzhu County peaked in July at an average of 191.17 gC/m². Shrub forests had a more uniform NPP distribution with a dispersed spatial pattern than high-value NPP areas, which were mixed forests. The average NPP in June was 167.33 gC/m², showing a distinct upward trend from January to June based on the temporal and spatial variations in NPP. The highest annual value was in July, at 191.17 gC/m². From January to July, the monthly average NPP changed at a rate of 25.60 gC/(m²· month). However, from August to December, NPP showed a notable downward trend, with the average falling to 1.2 gC/m² in December, which was lower than the average NPP in January. In August through December, the monthly average NPP changed at a rate of -39.19 gC/(m²·month). After August, there was a corresponding drop in vegetation productivity levels as precipitation and temperature started to decline.
Figure 12.
Monthly Forest NPP in Tianzhu County from January to December 2020 (30m).
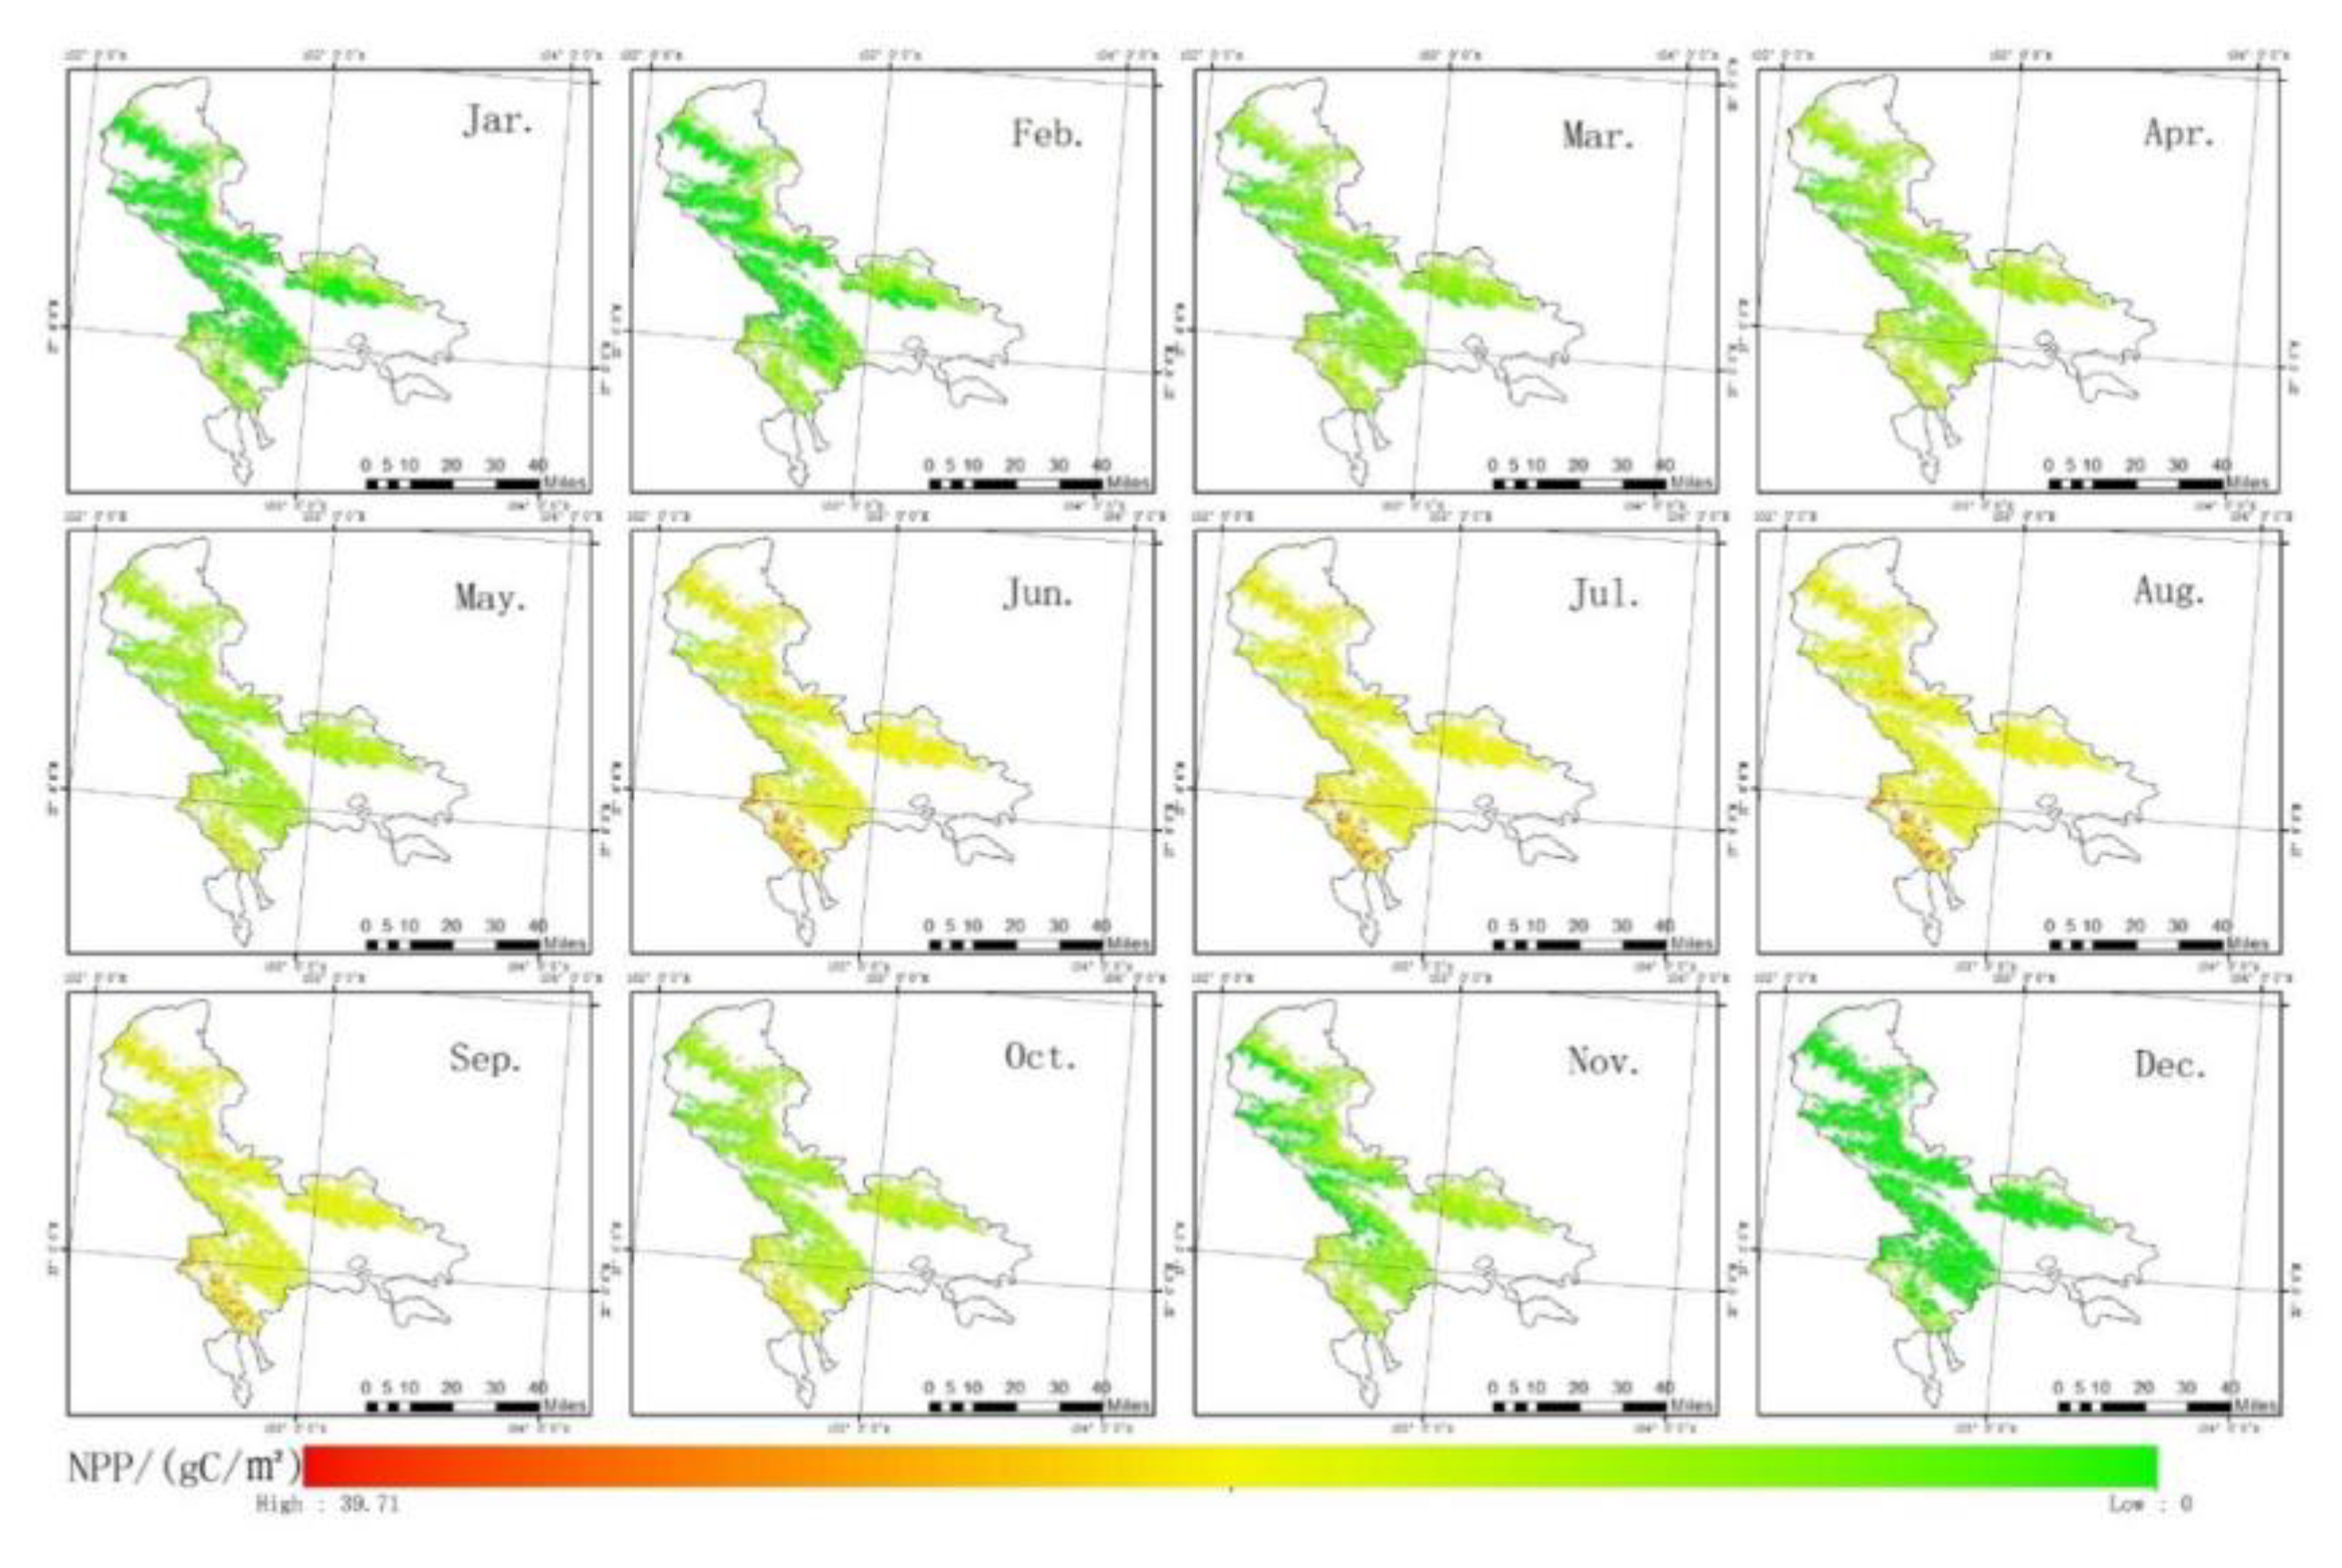
Figure 13.
Monthly Average Forest NPP in Tianzhu County from January to December 2020.
3.2. Estimation of Carbon Storage and Carbon Density
By creating a plant decay model, the estimation of forest carbon storage and carbon density in Tianzhu County was conducted based on the estimation of NPP at a 30m resolution. The calculations are as follows[34]:
𝐵𝐷𝑖 = 𝑁𝑃𝑃 × 0.565
𝐶𝑖 = 𝐵𝐷𝑖 × 𝐴𝑖 × 𝐶𝐹𝑖
In the equation: “Di” refers to biomass density of forest vegetation type (t/hm²)
“Ci” refers to forest carbon storage of vegetation type
“BAi” refers to forest area of vegetation type
“CFi” refers to carbon content rate of dominant tree species in forest vegetation type
The carbon content rates for each tree species have been calculated as indicated in Table 4 based on the dominant tree species in the forests of Tianzhu County, with reference to the Guidelines for Carbon Sequestration Measurement and Monitoring in Afforestation Projects (LY/T 2253-2014) and pertinent literature[40,41,42,43].
The estimation results show that Tianzhu County’s forests store 361,700 tons of carbon overall at the pixel scale. Among these, shrub forests store the most carbon (313,600 tons), making up 86.70% of Tianzhu County’s total forest carbon storage. Next is the carbon storage of coniferous forest vegetation at 46,500 tons, accounting for 12.86% of the total carbon storage. Broad-leaved and mixed forests store 1,100 and 500 tons of carbon respectively, accounting for 0.30% and 0.14% of the total carbon storage.
4. Discussion and Findings
4.1. Discussion
The NPP of the research area was determined using the CASA model based on data from the forest resource inventory and remote sensing, and the plant decay model was used to estimate the amount of carbon stored in the forest at the pixel level in Tianzhu County. Since the model only involves parameters such as monthly average temperature, total monthly precipitation, monthly NDVI, and total monthly net solar radiation, there are not many data points available for comparison. Therefore, it is necessary to incorporate more field survey data to optimize the model. The theoretical foundation and viability for a comprehensive and large-scale estimation of above-ground biomass are provided by this study. It is possible to ensure better forest ecology and increased capacity for sequestering carbon in the future planning and management of forest resources. This will facilitate an overall increase in forest carbon storage, promoting the achievement of “double carbon” and carbon reduction goals. Additionally, it provides a framework for “carbon trading”, preventing overselling or underselling scenarios.
4.2. Findings
- The total forest area in Tianzhu County is 25,606.325 km². Coniferous forests, broad-leaved forests, mixed forests, and shrub forests make up the majority of the vegetation types; they make up 20.69%, 2.78%, 2.34%, and 74% of the total area, respectively.
- According to the CASA model calculations, the annual cumulative NPP in Tianzhu County for 2020 ranged from a maximum of 249.63 gC/m² to a minimum of 3.40 gC/m², with a total forest net primary productivity of 134,674.65 tons of carbon. Of these, shrub forests accounted for 114,925.93 tons of carbon, representing 85.34% of the total; coniferous forests accounted for 18,590.86 tons of carbon, representing 13.80%; broad-leaved forests accounted for 765.41 tons, representing 0.57%; and mixed forests accounted for 392.44 tons, representing 0.29%. Based on MODIS17A observational data, the annual cumulative NPP ranged from a maximum of 325.36 gC/m² to a minimum of 0.02 gC/m², with a total forest net primary productivity of 171,728.32 tons of carbon. Of these, broad-leaved forests accounted for 94,737.11 tons of carbon, representing 55.17%; coniferous forests accounted for 45,488.07 tons of carbon, representing 26.47%; mixed forests accounted for 6,212.94 tons, representing 3.62%; and shrublands accounted for 25,290.20 tons, representing 14.73%.
- Tianzhu County has 361,700 tons of total forest carbon stored at the pixel level. With 313,600 tons, or 86.70% of total carbon storage, shrub forests have the highest carbon storage capacity. Coniferous forest vegetation has a carbon storage of 46,500 tons, accounting for 12.86%. Broad-leaved forest and mixed forest have a carbon storage of 1,100 tons and 500 tons, respectively, accounting for 0.30% and 0.14%.
References
- Li, L. Estimation of Forest Carbon Storage and Response of NPP to Climate Change in the Altai Mountains [D]. Xinjiang Agricultural University, 2019. [CrossRef]
- We, D. Temporal and Spatial Changes of Forest Biomass in China and Its Response to Climate Change [D]. Nanjing Forestry University, 2018.
- Binglun, W.; Ming, C.; Sixiang, Q.; et al. Assessment and Analysis of Forest Ecosystem Carbon Storage in the Ecological Green Heart Area of the Chang-Zhu-Tan Urban Agglomeration [J/OL]. Journal of Northwest Forestry University Retrieved April 29, 2024. 1–10.
- Yuqing, X.; Fengjin, X.; Li, Y. Review of the Spatiotemporal Distribution of Net Primary Productivity in Chinese Forest Ecosystems and Its Response to Climate Change. Acta Ecologica Sinica, 2020, 40, 4710–4723. [Google Scholar]
- Yue, F.; Yongjie, Y.; Pengwu, Z. Research Progress on Forest Carbon Storage Accounting and Carbon Sequestration Potential Evaluation under the Carbon Neutral Vision [J/OL]. Journal of Inner Mongolia Agricultural University (Natural Science Edition) Retrieved April 29, 2024. 2024, 1–8. [Google Scholar]
- Liu Wenyao. Making Facility Agriculture the “Engine” for Promoting Scientific Development in Tianzhu—Thoughts on the Development of Facility Agriculture in Tianzhu County. Gansu Agriculture 2010, 60–63. [CrossRef]
- He Junsheng, Gong Dajie, Huang Qitong, et al. Study on the Diversity and Zoogeography of Terrestrial Wild Vertebrates in Tianzhu County, Qilian Mountains. Journal of Arid Land Resources and Environment, 2020, 34, 148–155. [Google Scholar] [CrossRef]
- Wang Meiwen. Study on the Environmental Status of the Wushaoling Area in the Qilian Mountains Based on the PSR Model [D]. Huazhong University of Science and Technology, 2019. [CrossRef]
- The data set is provided by Geospatial Data Cloud site, Computer Network Information Center, Chinese Academy of Sciences. (http://www.gscloud.cn).
- Peng, S. (2020). 1-km monthly precipitation dataset for China (1901-2022). National Tibetan Plateau / Third Pole Environment Data Center. [CrossRef]
- Peng, S. (2020). 1-km monthly maximum temperature dataset for China (1901-2022). National Tibetan Plateau / Third Pole Environment Data Center. [CrossRef]
- Gao, J. , Shi, Y., Zhang, H., Chen, X., Zhang, W., Shen, W., Xiao, T., Zhang, Y. (2023). China regional 250m normalized difference vegetation index data set (2000-2023). National Tibetan Plateau / Third Pole Environment Data Center. https://cstr.cn/18406.11.Terre.tpdc.300328. [CrossRef]
- Hersbach, H.; Bell, B.; Berrisford, P.; Biavati, G.; Horányi, A.; Muñoz Sabater, J.; Nicolas, J.; Peubey, C.; Radu, R.; Rozum, I.; Schepers, D.; Simmons, A.; Soci, C.; Dee, D.; Thépaut, J.-N. (2023): ERA5 hourly data on single levels from 1940 to present. Copernicus Climate Change Service (C3S) Climate Data Store (CDS). [CrossRef]
- Running, S. Mu, M. Zhao. <italic>MODIS/Terra Gross Primary Productivity 8-Day L4 Global 500m SIN Grid V061</italic>. 2021, distributed by NASA EOSDIS Land Processes Distributed Active Archive Center.
- Wenquan, Z.; Yaozhong, P.; Jinshui, Z. Remote Sensing Estimation of Net Primary Productivity of Terrestrial Vegetation in China. Chinese Journal of Plant Ecology 2007, 413–424. [Google Scholar] [CrossRef]
- Wenquan, Z.; Yaozhong, P.; Hao, H.; et al. Simulation of Maximum Light Use Efficiency for Typical Vegetation in China. Chinese Science Bulletin 2006, 700–706. [Google Scholar]
- Simulation of Maximum Light Use Efficiency for Some Typical Vegetation Types in China. Chinese Science Bulletin 2006, 457–463.
- QGIS.org, 2024. QGIS Geographic Information System. QGIS Association. http://www.qgis.org.
- R Core Team (2024). _R: A Language and Environment for Statistical Computing_. R Foundation for Statistical Computing, Vienna, Austria. https://www.R-project.org/.
- Hijmans R (2023). _raster: Geographic Data Analysis and Modeling_. R package version 3.6-26, https://CRAN.R-project.org/package=raster.
- Pebesma, E.; Bivand, R. (2023).Spatial Data Science: With Applications in R. Chapman and Hall/CRC. [CrossRef]
- Bivand, R.; Keitt, T.; Rowlingson, B. (2023). _rgdal: Bindings for the 'Geospatial' Data Abstraction Library_. R package version 1.6-7, https://CRAN.R-project.org/package=rgdal.
- Python Software Foundation. (2024). Python (Version 3.12) [Software]. Available from https://www.python.org/.
- JetBrains. (2024). PyCharm Community Edition (Version 2024.1.1) [Software]. Available from https://www.jetbrains.com/pycharm/.
- Anaconda, Inc. (2024). Anaconda Distribution (Version 24.4.0) [Software]. Available from https://www.anaconda.com/.
- Microsoft Corporation. (2024). Microsoft Excel (Version 2024) [Software]. Available from https://www.microsoft.com/.
- Microsoft Corporation. (2024). Microsoft Word (Version 2021) [Software]. Available from https://www.microsoft.com/.
- Jiyuan, L.; Zengxiang, Z.; Shuwen, Z.; et al. Review and Prospect of Remote Sensing Research on Land Use Change in China—Guided by the Academic Thought of Chen Shupeng. Journal of Geo-Information Science 2020, 22, 680–687. [Google Scholar]
- Potter, C.S.; Randerson, J.T.; Field, C.B.; et al. Terrestrial ecosystem production: A process model based on global satellite and surface data. Global Biogeochemical Cycles 1993, 7, 811–841. [Google Scholar] [CrossRef]
- Shilong, P.; Jingyun, F.; Qinghua, G. Estimating Net Primary Productivity of Vegetation in China Using the CASA Model. Chinese Journal of Plant Ecology 2001, 603–608. [Google Scholar]
- Feng, Z.; Guangsheng, Z.; Yuhui, W. Dynamic Simulation of Net Primary Productivity of Typical Grassland Vegetation in Inner Mongolia Based on the CASA Model. Chinese Journal of Plant Ecology 2008, 32, 786–797. [Google Scholar]
- Wenrui, L.; Xiaoting, L.; Tong, L.; et al. Analysis of the Characteristics of Forest Vegetation NPP Changes and Their Influencing Factors in Yichun City Based on MODIS and CASA Model. Chinese Journal of Ecology, 2022, 41, 150–158. [Google Scholar]
- Zhe, L.; Xudong, G.; Chun, G.; et al. (2016). Inversion of Grassland Photosynthetic Effective Radiation Absorption Rate Based on Hyperspectral Absorption Characteristics. National Remote Sensing Bulletin 2016, 20, 290–302. [Google Scholar] [CrossRef]
- Zhenyu, Z. Estimation and Spatial Distribution of Forest Carbon Storage in Qingpu District Based on Forest Resource Inventory and Remote Sensing Data [D]. Shanghai Normal University, 2023. [CrossRef]
- Kajimoto, T.; Matsuura, Y.; Sofronov, M.A.; et al. Above- and belowground biomass and primary productivity of a Larix gmelinii stand near Tura, central Siberia. Tree Physiology 1999, 19, 815–822. [Google Scholar] [CrossRef] [PubMed]
- Kumar JI, N.; Sajish, P.R.; Kumar, R.N.; et al. Biomass and Net Primary Productivity in Three Different Aged Butea Forest Ecosystems in Western India, Rajasthan. Iranica Journal of Energy & Environment 2011, 2. [Google Scholar]
- Ford, E.D.; Lieth HF, H. Patterns of Primary Production in the Biosphere. Journal of Ecology 1978, 68, 323. [Google Scholar] [CrossRef]
- Roxburgh, S.H.; Berry, S.L.; Buckley, T.N.; et al. What is NPP? Inconsistent accounting of respiratory fluxes in the definition of net primary production. Functional Ecology 2005, 19, 378–382. [Google Scholar] [CrossRef]
- Mengjing, H. Remote Sensing Estimation of Natural Grassland Productivity in China and Study on the Causes of Its Spatiotemporal Changes [D]. Lanzhou University, 2023. [CrossRef]
- Shanghai Landscaping and City Appearance Administrative Bureau. DB31/T 1234-2020 Technical Regulations for Carbon Sequestration Measurement and Monitoring of Urban Forests [S]. Beijing:Standard Press of China, 2020.
- Yurong, Z.; Zhenliang, Y.; Shidong, Z. Carbon Storage and Carbon Balance of Major Forest Ecosystems in China. Chinese Journal of Plant Ecology 2000, 518–522. [Google Scholar]
- Weijie, Z.; Weikai, B.; Bing, G.; et al. (2007). Carbon Content and Characteristics of Terrestrial Higher Plants. Chinese Journal of Ecology 2007, 307–313. [Google Scholar]
- National Forestry Administration. Guidelines for Carbon Sequestration Measurement and Monitoring of Afforestation Projects (LY/T 2253-2014) [S]. Beijing: Standard Press of China, 2014.
Figure 10.
Comparison of NPP between the CASA Model and MODIS Observations.
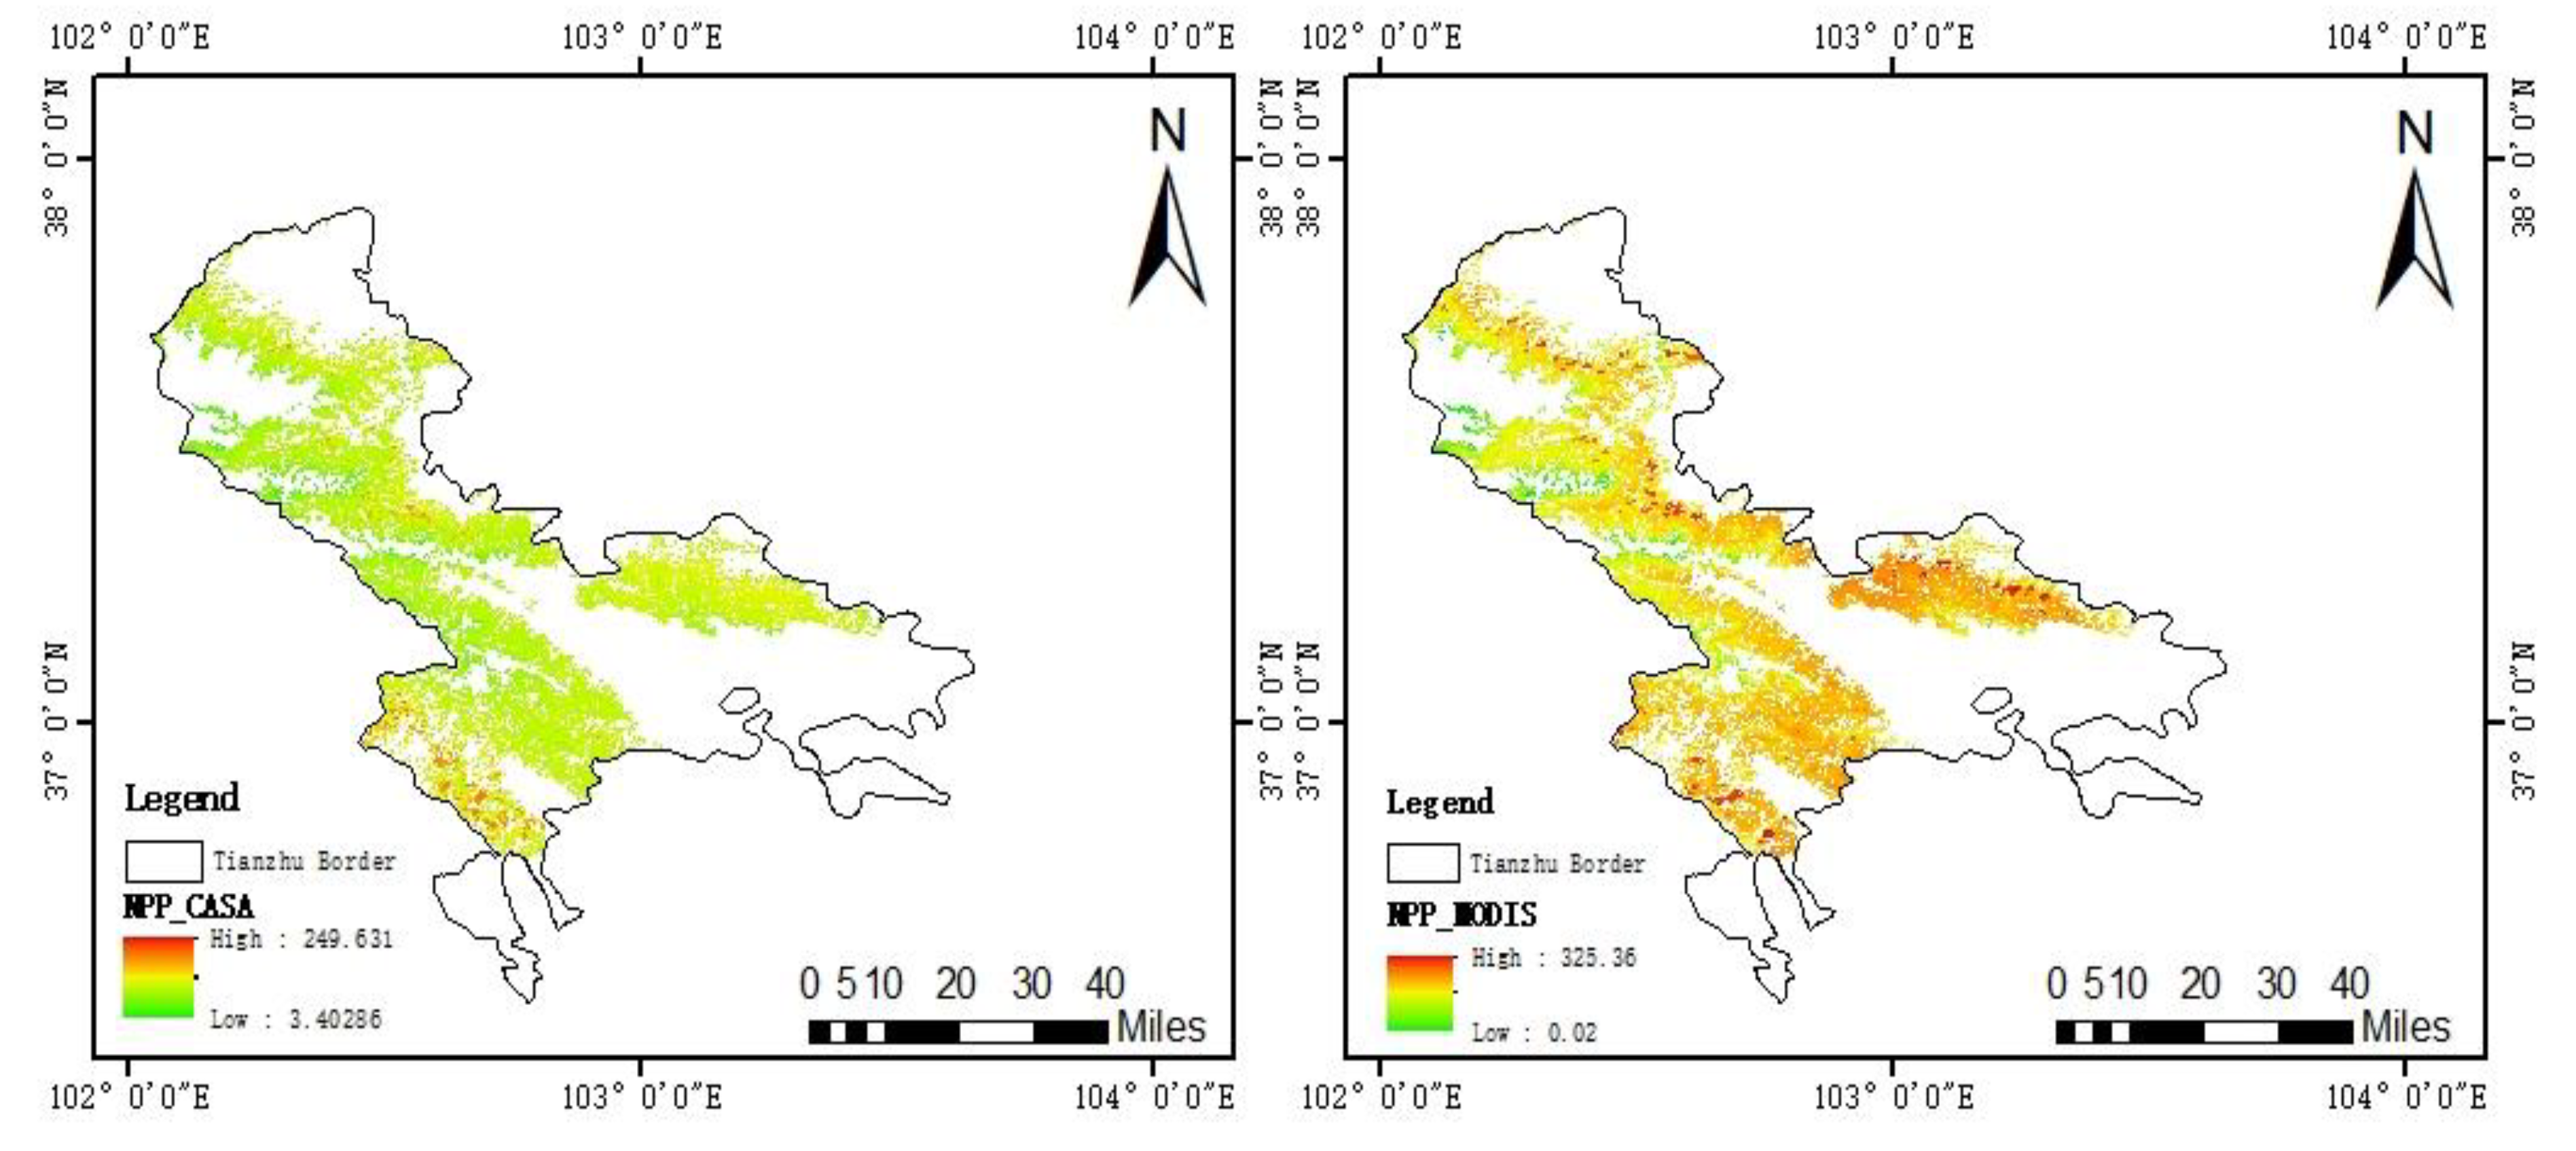
Figure 11.
NPP of Different Vegetation Types and Their Proportion of Forest NPP.
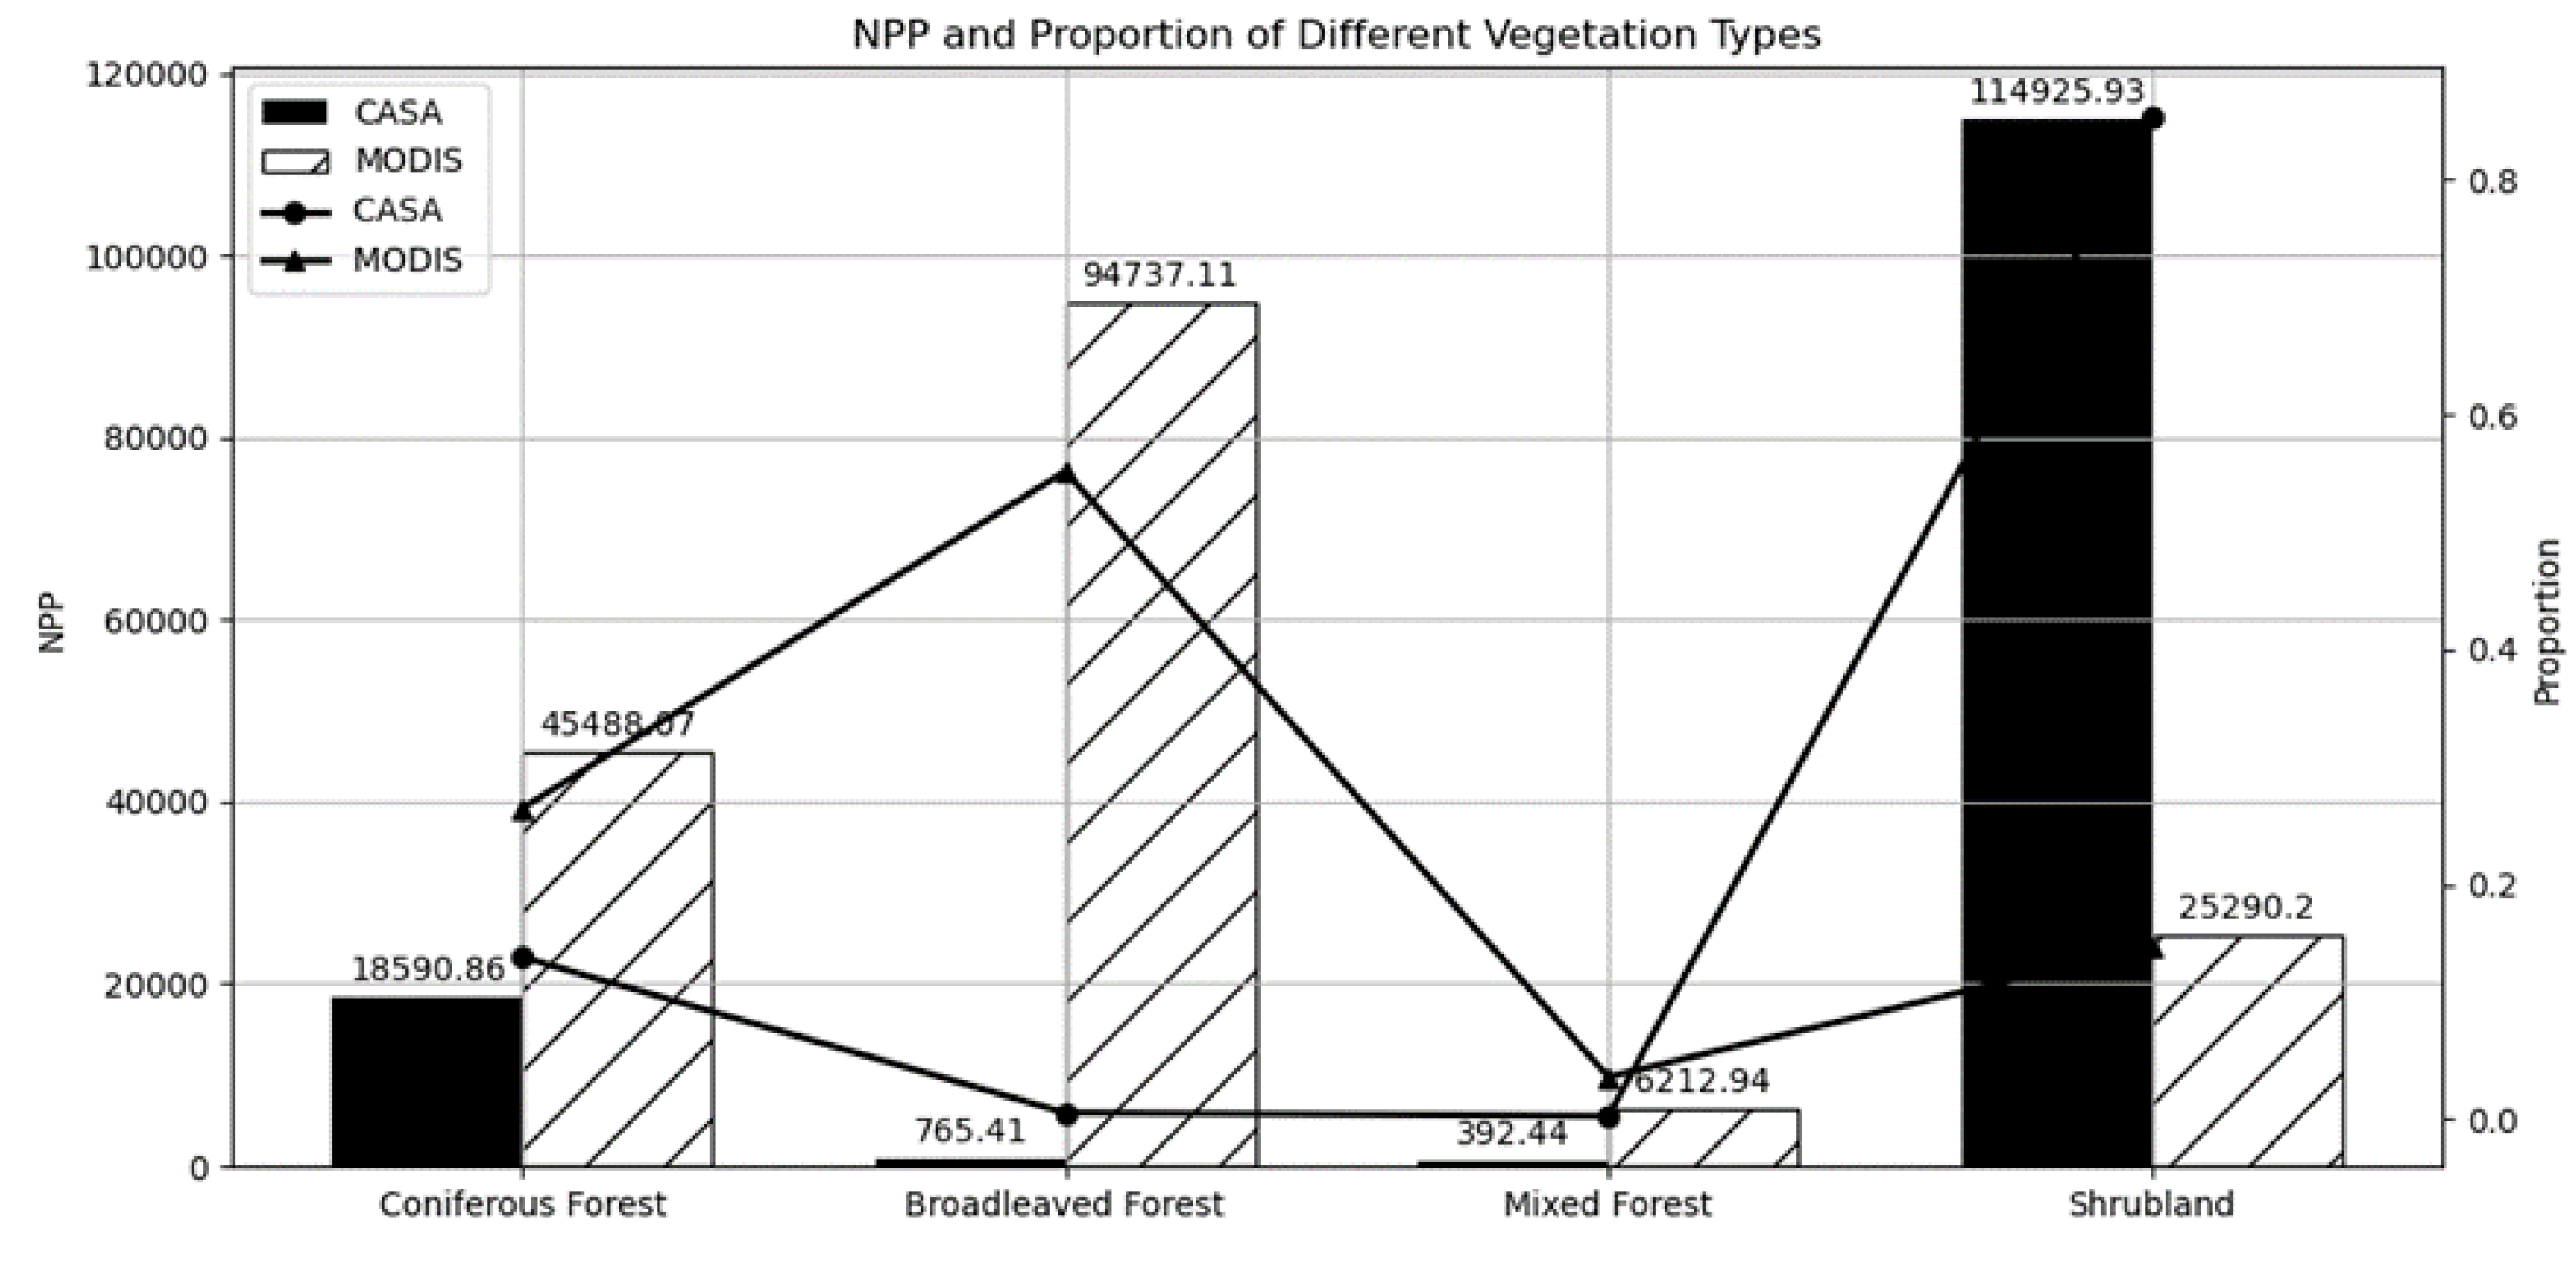
Table 2.
Distribution of Vegetation Types.
| Primary Classification | Secondary Classification | Third-level Classification |
| Forestland | Arboreal Forest | Coniferous Forest Broad-leaved Forest Mixed Forest |
| Shrub Forest | Dominant Shrub Other Shrubs |
Table 3.
Light Energy Utilization Rates of Different Vegetation.
| Code | Forest Type | NDVImax | NDVImin | SRmax | SRmin | Emax |
| 1 | Coniferous forest | 0.665 | 0.023 | 4.993212 | 1.05 | 0.437 |
| 2 | Broad-leaved Forest | 0.680 | 0.023 | 5.265886 | 1.05 | 0.839 |
| 3 | Mixed Forest | 0.672 | 0.023 | 5.131049 | 1.05 | 0.638 |
| 4 | Shrub Forest | 0.639 | 0.023 | 4.540166 | 1.05 | 0.429 |
Table 4.
Reclassification of NPP from CASA Model and MODIS Observations (Unit:gC/m2).
| No. | Range | No. | Range | No. | Range | No. | Range |
| C1 | 3.40-22.71 | C11 | 102.86-11.55 | M1 | 0.02-11.29 | M11 | 38.27-40.02 |
| C2 | 22.71-35.27 | C12 | 111.55-125.07 | M2 | 11.29-16.1 | M12 | 40.02-41.63 |
| C3 | 35.27-45.89 | C13 | 125.07-140.52 | M3 | 16.1-19.98 | M13 | 41.63-43.18 |
| C4 | 45.89-56.51 | C14 | 140.52-153.07 | M4 | 19.98-23.36 | M14 | 43.18-44.72 |
| C5 | 56.51-67.13 | C15 | 153.07-165.62 | M5 | 23.36-26.43 | M15 | 44.72- 46.42 |
| C6 | 67.13-75.82 | C16 | 165.62-177.21 | M6 | 26.43-29.35 | M16 | 46.42-48.54 |
| C7 | 75.82-83.55 | C17 | 177.21-185.90 | M7 | 29.35-32 | M17 | 48.54-52.64 |
| C8 | 83.55-89.35 | C18 | 185.90-194.59 | M8 | 32 -34.30 | M18 | 52.64-58.35 |
| C9 | 89.35-95.13 | C19 | 194.59-204.25 | M9 | 34.30-36.35 | M19 | 58.35-159.52 |
| C10 | 95.13-102.86 | C20 | 204.25-249.63 | M10 | 36.35-38.27 | M20 | 159.52-324.46 |
Table 5.
Carbon Content Rates of Dominant Tree Species.
| Code | Dominant Tree Species | CF |
| 120 | Qinghai spruce | 0.52 |
| 150 | larch | 0.521 |
| 200 | Chinese pine | 0.511 |
| 350 | Qilian juniper | 0.51 |
| 421 | poplar | 0.49 |
| 490 | Other hardwood broadleaved forests | 0.497 |
| 530 | birch | 0.496 |
| 590 | Other softwood broadleaved forests | 0.485 |
| 610 | Coniferous and mixed forest | 0.51 |
| 620 | Broad-leaved and mixed forest | 0.495 |
| 630 | Coniferous and broad-leaved mixed forest | 0.498 |
| 904-999 | Shrub forest | 0.483 |
Disclaimer/Publisher’s Note: The statements, opinions and data contained in all publications are solely those of the individual author(s) and contributor(s) and not of MDPI and/or the editor(s). MDPI and/or the editor(s) disclaim responsibility for any injury to people or property resulting from any ideas, methods, instructions or products referred to in the content. |
© 2024 by the authors. Licensee MDPI, Basel, Switzerland. This article is an open access article distributed under the terms and conditions of the Creative Commons Attribution (CC BY) license (http://creativecommons.org/licenses/by/4.0/).
Copyright: This open access article is published under a Creative Commons CC BY 4.0 license, which permit the free download, distribution, and reuse, provided that the author and preprint are cited in any reuse.


