Submitted:
12 June 2025
Posted:
13 June 2025
You are already at the latest version
Abstract
[Objectives] The major sugarcane-producing region of Guangxi represents a critical agricultural zone in China. Investigating the mechanisms of land use change and carbon storage dynamics in this area is essential for optimizing regional ecological security and promoting sustainable development.[Methods] Based on four-phase land use data (2011–2022), this study employed a land use transfer matrix and the Geodetector model to analyze spatiotemporal changes in carbon storage (assessed using the InVEST model) and identify key driving factors and their interactive effects.[Results] (1) From 2011 to 2022, total carbon storage in the study area fluctuated between 1,627.03 and 1,644.17 million tons, exhibiting a northwest-high, southeast-low spatial pattern, with high-value zones concentrated in mountainous regions and low-value areas in economically active lowlands. (2) Land use patterns significantly influenced carbon storage: forests remained the dominant contributor (>85% of total storage), while cropland and bare land initially declined before recovering. Grassland and water bodies showed sustained carbon loss, whereas construction land expansion drove carbon increases. (3) Land urbanization rate (q > 0.647) and cropland proportion (q > 0.656) were the primary drivers of spatial heterogeneity, followed by nighttime light index and forest coverage (q > 0.511). (4) Interaction analysis revealed strong synergistic effects among NDVI, forest coverage, and cropland proportion, with some factor combinations yielding q-values > 0.9, confirming multi-factor control over carbon storage changes.[Conclusions] Carbon storage in the Guangxi sugarcane-producing region is shaped by land use patterns and multi-factor interactions. Future strategies should optimize land use structures, strengthen forest conservation, and balance urbanization with ecological protection to enhance regional carbon sequestration.
Keywords:
carbon storage
; land use patterns
; InVEST model
; major sugarcane-producing regions of Guangxi
1. Introduction
Terrestrial ecosystem carbon storage plays a pivotal role in global carbon cycling [1], with its substantial carbon sequestration capacity and dynamic regulatory mechanisms representing an economically viable and ecologically sustainable approach to climate change mitigation [2]. As a critical nexus between atmospheric and geological carbon pools, the stability of terrestrial carbon reservoirs directly influences the equilibrium of global climate systems [3]. Land use transitions have emerged as the second largest anthropogenic carbon emission source after fossil fuel combustion [4]. Land use transition refers to the spatiotemporal conversion between different land use types driven by both human activities and natural processes [5], while carbon reservoirs represent storage compartments for carbon elements within terrestrial ecosystems, encompassing vegetation carbon pools [6], soil carbon pools [7], and other components. Distinct land use types exhibit varying carbon storage capacities, and land use/land cover (LULC) changes, such as forest conversion to cropland or grassland can significantly disrupt the balance of ecosystems, climate, and carbon cycling processes [8]. Consequently, investigating the mechanisms linking land use transitions and carbon pool responses will not only enhance understanding of terrestrial ecosystems' role in global carbon cycling, but also facilitate the development of scientific climate change adaptation strategies and promote sustainable ecosystem management.
Early research on carbon storage predominantly depended on forest resource inventories [9] and soil survey data [10], concentrating on the impacts of singular land use changes such as deforestation and afforestation, employing biomass expansion factor methods to estimate static carbon storage. However, such studies were constrained by data resolution limitations in quantifying the composite effects of multi-category land use transitions and dynamic carbon pool processes. With recent advancements in remote sensing technology and ecological modeling, researchers have begun integrating multi-source data including Landsat imagery [11] and soil carbon density grids [12], utilizing land use transition matrices to quantify land category conversion trajectories while combining various approaches: the CENTURY model based on biogeochemical cycle principles [13], the CA-Markov model focusing on spatial simulation of land use evolution [14], and the InVEST model for integrated ecosystem multifunction assessment [15]. Concurrently, numerous studies have employed multi-model coupling to achieve complementary advantages, such as combining the 3-PGS model with the Bookkeeping model [16], overcoming the limitations of single models in characterizing carbon cycle processes and predicting terrestrial ecosystem carbon storage changes. The PLUS model [17] can integrate land expansion simulation with spatial competition mechanisms and has been used for land use change prediction in complex terrains; the IBIS model [18] can simulate vegetation dynamic carbon density under different LUCC or climate scenarios; the FLUS model [19] can simulate land use evolution pathways under various policy or development scenarios; when combined with the InVEST model through localization of carbon module parameters [20], it enhances regional carbon storage estimation accuracy and strengthens multidimensional analytical capabilities for land use transition and carbon pool response mechanisms. In terms of research scale, macro-level studies primarily focus on national [21], provincial administrative regions [12] or typical urban agglomerations [19], analyzing the macro-level impacts of land management on carbon storage, while meso-scale studies concentrate on typical agricultural areas [7] or key forestry carbon sink regions [15]. In the field of sugarcane cultivation carbon sinks, existing research predominantly based on field experiments analyzes the impacts of agricultural practices like fertilization [22], expanded planting areas [23], and leaf burning [24] on soil carbon pools, or measures sugarcane's carbon sequestration capacity through biomass calculations [25], but systematic analysis of "dynamic transitions between sugarcane fields and other land categories - carbon pool responses" remains scarce. Forestry carbon sink research emphasizes regional forest carbon storage estimation [26] or explores the carbon sequestration enhancement benefits of afforestation projects [27], yet comprehensive understanding of the impacts of land use transitions between forest and agricultural land on regional carbon pools remains incomplete, with the synergistic mechanisms of sugarcane-forest composite systems still unclear, limiting precise exploration of regional carbon sink potential.
The major sugarcane-producing regions of Guangxi, located in South China, encompass core production areas including Nanning, Chongzuo, and Laibin, accounting for over 58% of China's total sugarcane cultivation area and serving as the nation's pivotal sugar industry base [28]. As a critical gateway connecting the China-ASEAN Free Trade Area, Guangxi's sugarcane sector holds dual significance for both national sugar security strategies and regional ecological security coupled with low-carbon development [29]. Recent years have witnessed dramatic land use transformations driven by urbanization and agricultural restructuring, with intensive conversions among forest, cultivated, and construction lands exerting substantial impacts on regional carbon storage, necessitating urgent scientific assessment of carbon response mechanisms. This study integrates 30m-resolution Landsat data with the InVEST model to systematically elucidate spatiotemporal response patterns of carbon pools to land use transitions during 2011-2022, while employing Geodetector to quantitatively identify key driving factors. The findings aim to provide scientific support for optimizing land resource allocation and enhancing carbon sequestration capacity, facilitating Guangxi's dual objectives of agricultural sustainability and carbon neutrality.
2. Materials and Methods
2.1. Study Area
The major sugarcane-producing regions of Guangxi encompass 46 counties/districts (Figure 1), covering approximately 12.18 million hectares (51.26% of Guangxi's total area), located in western South China (106°-110°E, 20°-25°N) and bordering Wuzhou to the east, the Beibu Gulf to the south, Yunnan to the west, and Guizhou to the north. The terrain exhibits a distinct northwest-high, southeast-low gradient, dominated by mountains and hills (>70% of total area) with limited plains and terraces, while karst landscapes span 70 counties, constituting 41% of Guangxi's territory. The region features a subtropical monsoon climate with warm temperatures (mean annual ~22.5°C), high humidity (frost-free period >330 days), and concentrated summer rainfall (~1800 mm annual precipitation) with ~1500 h annual sunshine.
As China's largest sugarcane production base, the study area cultivates sugarcane across >800,000 ha, where high-yield, high-sugar cultivars (e.g., GT42 and GL05136) show widespread adoption. Since Guangxi initiated high-productivity sugarcane base trials in 2014 [30] and the industry's national strategic elevation in 2015[31], cultivation has transitioned toward mechanized and modernized models, supported by concentrated sugar-processing industries and a complete sugarcane value chain.
2.2. Data Sources
The research data encompassed land use, natural factors, and socioeconomic data from 2011 to 2022 with a spatial resolution of 30m×30m (GCS_WGS_1984 coordinate system). According to the geographical characteristics of the study area, land use types were classified into six categories: cultivated land, forest, grass, water, barren, and construction land. Detailed data are presented in Table 1.
2.3. Methods
The research methodology begins with preprocessing Landsat satellite imagery combined with natural and socioeconomic driving factors, enabling comprehensive analysis of land use spatiotemporal dynamics. Subsequent application of the Integrated Valuation of Ecosystem Services and Tradeoffs (InVEST) model facilitates precise quantification of regional carbon stocks. Geographic detector analysis then reveals the principal mechanisms governing carbon storage variations. The study concludes by developing optimization strategies that account for methodological constraints, with the complete analytical framework diagrammatically presented in Figure 2.
2.3.1. Land Use Transfer Matrix
The land use transfer matrix [32] serves as a quantitative analytical method for examining spatiotemporal transition patterns of regional land-use types. This methodology establishes a two-dimensional matrix of land-use conversions between different time periods, systematically elucidating the evolutionary characteristics of land-use structure and spatial transformation trajectories, thereby providing scientific evidence for optimizing land resource allocation and ecological conservation. The computational formula is presented below:
The formula is expressed as: S represents land area (km²); Smn denotes the area converted from land-use category m to category n between the initial and final study periods (m=1,2,...i; n=1,2,...i), where i indicates the total number of land-use types.
2.3.2. InVEST Model
This study employed the Carbon Storage and Sequestration module of the InVEST model to estimate carbon storage in Guangxi's major sugarcane-producing regions. Based on four-phase land use/cover data, the model calculated carbon storage across different time periods.
The carbon storage calculation formula is as follows:
C_total=C_above+C_below+C_soil+C_dead
Where: C_total represents the total ecosystem carbon storage; C_above denotes aboveground vegetation carbon storage; C_below indicates belowground biomass carbon storage; C_soil refers to soil carbon storage; and C_dead represents dead organic matter carbon storage. Considering the relatively minor contribution of dead organic matter to regional carbon cycling [33], this component was excluded from the accounting framework in this study.
Total carbon storage by land use type in the study area can be calculated by combining carbon density data with land use data:
where: C_total represents the total ecosystem carbon storage in the study area (t); Cj denotes the carbon storage per unit area of the j-th land use/cover type (t/km2);Aj indicates the spatial distribution area of the j-th land use type (km2); and i represents the total number of land use categories in the classification system.
Carbon density data were obtained from relevant literature and previous studies [34,35]. Within the same climate zone, carbon density variations among similar land use types were relatively minor [36]. This study adopted carbon density parameters from adjacent regions with comparable land use types as baseline values, which were subsequently adjusted according to the land use classification system. The specific corrected carbon density values are detailed in Table 2.
2.3.3. Geodetector
The Geodetector [37] is a statistical tool based on spatial heterogeneity theory, primarily used to analyze the spatial differentiation characteristics of geographical elements and their driving mechanisms. Its fundamental premise states that if a driving factor significantly influences the target variable, their spatial distributions should exhibit strong coupling. Building on previous research and considering the natural environmental characteristics and socioeconomic conditions of Guangxi's major sugarcane-producing regions, this study selected 17 key driving factors encompassing climatic factors, topographic factors, vegetation indices, and land use indicators to systematically analyze their regulatory effects on the spatial patterns of regional carbon storage. The analysis employed two functional modules of the Geodetector: (1) the single-factor detection module calculates the q-value (range [0,1]), where values closer to 1 indicate stronger explanatory power of the factor for spatial differentiation [38]; (2) the interaction detection module compares q-value differences between factor combinations (X1∩X2) and individual factors, classifying interaction effects into five types (e.g., nonlinear enhancement and bivariate enhancement) (Table 3) to reveal synergistic mechanisms among driving factors [39]. The specific algorithm is as follows:
In the model, h = 1, 2, ..., L represents the stratification of variable Y or factor X; Nh and N denote the number of sample units in the h-th stratum and the total number of units in the study area, respectively; σh and σ represent the variances of Y values in the h-th stratum and the entire region. Here, SSW indicates the sum of within-stratum variances, while SST represents the total variance of the entire region.

Table 3.
Interaction mode of independent variables on dependent variables.
| Description | Interaction |
| q(X1 ∩ X2) < Min(q(X1), q(X2)) | Weaken, nonlinear |
| Min(q(X1),q(X2))<q(X1 ∩ X2)<Max(q(X1), q(X2)) | Weaken, uni- |
| q(X1 ∩ X2) > Max(q(X1), q(X2)) | Enhance, bi- |
| q(X1 ∩ X2) = q(X1) + q(X2) | Independent |
| q(X1 ∩ X2) > q(X1) + q(X2) | Enhance, nonlinear |
3. Results
3.1. Evolution of Land Use Patterns
3.1.1. Spatiotemporal Characteristics of Land Use
Table 4 shows the area of land use types in Guangxi's major sugarcane-producing regions during the study period. From 2011 to 2022, forest and cultivated land dominated the regional land use pattern and were widely distributed. As shown in Figure 3 and Table 4, forest remained the largest landscape type, consistently accounting for over 67.29% of the total area with a distinct altitudinal distribution pattern. Other land use types ranked by area proportion were: construction land > water bodies > grassland > barren land. Cultivated land area decreased significantly with a net reduction of 1,406.94 km² (3.79%) over 11 years; grassland area shrank by 43.89% and water bodies decreased by 20.62%, showing continuous decline trends; forest area increased by 1.57%, reflecting the implementation effects of ecological protection policies; construction land expanded most rapidly (42.53%), indicating rapid urbanization; while barren land showed a large percentage increase (264.77%), its absolute growth was limited (1.587 km²). Notably, a significant spatial coupling existed between construction land expansion and cultivated land reduction, a phenomenon likely related to urban expansion.
Land use dynamics reflects the magnitude and rate of land type changes within a specific time period in the study area [40].
Table 5 presents the area changes and dynamic degree data of different land use types in the study region during 2011-2022. Each land use type exhibited distinct change characteristics across different phases. During 2011-2014, construction land showed a dynamic degree of 12.040%, indicating significant area expansion that reflected active regional development activities. Grassland expanded moderately with a dynamic degree of 3.920%, while cultivated land and barren land decreased with dynamic degrees of -2.180% and -6.316% respectively. From 2014 to 2018, cultivated land, grassland and water bodies continued to decrease with dynamic degrees of -2.572%, -22.646% and -6.800%, demonstrating substantial external pressures on these land types. Forest land and construction land maintained growth with dynamic degrees of 1.053% and 15.223% respectively, with construction land showing particularly strong expansion that indicated accelerating urbanization. Barren land transitioned from decrease to increase with a dynamic degree of 85.072% (relatively small absolute change but large proportional change). During 2018-2022, cultivated land area increased with a dynamic degree of 0.952%; forest land, grassland and water bodies continued to decrease with dynamic degrees of -0.295%, -30.201% and -15.304% respectively; construction land still expanded but at a slower rate (dynamic degree 10.406%); and unused land persistently increased with a dynamic degree of 1.588%.
For the entire study period (2011-2022), construction land exhibited the most pronounced changes with a dynamic degree of 42.529%, highlighting sustained growth in development demands. Grassland showed substantial reduction (-43.892%), cultivated land displayed an overall decreasing trend (-3.788%), and water bodies continuously shrunk (-20.612%). Forest land experienced fluctuations but ultimately increased (1.573%), while barren land, despite its small base area, showed a dramatic dynamic degree of 265.263%. Overall, the study period witnessed remarkable land use changes, characterized primarily by expansion of barren land and construction land alongside reduction of cultivated land and grassland, reflecting the profound reshaping of land use patterns driven by economic development and urbanization.
3.1.2. Land Use Transfers Analysis
Figure 4 and Table 6, Table 7 and Table 8 provide a comprehensive overview of land use transitions in the study area during 2011-2022. Figure 3 visually demonstrates the consistent mutual conversion between cultivated land and forest land over this 11-year period, while also revealing frequent conversion of cultivated land to construction land, indicating pronounced urban expansion trends.
Table 6 provides a comprehensive overview of land use changes in the study area during 2011-2014. During this three-year period, cultivated land showed significant reduction with 3,302.143 km² transferred out and 2,492.608 km² transferred in. Forest land exhibited substantial expansion, with 2,435.726 km² transferred out but 3,101.055 km² transferred in. Grassland area increased slightly (32.016 km² out vs 35.183 km² in), as did water (68.151 km² out vs 76.906 km² in). Barren land experienced minimal changes (0.243 km² out vs 0.205 km² in), remaining essentially stable. Construction land showed marked expansion (6.431 km² out vs 138.752 km² in).
Table 7 reveals the land use transition patterns during 2014-2018. This period saw dramatic reduction in cultivated land (3,729.542 km² out vs 2,795.013 km² in), contrasting with significant forest land expansion (2,658.423 km² out vs 3,528.885 km² in). Both grass (42.445 km² out vs 23.436 km² in) and water (143.328 km² out vs 38.496 km² in) decreased, while barren land increased slightly (0.241 km² out vs 0.718 km² in). Construction land continued rapid expansion (5.303 km² out vs 192.741 km² in).
Table 8 demonstrates the land use dynamics during 2018-2022, showing notable trend reversals. Cultivated land area increased (3,474.136 km² out vs 3,811.263 km² in), breaking its previous declining trend. Forest showed slight reduction (3,556.150 km² out vs 3,309.727 km² in), contrasting with earlier expansion. Grass (35.337 km² out vs 15.728 km² in) and water (266.884 km² out vs 47.014 km² in) continued decreasing, while barren land increased (0.391 km² out vs 1.539 km² in). Construction land maintained strong expansion (17.105 km² out vs 164.732 km² in).
3.2. Spatiotemporal Characteristics of Carbon Storage
3.2.1. Carbon Storage Distribution Patterns
From 2011 to 2022, the major sugarcane-producing regions of Guangxi maintained moderate overall carbon storage levels, with distribution closely tied to land use types (Figure 5). The spatial heterogeneity was pronounced, exhibiting a northwest-high, southeast-low gradient. The western and northern mountainous areas formed high-value zones, where favorable hydrothermal conditions supported robust forest growth. These regions' inaccessibility limited human disturbance, preserving extensive forest cover that consistently accounted for >67% of the study area, primarily in higher-altitude northwestern areas. Forests' high carbon density and sequestration capacity dominated these zones.Moderate-value areas were widespread, dominated by cultivated land (>29% coverage) and grassland, where crop growth and vegetation provided measurable carbon sequestration. The southeastern low-value zones featured flat terrain, abundant water resources, and active economic development, with higher proportions of construction land and water bodies - both exhibiting low carbon density and limited sequestration capacity.While county-level carbon storage rankings remained generally stable throughout 2011-2022, localized changes occurred. Some counties improved their rankings through forest conservation and afforestation programs, while others experienced fluctuations or declines due to urbanization and agricultural expansion activities.
3.2.2. Characteristics of Carbon Storage Changes
The InVEST model's Carbon module calculations (Table 9) reveal that forests consistently dominated carbon storage contributions in Guangxi's major sugarcane-producing regions during 2011-2022, maintaining >85% shares: 1,384.523 million tons (85.095%) in 2011 increasing to 1,406.298 million tons (85.673%) by 2022. The period 2011-2018 witnessed extensive conversion of cultivated land to forests, representing a shift from low-carbon-density to high-carbon-density land uses. Conversely, 2018-2022 saw significant forest conversion to cultivated and construction land - a reverse transition pattern. These land use changes directly impacted carbon fluxes, with high-to-low carbon density conversions triggering carbon release [33], and vice versa.
Cultivated land's carbon storage declined from 236.276 million tons (14.522%) to 225.180 million tons (13.705%) during 2011-2018, before recovering slightly to 227.325 million tons (13.849%) by 2022. Grassland and water bodies showed consistent carbon storage reduction, while barren and construction land exhibited modest increases despite small proportional contributions. The carbon storage ranking across all years remained: forest > cultivated land > construction land > water bodies > grassland > barren land.
Total regional carbon storage fluctuated moderately between 1,627.028 and 1,643.099 million tons during the 11-year period. Forest expansion enhanced carbon sequestration, while urban expansion at the expense of cultivated land emerged as the primary factor undermining regional carbon storage capacity [41]. Notably, forests and cultivated land collectively contributed >99.5% of carbon sequestration, underscoring the critical importance of understanding land use transition mechanisms for ecological security and sustainable development in this key sugarcane-producing regions.
3.3. Driving Factors of Carbon Storage Spatial Differentiation
3.3.1. Factor Detection Results
This study employed the Geodetector model to quantitatively analyze the dominant factors and interaction mechanisms governing carbon storage spatial differentiation, using county-level carbon storage as the dependent variable and 17 indicator factors as independent variables. Among the selected drivers, seven factors failed the significance test (p-value ≥ 0.05): annual precipitation (X3), proportion of sugarcane planting area (X8), number of industrial enterprises above designated size (X14), distance to adjacent cities (X17), general public budget expenditure (X13), annual sunshine hours (X1), and population size (X11). These non-significant factors were excluded from subsequent Geodetector analysis as their q-values became negligible [42].
Figure 6 demonstrates that the remaining factors all influenced carbon storage spatial differentiation to varying degrees. Taking 2011 as an example, the explanatory power (q-value) ranking was: land urbanization rate (X10) > NDVI (X6) > proportion of cultivated land area (X7) > nighttime light index (X15) > forest coverage (X6) > NDVI (X5) > road network density (X16) > mean annual temperature (X2) > primary industry GDP (X12) > average slope (X4) > sugarcane yield per unit area (X9). The annual variations in q-value rankings reflect dynamic changes in factor influences.
Note: Road network density data for 2011 were substituted with 2013 values. q represents explanatory power; X1: annual sunshine hours; X2: mean annual temperature; X3: annual precipitation; X4: average slope; X5: NDVI; X6: forest coverage rate; X7: proportion of cultivated land area; X8: proportion of sugarcane planting area (relative to total crop sown area); X9: sugarcane yield per unit area; X10: land urbanization rate (proportion of construction land); X11: population size; X12: primary industry GDP; X13: general public budget expenditure; X14: number of industrial enterprises above designated size; X15: nighttime light index; X16: road network density; X17: distance to adjacent cities. The same conventions apply hereafter.
3.3.2. Interaction Detection Results
The interaction detection results exhibited two patterns: bivariate enhancement and nonlinear enhancement, with all factor combinations' interaction explanatory power q(Xi∩Xj) being significantly higher than individual factors' independent effects, confirming that the spatial differentiation of carbon storage in the study area resulted from multiple factors. Temporal analysis (Figure 7a-d) showed that in 2011, the interaction between cultivated land proportion (X7) and land urbanization rate (X10), primary industry GDP (X12), and road network density (X16) was most prominent (q-values of 0.922, 0.915, and 0.912 respectively), while forest coverage (X6) and primary industry GDP (X12) also showed strong interaction (q=0.909). In 2014, NDVI (X5) and primary industry GDP (X12), forest coverage (X6) and primary industry GDP (X12), and forest coverage (X6) and land urbanization rate (X10) demonstrated the strongest explanatory power (q-values of 0.953, 0.947, and 0.942 respectively). In 2018, the most significant interactions were between cultivated land proportion (X7) and land urbanization rate (X10), cultivated land proportion (X7) and primary industry GDP (X12), and NDVI (X5) and nighttime light index (X15) (q-values of 0.945, 0.943, and 0.921 respectively). By 2022, the interaction between NDVI (X5) and forest coverage (X6) reached its peak (q=0.959).
Notably, factors including NDVI, forest coverage, cultivated land proportion, and primary industry GDP consistently demonstrated high explanatory power in interaction effects across multiple periods, indicating that vegetation coverage and agricultural production activities were core elements driving carbon storage changes. Meanwhile, human activity indicators such as land urbanization rate, nighttime light index, and road network density also significantly influenced carbon storage spatial patterns through interactions, and the synergistic effects between these factors and natural elements collectively shaped the dynamic evolution characteristics of regional carbon storage.
4. Discussion
This study reveals that during 2011-2022, the carbon storage in Guangxi's major sugarcane-producing regions exhibited a distinct northwest-high and southeast-low spatial pattern, where the western and northern mountainous areas with favorable hydrothermal conditions for forest growth formed stable natural and plantation forest zones, while the southeastern plains experienced significant carbon loss due to intensive agricultural development and urbanization, resulting in lower carbon storage that closely correlated with regional forest distribution patterns - consistent with findings from comparable studies in other regions [43]. Forests increased their carbon sequestration contribution from 85.095% in 2011 to 85.673% in 2022, confirming their dominant role in carbon balance and aligning with previous vegetation carbon sink research [44]. The four-phase carbon storage data (2018 > 2022 > 2014 > 2011) showed an initial increase followed by decline, likely resulting from synergistic effects of policy interventions and land use transitions: China's Ecological Conservation Redline (ECR) strategy proposed in 2011 and nationally implemented by 2017 [45] restricted forest-to-construction land conversion; the 2014 launch of the second phase Grain-for-Green Program [46] combined with rocky desertification control [47] improved regional ecology; concurrent "High-Yield High-Sugar" sugarcane base construction promoted organic fertilizers and soil-testing formulated fertilization technologies to mitigate agricultural carbon loss [48]. Additionally, some abandoned farmlands were converted to forests due to agricultural conditions and demographic changes [49], becoming another carbon accumulation pathway. Notably, substantial cultivated-to-construction land transitions caused carbon losses, providing quantitative evidence for balancing the tripartite objectives of food security, ecological protection and urbanization.
The Geodetector results identified land urbanization rate (q > 0.647) and cultivated land proportion (q > 0.656) as dominant drivers surpassing natural factors. Spatial analysis revealed that forest-dominated northwestern areas accounted for 85.673% of carbon storage, while southeastern regions with predominant cultivated and construction lands showed lower carbon density, confirming land use type's deterministic influence [50]. Anthropogenic factors played substantial roles: human activities accelerated LULC changes, with rapid economic development and population density in the southeast driving construction land expansion and carbon storage decline [51]; GDP and population density exhibited threshold effects on carbon storage [52], while agricultural intensification exacerbated carbon loss [53]. The significant differences in land use patterns and human interventions between northwestern and southeastern areas collectively shaped regional carbon storage heterogeneity. In contrast, climatic factors like mean annual temperature and precipitation showed weak or insignificant explanatory power (p ≥ 0.05) in Geodetector analysis, likely due to regional climatic stability [54]. Interaction detection demonstrated bivariate enhancement, where any two factors' combined explanatory power exceeded individual effects. For instance, the 2022 interaction between cultivated land proportion and land urbanization rate reached q = 0.943, while NDVI and forest coverage achieved q = 0.959, aligning with the "ecological-economic coupling amplification effect" theory [55]. This was exemplified by Guangxi's 2016 Ecological Conservation Redline regulations that simultaneously constrained construction land and enhanced forest carbon sinks, reflecting policy-mediated factor coordination. The human-dominated driving mechanisms and factor coupling effects revealed by Geodetector necessitate multidimensional carbon management strategies beyond uniform approaches [55]. In rapidly urbanizing zones, strict ecological redline enforcement and science-based urban growth boundaries should be implemented with low-carbon infrastructure. In sugarcane cultivation areas, optimized "High-Yield High-Sugar" sugarcane base policies should promote low-carbon farming. For ecological protection, northwestern forests require enhanced compensation and quality improvement, while southeastern karst areas need integrated rocky desertification control to restore carbon sequestration functions, alongside exploring forestry-agriculture carbon synergy mechanisms. Coordinated land-use policies and ecological measures will collectively facilitate regional green transition and sustainable development.
This study quantitatively assessed the carbon effects of land-use changes in Guangxi's major sugarcane-producing regions, providing new insights for tropical agricultural carbon pool dynamics. However, several limitations should be noted: (1) The spatiotemporal patterns and driving mechanisms of carbon storage require longer-term monitoring - the 2011-2022 study period was insufficient to fully capture the impacts of land-use policy adjustments on carbon storage, and future LUCC scenarios were not simulated; (2) While focusing on land classification and natural/socioeconomic indicators, ecological factors such as microbial decomposition were not included - future studies should expand the indicator system to incorporate more socioeconomic and ecological parameters for a more comprehensive understanding of carbon storage drivers; (3) The interaction detection approach has limited capacity to characterize complex nonlinear relationships - further research is needed to elucidate the integrated pathways through which multiple factors influence carbon storage. To address these limitations, we propose three optimization strategies: (1) Developing multi-scenario simulation frameworks aligned with Guangxi's medium- and long-term development plans to enable long-term carbon storage prediction and targeted management; (2) Establishing a multidimensional assessment system encompassing "soil-vegetation-human activity" by integrating soil carbon monitoring, agricultural policy adjustments, and labor migration data [56]; (3) Creating a multi-scale monitoring system combining Sentinel-2 and UAV data [57] in response to IPCC's call for improved agricultural carbon accounting methodologies, and exploring coupled modeling frameworks that integrate socioeconomic and ecological process parameters to enhance the predictive accuracy of land-use policy effects on carbon dynamics, thereby providing actionable guidance for similar regions to achieve "dual carbon" goals.
5. Conclusions and Recommendations
(1) From 2011 to 2022, the total carbon storage in Guangxi's major sugarcane-producing regions measured 1,627.027, 1,633.721, 1,643.099, and 1,641.468 million tons respectively, exhibiting a distinct northwest-high and southeast-low spatial pattern. The western and northern mountainous areas formed high-value carbon zones due to favorable forest growth conditions and abundant woodland resources, while the flat southeastern regions with intensive economic activities showed relatively lower carbon storage owing to higher proportions of construction land and water bodies.
(2) Land use transitions significantly influenced carbon storage dynamics. Forests consistently contributed over 85% of total carbon storage, playing a pivotal role in maintaining regional carbon stocks. Cultivated land showed fluctuating carbon storage corresponding to its initial decrease and subsequent recovery, whereas grassland and water bodies demonstrated consistent declines. Although barren land and construction land accounted for minor proportions, their marked increasing trends reflected growing anthropogenic impacts on regional carbon cycles.
(3) Geodetector analysis identified land urbanization rate (q>0.647) and cultivated land proportion (q>0.656) as dominant factors governing carbon storage spatial differentiation. Nighttime light index, forest coverage, and NDVI (q>0.511) also significantly influenced spatial patterns, while seven factors including annual precipitation and sugarcane planting proportion showed no significant correlation (p≥0.05).
(4) Interaction detection revealed that NDVI, forest coverage, cultivated land proportion, and primary industry GDP exhibited particularly strong synergistic effects, with combined q-values exceeding 0.9 in multiple years - significantly surpassing individual factor impacts - confirming multi-factor coordination drives carbon storage changes.
(5) Policy recommendations emphasize: optimizing land use structures during urbanization/agricultural development; strengthening forest conservation and ecological restoration; controlling construction land expansion; and establishing dynamic balance mechanisms between economic growth and ecological protection by leveraging factor interactions to enhance carbon sequestration capacity and support China's dual carbon goals.
Author Contributions
J.M.: Conception; Data organization; Analysis; Resources; Software; Validation; Original manuscript. J.W.: Funding acquisition; Validation; Supervision. S.D.and C.Y.: Revision;Supervision. C.P.: Data management; Testing. All authors have read and agreed to the published version of the manuscript.
References
- Xu, T.; Xu, M.; Zhang, M.; Letnic, M.; Wang, J.; Wang, L. Spatial Effects of Nitrogen Deposition on Soil Organic Carbon Stocks in Patchy Degraded Saline-Alkaline Grassland. Geoderma 2023, 432, 116408. [Google Scholar] [CrossRef]
- Global Patterns of the Effects of Land-Use Changes on Soil Carbon Stocks. Global Ecology and Conservation 2016, 5, 127–138. [CrossRef]
- Van Pham, T.; Do, T.A.T.; Tran, H.D.; Do, A.N.T. Assessing the Impact of Ecological Security and Forest Fire Susceptibility on Carbon Stocks in Bo Trach District, Quang Binh Province, Vietnam. Ecological Informatics 2023, 74, 101962. [Google Scholar] [CrossRef]
- Zhu, L.; Song, R.; Sun, S.; Li, Y.; Hu, K. Land Use/Land Cover Change and Its Impact on Ecosystem Carbon Storage in Coastal Areas of China from 1980 to 2050. Ecological Indicators 2022, 142, 109178. [Google Scholar] [CrossRef]
- Daniel J C,Frid L,Sleeter M B, et al.State-and-transition simulation models: a framework for forecasting landscape change [J].Methods in Ecology and Evolution,2016,7(11):1413-1423.
- Djomo, A.N.; Knohl, A.; Gravenhorst, G. Estimations of Total Ecosystem Carbon Pools Distribution and Carbon Biomass Current Annual Increment of a Moist Tropical Forest. Forest Ecology and Management 2011, 261, 1448–1459. [Google Scholar] [CrossRef]
- Leifeld, J.; Bassin, S.; Fuhrer, J. Carbon Stocks in Swiss Agricultural Soils Predicted by Land-Use, Soil Characteristics, and Altitude. Agriculture, Ecosystems & Environment 2005, 105, 255–266. [Google Scholar]
- Zafar, Z.; Sajid Mehmood, M.; Shiyan, Z.; Zubair, M.; Sajjad, M.; Yaochen, Q. Fostering Deep Learning Approaches to Evaluate the Impact of Urbanization on Vegetation and Future Prospects. Ecological Indicators 2023, 146, 109788. [Google Scholar] [CrossRef]
- Kim Phat, N.; Knorr, W.; Kim, S. Appropriate Measures for Conservation of Terrestrial Carbon Stocks—Analysis of Trends of Forest Management in Southeast Asia. Forest Ecology and Management 2004, 191, 283–299. [Google Scholar] [CrossRef]
- de Koning, G.H.J.; Veldkamp, E.; López-Ulloa, M. Quantification of Carbon Sequestration in Soils Following Pasture to Forest Conversion in Northwestern Ecuador. Global Biogeochemical Cycles 2003, 17. [Google Scholar] [CrossRef]
- Gonzalez, P.; Battles, J.J.; Collins, B.M.; Robards, T.; Saah, D.S. Aboveground Live Carbon Stock Changes of California Wildland Ecosystems, 2001–2010. Forest Ecology and Management 2015, 348, 68–77. [Google Scholar] [CrossRef]
- Ota, H.O.; Mohan, K.C.; Udume, B.U.; Olim, D.M.; Okolo, C.C. Assessment of Land Use Management and Its Effect on Soil Quality and Carbon Stock in Ebonyi State, Southeast Nigeria. Journal of Environmental Management 2024, 358, 120889. [Google Scholar] [CrossRef]
- Chiti, T.; Benilli, N.; Mastrolonardo, G.; Certini, G. The Potential for an Old-Growth Forest to Store Carbon in the Topsoil: A Case Study at Sasso Fratino, Italy. J. For. Res. 2023, 35, 10. [Google Scholar] [CrossRef]
- Zafar, Z.; Zubair, M.; Zha, Y.; Mehmood, M.S.; Rehman, A.; Fahd, S.; Nadeem, A.A. Predictive Modeling of Regional Carbon Storage Dynamics in Response to Land Use/Land Cover Changes: An InVEST-Based Analysis. Ecological Informatics 2024, 82, 102701. [Google Scholar] [CrossRef]
- Ma, W.; Hou, S.; Su, W.; Mao, T.; Wang, X.; Liang, T. Estimation of Carbon Stock and Economic Value of Sanjiangyuan National Park, China. Ecological Indicators 2024, 169, 112856. [Google Scholar] [CrossRef]
- Chang, X.; Xing, Y.; Wang, J.; Yang, H.; Gong, W. Effects of Land Use and Cover Change (LUCC) on Terrestrial Carbon Stocks in China between 2000 and 2018. Resources, Conservation and Recycling 2022, 182, 106333. [Google Scholar] [CrossRef]
- Recent and Projected Impacts of Land Use and Land Cover Changes on Carbon Stocks and Biodiversity in East Kalimantan, Indonesia. Ecological Indicators 2019, 103, 563–575. [CrossRef]
- Future Land-Use Change and Its Impact on Terrestrial Ecosystem Carbon Pool Evolution along the Silk Road under SDG Scenarios. Science Bulletin 2023, 68, 740–749. [CrossRef] [PubMed]
- Gao, J.; Wang, L. Embedding Spatiotemporal Changes in Carbon Storage into Urban Agglomeration Ecosystem Management — A Case Study of the Yangtze River Delta, China. Journal of Cleaner Production 2019, 237, 117764. [Google Scholar] [CrossRef]
- Li, C.; Xu, H.; Du, P.; Tang, F. Predicting Land Cover Changes and Carbon Stock Fluctuations in Fuzhou, China: A Deep Learning and InVEST Approach. Ecological Indicators 2024, 167, 112658. [Google Scholar] [CrossRef]
- Mendoza-Ponce, A.; Corona-Núñez, R.; Kraxner, F.; Leduc, S.; Patrizio, P. Identifying Effects of Land Use Cover Changes and Climate Change on Terrestrial Ecosystems and Carbon Stocks in Mexico. Global Environmental Change 2018, 53, 12–23. [Google Scholar] [CrossRef]
- Sattolo, T.M.S.; Mariano, E.; Boschiero, B.N.; Otto, R. Soil Carbon and Nitrogen Dynamics as Affected by Land Use Change and Successive Nitrogen Fertilization of Sugarcane. Agriculture, Ecosystems & Environment 2017, 247, 63–74. [Google Scholar]
- Franco, A.L.C.; Cherubin, M.R.; Pavinato, P.S.; Cerri, C.E.P.; Six, J.; Davies, C.A.; Cerri, C.C. Soil Carbon, Nitrogen and Phosphorus Changes under Sugarcane Expansion in Brazil. Science of The Total Environment 2015, 515–516, 30–38. [Google Scholar] [CrossRef]
- Moitinho R M,Ferraudo S A,Panosso R A, et al.Effects of burned and unburned sugarcane harvesting systems on soil CO2 emission and soil physical, chemical, and microbiological attributes [J].Catena,2021,196.
- Ma, J.; Xu, J.; He, P.; Chen, B. Carbon Uptake of the Sugarcane Agroecosystem Is Profoundly Impacted by Climate Variations Due to Seasonality and Topography. Field Crops Research 2022, 289, 108729. [Google Scholar] [CrossRef]
- Adhikari, D.; Singh, P.P.; Tiwary, R.; Barik, S.K. Forest Carbon Stock-Based Bioeconomy: Mixed Models Improve Accuracy of Tree Biomass Estimates. Biomass and Bioenergy 2024, 183, 107142. [Google Scholar] [CrossRef]
- Hasegawa, T.; Fujimori, S.; Ito, A.; Takahashi, K. Careful Selection of Forest Types in Afforestation Can Increase Carbon Sequestration by 25% without Compromising Sustainability. Commun Earth Environ 2024, 5, 1–10. [Google Scholar] [CrossRef]
- Guga, S.; Xu, J.; Riao, D.; Li, kaiwei; Han, A.; Zhang, J. Combining MaxEnt Model and Landscape Pattern Theory for Analyzing Interdecadal Variation of Sugarcane Climate Suitability in Guangxi, China. Ecological Indicators 2021, 131, 108152. [CrossRef]
- Bordonal, R. de O.; Carvalho, J.L.N.; Lal, R.; de Figueiredo, E.B.; de Oliveira, B.G.; La Scala, N. Sustainability of Sugarcane Production in Brazil. A Review. Agron. Sustain. Dev. 2018, 38, 13.
- Zhu, H.Y., Wu, L., & Peng, Z.P. (2016). Analysis of the Construction for Sugarcane Base in Guangxi. Macroeconomic Management 2016,05:80-83.
- Lu, X.G., Fan, Y.G., Qiu, L.H., et al. The Current State of Sugarcane Base under Construction and Its Suggestions on Development in Guangxi. Tropical Agricultural Science & Technology 2019,42(02):51-54.
- Pérez-Hugalde, C.; Romero-Calcerrada, R.; Delgado-Pérez, P.; Novillo, C.J. Understanding Land Cover Change in a Special Protection Area in Central Spain through the Enhanced Land Cover Transition Matrix and a Related New Approach. Journal of Environmental Management 2011, 92, 1128–1137. [Google Scholar] [CrossRef]
- Zhu, G.; Qiu, D.; Zhang, Z.; Sang, L.; Liu, Y.; Wang, L.; Zhao, K.; Ma, H.; Xu, Y.; Wan, Q. Land-Use Changes Lead to a Decrease in Carbon Storage in Arid Region, China. Ecological Indicators 2021, 127, 107770. [Google Scholar] [CrossRef]
- Bai Y,Tang X,Xue F, et al.Spatiotemporal variation and dynamic simulation of carbon stock based on PLUS and InVEST models in the Li River Basin, China [J].Scientific Reports,2025,15(1):6060-6060.
- Qin, M.; Zhao, Y.; Liu, Y.; Jiang, H.; Li, H.; Zhu, Z. Multi-Scenario Simulation for 2060 and Driving Factors of the Eco-Spatial Carbon Sink in the Beibu Gulf Urban Agglomeration, China. Chin. Geogr. Sci. 2023, 33, 85–101. [Google Scholar] [CrossRef]
- Post, W.M.; Emanuel, W.R.; Zinke, P.J.; Stangenberger, A.G. Soil Carbon Pools and World Life Zones. Nature 1982, 298, 156–159. [Google Scholar] [CrossRef]
- Zhu, L.; Meng, J.; Zhu, L. Applying Geodetector to Disentangle the Contributions of Natural and Anthropogenic Factors to NDVI Variations in the Middle Reaches of the Heihe River Basin. Ecological Indicators 2020, 117, 106545. [Google Scholar] [CrossRef]
- Wang, J.; Xu, C. Geodetectors: Principles and Prospects. Acta Geogr. Sin. 2017, 72, 116–134. [Google Scholar]
- Song, Y.; Wang ,Jinfeng; Ge ,Yong; and Xu, C. An Optimal Parameters-Based Geographical Detector Model Enhances Geographic Characteristics of Explanatory Variables for Spatial Heterogeneity Analysis: Cases with Different Types of Spatial Data. GIScience & Remote Sensing 2020, 57, 593–610.
- Qiu, H.; Hu, B.; Zhang, Z. Impacts of Land Use Change on Ecosystem Service Value Based on SDGs Report--Taking Guangxi as an Example. Ecological Indicators 2021, 133, 108366. [Google Scholar] [CrossRef]
- Peng, Y.; Cheng, W.; Xu, X.; Song, H. Analysis and Prediction of the Spatiotemporal Characteristics of Land-Use Ecological Risk and Carbon Storage in Wuhan Metropolitan Area. Ecological Indicators 2024, 158, 111432. [Google Scholar] [CrossRef]
- An Integrated Approach to Exploring Soil Fertility from the Perspective of Rice (Oryza Sativa L. ) Yields. Soil and Tillage Research 2019, 194, 104322. [Google Scholar]
- Zheng, H.; Zheng, H. Assessment and Prediction of Carbon Storage Based on Land Use/Land Cover Dynamics in the Coastal Area of Shandong Province. Ecological Indicators 2023, 153, 110474. [Google Scholar] [CrossRef]
- Gogoi, A.; Ahirwal, J.; Sahoo, U.K. Evaluation of Ecosystem Carbon Storage in Major Forest Types of Eastern Himalaya: Implications for Carbon Sink Management. Journal of Environmental Management 2022, 302, 113972. [Google Scholar] [CrossRef]
- Gao, J.; Zou, C.; Zhang, K.; Xu, M.; Wang, Y. The Establishment of Chinese Ecological Conservation Redline and Insights into Improving International Protected Areas. Journal of Environmental Management 2020, 264, 110505. [Google Scholar] [CrossRef]
- Gao, Y.; Liu, Z.; Li, R.; Shi, Z. Long-Term Impact of China’s Returning Farmland to Forest Program on Rural Economic Development. Sustainability 2020, 12, 1492. [Google Scholar] [CrossRef]
- Liu, Y.; Wang, S.; Chen, Z.; Tu, S. Research on the Response of Ecosystem Service Function to Landscape Pattern Changes Caused by Land Use Transition: A Case Study of the Guangxi Zhuang Autonomous Region, China. Land 2022, 11, 752. [Google Scholar] [CrossRef]
- Wang G,Liao M,Jiang J.Research on Agricultural Carbon Emissions and Regional Carbon Emissions Reduction Strategies in China [J].Sustainability,2020,12(7):2627.
- Zhang, M.; Li, G.; He, T.; Zhai, G.; Guo, A.; Chen, H.; Wu, C. Reveal the Severe Spatial and Temporal Patterns of Abandoned Cropland in China over the Past 30 Years. Science of The Total Environment 2023, 857, 159591. [Google Scholar] [CrossRef]
- Houghton, R.A.; Hackler, J.L. Sources and Sinks of Carbon from Land-Use Change in China. Global Biogeochemical Cycles 2003, 17. [Google Scholar] [CrossRef]
- Tao, Y.; Li, F.; Wang, R.; Zhao, D. Effects of Land Use and Cover Change on Terrestrial Carbon Stocks in Urbanized Areas: A Study from Changzhou, China. Journal of Cleaner Production 2015, 103, 651–657. [Google Scholar] [CrossRef]
- Song, Z. Economic Growth and Carbon Emissions: Estimation of a Panel Threshold Model for the Transition Process in China. Journal of Cleaner Production 2021, 278, 123773. [Google Scholar] [CrossRef]
- Molotoks, A.; Stehfest, E.; Doelman, J.; Albanito, F.; Fitton, N.; Dawson, T.P.; Smith, P. Global Projections of Future Cropland Expansion to 2050 and Direct Impacts on Biodiversity and Carbon Storage. Global Change Biology 2018, 24, 5895–5908. [Google Scholar] [CrossRef]
- Zhang, Z.; Hu, B.; Jiang, W.; Qiu, H. Identification and Scenario Prediction of Degree of Wetland Damage in Guangxi Based on the CA-Markov Model. Ecological Indicators 2021, 127, 107764. [Google Scholar] [CrossRef]
- Nie, Q.; Wu, G.; Li, L.; Man, W.; Ma, J.; Bao, Z.; Luo, L.; Li, H. Exploring Scaling Differences and Spatial Heterogeneity in Drivers of Carbon Storage Changes: A Comprehensive Geographic Analysis Framework. Ecological Indicators 2024, 165, 112193. [Google Scholar] [CrossRef]
- Pan, L.; Shi, D.; Jiang, G.; Xu, Y. Impacts of Different Management Measures on Soil Nutrients and Stoichiometric Characteristics for Sloping Farmland under Erosive Environments in the Three Gorges Reservoir Area, China. Soil and Tillage Research 2024, 244, 106173. [Google Scholar] [CrossRef]
- Wang, Z.; Zhang, Y.; Li, F.; Gao, W.; Guo, F.; Li, Z.; Yang, Z. Regional Mangrove Vegetation Carbon Stocks Predicted Integrating UAV-LiDAR and Satellite Data. Journal of Environmental Management 2024, 368, 122101. [Google Scholar] [CrossRef] [PubMed]
Figure 1.
Location and topography of study area.
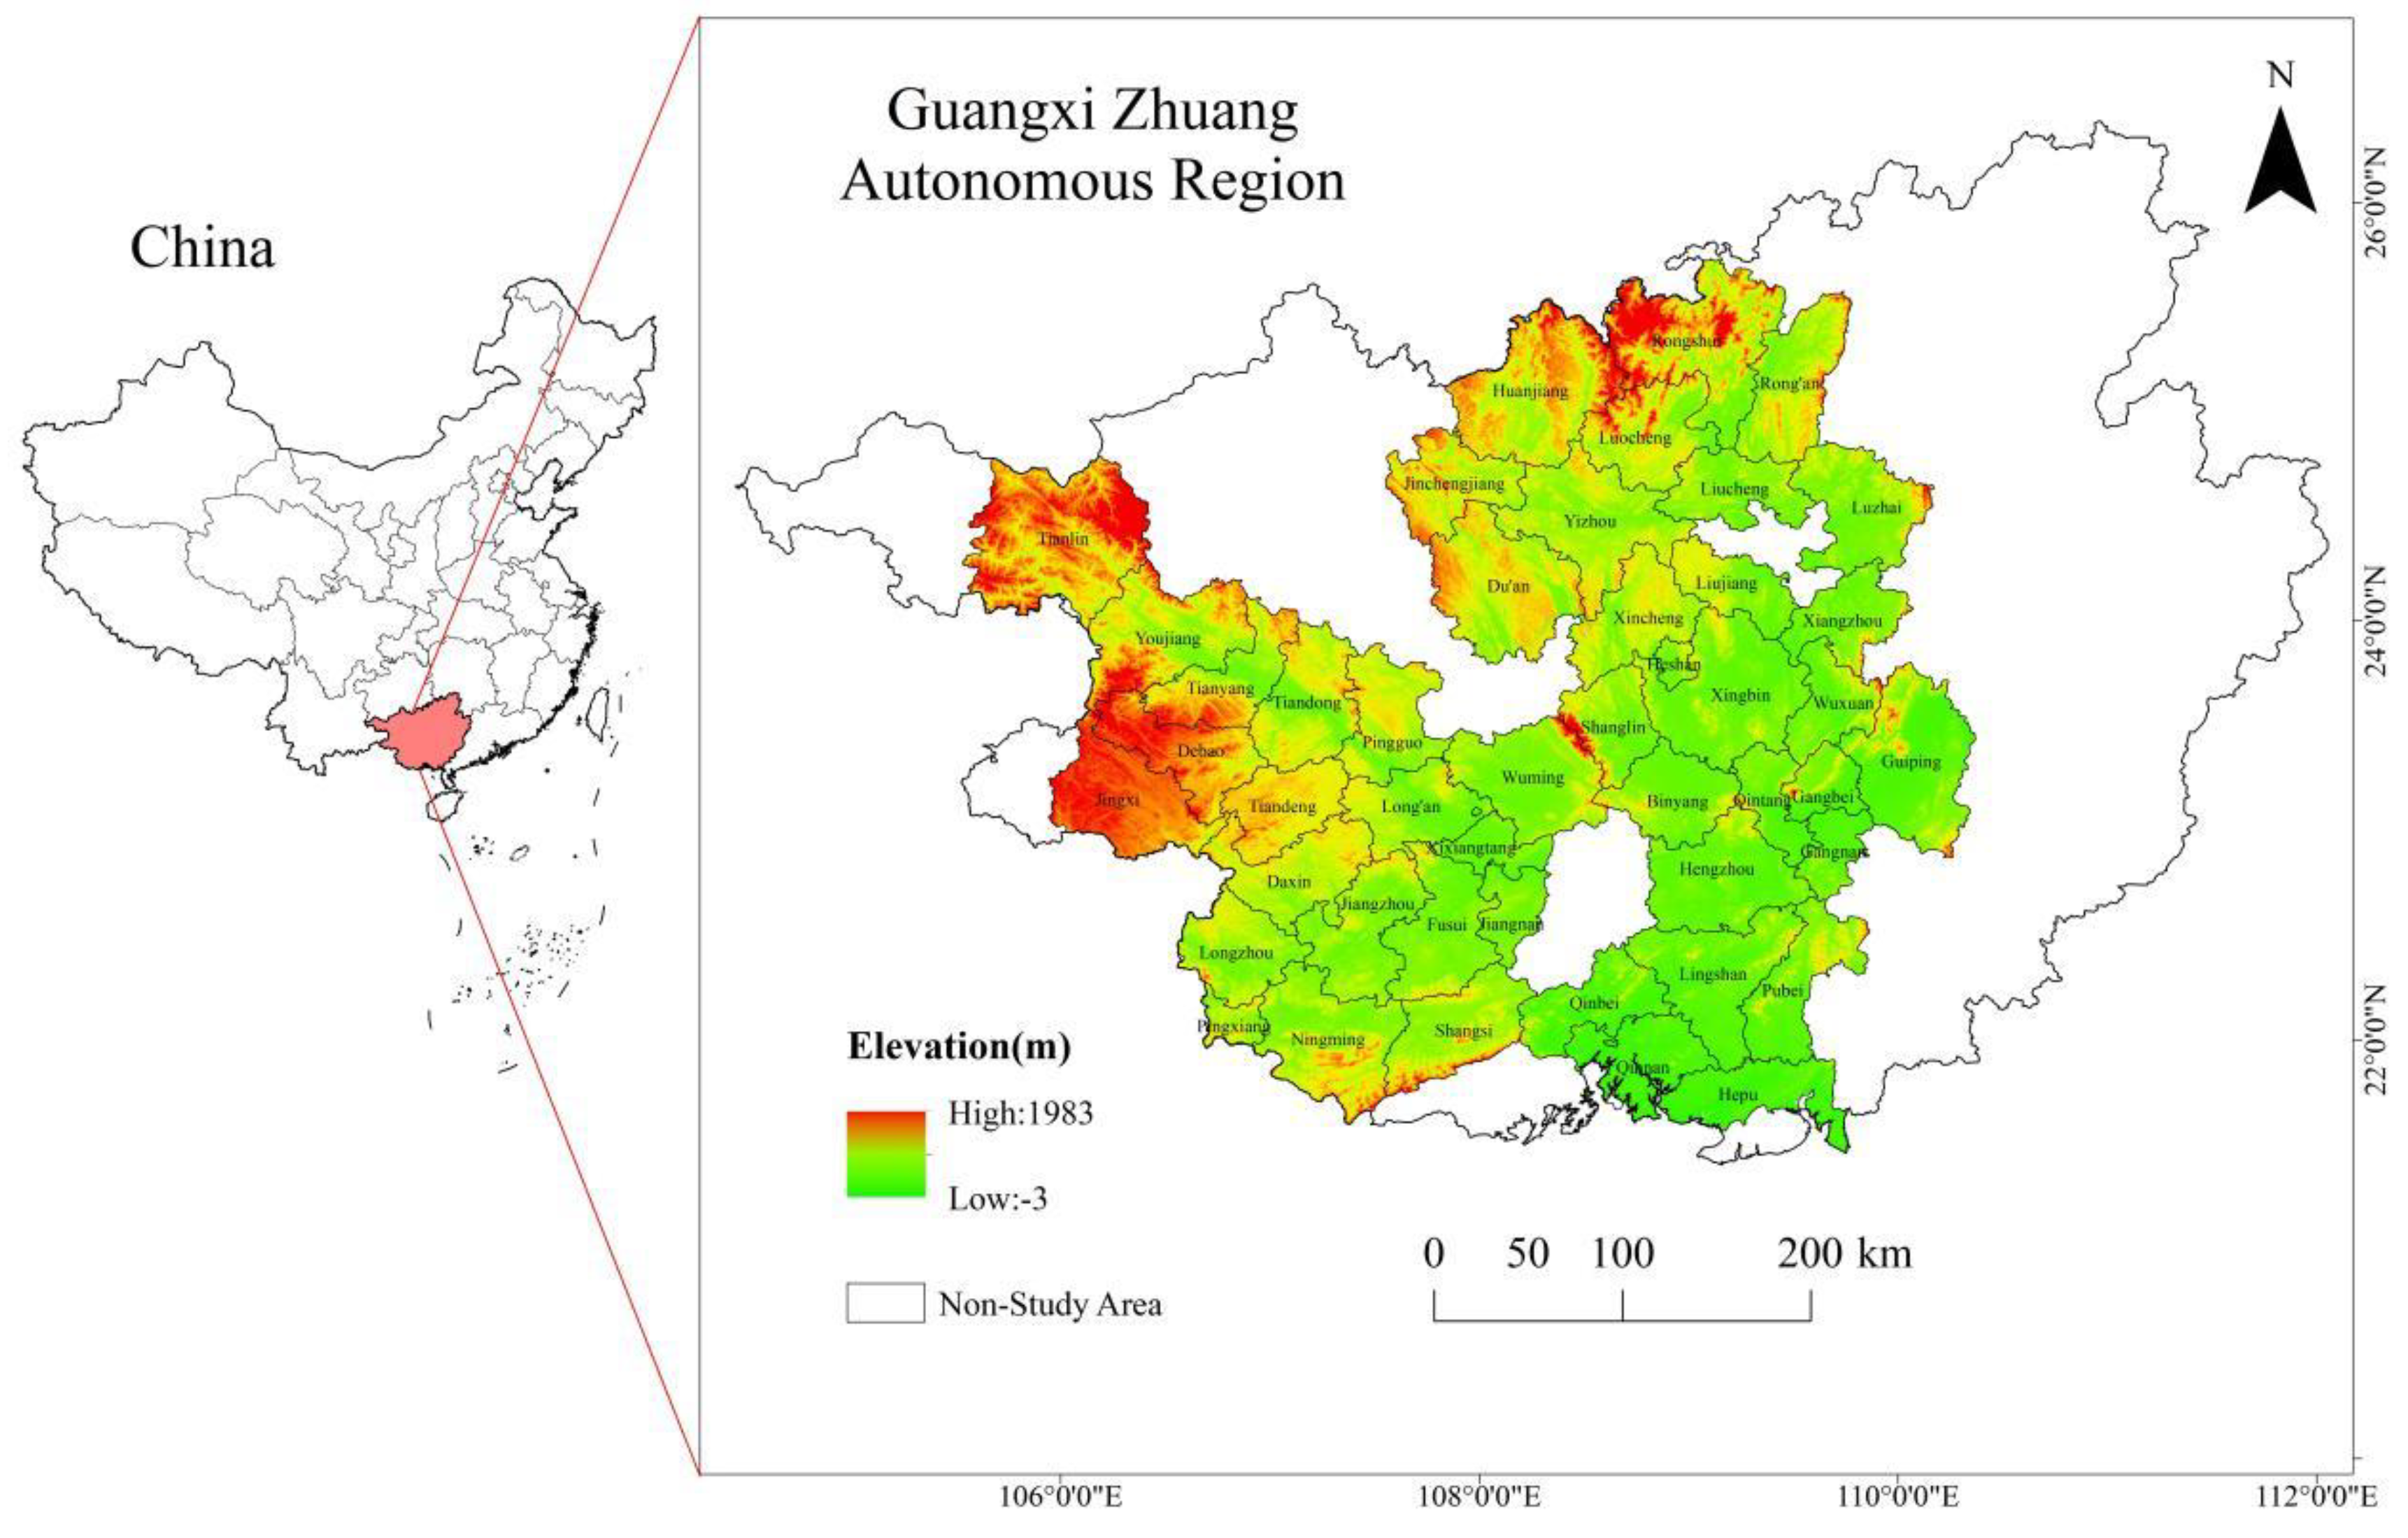
Figure 2.
The research framework.
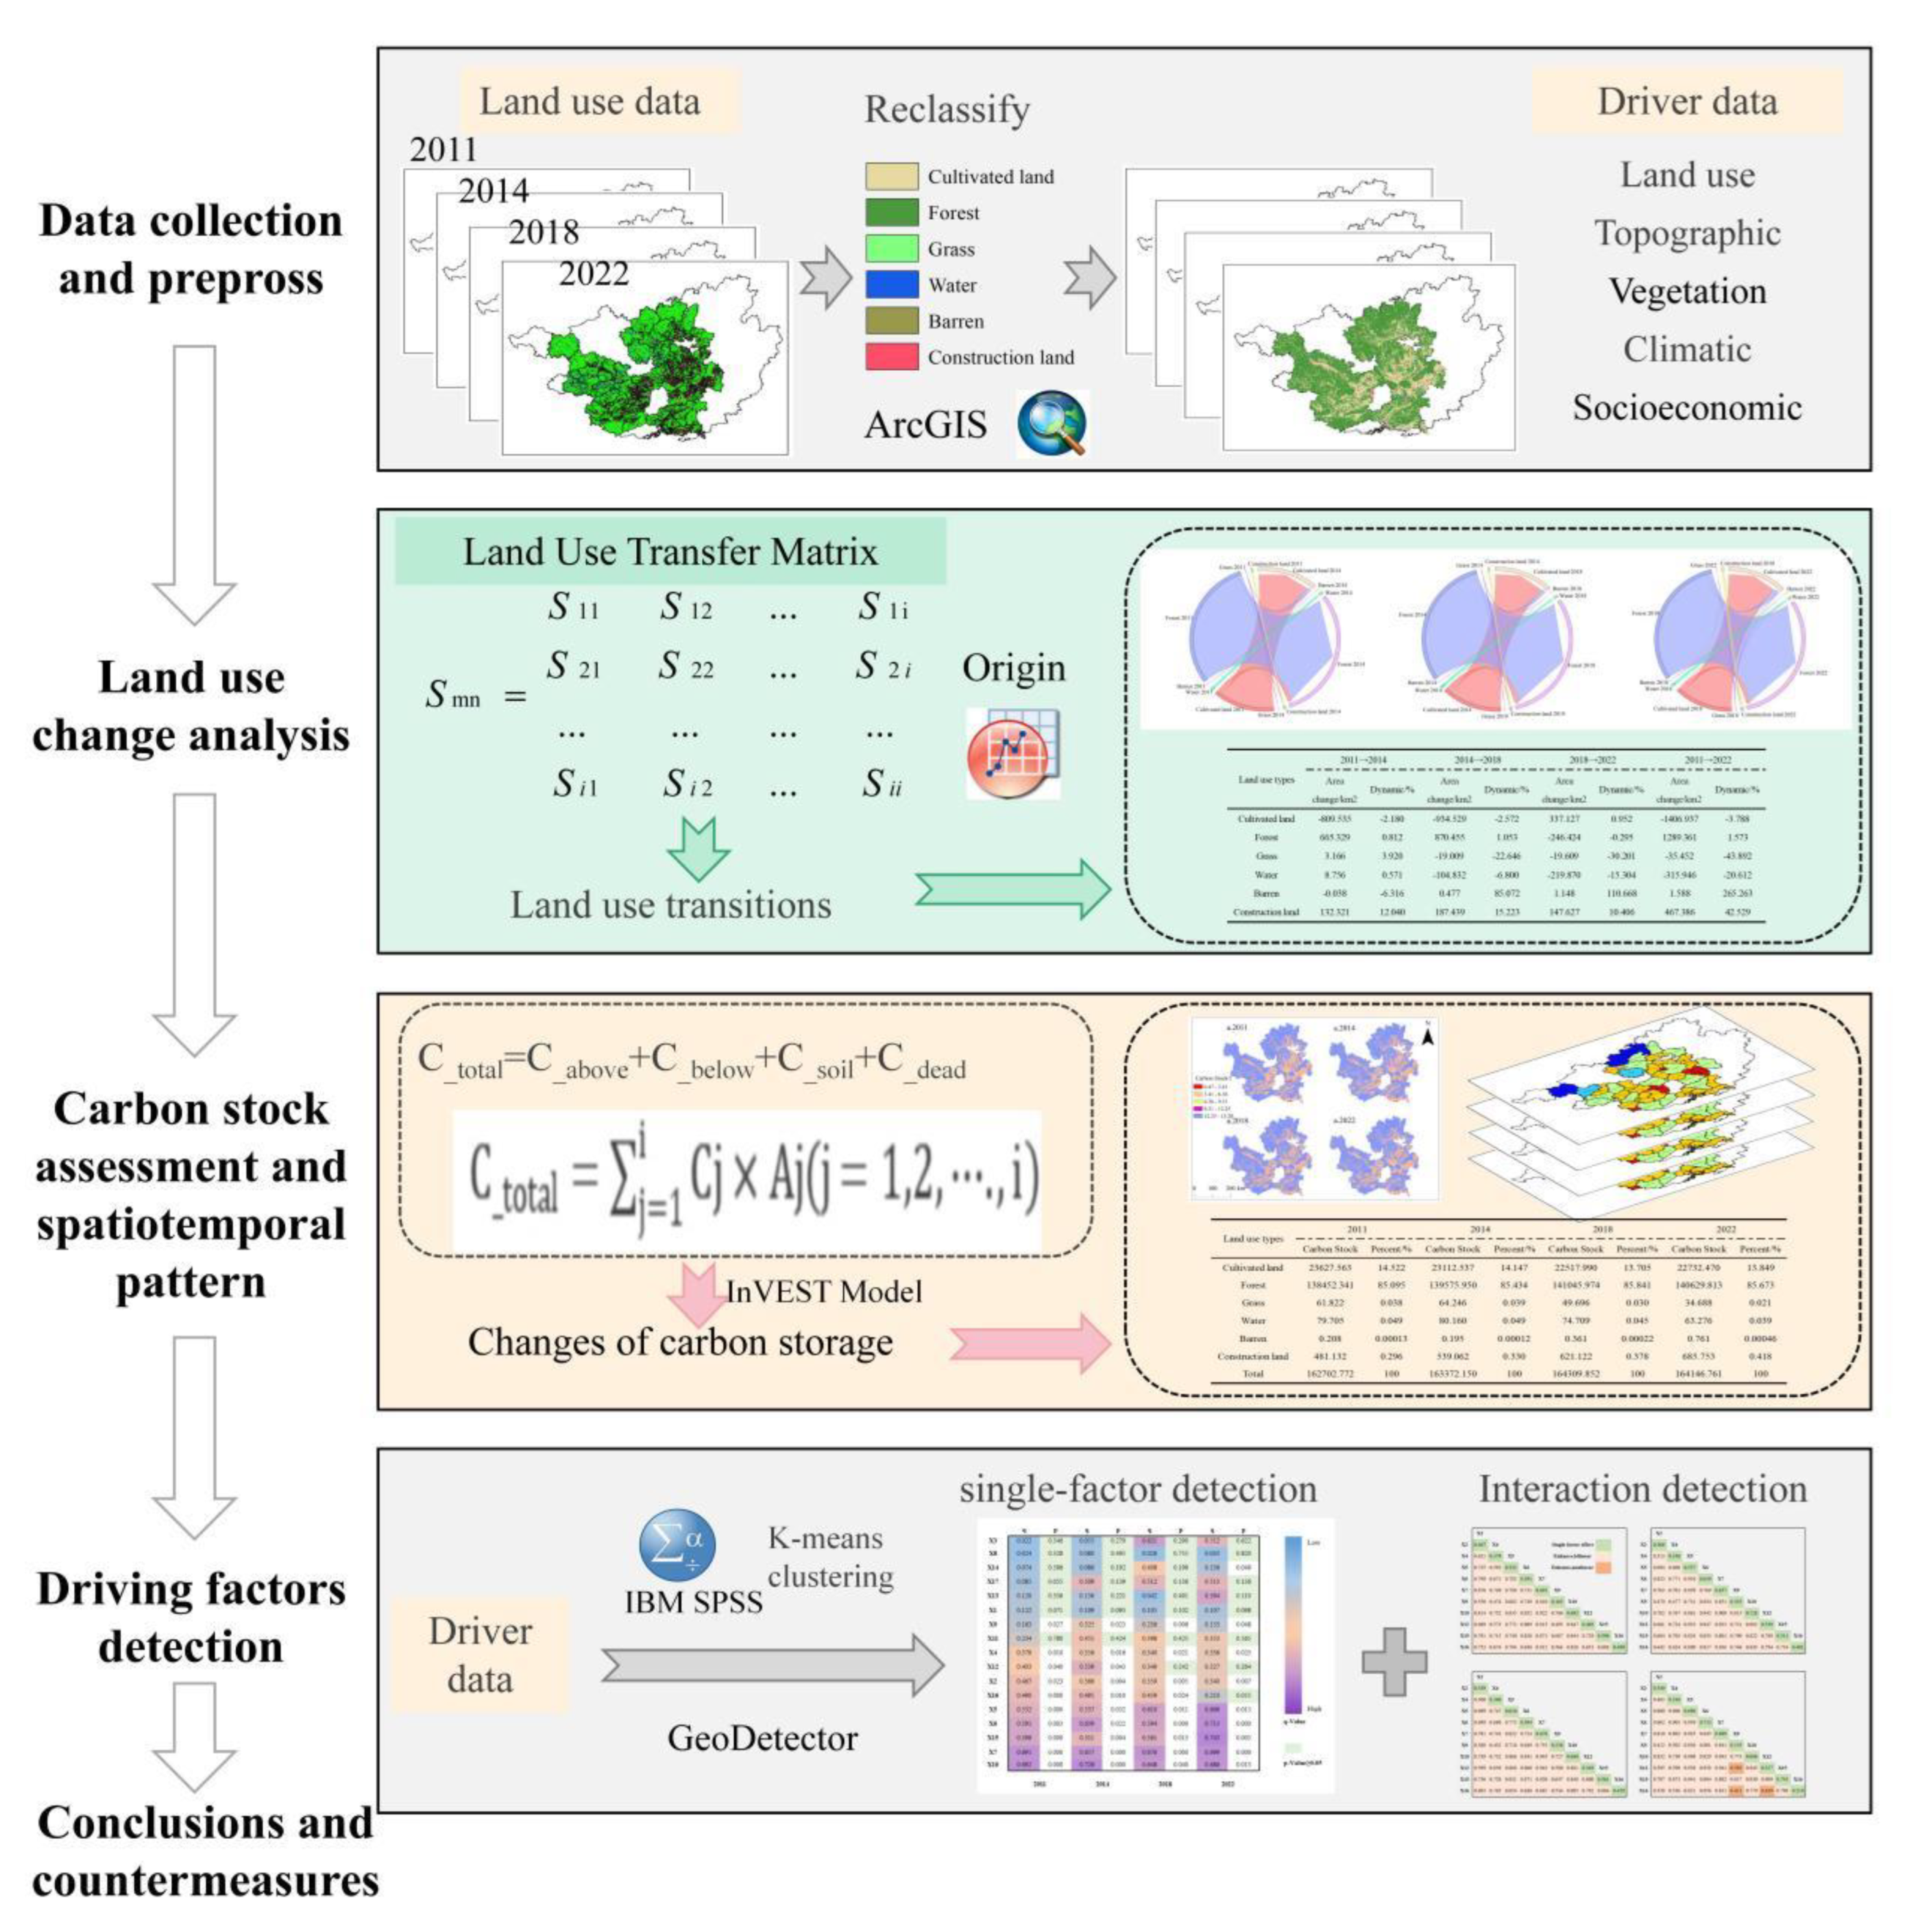
Figure 3.
Spatial distribution and land use changes in the study area from 2011 to 2022.
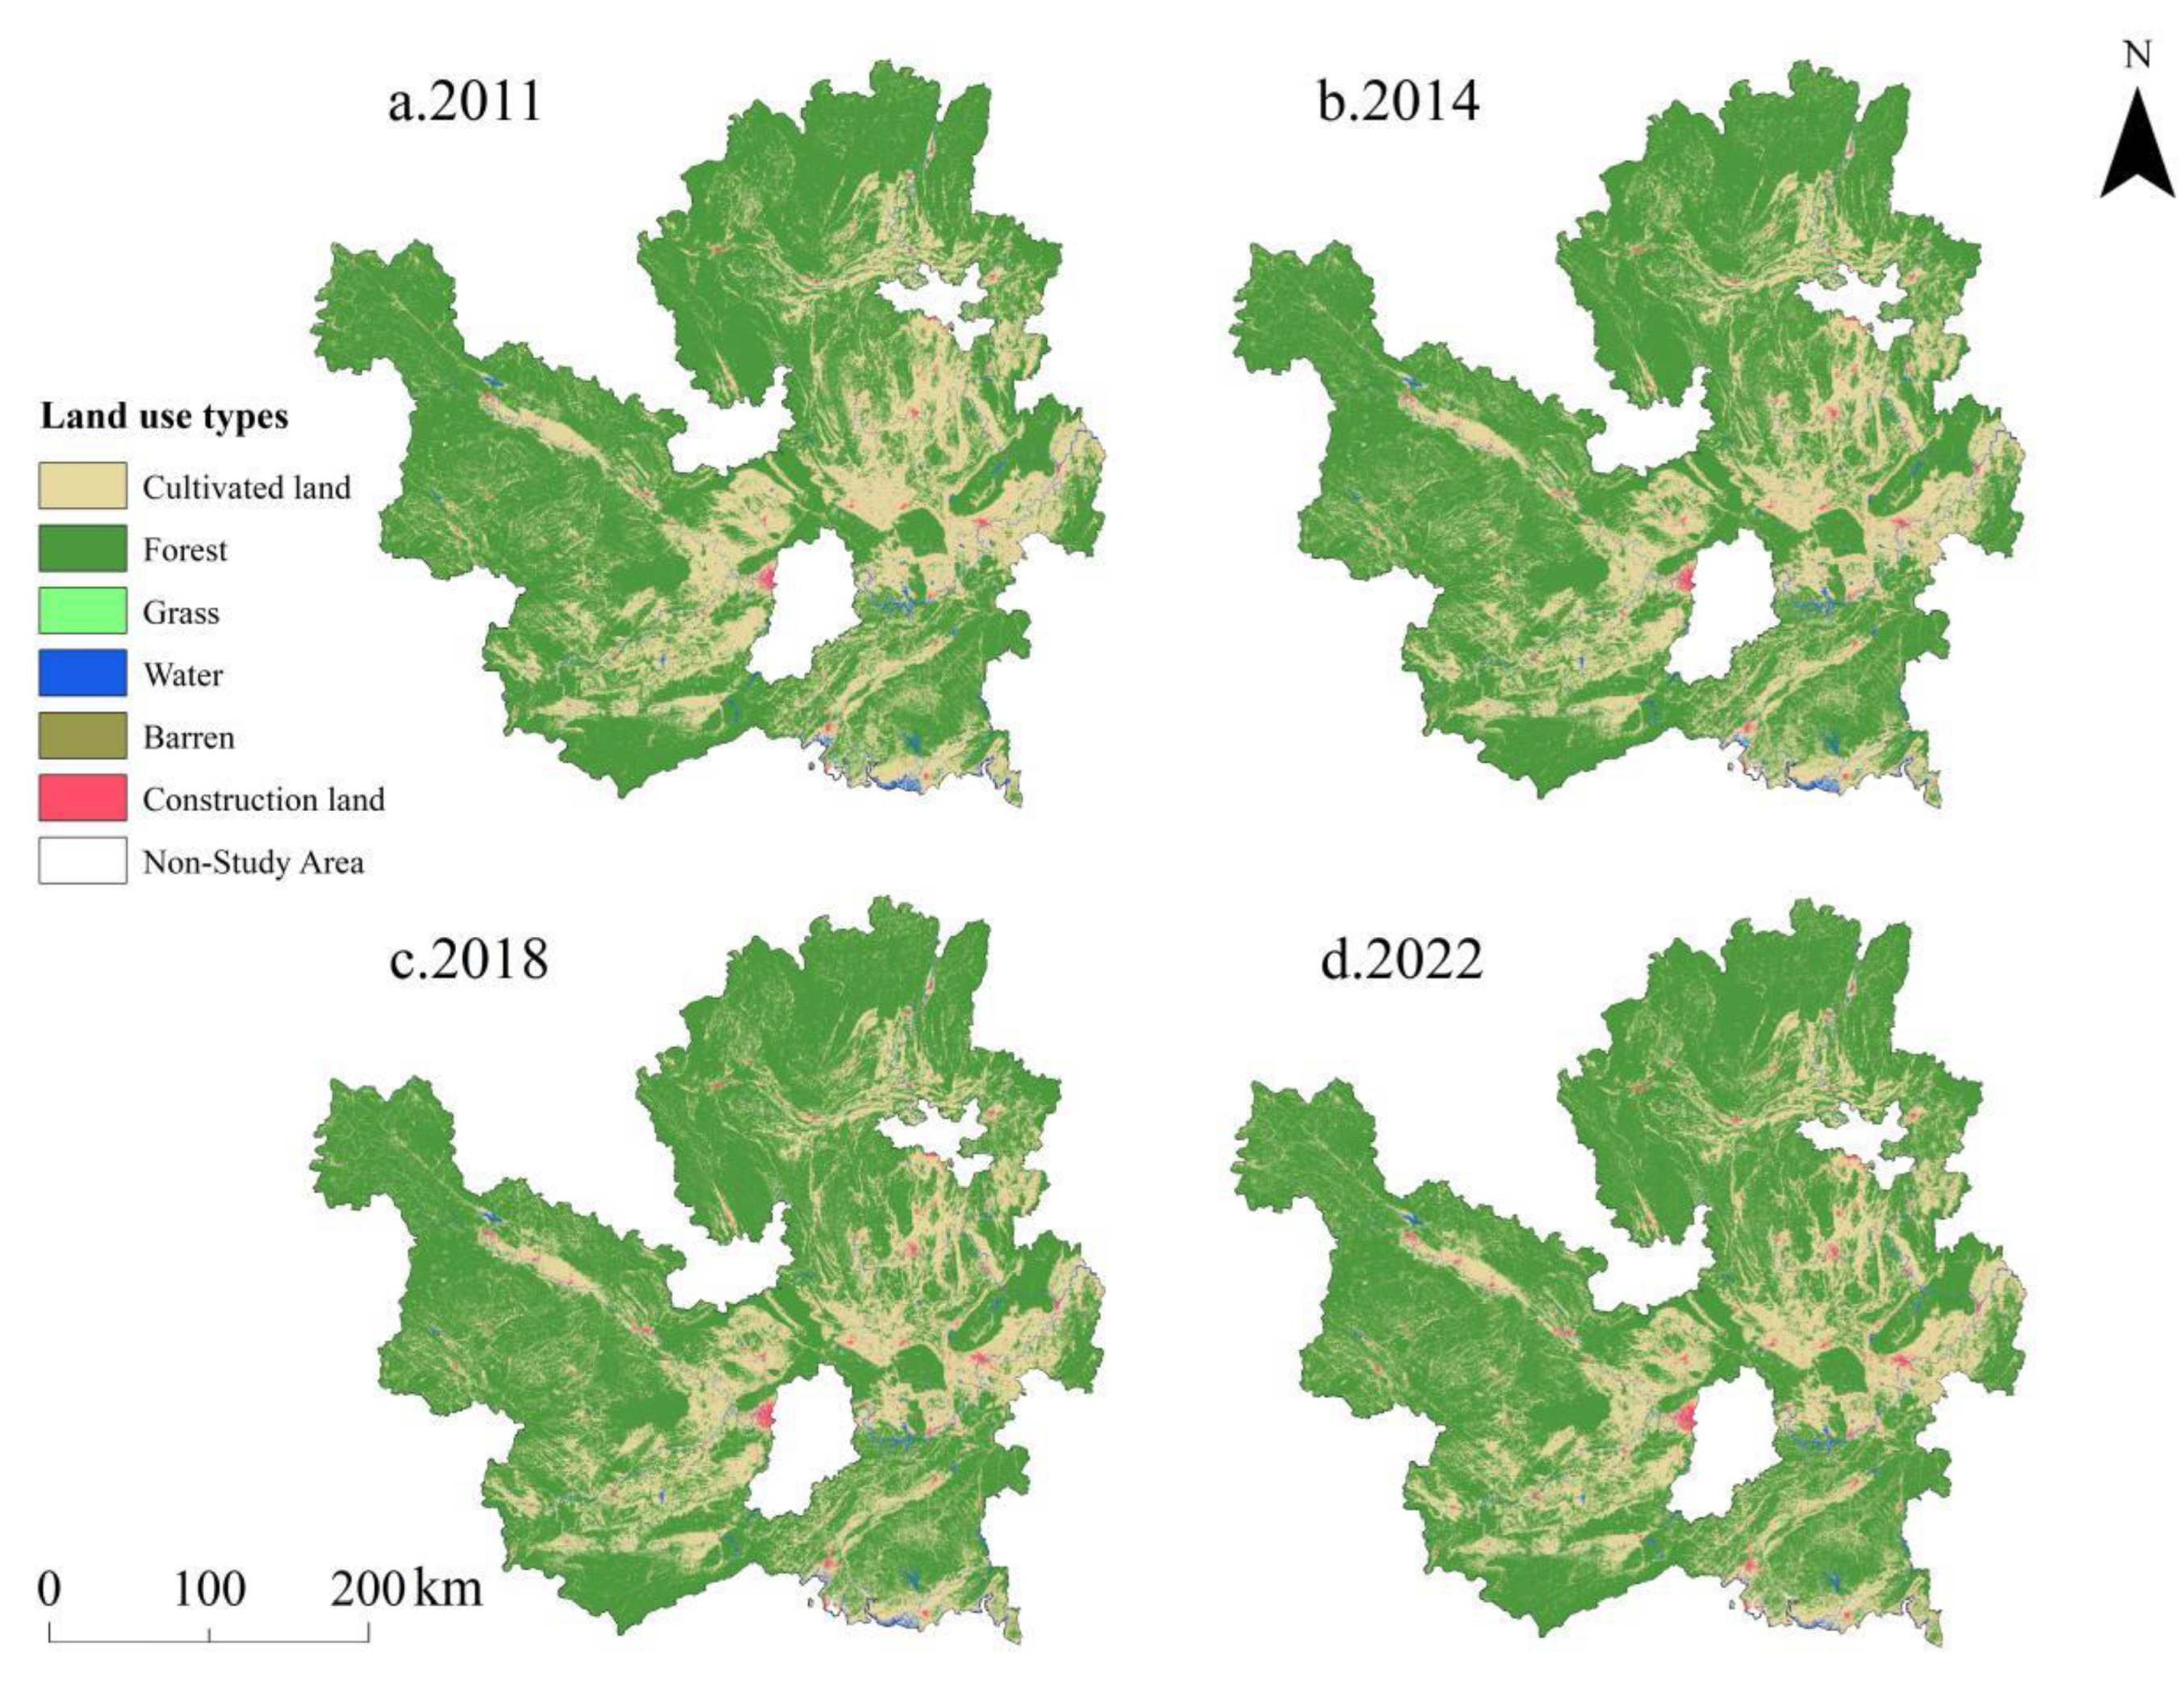
Figure 4.
Chord diagram of land use transitions in the study area from 2011 to 2022.
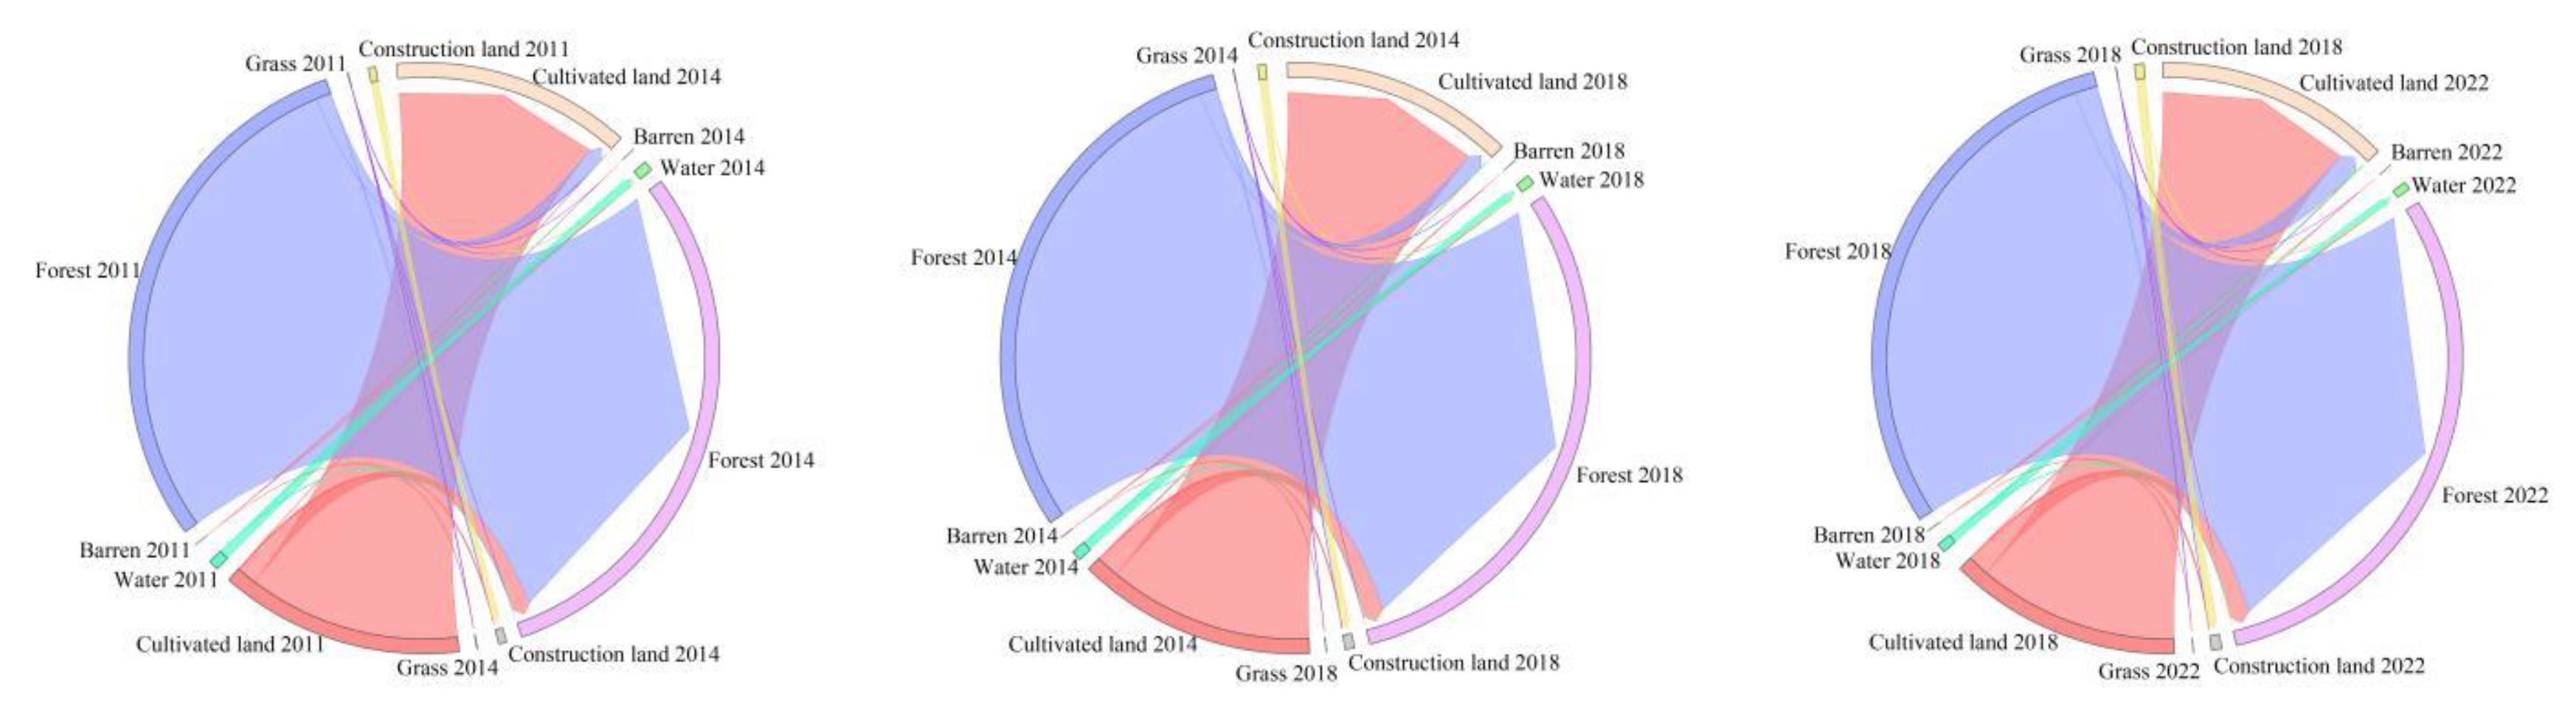
Figure 5.
Carbon storage levels of each district and county from 2011 to 2022.
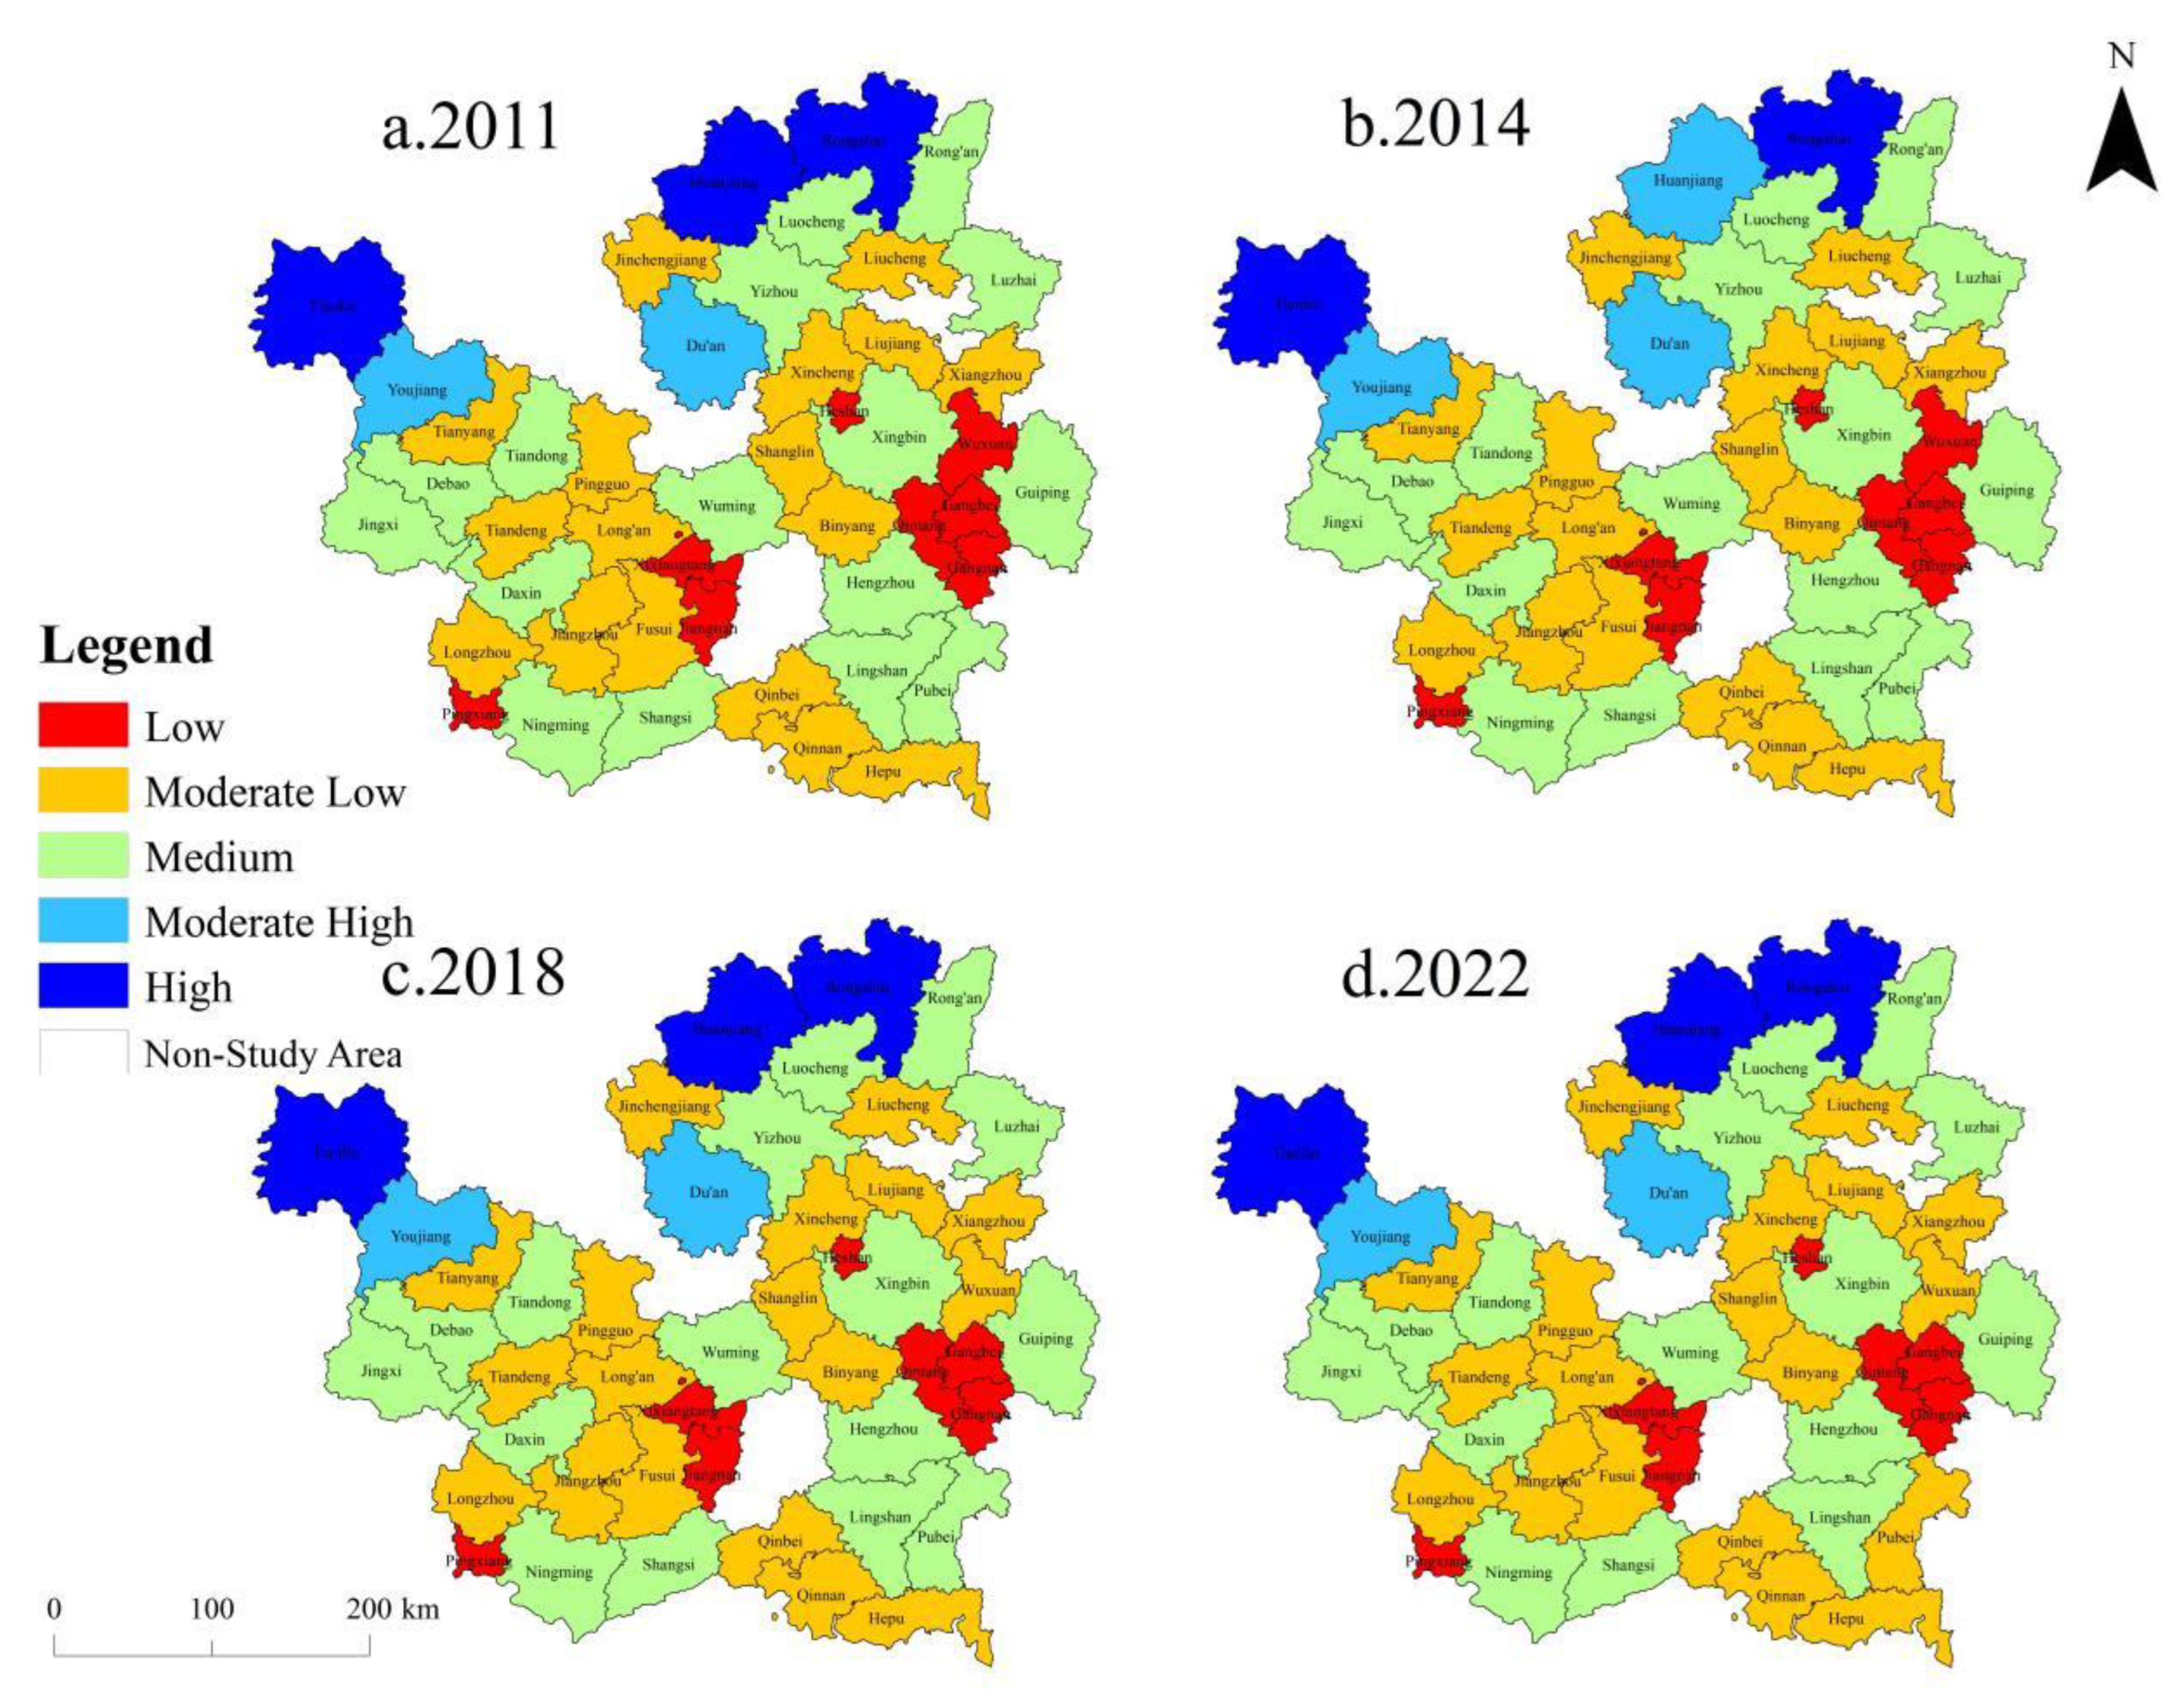
Figure 6.
Detection of carbon storage factors in the study area during 2011-2022.
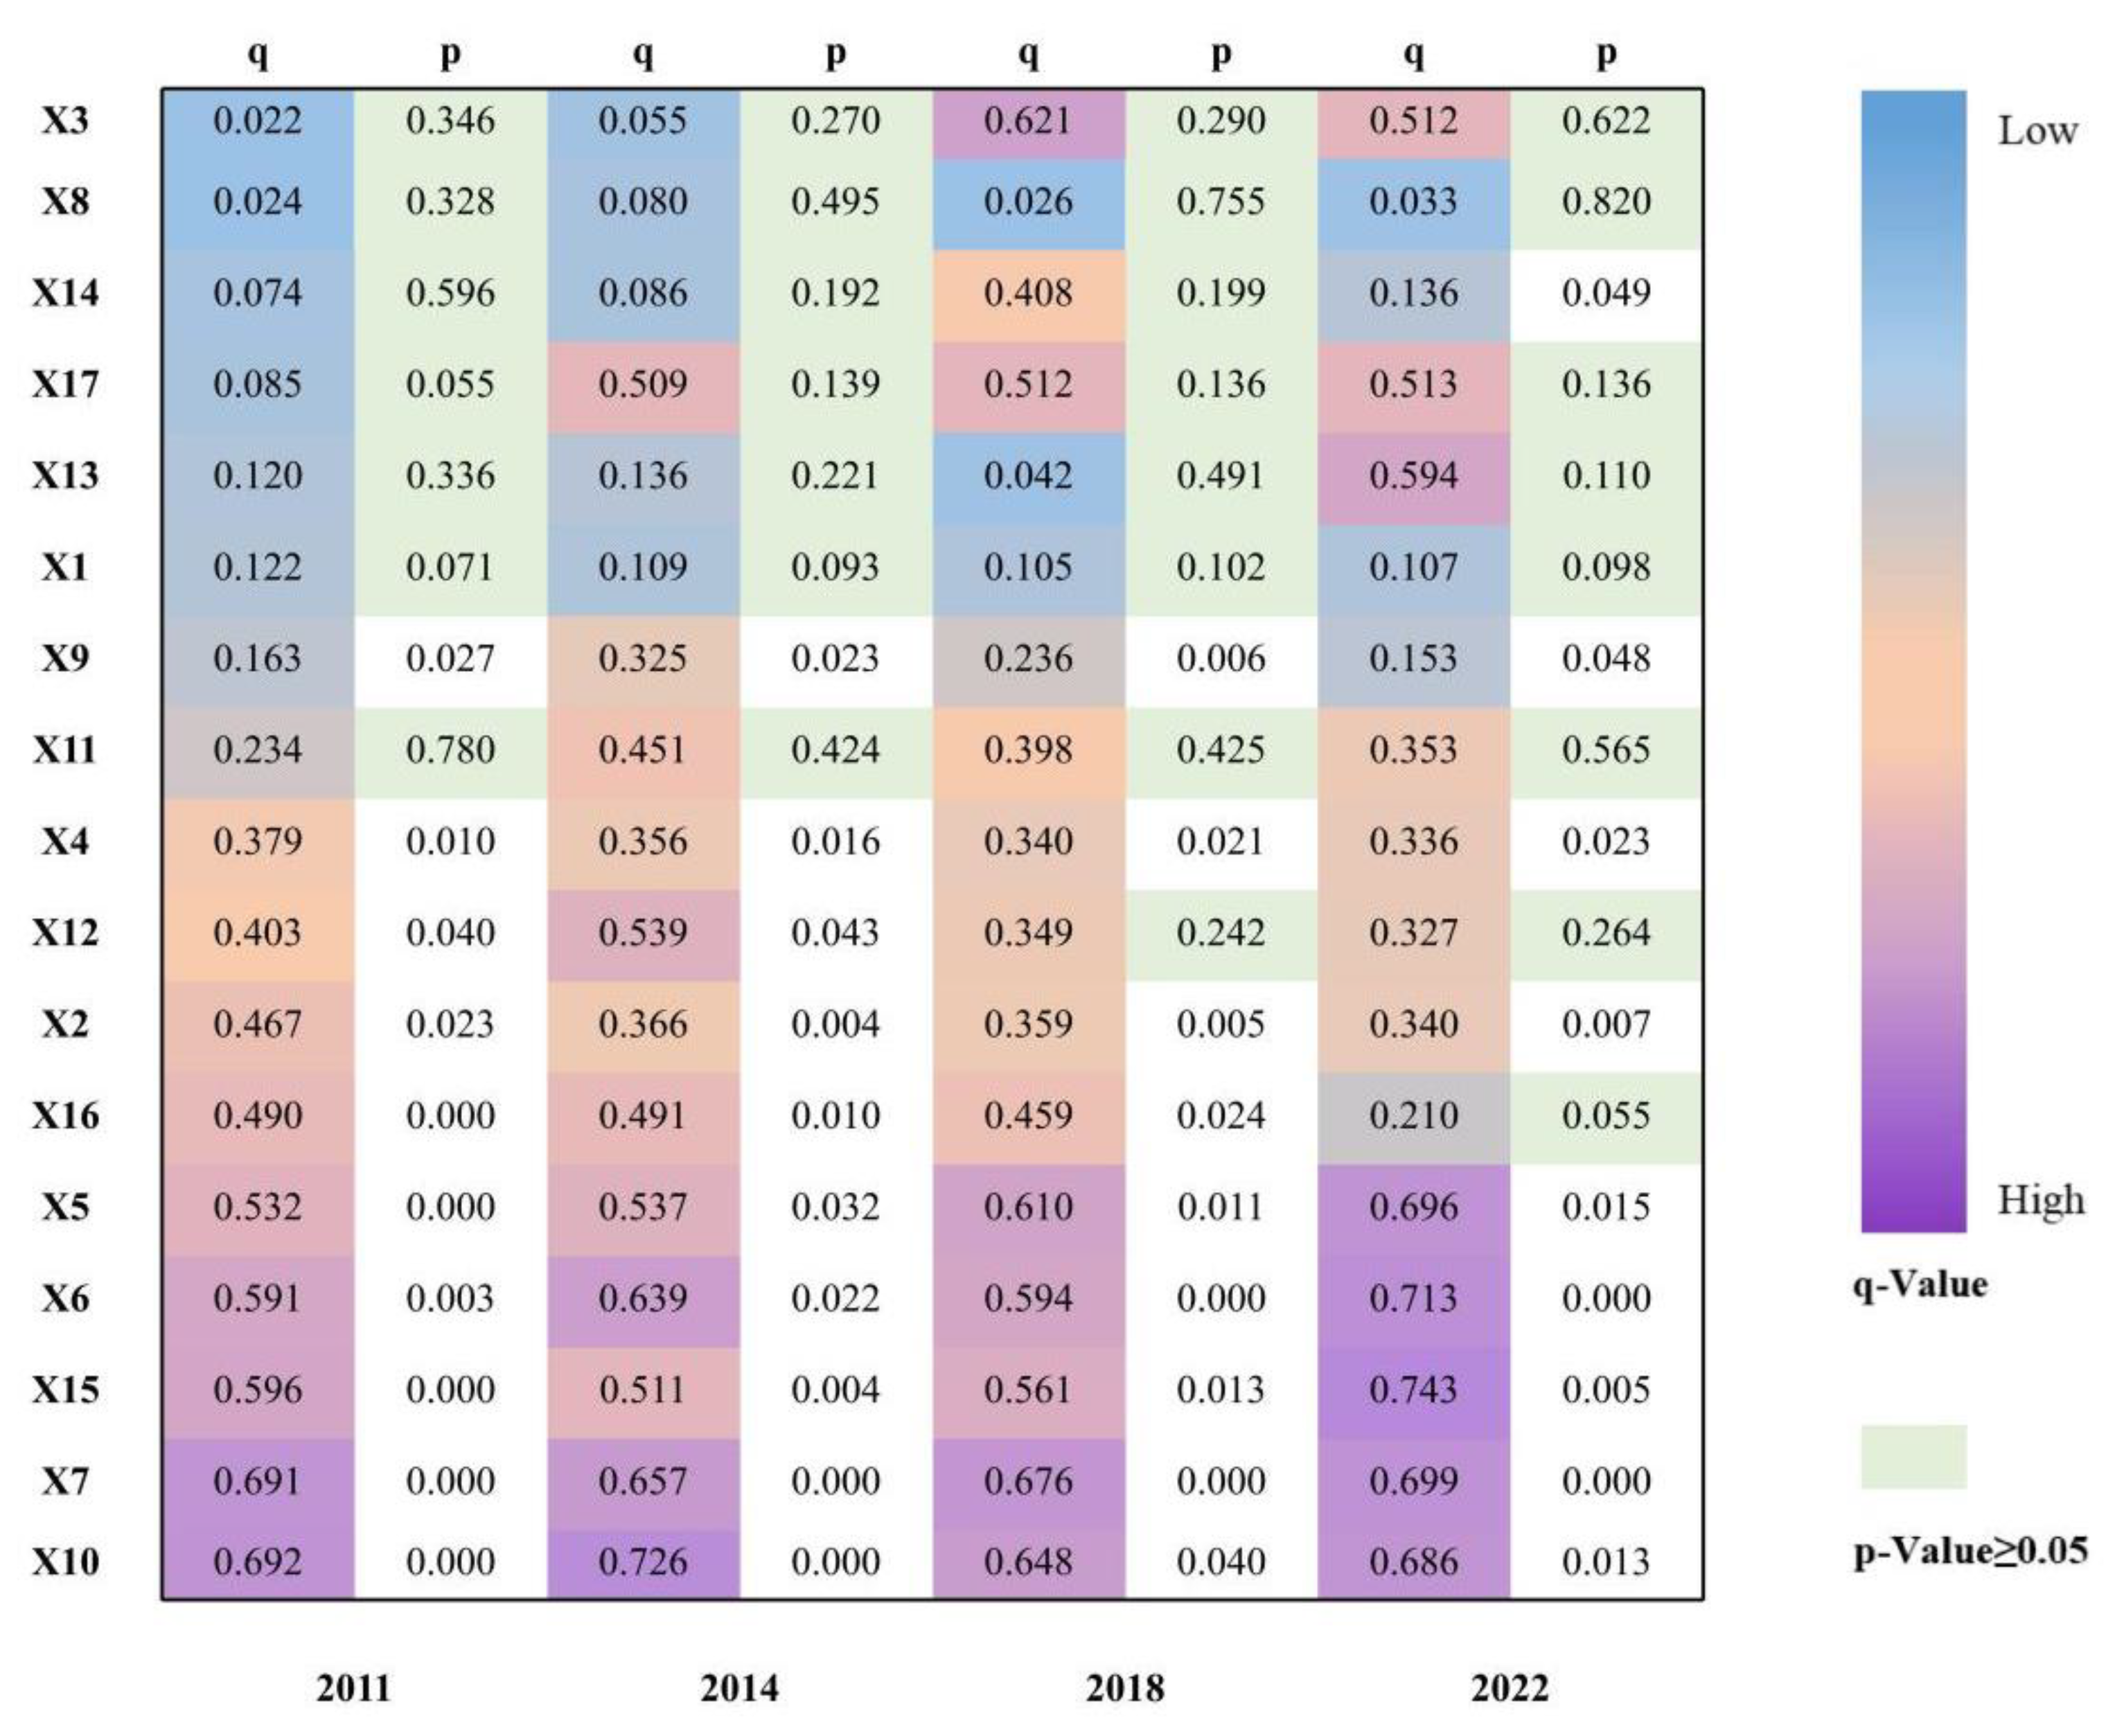
Figure 7.
Interaction detection of carbon storage in the study area during 2011-2022.
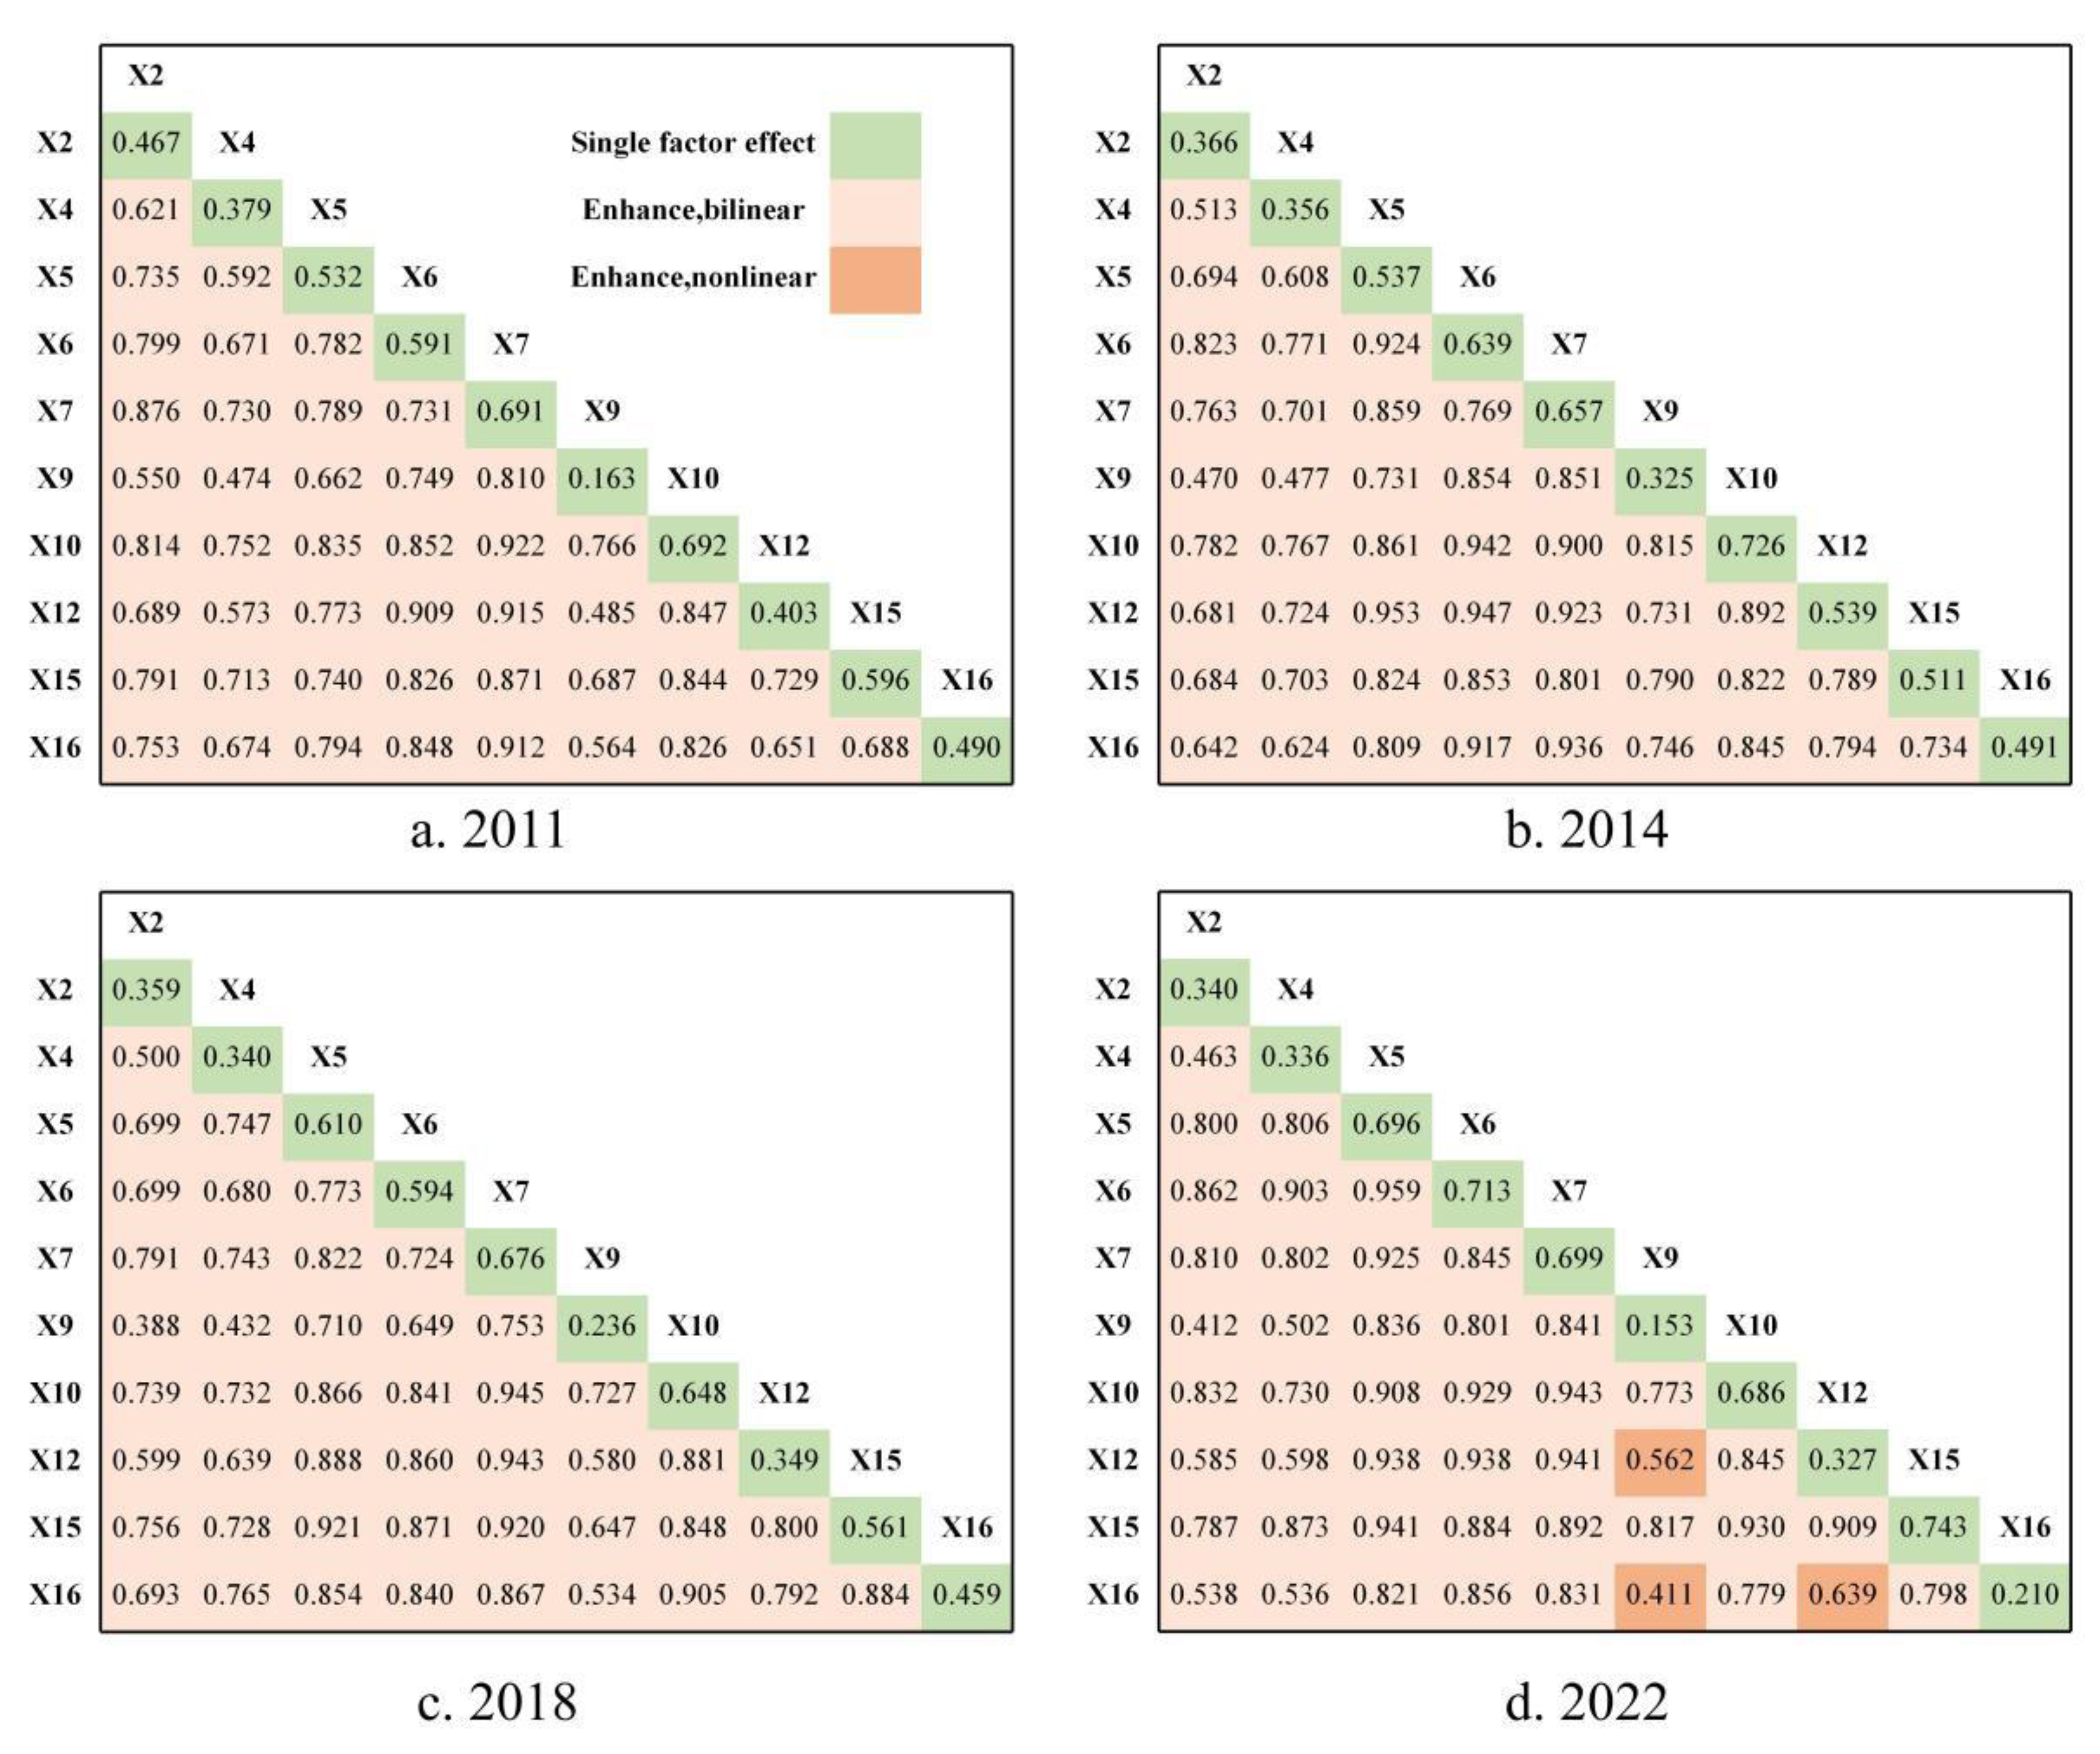
Table 1.
Types of study data and their sources.
| Data Type | Data Name | Year(s) | Data Source |
| Land use data | Land use status | 2011, 2014, 2018, 2022 | Remote Sensing Information Processing Institute (http://irsip.whu.edu.cn/) |
| Natural factors | Average slope | 2022 | Resource and Environment Data Center, CAS (http://www.resdc.cn/) |
| Forest coverage rate | 2011, 2014, 2018, 2022 | ||
| DEM | 2022 | Geospatial Data Cloud (http://www.gscloud.cn/) | |
| NDVI | 2011, 2014, 2018, 2022 | ||
| Annual sunshine hours | 2011, 2014, 2018, 2020 | China Meteorological Data Network (http://data.cma.cn/) | |
| Mean annual temperature | 2011, 2014, 2018, 2022 | ||
| Annual precipitation | |||
| Socioeconomic factors | Sugarcane planting area | Guangxi Bureau of Statistics/Statistical Yearbook (http://tjj.gxzf.gov.cn/) | |
| Sugarcane yield | |||
| Population | |||
| Primary industry GDP | |||
| General public budget expenditure | |||
| Number of industrial enterprises above designated size | |||
| Land urbanization rate | |||
| Road network density | 2013, 2014, 2018, 2022 | National Geographic Information Resource Directory Service System (http://www.webmap.cn/) | |
| Nighttime light index | 2011, 2014, 2018, 2022 | Resource and Environment Data Center, CAS (http://www.resdc.cn/) | |
| Distance to adjacent cities | 2022 |
Table 2.
Carbon Density of various land use types in the study area (t/hm2).
| LULC_name | C_above | C_below | C_soil |
| Cultivated land | 13.57 | 2.65 | 47.4 |
| Forest | 58.3 | 14.58 | 96 |
| Grass | 3.01 | 13.53 | 60 |
| Water | 2.8 | 2.4 | 0 |
| Barren | 3.4 | 0 | 31.4 |
| Construction land | 11.45 | 0.93 | 31.4 |
Table 4.
Area and percentage of land use types in the study area during 2011-2022.
| Land use types | 2011 | 2014 | 2018 | 2022 | ||||
| Area/km2 | Percent/% | Area/km2 | Percent/% | Area/km2 | Percent/% | Area/km2 | Percent/% | |
| Cultivated land | 37138.581 | 30.483 | 36329.046 | 29.818 | 35394.517 | 29.051 | 35731.644 | 29.328 |
| Forest | 81982.671 | 67.290 | 82648.001 | 67.836 | 83518.456 | 68.551 | 83272.032 | 68.349 |
| Grass | 80.771 | 0.066 | 83.938 | 0.069 | 64.929 | 0.053 | 45.320 | 0.037 |
| Water | 1532.788 | 1.258 | 1541.544 | 1.265 | 1436.712 | 1.179 | 1216.842 | 0.999 |
| Barren | 0.599 | 0.0005 | 0.561 | 0.0005 | 1.038 | 0.0009 | 2.186 | 0.0018 |
| Construction land | 1098.976 | 0.902 | 1231.296 | 1.011 | 1418.735 | 1.164 | 1566.362 | 1.286 |
Table 5.
Changes in land use type area and dynamic degree in the study region during 2011-2022.
| Land use types | 2011→2014 | 2014→2018 | 2018→2022 | 2011→2022 | ||||
| Area change/km2 | Dynamic/% | Area change/km2 | Dynamic/% | Area change/km2 | Dynamic/% | Area change/km2 | Dynamic/% | |
| Cultivated land | -809.535 | -2.180 | -934.529 | -2.572 | 337.127 | 0.952 | -1406.937 | -3.788 |
| Forest | 665.329 | 0.812 | 870.455 | 1.053 | -246.424 | -0.295 | 1289.361 | 1.573 |
| Grass | 3.166 | 3.920 | -19.009 | -22.646 | -19.609 | -30.201 | -35.452 | -43.892 |
| Water | 8.756 | 0.571 | -104.832 | -6.800 | -219.870 | -15.304 | -315.946 | -20.612 |
| Barren | -0.038 | -6.316 | 0.477 | 85.072 | 1.148 | 110.668 | 1.588 | 265.263 |
| Construction land | 132.321 | 12.040 | 187.439 | 15.223 | 147.627 | 10.406 | 467.386 | 42.529 |
Table 6.
Land use transfer matrix of Study area from 2011 to 2014.
| Land use types | Cultivated land | Forest | Grass | Water | Barren | Construction land | Total |
| Cultivated land | 33836.438 | 3089.237 | 20.660 | 68.477 | 0.000 | 123.770 | 37138.581 |
| Forest | 2417.180 | 79546.946 | 13.461 | 0.000 | 0.000 | 5.085 | 81982.671 |
| Grass | 20.522 | 4.449 | 48.755 | 1.997 | 0.095 | 4.954 | 80.771 |
| Water | 54.877 | 7.370 | 0.920 | 1464.638 | 0.110 | 4.874 | 1532.788 |
| Barren | 0.031 | 0.000 | 0.142 | 0.001 | 0.356 | 0.069 | 0.599 |
| Construction land | 0.000 | 0.000 | 0.000 | 6.431 | 0.000 | 1092.544 | 1098.976 |
| Total | 36329.046 | 82648.001 | 83.938 | 1541.544 | 0.561 | 1231.296 | 121834.386 |
Table 7.
Land use transfer matrix of Study area from 2014 to 2018.
| Land use types | Cultivated land | Forest | Grass | Water | Barren | Construction land | Total |
| Cultivated land | 32599.504 | 3505.519 | 20.101 | 31.734 | 0.036 | 172.153 | 36329.046 |
| Forest | 2649.155 | 79989.571 | 2.083 | 0.155 | 0.001 | 7.037 | 82648.001 |
| Grass | 20.743 | 13.019 | 41.493 | 1.337 | 0.644 | 6.701 | 83.938 |
| Water | 125.034 | 10.346 | 1.102 | 1398.217 | 0.038 | 6.808 | 1541.544 |
| Barren | 0.045 | 0.000 | 0.151 | 0.003 | 0.320 | 0.042 | 0.561 |
| Construction land | 0.036 | 0.000 | 0.000 | 5.267 | 0.000 | 1225.994 | 1231.296 |
| Total | 35394.517 | 83518.456 | 64.929 | 1436.712 | 1.038 | 1418.735 | 121834.386 |
Table 8.
Land use transfer matrix of Study area from 2018 to 2022.
| Land use types | Cultivated land | Forest | Grass | Water | Barren | Construction land | Total |
| Cultivated land | 31920.381 | 3288.267 | 12.456 | 28.718 | 0.068 | 144.627 | 35394.517 |
| Forest | 3544.106 | 79962.305 | 2.745 | 0.616 | 0.000 | 8.684 | 83518.456 |
| Grass | 23.869 | 5.747 | 29.592 | 0.644 | 0.946 | 4.130 | 64.929 |
| Water | 243.119 | 15.710 | 0.321 | 1169.828 | 0.526 | 7.209 | 1436.712 |
| Barren | 0.100 | 0.000 | 0.205 | 0.004 | 0.647 | 0.082 | 1.038 |
| Construction land | 0.070 | 0.003 | 0.000 | 17.033 | 0.000 | 1401.629 | 1418.735 |
| Total | 35731.644 | 83272.032 | 45.320 | 1216.842 | 2.186 | 1566.362 | 121834.386 |
Table 9.
Changes of carbon storage in the study area from 2011 to 2022m ×104 t.
| Land use types | 2011 | 2014 | 2018 | 2022 | ||||
| Carbon Stock | Percent/% | Carbon Stock | Percent/% | Carbon Stock | Percent/% | Carbon Stock | Percent/% | |
| Cultivated land | 23627.563 | 14.522 | 23112.537 | 14.147 | 22517.990 | 13.705 | 22732.470 | 13.849 |
| Forest | 138452.341 | 85.095 | 139575.950 | 85.434 | 141045.974 | 85.841 | 140629.813 | 85.673 |
| Grass | 61.822 | 0.038 | 64.246 | 0.039 | 49.696 | 0.030 | 34.688 | 0.021 |
| Water | 79.705 | 0.049 | 80.160 | 0.049 | 74.709 | 0.045 | 63.276 | 0.039 |
| Barren | 0.208 | 0.00013 | 0.195 | 0.00012 | 0.361 | 0.00022 | 0.761 | 0.00046 |
| Construction land | 481.132 | 0.296 | 539.062 | 0.330 | 621.122 | 0.378 | 685.753 | 0.418 |
| Total | 162702.772 | 100 | 163372.150 | 100 | 164309.852 | 100 | 164146.761 | 100 |
Disclaimer/Publisher’s Note: The statements, opinions and data contained in all publications are solely those of the individual author(s) and contributor(s) and not of MDPI and/or the editor(s). MDPI and/or the editor(s) disclaim responsibility for any injury to people or property resulting from any ideas, methods, instructions or products referred to in the content. |
© 2025 by the authors. Licensee MDPI, Basel, Switzerland. This article is an open access article distributed under the terms and conditions of the Creative Commons Attribution (CC BY) license (http://creativecommons.org/licenses/by/4.0/).
Copyright: This open access article is published under a Creative Commons CC BY 4.0 license, which permit the free download, distribution, and reuse, provided that the author and preprint are cited in any reuse.


