
Submitted:
23 September 2025
Posted:
25 September 2025
You are already at the latest version
Abstract
Urban agglomerations are crucial for promoting the balanced development of carbon emissions (CE) and ecosystem services (ES). However, a structural imbalance exists between land use carbon emissions (LUCE) and ES, compounded by the absence of standardized measurement frameworks and clear governance strategies. This research uses the Chang-Zhu-Tan urban agglomeration as a case study to establish a spatial association network linking LUCE and ES, based on multi-source data from 2010 to 2023. Centrality metrics are utilized to assess connectivity, accessibility, and channel functions. To identify key factors, three heterogeneity indices are developed for evaluation and driving factor analysis. The findings are as follows: (1) Both LUCE and ES networks display corridor-like and cross-domain connections, but with asymmetric node structures. The degree centrality of the LUCE-Network increased from 0.16 to 0.29, while that of the ES-Network rose from 0.16 to 0.23. (2) Heterogeneity was generally positive in the initial stages but turned negative by 2023, signifying a shift from a dominance of carbon networks to one dominated by ecological networks. The positive bias is concentrated along primary urban corridors and boundaries, whereas negative bias is observed in green zones and mountainous water networks. (3) The heterogeneity is influenced by spatial layout, natural environments, and human activities. Among the driving factors, the proportion of built-up land (X11) grew from 0.0187 in 2010 to 0.1500 in 2023, intensifying the disparity between LUCE and ES networks. The urbanization rate (X7) surged to 0.1558 in 2023, up from 0.0761 in 2010, which contributed to increased CE and heightened demand for ES. Forest cover (X10) progressively strengthened the ES-Network, reaching 0.1378 by 2023. In general, urbanization and land use shifts have significantly altered the spatial organization of LUCE and ES. (4) Based on structural correction and process coupling, a collaborative pathway is proposed: stringent control of new developments and rehabilitation of existing structures in high positive-bias corridors and hubs, with a focus on ecological and river-lake connectivity projects; extensive restoration and expansion of green zones and mountainous water networks; reduction of single-channel dependency through public transport prioritization, energy efficiency upgrades, clean energy transitions, and multimodal transport strategies; and the establishment of a threshold-monitoring-assessment system through heterogeneity indices and key variables. This research suggests transforming average coupling assessments into actionable diagnostics for network structural differences and enables the identification of driving factors and the implementation of collaborative pathways, offering a replicable framework for low-carbon and ecological governance in urban agglomerations.
Keywords:
land use carbon emissions
; ecosystem services
; spatial association network
; driving mechanisms
; Chang-Zhu-Tan urban agglomeration
1. Introduction
Global climate governance has reached a critical juncture, centered around achieving the "dual carbon" objectives (Chen et al., 2020). Land use change and energy consumption, particularly through the expansion of construction land, are widely acknowledged as major human-driven factors contributing to disturbances in the carbon cycle and changes in ES at the regional level (Tian et al., 2021; Zhang et al., 2024). In line with the Paris Agreement's target to limit global warming to below 2°C above pre-industrial levels (Jiang et al., 2023), it is crucial to identify and address these driving forces and their spatial interactions in highly urbanized areas (Muga et al., 2025). This not only affects carbon reduction efficiency (Yu et al., 2022), but also influences the resilience of ecosystem multifunctionality, encompassing supply, regulation, and cultural services (Huang et al., 2024; Zhao et al., 2025). Extensive research has demonstrated that land use and cover change (LUCC) directly alters carbon storage by changing ecosystem types (Zhao et al., 2023), while energy consumption exacerbates regional carbon emissions through the expansion and intensification of construction land. Initiatives such as the Global Carbon Project further substantiate the substantial role of land use change in cumulative historical carbon emissions (Wang et al., 2024; Zeng et al., 2022). These findings underscore the need for a systematic approach to assess the spatial heterogeneity and cross-domain interactions of urban agglomerations, with a focus on the interplay between the LUCE and ES "dual systems" under conditions of uncertainty.
Rapid urban expansion and land use change have been repeatedly identified as key factors reshaping the spatial patterns of CE and ES (Huang et al., 2023; Xu et al., 2023), generating a complex tension between the two systems (Wang et al., 2025). Research indicates (Liu et al., 2023; Zhao et al., 2023) that by 2030, urban land use will continue to expand rapidly, and its direct impact on biodiversity and carbon pools will become increasingly significant. This expansion, combined with growing energy consumption, is driving the rise in CE, presenting a major challenge within current human-environment systems. Furthermore, the IPCC guidelines, revised in 2006 and 2019, have established a universal methodology for energy accounting (Gao et al., 2021; Yang et al., 2022), providing a solid foundation for multi-scale carbon emission calculations and a framework for comprehensive "land-carbon-ecosystem" assessments at the regional level (Wang and Hao, 2023). In the case of urban agglomerations in China, primarily driven by industrialization and infrastructure development, the global consensus is reflected in the fact that construction land expansion and increased intensity often lead to significant carbon emission increases (Chen et al., 2022; Guo et al., 2022). Meanwhile, the contraction and fragmentation of ecological spaces, which weaken ES provision, exhibit notable spatial heterogeneity and spillover effects. These dynamics highlight the need for network-based characterization and regulatory simulations at the urban agglomeration scale (Tian et al., 2022).
The classical paradigm of ES highlights the various ways in which ecosystems contribute to human well-being. However, recent studies have increasingly focused on the spatial coupling of services through a “supply-demand-flow” framework (Shi et al., 2021), emphasizing that services are not confined to the supply side but also flow across regions via social and natural networks. Research (Wen and Wang, 2023; Zhang et al., 2023) points to a stable synergy-tradeoff structure between ES, noting that neglecting beneficiaries, flow paths, and landscape history could lead to misinterpretations of these relationships. Methodologically, frameworks such as SPAN conceptualize ES as an actual flow from supply areas to benefit zones, emphasizing connectivity and path dependence (Zhan et al., 2024; Elliot and Levasseur, 2022). This perspective forms the theoretical basis for embedding ES into a network context and stresses the need to identify “key channels” and “spillover benefits” at the urban agglomeration level (Zhang et al., 2024). In the case of the Chang-Zhu-Tan urban agglomeration, the region's spatial structure—characterized by alternating mountains and plains, along with the urban-industrial-agricultural complexity—suggests that ES flows are inherently directional and subject to obstruction (Jiang et al., 2023). These spatial patterns do not overlap with the processes of LUCE accumulation and diffusion, laying the foundation for the development and interpretation of the “dual network” heterogeneity index (Figueroa-López and Mancini, 2019). On the methodological front, tools like In-VEST have become vital for assessing key ES, such as water production, carbon storage, soil retention, and habitat quality (Gou et al., 2021). Complementary landscape pattern metrics have shown how fragmentation, connectivity, and patch morphology constrain ES supply. Further studies (Zhu et al., 2021; Wang et al., 2024) suggest that measuring ES synergies and trade-offs requires moving beyond simple correlations to embrace models that account for non-linearity, spatial spillovers, and multi-scale coupling. These cumulative findings lay the groundwork for translating “patterns to networks” at the urban agglomeration scale, starting with the “process-pattern” model to capture the spatial distribution of ES and LUCE, and applying network-based methods to analyze city interactions and intermediary structures, ultimately identifying “key nodes - key channels - key scenarios” for governance (Tian et al., 2022).
Traditional spatial econometrics primarily focuses on spatial autocorrelation and spillover effects driven by distance (Singh et al., 2022). However, cross-border interactions within urban agglomerations are more effectively captured using a "network" framework (Feng et al., 2024). The gravity model describes the intensity of potential flows, while centrality measures the structural position of nodes in terms of connectivity, proximity, and mediation. Representing LUCE-Networks and ES-Networks as a "multilayer network" (Song et al., 2022) enables the comparison of structural differences between the two processes at the same node. Network science and spatial interaction models provide a strong theoretical basis for the "centrality heterogeneity index" proposed in this study, facilitating a shift from "single-layer coupling" to "cross-layer structural differences." In the context of urban agglomerations in China, previous research (Fan et al., 2022; Zhao et al., 2023) has shown that central nodes in the LUCE-Network often coincide with industrial structure, population density, and transportation corridors. Meanwhile, ES in regions such as the Yangtze River Economic Belt, the Yangtze River Delta, and the Pearl River Delta exhibit significant spatial spillovers and gradient transitions (Watanabe and Ortega, 2014). Specifically, in the Chang-Zhu-Tan urban agglomeration, ecological security patterns, habitat quality, water production, and soil retention reveal an ecological foundation characterized by "higher north, lower south, better west, and weaker east." Additionally, carbon emission hotspots and ecological cold spots often co-occur due to urban expansion and industrial clustering (Ouyang et al., 2022). While existing studies typically use coupling coordination or correlation frameworks to explore "carbon-ecosystem" interactions, they often overlook "structural differences at the network level," particularly the lack of cross-layer comparisons and identification of key nodes and channels within the same urban agglomeration (Peters et al., 2019; Zhong et al., 2024). Regarding driving factor identification, traditional spatial econometrics can capture spillover effects, but in high-dimensional, nonlinear, and interaction-heavy geographical contexts, techniques like Random Forests (RF) have proven effective in both ecology and geography. These methods offer interpretability through feature importance and SHAP values, linking "network structural differences" with the nonlinear coupling of "environmental-social-spatial" factors (Ke et al., 2022).
This study tackles the following key scientific questions: (1) Under conditions of strong connectivity, how are the structural differences between LUCE and ES networks reflected spatially, and what are the common patterns and distinctive features of their heterogeneity across connectivity, accessibility, and mediation? (2) How do natural, social, and land factors drive this heterogeneity in nonlinear and interactive ways, and what are their relative significance, potential thresholds, and influence pathways? (3) How can the understanding of the "structure-mechanism" relationship be translated into a practical, scalable collaborative pathway for urban agglomerations, ensuring a balance between carbon reduction efficiency and the resilience of ES provision? In line with these questions, the research objectives are: (1) To construct and compare the structural characteristics of LUCE and ES networks, quantifying their heterogeneity indices; (2) To identify the key driving factors and uncover their mechanisms; (3) To propose collaborative governance strategies for urban agglomerations, offering evidence-based insights and supporting decision-making for regional low-carbon and high-quality ecological development.
2. Reasearch Framework
This study introduces an integrated framework of "data-modeling-measurement-mechanism-collaboration"(Figure 1). Using county-level units within the Chang-Zhu-Tan urban agglomeration, multi-source geographic and statistical data are integrated to account for LUCE and assess ES. A modified gravity model is then used to capture cross-domain interactions, generating weighted spatial association matrices for both LUCE and ES. These matrices are binarized with threshold values to create spatial association networks for each domain. The spatial network structure is analyzed at both the overall and individual levels, with three heterogeneity indices constructed based on centrality measurements from the LUCE-Network and ES-Network. These indices are compared across four time points: 2010, 2015, 2020, and 2023. In addition, random forest analysis identifies the importance of factors such as the natural environment, socio-economic conditions, and land use structure in driving heterogeneity, revealing the dominant mechanisms and key factors. Finally, the results are translated into collaborative pathways that focus on "connectivity-accessibility-mediation" across three levels, with threshold-based control and evaluation loops, offering a full-chain approach from structural discovery and causal explanation to actionable strategy implementation.
3. Data and Methods
3.1. Study Area
The Chang-Zhu-Tan metropolitan area, located in central China, includes the entire Changsha city, central urban districts of Zhuzhou and Liuling, as well as the central urban areas of Xiangtan, Xiangtan County, and Shaoshan City. It spans 19 districts and counties, covering about 18,900 km². As of 2023, the region’s permanent population is 16.68 million, with an urbanization rate of 81.5% and a GDP of 2.07 trillion yuan, making it the leading economic and population growth engine in Hunan Province (Xie et al., 2023).
The region enjoys favorable geographical conditions, including a mild and humid climate, abundant natural resources, and a solid ecological environment, all of which support its development (Huang et al., 2024). Vital ecosystems like the Xiangjiang River Basin and Dongting Lake Wetland play crucial roles in water conservation, water quality purification, and provide valuable habitats for biodiversity (Wu et al., 2024). However, with rapid urbanization, land use patterns and CE in the region have changed significantly (Figure 2). The expansion of urban construction land, industrial growth, and increased transportation infrastructure have led to a sharp rise in CE. While agricultural lands and forests have somewhat alleviated the CE pressure, over-exploitation of resources continues to negatively impact the ecosystem. The region's ES mainly include water conservation, biodiversity protection, and carbon sequestration. However, as urbanization and industrialization progress, the area of natural ecosystems, such as wetlands and forests, is decreasing, leading to ES degradation. Thus, effective land use planning and ecological protection measures are essential for the region’s sustainable development. LUCE and ES in the Chang-Zhu-Tan urban agglomeration are interconnected with several factors. Climate, topography, and hydrological conditions directly influence the stability of the regional ecosystem and its carbon sequestration capacity. Natural ecosystems such as wetlands and forests are crucial for carbon sequestration and water conservation. Additionally, socio-economic development and population concentration drive land use changes, accelerating urbanization and industrialization, which intensifies the conflict between CE and ES. The expansion of urban construction land and the reduction of agricultural and forest lands are key contributors to the rise in CE and the degradation of ES.
3.2. Research Date
This study utilizes three types of datasets: land use, auxiliary geographic, and panel data (Table 1), which support the entire process of LUCE accounting, ES evaluation, spatial association network construction, and the analysis of the driving factors behind network differences. The land use data covers the years 2010, 2015, 2020, and 2023, primarily for CE accounting and indicator development. It is obtained from the Resource and Environmental Science Data Center of the Chinese Academy of Sciences, with a spatial resolution of 30 m. The data is organized according to a secondary classification system to ensure high spatiotemporal consistency and comparability. The auxiliary geographic data includes soil, environmental, and climate datasets, which are primarily used for ES evaluation and the importance assessment of driving factors. These datasets are sourced from the National Meteorological Information Center and the Geospatial Data Cloud, with resolutions ranging from 30 m to 1000 m. Panel data is used for CE accounting and analyzing the driving mechanisms, with data sourced from the "Hunan Statistical Yearbook".
3.3. Research Methods
3.3.1. Carbon Emission Accounting
In this study, CE from cultivated land, forest land, grassland, water bodies, and unused land are calculated using the direct CE coefficient method (Lungarska and Chakir, 2024).The carbon balance equation is as follows:
In the formula, Cz represents the total CE from land use; ei represents the CE of the land use type i; Si represents the area of the land use type i; βi represents the CE coefficient associated with the land use type i.
Based on previous research findings (Feng et al., 2024; Zhao et al., 2025) and the specific context of the Chang-Zhu-Tan urban agglomeration, the CE coefficients for land use in the region are derived, as detailed in Table 2.
The CE from construction land are calculated using an indirect CE method, as outlined below:
In the formula, Cj represents the total indirect CE from land use; ek represents the CE generated by the type k of energy; Ek represents the energy consumption of the type k of energy; μk represents the conversion factor for the type k of energy to standard coal; εk represents the CE coefficient of the type k of energy. According to the energy CE coefficients outlined in the international IPCC CE calculation guidelines (Table 3). The formula for calculating the total CE in the Chang-Zhu-Tan urban agglomeration is as follows:
In the formula, E represents the total CE within the region.
3.3.2. Ecosystem Service Evaluation
ES refer to the direct or indirect contributions of ecosystems to human society and well-being, with their supply level serving as a key indicator of regional development potential. As human activities increasingly impact the natural environment, along with ongoing socio-economic development and urban expansion, the area of natural environments diminishes, resulting in a significant reduction in ES supply within urban agglomerations. At the same time, population growth drives an escalating demand for ES, including water, energy, and food. Therefore, it is essential to focus on the supply capacity of key ES that have substantial effects on urban agglomerations, such as regulating, provisioning, and supporting services. Based on relevant literature (Song et al., 2022; Zhong et al., 2024), this study quantifies the value of ES by assessing four supply types that significantly influence socio-economic development: water resources, carbon storage, soil conservation, and habitat quality. The supply capacities of these four ES types are then normalized and weighted to calculate the overall ES level. The specific quantification methods and formulas for these services are outlined in Table 4.
3.3.3. Modified Gravity Model and Spatial Association Matrix
A modified gravity model is used to depict the correlation between ES and LUCE across regions, and this value reflects the gravitational strength between cities for both. Based on prior research (Tian et al., 2021; Muga et al., 2025), when calculating city attraction, socio-economic factors should be taken into account. Thus, GDP and population weight parameters are incorporated into the model for calculation. The specific calculation is as follows:
In the formula, dij represents the spatial distance between city i and city j, where the spatial distance is calculated using urban centers; G, P represents the city GDP, and the population; The correlation between ES between cities is calculated, Rij represents the gravitational pull, C represents the overall ES, while k is an adjustment factor that reflects the weight of the connection between ES in regions i and j. In calculating the correlation of LUCE between cities, Rij represents the CE gravitational pull, C represents the total LUCE for the region, and k reflects the weight of the relationship between LUCE in regions i and j. Based on this model, a gravitational matrix for LUCE and ES is constructed. The average gravitational pull for each row is used as the benchmark value. Values greater than the average are assigned 1, while those less than or equal to the average are assigned 0, resulting in a 0-1 matrix.
3.3.4. Spatial Association Network Structure Analysis
Social network analysis is an interdisciplinary method for studying "relational data" and has been widely applied across various fields. Based on related studies (Zhang et al., 2024; Wang et al., 2024), this paper applies social network analysis to investigate the structural characteristics of the spatial association network between LUCE and ES in the Chang-Zhu-Tan urban agglomeration, both at the overall and individual levels.
The overall structural characteristics of the spatial association network are captured through five indicators: network relations count, network density, network connectivity, network degree centrality, and network efficiency. The network relations count represents the number of connections formed by each node in the network, while network density reflects the closeness of these connections. A higher number of network relations and greater density indicate that spatial associations between LUCE across regions are becoming more interconnected. Network connectivity measures the robustness of the spatial network, highlighting the effect of unreachable node pairs on its stability. A value of 1 indicates no unreachable node pairs, implying a more robust spatial association network. Network degree centrality gauges the asymmetry of access within the network. High centrality suggests that certain nodes hold a "leadership" role, controlling the flow of elements within the network. If these central nodes face disruptions, the network's stability may decrease. A lower degree centrality, however, indicates that the network is less reliant on individual nodes, enhancing its stability. Network efficiency measures the number of network links, with lower efficiency indicating greater stability for the entire network.
Individual characteristics of the network are captured through degree centrality, closeness centrality, and betweenness centrality. Higher degree centrality signifies a node's proximity to the network center. When a node’s degree centrality surpasses the average, it has a stronger influence on other nodes in the network. Closeness centrality reflects a node's ability to remain unaffected by others, with higher values indicating better access to other nodes and a clearer advantage in transmitting information and promoting flow. Betweenness centrality represents a node's intermediary role within the network. A node with high betweenness centrality occupies more shortcut paths between other nodes, strengthening its role as an intermediary.
3.3.5. Spatial Association Network Heterogeneity Analysis
The heterogeneity of the spatial association network is quantified using a heterogeneity index, which reflects the differences in node centrality between the LUCE-Network and ES-Network. The specific formula for calculation is as follows:
In the formula, i represents the node in the network; Ccarbon(i) is the degree centrality of node i in the LUCE-Network; Ceco(i) is the degree centrality of node i in the ES-Network. H(i) is the heterogeneity index of node i in the network. If H(i) is positive, it indicates that this node is more important in the LUCE-Network; if H(i) is negative, it indicates that the node is more important in the ES-Network.
3.3.6. Driving Factor Importance Assessment
This study uses the Random Forest model to assess the driving factors behind the heterogeneity of the LUCE and ES spatial association networks. Random Forest is an ensemble learning method that builds multiple decision trees and performs voting or regression, effectively identifying and evaluating the importance of various features to the target variable. In this study, the importance of each feature is evaluated by calculating the reduction in mean squared error (MSE) for each feature. The specific steps are as follows:
First, calculate the MSE of the model without any feature exchange:
In the formula, yi is the actual value, is the predicted value, and N is the sample size.
Next, for each feature j, randomly shuffle the data of that feature at each node of each decision tree, and then recalculate the model's MSE:
Here, is the predicted value after the feature j has been shuffled.
Next, calculate the change in MSE for that feature, which represents its contribution to the model's predictive performance:
Finally, by averaging the MSE changes across all trees, the contribution of that feature to the prediction of the target variable is obtained:
Here, T is the total number of decision trees, and is the change in the MSE of feature j in the tree t.
4. Results and Analysis
4.1. Overall Spatiotemporal Pattern
Using the LUCE accounting method, ES assessment approach, and gravity model formula, the spatial association strength between LUCE and ES is calculated, and a binary spatial association matrix is created. Based on the LUCE and ES gravity data, along with ArcGIS mapping tools, spatial association network structure diagrams for LUCE and ES are plotted.
Figure 3 illustrates the significant changes in the spatial distribution of LUCE over time. In 2010, carbon emissions were mainly concentrated in highly urbanized areas, particularly in the central urban districts of Changsha and its surrounding industrial zones. These areas became the primary sources of carbon emissions due to the expansion of construction land and dense population. By 2023, as urbanization accelerated, carbon emissions spread to the urban periphery, especially in the industrial zones of Xiangtan and Zhuzhou, showing that land use changes directly influenced the spatial movement of carbon emissions. Regarding spatial network structure, the connectivity of the LUCE-Network also gradually increased over time. In 2010, the network was relatively fragmented, with localized connections centered around Changsha. By 2020 and 2023, the connectivity of the LUCE-Network had significantly improved, with stronger interactions between multiple regions centered around Changsha. This change not only highlights the role of urban expansion in driving carbon emissions but also shows the strengthening of emission flows within the region, particularly between transportation hubs and industrial areas, making the LUCE-Network more centralized.
Figure 4 shows that the spatial distribution of ES follows a different trend compared to LUCE. In 2010, ES was relatively evenly spread across the Chang-Zhu-Tan region, with a concentration in areas where forests, wetlands, and water systems intersect, reflecting a high level of ecological protection. By 2020 and 2023, as ecological protection and restoration efforts were intensified, ES concentration in green heart areas grew significantly, indicating clear progress in ecological restoration. From a spatial network perspective, as ecological protection and restoration measures strengthened, the ES-Network developed greater connectivity and stability. In 2010, the ES-Network was fragmented, especially in areas with rapid urbanization, where the capacity to provide ecosystem services was limited. However, by 2020 and 2023, increased forest cover and water conservation measures gradually strengthened the ES-Network, particularly between the Xiangjiang River Basin, wetland conservation areas, and ecological corridors in mountainous regions, leading to a more stable and continuous flow of ES. This demonstrates that ecological restoration and protection efforts effectively enhanced ES connectivity, extending these services across a larger area, especially between urban centers and surrounding regions.
Overall, the spatial association between LUCE and ES extends beyond traditional spatial proximity, forming a cross-regional spatial network with complex characteristics. These characteristics influence both carbon reduction efforts and the supply of ES. Therefore, a thorough analysis of the spatial association network between LUCE and ES is crucial.
4.2. Analysis of the Overall Characteristics of the Spatial Association Network
Figure 5 and Figure 6 provide an overall analysis of the spatial association networks between LUCE and ES. By comparing indicators such as network density, connectivity, degree centrality, efficiency, and network relations count, the spatial structural characteristics and evolutionary trends of both networks at different time scales are revealed.
The LUCE-network showed fluctuations in its overall characteristics from 2010 to 2023. In 2010, the network density was 0.34, indicating a relatively high level of connectivity and strong spatial connections for carbon emissions at that time. By 2015, the network density slightly dropped to 0.30, suggesting a weakening of spatial connectivity. From 2020 to 2023, the network density remained stable at around 0.30, indicating consistent connectivity in recent years. The network association coefficient was 1 in 2010, reflecting complete connectivity in the carbon emission network that year. In subsequent years, the coefficient remained stable, confirming the stability of the network. The network degree centrality increased from 0.16 in 2010 to 0.29, indicating a shift from a dispersed to a more centralized structure. Network efficiency fluctuated more significantly, starting at 0.63 in 2010, fluctuating in the following years, and ending at 0.62 in 2023, suggesting a slight decline in the network's efficiency in terms of information flow and resource transmission.
In contrast to the LUCE-network, the overall characteristics of the ES-network show a more stable trend. The data in Figure 5 reveals that the network density of the ES-Network has remained around 0.30 since 2010, indicating a balanced spatial distribution. The network association coefficient has consistently stayed at 1, confirming the strong connectivity between nodes in the ES-Network. The trend in network degree centrality differs from that of the LUCE-Network; the ES-Network’s degree centrality has steadily increased from 0.16 in 2010 to 0.23 in 2023, suggesting a gradual centralization of the network. In terms of network efficiency, it was 0.63 in 2010 and remained stable at 0.63 in 2023, reflecting the ES-Network’s stability and efficiency in resource flow and information exchange.
Overall, the spatial networks of LUCE and ES exhibit different dynamic changes across time and space. The LUCE-Network shows more volatility, particularly in network efficiency and degree centrality, with noticeable fluctuations. These changes may be closely related to policy regulations and regional land use shifts during different periods. In contrast, the ES-Network demonstrates greater stability and a more balanced structure, likely influenced by regional ecological protection efforts and the steady supply of ES.
4.3. Analysis of Individual Characteristics of the Spatial Association Network
Using Ucinet software, the individual structural characteristics of the LUCE and ES spatial association networks are calculated (Figure 7 and Figure 8). Overall, the LUCE-network in the Chang-Zhu-Tan region forms a structure with the central urban area at its core, and the northwest and southeast regions on the periphery. As urban expansion progresses, the central and northern regions have become more prominent in the spatial association network. In contrast, the ES-network exhibits a multi-core structure, with the central, western, and southern regions as the cores. With economic development, the central region's role in the ES network has steadily increased.
4.3.1. Degree Centrality Analysis
Based on data from the four years, the central region of the LUCE-network consistently exhibits higher degree centrality, remaining at the network center for extended periods. Over time, the southeastern region has gradually moved closer to the network center, while the western region has stayed on the periphery. The average degree centrality in 2010, 2015, 2020, and 2023 was 4.84, 4.11, 4.84, and 4.63, respectively. Central districts such as Tianxin, Furong, and Yuhua had above-average degree centrality in most years. This is due to their economic development and rapid urbanization, which attract LUCE-related factors, such as energy and labor, from surrounding areas.
In the ES-network, districts at the city boundaries have higher degree centrality, staying at the network center for extended periods. Over time, the northeastern region has gradually moved closer to the network center, while most of the southwestern region has remained on the periphery. The average degree centrality in 2010, 2015, 2020, and 2023 was 5.47, 5.21, 5.36, and 5.01, respectively. Peripheral districts such as Liuyang City, Shifeng District, and Changsha County had above-average degree centrality in most years. This is likely due to their higher connectivity in terms of ES, particularly due to strong demands in areas like environmental protection, agricultural ecology, and water resource management.
4.3.2. Closeness Centrality Analysis
Based on data from the four years, in the LUCE-network, districts with above-average closeness centrality are primarily concentrated in the central and eastern regions. Most northern districts showed relatively high closeness centrality in certain years, while some southern districts had lower closeness centrality. The average closeness centrality in 2010, 2015, 2020, and 2023 was 33.47, 35.79, 34.42, and 35.26, respectively. Districts such as Kaifu, Changsha County, and Tianyuan in the central and eastern regions consistently had higher closeness centrality than average. This is due to these districts attracting labor, energy, and other factors from the central and western regions, as well as establishing connections with other areas through investments and technology exports, which influence LUCE in those regions.
In the ES-network, districts with above-average closeness centrality are primarily found in the western and southern regions. Most central districts had relatively high closeness centrality in certain years, while some northern districts had lower values. The average closeness centrality in 2010, 2015, 2020, and 2023 was 32.95, 31.79, 34.01, and 32.63, respectively. Districts such as Ningxiang City, Furong District, and Lusheng District in the western and southern regions are closer to areas rich in natural resources. Through enhanced ecological protection and compensation policies, these regions have improved the transmission and connection of ES across different areas.
4.3.3. Betweenness Centrality Analysis
Based on the data from the four years, in the LUCE-network, betweenness centrality remained high in the central and southern regions overall. In certain years, some northern districts showed relatively high betweenness centrality, while few districts in the western region played a significant intermediary role in the spatial association network. The average betweenness centrality in 2010, 2015, 2020, and 2023 was 7.79, 8.89, 8.16, and 8.63, respectively. Districts such as Yuhua, Tianxin, and Lukou consistently had high betweenness centrality, indicating their significant influence on LUCE within the spatial association network. These districts promote low-carbon land use in other regions through the export of low-carbon technologies, funding, and other means. Additionally, the consumption habits in these districts also impact the development of other regions.
In the ES-network, the central region maintained high betweenness centrality overall. In certain years, some northern districts had relatively high betweenness centrality, while most western districts had a less significant intermediary role. The average betweenness centrality in 2010, 2015, 2020, and 2023 was 7.58, 6.74, 8.01, and 7.26, respectively. Districts such as Yuhua, Changsha County, and Yuelu consistently had high betweenness centrality, reflecting their central role in the flow and distribution of ES resources. These districts, with strong ecological infrastructure and management capabilities, help enhance ES in other regions through ecological compensation, green policies, and the export of ecological projects. They also guide the promotion of ecological civilization and foster ecological cooperation, thus becoming key intermediary nodes within the ES-Network.
4.4. Analysis of Spatial Association Network Heterogeneity
This study calculated the heterogeneity indices for the LUCE-Network and ES-Network in the Chang-Zhu-Tan urban agglomeration from 2010 to 2023. As shown in Table 5, the LUCE-Network dominated until 2020. This suggests that rapid economic activities during this period had a significant impact on the region’s development. However, by 2023, the heterogeneity index of the ES-Network surpassed that of the LUCE-Network, highlighting the increasing importance of ecosystem services in the region. Particularly, with the promotion of ecological restoration projects and the growth of green infrastructure, the role of the ES-Network strengthened, and its function began to replace the LUCE-Network's dominant position.
As shown in Figure 9, the three heterogeneity indices of the LUCE-Network and ES-Network reveal a significant spatiotemporal shift in their strength. Regions with high LUCE-Network heterogeneity gradually expanded from the core areas of the Chang-Zhu-Tan urban agglomeration to the western and southern regions. This shift is due to industrial transformation, economic restructuring, and the promotion of green low-carbon policies, which have caused carbon emission sources to move from core urban areas to peripheral regions. In contrast, the spatial distribution of ES-Network heterogeneity shows a different trend. The importance of nodes in the peripheral and green heart areas significantly increased, gradually extending toward the core regions. This reflects the improved connectivity of ecosystem services in the urban agglomeration, driven by increased efforts in ecological restoration, low-carbon technologies, and ecological compensation policies.
In 2010, nodes with a strong DCDI in the LUCE-Network were mainly concentrated in areas like Yuhua District and Shaoshan City, reflecting the rapid economic development in these regions at the time. By 2023, due to adjustments in regional industrial structures and the implementation of low-carbon policies, carbon emission sources gradually shifted towards emerging industrial and economic areas in the western and southern regions. This shift indicates the restructuring of industrial space and regional development imbalances. Additionally, in 2010, nodes with a high CCDI in the LUCE-Network were mainly found in areas like Liuyang City, Changsha County, and Tianyuan District, signifying these regions had a strong capacity for carbon emission propagation. By 2023, strong CCDI nodes gradually shifted southward and westward, likely due to the development of new industrial areas and transportation hubs, which altered the radiation range of the network. Similarly, in 2010, nodes with a strong BCDI in the LUCE-Network were concentrated in regions such as Yuhua District, which not only contributed to significant carbon emissions but also played a bridging role in carbon flow. By 2023, these nodes shifted southward, suggesting they became key nodes for carbon emissions and resource flow, particularly in regions with emerging concentrated economic activities.
In 2010, nodes with a strong DCDI in the ES-Network were mainly concentrated in the northeastern areas of Changsha, reflecting the abundance of natural resources and high capacity for ecosystem service provision in these regions. By 2023, these strong DCDI nodes gradually shifted towards the central region, likely due to the increasing emphasis on ecological protection policies and ecological restoration projects during urbanization. Additionally, in 2010, the strong CCDI nodes in the ES-Network were concentrated in areas such as Shaoshan City. By 2023, these nodes shifted southward, indicating that as the functions of ecosystem services expanded, the ES-Network spread not only to ecologically sensitive areas but also began to infiltrate the urban periphery and surrounding regions. Meanwhile, the strong BCDI nodes in the ES-Network were initially concentrated in the northeastern region and gradually expanded toward the central region. These nodes played a key role in the cross-regional flow of ecosystem services. With strengthened ecological compensation policies and regional restoration efforts, the ES-Network has increasingly acted as a vital intermediary, connecting different ecological regions and serving as an essential “bridge” for regional ecosystem service delivery.
4.5. Analysis of the Driving Mechanisms of Spatial Association Network Heterogeneity
4.5.1. Indicator Construction
To systematically analyze the driving mechanisms of LUCE and ES spatial association network heterogeneity in the Chang-Zhu-Tan urban agglomeration, this study combines previous research findings and selects driving factors from three aspects: the natural environment, socio-economic conditions, and land use structure. A comprehensive indicator system is constructed (Table 6).
In the natural environment dimension, five indicators are selected: temperature, average annual precipitation, evapotranspiration, elevation, and slope. These factors reflect the region's water-heat conditions and topographical features, which significantly influence vegetation growth, carbon sequestration capacity, and ecosystem service supply, leading to spatial differences in network connections. In the socio-economic dimension, three indicators are chosen: GDP per capita, urbanization rate, and population density. GDP per capita reflects the level of regional economic development, directly affecting energy consumption and carbon emissions, while also influencing the demand for ecosystem services. The urbanization rate reflects trends in construction land expansion and population concentration, key factors driving carbon emissions and disrupting the ecological network. Population density further highlights the role of population pressure in carbon emission concentration and the imbalance between ecosystem service supply and demand. In the land use structure dimension, four indicators are selected: the proportion of arable land, forest cover, proportion of construction land, and landscape fragmentation index. Arable land and construction land directly impact carbon emission levels and food production patterns; forest cover is crucial for carbon sequestration and ecosystem service supply; and the landscape fragmentation index measures the integrity and connectivity of ecological spaces, which directly affects network stability. Additionally, to support subsequent model analysis, each indicator is assigned a corresponding variable symbol, with X1-X5 representing natural environmental factors, X6-X8 representing socio-economic factors, and X9-X12 representing land use structure factors.
4.5.2. Driving Mechanism Assessment
The results in Figure 10 show that the natural environment, socio-economic factors, and land use structure each influenced network heterogeneity differently over time. Specifically, factors such as average annual precipitation, forest cover, urbanization rate, the proportion of construction land, and landscape fragmentation are key drivers of spatial association network heterogeneity. Over time, the influence of socio-economic factors, particularly the urbanization process, gradually grew, with the urbanization rate reaching 0.1558 in 2023, significantly higher than 0.0761 in 2010. Additionally, changes in land use structure, especially the expansion of construction land and increased landscape fragmentation, directly impacted the spatial association and transmission paths of LUCE and ES.
From the perspective of different target variables, the driving mechanisms behind network heterogeneity show significant variation. In the analysis of LUCE network heterogeneity (DCDI), the influence of X2 was 0.3947 in 2010, making it a key driver within the natural environment factors. Precipitation changes directly impacted carbon sequestration and water supply, which regulated the connectivity and spatial heterogeneity of the LUCE-Network. Meanwhile, although the influence of X11 was 0.0187 in 2010, it increased significantly to 0.1500 by 2023, reflecting the growing impact of urbanization-driven land use changes on the LUCE-Network. In contrast, ES network heterogeneity (CCDI) was more strongly driven by X10 and X7. From 2020 to 2023, the influence of forest cover increased from 0.0367 to 0.1378, indicating that forest protection and restoration greatly improved the connectivity of the ES-Network and mitigated the ecological degradation caused by urbanization. At the same time, the influence of X7 in 2023 was 0.1558, showing that the accelerating urbanization led to increased demand for ecosystem services, significantly affecting the network structure.
Looking at the overall distribution of indicator categories, natural environment factors dominated in 2010 and 2015, with X2 and X1 significantly influencing the LUCE and ES networks. In 2010, the influence of X2 was 0.3947, while the influence of X1 gradually grew, reaching 0.0976 in 2023, reflecting the contribution of ecological restoration to network connectivity. By 2020 and 2023, socio-economic factors, particularly the influence of X7, became more prominent. The influence of X7 in 2023 was 0.1558, significantly higher than 0.0761 in 2010, emphasizing the impact of urbanization on the spatial relationship between LUCE and ES. Regarding land use structure factors, the influence of X11 grew steadily, from 0.0187 in 2010 to 0.1500 in 2023, showing the direct impact of land use changes, especially the expansion of construction land during urbanization, on the heterogeneity of LUCE and ES networks. Additionally, the influence of X12 gradually increased from 0.0272 in 2020 to 0.0635 in 2023, indicating the negative effect of infrastructure development on ecological space connectivity.
In summary, the heterogeneity of the LUCE and ES networks is driven by the interaction of three main factors: the natural environment, socio-economic conditions, and land use structure. In terms of the natural environment, X1 and X2 played a foundational role in regulating the connectivity and stability of the networks across time periods. While their influence gradually weakened, they remain important for regulating the LUCE-ES relationship. Regarding socio-economic factors, changes in X7 and X6 significantly shaped the spatial structure of the LUCE-Network. The urbanization process intensified land use changes and resource consumption, driving carbon emissions and increasing the demand for ecosystem services. In terms of land use structure, X11 consistently had a prominent influence, reflecting the impact of urbanization on LUCE network density and the weakening of ecological services. Thus, policies should prioritize ecological restoration and green infrastructure during urbanization, reducing the negative effects of land use changes on ecosystem services, and promoting the coordinated development of low-carbon initiatives and ecosystem services.
4.6. Collaborative Path of the Spatial Association Network
4.6.1. Structural Expansion Constraints, Ecological Connectivity Restoration
The differences in node degree are mainly due to the continuous expansion of construction land and landscape fragmentation, which have weakened the adjacency relationships within the ES-Network (Figure 11). In contrast, connected forest belts and favorable water-heat conditions can restore the natural connectivity of ecosystems. Therefore, in the Chang-Zhu-Tan urban agglomeration, particularly in areas like the central urban district of Changsha, the Hedong area of Zhuzhou, and the Yutang area of Xiangtan, the core strategy should focus on “strict control of incremental development and updating of stock.” This approach will prevent the excessive spread of dispersed areas into large blocks through wide roads and hard barriers, reducing the structural advantages of the LUCE-Network from its source. For agricultural and construction lands in the urban-rural fringe areas, measures such as patch juxtaposition, boundary shaping, permeable barriers, and underpass corridors should be implemented to reduce fragmentation caused by roads and barriers. Along the main stream and tributaries of the Xiangjiang River, as well as the low valleys at the foot of mountains and agricultural-forest mixed zones, continuous river-lake-wetland-forest corridor networks and urban green wedge networks should be developed to improve forest patch connectivity and strengthen ecosystem links. These measures are expected to increase the number and weight of ecological edges in the adjacency matrix, reduce the relative weight of carbon edges, and bring the heterogeneity index of the connectivity layer closer to zero, thus enhancing the network's redundancy and robustness.
4.6.2. Accessibility Decentralization, Ecological Resistance Reduction
In terms of accessibility decentralization and ecological resistance reduction, the differences in closeness centrality highlight the coexistence of "proximity monopolies" in the LUCE-Network and "low-resistance corridors" controlled by topography and water systems in the ES-Network. The corresponding strategies are as follows: On one hand, in the core corridors, the promotion of public transport priority and multi-center linkage should be advanced, avoiding excessive densification of the "shortest path." By controlling strength around hubs and implementing demand management measures, such as tolls, transportation and energy flows can be decentralized, moderately extending the average shortest path of the LUCE-Network. On the other hand, in slope-valley, river-lake, and agricultural-forest mixed zones, ecological culverts, permeable shorelines, eco-bridges, and flood retention spaces should be systematically deployed to restore ecological connectivity interrupted by roads and barriers, thus shortening effective paths in the ES-Network. These measures will help the heterogeneity index of the accessibility layer approach zero and significantly reduce the "path length difference" between the LUCE and ES networks.
4.6.3. Channel Depointification, Ecological Substitution Reinforcement
In terms of channel decentralization and ecological reinforcement, the differences in betweenness centrality are primarily driven by the "must-pass routes" created by economic activities and the urbanization gradient along the main axis, while being constrained by construction patterns and the availability of ecological corridors. To reduce the "bottleneck" control of a few nodes, distributed energy systems, green freight corridors, and multimodal transport for inland rivers and roads should be introduced along the main axis. This will promote multi-channel parallelism for industries and logistics, decentralizing the intermediary control of carbon-related flows and reducing the bottleneck effect of key nodes. Additionally, the main stream of the Xiangjiang River, its wetlands, the Yuelu, Ningxiang, and the eastern mountainous forest belts of Liuyang should be included in strict protection and continuous restoration plans, using a "stepping-stone-island hopping" strategy to link and restore river-lake connectivity. These measures are expected to strengthen alternative pathways in the ecological network, allowing the ecological layer to bypass high-emission corridors and form "ecological loops." As a result, the heterogeneity index of the mediation layer will significantly decrease, enhancing the robustness of the network in case of failure at key nodes.
4.6.4. Threshold Constraints, Closed-Loop Evaluation
To ensure the feasibility and verifiability of the proposed pathways, key structural and environmental variables must be converted into threshold-based control and network evaluation mechanisms. Based on model results and sensitivity analysis, upper limits for the proportion of construction land and landscape fragmentation, as well as lower limits for forest patch continuity and river-lake connectivity, should be set. These thresholds should be incorporated into land space management and project admission constraints. Additionally, annual evaluations and adjustments should be made based on indicators such as changes in the heterogeneity index, network redundancy, the proportion of alternative paths, and ecological connectivity. Through the closed-loop process of "threshold control—monitoring—evaluation," the synergistic improvement of the connectivity, accessibility, and mediation layers can be ensured, providing stable institutional support for the implementation of these collaborative pathways.
5. Discussion
5.1. Dual Network Construction and Structural Characteristics
After constructing the LUCE and ES networks within a unified framework, a common "corridorization + cross-domain coupling" structure emerges in the same topological language. However, the node positions are significantly asymmetric: along the urban main axes and industrial corridors, the LUCE-Network shows high degree centrality and closeness centrality, while the centrality of the ES-Network depends more on the continuity and accessibility of habitats and water-mountain systems. In contrast to studies focused on single-system networks or adjacency-based coupling (Abd El-Hamid et al., 2023; Gonçalves et al., 2018), this juxtaposition modeling avoids scope drift and clearly highlights the differences in "same geographic corridors, different structural positions." Notably, the comparison of betweenness centrality reveals several "cross-layer decoupling" nodes that serve as key bridges in the LUCE layer but lose their bridging role in the ES layer due to source area thinning or fragmentation by infrastructure. Unlike research that treats the two processes as simply "strongly correlated-weakly correlated" (Felipe-Lucia et al., 2020; Liu et al., 2024), this approach emphasizes that the differences in cross-layer roles are governance targets themselves: identifying and addressing these mispositioned nodes is more focused than improving overall coupling.
5.2. Network Differentiation Diagnosis
The three heterogeneity indices derived from the "LUCE-Network degree centrality - ES-Network degree centrality" elevate the coupling analysis from a simple mean comparison to a structured measurement. The results indicate that the DCDI and CCDI are generally positive along the main axes and group boundaries, reflecting the proximity advantages driven by increased traffic and development. However, in green heart areas, mountainous regions, and river-lake composite corridors, the index becomes negative, suggesting that low-resistance ecological corridors have strengthened the position of the ES-Network. Positive BCDI values are concentrated along urban main axes, indicating the monopolization of carbon flow corridors. In areas where ecological corridors have parallel and alternative paths, the BCDI turns negative. Compared to "coupling coordination" studies (Jiang et al., 2023; Fan et al., 2022), this centrality difference directly identifies the structural roots of "who is more easily connected and who is more easily accessed" (Xiao et al., 2023) and explains the causes of "carbon emission hotspots - ecological cold spots juxtaposition" (Hardaker et al., 2020). Corridor reinforcement creates the "illusion of the shortest path" in the LUCE layer (Wang et al., 2022). Without ecological culverts, permeable shorelines, and river-lake connectivity projects, the ES-Network struggles to form a comparable shortest path, reinforcing functional misalignment (Qu et al., 2024). The results also suggest a fragmentation-dependent context: in areas where total habitat loss has been minimal and key corridors have been strengthened, moderate patch diversity can enhance local accessibility and redundancy in the ES-Network, reducing the heterogeneity index and scale effects. These factors should be incorporated into management strategies.
5.3. Ternary Coupling Drive and Synergy
Importance assessments reveal that heterogeneity is shaped by the combined influence of "spatial structure, natural environment, and human activity." The continuous expansion of construction land and landscape fragmentation directly increase carbon layer edge density and regional accessibility, while disrupting ecological edges. Connected forests and river wetlands, supported by favorable water-heat conditions, create low-resistance ecological corridors and redundant parallel paths. Industrial and population agglomeration strengthen intermediary control through multiple transportation, logistics, and information channels, creating monopolies in a few nodes. Unlike unidirectional approaches like "ecology first" or "emission reduction first" (Zhai et al., 2021; Seydewitz et al., 2023), this study frames the collaborative pathway as a dual-arm linkage of "structural correction + process coupling": First, in corridors and hubs with positive bias, stock updates and intensity caps should be implemented to control outward expansion and reduce fragmentation, while simultaneously installing cross-road ecological facilities and river-lake connectivity projects to provide parallel paths for the ES-Network. Second, in green heart areas, mountain systems, and water networks, large-scale restoration and corridor widening should be carried out, creating bypass ecological loops to reduce the LUCE-Network's dependence on single-path corridors. Third, through public transport prioritization, clean energy substitution, and multimodal transport, carbon flow distribution should shift from a unimodal to a multimodal system, reducing the structural control of "must-pass nodes" on regional emissions. The heterogeneity index and importance ranking serve as key quantitative measures (Field, 2021; Holmberg et al., 2019), avoiding reverse damage caused by unidirectional benefits and shifting governance focus from "volume accumulation" to "structural adjustment and path connectivity".
5.4. Limitations and Outlook
The current conclusions are primarily based on structural mapping of centrality differences and have not directly addressed the material-energy processes of carbon emissions and ecosystem services, service flow time lags, and threshold transitions. Future research should integrate service flow models with multilayer network dynamics, testing path dependence and critical points under the unified "structure-process-function" framework. Machine learning's importance ranking focuses on related explanations, while directional causality and transferable thresholds need to be calibrated using panel causality and local interpretability methods. Carbon accounting and ecological assessment involve parameter and data uncertainties, so it is recommended to incorporate emission inventories, vorticity covariance fluxes, and ecological monitoring cross-validation, applying Bayesian and Monte Carlo methods to propagate uncertainty. Additionally, combining high-resolution remote sensing, nightlight data, mobile signaling, and other multi-source data can improve spatiotemporal characterization accuracy. Finally, the extrapolation of carbon emissions and ecosystem services in the Chang-Zhu-Tan urban agglomeration should be further tested in comparison with other urban agglomerations, such as the Yangtze River Delta, Chengdu-Chongqing, and Beijing-Tianjin-Hebei regions. The "transportation-industry-ecology" three-network co-evolution should be included in scenario simulations to systematically assess the robustness and benefit boundaries of collaborative pathways.
6. Conclusion
This study uses the Chang-Zhu-Tan urban agglomeration as a case, utilizing multi-source data from 2010 to 2023 to construct spatial association networks for LUCE and ES. Centrality indicators are used to represent connectivity, accessibility, and channel functions, and three heterogeneity indices are defined to evaluate and identify driving factors. The findings are as follows: (1) Both networks show corridorization and cross-domain connections, but with asymmetric nodes. The LUCE-Network's degree centrality increased from 0.16 to 0.29, while the ES-Network's degree centrality rose from 0.16 to 0.23. Nodes that act as bridges in the carbon layer but lose their function in the ecological layer should be prioritized for management. (2) The three heterogeneity indices were positive in 2010, 2015, and 2020, but turned negative by 2023, indicating a shift from carbon network dominance to ecological network dominance. Specifically, the DCDI decreased from 0.3944, 0.5851, and 0.3956 to -0.0682, the CCDI dropped from 0.0749, 0.1021, and 0.0281 to -0.3071 (a decrease of about 0.34 compared to 2020), and the BCDI fell from 0.1871, 0.4742, and 0.3429 to -0.3338 (a decrease of about 0.68 compared to 2020). Spatially, positive bias is concentrated along the main axes and group boundaries, while negative bias is concentrated in the green heart and mountainous water network corridors. (3) Heterogeneity is mainly shaped by spatial structure, the natural environment, and human activities. Among the driving factors, X11 increased from 0.0187 in 2010 to 0.1500 in 2023, exacerbating the heterogeneity of carbon and ecological networks. X7 reached 0.1558 in 2023, significantly higher than 0.0761 in 2010, driving the increase in carbon emissions and the growing demand for ecosystem services. X10 progressively enhanced the ecological network, reaching 0.1378 by 2023. Overall, urbanization and land use changes have significantly impacted the spatial structure of LUCE and ES. (4) A collaborative path is proposed based on structural correction and process coupling: in corridors and hubs with strong positive bias, implement strict control on incremental development and update existing stock, while configuring cross-road ecological and river-lake connectivity projects. Large-scale restoration and corridor widening should be carried out along green heart and mountainous water networks. Additionally, reduce single-channel dependency through public transport priority, energy efficiency improvements, clean energy substitution, and multimodal transport. Establish a threshold-monitoring-assessment loop using heterogeneity indices and key variables.
Funding
This research was supported by the Postgraduate Scientific Research Innovation Project of Hunan Province (Grant No. LXBZZ2024318) and the Science and Technology Program of the Department of Natural Resources of Hunan Province (Grant No. 20230108GH).
CRediT authorship contribution statement
Fanmin Liu:Writing - review & editing, Writing - original draft, Methodology, Formal analysis, Data curation, Conceptualization. Mengjie Wang:Writing - review & editing, Methodology, Formal analysis, Conceptualization. Xianchao Zhao:Writing - review & editing, Supervision, Resources, Funding acquisition, Conceptualization.
Data availability
Data will be made available on request.
Acknowledgments
We thank the editor and the reviewers for their helpful comments.
Declaration of competing interest
The authors declare that they have no known competing financial interests or personal relationships that could have appeared to influence the work reported in this paper.
References
- Chen, Y., Lu, H., Li, J., et al., 2020. Effects of land use cover change on carbon emissions and ecosystem services in Chengyu urban agglomeration, China. Stoch. Environ. Res. Risk Assess. 34, 1197–1215. [CrossRef]
- Tian, S., Wang, S., Bai, X., Luo, G., Li, Q., Yang, Y., Hu, Z., Li, C., Deng, Y., 2021. Global patterns and changes of carbon emissions from land use during 1992–2015. Environ. Sci. Ecotechnol. 7, 100108. [CrossRef]
- Zhang, R., Yu, K., Luo, P., 2024. Spatio-temporal relationship between land use carbon emissions and ecosystem service value in Guanzhong, China. Land. 13(1), 118. [CrossRef]
- Jiang, L., Liu, X., Gao, Z., Zha, X., He, D., Chen, H., 2023. The spatial coupling of land use carbon emissions and ecosystem service value and its influence mechanism at county level in China. Acad. J. Environ. Earth Sci. 5(10), 37–48. [CrossRef]
- Muga, G., Tiando, D.S., Liu, C., 2025. Spatial relationship between carbon emissions and ecosystem service value based on land use: A case study of the Yellow River Basin. PLoS ONE 20(2), e0318855. [CrossRef]
- Yu, Z., Chen, L., Tong, H., Chen, L., Zhang, T., Li, L., Yuan, L., Xiao, J., Wu, R., Bai, L., Shi, S., 2022. Spatial correlations of land-use carbon emissions in the Yangtze River Delta region: A perspective from social network analysis. Ecological Indicators 142, 109147. [CrossRef]
- Huang, H., Jia, J., Chen, D., Liu, S., 2024. Evolution of spatial network structure for land-use carbon emissions and carbon balance zoning in Jiangxi Province: A social network analysis perspective. Ecological Indicators 158, 111508. [CrossRef]
- Zhao, S., Yu, Z., Liu, W., 2025. Revealing the spatio-temporal coupling coordination characteristics and influencing factors of carbon emissions from urban use and ecosystem service values in China at the municipal scale. Front. Ecol. Evol. 13, 1539909. [CrossRef]
- Zhao, Q., Xie, B., Han, M., 2023. Unpacking the sub-regional spatial network of land-use carbon emissions: The case of Sichuan Province in China. Land. 12(10), 1927. [CrossRef]
- Wang, Y., Li, M., Jin, G., 2024. Optimizing spatial patterns of ecosystem services in the Chang-Ji-Tu region (China) through Bayesian Belief Network and multi-scenario land use simulation. Science of The Total Environment 917, 170424. [CrossRef]
- Zeng, J., Xu, J., Li, W., Dai, X., Zhou, J., Shan, Y., Zhang, J., Li, W., Lu, H., Ye, Y., et al., 2022. Evaluating trade-off and synergies of ecosystem services values of a representative resources-based urban ecosystem: A coupled modeling framework applied to Panzhihua City, China. Remote Sensing 14(20), 5282. [CrossRef]
- Huang, Y., Wu, J., 2023. Spatial and temporal driving mechanisms of ecosystem service trade-off/synergy in national key urban agglomerations: A case study of the Yangtze River Delta urban agglomeration in China. Ecological Indicators 154, 110800. [CrossRef]
- Xu, H., Cheng, J., Guo, Y., Zhong, T., Zhang, J., 2023. Deciphering the spatiotemporal trade-offs and synergies between ecosystem services and their socio-ecological drivers in the plain river network area. Front. Ecol. Evol. 11, 1212088. [CrossRef]
- Wang, Z., Fu, B., Wu, X., Wang, S., Li, Y., Zhang, L., Chen, N., Wu, X., 2025. Exploring the interdependencies of ecosystem services and social-ecological factors on the Loess Plateau through network analysis. Science of The Total Environment 960, 178362. [CrossRef]
- Liu, J., Yan, Q., Zhang, M., 2023. Ecosystem carbon storage considering combined environmental and land-use changes in the future and pathways to carbon neutrality in developed regions. Science of The Total Environment 903, 166204. [CrossRef]
- Zhao, X.C., Tian, Y.D., Zhang, X.X., 2023. Spatiotemporal analysis of the relationship between land-use carbon emissions and ecosystem service value in the Chang-Zhu-Tan urban agglomeration. Journal of Soil and Water Conservation 37(5), 215–225. [CrossRef]
- Gao, P., Yue, S., Chen, H., 2021. Carbon emission efficiency of China’s industry sectors: From the perspective of embodied carbon emissions. Journal of Cleaner Production 283, 124655. [CrossRef]
- Yang, P., Peng, S., Benani, N., Dong, L., Li, X., Liu, R., Mao, G., 2022. An integrated evaluation on China's provincial carbon peak and carbon neutrality. Journal of Cleaner Production 377, 134497. [CrossRef]
- Wang, J., Hao, S., 2023. The spatial impact of carbon trading on harmonious economic and environmental development: Evidence from China. Environmental Geochemistry and Health 45(8), 6495–6515. [CrossRef]
- Chen, S., Liu, J., Zhang, Q., Teng, F., McLellan, B.C., 2022. A critical review on deployment planning and risk analysis of carbon capture, utilization, and storage (CCUS) toward carbon neutrality. Renewable and Sustainable Energy Reviews 167, 112537. [CrossRef]
- Guo, W., Teng, Y., Yan, Y., Zhao, C., Zhang, W., Ji, X., 2022. Simulation of land use and carbon storage evolution in multi-scenario: A case study in Beijing-Tianjin-Hebei urban agglomeration, China. Sustainability 14(20), 13436. [CrossRef]
- Tian, L., Tao, Y., Fu, W., Li, T., Ren, F., Li, M., 2022. Dynamic simulation of land use/cover change and assessment of forest ecosystem carbon storage under climate change scenarios in Guangdong Province, China. Remote Sensing 14(10), 2330. [CrossRef]
- Shi, M., Wu, H., Fan, X., Jia, H., Dong, T., He, P., Baqa, M.F., Jiang, P., 2021. Trade-offs and synergies of multiple ecosystem services for different land use scenarios in the Yili River Valley, China. Sustainability 13(3), 1577. [CrossRef]
- Wen, L., Wang, A., 2023. System dynamics model of Beijing urban public transport carbon emissions based on carbon neutrality target. Environment, Development and Sustainability 25, 12681–12706. [CrossRef]
- Zhang, S., Dong, H., Lu, C., Li, W., 2023. Carbon emission projection and carbon quota allocation in the Beijing–Tianjin–Hebei region of China under carbon neutrality vision. Sustainability 15(21), 15306. [CrossRef]
- Zhan, M.S., Wang, M.Y., Liu, C., et al., 2024. Research progress on the quantitative evaluation method of urban ecological carrying capacity. Chinese Journal of Applied Ecology 35(10), 2925–2932. [CrossRef]
- Elliot, T., Levasseur, A., 2022. System dynamics life cycle-based carbon model for consumption changes in urban metabolism. Ecological Modelling 473, 110010. [CrossRef]
- Zhang, Z., Li, X., Liu, X., Zhao, K., 2024. Dynamic simulation and projection of land use change using system dynamics model in the Chinese Tianshan mountainous region, Central Asia. Ecological Modelling 487, 110564. [CrossRef]
- Jiang, L., Liu, X., Gao, Z., Zha, X., He, D., Chen, H., 2023. The spatial coupling of land use carbon emissions and ecosystem service value and its influence mechanism at county level in China. Academic Journal of Environment & Earth Science 5(10), 37–48. [CrossRef]
- Figueroa-López, J.E., Mancini, C., 2019. Optimum thresholding using mean and conditional mean squared error. Journal of Econometrics 208(1), 179–210. [CrossRef]
- Gou, M., Li, L., Ouyang, S., Wang, N., La, L., Liu, C., Xiao, W., 2021. Identifying and analyzing ecosystem service bundles and their socioecological drivers in the Three Gorges Reservoir Area. Journal of Cleaner Production 307, 127208. [CrossRef]
- Zhu, G., Qiu, D., Zhang, Z., Sang, L., Liu, Y., Wang, L., Zhao, K., Ma, H., Xu, Y., Wan, Q., 2021. Land-use changes lead to a decrease in carbon storage in arid region, China. Ecological Indicators 127, 107770. [CrossRef]
- Singh, C., Kishore Karan, S., Sardar, P., Samadder, S.R., 2022. Remote sensing-based biomass estimation of dry deciduous tropical forest using machine learning and ensemble analysis. Journal of Environmental Management 308, 114639. [CrossRef]
- Feng, X., Lin, X., Li, Y., Yang, J., Yu, E., Lei, K., 2024. Spatial association network of carbon emission performance: Formation mechanism and structural characteristics. Socio-Economic Planning Sciences 91, 101792. [CrossRef]
- Song, H., Gu, L., Li, Y., Zhang, X., Song, Y., 2022. Research on carbon emission efficiency space relations and network structure of the Yellow River Basin City Cluster. International Journal of Environmental Research and Public Health 19(19), 12235. [CrossRef]
- Fan, R., Zhang, X., Bizimana, A., Zhou, T., Liu, J.S., Meng, X.Z., 2022. Achieving China's carbon neutrality: Predicting driving factors of CO2 emission by artificial neural network. Journal of Cleaner Production 362, 132331. [CrossRef]
- Watanabe, M.D.B., Ortega, E., 2014. Dynamic emergy accounting of water and carbon ecosystem services: A model to simulate the impacts of land-use change. Ecological Modelling 271, 113–131. [CrossRef]
- Ouyang, X., Xu, J., Li, J., Wei, X., Li, Y., 2022. Land space optimization of urban-agriculture-ecological functions in the Changsha-Zhuzhou-Xiangtan Urban Agglomeration, China. Land Use Policy 117, 106112. [CrossRef]
- Peters, M.K., Hemp, A., Appelhans, T., et al., 2019. Climate–land-use interactions shape tropical mountain biodiversity and ecosystem functions. Nature 568, 88–92. [CrossRef]
- Zhong, J., Cui, L., Deng, Z., et al., 2024. Long-Term Effects of Ecological Restoration Projects on Ecosystem Services and Their Spatial Interactions: A Case Study of Hainan Tropical Forest Park in China. Environmental Management 73, 493–508. [CrossRef]
- Ke, Y., Xia, L., Huang, Y., Li, S., Zhang, Y., Liang, S., Yang, Z., 2022. The carbon emissions related to the land-use changes from 2000 to 2015 in Shenzhen, China: Implication for exploring low-carbon development in megacities. Journal of Environmental Management 319, 115660. [CrossRef]
- Xie, J., Xie, B., Zhou, K., Li, J., Xiao, J., Liu, C., Zhang, X., 2023. Factors impacting ecological network in Changsha-Zhuzhou-Xiangtan urban agglomeration, China—Based on the perspective of functional performance. Ecological Indicators 154, 110771. [CrossRef]
- Huang, X., Xie, Y., Lei, F., Cao, L., Zeng, H., 2024. Analysis on spatio-temporal evolution and influencing factors of ecosystem service in the Changsha-Zhuzhou-Xiangtan urban agglomeration, China. Front. Environ. Sci. 11, 1334458. [CrossRef]
- Wu, W., Xie, W., Sun, Y., 2024. Spatiotemporal pattern evolution and influencing factors of population spatial distribution in Chang-sha-Zhuzhou-Xiangtan urban agglomeration, China. Journal of Regional Economics 3(1), 12. [CrossRef]
- Lungarska, A., Chakir, R., 2024. Projections of climate change impacts on ecosystem services and the role of land use adaptation in France. Environmental and Sustainability Indicators 22, 100369. [CrossRef]
- Abd El-Hamid, H.T., Toubar, M.M., Zarzoura, F., El-Alfy, M.A., 2023. Ecosystem services based on land use/cover and socio-economic factors in Lake Burullus, a Ramsar Site, Egypt. Remote Sensing Applications: Society and Environment 30, 100979. [CrossRef]
- Gonçalves, D.R.P., Sá, J.C.d.M., Mishra, U., Furlan, F.J.F., Ferreira, L.A., Inagaki, T.M., Romaniw, J., Ferreira, A.d.O., Briedis, C., 2018. Soil carbon inventory to quantify the impact of land use change to mitigate greenhouse gas emissions and ecosystem services. Environmental Pollution 243(Pt B), 940–952. [CrossRef]
- Felipe-Lucia, M.R., Soliveres, S., Penone, C., Fischer, M., Ammer, C., Boch, R.S., Boeddinghaus, M., Bonkowski, F., Buscot, A.M., Fiore-Donno, K., Frank, K., Goldmann, K., Gossner, M.M., Hölzel, N., Jochum, M., Kandeler, E., Klaus, V.H., Kleinebecker, T., Leimer, S., Allan, E., 2020. Land-use intensity alters networks between biodiversity, ecosystem functions, and services. Proc. Natl. Acad. Sci. U.S.A. 117(45), 28140–28149. [CrossRef]
- Liu, C., Hu, S., Wu, S., Song, J., Li, H., 2024. County-level land use carbon emissions in China: Spatiotemporal patterns and impact factors. Sustainable Cities and Society 105, 105304. [CrossRef]
- Xiao, J., Song, F., Su, F., Shi, Z., Song, S., 2023. Quantifying the independent contributions of climate and land use change to ecosystem services. Ecological Indicators 153, 110411. [CrossRef]
- Hardaker, A., Pagella, T., Rayment, M., 2020. Integrated assessment, valuation and mapping of ecosystem services and dis-services from upland land use in Wales. Ecosystem Services 43, 101098. [CrossRef]
- Wang, N., Zhao, Y., Song, T., Zou, X., Wang, E., Du, S., 2022. Accounting for China’s net carbon emissions and research on the realization path of carbon neutralization based on ecosystem carbon sinks. Sustainability 14(22), 14750. [CrossRef]
- Qu, H., You, C., Feng, C.C., Guo, L., 2024. Spatial responses of ecosystem services to carbon emission efficiency based on spatial panel models in the Yangtze River Economic Belt. Journal of Cleaner Production 434, 139953. [CrossRef]
- Zhai, T., Wang, J., Fang, Y., Huang, L., Liu, J., Zhao, C., 2021. Integrating ecosystem services supply, demand and flow in ecological compensation: A case study of carbon sequestration services. Sustainability 13(4), 1668. [CrossRef]
- Seydewitz, T., Pradhan, P., Landholm, D.M., et al., 2023. Deforestation drivers across the tropics and their impacts on carbon stocks and ecosystem services. Anthr. Sci. 2, 81–92. [CrossRef]
- Field, J.L., 2021. Revisiting “Additional Carbon”: Tracking atmosphere–ecosystem carbon exchange to establish mitigation and negative emissions from bio-based systems. Front. Clim. 3, 603239. [CrossRef]
- Holmberg, M., Aalto, T., Akujärvi, A., Arslan, A.N., Bergström, I., Böttcher, K., Lahtinen, I., Mäkelä, A., Markkanen, T., Minunno, F., Peltoniemi, M., Rankinen, K., Vihervaara, P., Forsius, M., 2019. Ecosystem services related to carbon cycling – modeling present and future impacts in boreal forests. Front. Plant Sci. 10, 343. [CrossRef]
Figure 1.
Reasearch framework.
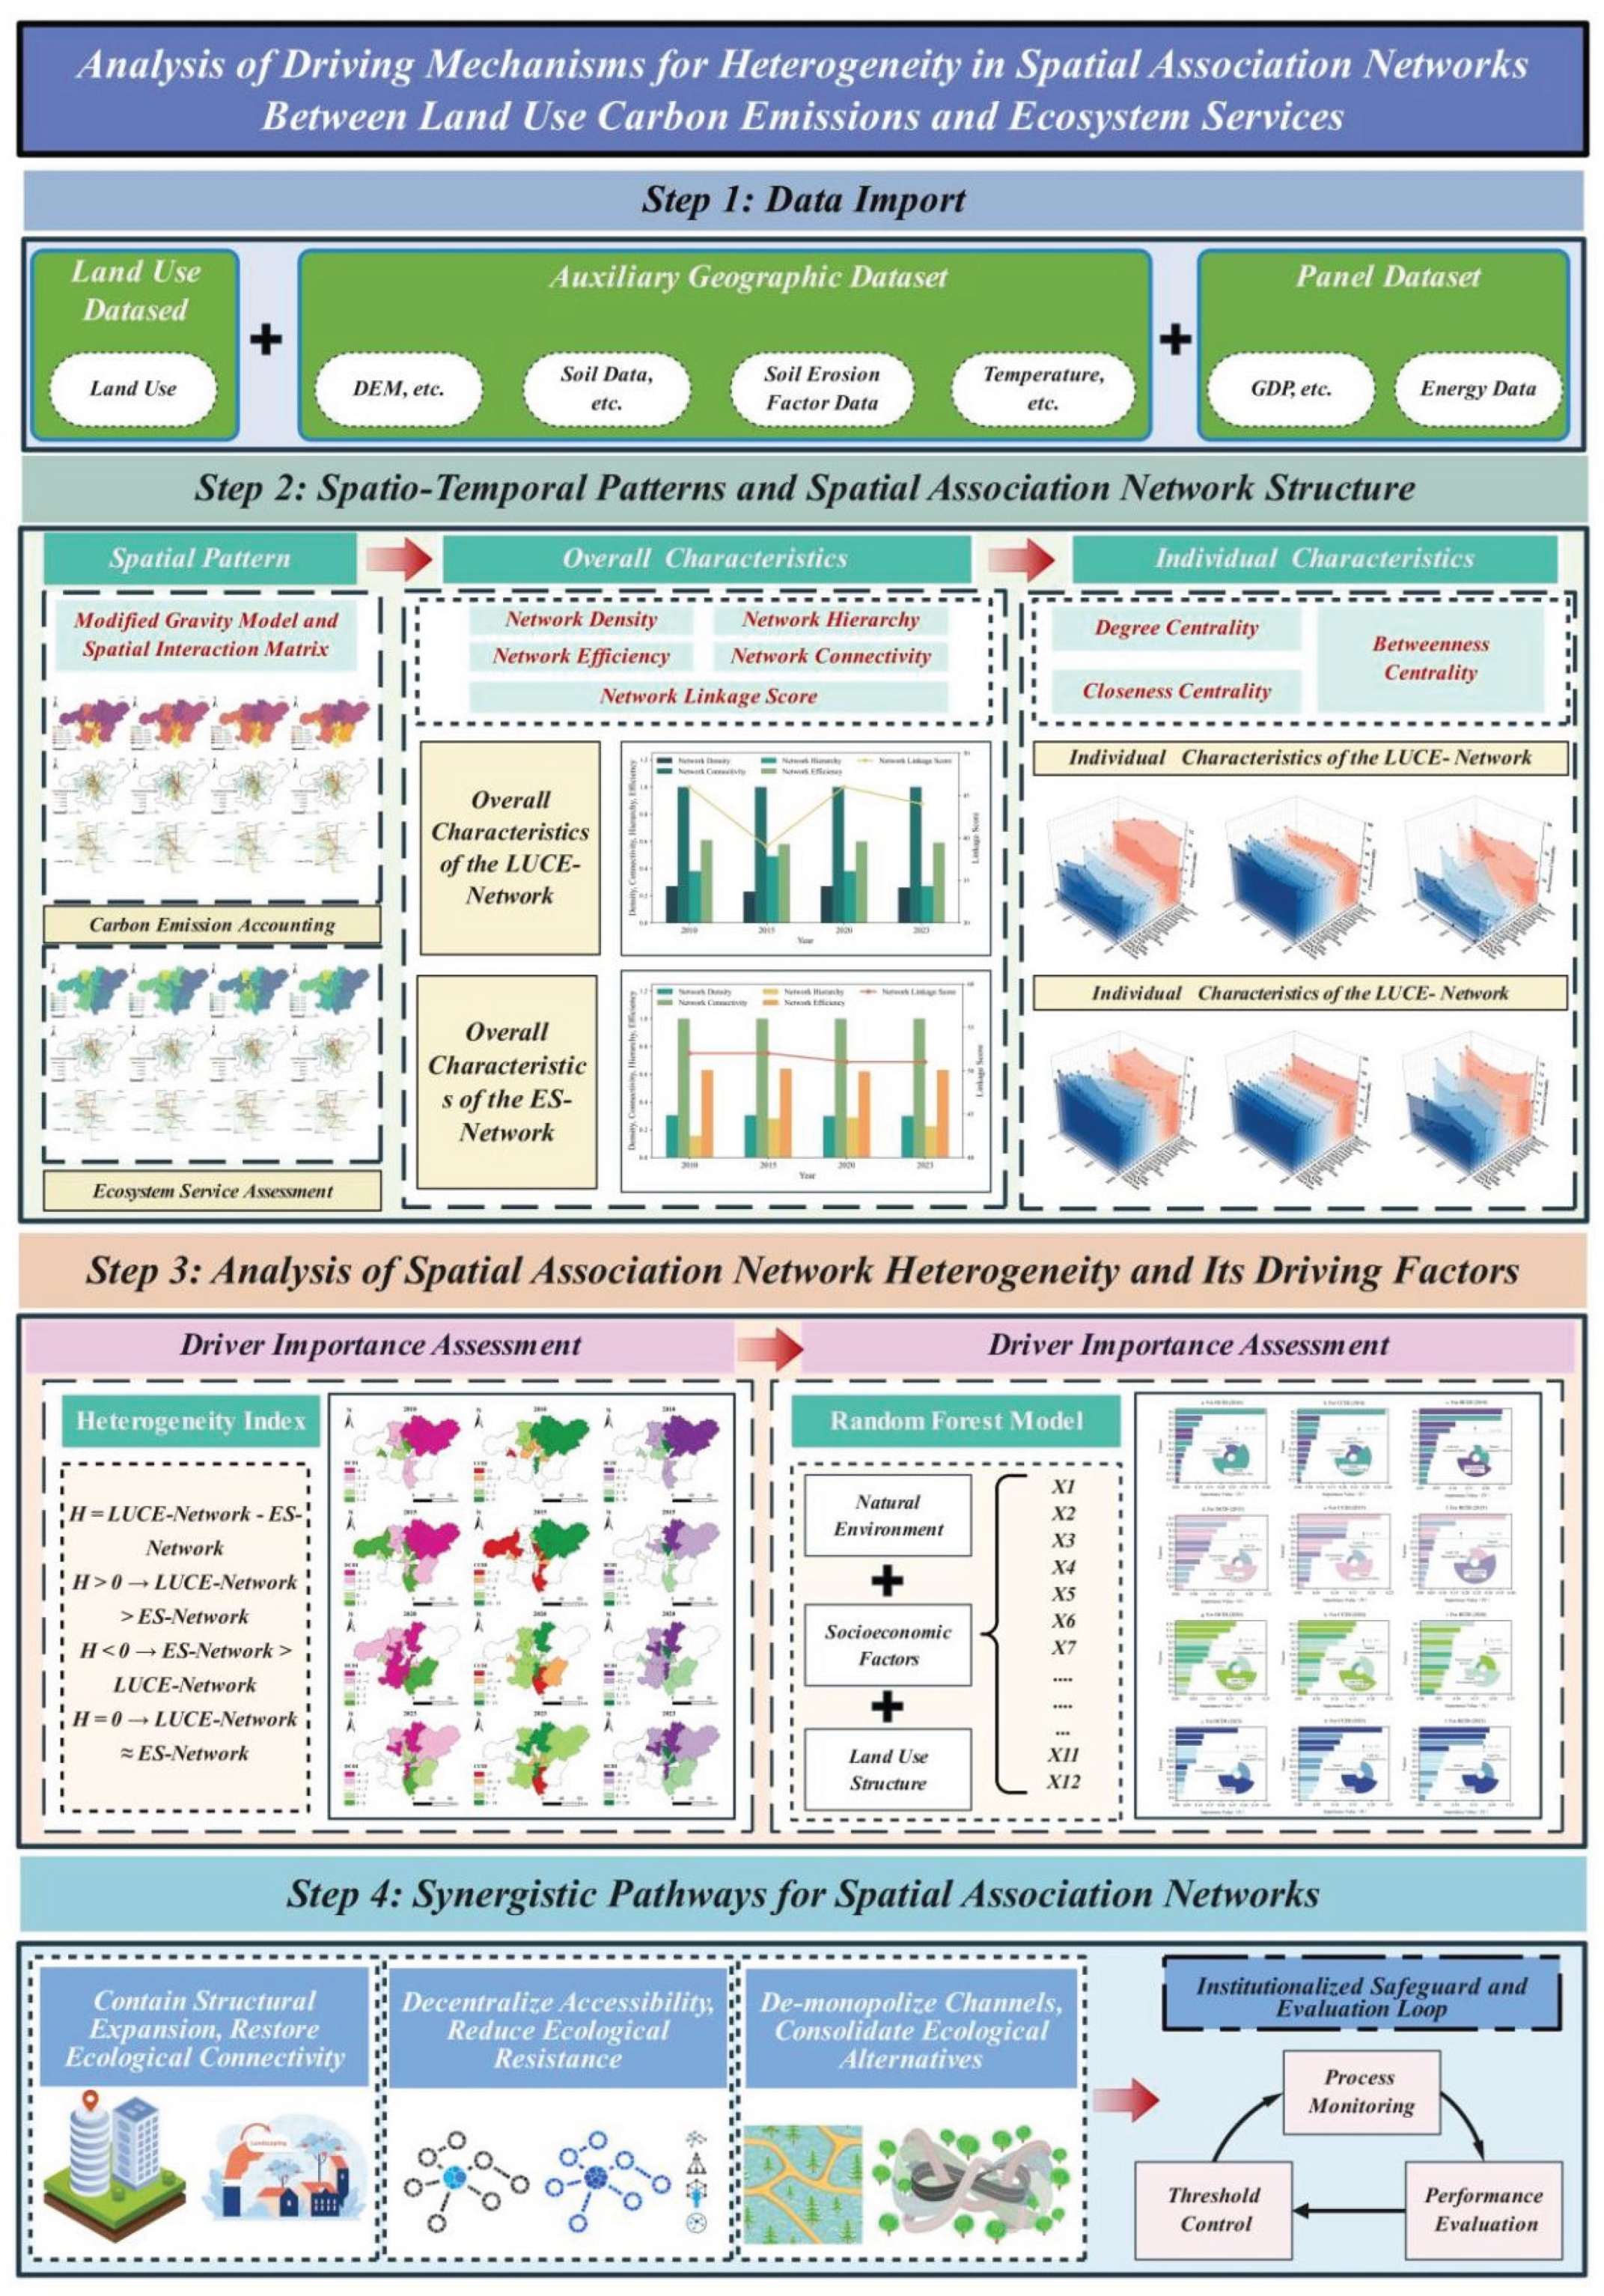
Figure 2.
Overview of the study area.
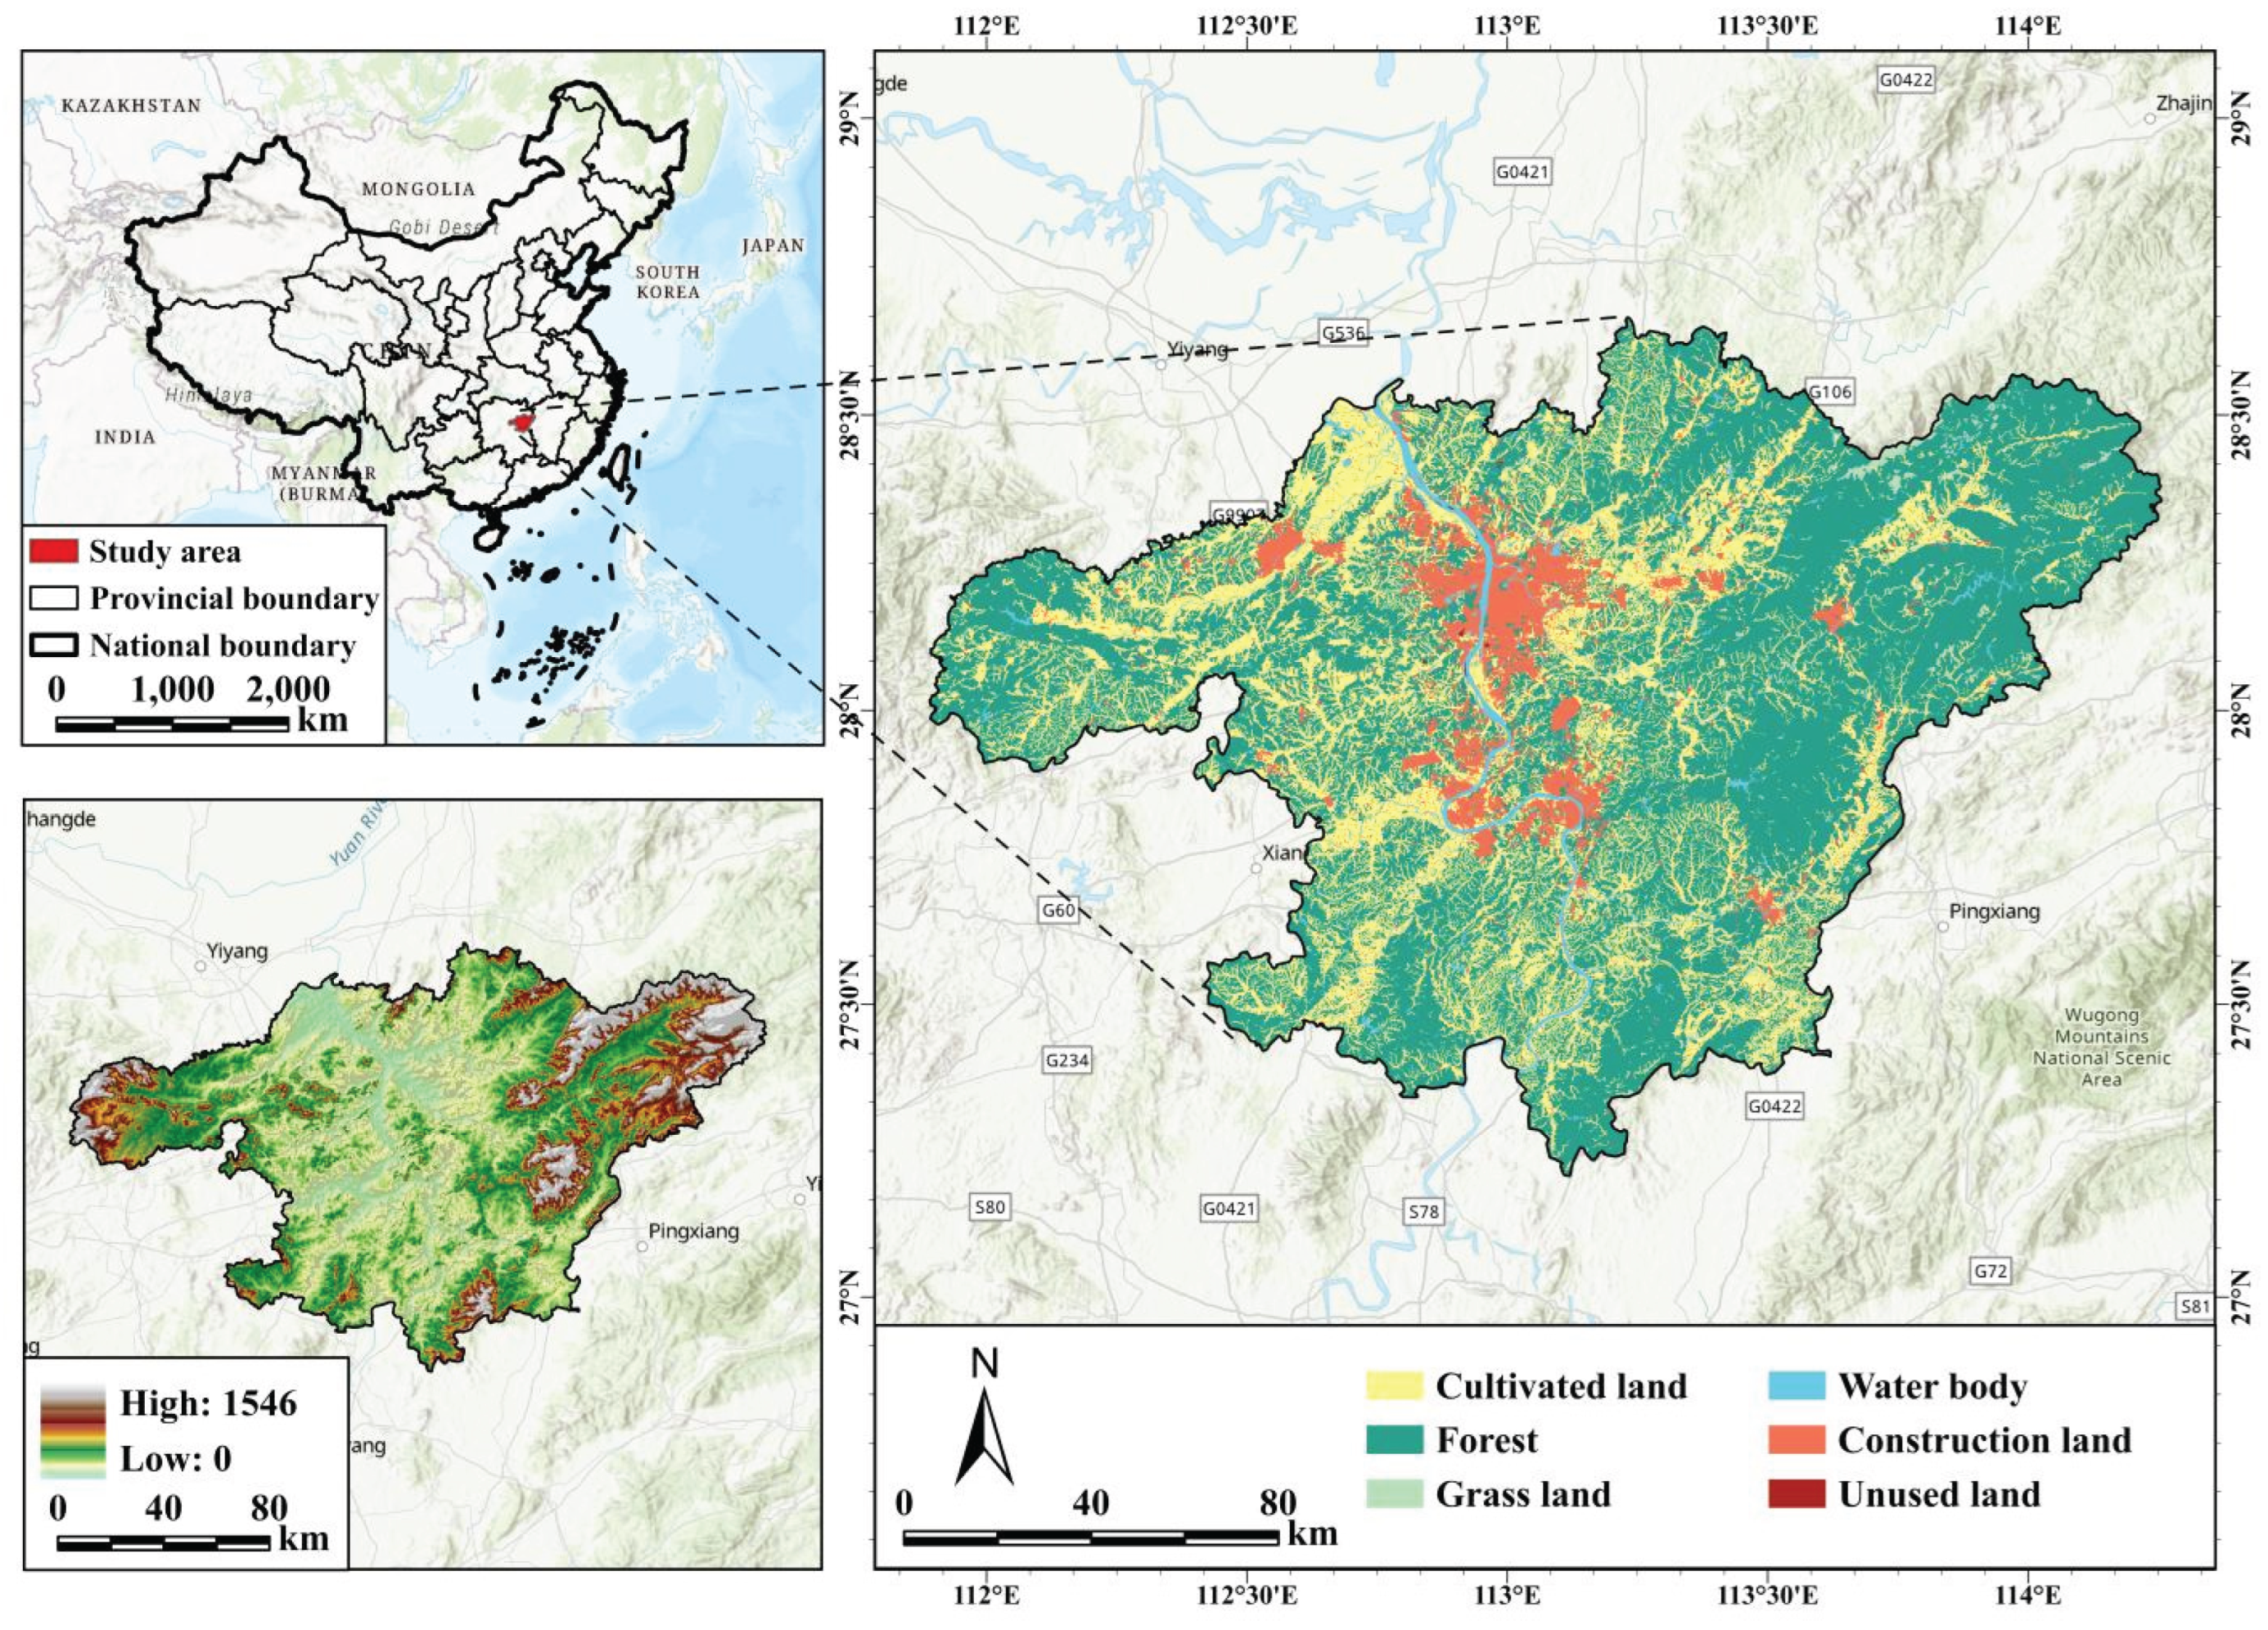
Figure 3.
Spatial Distribution and Spatial Network Structure Diagram of LUCE.
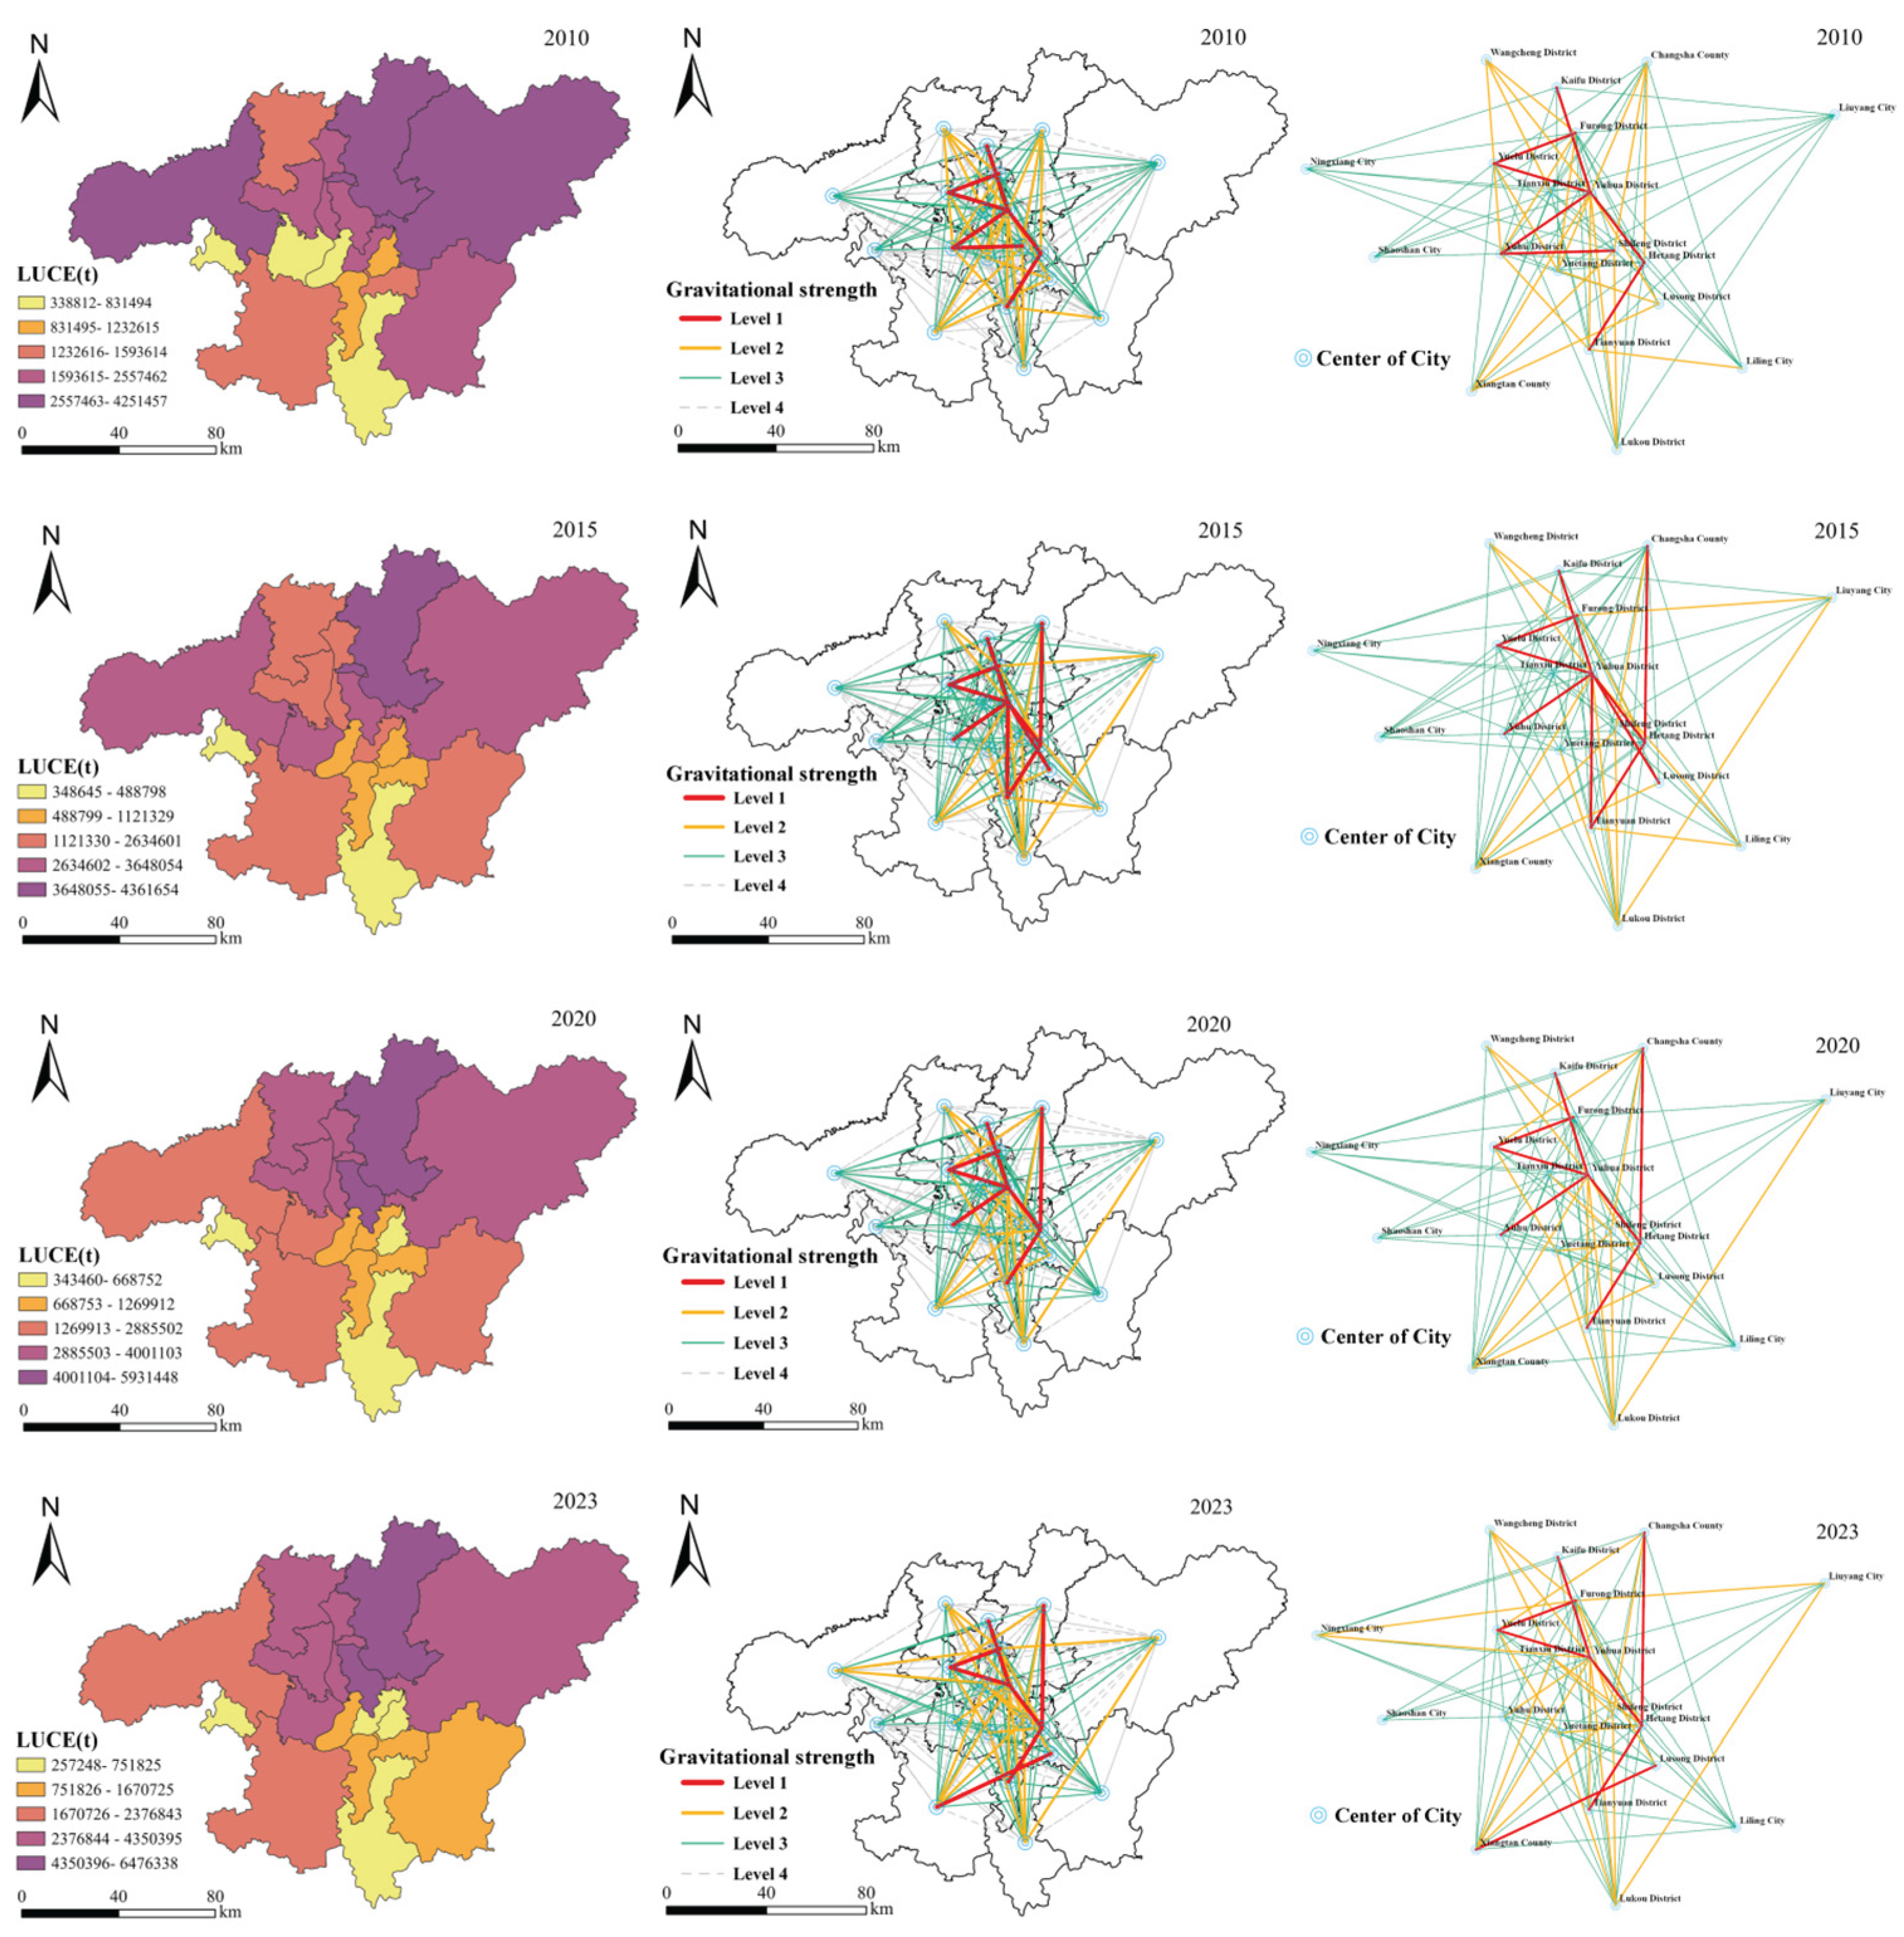
Figure 4.
Spatial Distribution and Spatial Network Structure Diagram of ES.
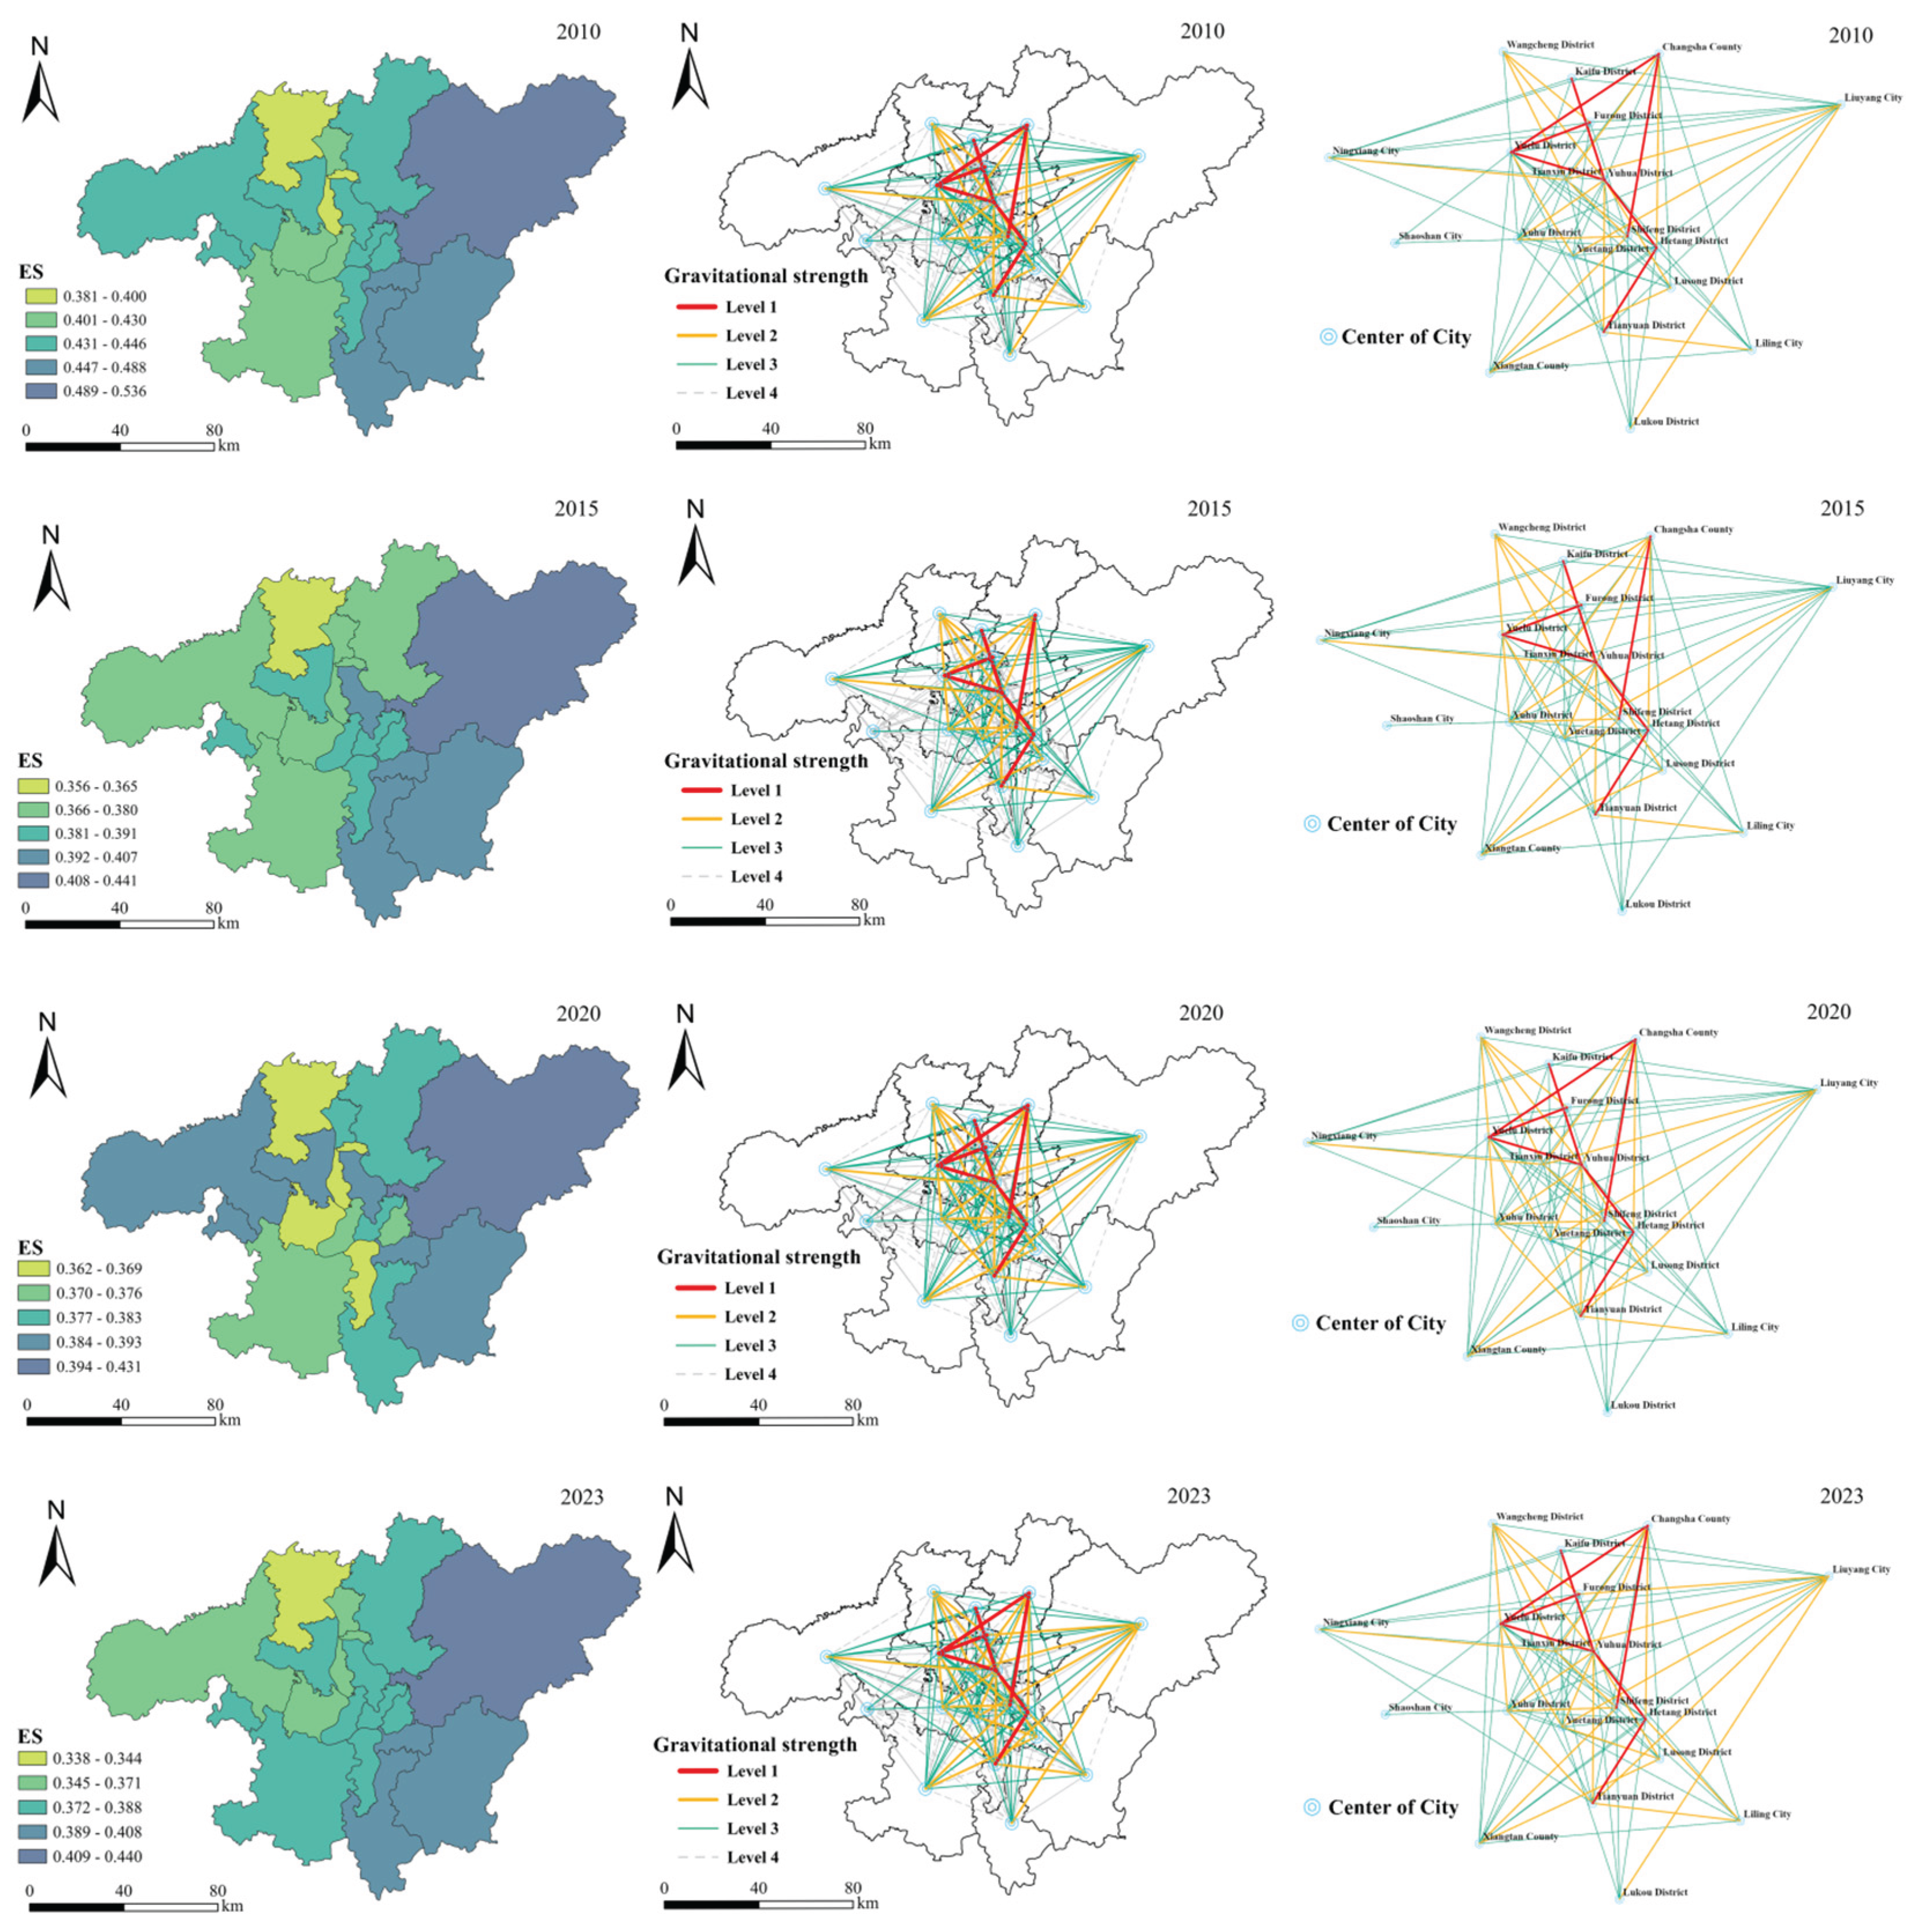
Figure 5.
Overall Characteristics of the LUCE-Network.
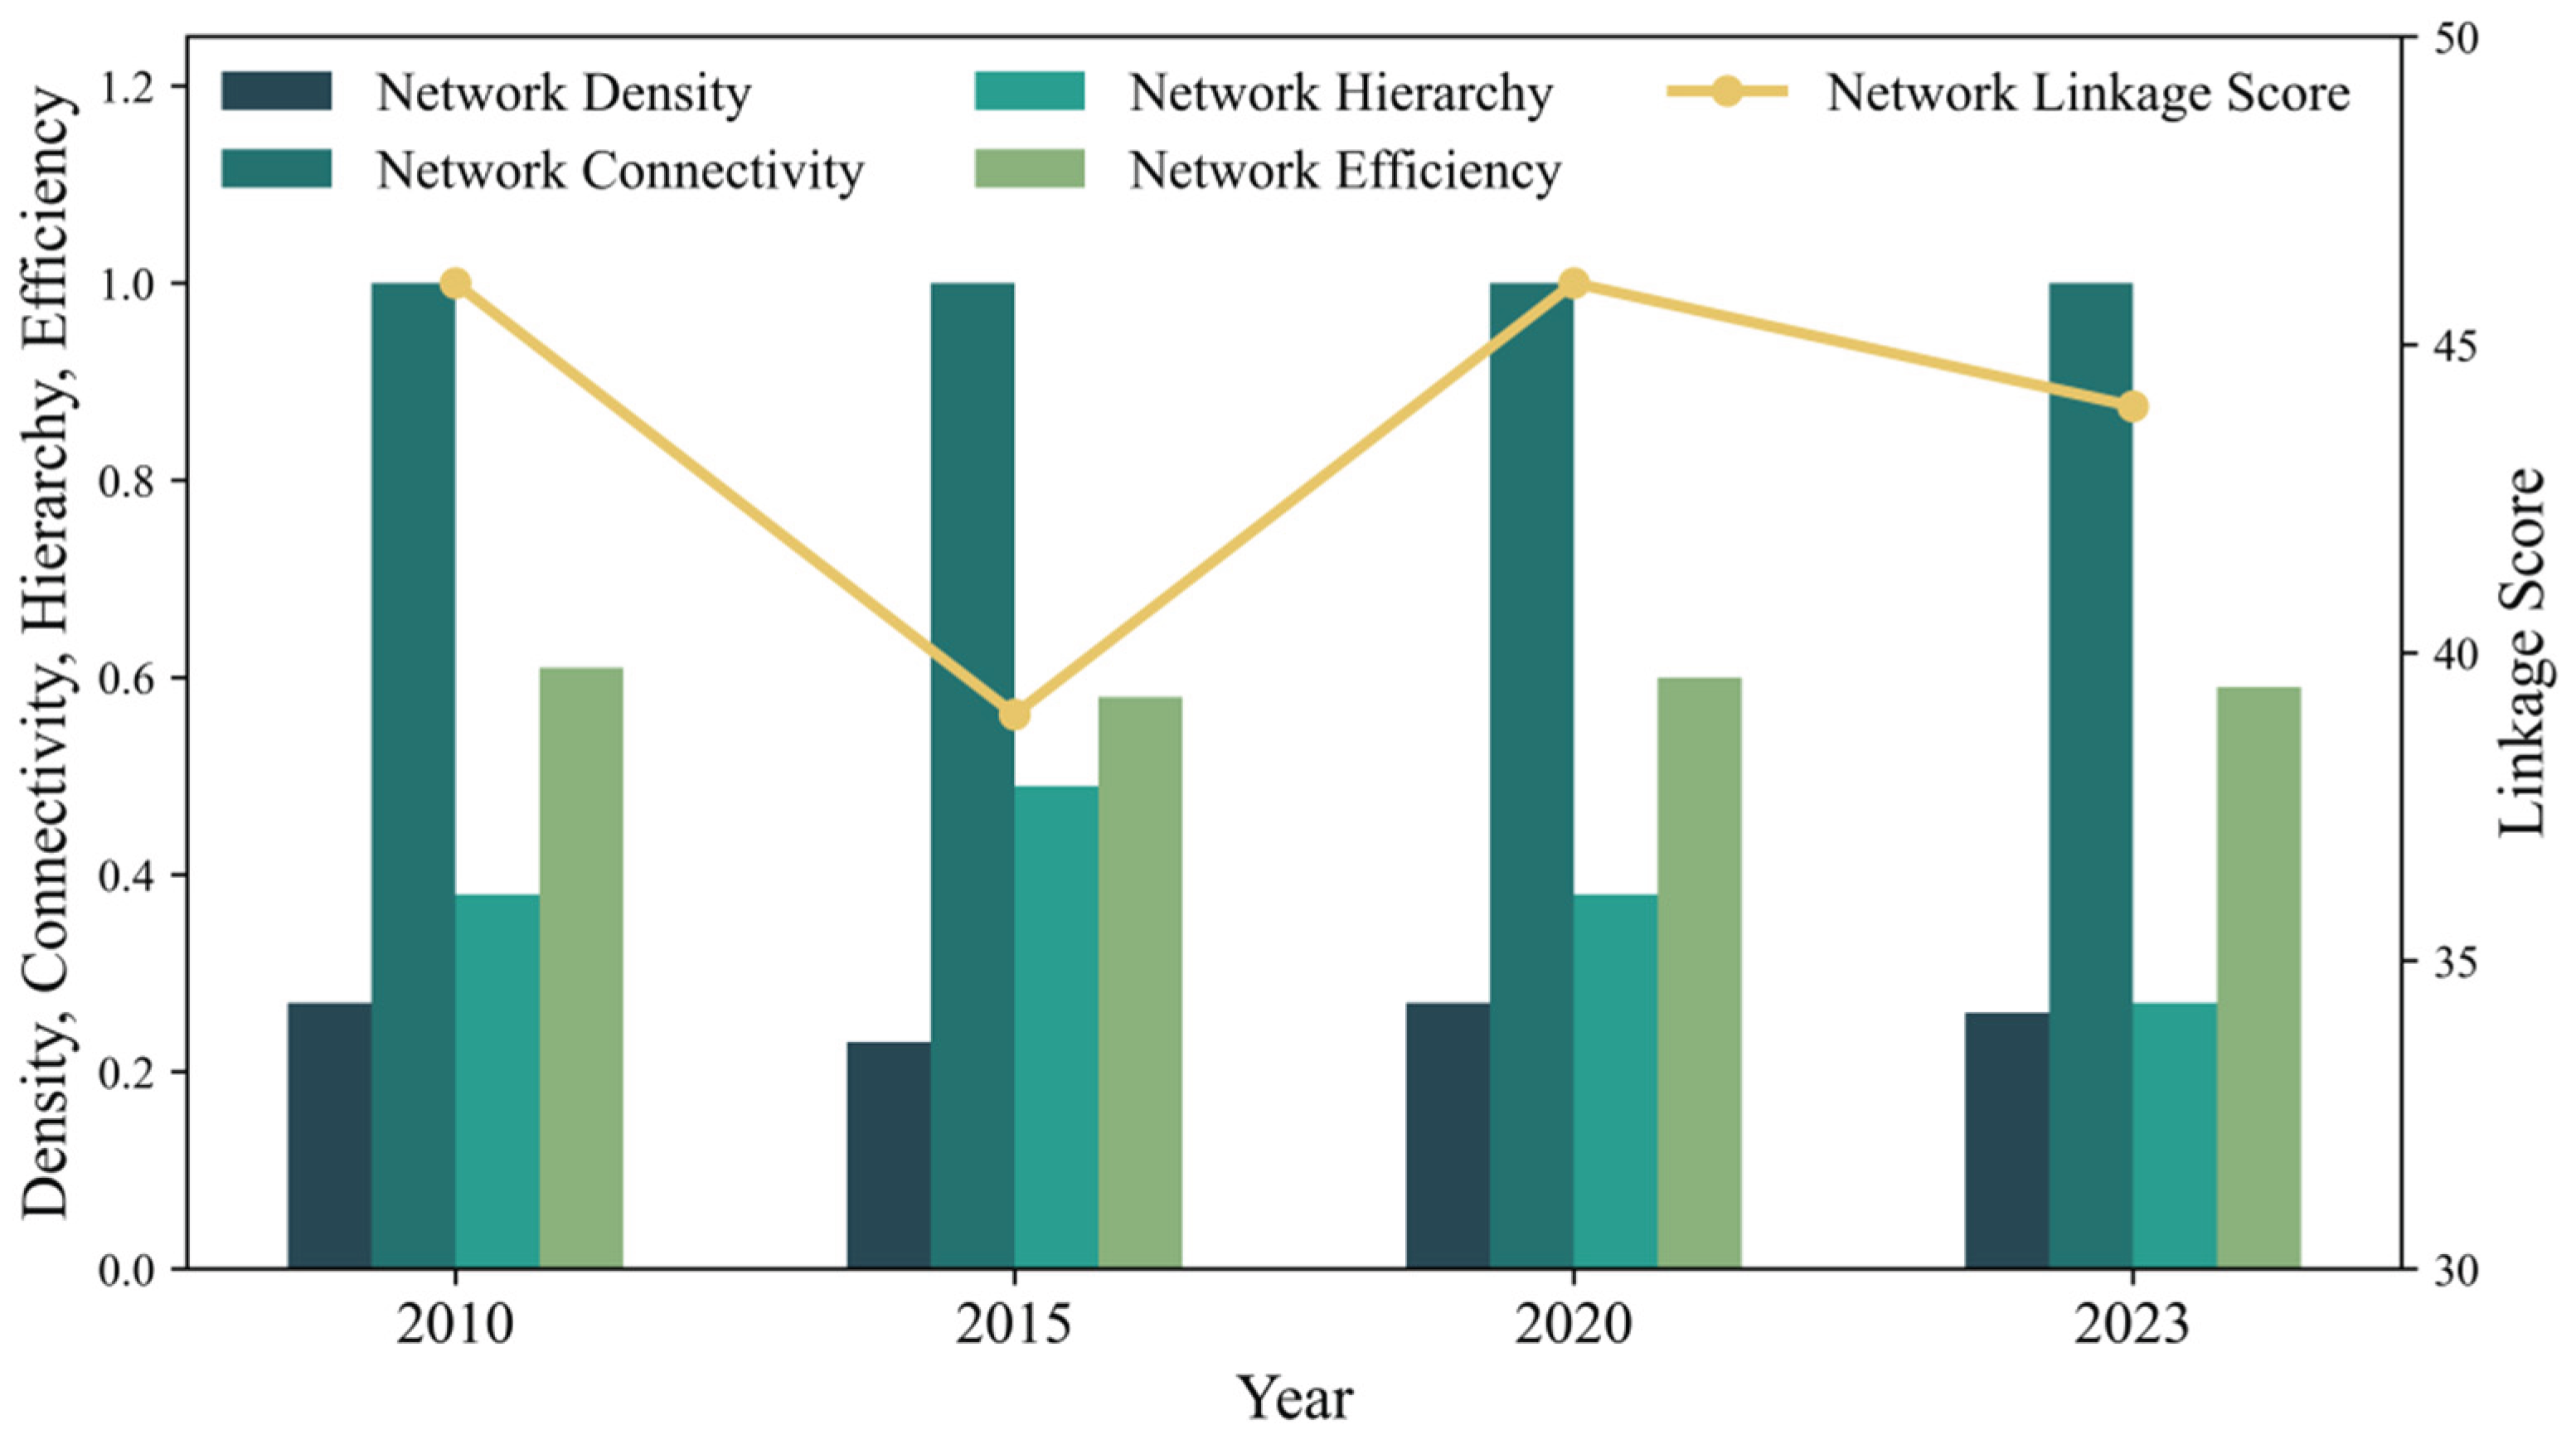
Figure 6.
Overall Characteristics of the ES-Network.
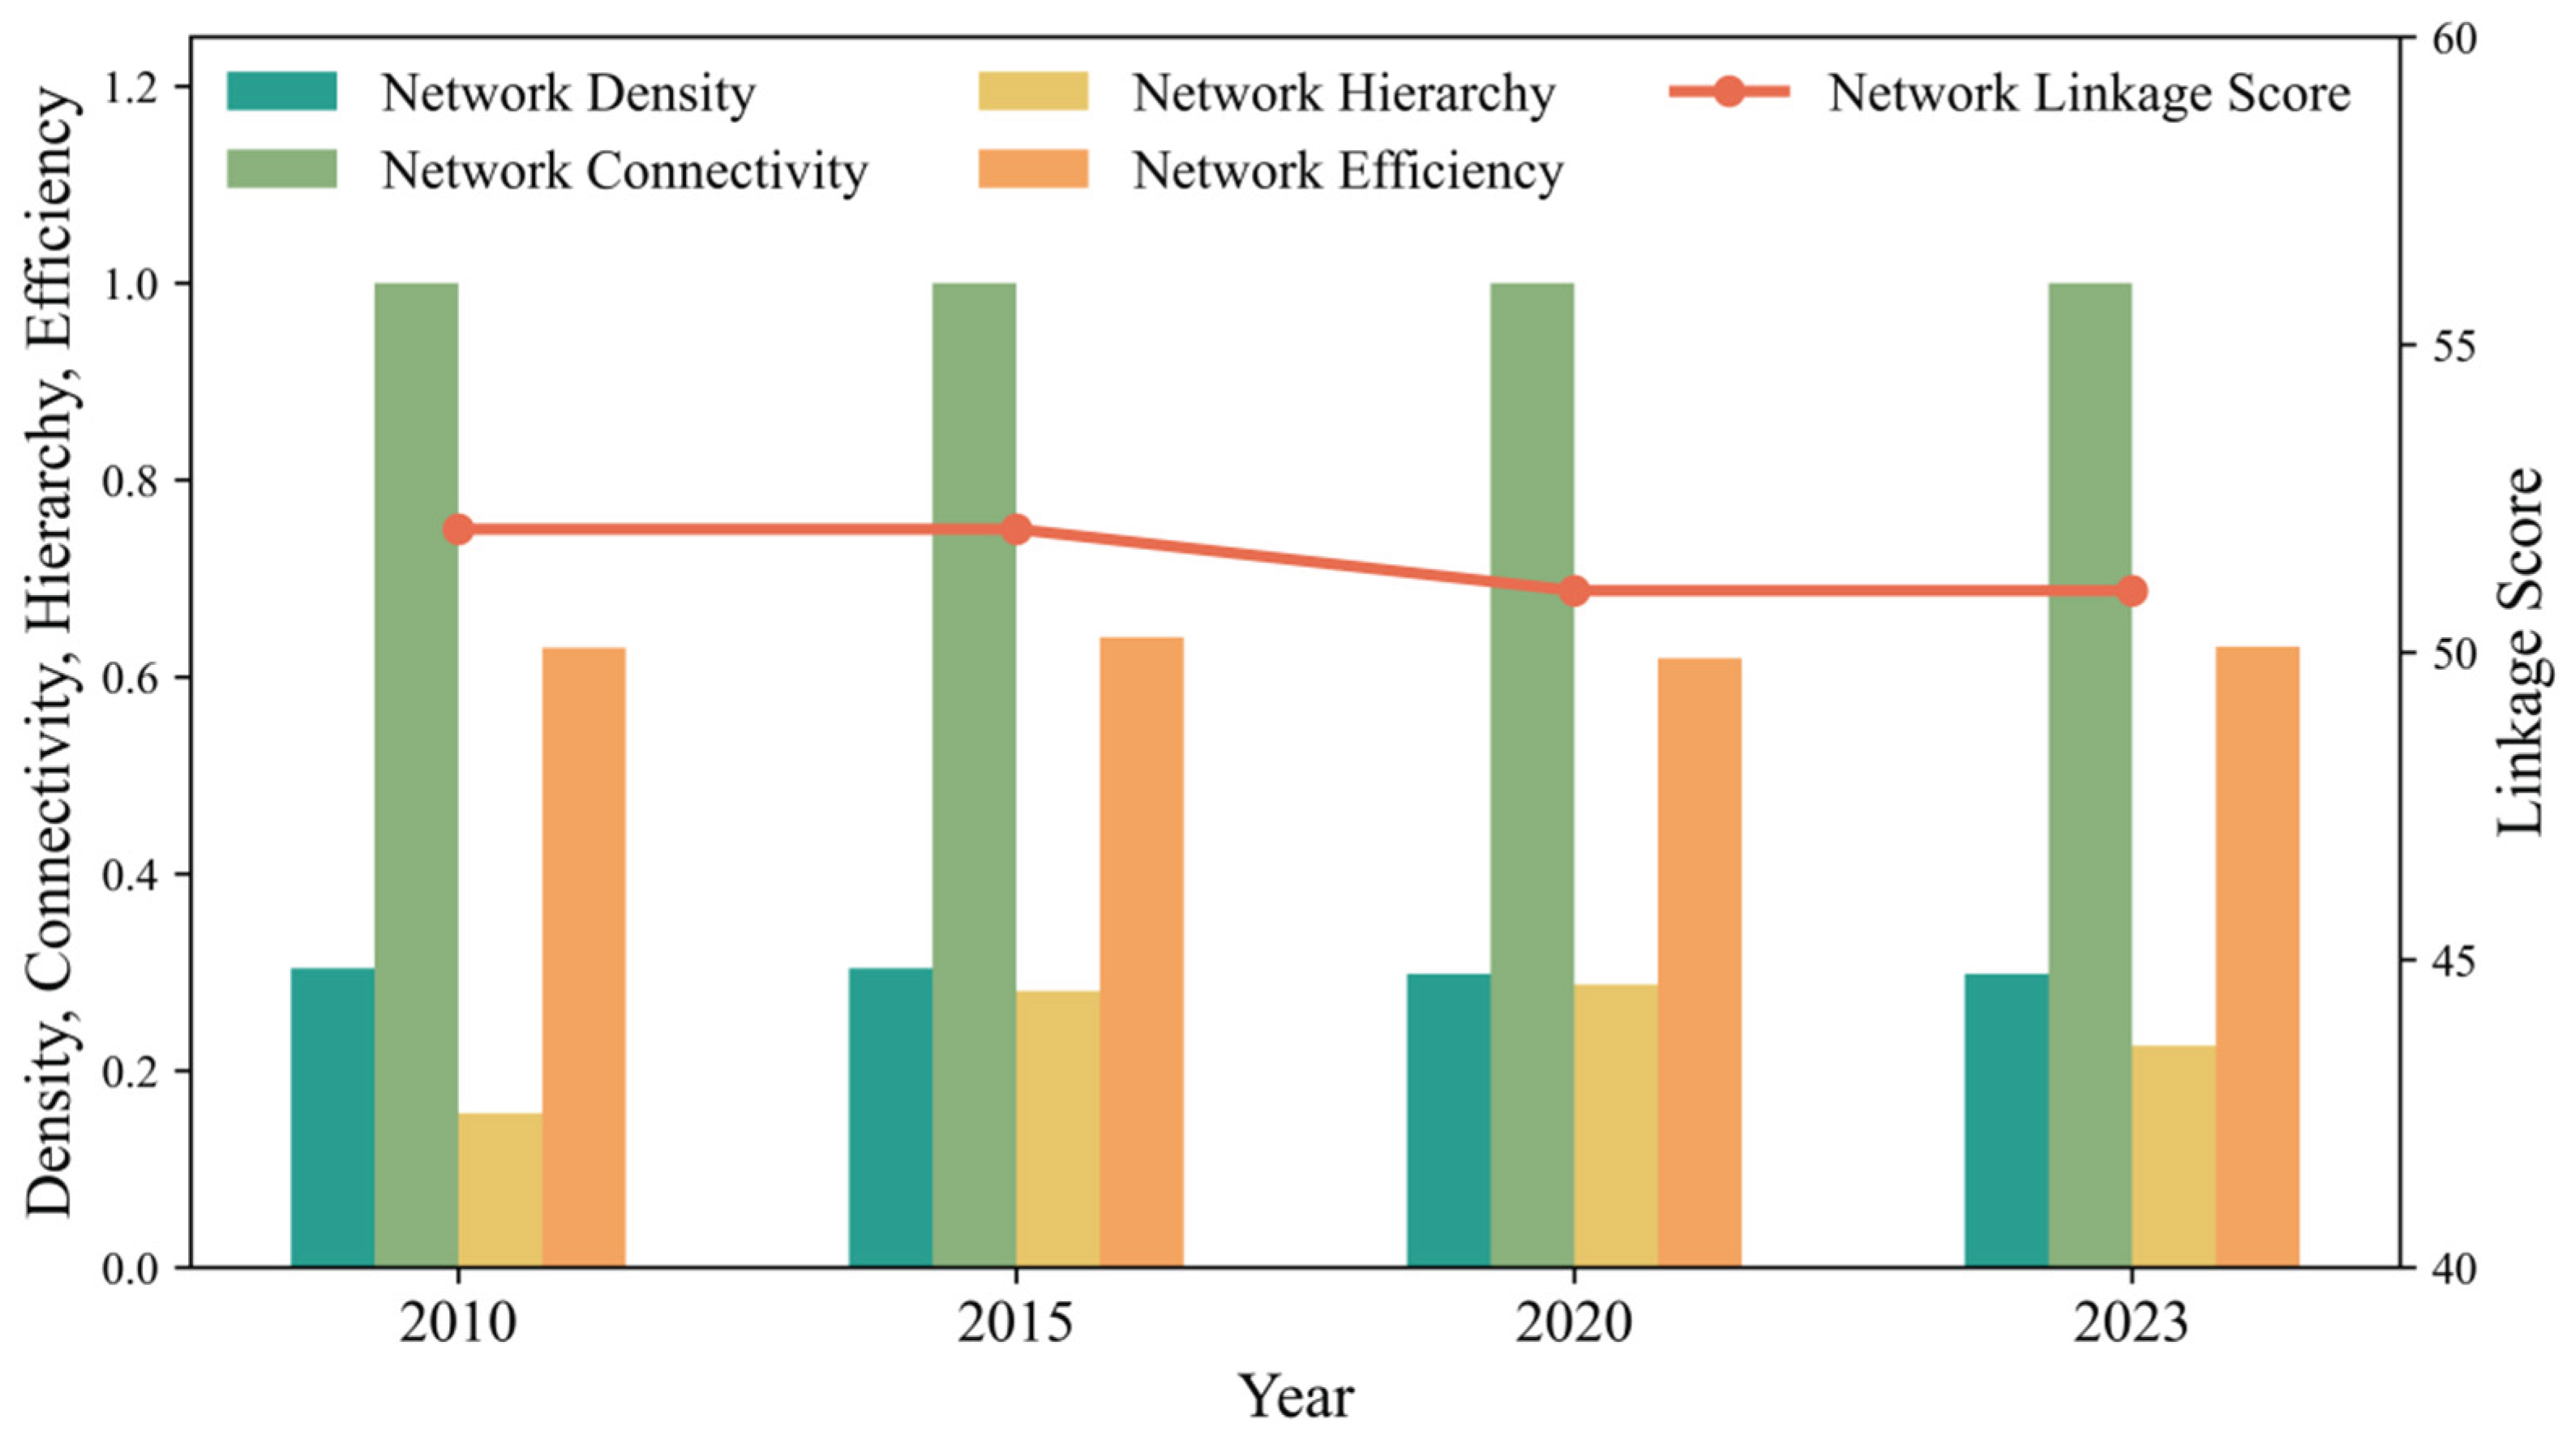
Figure 7.
Individual Structural Characteristics Indicators of the LUCE-Network.
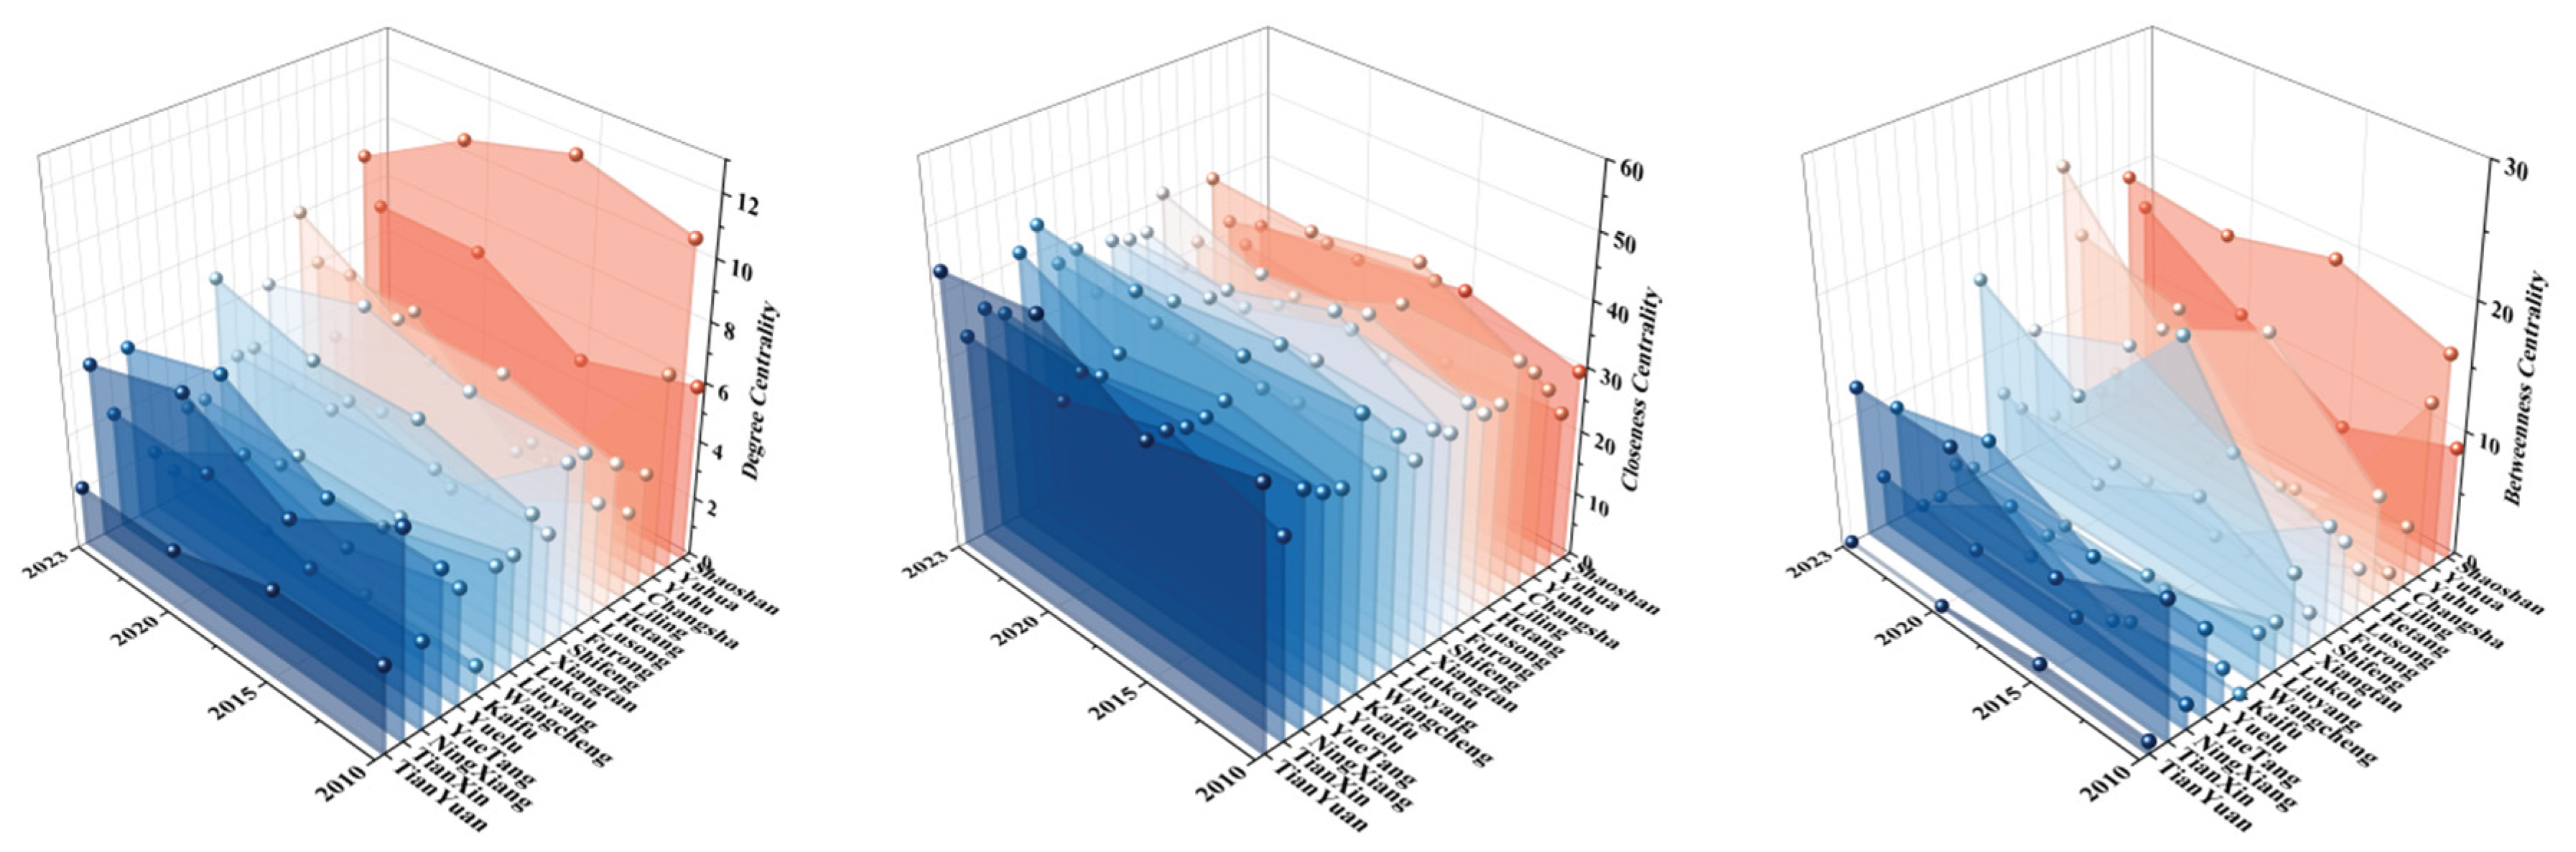
Figure 8.
Individual Structural Characteristics Indicators of the ES-Network.
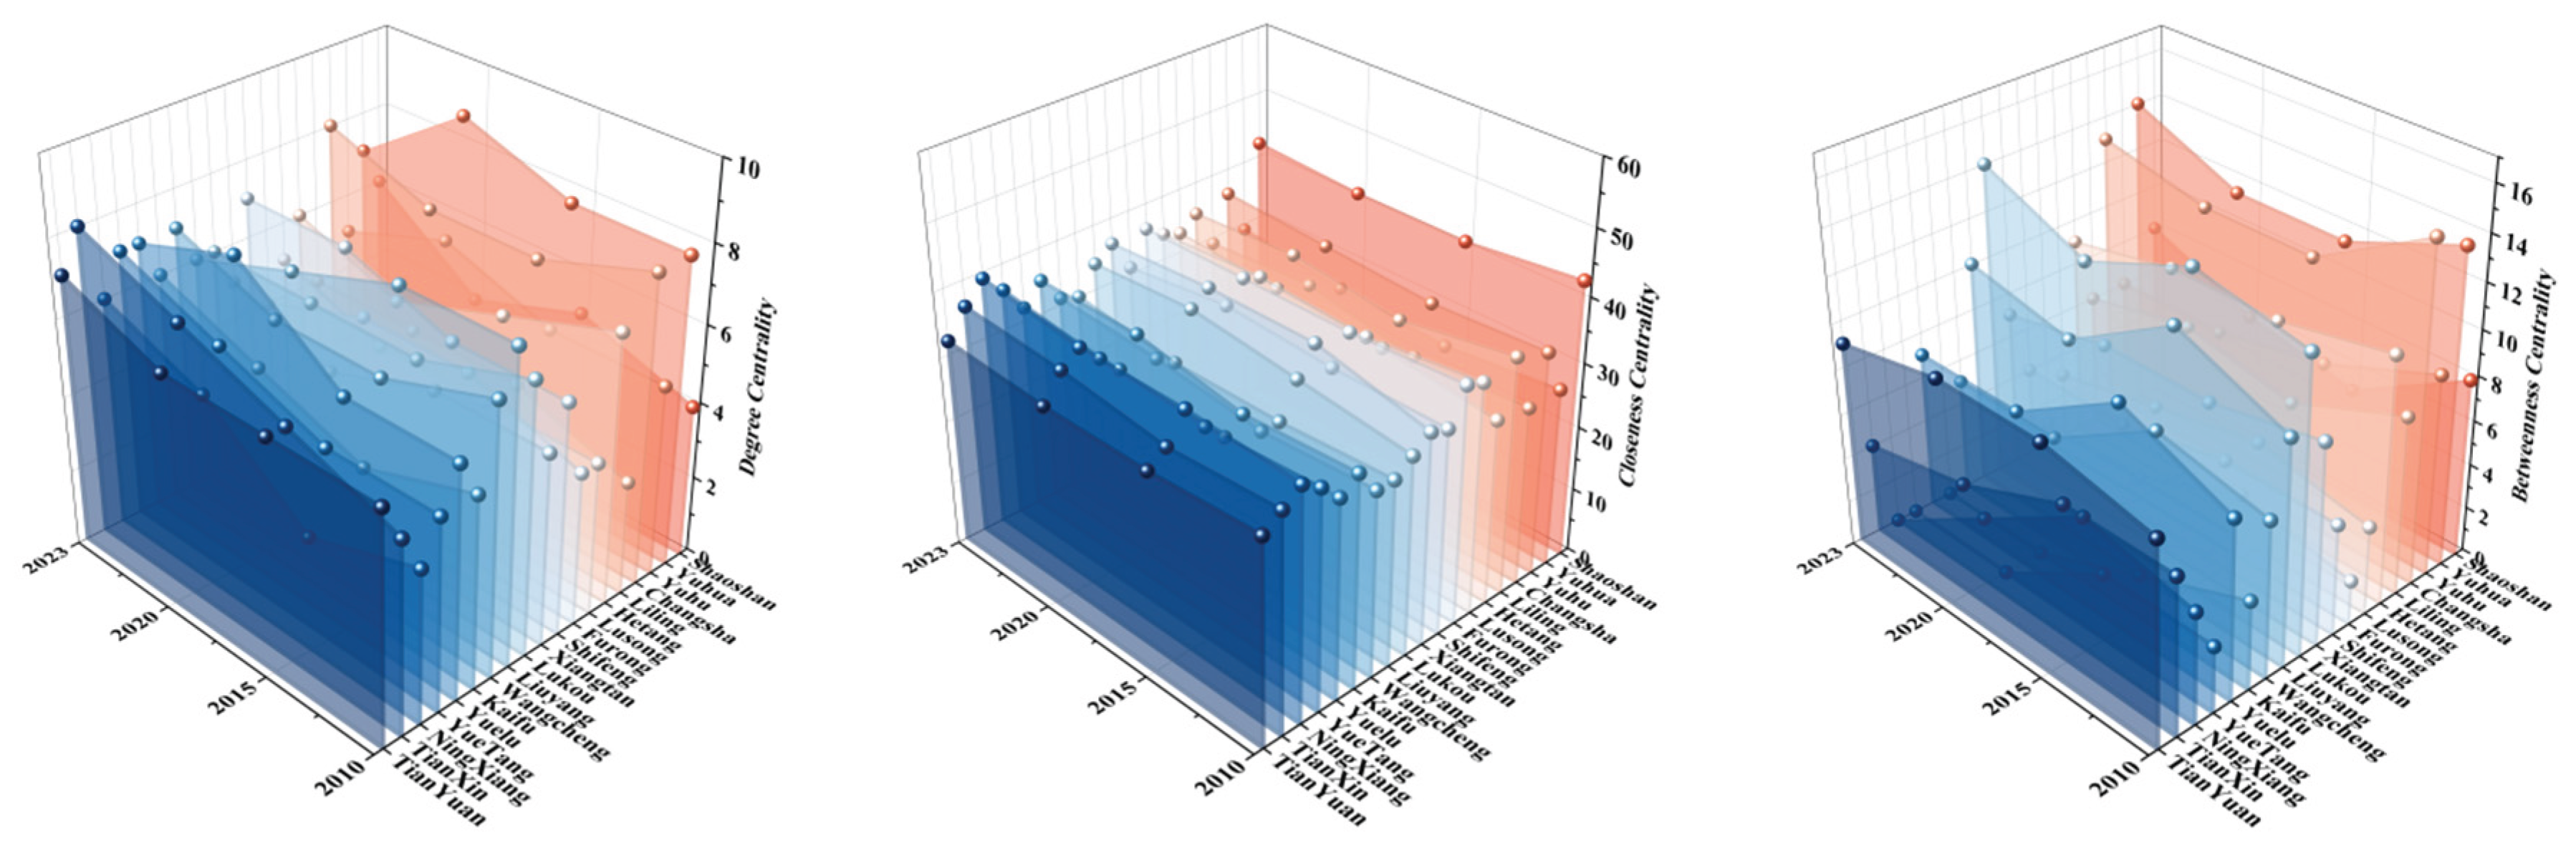
Figure 9.
Spatiotemporal Distribution Pattern of LUCE and ES Network Heterogeneity Indices from 2010 to 2023.
Figure 9.
Spatiotemporal Distribution Pattern of LUCE and ES Network Heterogeneity Indices from 2010 to 2023.
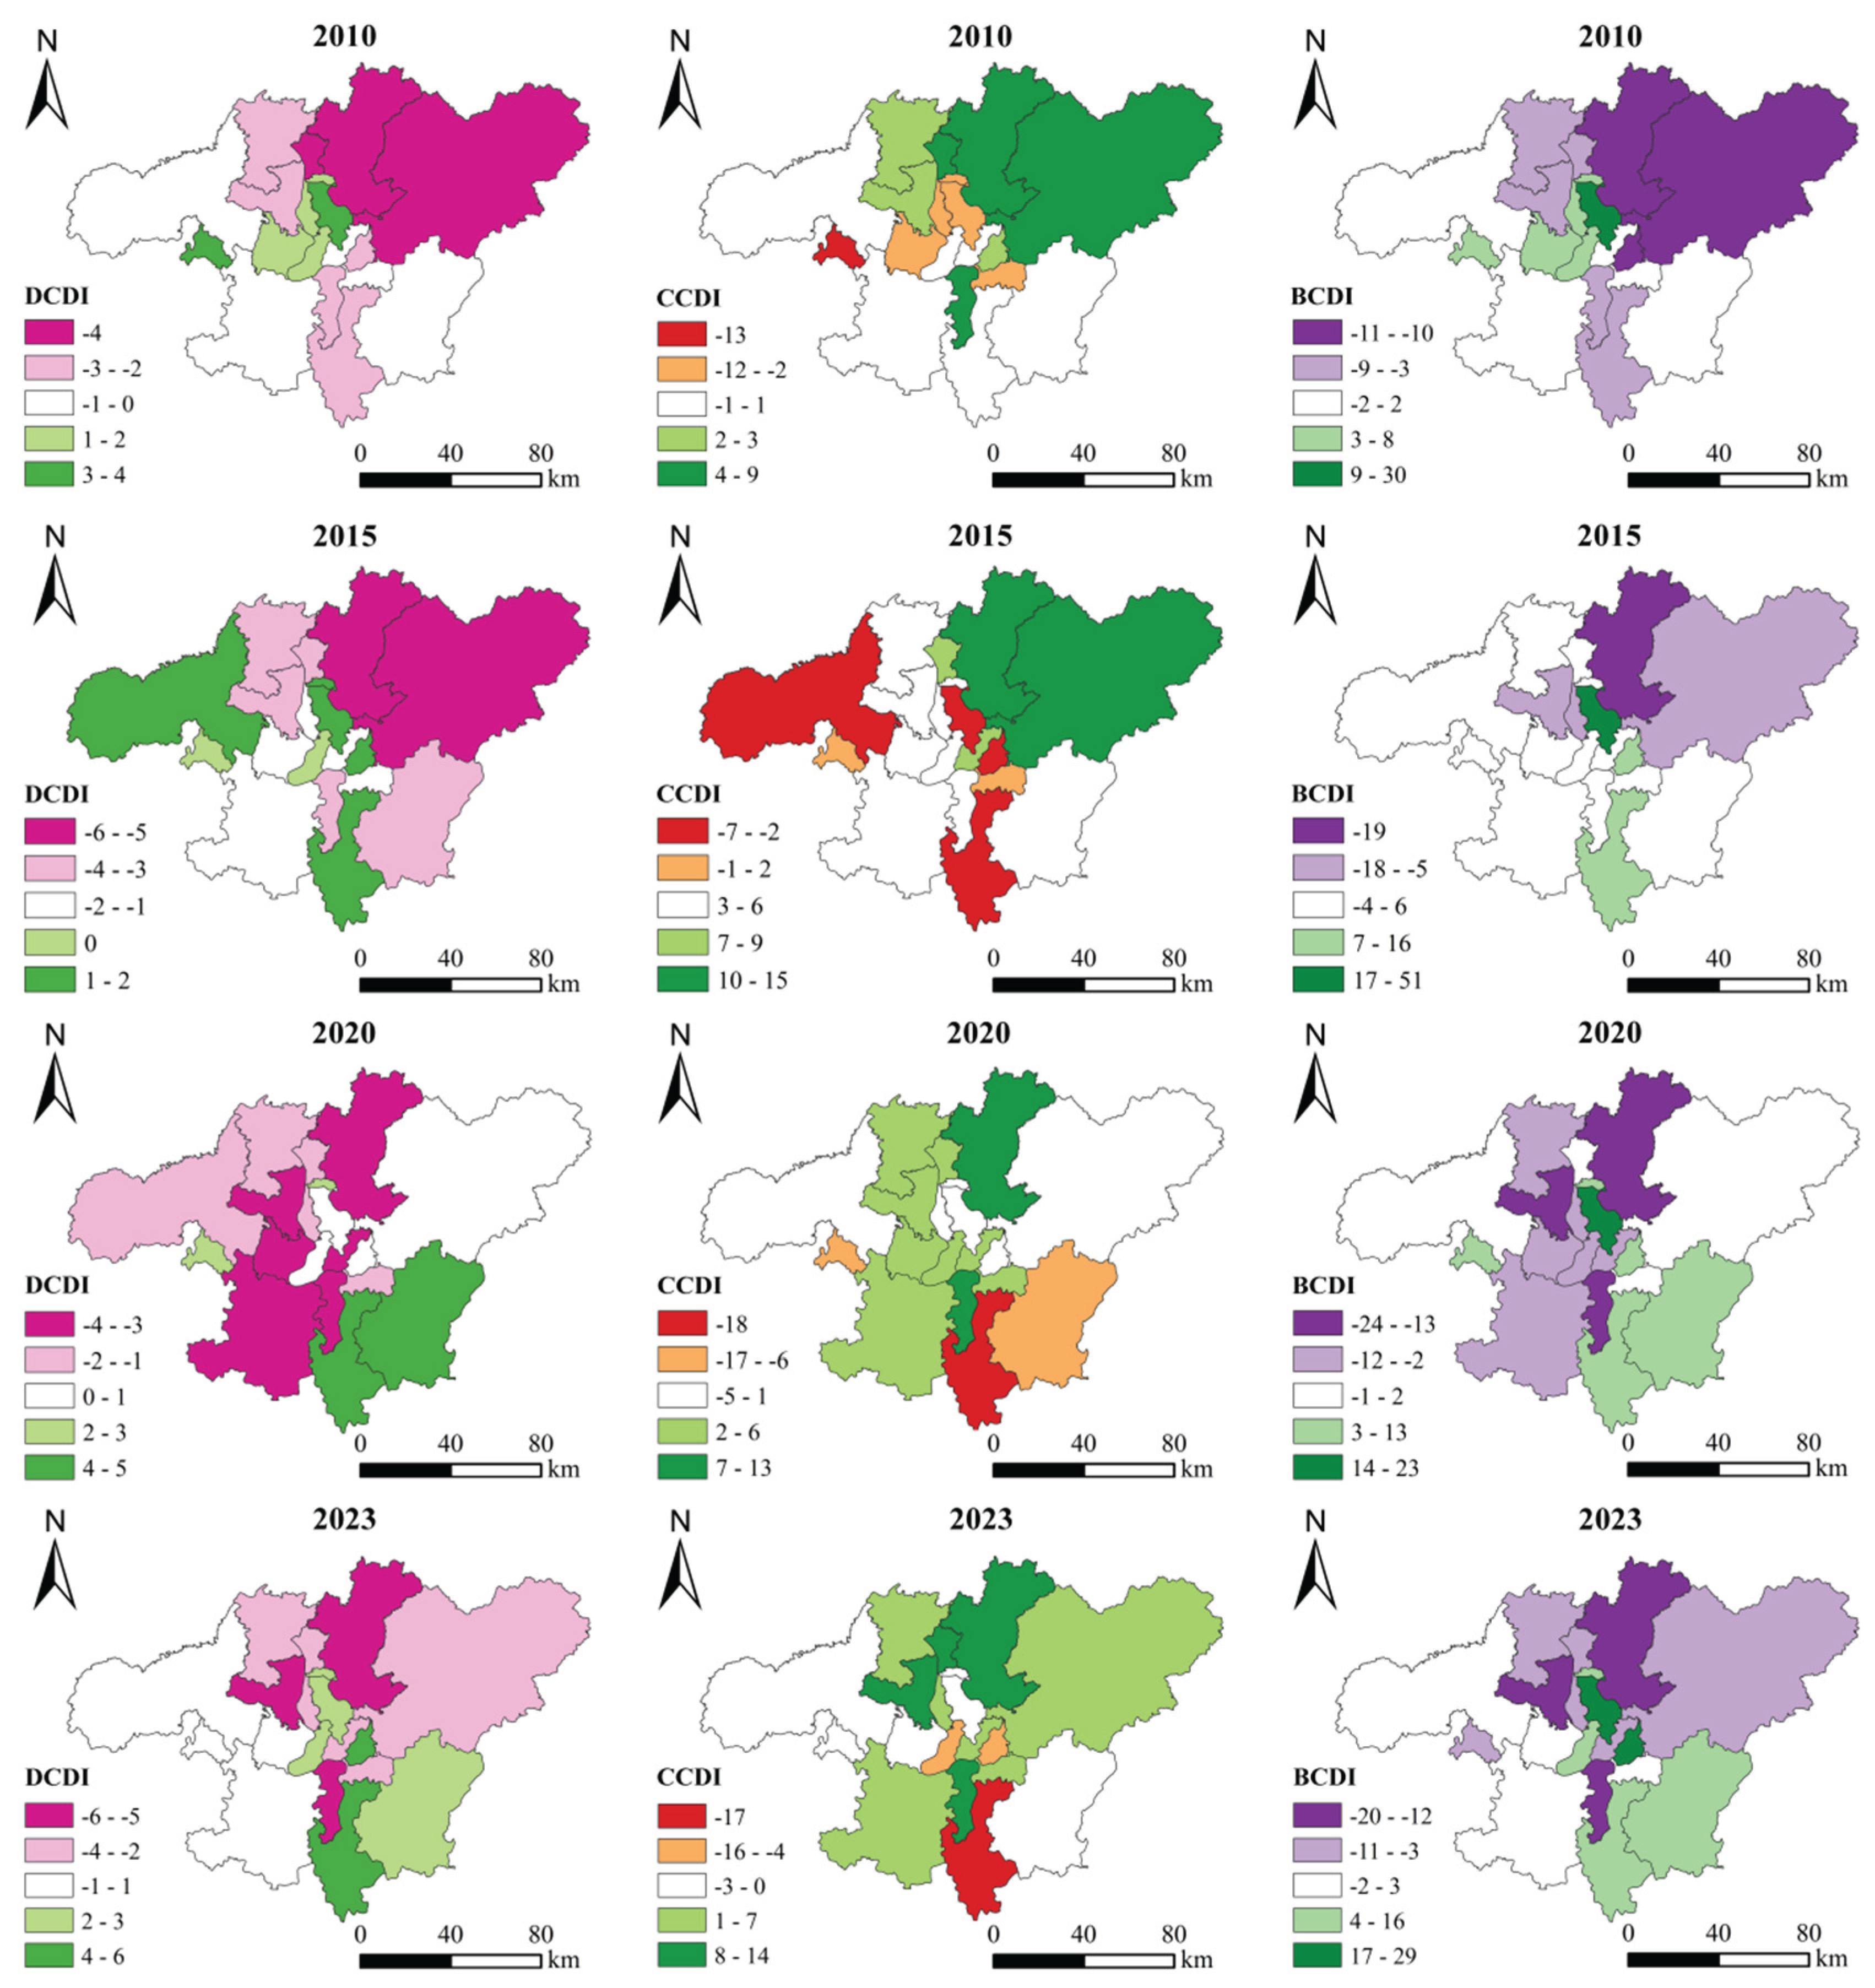
Figure 10.
Driving Factor Importance Assessment Results from 2010 to 2023.
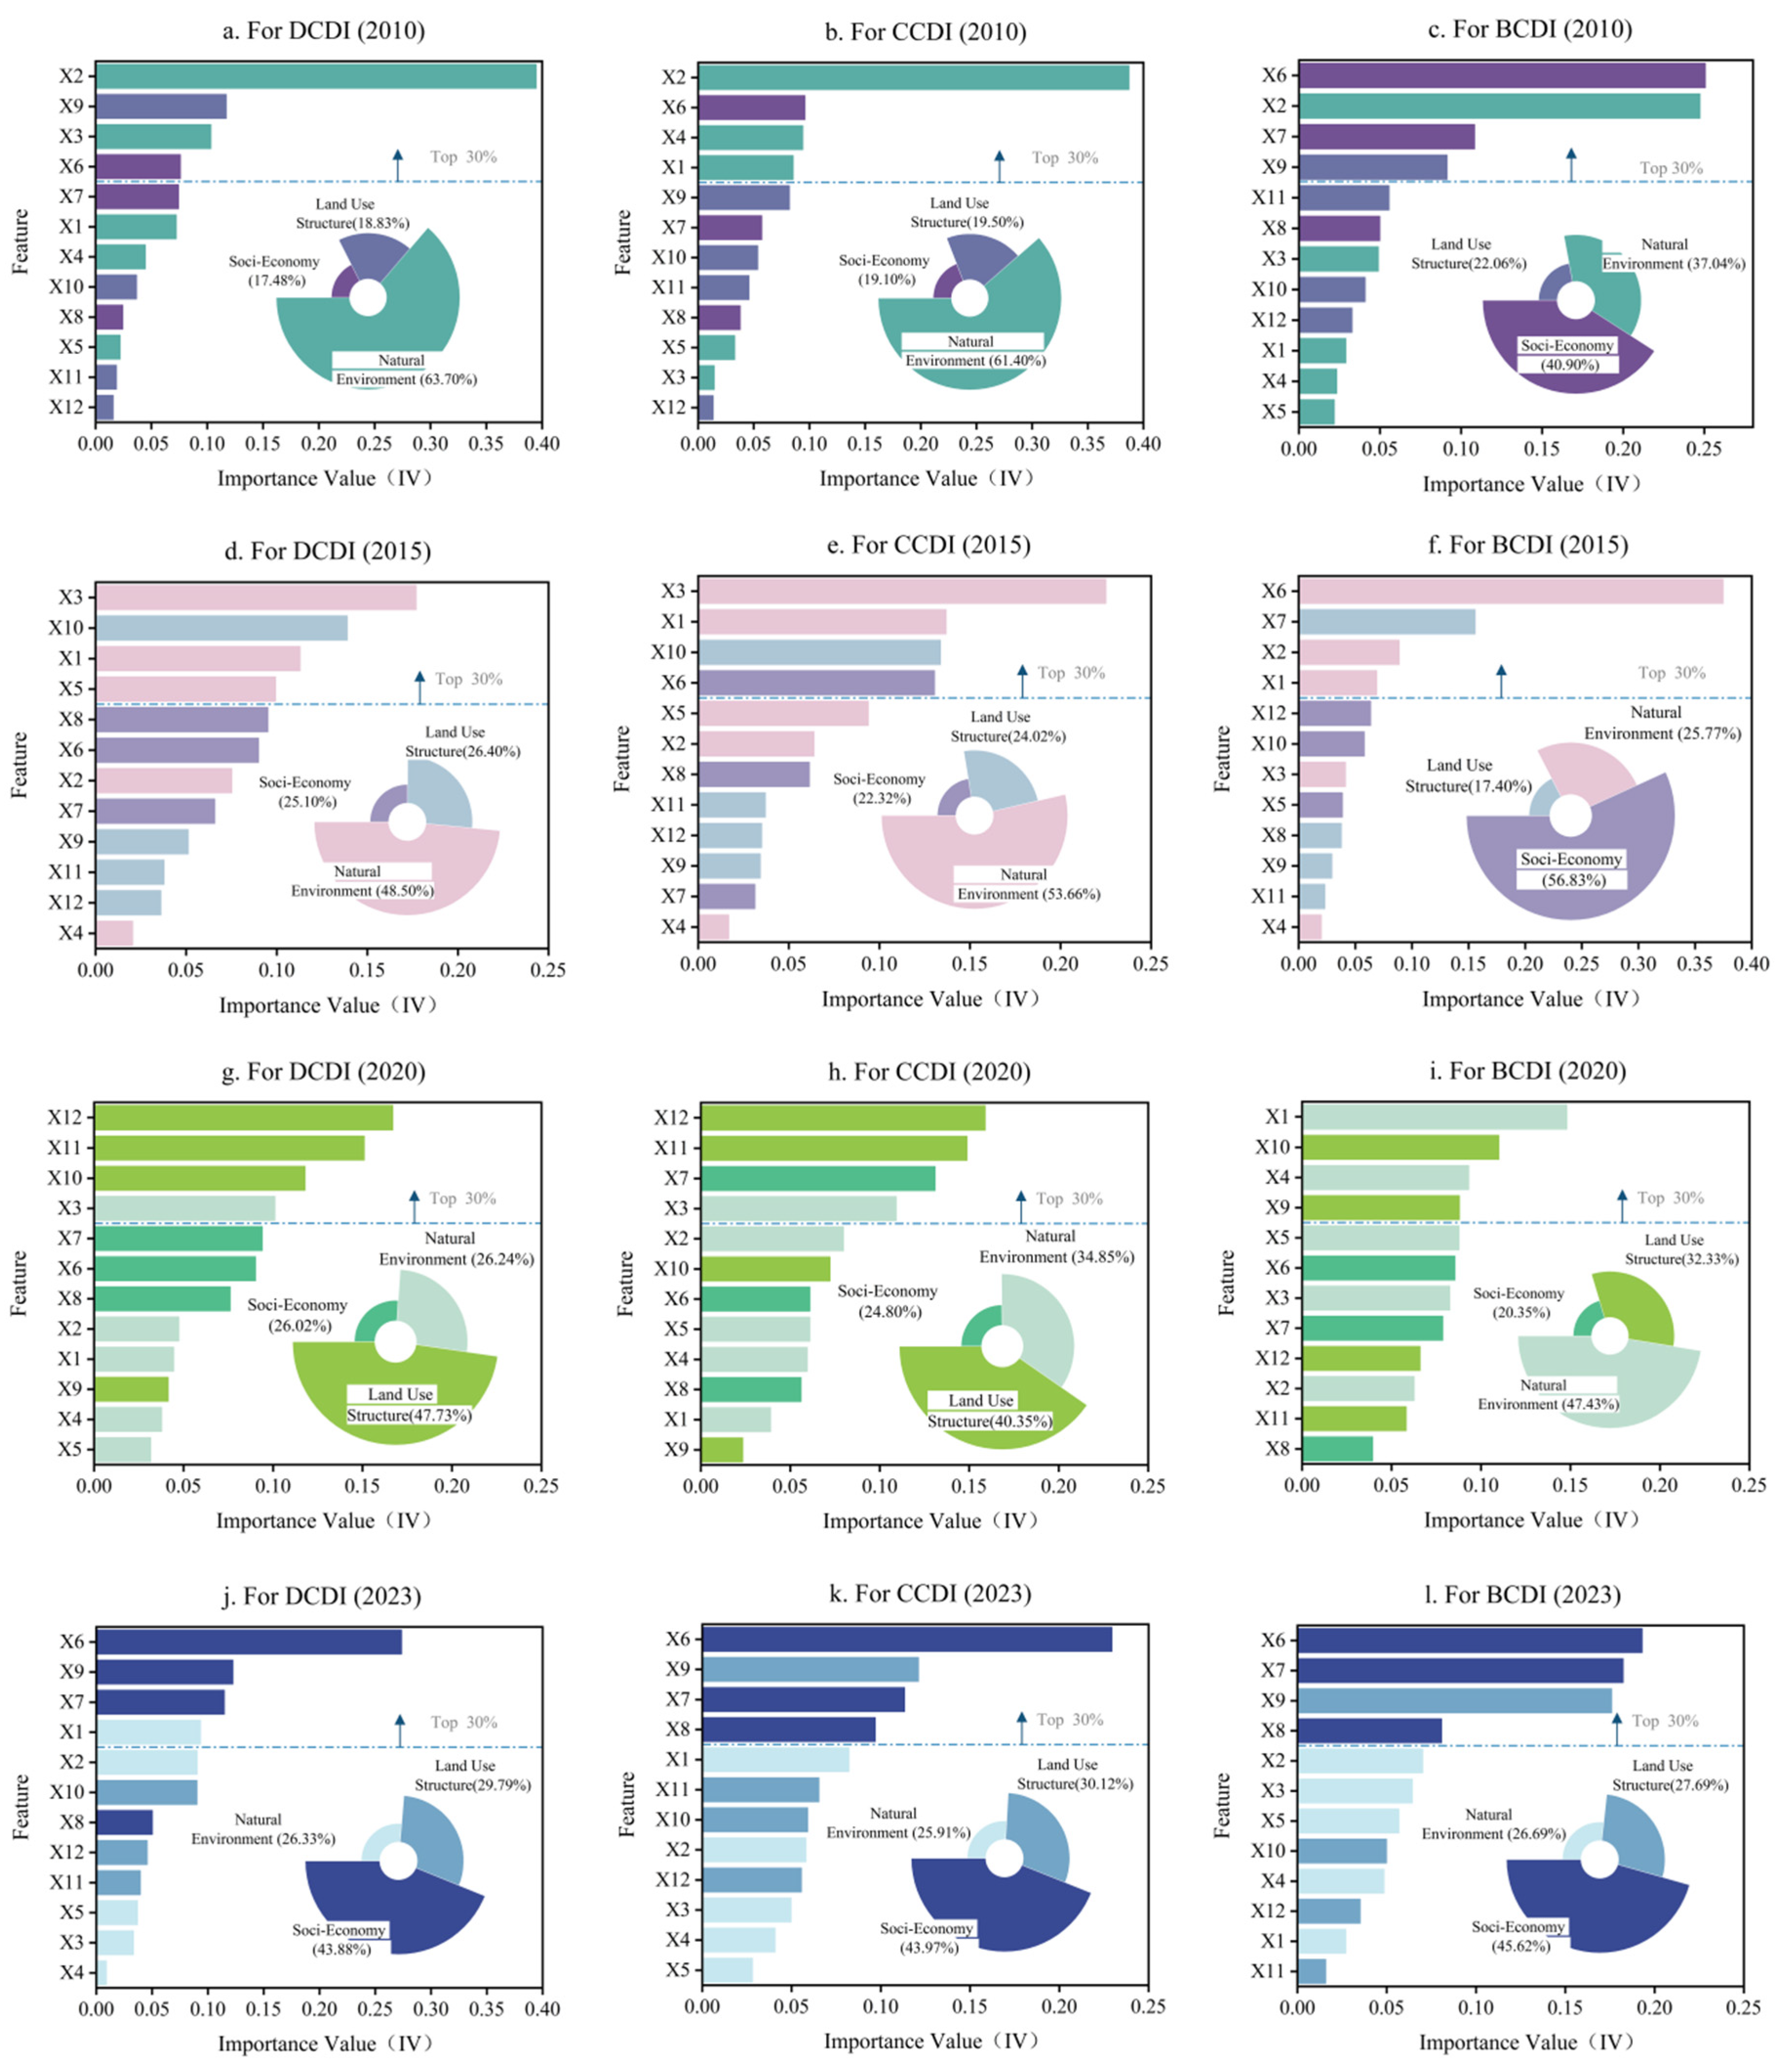
Figure 11.
Collaborative Path of Spatial Association Network.
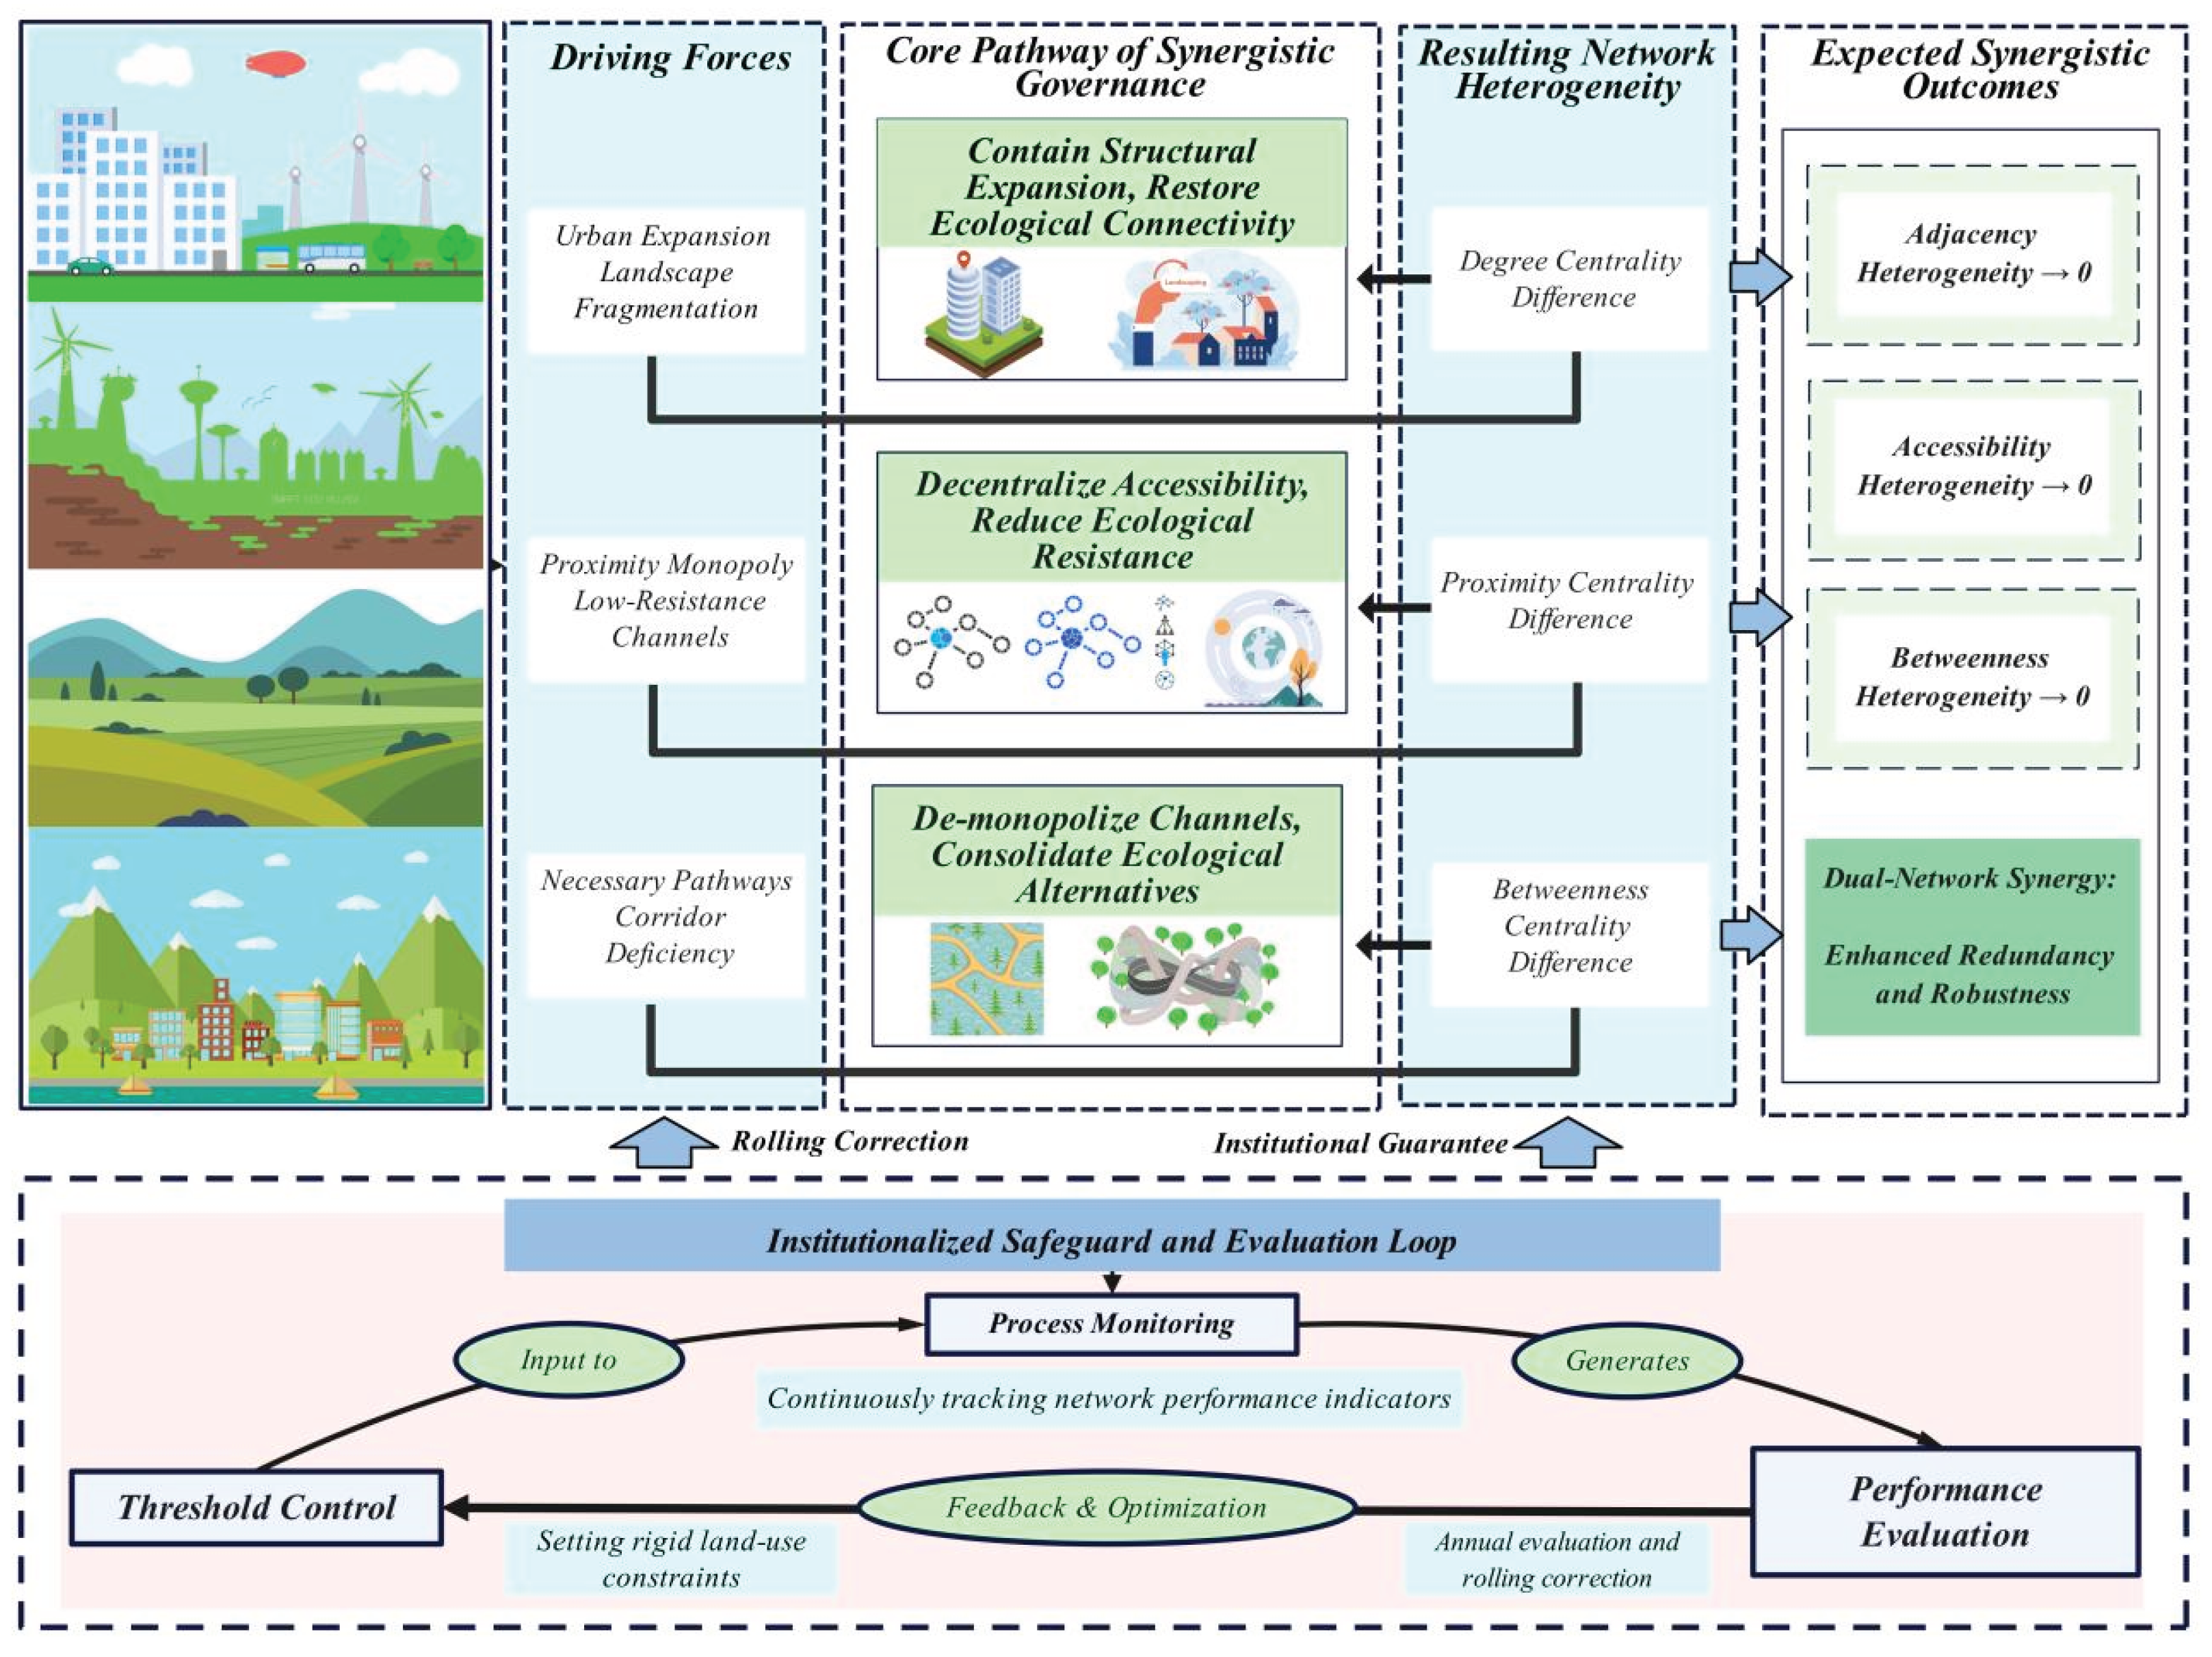

Table 1.
Data sources.
| Data Type | Sub-data | Year Range | Spatial Resolution | Data Source |
| Land Use Dataset | Land Use | 2010-2023 | 30m | Resource and Environmental Science Data Center, Chinese Academy of Sciences ( http://www.resdc.cn) |
| Auxiliary Geographic Dataset | Precipitation, Temperature, Evapotranspiration | 2010-2023 | 1000m | National Meteorological Information Center ( http://data.cma.cn) |
| DEM, Slope | 2010-2023 | 30m | Geospatial Data Cloud ( https://www.gsclound.cn) | |
| Soil Data | 2010-2023 | 1000m | FAO Soils Portal ( https://www.fao.org/soils-portal/) | |
| Soil Erosion Factor Data | 2010-2023 | 1000m | World Data Bank ( https://www.scidb.cn) | |
| Root Limitation Depth Data | 2010-2023 | 1000m | ISRIC World Soil Information Service ( https://www.isric.org/) | |
| Panel Dataset | Population, GDP, Urbanization Rate | 2010-2023 | / | Hunan Statistical Yearbook. (http://tij.hunan.gov.cn) |
| Energy Data | 2010-2023 | / |
Table 2.
Land Use Carbon Emission Coefficient.
| Land Use Type | Carbon Emission Coefficient (kg/hm2·a) | Carbon Effect |
| Cultivated Land | 0.4971 | Carbon Source |
| Forest Land | -0.5812 | Carbon Sink |
| Grassland | -0.0205 | Carbon Sink |
| Water Bodies | -0.0255 | Carbon Sink |
| Unused Land | -0.0005 | Carbon Sink |
Table 3.
Energy Carbon Emission Coefficient.
| Energy Type | Coal | Coke | Crude Oil | Gasoline | Kerosene | Diesel | Fuel Oil | Natural Gas | Electricity |
| Standard Coal Conversion Factor (tce·t-1) | 0.7143 | 0.9714 | 1.4286 | 1.4714 | 1.4714 | 1.4571 | 1.4286 | 1.2143 | 0.4040 |
| Carbon Emission Coefficient (t·tce-1) | 0.7559 | 0.8550 | 0.5857 | 0.5538 | 0.5714 | 0.5921 | 0.6185 | 0.4483 | 0.7935 |
Table 4.
Quantification Methods for ES Types.
| Service Type | Indicator | Assessment Method | Formula |
| Regulating Services | Carbon Storage | InVEST Model - Carbon storage and sequestration module |
In the formula, C represents the annual total carbon storage; Cabove represents aboveground biomass carbon; Cbelow represents belowground biomass carbon; Csoil represents soil carbon; Cdead represents carbon content in dead material. |
| Soil Conservation | InVEST Model - Sediment delivery ratio module |
In the formula, SD represents the annual total soil conservation; RKLS represents potential soil erosion; USLE represents actual soil erosion; R represents rainfall erosivity factor; K represents soil erodibility factor; LS represents slope length and steepness factor; C represents vegetation cover and management factor; P represents soil conservation measure factor. All calculations are based on pixel units. |
|
| Provisioning Services | Water Yield | InVEST Model - Annual water yield module |
In the formula, Y(x) represents the total annual water yield for the raster x;AET(x) represents the actual evapotranspiration for the raster x; P(x) represents the annual precipitation for the raster x. All calculations are based on pixel units. |
| Supporting Services | Habitat Quality | InVEST Model - Habitat quality module |
In the formula, Dxj represents the environmental stress index of the grid x in the land use type j; R represents the number of threat factors; Yr represents the number of grids for the threat factors r; wr represents the weight of threat factors r; ry represents the stress value for the raster unit y; irxy represents the influence value of the grid unit y on the land use unit x; βx represents the accessibility level of the threat factors for the raster unit x; Sjr represents the susceptibility of the environmental factor of the land use type j to the stressor r at the grid unit level; Qxj represents the environmental stress index for the land use type j in the grid unit x; Hj represents the environmental suitability index of the land use type j; z represents a unified value; commonly taken as 2.5 in this study; K represents a constant parameter, commonly taken as 0.5 in this study. |
Table 5.
Average Value of the Spatial Association Network Heterogeneity Index.
| Indicator | Year | |||
| 2010 | 2015 | 2020 | 2023 | |
| DCDI | 0.3944 | 0.5851 | 0.3956 | -0,0682 |
| CCDI | 0.0749 | 0.1021 | 0.0281 | -0.3071 |
| BCDI | 0.1871 | 0.4742 | 0.3429 | -0.3338 |
Table 6.
Indicator System and Model Variables.
| Primary Indicator | Secondary Indicator | Unit | Model Variable | Attribute |
| Natural Environment | Temperature | °C | X1 | Affects vegetation carbon absorption and emission intensity, altering network connections. |
| Average Annual Precipitation | mm | X2 | Determines moisture conditions, influencing the supply pattern of ecosystem services. | |
| Evapotranspiration | mm | X3 | Reflects water-heat conditions, constraining differences in carbon sequestration and service supply. | |
| Elevation | m | X4 | Affects land use distribution, causing differences in carbon emissions and service supply. | |
| Slope | ° | X5 | Restricts construction and cultivation, regulating spatial patterns of carbon emissions and services. | |
| Socio-Economic | GDP per capita | ten thousand yuan / person | X6 | Economic level drives carbon emission intensity and affects service demand. |
| Urbanization Rate | % | X7 | Urban expansion increases carbon emissions, disturbing the ecological service network. | |
| Population Density | / | X8 | Population concentration intensifies conflicts between carbon emissions and service supply and demand. | |
| Land Use Structure | Proportion of Arable Land | % | X9 | Determines the spatial pattern of carbon emissions and food supply. |
| Forest Cover | % | X10 | Core carbon sequestration area, enhancing service supply and spatial connectivity. | |
| Proportion of Construction Land | % | X11 | Expansion increases emissions, weakening the balance of ecological services. | |
| Landscape Fragmentation Index | / | X12 | Damages ecological connectivity, increasing network heterogeneity. |
Disclaimer/Publisher’s Note: The statements, opinions and data contained in all publications are solely those of the individual author(s) and contributor(s) and not of MDPI and/or the editor(s). MDPI and/or the editor(s) disclaim responsibility for any injury to people or property resulting from any ideas, methods, instructions or products referred to in the content. |
© 2025 by the authors. Licensee MDPI, Basel, Switzerland. This article is an open access article distributed under the terms and conditions of the Creative Commons Attribution (CC BY) license (http://creativecommons.org/licenses/by/4.0/).
Copyright: This open access article is published under a Creative Commons CC BY 4.0 license, which permit the free download, distribution, and reuse, provided that the author and preprint are cited in any reuse.


