Submitted:
14 June 2025
Posted:
16 June 2025
You are already at the latest version
Abstract
Background/objectives: Overweight increases the predisposition to obesity and type 2 diabetes (T2D), which significantly elevate stroke risk and the likelihood of severe post-stroke disability. However, since overweight itself is not a disease, interventions to prevent its progression to obesity/T2D comprise predominantly generic lifestyle recommendations that often lack long-term adherence. Dietary nitrate (NO) supplementation can mitigate obesity and metabolic impairments, making it a promising, non-pharmacological approach to halt overweight from progressing into obesity/T2D, thereby potentially also improving stroke outcome.
We determined whether NO- supplementation prevents overweight from progressing into obesity and T2D and whether this intervention improves stroke outcome.
Methods: Overweight was induced via 6 weeks of high-fat diet (HFD), after which animals were randomized to either HFD or HFD and NO-supplementation. After 24 weeks, when HFD-mice without NO developed obesity and T2D, all animals were subjected to transient middle cerebral artery occlusion and stroke outcome was assessed via behavioral testing and infarct size. The effect of NO on post-stroke neuroinflammation, neurogenesis, and neovascularization was analyzed by immunohistochemistry.
Results: Sustained NO-supplementation in overweight mice did not prevent obesity or insulin resistance. However, it attenuated weight gain, prevented hyperglycemia and significantly improved functional recovery after stroke, without affecting infarct size. Moreover, NO decreased post-stroke neuroinflammation, but did not affect stroke-induced neurogenesis or vascularization.
Conclusion: These results highlight the potential of NO-supplementation to prevent metabolic impairment in the overweight population and improve stroke prognosis in this large group of people at risk of stroke and severe stroke sequelae.
Keywords:
Stroke
; Obesity
; Diabetes
; Nitrate
; Overweight
1. Introduction
The worldwide epidemic of obesity has dramatically increased the incidence of metabolic syndrome, type 2 diabetes (T2D) and related cardiovascular complications [1,2,3,4]. One of the major debilitating consequences of this is stroke, which is a major cause of adult disability worldwide [5,6]. Therefore, there is a large global medical need to reduce obesity and T2D, to consequently also reduce stroke risk and poor stroke outcome.
Weight loss has proven effective in reducing the risk for cardiovascular disease in the obese population, primarily via its effective prevention of weight-related co-morbidities such as T2D [7,8,9,10]. In recent years, effective pharmacological strategies, such as high-dose glucose-like peptide (GLP) 1 receptor agonists and dual GLP1R/glucose-dependent insulinotropic polypeptide (GIP) agonists, have been approved for weight loss [11,12,13]. However, current clinical guidelines only recommend the use of these drugs in individuals with obesity or with overweight and a diagnosed co-morbidity. Since most people with overweight have not yet developed weight-related co-morbidities [14,15], this leaves a large population at increased risk for stroke and poor stroke outcome with very limited options for intervention. Indeed, the only available strategy for these people are lifestyle changes (i.e. diet and exercise) that often face major problems with adherence, since they require considerable changes in habits and consequently most people revert to their old, unhealthy lifestyle [16,17]. In summary, sustainable efficacious interventions specifically targeting the overweight population in the preventive perspective to halt obesity/T2D and reduce stroke risk and stroke-induced disability are lacking.
Dietary nitrate (NO3-) is a novel strategy that effectively slows weight gain in obesity and T2D [18,19,20,21], making it a promising, non-pharmacological approach to evade obesity and T2D in the overweight population, thereby potentially also reducing stroke risk and persistent post-stroke disability. Upon ingestion, NO3- is metabolized via the nitrate-nitrite-NO pathway, which elicits a range of beneficial effects, such as improved insulin sensitivity and endothelial function, enhanced mitochondrial efficiency, and reduced oxidative stress, underscoring its multifaceted role in metabolic health [22,23]. Moreover, NO3- also exerts direct beneficial effects on brain vascular health [24,25,26] and improves stroke outcome in metabolically healthy rodents [27,28,29]. However, whether halting obesity and metabolic impairments by dietary NO3- in overweight improves stroke outcome has not yet been investigated.
Therefore, the aim of this study was to determine whether prolonged NO3- supplementation prevents the progression of overweight into obesity and T2D and consequently improves stroke outcome in a clinically relevant murine model. Moreover, the effects of prolonged NO3- supplementation on post-stroke neuroinflammation, neurogenesis and neovascularization were assessed.
2. Materials and Methods
2.1. Animals
Twenty C57BL/6JRj mice (Janvier Labs, France) were used in this study. Mice were housed in environmentally controlled conditions (22 ± 0.5 °C, 12/12 h light/dark cycle with ad libitum access to food and water). The mice were kept under pathogen free conditions in type III size individually ventilated cages with wood chip bedding and nest material.
This study was conducted according to the guidelines of the declaration of Helsinki and has been approved by the regional ethics committee of Karolinska Institutet (approval ID: 19666-2022). The work follows the 2010/63/EU directive and is reported according to the ARRIVE guidelines.
2.2. Sample Size Calculation
Group sizes were determined based on ≈ 20% effect size between groups in functional recovery after stroke, with α = 0.05 and a statistical power of 90%. The standard deviation (SD) used in sample size calculation was obtained from pilot experiments. Based on this analysis a minimum final sample size of n = 5 was determined. Taking into consideration the success rate of stroke surgery, mortality rate and likelihood of statistical outliers, the final sample size per group was set at n =10.
2.3. Experimental Design
Starting at 4 weeks of age, mice were exposed to high-fat diet (HFD; 60% energy from fat). Animals developed overweight after 6 weeks of HFD (defined as 15-25% weight gain compared to lean, age-matched mice). Thereafter, they were randomized in two groups: HFD and 10 mM/day NaNO3- (NO3-, n = 10) in drinking water and HFD and regular water (HFD, n = 10). Body weight and fasting glucose were monitored every 4 weeks until the HFD group developed obesity (defined as >50% weight gain compared to lean, age-matched mice) and hyperglycemia (defined as fasting glucose > 7 mmol/L). Then, insulin resistance was assessed via an insulin and glucose tolerance test, confirming the development of obesity and diabetes in the HFD group after 24 weeks of HFD. Then, mice were subjected to transient middle cerebral artery occlusion (tMCAO) to induce stroke, and functional recovery was tracked using the grip strength test (see below). An overview of the experimental design can be found in Figure 1.
2.4. Metabolic Assessments
2.4.1. Fasting Glycemia
Fasting glycemia was measured every 4 weeks during NO3- -supplementation via a tail tip puncture and a glucometer after overnight (ON) fasting.
2.4.2. Insulin Tolerance Test (ITT)
ITT was performed after 24 weeks of NO3- -supplementation. Briefly, mice were fasted for 2h and baseline glycemia was measured via tail tip puncture and a glucometer. Then, animals were injected with 0.5U/kg human insulin intra-peritoneally (i.p.) and glycemia was checked at 15, 30, 45, 60, 75, and 90 min after injection. Percentage of baseline glycemia was calculated and area under the curve was used for statistical analysis.
2.4.3. Glucose Tolerance Test (GTT)
GTT was performed after 24 weeks of NO3- -supplementation. Briefly, mice were fasted ON. Then, baseline glycemia was measured and mice were injected i.p. with 1 g/kg glucose. Glycemia was monitored at 15, 30, 60, 90, and 120 min after injection. Percentage change from baseline glycemia was calculated and area under the curve was used for statistical analysis.
2.5. Transient Middle Cerebral Artery Occlusion
Stroke was induced by tMCAO using the intraluminal filament technique as described previously [30,31]. Briefly, mice were anesthetized by inhalation of 3% isoflurane and throughout surgery, anesthesia was maintained by 1.5% isoflurane. Using a heated pad with feedback from a thermometer, body temperature of animals was kept at 37–38 °C. Left external (ECA) and internal (ICA) carotid arteries were exposed and a 7–0 silicone-coated monofilament (total diameter 0.17–0.18 mm) was inserted into the ICA until the origin of the MCA was blocked. The occluding filament was removed after 35 min. Cerebral blood flow in the vicinity of MCA was monitored by Laser Doppler Blood Flow Monitor (Moor Instruments Ltd, UK), and no differences between the groups were observed (data not shown). Stroke induction was considered unsuccessful when the occluding filament could not be advanced within the internal carotid artery beyond 7–8 mm from the carotid bifurcation, or if mice lacked symptoms of neurological impairment based on the neurological severity score [32]. After surgery, all mice were given an analgesic (Carprofen, 5 mg/kg) and soft food. After tMCAO, all mice were switched to normal chow, to mimic the clinical setting of a post-stroke balanced diet. 2 mice in the HFD-group and 1 mouse in the NO3- group were euthanized shortly after surgery because the humane endpoint was reached (HFD n = 8, NO3- n = 9).
2.6. Behavioral Assessment
To assess functional recovery after stroke, forelimb grip strength was tested as previously described [31,33]. Briefly, mice were held firmly by the body and allowed to grasp the grid with the paretic (right) forepaw. Hereafter, they were dragged backwards until their grip was broken. Grip strength was measured using a grip strength meter (Harvard apparatus, MA, USA) at 3 days and 1-2 weeks after tMCAO. Ten trials were performed by an experimenter blinded to groups, and the average of the two highest values was used for statistical analysis.
2.7. Tissue Collection
After a 4h fast, animals were anesthetized using an overdose of sodium pentobarbital. Hereafter, cardiac puncture was performed to collect blood, and then mice were perfused transcardially using PBS followed by a 4% ice-cold paraformaldehyde (PFA) solution. Brains were harvested and stored ON in 4% PFA at 4°C. After 24h of PFA-fixation, brains were transferred to a solution of PBS and 25% sucrose and stored at 4°C until they sank. Then, 30-μm thick coronal sections were cut using a sliding microtome, and sections were stored at -20°C in anti-freeze solution until further analysis.
2.8. Immunohistochemistry (IHC)
To stain brain-sections, the free-floating staining method was used. Briefly, sections were washed in PBS to remove anti-freeze solution. Sections were then incubated in a solution of 3% H2O2, 10% MeOH and PBS, for visualization with 3′-3 diaminobenzidine (DAB). For immunofluorescent staining with Ki67 and double-cortin (DCX), sections were then incubated 15 minutes in citric acid (pH = 6.0) at 95°C for antigen retrieval. For immunofluorescent staining with aminopeptidase N (CD13), podocalyxin (PDXL), a blocking step was performed with a 1h incubation in PBS supplemented with 0.25% Triton-X-100 and 5% serum at room temperature (RT). Hereafter, sections were incubated ON at 4°C in a PBS solution supplemented with primary antibody, 3-5% serum and 0.25% Triton-X-100. For NeuN, sections were incubated in primary antibody solution for 48h. The following primary antibodies were used: NeuN (1:500; RRID:AB_2298772), Ki67 (1:300; RRID:AB_443209), DCX (1:200; RRID:AB_10610966), Iba1 (1:1000; RRID:AB_2220422), CD206 (1:200; RRID:AB_2063012), CD68 (1:2000, RRID:AB_10975465), PDXL (1:200; RRID:AB_354858), CD13 (1:200; RRID:AB_323691). After incubation with primary antibody, sections were washed and incubated with secondary antibody solution consisting of PBS supplemented with secondary antibody, 3-5% serum and 0.25% Triton-X-100 for 2h at RT. The following secondary antibodies were used: biotinylated horse anti-mouse (1:200; RRID:AB_2313581), biotinylated horse anti-goat (1:200; RRID:AB_2336123), Alexa-488 conjugated horse anti-rabbit (1:200; RRID:AB_2336403), Alexa-594 conjugated horse anti-mouse (1:200; RRID:AB_2336412), Alexa-594 conjugated donkey anti-goat (1:500; RRID:AB_2340432), Cy5 conjugated donkey anti-rat (1:500; RRID:AB_2340671). A 1h incubation with avidin-biotin complex was next performed for the stainings for DAB-visualization according to manufacturer’s instructions (Vectastain Elite ABC kit, Vector Laboratories), followed by DAB-visualization. All quantifications of IHC-stainings were performed by experimenters blinded for groups.
2.9. Analysis
2.9.1. Quantification of Infarct Size
NeuN-labelled sections were displayed on a computer monitor using a 1.25x lens. Infarct size was determined using all serial sections containing visual ischemic damage. The volume of the contralateral, non-injured hemisphere and of the intact portion of the ipsilateral, injured hemisphere was measured using the Cavalieri Estimator probe (StereoInvestigator, MBF Bioscience) [34]. Then, the infarct size was calculated by subtracting the ipsilateral volume from the contralateral volume, to adjust for stroke-induced tissue shrinkage. Animals with extensive cortical damage (3 animals in the NO3- group) were excluded for analysis.
2.9.2. Quantification of Stroke-Induced Neural Stem Cell Proliferation (Ki67) and Early Neurogenesis (DCX)
Animals with extensive cortical damage (3 animals in the NO3- group) were excluded from these analyses. Manual counting of Ki67 in the subventricular zone (SVZ) and of DCX in striatum was performed as described previously [35]. Briefly, three coronal sections were manually counted using the Olympus BX40 microscope. The first section was selected based on its anatomical location along the rostral-caudal axis (approximately 1 mm from the Bregma). The second and third sections were 300 and 600 μm caudal from the first section. The number of Ki67+ cells in the SVZ and of DCX+ cells in striatum was manually counted in all three sections using a dry 40x lens. All counts were performed by experimenters blinded to the treatment groups. The sum of the counts in all three sections was used for statistical analysis.
2.9.3. Quantification of Neuroinflammation
The Fiji open-source software [36] was used to evaluate Iba1 immunoreactivity as described previously [35]. Animals with extensive cortical damage (3 animals in the NO3- group) were excluded from these analyses. Briefly, three coronal sections were included in the analysis. The first section was selected based on its anatomical location along the rostral-caudal axis (approximately 1 mm from the Bregma). The second and third sections were 300 and 600 μm caudal from the first section. Images of Iba-1 staining in striatum were acquired at 20x using the Olympus BX40 microscope. For each contralateral, undamaged hemisphere, 1 representative image of each section was acquired. For the ipsilateral, injured hemisphere, 3 images per section spanning > 90% of the whole striatum were acquired, accounting for 9 images in total for each animal. Then, images were converted into grayscale (8-bit) mode and a threshold was determined based on the lowest Iba-1 immunoreactivity in the contralateral striatum of the HFD group. The Iba-1+ area was then measured and expressed as a percentage of the total area that was analyzed.
The number of CD68+ cells in ipsilateral striatum and CD206+ cells in the peri-infarct area was counted manually in three coronal sections. Animals with extensive cortical damage (3 animals in the NO3- group) were excluded from these analyses. The first section was selected based on its anatomical location along the rostral-caudal axis (approximately 1 mm from the Bregma). The second and third sections were 300 and 600 μm caudal from the first section. For CD68+ quantification, positive cells were counted manually in the ipsilateral striatum using a 60x dry lens. The sum of the counts in 3 sections was used for statistical analysis. For the quantification of CD206 in the peri-infarct area, first the area of interest was delineated at 4x magnification and subsequently, cells were manually quantified using a 60x dry lens in the delineated area. Then, the number of positive cells per area was calculated and used for statistical analysis.
2.9.4. Quantification of Neovascularization
Animals with extensive cortical damage (3 animals in the NO3- group) were excluded from these analyses. Neovascularization was quantified using the open-source software Fiji [36]. Confocal images were acquired with a Leica DMi8 confocal microscope. For each animal, one brain section was selected, and one to two images were captured per section at 20× magnification in the peri-infarct area. This region was identified by comparing the immunofluorescence signal to previously acquired reference images showing the ischemic core based on NeuN staining. Image dimensions were 775 μm × 775 μm, with a z-stack depth of 10 μm and a step size of 0.5 μm. The same acquisition settings were used for all images. Vascular parameters were quantified on maximum intensity projections of thresholded images using Fiji’s area fraction measurement tool. The area density was expressed as the percentage of PDXL and CD13 of the total image area. Pericyte coverage was calculated by measuring the area of colocalized CD13 and PDXL signals and normalizing it to the total PDXL-positive area within the same image.
For vessel length quantification, maximum projected images were thresholded and skeletonized. The resulting skeletons were analyzed using the AnalyzeSkeleton plugin [37], as previously described [38]. To measure vascular diameter, we adapted the Vessel Analysis plugin [39,40]. Briefly, following maximum projection and thresholding, a Euclidean distance map was generated to indicate the distance of each pixel to the nearest background pixel. Simultaneously, skeletonized versions of the images were created. Multiplication of the distance map with the skeletonized images produced skeletons containing vessel thickness information, from which the average vessel diameter was calculated. All image analyses were scripted and automated using the ImageJ Macro language to minimize human error and bias. Macro scripts are publicly available at: https://github.com/carbui/image-analysis/.
2.10. Statistical Analysis
GraphPad prism version 10 (10.2.3 (347)) was used for statistical analysis. Data was checked for statistical outliers using the ROUT method, and for normality using the Shapiro-Wilk test. For body weight, weight change, fasting glucose and grip over time, repeated measures two-way ANOVA with two-stage linear set-up procedure of Benjamini, Krieger and Yekutieli was used. For AUC of ITT, GTT, and grip, fasting glucose, stroke volume, and CD68 quantification, unpaired t-test was used. For Ki67, DCX, Iba1, CD206, PDXL, CD13, CD13/PDXL ratio, vessel length and vessel diameter ordinary two-way ANOVA, with uncorrected Fisher’s LSD was used. All data are expressed as mean ± SD and results were considered significant when p < 0.05.
3. Results
3.1. Sustained NO3- Supplementation in Overweight Mice Attenuates the Development of Obesity and Hyperglycemia and Improves Stroke Recovery
Six weeks of HFD-feeding induced overweight compared to age-matched controls fed a standard diet (Suppl. Figure 1). Although NO3- supplementation did not prevent the development of obesity (Figure 2A), a 15% attenuation in weight gain was observed in the NO3- group (Figure 2B). Importantly, HFD-mice developed hyperglycemia during the duration of the study, reaching fasting glycemia levels of 9 mmol/L after 24 weeks (Figure 2C). On the contrary, fasting glycemia remained significantly lower in NO3--treated mice and below the diabetic threshold of 7 mmol/L (Figure 2C). No differences between the groups were observed when performing insulin- (Figure 2D,E) and glucose tolerance tests (Figure 2F,G), indicating that long-term NO3- did not improve insulin sensitivity.
These results indicate that although long-term NO3- supplementation did not prevent the occurrence of insulin resistance and obesity in overweight mice, it prevented the occurrence of hyperglycemia and slightly reduced weight gain, even under continuous HFD-feeding.
After stroke, grip strength was significantly greater in the NO3- group compared to HFD mice (Figure 2H, I) despite no difference in stroke volume between groups (Figure 2J). In accordance with previous studies [31,35], all mice lost weight after tMCAO, with no differences in the degree of weight loss between groups (Figure 2K,L). This rapid post-stroke weight loss resulted in attenuated hyperglycemia in both groups at 2 weeks after stroke (Figure 2M).
Taken together, these data show that a long-term supplementation with NO3- significantly improves functional recovery after stroke without affecting stroke size. Moreover, our results indicate that this improved stroke recovery was associated with an attenuation of HFD-induced weight gain and with the prevention of hyperglycemia before stroke.
3.2. Improved Stroke Outcome in NO3- Mice Was Not Associated with Increased Stroke-Induced Early Neurogenesis
NO3- has been shown to increase adult neurogenesis [41]. Since stroke-induced neurogenesis has been associated with improved stroke recovery [42], we next assessed the effect of long-term NO3- supplementation on this cellular process. The number of Ki67+ cells in the SVZ was not different between groups, showing that stroke-induced neural stem cell proliferation was not altered by NO3- supplementation (Figure 3A). Moreover, the amount of DCX+ neuroblasts in the ipsilateral striatum was significantly higher compared to the contralateral striatum, in both groups (Figure 3B). However, the number of DCX+ cells was not different between groups (Figure 3B). These results show that improved recovery in the NO3- group was not associated with differences in stroke-induced early neurogenesis.
3.3. Improved Stroke Outcome in NO3- Mice Was Associated with Decreased Post-Stroke Inflammation
Neuroinflammation plays a critical role in stroke recovery but is dysregulated by T2D [43]. Therefore, we investigated whether NO3- impacted post-stroke neuroinflammation. We quantified Iba1 immunoreactivity in both the ipsi- and the contralateral hemisphere to assess microglial infiltration. In accordance with previous studies, we found significantly higher Iba1 expression in the ipsilateral compared to the contralateral hemisphere, although in the NO3- group this was only a trend (p = 0.08) (Figure 4A). Importantly, the amount of Iba1 in the ipsilateral hemisphere was significantly lower in the NO3- group compared to HFD (Figure 4A), indicating a dampened inflammatory response in NO3- treated mice.
Next, we characterized whether this post-stroke neuroinflammation resembled either a more proinflammatory M1-type, indicative of persistent inflammation, or a reparative M2-type response. To identify M2-type immune cells, we quantified the number of CD206+ cells, a widely recognized representative M2 microglial marker [44,45,46], in both the contralateral hemisphere and the peri-infarct area of the ipsilateral striatum. NO3- significantly increased the number of CD206+ cells in the peri-infarct area compared to contralateral striatum, whereas we found no difference between hemispheres in the HFD group (Figure 4B), indicating that in addition to a decreased infiltration of microglia, NO3- also induced an M2-type reparative immune response compared to HFD-controls, which has been shown beneficial for stroke recovery [47]. In contrast, there was no effect of NO3- on the number of CD68-expressing microglia in ipsilateral striatum, which are indicative of activated M1-type microglia (Figure 4C).
Taken together, these results indicate that sustained NO3- supplementation improves stroke outcome in association with reduced post-stroke neuroinflammation.
3.4. Improved Stroke Outcome in NO3- Mice Was Not Associated with Improved Post-Stroke Vascularization
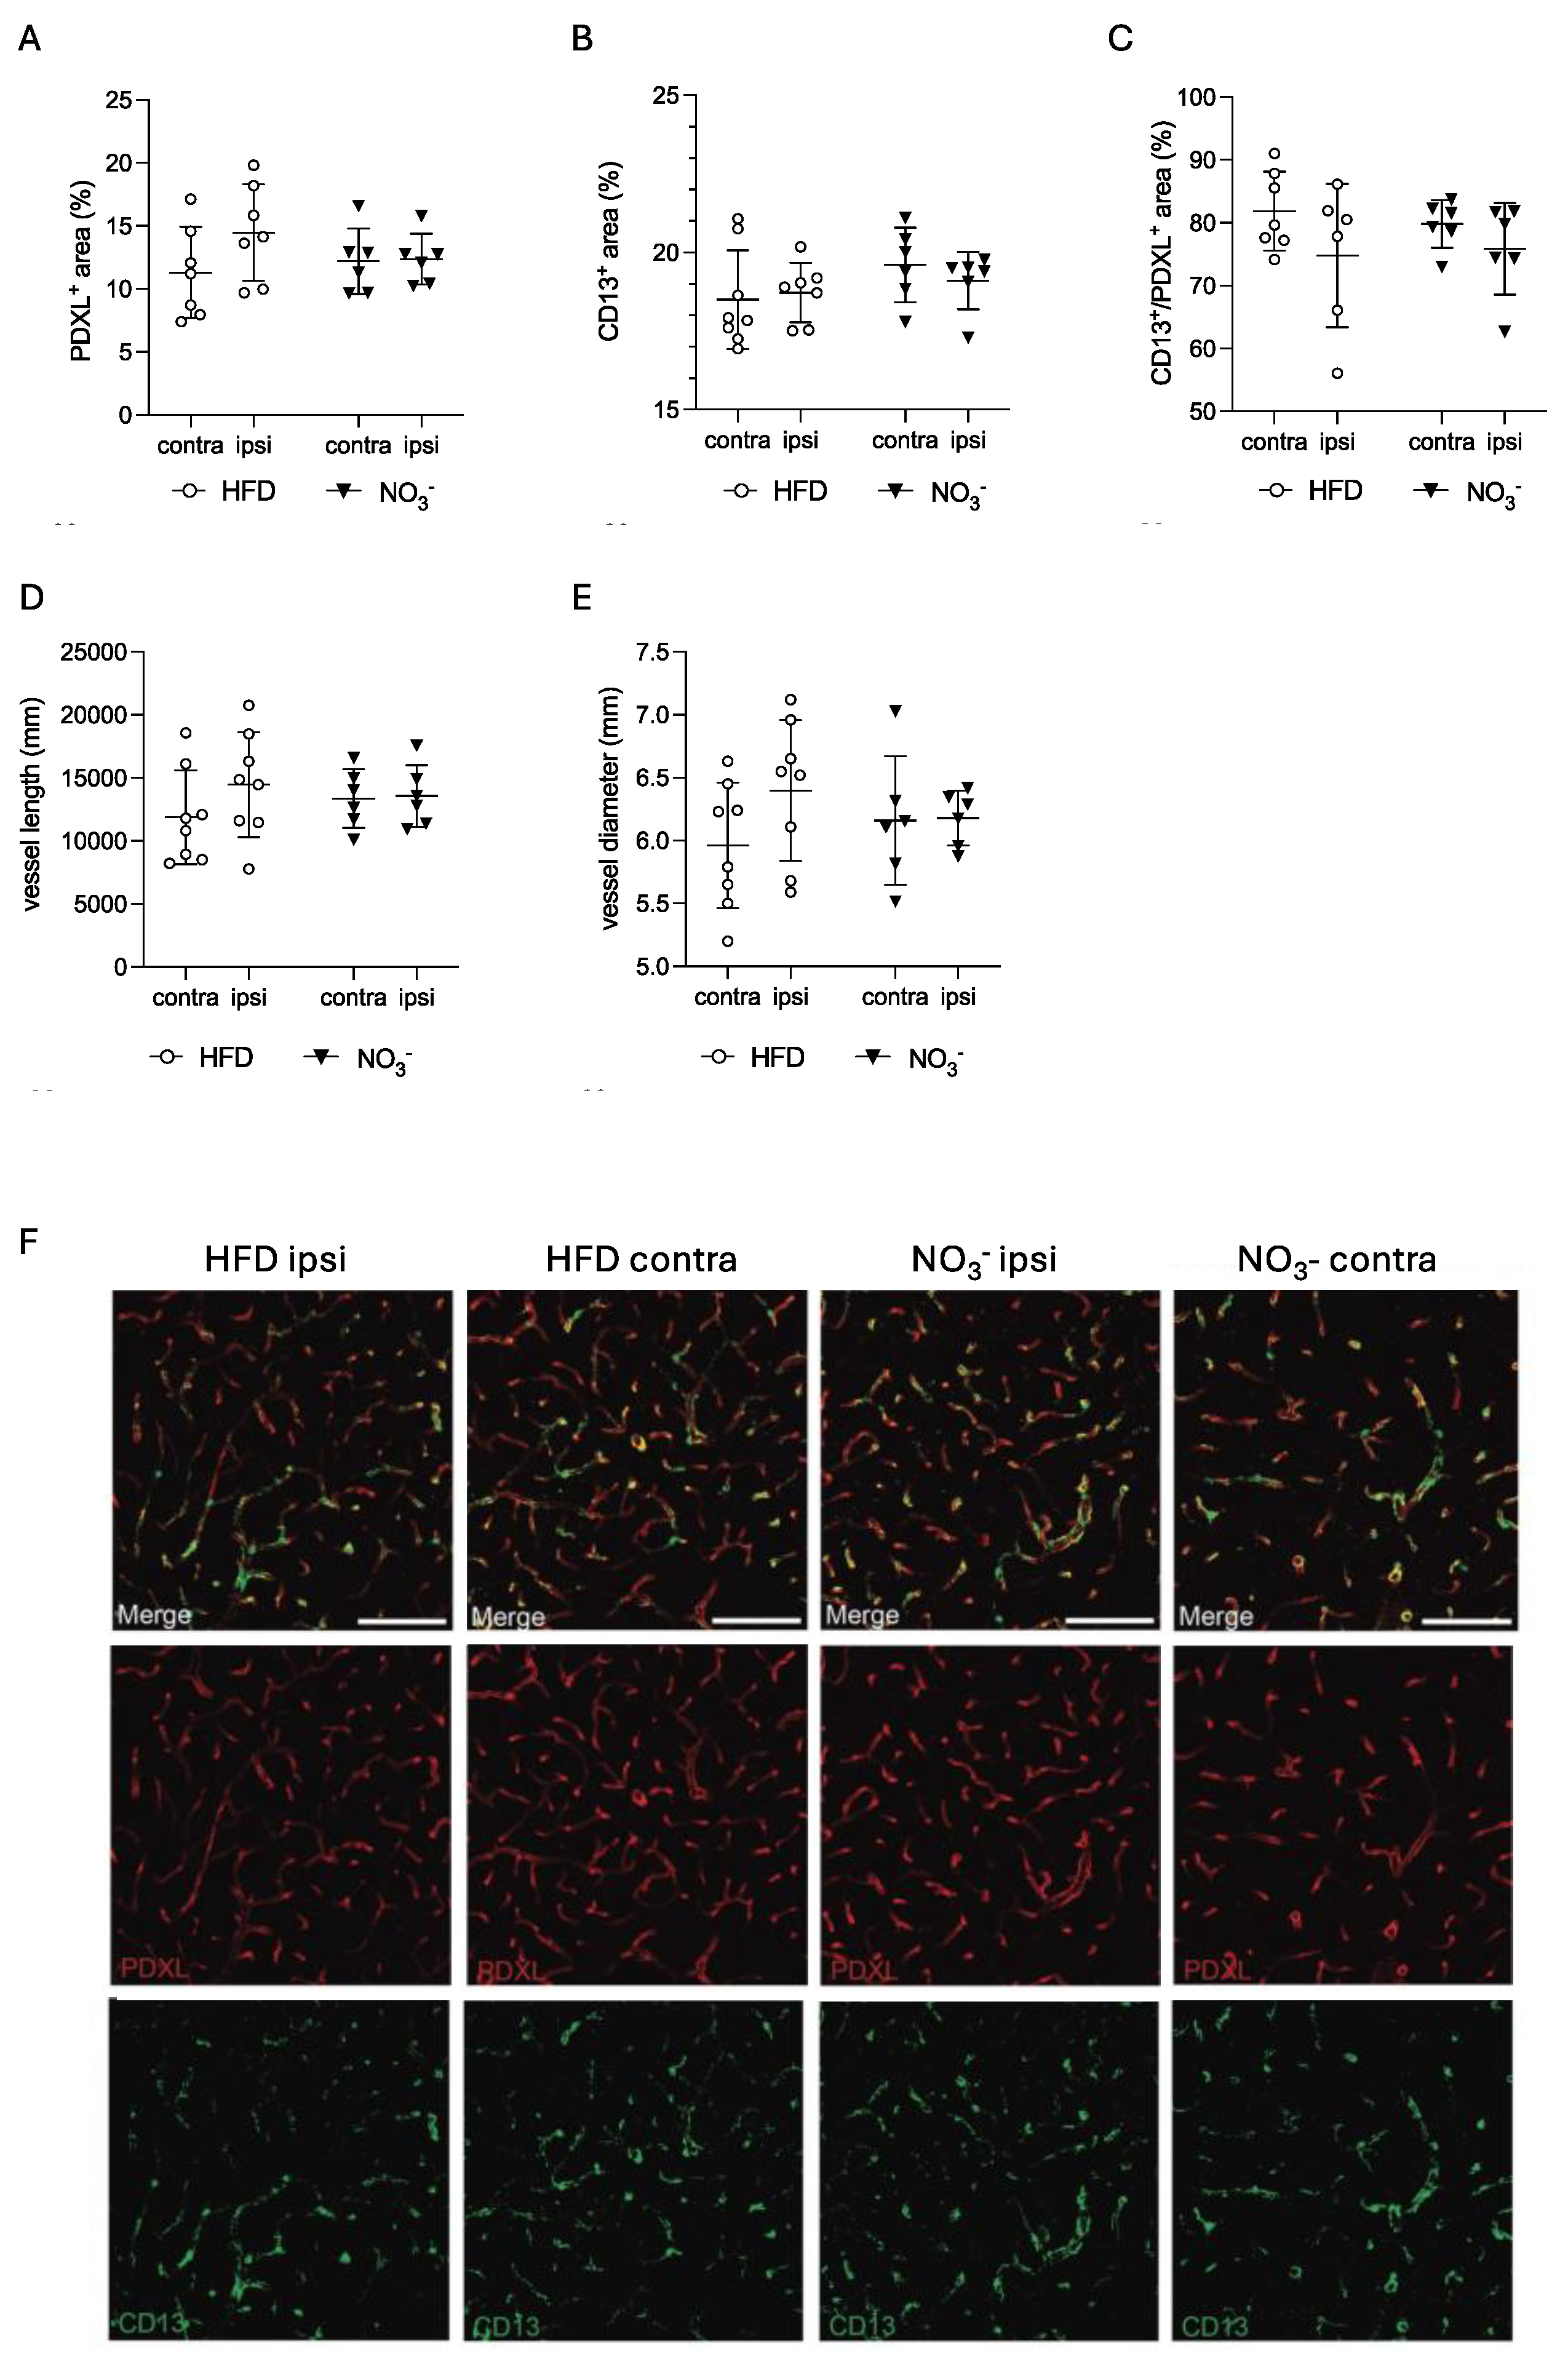
The beneficial effect of NO3- on vascularization is well-known [48,49,50]. Since post-stroke neovascularization plays an important role in stroke recovery, and diabetes hampers functional angiogenesis [51,52], we next assessed the effect of NO3- supplementation on post-stroke vascularization in the peri-infarct area. We found no difference between groups in PDXL staining density, indicating that NO3- did not alter the overall vessel area (Figure 5A). Moreover, there was no difference in the CD13+ area between groups (Figure 5B), nor in the ratio between CD13+/PDXL+ (Figure 5C), suggesting that NO3- did not alter the number of pericytes, or pericyte coverage of vessels after stroke. In addition, neither the total vessel length (Figure 5D) nor the average vessel diameter (Figure 5E) in the peri-infarct area was different between groups.
Taken together, these data indicate that NO3- supplementation did not affect post-stroke neovascularization.
4. Discussion
In this study, we showed that sustained NO3- supplementation in overweight mice attenuates weight gain, and prevents the occurrence of hyperglycemia, even during ongoing HFD-feeding. Importantly, these metabolic effects may contribute to enhanced functional recovery after stroke. Moreover, we showed that improved stroke recovery by NO3- was associated with reduced neuroinflammation, but not with improved post-stroke neovascularization or increased neurogenesis.
Overweight significantly increases the risk of stroke and worsens stroke outcome, predominantly by increasing the likelihood of obesity and T2D, both of which are known to raise the risk of stroke and severe post-stroke disability [53,54,55,56]. However, since overweight itself is not classified as a disease, pharmacological interventions are hard to justify in this group and current recommendations to halt the progression from overweight to obesity and T2D predominantly consist of generic lifestyle changes that often lack long-term adherence.
Dietary NO3- has been proven an effective and feasible non-pharmacological strategy to prevent obesity and metabolic complications [22,57,58]. In the current study, under continuous HFD-feeding, dietary NO3- did not prevent the occurrence of obesity in overweight mice. However, it did slow weight gain by 15% and significantly improved functional recovery after stroke. Interestingly, a 5-10% body weight reduction has proven sufficient to improve metabolic health in obesity [9,59,60] and decrease the risk of cardiovascular complications [61]. This suggests that even a modest effect in reducing weight gain as shown in this study could be important to improve stroke recovery. Moreover, the composition of HFDs used in murine studies, typically is more extreme than dietary patterns observed in humans with obesity [62,63,64]. Considering that NO3- is a dietary supplement and not a pharmacologically active drug, it is notable that even under concomitant exposure to an aggressive HFD, weight gain was still attenuated.
In the present study, NO3- did not prevent insulin resistance. Since insulin sensitivity closely correlates with weight gain, and both groups developed obesity after 24 weeks of HFD, this could explain the lack of difference in insulin sensitivity [65]. However, even though mice were insulin resistant, NO3- did prevent hyperglycemia entirely. Indeed, several studies show insulin-independent mechanisms by which dietary nitrate lowers glycemia, for instance through the stimulation of AMPK signaling and via enhancing of GLUT4 expression [66,67,68], thereby effectively enhancing glucose uptake and lowering glycemia. Given the well-established link between hyperglycemia and poor stroke outcome [69,70,71], it is conceivable that the improved stroke recovery by NO3- in our study was mainly mediated by the prevention of hyperglycemia.
In contrast to previous reports [28,29,72], we did not observe any acute neuroprotective effects of NO3- supplementation, as infarct size was not different between groups. NO3- was given in the drinking water, which limited control over its intake relative to the time of stroke induction. Given the relatively short half-life of NO3-, especially in mice [73], it is likely that we did not observe any neuroprotective effects simply because NO3- concentrations were insufficient at the time of stroke to mediate neuroprotection. Consequently, this suggests that the metabolic effects of NO3- before stroke likely were key contributors to the improved stroke recovery observed. How improved stroke recovery can be achieved in absence of changes in stroke volume remains unclear but may involve enhanced neuroplasticity during the recovery phase [74,75].
In the present study, NO3- administration was initiated at the onset of overweight and continued through the post-stroke period. While this experimental design reflects a clinically relevant scenario, it limits the ability to discern whether the improved stroke recovery observed with NO3- was due to pre-stroke, post-stroke, or combined effects. However, given the absence of differences in infarct size and post-stroke metabolism between groups, it is tempting to speculate that the beneficial pre-stroke effects of NO3- could have played a causal role in the improved recovery seen in the NO3- group. A follow-up study, restricting NO3- administration to the pre-stroke time frame would help clarify the specific metabolic mechanisms underlying this effect.
Neuroinflammation plays a crucial role in stroke outcome [76], and diabetes has been shown to exacerbate post-stroke neuroinflammation, thereby worsening stroke outcome [43]. In this study, we demonstrated that NO3- reduced microglial infiltration and promoted a shift to a more reparative M2-type inflammatory response, which has been associated with improved post-stroke recovery [47,77]. Indeed, microglia are key modulators of neuroplasticity, both under homeostatic conditions and in the post-stroke brain, when effective neuroplasticity is essential for the formation of new neuronal connections [78,79,80]. Our data suggests that the improved stroke recovery observed with NO3- supplementation may be mediated by enhanced neuroplasticity secondary to reduced neuroinflammation.
Post-stroke neovascularization is impaired in the context of T2D and is associated with poorer stroke recovery [52]. Nitrates, commonly used as vasodilators in the treatment and prevention of angina pectoris, have demonstrated various vascular benefits across differences diseases [48,49]. However, their role in post-stroke cerebral vascularization remains poorly understood. In our study, NO3- supplementation did not alter vascular parameters following stroke. Nevertheless, potential effects on the cerebral vasculature cannot be entirely ruled out. Hypertension is a well-established factor that worsens stroke outcome [81], and NO3- can reduce hypertension in the brain after ischemic injury [25,29,82]. In the present study, blood pressure was not monitored, leaving potential associations of improved stroke recovery by NO3- with lowered blood pressure unexplored.
Stroke-induced neurogenesis has been associated with improved stroke recovery, and some studies indicate positive effects of NO3- on neurogenesis [41,42]. However, we observed no effects of NO3- on post-stroke neurogenesis, at least at the time points assessed.
In conclusion, we demonstrate for the first time the efficacy of a previously unexplored strategy to improve stroke outcome using NO3- supplementation in overweight mice, even during continuous HFD feeding. If clinically validated, this prophylactic approach could benefit a population of individuals who are overweight and thus at a higher risk for the development obesity, T2D and subsequently for stroke and severe post-stroke disability. By receiving NO3-, such individuals may experience improved metabolic function, even in the presence of ongoing unhealthy dietary habits. This metabolic improvement could prove sufficient to lower their risk for poor stroke prognosis.
Author Contributions
Conceptualization, V.D and C.P.; Methodology, E.V., J.O.L. and V.D.; Software, E.V. and C.B.; Investigation, E.V., D.K. and C.B; Resources, G.P., J.O.L., T.N. and C.P.; Writing – original draft preparation, E.V., C.B., V.D. and C.P.; Writing – review and editing, E.V., D.K., C.B, G.P., J.O.L., T.N., V.D. and C.P.; Visualization, E.V. and C.B.: Supervision, C.P.; Project Administration, E.V. and C.P.; Funding Acquisition, E.V. J.O.L. T.N. V.D. and C.P.
Funding
Funding was provided by the Swedish Medical Research Council (CP, JOL), The FANG Foundation and the Swedish Brain Foundation (CP), the Swedish Heart-Lung Foundation (TN, JOL), Konung Gustaf V:s och Drottning Victorias Frimurarestiftelse (TN), Ulla Hamberg Angeby och Lennart Angebys Stiftelse (VD and EV), the Swedish Stroke Foundation (VD and EV), ALF Stockholm (TN), Knut and Alice Wallenberg Foundation (JOL).
Data Availability
The data that support the findings of this study are not openly available due to reasons of sensitivity and are available from the corresponding author upon reasonable request. Data are located in a controlled access data storage at Karolinska Institutet.
Acknowledgments
We thank Dr. Fuad Bahram (Södersjukhuset) for technical assistance and Dr. Hans Pettersson for advice on statistical analyses.
Competing Interests
TN has received consultancy fees from Boehringer Ingelheim, Eli Lilly, Novo Nordisk, Merck, and Sanofi. JOL is a named inventor on patents related to the medical uses of inorganic nitrate and nitrite. No other potential conflicts of interest relevant to this article were reported.
References
- Eckel, R.H.; Alberti, K.G.M.M.; Grundy, S.M.; Zimmet, P.Z. The metabolic syndrome. The Lancet 2010, 375. [Google Scholar] [CrossRef]
- Hirode, G.; Wong, R.J. Trends in the Prevalence of Metabolic Syndrome in the United States, 2011-2016. JAMA - Journal of the American Medical Association 2020, 323. [Google Scholar] [CrossRef]
- Ong, K.L.; Stafford, L.K.; McLaughlin, S.A.; Boyko, E.J.; Vollset, S.E.; Smith, A.E.; et al. Global, regional, and national burden of diabetes from 1990 to 2021, with projections of prevalence to 2050: a systematic analysis for the Global Burden of Disease Study 2021. The Lancet. 2023, 402. [Google Scholar] [CrossRef]
- Peters, S.A.E.; Huxley, R.R.; Woodward, M. Diabetes as a risk factor for stroke in women compared with men: A systematic review and meta-analysis of 64 cohorts, including 775 385 individuals and 12 539 strokes. The Lancet. 2014, 383. [Google Scholar] [CrossRef]
- Ullberg, T.; Zia, E.; Petersson, J.; Norrving, B. Changes in functional outcome over the first year after stroke: an observational study from the Swedish stroke register. Stroke. 2015, 46, 389–394. [Google Scholar] [CrossRef]
- Megherbi, S.E.; Milan, C.; Minier, D.; Couvreur, G.; Osseby, G.V.; Tilling, K.; et al. Association between diabetes and stroke subtype on survival and functional outcome 3 months after stroke: data from the European BIOMED Stroke Project. Stroke. 2003, 34, 688–694. [Google Scholar] [CrossRef]
- Braggio, M.; Dorelli, G.; Olivato, N.; Lamberti, V.; Valenti, M.T.; Dalle Carbonare, L.; et al. Tailored Exercise Intervention in Metabolic Syndrome: Cardiometabolic Improvements Beyond Weight Loss and Diet—A Prospective Observational Study. Nutrients. 2025, 17. [Google Scholar] [CrossRef]
- Muszalska, A.; Wiecanowska, J.; Michałowska, J.; Pastusiak-Zgolińska, K.M.; Polok, I.; Łompieś, K.; et al. The Role of the Planetary Diet in Managing Metabolic Syndrome and Cardiovascular Disease: A Narrative Review. Nutrients 2025, 17. [Google Scholar] [CrossRef]
- Tahrani, A.A.; Morton, J. Benefits of weight loss of 10% or more in patients with overweight or obesity: A review. Obesity 2022, 30. [Google Scholar] [CrossRef]
- Kernan, W.N.; Inzucchi, S.E. Treating Diabetes to Prevent Stroke. Stroke 2021, 52. [Google Scholar] [CrossRef]
- Ghusn, W.; De La Rosa, A.; Sacoto, D.; Cifuentes, L.; Campos, A.; Feris, F.; et al. Weight Loss Outcomes Associated with Semaglutide Treatment for Patients with Overweight or Obesity. JAMA Netw Open. 2022. [CrossRef]
- Rodriguez, P.J.; Goodwin Cartwright, B.M.; Gratzl, S.; Brar, R.; Baker, C.; Gluckman, T.J.; et al. Comparative Effectiveness of Semaglutide and Tirzepatide for Weight Loss in Adults with Overweight and Obesity in the US: A Real-World Evidence Study. medRxiv. 2023.
- Abdel-Bary, M.; Brody, A.; Schmitt, J.; Prieto, K.; Wetzel, A.; Juo, Y.Y. Treating class 2–3 obesity with glucagon-like peptide-1 agonists: A 2-year real-world cohort study. Diabetes Obes Metab. 2025. [CrossRef]
- Guh, D.P.; Zhang, W.; Bansback, N.; Amarsi, Z.; Birmingham, C.L.; Anis, A.H. The incidence of co-morbidities related to obesity and overweight: A systematic review and meta-analysis. BMC Public Health. 2009, 9. [Google Scholar] [CrossRef]
- Nichols, G.A.; Horberg, M.; Koebnick, C.; Young, D.R.; Waitzfelder, B.; Sherwood, N.E.; et al. Cardiometabolic risk factors among 1.3 million adults with overweight or obesity, but not diabetes, in 10 geographically diverse regions of the United States, 2012-2013. Prev Chronic Dis. 2017, 14. [Google Scholar] [CrossRef]
- Domosławska-Żylińska, K.; Łopatek, M.; Krysińska-Pisarek, M.; Sugay, L. Barriers to Adherence to Healthy Diet and Recommended Physical Activity Perceived by the Polish Population. J Clin Med. 2024, 13. [Google Scholar] [CrossRef]
- Hall, K.D.; Kahan, S. Maintenance of Lost Weight and Long-Term Management of Obesity. Medical Clinics of North America 2018, 102. [Google Scholar] [CrossRef]
- Gheibi, S.; Jeddi, S.; Carlström, M.; Gholami, H.; Ghasemi, A. Effects of long-term nitrate supplementation on carbohydrate metabolism, lipid profiles, oxidative stress, and inflammation in male obese type 2 diabetic rats. Nitric Oxide. 2018, 75. [Google Scholar] [CrossRef]
- Peleli, M.; Ferreira, D.M.S.; Tarnawski, L.; McCann Haworth, S.; Xuechen, L.; Zhuge, Z.; et al. Dietary nitrate attenuates high-fat diet-induced obesity via mechanisms involving higher adipocyte respiration and alterations in inflammatory status. Redox Biol. 2020, 28. [Google Scholar] [CrossRef]
- Peng, R.; Luo, M.; Tian, R.; Lu, N. Dietary nitrate attenuated endothelial dysfunction and atherosclerosis in apolipoprotein E knockout mice fed a high-fat diet: A critical role for NADPH oxidase. Arch Biochem Biophys. 2020, 689. [Google Scholar] [CrossRef]
- Carlström, M.; Larsen, F.J.; Nyström, T.; Hezel, M.; Borniquel, S.; Weitzberg, E.; et al. Dietary inorganic nitrate reverses features of metabolic syndrome in endothelial nitric oxide synthase-deficient mice. Proc Natl Acad Sci U S A. 2010, 107, 17716–17720. [Google Scholar] [CrossRef]
- Lundberg, J.O.; Carlström, M.; Weitzberg, E. Metabolic Effects of Dietary Nitrate in Health and Disease. Cell Metab. 2018, 28, 9–22. [Google Scholar] [CrossRef]
- Lundberg, J.O.; Weitzberg, E. Nitric oxide signaling in health and disease. Cell. 2022, 185, 2853–2878. [Google Scholar] [CrossRef] [PubMed]
- Rajendra, A.; Bondonno, N.P.; Murray, K.; Zhong, L.; Rainey-Smith, S.R.; Gardener, S.L.; et al. Habitual dietary nitrate intake and cognition in the Australian Imaging, Biomarkers and Lifestyle Study of ageing: A prospective cohort study. Clinical Nutrition. 2023, 42. [Google Scholar] [CrossRef] [PubMed]
- Wightman, E.L.; Haskell-Ramsay, C.F.; Thompson, K.G.; Blackwell, J.R.; Winyard, P.G.; Forster, J.; et al. Dietary nitrate modulates cerebral blood flow parameters and cognitive performance in humans: A double-blind, placebo-controlled, crossover investigation. Physiol Behav. 2015, 149. [Google Scholar] [CrossRef]
- de Crom, T.O.E.; Blekkenhorst, L.; Vernooij, M.W.; Ikram, M.K.; Voortman, T. ; IkramMA. Dietary nitrate intake in relation to the risk of dementia and imaging markers of vascular brain health: a population-based study. American Journal of Clinical Nutrition 2023, 18. [Google Scholar]
- Jung, K.H.; Chu, K.; Ko, S.Y.; Lee, S.T.; Sinn, D.I.; Park, D.K.; et al. Early intravenous infusion of sodium nitrite protects brain against in vivo ischemia-reperfusion injury. Stroke. 2006, 37, 2744–2750. [Google Scholar] [CrossRef]
- Wang, Y.; Chen, W.; Zhou, J.; Wang, Y.; Wang, H.; Wang, Y. Nitrate Metabolism and Ischemic Cerebrovascular Disease: A Narrative Review. Front Neurol. 7351, 13, 735181. [Google Scholar] [CrossRef]
- Allan, P.D.; Tzeng, Y.C.; Gowing, E.K.; Clarkson, A.N.; Fan, J.L. Dietary nitrate supplementation reduces low frequency blood pressure fluctuations in rats following distal middle cerebral artery occlusion. J Appl Physiol. 2018, 125. [Google Scholar] [CrossRef]
- Hara, H.; Huang, P.L.; Panahian, N.; Fishman, M.C.; Moskowitz, M.A. Reduced brain edema and infarction volume in mice lacking the neuronal isoform of nitric oxide synthase after transient MCA occlusion. Journal of cerebral blood flow and metabolism. 1996, 16, 605–611. [Google Scholar] [CrossRef] [PubMed]
- Pintana, H.; Lietzau, G.; Augestad, I.L.; Chiazza, F.; Nyström, T.; Patrone, C.; et al. Obesity-induced type 2 diabetes impairs neurological recovery after stroke in correlation with decreased neurogenesis and persistent atrophy of parvalbumin-positive interneurons. Clin Sci (Lond). 2019, 133, 1367–1386. [Google Scholar] [CrossRef]
- Bederson, J.B.; Pitts, L.H.; Tsuji, M.; Nishimura, M.C.; Davis, R.L.; Bartkowski, H. Rat middle cerebral artery occlusion: evaluation of the model and development of a neurologic examination. Stroke. 1986, 17, 472–476. [Google Scholar] [CrossRef] [PubMed]
- Sunderland, A.; Tinson, D.; Bradley, L.; Hewer, R.L. Arm function after stroke. An evaluation of grip strength as a measure of recovery and a prognostic indicator. J Neurol Neurosurg Psychiatry. 1989, 52, 1267–1272. [Google Scholar] [CrossRef]
- Rosen, G.D.; Harry, J.D. Brain volume estimation from serial section measurements: a comparison of methodologies. J Neurosci Methods. 1990, 35. [Google Scholar] [CrossRef] [PubMed]
- Vercalsteren, E.; Karampatsi, D.; Buizza, C.; Nyström, T.; Klein, T.; Paul, G.; et al. The SGLT2 inhibitor Empagliflozin promotes post-stroke functional recovery in diabetic mice. Cardiovasc Diabetol. 2024, 23. [Google Scholar] [CrossRef]
- Schindelin, J.; Arganda-Carreras, I.; Frise, E.; Kaynig, V.; Longair, M.; Pietzsch, T.; et al. Fiji: An open-source platform for biological-image analysis. Nat Methods. 2012, 9, 676–682. [Google Scholar] [CrossRef] [PubMed]
- Arganda-Carreras, I.; Fernández-González, R.; Muñoz-Barrutia, A.; Ortiz-De-Solorzano, C. 3D reconstruction of histological sections: Application to mammary gland tissue. Microsc Res Tech. 2010, 73. [Google Scholar] [CrossRef]
- Victoria, A.S.; Roy, B.; Victoria, L.H. Development of an ImageJ-based method for analysing the developing zebrafish vasculature. Vasc Cell. 2017, 9. [Google Scholar]
- Elfarnawany, M.H. Signal Processing Methods for Quantitative Power Doppler Microvascular Angiography. Electronic Thesis and Dissertation Repository. 2015.
- Teplyi, V.; Grebchenko, K. Evaluation of the scars’ vascularization using computer processing of the digital images. Skin Research and Technology. 2019, 25. [Google Scholar] [CrossRef]
- Zhang, R.; Zhang, L.; Zhang, Z.; Wang, Y.; Lu, M.; LaPointe, M.; et al. A nitric oxide donor induces neurogenesis and reduces functional deficits after stroke in rats. Ann Neurol. 2001, 50. [Google Scholar] [CrossRef] [PubMed]
- Ceanga, M.; Dahab, M.; Witte, O.W.; Keiner, S. Adult Neurogenesis and Stroke: A Tale of Two Neurogenic Niches. Frontiers in Neuroscience 2021, 15. [Google Scholar] [CrossRef] [PubMed]
- Shukla, V.; Shakya, A.K.; Perez-Pinzon, M.A.; Dave, K.R. Cerebral ischemic damage in diabetes: An inflammatory perspective. Journal of Neuroinflammation 2017, 14. [Google Scholar] [CrossRef] [PubMed]
- Durafourt, B.A.; Moore, C.S.; Zammit, D.A.; Johnson, T.A.; Zaguia, F.; Guiot, M.C.; et al. Comparison of polarization properties of human adult microglia and blood-derived macrophages. Glia. 2012, 60. [Google Scholar] [CrossRef]
- Zimmer, H.; Riese, S.; Régnier-Vigouroux, A. Functional characterization of mannose receptor expressed by immunocompetent mouse microglia. Glia. 2003, 42. [Google Scholar] [CrossRef]
- Tanaka, S.; Ohgidani, M.; Hata, N.; Inamine, S.; Sagata, N.; Shirouzu, N.; et al. CD206 Expression in Induced Microglia-Like Cells From Peripheral Blood as a Surrogate Biomarker for the Specific Immune Microenvironment of Neurosurgical Diseases Including Glioma. Front Immunol. 2021, 12. [Google Scholar] [CrossRef]
- Kanazawa, M.; Ninomiya, I.; Hatakeyama, M.; Takahashi, T.; Shimohata, T. Microglia and monocytes/macrophages polarization reveal novel therapeutic mechanism against stroke. International Journal of Molecular Sciences 2017, 18. [Google Scholar] [CrossRef]
- Rammos, C.; Luedike, P.; Hendgen-Cotta, U.; Rassaf, T. Potential of dietary nitrate in angiogenesis. World J Cardiol. 2015, 7, 652–657. [Google Scholar] [CrossRef]
- Lidder, S.; Webb, A.J. Vascular effects of dietary nitrate (as found in green leafy vegetables and beetroot) via the nitrate-nitrite-nitric oxide pathway. Br J Clin Pharmacol. 2013, 75, 677–696. [Google Scholar] [CrossRef]
- Cui, H.; Wang, Y.; Feng, Y.; Li, X.; Bu, L.; Pang, B.; et al. Dietary nitrate protects skin flap against ischemia injury in rats via enhancing blood perfusion. Biochem Biophys Res Commun. 2019, 515. [Google Scholar] [CrossRef]
- Elabi, O.F.; Karampatsi, D.; Vercalsteren, E.; Lietzau, G.; Nyström, T.; Klein, T.; et al. DPP-4 Inhibitor and Sulfonylurea Differentially Reverse Type 2 Diabetes-Induced Blood-Brain Barrier Leakage and Normalize Capillary Pericyte Coverage. Diabetes. 2023, 72, 405–414. [Google Scholar] [CrossRef] [PubMed]
- Prakash, R.; Li, W.; Qu, Z.; Johnson, M.A.; Fagan, S.C.; Ergul, A. Vascularization pattern after ischemic stroke is different in control versus diabetic rats: relevance to stroke recovery. Stroke. 2013, 44, 2875–2882. [Google Scholar] [CrossRef] [PubMed]
- Bhaskar, S. Impact of obesity-induced type 2 diabetes on long-term outcomes following stroke. Clin Sci (Lond). 2019, 133, 1603–1607. [Google Scholar] [CrossRef]
- Liu, Z.; Sanossian, N.; Starkman, S.; Avila-Rinek, G.; Eckstein, M.; Sharma, L.K.; et al. Adiposity and Outcome After Ischemic Stroke: Obesity Paradox for Mortality and Obesity Parabola for Favorable Functional Outcomes. Stroke. 2021, 52, 144–151. [Google Scholar] [CrossRef]
- Lu, J.; Gong, S.; Zhu, J.; Fang, Q. Relationships between obesity and functional outcome after ischemic stroke: a Mendelian randomization study. Neurological Sciences. 2024, 45. [Google Scholar] [CrossRef]
- Bailey, R.R.; Serra, M.C.; McGrath, R.P. Obesity and diabetes are jointly associated with functional disability in stroke survivors. Disabil Health J. 2020, 13, 100914. [Google Scholar] [CrossRef]
- Weitzberg, E.; Lundberg, J.O. Novel aspects of dietary nitrate and human health. Annu Rev Nutr. 2013, 33, 129–159. [Google Scholar] [CrossRef]
- Lundberg, J.O.; Gladwin, M.T.; Ahluwalia, A.; Benjamin, N.; Bryan, N.S.; Butler, A.; et al. Nitrate and nitrite in biology, nutrition and therapeutics. In Nature Chemical Biology; 2009. [Google Scholar]
- Group, D.P.P.R. Reduction in the Incidence of Type 2 Diabetes with Lifestyle Intervention or Metformin - NEJMoa012512. New England Journal of Medicine. 2002, 346. [Google Scholar]
- Nathan, D.M.; Barrett-Connor, E.; Crandall, J.P.; Edelstein, S.L.; Goldberg, R.B.; Horton, E.S.; et al. Long-term effects of lifestyle intervention or metformin on diabetes development and microvascular complications over 15-year follow-up: The Diabetes Prevention Program Outcomes Study. Lancet Diabetes Endocrinol. 2015, 3. [Google Scholar]
- Association of the magnitude of weight loss and changes in physical fitness with long-term cardiovascular disease outcomes in overweight or obese people with type 2 diabetes: a post-hoc analysis of the Look AHEAD randomised clinical trial. Lancet Diabetes Endocrinol. 2016, 4.
- Lai, M.; Chandrasekera, P.C.; Barnard, N.D. You are what you eat, or are you? the challenges of translating high-fat-fed rodents to human obesity and diabetes. Nutrition and Diabetes 2014, 4. [Google Scholar] [CrossRef] [PubMed]
- Buettner, R.; Schölmerich, J.; Bollheimer, L.C. High-fat Diets: Modeling the Metabolic Disorders of Human Obesity in Rodents. Obesity. 2007, 15, 798–808. [Google Scholar] [CrossRef] [PubMed]
- Speakman, J.R. Use of high-fat diets to study rodent obesity as a model of human obesity. Int J Obes [Internet]. 2019, 43, 1491–1492. [Google Scholar] [CrossRef] [PubMed]
- Tabung, F.K.; Satija, A.; Fung, T.T.; Clinton, S.K.; Giovannucci, E.L. Long-term change in both dietary insulinemic and inflammatory potential is associated with weight gain in adult women and men. Journal of Nutrition. 2019, 149, 804–815. [Google Scholar] [CrossRef]
- Cordero-Herrera, I.; Kozyra, M.; Zhuge, Z.; Haworth, S.M.C.; Moretti, C.; Peleli, M.; et al. AMP-activated protein kinase activation and NADPH oxidase inhibition by inorganic nitrate and nitrite prevent liver steatosis. Proc Natl Acad Sci U S A. 2019, 116. [Google Scholar] [CrossRef]
- Higaki, Y.; Hirshman, M.F.; Fujii, N.; Goodyear, L.J. Nitric oxide increases glucose uptake through a mechanism that is distinct from the insulin and contraction pathways in rat skeletal muscle. Diabetes. 2001, 50. [Google Scholar] [CrossRef]
- Lai, Y.C.; Tabima, D.M.; Dube, J.J.; Hughan, K.S.; Vanderpool, R.R.; Goncharov, D.A.; et al. SIRT3-AMP-Activated Protein Kinase Activation by Nitrite and Metformin Improves Hyperglycemia and Normalizes Pulmonary Hypertension Associated with Heart Failure with Preserved Ejection Fraction. Circulation. 2016, 133. [Google Scholar] [CrossRef]
- Masrur, S.; Cox, M.; Bhatt, D.L.; Smith, E.E.; Ellrodt, G.; Fonarow, G.C.; et al. Association of acute and chronic hyperglycemia with acute ischemic stroke outcomes post-thrombolysis: Findings from get with the guidelines-stroke. J Am Heart Assoc. 2015, 4. [Google Scholar] [CrossRef]
- Kamouchi, M.; Matsuki, T.; Hata, J.; Kuwashiro, T.; Ago, T.; Sambongi, Y.; et al. Prestroke glycemic control is associated with the functional outcome in acute ischemic stroke: The fukuoka stroke registry. Stroke. 2011, 42. [Google Scholar] [CrossRef]
- Chang, J.Y.; Kim, W.J.; Kwon, J.H.; Kim, B.J.; Kim, J.T.; Lee, J.; et al. Prestroke glucose control and functional outcome in patients with acute large vessel occlusive stroke and diabetes after thrombectomy. Diabetes Care. 2021, 44. [Google Scholar] [CrossRef]
- Siervo, M.; Babateen, A.; Alharbi, M.; Stephan, B.; Shannon, O. Dietary nitrate and brain health. Too much ado about nothing or a solution for dementia prevention? British Journal of Nutrition 2022, 128. [Google Scholar] [CrossRef] [PubMed]
- Veszelovszky, E.; Holford, N.H.G.; Thomsen, L.L.; Knowles, R.G.; Baguley, B.C. Plasma nitrate clearance in mice: modeling of the systemic production of nitrate following the induction of nitric oxide synthesis. Cancer Chemother Pharmacol. 1995, 36. [Google Scholar] [CrossRef]
- Grefkes, C.; Grefkes, C.; Fink, G.R.; Fink, G.R. Recovery from stroke: Current concepts and future perspectives. Neurological Research and Practice 2020, 2. [Google Scholar] [CrossRef] [PubMed]
- Ospel, J.M.; Hill, M.D.; Menon, B.K.; Demchuk, A.; McTaggart, R.; Nogueira, R.; et al. Strength of association between infarct volume and clinical outcome depends on the magnitude of infarct size: Results from the ESCAPE-NA1 trial. American Journal of Neuroradiology. 2021, 42. [Google Scholar] [CrossRef]
- Jayaraj, R.L.; Azimullah, S.; Beiram, R.; Jalal, F.Y.; Rosenberg, G.A. Neuroinflammation: friend and foe for ischemic stroke. J Neuroinflammation. 2019, 16, 142. [Google Scholar] [CrossRef]
- Kobayashi, K.; Imagama, S.; Ohgomori, T.; Hirano, K.; Uchimura, K.; Sakamoto, K.; et al. Minocycline selectively inhibits M1 polarization of microglia. Cell Death Dis. 2013, 4. [Google Scholar] [CrossRef]
- Sandvig, I.; Augestad, I.L.; Håberg, A.K.; Sandvig, A. Neuroplasticity in stroke recovery. The role of microglia in engaging and modifying synapses and networks. European Journal of Neuroscience 2018, 47. [Google Scholar] [CrossRef]
- Nguyen, P.T.; Dorman, L.C.; Pan, S.; Vainchtein, I.D.; Han, R.T.; Nakao-Inoue, H.; et al. Microglial Remodeling of the Extracellular Matrix Promotes Synapse Plasticity. Cell. 2020, 182. [Google Scholar] [CrossRef] [PubMed]
- Alia, C.; Cangi, D.; Massa, V.; Salluzzo, M.; Vignozzi, L.; Caleo, M.; et al. Cell-to-Cell Interactions Mediating Functional Recovery after Stroke. Cells. 2021, 10. [Google Scholar] [CrossRef]
- Cipolla, M.J.; Liebeskind, D.S.; Chan, S.L. The importance of comorbidities in ischemic stroke: Impact of hypertension on the cerebral circulation. Journal of Cerebral Blood Flow and Metabolism 2018, 38. [Google Scholar] [CrossRef]
- Fan, J.L.; O’Donnell, T.; Lanford, J.; Croft, K.; Watson, E.; Smyth, D.; et al. Dietary nitrate reduces blood pressure and cerebral artery velocity fluctuations and improves cerebral autoregulation in transient ischemic attack patients. J Appl Physiol. 2020, 129. [Google Scholar] [CrossRef] [PubMed]
Figure 1.
Experimental design of the study.
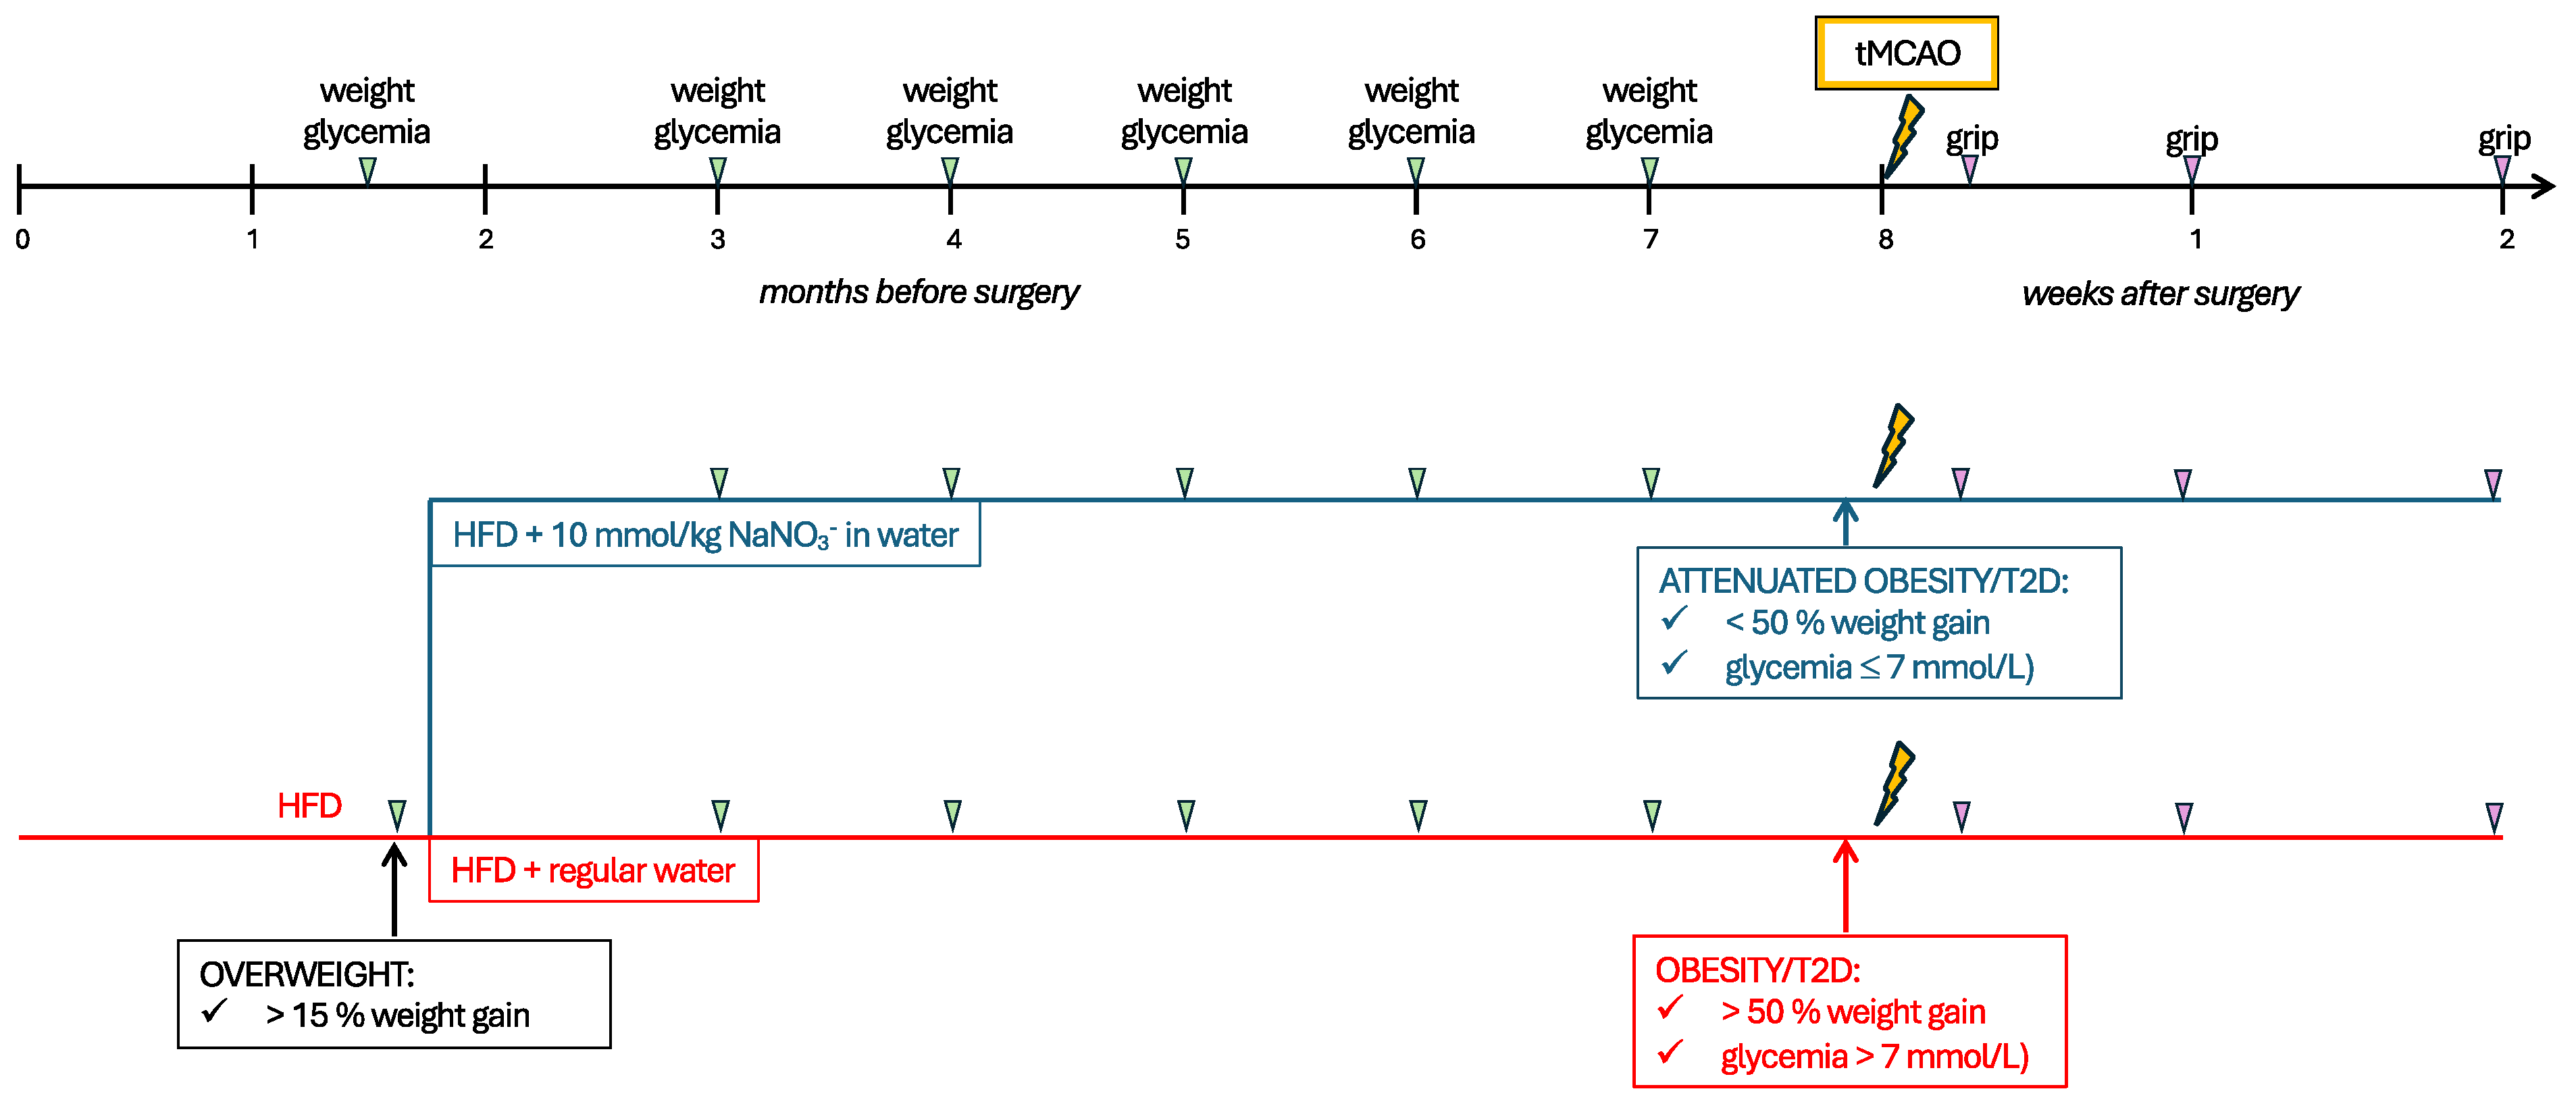
Figure 2.
Effect of prolonged NO3- supplementation on pre-stroke metabolism and stroke outcome. The effect of 24 weeks of NO3- on (A) body weight (in grams), (B) weight gain in %, and (C) fasting glucose over time, and (D,E) insulin sensitivity, measured with an insulin tolerance test (plotted curve in D, area under the curve in E) and a (F,G) glucose tolerance test (plotted curve in F, area under the curve in G). (H,I) Forepaw grip strength, as plotted curve (H), and area under the curve (I). (J) Stroke volume. (K) body weight (grams), (L) weight loss (grams) and (M) fasting glucose at two weeks after stroke. Data are presented as mean ± SD. Statistical significance was calculated using repeated measures two-way ANOVA, with two-stage linear set-up procedure of Benjamini, Krieger and Yekutieli in A, B, C, H, K, L and Welch t-test in E, G, I, J, and M, and results were considered significant when p < 0.05. * depict a significant difference between HFD and NO3- with * denoting p < 0.05, ** denoting p < 0.01, *** denoting p < 0.001, and **** denoting p < 0.0001. HFD = high-fat diet, NO3- = dietary nitrate. Sample size: (A-G) n = 10 per group, (H,I and K-M) HFD n = 8, NO3- n = 9, (J) HFD n = 8, NO3- n = 6.
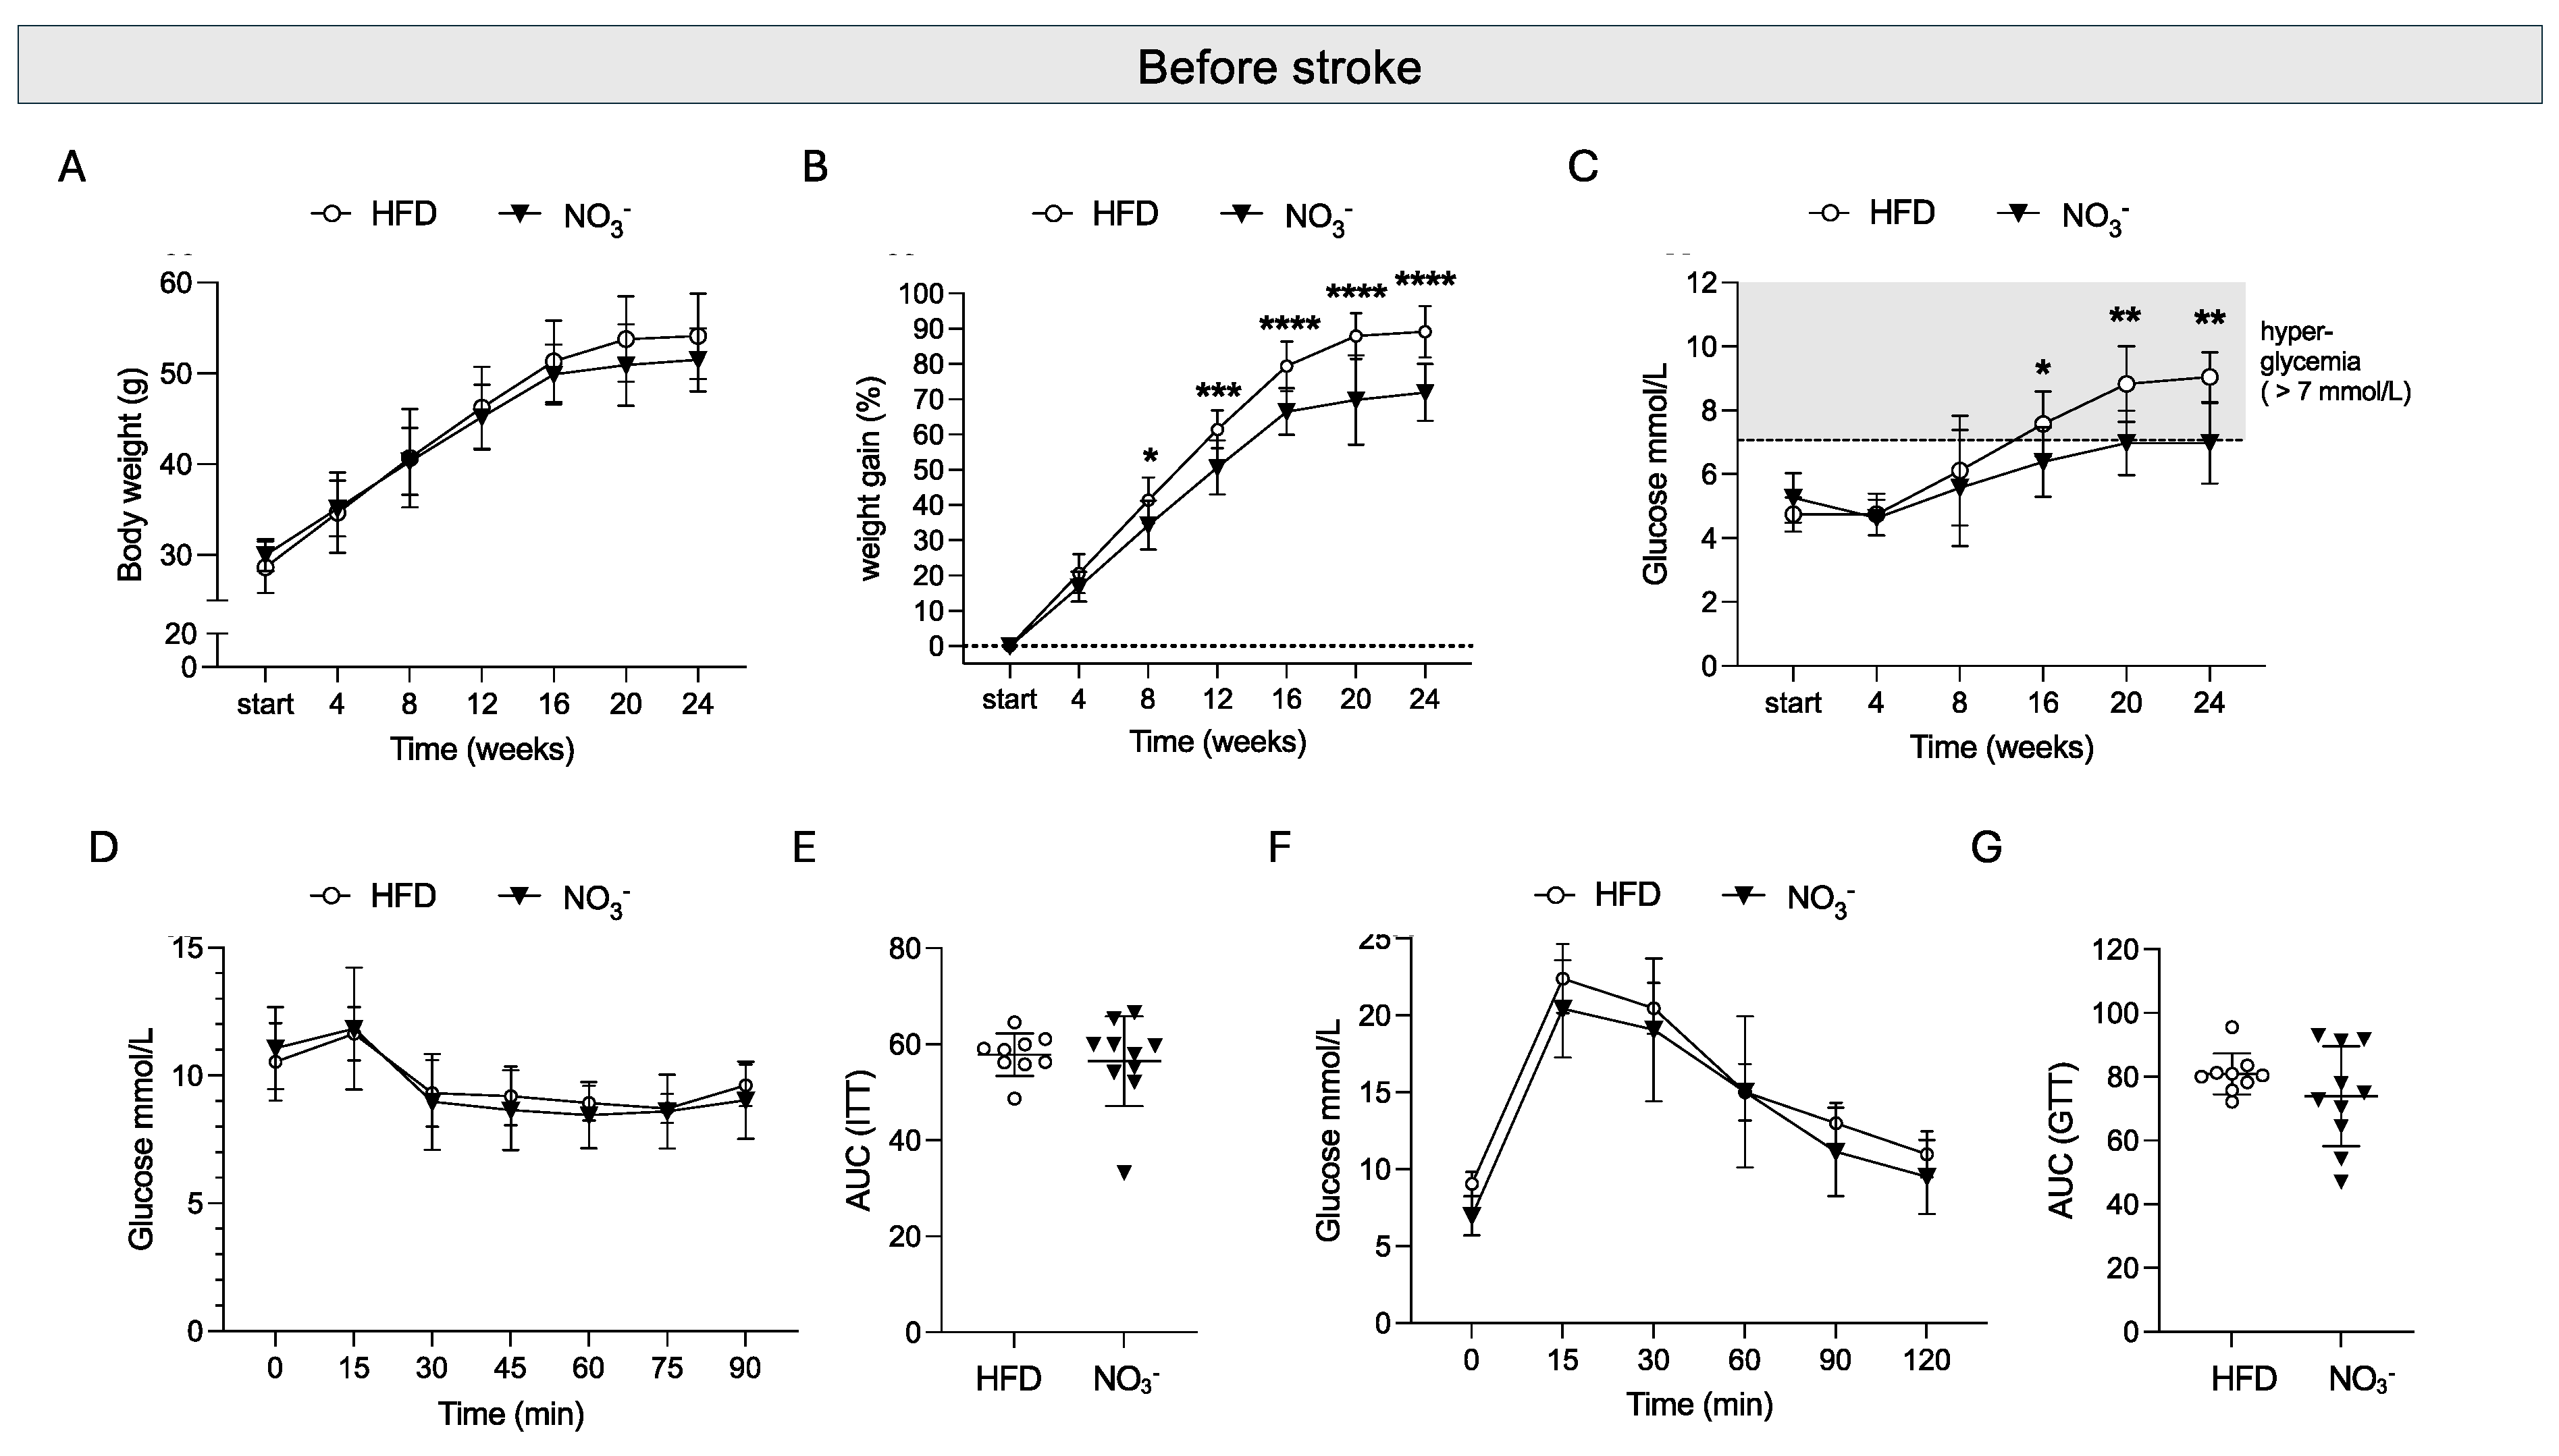
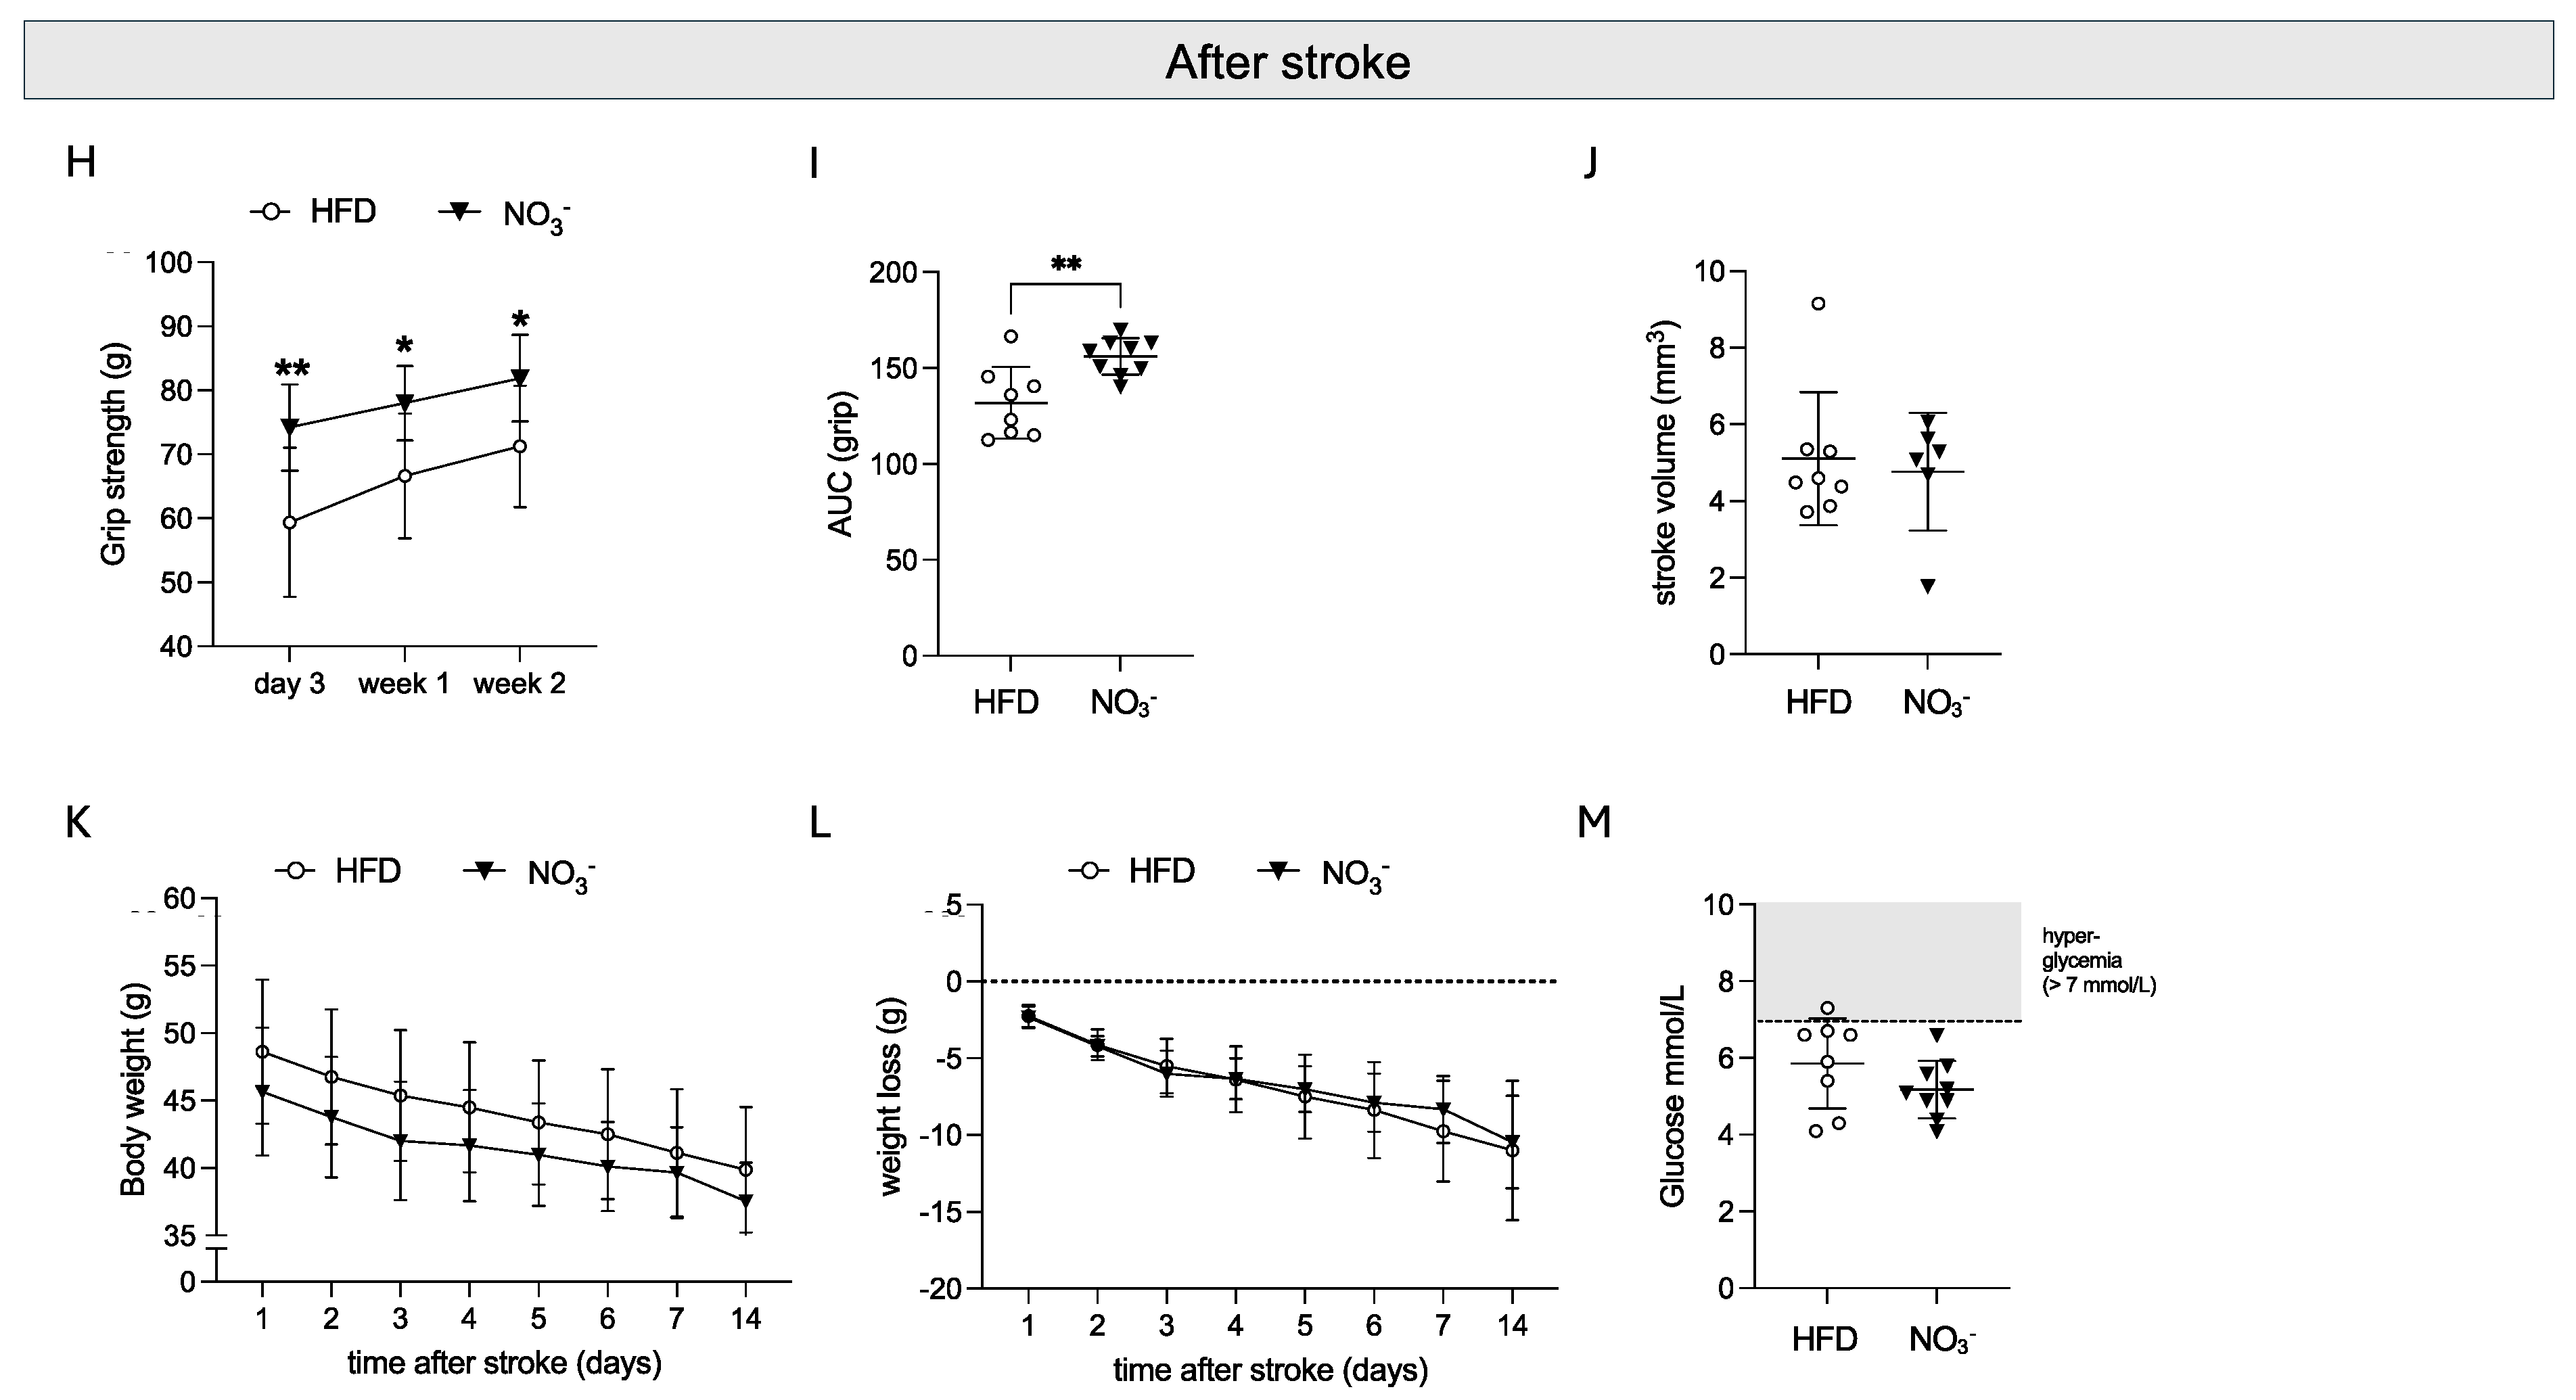
Figure 3.
Effect of long-term NO3- supplementation on post-stroke neurogenesis. (A) Number of Ki67+ cells in subventricular zone (SVZ) and (B) number of DCX+ cells in striatum. (C) representative images of Ki67 (left) and DCX positive staining. White dotted line delineates subventricular zone, white arrows indicate DCX+ cells. Scale bar = 20 μm. Data are presented as mean ± SD. Statistical significance was calculated using ordinary two-way ANOVA, with uncorrected Fisher’s LSD. Results were considered statistically significant when p < 0.05 and * denotes p < 0.05. HFD = high fat diet, NO3- = dietary nitrate, SVZ = subventricular zone. Sample size: HFD = 8, NO3- = 6.
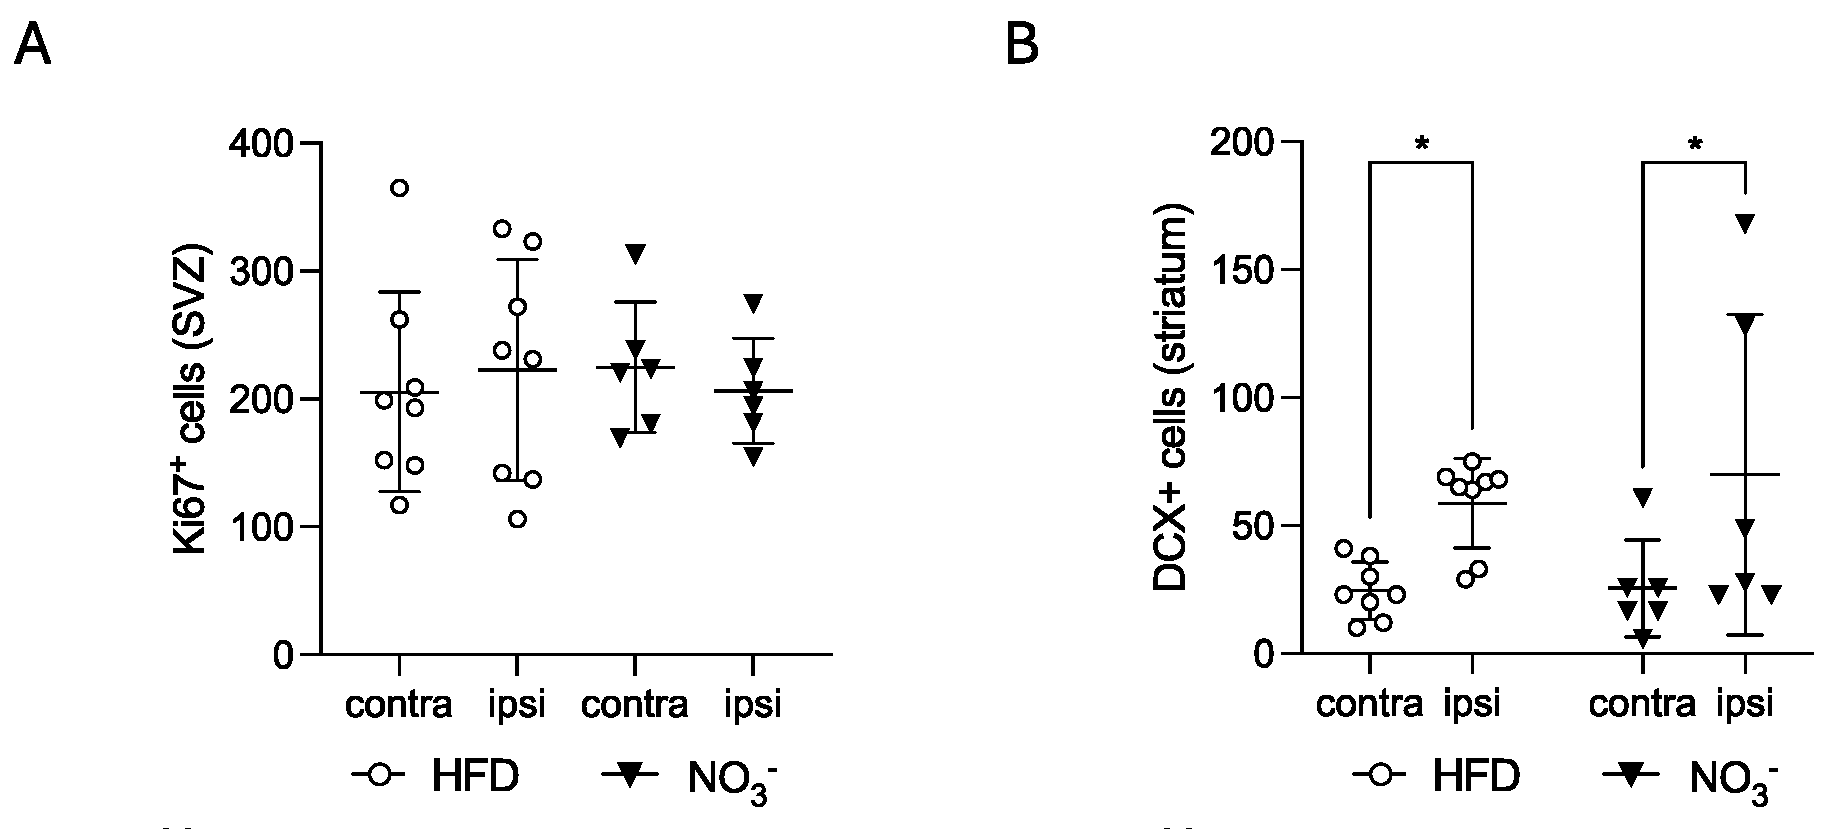
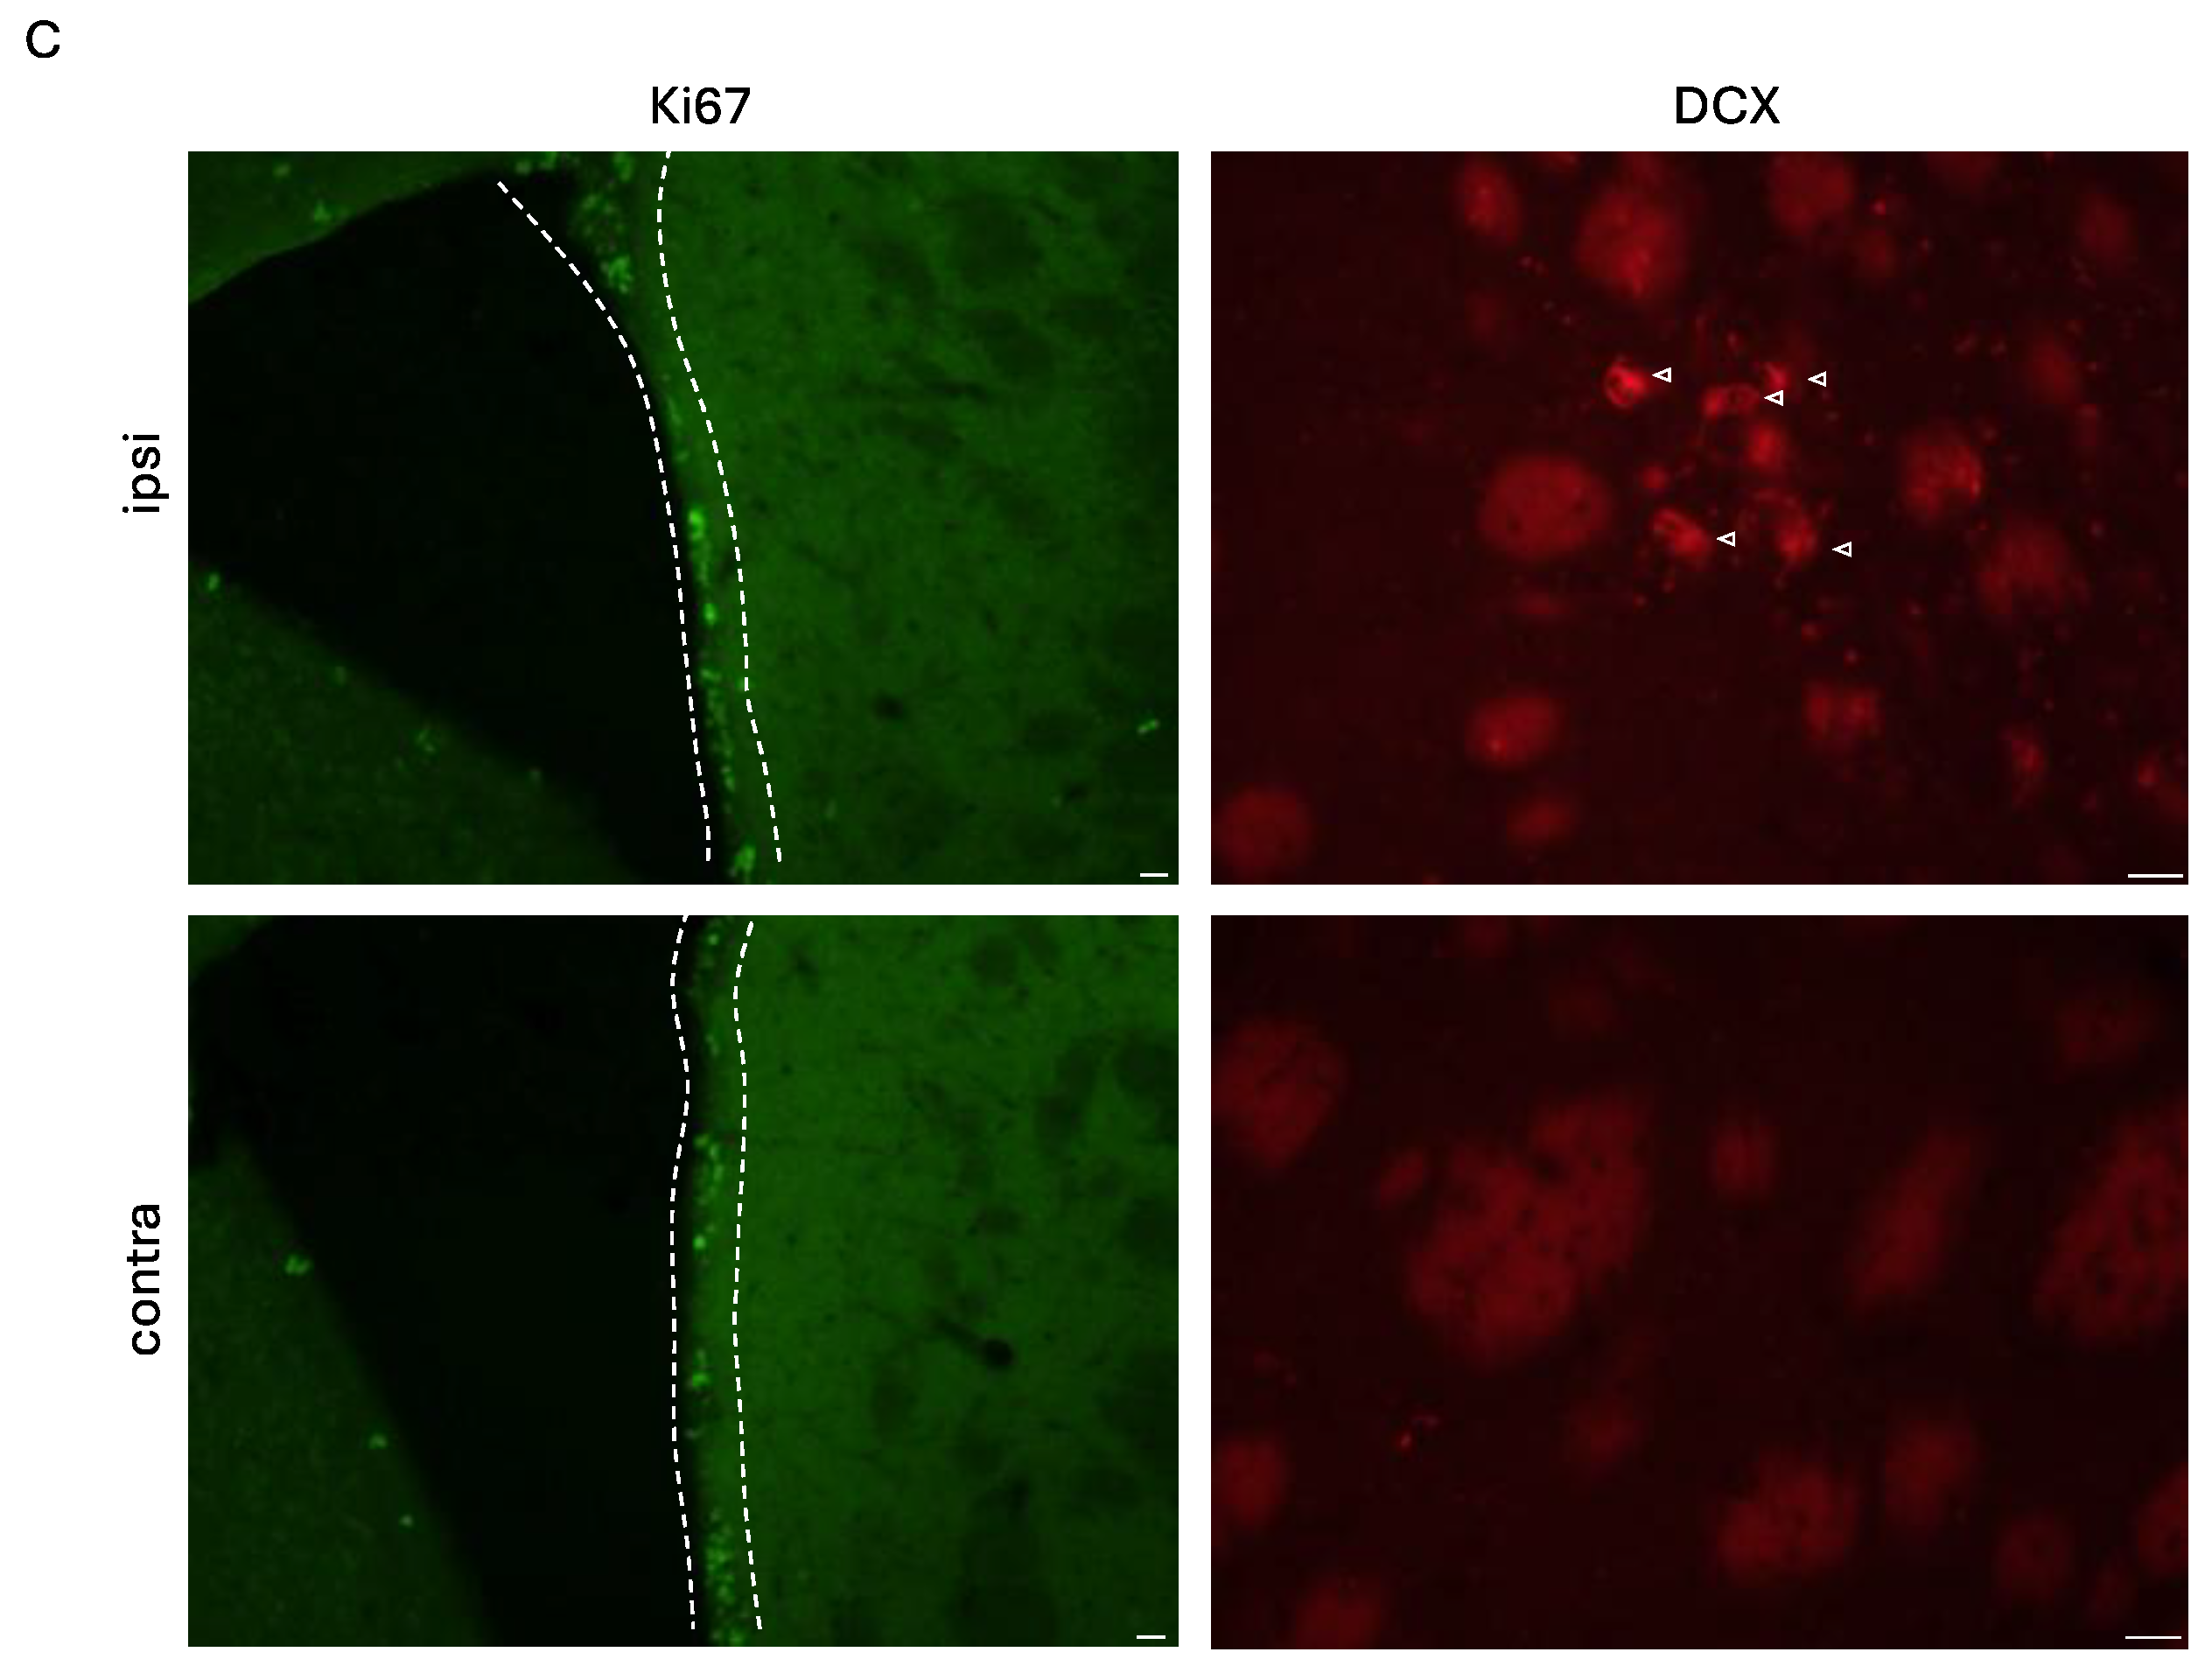
Figure 4.
The effect of long-term NO3- supplementation on post-stroke neuroinflammation. (A) Striatal Iba-1 expression, % positive area. (B) Number of CD206+ cells in contralateral striatum and ipsilateral peri-infarct per mm2, average of three sections. (C) Number of CD68+ cells in ipsilateral striatum. (D) representative images of Iba1, CD206 and CD68 staining. Scale bar = 20 μm. Data are presented as mean ± SD. Statistical significance was calculated using ordinary two-way ANOVA, with uncorrected Fisher’s LSD in A and B, unpaired t-test in C. Results were considered statistically significant when p < 0.05, with * denoting p < 0.05 and ** denoting p < 0.01.HFD = high fat diet, NO3- = dietary nitrate. Sample size: HFD = 8, NO3- = 6.

Figure 5.
The effect of long-term NO3- supplementation on post-stroke neovascularization. Expression of PDXL (A), and CD13 (B) in peri-infarct area. (C) Ratio of CD13/PDXL in peri-infarct area. Total vessel length (D) and average vessel diameter (E) in peri-infarct area. (F) Representative confocal images showing comparable pericyte (CD13, green) and vessel (PDXL, red) area density, pericyte coverage, total vessel length, and average vessel diameter across groups. Scale bar = 100 μm. Data are presented as mean ± SD. Statistical significance was calculated using ordinary two-way ANOVA, with uncorrected Fisher’s and results were considered statistically significant when p < 0.05. HFD = high fat diet, NO3- = dietary nitrate. Sample size: HFD = 8, NO3- = 6.
Disclaimer/Publisher’s Note: The statements, opinions and data contained in all publications are solely those of the individual author(s) and contributor(s) and not of MDPI and/or the editor(s). MDPI and/or the editor(s) disclaim responsibility for any injury to people or property resulting from any ideas, methods, instructions or products referred to in the content. |
© 2025 by the authors. Licensee MDPI, Basel, Switzerland. This article is an open access article distributed under the terms and conditions of the Creative Commons Attribution (CC BY) license (http://creativecommons.org/licenses/by/4.0/).
Copyright: This open access article is published under a Creative Commons CC BY 4.0 license, which permit the free download, distribution, and reuse, provided that the author and preprint are cited in any reuse.


