Submitted:
13 June 2025
Posted:
13 June 2025
You are already at the latest version
Abstract
Background/Objectives: With the rapidly aging global population, the incidence of sarcopenia is rising, making the development of effective prevention and treatment strategies critical. The present study aims to evaluate the effects and clinical efficacy of Myoki, a corn-derived peptide, using mouse-derived C2C12 myoblasts and an accelerated aging mouse model as well as a human clinical trial. Methods: In vitro, muscle atrophy was induced in C2C12 cells using 10 μM dexamethasone (DEX). Myoki was applied at concentrations up to 500 μM and its cytotoxicity was assessed via cell viability assays. Morphological changes were documented by microscopy, and the expression of muscle structural and differentiation proteins was measured using Western blot and qRT-PCR. The binding affinity between Myoki and myostatin was determined using surface plasmon resonance on a Biacore T200 system and validated by ELISA. For in vivo studies, 8-week-old male SAMP8 (accelerated aging) and SAMR1 mice were divided into three groups: SAMR1 control, SAMP8 negative control, and SAMP8 receiving Myoki. Muscle tissues were histologically examined to assess fiber density, thickness, and collagen deposition. In a clinical trial, 80 sarcopenic patients were randomly assigned to receive either Myoki combined with arginine and maltodextrin (100 mg) or the carrier alone for 12 weeks. Efficacy was evaluated by measuring muscle mass, 6‑meter walk test speed, hand grip strength, and serum levels of TNF‑α, estrogen, testosterone, IL‑6, IGF‑I, myoglobin, and AST. Results: Myoki showed no cytotoxicity up to 500 μM. In C2C12 cells, treatment with Myoki increased myofiber length in a dose- and time-dependent manner (up to 217.1%) and enhanced the expression of key muscle proteins (up to 818%). In the DEX-induced atrophy model, Myoki restored growth signaling and reduced expression of the atrophy markers MAFbx and MuRF1. SPR and ELISA confirmed a high binding affinity for myostatin. In SAMP8 mice, Myoki improved muscle fiber density and thickness while reducing collagen deposition. Clinically, patients treated with Myoki demonstrated significant improvements in muscle mass, walking speed, and hand grip strength, along with increased IGF‑I and myoglobin levels compared to controls. Conclusions: Myoki promotes myofiber growth and inhibits myostatin, suggesting its potential as a novel therapeutic approach for combating sarcopenia.
Keywords:
Sarcopenia
; Myostatin
; Muscle atrophy
; Muscle hypertrophy
; Protein degradation
; Protein synthesis
; Myogenic regulatory factors
1. Introduction
With the aging global population, sarcopenia has emerged as a significant public health issue [1]. Characterized by the gradual loss of muscle mass and function, sarcopenia primarily affects older adults [2,3]. This condition increases the risk of falls, fractures, disability, and mortality and significantly reduces patients' quality of life [4]. Thus, maintaining muscle mass and function is critical.
To delay the progression of sarcopenia, it is essential to understand the mechanisms associated with muscle loss and develop targeted treatment strategies. Although muscle loss can result from complex mechanisms, several key pathways have been identified. Muscle atrophy is primarily driven by the reduced differentiation of satellite cells and myocytes and an imbalance between protein synthesis and degradation (specifically, decreased synthesis and increased degradation) [5,6,7,8].
The muscle regeneration process begins with satellite cell activation, followed by myoblast proliferation and differentiation, leading to mature myotube formation. Myoblast differentiation and mature myotube formation are regulated by myogenic regulatory factors (MRFs), which include MyoD, Myf5, MyoG (Myogenin), and Myf6 [9,10]. These are key transcription factors that are upregulated during myogenesis, playing a critical role in directing stem cells to differentiate into myotube cells. Ultimately, differentiated myotube cells may fuse to form new muscle fibers or integrate with existing ones. Studies have shown that newborn mice lack MyoD and Myf5, exhibiting a severe deficiency of myoblasts and muscle fibers [11].
Myostatin functions as a critical negative regulator of skeletal muscle growth [12]. Its inhibition leads to muscle hypertrophy, whereas its overexpression causes muscle atrophy, primarily due to the mechanisms suppressing protein synthesis and promoting protein degradation by inhibiting the AKT/p70S6K signaling pathway and activating the ubiquitin-proteasome system [13,14]. Myostatin increases the expression of ubiquitin E3 ligases such as Atrogin-1 and MuRF-1, thereby accelerating protein degradation in muscle [15,16]. In contrast, myostatin inhibition results in muscle growth and increased muscle mass [17]. Anti-myostatin therapeutic strategies have been shown to effectively enhance muscle mass and strength. Notably, cattle deficient in myostatin and myostatin knockout mice exhibit the double-muscle phenotype [18,19]. These findings suggest that myostatin inhibition may alleviate muscle atrophy and play a significant role in the treatment of various muscle-related diseases.
This study aimed to evaluate the effects of Myoki, a corn-derived peptide, on skeletal muscle atrophy and elucidate its underlying mechanisms. Initially, its impact on sarcopenia was assessed using the mouse-derived C2C12 muscle cell line and an accelerated aging mouse model. Based on the findings, its clinical efficacy and safety were further investigated to validate its potential therapeutic application.
2. Materials and Methods
2.1. Preparation of Corn Extract and Fractionation of Its Components
Corn kernels (100 g) were ground and extracted with 1,000 mL of absolute ethanol (99.5%) at 60°C for 6 h using a rotary evaporator. The extract was centrifuged at 12,000 × g for 20 min to remove solids, after which the ethanol was evaporated and the residue freeze-dried. The ethanol-dissolved extract was injected into an ÄKTA purification system (GE Healthcare, USA) and subjected to gel filtration chromatography using 20 mM potassium phosphate buffer (pH 7.0) to isolate peptide fractions (500–5,000 Da).
2.2. Peptide (Myoki) Synthesis
To methylate the second amino acid, methanol and sulfuric acid (H₂SO₄) were added and stirred for 6 h. LC/MS/MS confirmed the methylation. Then, the first amino acid in acetone was combined with the methylated amino acid, and the mixture was stirred for 6–8 h. HPLC (U-3000, Thermo Fisher) and LC/MS/MS (3200 Q-trap, AB SCIEX) verified completion and bond formation. The peptide was purified via column chromatography using C18 resin. The peptide dissolved in purified water was adsorbed onto a C18 resin and eluted using ethanol. After the purification, the product was dried using a freeze-dryer (ilShinBioBase, LP20, Korea) to obtain the synthesized peptide containing the first and second amino acids. In the method describe above, the peptide was synthesized sequentially until the final amino acid was added. The purity of the synthesized peptide was confirmed by HPLC analysis (U-3000, Thermo Fisher Scientific) using a C18 column (250 × 4.65 mm, 5 µm; Pursuit XRs, Agilent Technologies). Molecular weight was determined by LC/MS/MS (3200 Q-trap, AB SCIEX). MS/MS conditions were as follows: ESI positive mode; curtain gas = 20; collision gas = high; ionspray voltage = 5500; temperature = 350°C; and ion source gases 1 and 2 at 50. Compound settings were: declustering potential = 50–80, entrance potential = 10, collision energy = 10–50, and collision energy spread = 1–10. The Myoki peptide (sequence EAEYEHL, 7-mer) had a purity of 99.8% and a molecular weight of 889.9 Da.
2.3. Cell Culture
The C2C12 myoblasts used in this study were purchased from ATCC (CRL-1772™, Manassas, VA, USA). The cells were cultured in growth medium (GM), which consisted of Dulbecco’s Modified Eagle’s Medium (DMEM, 25 mM glucose) supplemented with 10% fetal bovine serum (FBS) and 1% penicillin-streptomycin (all obtained from Thermo Fisher Scientific). All cells were incubated in a humidified atmosphere at 37°C with 95% air and 5% CO₂.
2.4. Cell Differentiation and Muscle Atrophy Model
To induce C2C12 myotube differentiation, myoblasts were seeded in six-well plates at 5×10⁵ cells per well. Once reaching 90% confluency, they were cultured in DMEM supplemented with 2% horse serum (Thermo Fisher Scientific) and 1% penicillin-streptomycin. To evaluate Myoki’s effect, cells were co-cultured with 5, 50, or 100 μM Myoki for 3 or 6 days. Differentiation was observed using an optical microscope (LEICA, 100×) and myotube length measured via ImageJ (NIH). For the muscle atrophy model, cells were similarly seeded and differentiated for 5 days, then treated for 24 hours with 10 μM dexamethasone (DEX, Sigma-Aldrich) combined with 10 or 100 μM Myoki.
2.5. Cytotoxicity Assay
To assess Myoki’s cytotoxicity in C2C12 cells, an assay using EZ-Cytox (DoGenBio, Seoul, Korea) was conducted. First, C2C12 myoblasts were seeded at a density of 1×10⁴ cells per well in a 96-well culture plate and incubated for 24 h at 37°C in 5% CO₂. Then, the cells were treated with various Myoki concentrations (3.9, 7.81, 15.63, 31.25, 62.5, 125, 250, and 500 μM) and cultured for an additional 24 h. Subsequently, 10 μL of EZ-Cytox reagents were added to each well, followed by a 1-h incubation. The absorbance was measured at 450 nm using a microplate reader, and the relative cell viability was estimated based on the absorbance of the untreated control group as 100% viability.
2.6. Immunocytochemistry (ICC)
Differentiated C2C12 cells cultured on coverslips were fixed at room temperature for 10 min with PBS containing 3.7% paraformaldehyde. They were then permeabilized with 0.25% Triton X-100/PBS for 10 min and blocked with 1% BSA/PBS. They were incubated overnight with primary antibodies, anti-MyoD (Santa Cruz, sc-377460) and anti-MyHC (Santa Cruz, sc-53091), followed by washing with PBS. They were then incubated for 1 h with goat anti-mouse IgG H&L (Alexa Fluor® 488). Nuclei were stained with 4′,6-diamidino-2-phenylindole (DAPI; blue) for 5 min. The coverslips were mounted onto glass slides using an aqueous mounting solution (Biomeda, Foster City, CA, USA) and left to dry. Images were captured using a confocal laser scanning microscope (LEICA, Wetzlar, Germany) at 200× magnification for MyHC and 400× magnification for MyoD. Each marker’s fluorescence intensity was quantified using ImageJ software.
2.7. Quantitative Polymerase Chain Reaction (qPCR) Assay
To investigate Myoki’s regulatory effects on the expression of differentiation-related genes (Myf5, Myf6, MyoD, and MyoG) in C2C12 cells, reverse transcription PCR (RT-PCR) was performed. Total RNA was extracted, and complementary DNAs (cDNAs) were synthesized using a cDNA reverse transcription kit (Enzynomics, Daejeon, South Korea) according to the manufacturer's instructions, using a PCR thermal cycler (Eppendorf, Hamburg, Germany). The final PCR products were electrophoresed in 1.5% agarose gel containing EtBr at 100V for 30 min and visualized using a ChemiDoc™ XRS imaging system (Bio-Rad, Hercules, CA, USA). The primers used were as follows: Myf5 forward (5′-TAT GAA GGC TCC TGT ATC CC-3′), Myf5 reverse (5′-ACG TGC TCC TCA TCG TCT G-3′), Myf6 forward (5′-TGC TAA GGA AGG AGG AGC AA-3′), Myf6 reverse (5′-CCT GCT GGG TGA AGA ATG TT-3′), MyoD forward (5′-AGT GAA TGA GGC CTT CGA GA-3′), MyoD reverse (5′-CTG GGT TCC CTG TTC TGT GTA-3′), MyoG forward (5′-ACC AGG AGC CCC ACT TCT AT-3′), MyoG reverse (5′-ACG ATG GAC GTA AGG GAG TG-3′). The data were normalized using GAPDH as an internal control for each sample and quantified using ImageJ software.
2.8. Western Blot Assay
Treated C2C12 cells (5×10⁵ cells/well) were harvested in lysis buffer (Sigma-Aldrich) and centrifuged at 12,000 g for 10 min; proteins in the supernatant were collected. Protein concentrations were measured using the BCA Protein Assay Kit (Thermo Fisher Scientific). Each 20 μg sample was separated by 10% SDS-PAGE and transferred to a PVDF membrane (Millipore, Burlington, MA, USA). Non-specific binding was blocked with 5% non-fat dry milk for 1 h. Membranes were incubated overnight with primary antibodies: Anti-Myf5 (Abcam, ab125078), Anti-Myf6 (Abcam, ab182842), Anti-MyoD (Santa Cruz, sc-377460), Anti-MyoG (Santa Cruz, sc-52903), Anti-α-actinin (Santa Cruz, sc-17829), Anti-MyHC (Santa Cruz, sc-53091), Anti-p-mTOR (Ser2448) (CST, #5536), Anti-p-AKT (Ser473) (CST, #9271), Anti-p-p70 S6 Kinase (Thr389) (CST, #9205), Anti-myostatin (Abcam, ab124721), Anti-MAFbx (Santa Cruz, sc-166806), and Anti-MuRF1 (Santa Cruz, sc-398608). Membranes were then incubated for 1 h with HRP-conjugated secondary antibodies. Blot images were captured with the ECL system (Amersham, UK) and quantified using ImageJ.
2.9. Surface Plasmon Resonance (SPR) Analysis
The Myoki–MSTN interaction was measured as SPR using the Biacore T200 system (Cytiva). The human recombinant MSTN-Fc protein (Sino Biological, #50441-M01H) was immobilized on the surface of a CM5 sensor chip at 2210.3 response units (RUs) using an EDC/NHS amine coupling kit, following the manufacturer's instructions. The Myoki peptide was injected into the flow cell at a rate of 30 μL/min at 25°C, using HBS-EP buffer as the running buffer. Data analysis was performed using Biacore T200 Evaluation Software version 3.1 (Cytiva).
2.10. Enzyme-linked immunosorbent assay (ELISA)-Based Receptor Binding Assay
Myoki, diluted in coating buffer (R&D Systems, #DY006), and activin R2B (ASRO Biosystem, #ACB-H82E3) were dispensed into ELISA plates (Thermo Fisher Scientific, #439454) and coated overnight at 4°C. Plates were washed with PBST and blocked with 3% (w/v) BSA for 2 h at room temperature. They were then incubated for 2 h with Fc gamma-tagged myostatin/GDF-8 (Sino Biological, #50441-M01H) diluted in PBST. After another PBST wash, plates were treated with HRP-linked Anti-IgG Fc gamma (CST, #32935S, 1:1000) for 2 h. Finally, color was developed with TMB (Sigma, #T0440), the reaction stopped with 1 M H₂SO₄, and absorbance was measured at 450 nm.
2.11. Animal Study Design
Eight-week-old male SAMP8 and SAMR1 mice (weighing 30 ± 2 g) were purchased from Central Lab Animal Inc. (Seoul, Korea) and housed at 24°C in cages under a 12/12-h light/dark cycle with ad libitum access to food and water. After a 7-d acclimation period, they were randomly assigned into three groups (n = 5 per group): a control group (SAMR1), a negative control group (SAMP8), and a Myoki treatment group (Myoki + SAMP8). Control and negative control group mice received 200 µL of PBS, whereas Myoki group mice received 20 mg of Myoki dissolved in 200 µL of PBS daily for 45 weeks. This study was approved by the Institutional Animal Care and Use Committee (approval number CG-R22-001).
2.12. Histopathological Image Analysis
Quadriceps (Quad) and gastrocnemius (Gas) muscle tissues were fixed in 10% formalin at 4°C for 24 h for dehydration. The fixed tissues were preprocessed, embedded in paraffin, and sectioned into 5-μm-thick slices. The tissue sections mounted on slides were deparaffinized, washed, and stained with hematoxylin (Dako, S3309) and eosin (Thermo Fisher Scientific, #6766007) (H&E) and then observed under an optical microscope (LEICA). To assess the degree of muscle fibrosis, they were also stained using a Sirius Red Stain Kit (Abcam, ab150681) following the washing steps. Both H&E- and Sirius Red-stained slides were observed at 200× magnification using an optical microscope. The cross-sectional area of each tissue was quantitatively analyzed using ImageJ software.
2.13. Immunohistochemistry (IHC)
Muscle tissues fixed in formalin were sectioned into 5-μm paraffin slices. They were treated with heated TRS buffer (pH 6.2) and peroxide-blocked using reagent (Epredia, TA-125-PBQ). Primary antibodies—anti-myostatin (Abcam, ab124721), anti-MAFbx (Santa Cruz, sc-166806), and anti-fast (Abcam, ab91506)—were diluted 1:250 or 1:500 in antibody diluent (GBI Labs, E09-300) and incubated overnight at 4°C. After PBS washing, secondary antibodies—goat anti-mouse IgG (Jackson, 115-035-003) and goat anti-rabbit IgG (Jackson, 111-035-003)—were applied at 1:250 for 1 h at room temperature. Samples were then stained with DAPI (Invitrogen) for 20 min, mounted using Aqua Mounting Media (Biomeda), and imaged at 200× with a confocal laser microscope. Fluorescence intensities were quantified using ImageJ software, and results were statistically analyzed.
2.14. Patients and Data
Individuals with muscle atrophy were recruited to evaluate Myoki’s efficacy and safety through a randomized, double-blind, placebo-controlled, parallel study. Among the applicants, those below the thresholds of muscle mass (Men: <7.0 kg/m², Women: <5.4 kg/m² by DEXA scan) and either hand grip strength (Men: <28 kg, Women: <18 kg) or 6-m walking speed (<1.0 m/s) were enrolled in the study. All 80 participants provided written informed consent. They were randomly assigned in a 1:1 ratio (40 per group) to evenly distribute baseline characteristics between the groups (Table S1). Participants were assigned to receive either 100 mg of Myoki + arginine + maltodextrin or 100 mg of arginine + maltodextrin, to be consumed by mixing with water twice daily after breakfast and dinner for 12 weeks. Of the 80 participants, 75 completed their participation in the study (Figure 7). Efficacy analyses were conducted by assessing changes from baseline to 12 weeks, while safety analyses followed the protocol and included all participants who consumed at least one dose of the investigational product (Figure S1). The study was performed in Biosite Research Private Limited, Shanthipura, India and compliance with the requirements of the CDSCO, Ministry of health and family welfare, Government of India. This study was reviewed and approved by the Ethics Committee (Reg. No: CTRI/2024/01/061919) and was conducted in accordance with the Declaration of Helsinki.
2.15. Statistical Analysis
All data were presented as mean ± standard deviation (SD) following the evaluation between groups for statistically significant relationships. To analyze differences between the two groups, Student’s t-test was used. Statistical analyses were conducted using Microsoft Excel. Differences were considered statistically significant if p < 0.05 (*).
3. Results
This section may be divided by subheadings. It should provide a concise and precise description of the experimental results, their interpretation, as well as the experimental conclusions that can be drawn.
3.1. Morphological Confirmation of Cytotoxicity and Myotube Differentiation in Corn-Derived Peptide Myoki in C2C12 Skeletal Muscle Cells
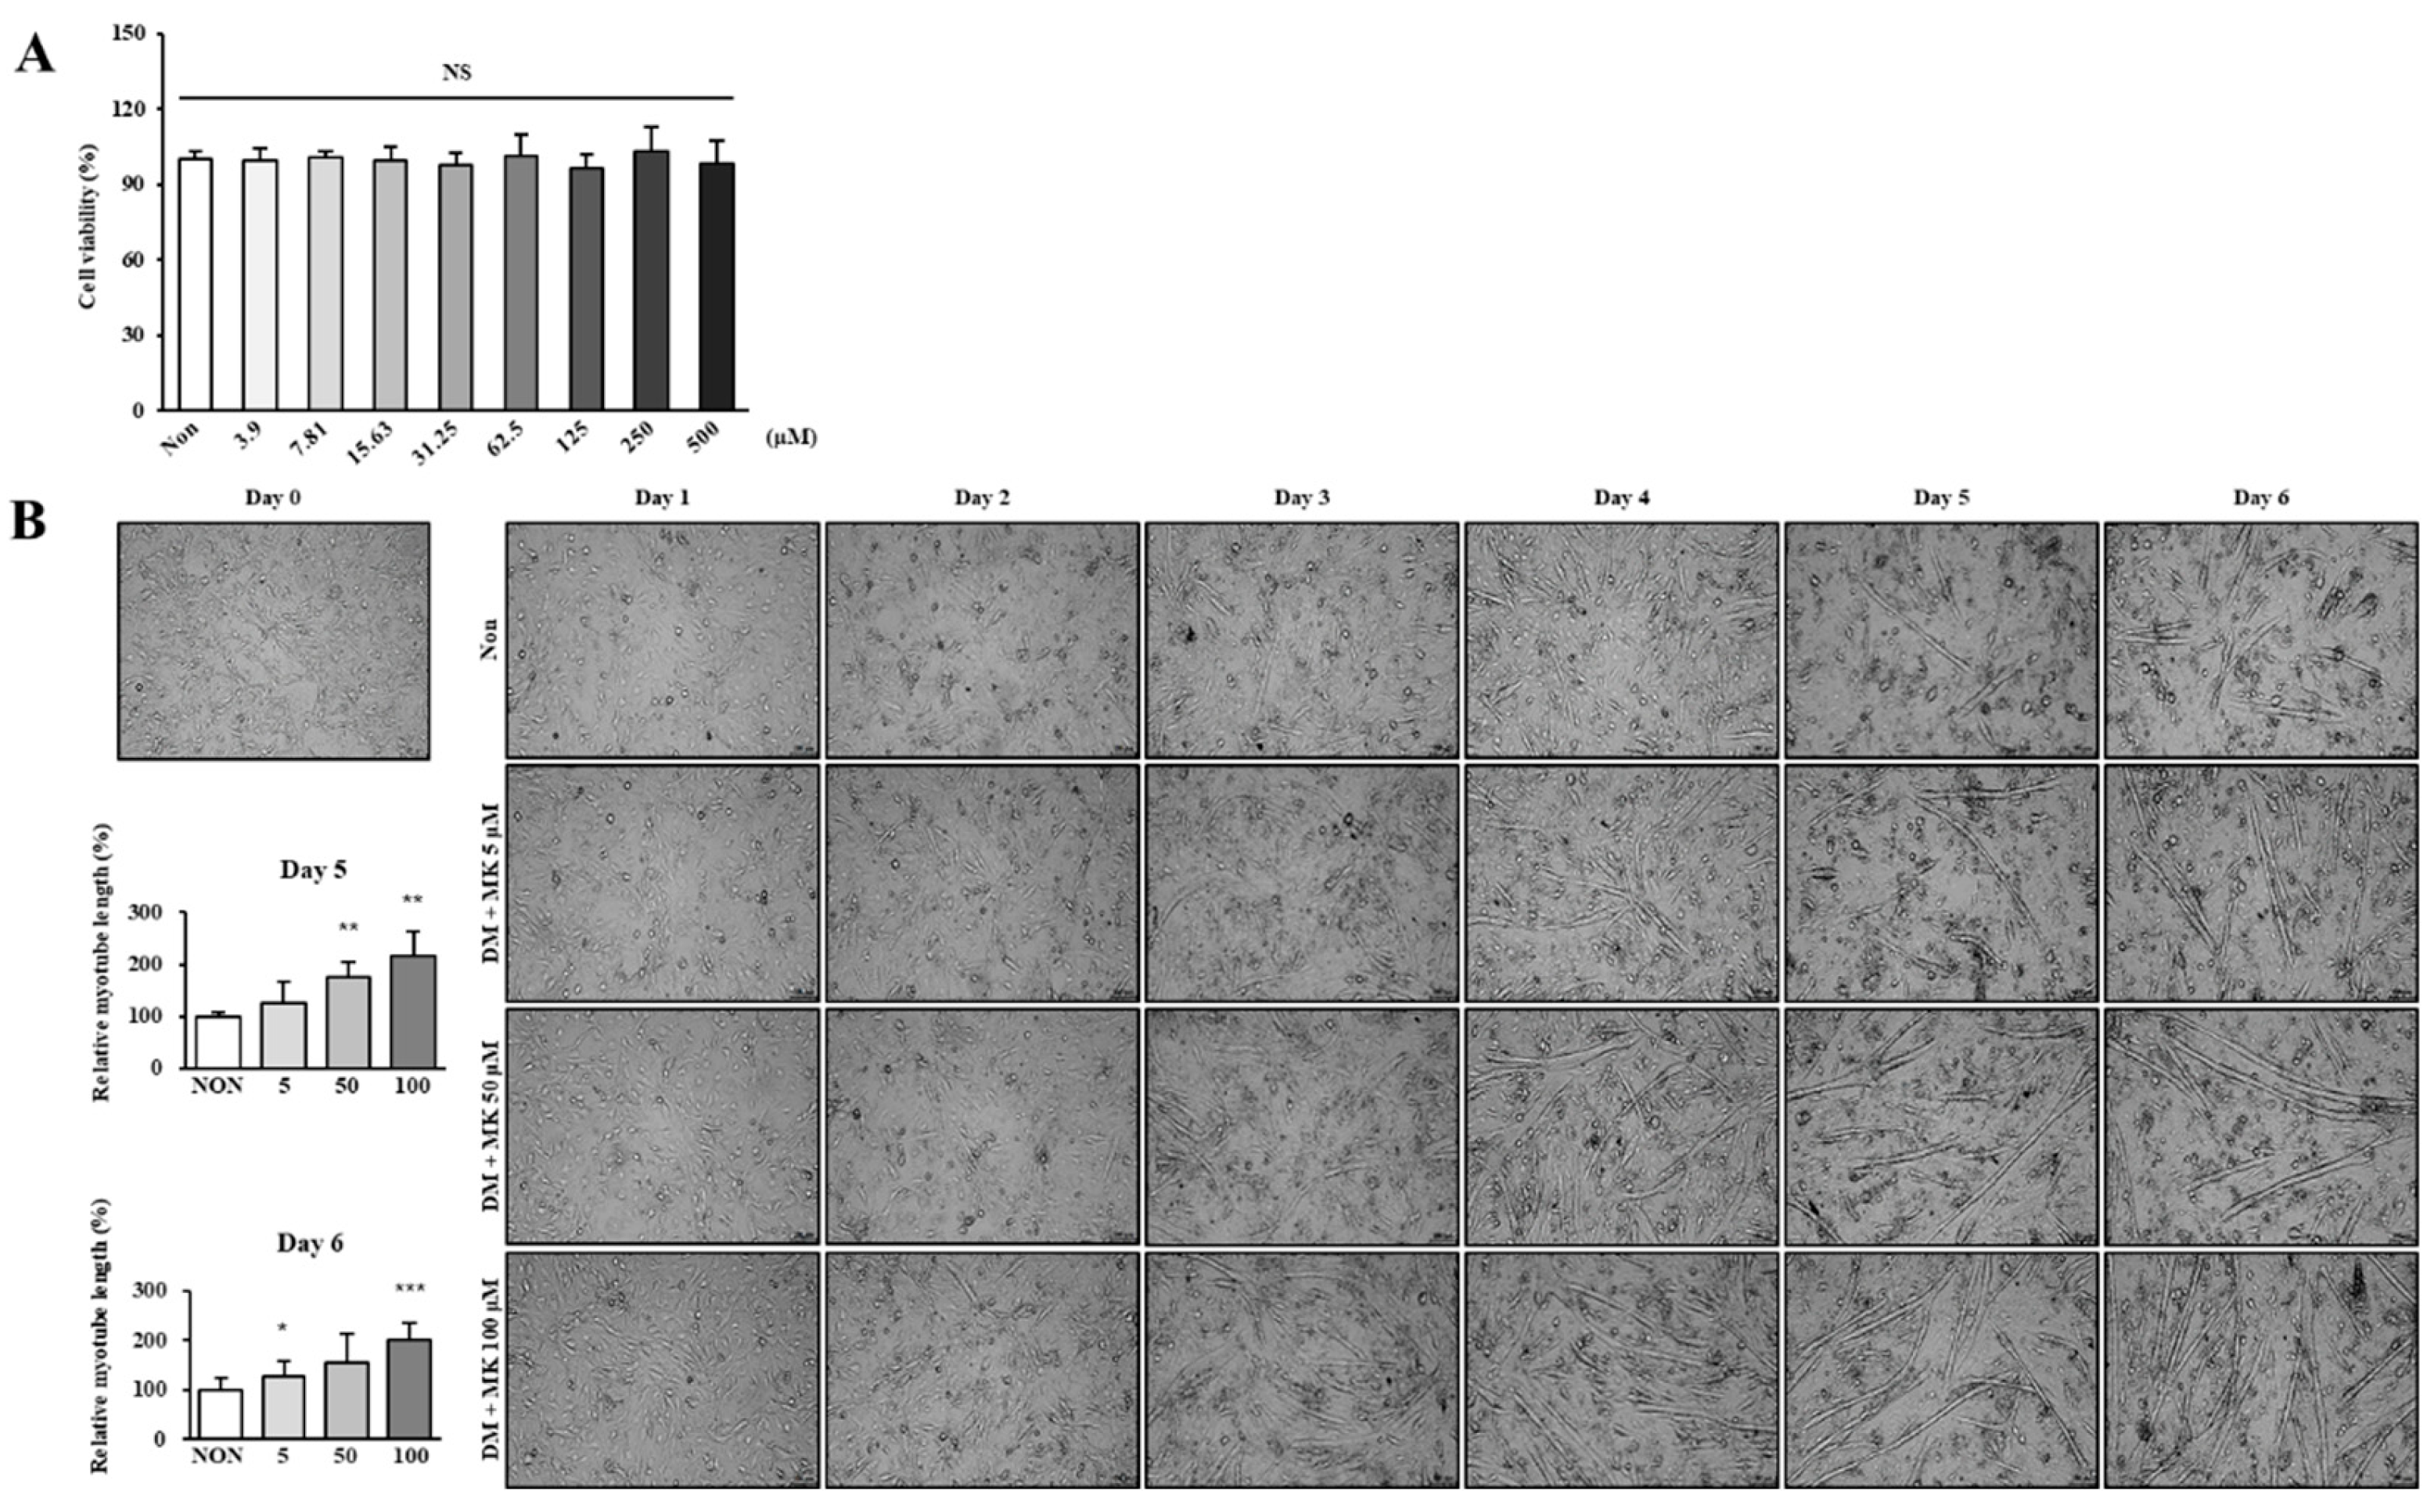
C2C12 cells were used to evaluate Myoki’s cytotoxicity. Cells were seeded on 96-well plates and incubated for 24 h, after which Myoki was administered at concentrations ranging from 0 to 500 μM and incubated again for 24 h. Cell viability was then assessed using a cell viability assay kit. As shown in Figure 1A, the decrease in cell viability at concentrations up to 500 μM was negligible, indicating that Myoki does not exhibit cytotoxicity at concentrations below 500 μM.
During muscle differentiation, myoblasts undergo proliferation and subsequently fuse to form myotube cells, which develop into mature muscle fibers. Therefore, to assess Myoki’s effect on muscle differentiation, its ability to induce myotube formation was evaluated. The experiment was conducted using the same method as the myotube formation induction assay. After treating the cells with serum, so that the Myoki concentrations were 1, 10, and 100 μM, they were incubated for 6 d. The cell images were captured using an optical microscope on Days 0, 1, 2, 3, 4, 5, and 6 of incubation (Figure 1B). In the Myoki-treated groups, myotube length increased in a concentration- and time-dependent manner. On Days 5 and 6, the 100 μM Myoki-treated group exhibited a statistically significant increase in myotube length by 217.1% and 200%, respectively, compared to the control group.
Figure 1.
Myoki does not exhibit cytotoxicity and enhances myotube formation. (A) To assess the impact of Myoki on cell viability, C2C12 cells were seeded and, after 24 hours, treated with various concentrations (3.9–500 μM) of Myoki for an additional 24 hours. Cell viability was then evaluated using the EZ-Cytox assay. (B) To investigate morphological changes following Myoki treatment, cells were cultured in differentiation medium (DM) with or without Myoki for 6 days, and phase-contrast images were acquired at 100× magnification using light microscopy. Scale bars: 100 μm. Data are expressed as means ± SD (n = 3). * p < 0.05, ** p < 0.01, *** p < 0.001 vs. Non group.
To summarize, Myoki shows no cytotoxicity up to 500 μM and promotes myotube formation in C2C12 cells in a dose- and time-dependent manner.
3.2. Increased Differentiation Marker Proteins and Myofibrillar Component Proteins in Myoki-Treated C2C12 Cells
To evaluate Myoki’s effect on the induction of C2C12 cell differentiation into myotubes, cells were cultured in differentiation medium supplemented with Myoki. On Day 3 after Myoki treatment, Western blot analysis confirmed a significant increase in the expression of differentiation marker proteins (MRFs: Myf5, Myf6, MyoD, MyoG) and differentiated muscle fiber structural proteins (alpha-actinin, MyHC) (Figure 2A). Additionally, qRT-PCR analysis of mRNA isolated on Day 3 showed a significant increase in MRF gene expression (Figure 2B). On Day 3 of the myotube differentiation stage, MyoD and MyHC were stained with fluorescent antibodies and imaged using a fluorescence microscope (Figure 2C,D). Quantitative analysis revealed that treatment with 100 μM Myoki significantly increased the expression of MyoD and MyHC by 190% and 191%, respectively, compared to the control.
On Day 6, Western blot analysis of the 100 μM Myoki-treated group showed that the expression levels of alpha-actinin and MyHC significantly increased by 818% and 307%, respectively (Figure 3A). Fluorescence staining of MyHC on Day 6 also confirmed a significant increase of 153% compared to the control (Figure 3B).
These findings indicate that Myoki treatment significantly enhances the expression of differentiation marker proteins and myofibrillar structural proteins during C2C12 myotube differentiation.
3.3. Myoki Reverses DEX-Induced Myotube Atrophy through Binding to Myostatin
An in vitro model of muscle atrophy was established by exposing C2C12 myotubes to 10 μM DEX. Myoki treatment was observed to effectively reverse the DEX-induced damage in C2C12 cells. The phosphorylation levels of muscle growth signaling proteins were significantly reduced by DEX treatment but were restored in a dose-dependent manner in the Myoki-treated groups. The expression levels of differentiated muscle fiber structural proteins were significantly decreased by DEX and recovered in a dose-dependent manner in the Myoki-treated groups (Figure 4A). Western blot analysis was performed to assess the expression levels of MAFbx and MuRF1, the proteins essential for activating the ubiquitin-proteasome system of muscle protein degradation, and a significant increase was found in the DEX-treated group in contrast to the control group. However, in the Myoki-treated groups, their expression levels were significantly reduced in a dose-dependent manner (Figure 4B). These findings suggest that Myoki might block the myotube atrophy pathway induced by DEX and facilitate the recovery from muscle atrophy. Based on this, the mechanism of Myoki's myostatin-inhibitory activity was further investigated by confirming its binding to myostatin. To determine the binding affinity between the Myoki peptide complex and human myostatin, SPR analysis was performed using the Biacore T200 system (GE Healthcare). It was verified that the peptide binds to MSTN. Seven different concentrations of the peptide, ranging from 3.125 μM to 200 μM, were injected over a CM5 chip immobilized with MSTN-Fc, and SPR sensorgrams were obtained. Although relatively rapid association and dissociation were observed, the RUs increased in a dose-dependent manner (Figure 4C). Additionally, a receptor binding assay was performed using ELISA. The results showed that Myoki directly binds to myostatin in a concentration-dependent manner. Myoki at concentrations of 125, 250, 500, and 1000 μM and the myostatin receptor activin receptor 2B (activin R2B) at concentrations of 2.18, 4.36, 8.72, and 17.44 nM were coated on ELISA plates. Upon myostatin treatment, Myoki significantly enhanced binding to myostatin by more than 150% compared to the control group, which was observed at concentrations equal to and greater than 62.5 μM (Figure 4E).
In summary, Myoki effectively reverses DEX-induced myotube atrophy by dose-dependently restoring protein synthesis-related signaling and structural proteins, while directly binding to and inhibiting myostatin.
3.4. Myoki Induces Recovery from Sarcopenia and Aging in Accelerated Aging Animal Model
The experiment, which was designed and carried out as shown in Figure 5A, used the accelerated aging mouse model SAMP8. H&E staining of Gas and Quad muscles isolated from the legs of experimental mice was used as a critical and straightforward assessment of muscle fiber density and thickness. In the SAMP8 group, the thickness of the muscle fiber bundles in both Gas and Quad was significantly lower than in the SAMR1 group. However, in mice treated with Myoki, the thickness of the muscle fiber bundles in both Gas and Quad was significantly higher than in the SAMP8 group (Figure 5B). To evaluate muscle aging, Sirius Red staining was conducted in Gas and Quad to assess the extent of collagen accumulation between muscle fibers, which serves as a marker of muscle fiber aging. The analysis revealed that the SAMP8 group exhibited substantially greater collagen formation between the muscle fibers of Gas and Quad compared to the SAMR1 group. However, in the Myoki-treated group, collagen accumulation in Gas significantly decreased from 281% in the SAMP8 group to 207%. Quad reduced from 185% in the SAMP8 group to 151% in the Myoki-treated group, but the difference was not statistically significant (Figure 5C).
Overall, Myoki treatment improved muscle fiber thickness and reduced collagen accumulation, suggesting its potential to mitigate muscle aging in the SAMP8 mouse model.
3.5. Myoki Induces Regulation and Recovery of Myostatin Expression in Sarcopenia Animal Model with Accelerated Aging
Myoki’s effect on myostatin expression was examined in an accelerated aging animal model of sarcopenia, the SAMP8 mouse model, from the experiment conducted as outlined in Figure 5A. Fluorescence staining was performed on Gas and Quad muscles harvested from mice to assess the expression changes of myostatin and MAFbx, a key component protein of the ubiquitin-proteasome system regulated by myostatin. The results indicated that the protein expression levels of myostatin and MAFbx were significantly increased in both Gas and Quad muscles of the SAMP8 group compared to the SAMR1 group. Notably, in the Myoki-treated group, the expression levels were significantly restored to those of the SAMR1 group (Figure 6A,B). Furthermore, fast myosin heavy chain (fast-MyHC), a major contractile protein and a marker of fast-twitch muscle fibers in skeletal muscle, was reduced in the SAMP8 group but restored to SAMR1 levels after Myoki treatment (Figure 6C).
In summary, Myoki treatment effectively restored muscle protein expression and fiber composition altered by sarcopenia in the SAMP8 mouse model.
3.6. Randomized, Double-Blind, Placebo-Controlled, Parallel Study to Evaluate Efficacy and Safety of Myoki in Muscle Atrophy Patients
To evaluate the clinical efficacy and safety of the Myoki peptide, a 12-week randomized, double-blind, placebo-controlled, parallel study was conducted in 80 patients with muscle atrophy (Figure 7).
The study compared the effects of Myoki with a mixture of arginine and maltodextrin on changes in muscle mass, hand grip strength, and physical performance. The analysis from baseline to 12 weeks revealed a least squares (LS) mean difference in muscle mass of 0.13 kg/m² between the Myoki and placebo groups, indicating a greater increase in muscle mass for the Myoki group compared to the control during the study period. The LS mean difference in the time to complete the 6-m walk test (TTC-6mWT) between the two groups was –0.34 s, demonstrating better walking performance in the Myoki-treated group compared to the control group. The LS mean difference in hand grip strength between the Myoki and control groups was 0.43 kg, suggesting a greater increase in grip strength in the Myoki group. The p-values for the mean differences in TNF-α, estrogen, testosterone, and IL-6 were >0.05, indicating no statistically significant differences between the two groups for these markers. In contrast, the p-values for IGF-I, myoglobin, creatine kinase, and aspartate aminotransferase were all <0.05, indicating statistically significant differences between the Myoki and control groups for these biomarkers (Table 1).
In conclusion, Myoki peptide demonstrated significant efficacy in enhancing muscle mass, strength, and function in muscle atrophy patients.
4. Discussion
This study investigated the effects of the corn-derived peptide Myoki on muscle formation and muscle atrophy. The results from our in vitro assays, an accelerated aging mouse model, and a clinical trial with muscle atrophy patients demonstrated that Myoki could inhibit muscle atrophy by binding to myostatin. This mechanism aligns with prior findings where inhibition of myostatin has been shown to induce muscle hypertrophy and prevent atrophy in various models [20,21]. Additionally, clinical outcomes revealed that Myoki significantly improved muscle strength and physical function in muscle atrophy patients compared to placebo. These improvements are consistent with previous studies demonstrating that targeting myostatin pathways can enhance muscle performance in elderly or atrophic populations [22,23]. These findings provide experimental evidence supporting the therapeutic potential of Myoki in muscle-related disorders and suggest its promise as a potential treatment for muscle atrophy and sarcopenia.
First, Myoki was confirmed to be non-cytotoxic even at a concentration of 500 μM. Notably, at 100 μM—one-fifth the concentration of the non-toxic threshold—Myoki significantly increased myotube length and upregulated muscle differentiation marker proteins, such as MyoD and MyoG, as well as structural muscle proteins, including MyHC and alpha-actinin. Similar effects have been observed with vitamin D and creatine, both of which are well-known for enhancing muscle synthesis and strength [24,25]. These substances promote muscle growth by modulating myogenic regulatory factors (MRFs), including MyoD and MyoG. These findings suggest that Myoki can effectively promote myogenic differentiation and facilitate muscle fiber formation in C2C12 cells, even at low doses.
Another important finding is Myoki’s ability to effectively suppress muscle atrophy. Myostatin decreases the expression of MyoD and myogenin, and induces the expression of Atrogin-1 and MuRF1, thereby regulating proteasome-mediated degradation. [26,27]. Myoki significantly reduced the expression of myostatin, a key negative regulator of muscle growth, not only in the DEX-induced muscle atrophy model but also in the accelerated aging animal model. Furthermore, the expression of Atrogin-1 and MuRF1—downstream components of the myostatin signaling pathway—significantly decreased. SPR and ELISA-based receptor binding assays confirmed a high binding affinity between Myoki and Myostatin. These findings suggest that Myoki may attenuate excessive activation of the myostatin-mediated ubiquitin-proteasome system, thereby reducing unnecessary protein degradation and alleviating muscle loss. AKT/mTOR signaling pathway plays a vital role in regulating skeletal muscle hypertrophy and mitigating muscle atrophy [28,29]. Myoki restored phosphorylation of key signaling proteins such as p-mTOR, p-AKT, and p-p70S6K, which promotes protein synthesis. Therefore, Myoki has the potential to enhance muscle protein synthesis while simultaneously suppressing protein degradation pathways.
The SAMP8 mouse model is widely used in aging research owing to its presentation of various age-related physiological changes and cognitive decline [30,31,32]. This model exhibits characteristics such as oxidative stress, inflammation, and muscle atrophy, making it a valuable tool for studying age-related diseases [33,34]. In this aging model, Myoki significantly increased muscle fiber thickness and effectively improved fibrotic muscle tissue. Additionally, the recovery of fast-MyHC expression indicated that Myoki contributes to structural restoration and positively affects the functional properties of muscle. These findings were further supported by the findings from our clinical research. Myoki demonstrated significant efficacy in our clinical study involving muscle atrophy patients. Participants who received Myoki treatment showed significant improvements in muscle mass, hand grip strength, and walking speed, which may contribute to the improvement of mobility and quality of life. IGF-I levels, which play a critical role in muscle growth [35], also increased. Additionally, Myoki reduced levels of myoglobin and creatine kinase that are known to increase during excessive muscle damage [36,37], suggesting its potential role in muscle recovery. To summarize, Myoki treatment can effectively suppress the progression of muscle atrophy.
Despite the encouraging results, several important limitations must be taken into account when interpreting the findings of this study. One major concern is the incomplete understanding of the molecular mechanisms through which Myoki exerts its effects. While myostatin inhibition appears to be the primary mechanism, muscle homeostasis is governed by a broader and highly complex signaling network. Whether Myoki also influences alternative pathways or induces compensatory responses remains to be fully elucidated. Another key limitation lies in the clinical trial component, which, despite promising outcomes, was constrained in both scope and duration. The observed improvements in muscle mass, strength, and function were drawn from a relatively small participant pool over a short follow-up period. Consequently, it remains uncertain whether these benefits are sustainable over the long term or translate into meaningful clinical outcomes, such as improved mobility, reduced fall risk, or enhanced quality of life. Lastly, Myoki was not evaluated alongside standard therapeutic strategies such as resistance training or nutritional supplementation, both of which are widely recommended for managing muscle atrophy and sarcopenia. Therefore, it remains unclear whether Myoki provides any additional benefit beyond these conventional treatments or produces synergistic effects when used in combination.
5. Conclusions
In summary, the corn-derived peptide Myoki was shown to promote myogenesis and suppress muscle atrophy in C2C12 myoblasts by binding to myostatin. It also reduced aging-related muscle atrophy markers in muscle tissues of an aged mouse model. Additionally, in a clinical study involving patients with muscle atrophy, Myoki significantly improved muscle mass, muscle strength, walking speed, and blood biomarkers. Thus, preclinical and clinical studies demonstrated the positive impact of Myoki in suppressing muscle atrophy consistently and its potential as a promising therapeutic strategy for conditions such as sarcopenia and muscle atrophy.
Author Contributions
Conceptualization, Eun mi Kim, Seon Soo Kim and Yong Ji Chung; Data curation, Eun mi Kim, Seon Soo Kim, Yong Geon Hyun, Su Yeon Lee and Yong Ji Chung; Formal analysis, Yong Geon Hyun and Su Yeon Lee; Funding acquisition, Yong Ji Chung; Investigation, Eun mi Kim, Seon Soo Kim, Yong Geon Hyun, Su Yeon Lee and Yong Ji Chung; Methodology, Eun mi Kim, Seon Soo Kim, Yong Geon Hyun, Su Yeon Lee and Yong Ji Chung; Project administration, Eun mi Kim and Yong Ji Chung; Supervision, Eun mi Kim, Seon Soo Kim and Yong Ji Chung; Validation, Eun mi Kim, Seon Soo Kim, Yong Geon Hyun, Su Yeon Lee and Yong Ji Chung; Visualization, Yong Geon Hyun and Su Yeon Lee; Writing – original draft, Eun mi Kim, Seon Soo Kim, Yong Geon Hyun, Su Yeon Lee and Yong Ji Chung; Writing – review & editing, Eun mi Kim, Seon Soo Kim, Yong Geon Hyun, Su Yeon Lee and Yong Ji Chung.Funding: This research received no external funding.
Institutional Review Board Statement
Animal care and experimental protocols were approved by the Institutional Animal Care and Use Committee (approval number CG-R22-001). Clinical study was reviewed and approved by the Ethics Committee (Reg. No: CTRI/2024/01/061919) and was conducted in accordance with the Declaration of Helsinki.
Informed Consent Statement
Informed consent was obtained from all subjects involved in the study.
Data Availability Statement
Data supporting the findings of this study are available upon reasonable request from the corresponding author.
Acknowledgments
The authors are deeply grateful to all the study participants and the hospital staff for their valuable cooperation and support throughout the course of this clinical study.
Conflicts of Interest
The authors declare no conflicts of interest.
Abbreviations
The following abbreviations are used in this manuscript:
| AKT | Protein Kinase B |
| AST | Aspartate Aminotransferase |
| BSA | Bovine Serum Albumin |
| CDSCO | Central Drugs Standard Control Organization |
| DAPI | 4′,6-diamidino-2-phenylindole |
| DEX | Dexamethasone |
| DEXA | Dual-Energy X-ray Absorptiometry |
| DMEM | Dulbecco’s Modified Eagle’s Medium |
| ECL | Enhanced Chemiluminescence |
| EDC | 1-Ethyl-3-(3-dimethylaminopropyl)carbodiimide |
| ELISA | Enzyme-Linked Immunosorbent Assay |
| ESI | Electrospray Ionization |
| EtBr | Ethidium Bromide |
| FBS | Fetal Bovine Serum |
| GAPDH | Glyceraldehyde 3-Phosphate Dehydrogenase |
| Gas | Gastrocnemius muscle |
| H&E | Hematoxylin and Eosin |
| HBS-EP | Hepes Buffered Saline with EDTA and P20 |
| HPLC | High-Performance Liquid Chromatography |
| HRP | Horseradish Peroxidase |
| IGF-I | Insulin-like Growth Factor I |
| IgG | Immunoglobulin G |
| IHC | Immunohistochemistry |
| IL-6 | Interleukin-6 |
| LC/MS/MS | Liquid Chromatography with Tandem Mass Spectrometry |
| LS | Least Squares |
| MAFbx | Muscle Atrophy F-box protein |
| MRFs | Myogenic Regulatory Factors |
| MS/MS | Tandem Mass Spectrometry |
| MSTN | Myostatin |
| mTOR | Mechanistic Target of Rapamycin |
| MuRF1 | Muscle RING Finger-1 |
| Myf5 | Myogenic Factor 5 |
| Myf6 | Myogenic Factor 6 |
| MyHC | Myosin Heavy Chain |
| MyoD | Myoblast determination protein 1 |
| NHS | N-Hydroxysuccinimide |
| p70S6K | Ribosomal protein S6 kinase beta-1 |
| PBS | Phosphate-Buffered Saline |
| PVDF | Polyvinylidene Fluoride |
| Quad | Quadriceps muscle |
| R2B | Activin Receptor Type-2B |
| RT-PCR | Reverse Transcription Polymerase Chain Reaction |
| RUs | Response Units |
| SAMP8 | Senescence-Accelerated Mouse Prone 8 |
| SAMR1 | Senescence-Accelerated Mouse Resistant 1 |
| SDS-PAGE | Sodium Dodecyl Sulfate–Polyacrylamide Gel Electrophoresis |
| SPR | Surface Plasmon Resonance |
| TMB | 3,3',5,5'-Tetramethylbenzidine |
| TNF-α | Tumor Necrosis Factor-alpha |
| TRS | Target Retrieval Solution |
| TTC-6mWT | Time to Complete 6-meter Walk Test |
References
- Beaudart, C.; Rizzoli, R.; Bruyère, O.; Reginster, J.-Y.; Biver, E. Sarcopenia: burden and challenges for public health. Archives of public health 2014, 72, 1-8. https://doi.org/10.1186/2049-3258-72-45.
- Zhang, Y.; Guo, J.-y.; Wang, F.; Li, C.-w.; Yu, K. Start with muscle mass or muscle strength in diagnosis and management of sarcopenia? A systematic review of guidance documents. Asia Pacific Journal of Clinical Nutrition 2024, 33 (2), 247. [CrossRef]
- Cruz-Jentoft, A. J.; Bahat, G.; Bauer, J.; Boirie, Y.; Bruyère, O.; Cederholm, T.; Cooper, C.; Landi, F.; Rolland, Y.; Sayer, A. A. Sarcopenia: revised European consensus on definition and diagnosis. Age and ageing 2019, 48 (1), 16-31. [CrossRef]
- Beaudart, C.; Zaaria, M.; Pasleau, F.; Reginster, J.-Y.; Bruyère, O. Health outcomes of sarcopenia: a systematic review and meta-analysis. PloS one 2017, 12 (1), e0169548. [CrossRef]
- Wang, T.; Zhou, D.; Hong, Z. Sarcopenia and cachexia: molecular mechanisms and therapeutic interventions. MedComm 2025, 6 (1), e70030. [CrossRef]
- Yablonka-Reuveni, Z. The skeletal muscle satellite cell: still young and fascinating at 50. Journal of Histochemistry & Cytochemistry 2011, 59 (12), 1041-1059.
- Sandri, M. Signaling in muscle atrophy and hypertrophy. Physiology 2008, 23 (3), 160-170. [CrossRef]
- Bodine, S. C.; Latres, E.; Baumhueter, S.; Lai, V. K.-M.; Nunez, L.; Clarke, B. A.; Poueymirou, W. T.; Panaro, F. J.; Na, E.; Dharmarajan, K. Identification of ubiquitin ligases required for skeletal muscle atrophy. Science 2001, 294 (5547), 1704-1708. [CrossRef]
- Zammit, P. S. Function of the myogenic regulatory factors Myf5, MyoD, Myogenin and MRF4 in skeletal muscle, satellite cells and regenerative myogenesis. In Seminars in cell & developmental biology, 2017; Elsevier: Vol. 72, pp 19-32. [CrossRef]
- Segalés, J.; Perdiguero, E.; Muñoz-Cánoves, P. Epigenetic control of adult skeletal muscle stem cell functions. The FEBS journal 2015, 282 (9), 1571-1588. [CrossRef]
- Rudnicki, M. A.; Schnegelsberg, P. N.; Stead, R. H.; Braun, T.; Arnold, H.-H.; Jaenisch, R. MyoD or Myf-5 is required for the formation of skeletal muscle. Cell 1993, 75 (7), 1351-1359. [CrossRef]
- Rodriguez, J.; Vernus, B.; Chelh, I.; Cassar-Malek, I.; Gabillard, J.-C.; Hadj Sassi, A.; Seiliez, I.; Picard, B.; Bonnieu, A. Myostatin and the skeletal muscle atrophy and hypertrophy signaling pathways. Cellular and molecular life sciences 2014, 71, 4361-4371. [CrossRef]
- Trendelenburg, A. U.; Meyer, A.; Rohner, D.; Boyle, J.; Hatakeyama, S.; Glass, D. J. Myostatin reduces Akt/TORC1/p70S6K signaling, inhibiting myoblast differentiation and myotube size. American Journal of Physiology-Cell Physiology 2009, 296 (6), C1258-C1270. [CrossRef]
- Elkina, Y.; von Haehling, S.; Anker, S. D.; Springer, J. The role of myostatin in muscle wasting: an overview. Journal of cachexia, sarcopenia and muscle 2011, 2, 143-151. [CrossRef]
- Lokireddy, S.; Mouly, V.; Butler-Browne, G.; Gluckman, P. D.; Sharma, M.; Kambadur, R.; McFarlane, C. Myostatin promotes the wasting of human myoblast cultures through promoting ubiquitin-proteasome pathway-mediated loss of sarcomeric proteins. American Journal of Physiology-Cell Physiology 2011, 301 (6), C1316-C1324. [CrossRef]
- McFarlane, C.; Plummer, E.; Thomas, M.; Hennebry, A.; Ashby, M.; Ling, N.; Smith, H.; Sharma, M.; Kambadur, R. Myostatin induces cachexia by activating the ubiquitin proteolytic system through an NF-κB-independent, FoxO1-dependent mechanism. Journal of cellular physiology 2006, 209 (2), 501-514.
- Bogdanovich, S.; Krag, T. O.; Barton, E. R.; Morris, L. D.; Whittemore, L.-A.; Ahima, R. S.; Khurana, T. S. Functional improvement of dystrophic muscle by myostatin blockade. Nature 2002, 420 (6914), 418-421. [CrossRef]
- McPherron, A. C.; Lee, S.-J. Double muscling in cattle due to mutations in the myostatin gene. Proceedings of the National Academy of Sciences 1997, 94 (23), 12457-12461. [CrossRef]
- Grobet, L.; Royo Martin, L. J.; Poncelet, D.; Pirottin, D.; Brouwers, B.; Riquet, J.; Schoeberlein, A.; Dunner, S.; Ménissier, F.; Massabanda, J. A deletion in the bovine myostatin gene causes the double–muscled phenotype in cattle. Nature genetics 1997, 17 (1), 71-74. [CrossRef]
- Lee, S.-J.; McPherron, A. C. Regulation of myostatin activity and muscle growth. Proceedings of the National Academy of Sciences 2001, 98 (16), 9306-9311.
- Amthor, H.; Otto, A.; Vulin, A.; Rochat, A.; Dumonceaux, J.; Garcia, L.; Mouisel, E.; Hourdé, C.; Macharia, R.; Friedrichs, M. Muscle hypertrophy driven by myostatin blockade does not require stem/precursor-cell activity. Proceedings of the National Academy of Sciences 2009, 106 (18), 7479-7484. [CrossRef]
- Rooks, D.; Roubenoff, R. Development of Pharmacotherapies for the Treatment of Sarcopenia. The Journal of frailty & aging 2019, 8 (3), 120-130. [CrossRef]
- Lee, S.-J.; Bhasin, S.; Klickstein, L.; Krishnan, V.; Rooks, D. Challenges and future prospects of targeting myostatin/activin A signaling to treat diseases of muscle loss and metabolic dysfunction. The Journals of Gerontology: Series A 2023, 78 (Supplement_1), 32-37. [CrossRef]
- Braga, M.; Simmons, Z.; Norris, K. C.; Ferrini, M. G.; Artaza, J. N. Vitamin D induces myogenic differentiation in skeletal muscle derived stem cells. Endocrine Connections 2017, 6 (3), 139-150. [CrossRef]
- Deldicque, L.; Theisen, D.; Bertrand, L.; Hespel, P.; Hue, L.; Francaux, M. Creatine enhances differentiation of myogenic C2C12 cells by activating both p38 and Akt/PKB pathways. American Journal of Physiology-Cell Physiology 2007, 293 (4), C1263-C1271. [CrossRef]
- Lokireddy, S.; McFarlane, C.; Ge, X.; Zhang, H.; Sze, S. K.; Sharma, M.; Kambadur, R. Retraction: Myostatin induces degradation of sarcomeric proteins through a Smad3 signaling mechanism during skeletal muscle wasting. Molecular endocrinology 2011, 25 (11), 1936-1949. [CrossRef]
- Durieux, A.-C. c.; Amirouche, A.; Banzet, S. b.; Koulmann, N.; Bonnefoy, R. g.; Pasdeloup, M.; Mouret, C.; Bigard, X.; Peinnequin, A.; Freyssenet, D. Ectopic expression of myostatin induces atrophy of adult skeletal muscle by decreasing muscle gene expression. Endocrinology 2007, 148 (7), 3140-3147. [CrossRef]
- Bodine, S. C.; Stitt, T. N.; Gonzalez, M.; Kline, W. O.; Stover, G. L.; Bauerlein, R.; Zlotchenko, E.; Scrimgeour, A.; Lawrence, J. C.; Glass, D. J. Akt/mTOR pathway is a crucial regulator of skeletal muscle hypertrophy and can prevent muscle atrophy in vivo. Nature cell biology 2001, 3 (11), 1014-1019. [CrossRef]
- Kitakaze, T.; Sakamoto, T.; Kitano, T.; Inoue, N.; Sugihara, F.; Harada, N.; Yamaji, R. The collagen derived dipeptide hydroxyprolyl-glycine promotes C2C12 myoblast differentiation and myotube hypertrophy. Biochemical and biophysical research communications 2016, 478 (3), 1292-1297. [CrossRef]
- Okuma, Y.; Nomura, Y. Senescence-accelerated mouse (SAM) as an animal model of senile dementia: pharmacological, neurochemical and molecular biological approach. The Japanese Journal of Pharmacology 1998, 78 (4), 399-404.
- Liu, B.; Liu, J.; Shi, J.-S. SAMP8 mice as a model of age-related cognition decline with underlying mechanisms in Alzheimer’s disease. Journal of Alzheimer’s Disease 2020, 75 (2), 385-395. [CrossRef]
- Morita, Y.; Ishida, T.; Morisawa, S.; Jobu, K.; Ou, Y.; Fujita, H.; Hanazaki, K.; Miyamura, M. Juzentaihoto suppresses muscle atrophy and decreased motor function in SAMP8 mice. Biological and Pharmaceutical Bulletin 2021, 44 (1), 32-38. [CrossRef]
- Bayram, B.; Nikolai, S.; Huebbe, P.; Ozcelik, B.; Grimm, S.; Grune, T.; Frank, J.; Rimbach, G. Biomarkers of oxidative stress, antioxidant defence and inflammation are altered in the senescence-accelerated mouse prone 8. Age 2013, 35, 1205-1217. [CrossRef]
- Yun, G. A.; Leung, K. S.; Siu, P. M. F.; Qin, J. H.; Chow, S. K. H.; Qin, L.; Li, C. Y. Muscle mass, structural and functional investigations of senescence-accelerated mouse P8 (SAMP8). Experimental animals 2015, 64 (4), 425-433. [CrossRef]
- Yoshida, T.; Delafontaine, P. Mechanisms of IGF-1-mediated regulation of skeletal muscle hypertrophy and atrophy. Cells 2020, 9 (9), 1970. [CrossRef]
- Baird, M. F.; Graham, S. M.; Baker, J. S.; Bickerstaff, G. F. Creatine-kinase-and exercise-related muscle damage implications for muscle performance and recovery. Journal of nutrition and metabolism 2012, 2012 (1), 960363. [CrossRef]
- Driessen-Kletter, M.; Amelink, G.; Bär, P.; Van Gijn, J. Myoglobin is a sensitive marker of increased muscle membrane vulnerability. Journal of neurology 1990, 237, 234-238. [CrossRef]
Figure 2.
Myoki increases the expression of myogenic regulatory factors (MRFs) in C2C12 muscle cells. C2C12 myoblasts were cultured in DM with or without Myoki for 3 days. (A) Protein expression levels of Myf5, MyoD, MyoG, α-actinin, and myosin heavy chain (MyHC) were assessed by western blotting. (B) mRNA levels of Myf5, Myf6, MyoD, and MyoG were evaluated by RT-PCR, and visualized by agarose gel electrophoresis. Immunofluorescence staining was performed to detect (C) MyoD and (D) MyHC expression. Fluorescence intensity was quantified using ImageJ software. Scale bars: 25 μm (MyoD), 50 μm (MyHC). Data are expressed as means ± SD (n = 3). * p < 0.05, ** p < 0.01, *** p < 0.001 vs. Non group.
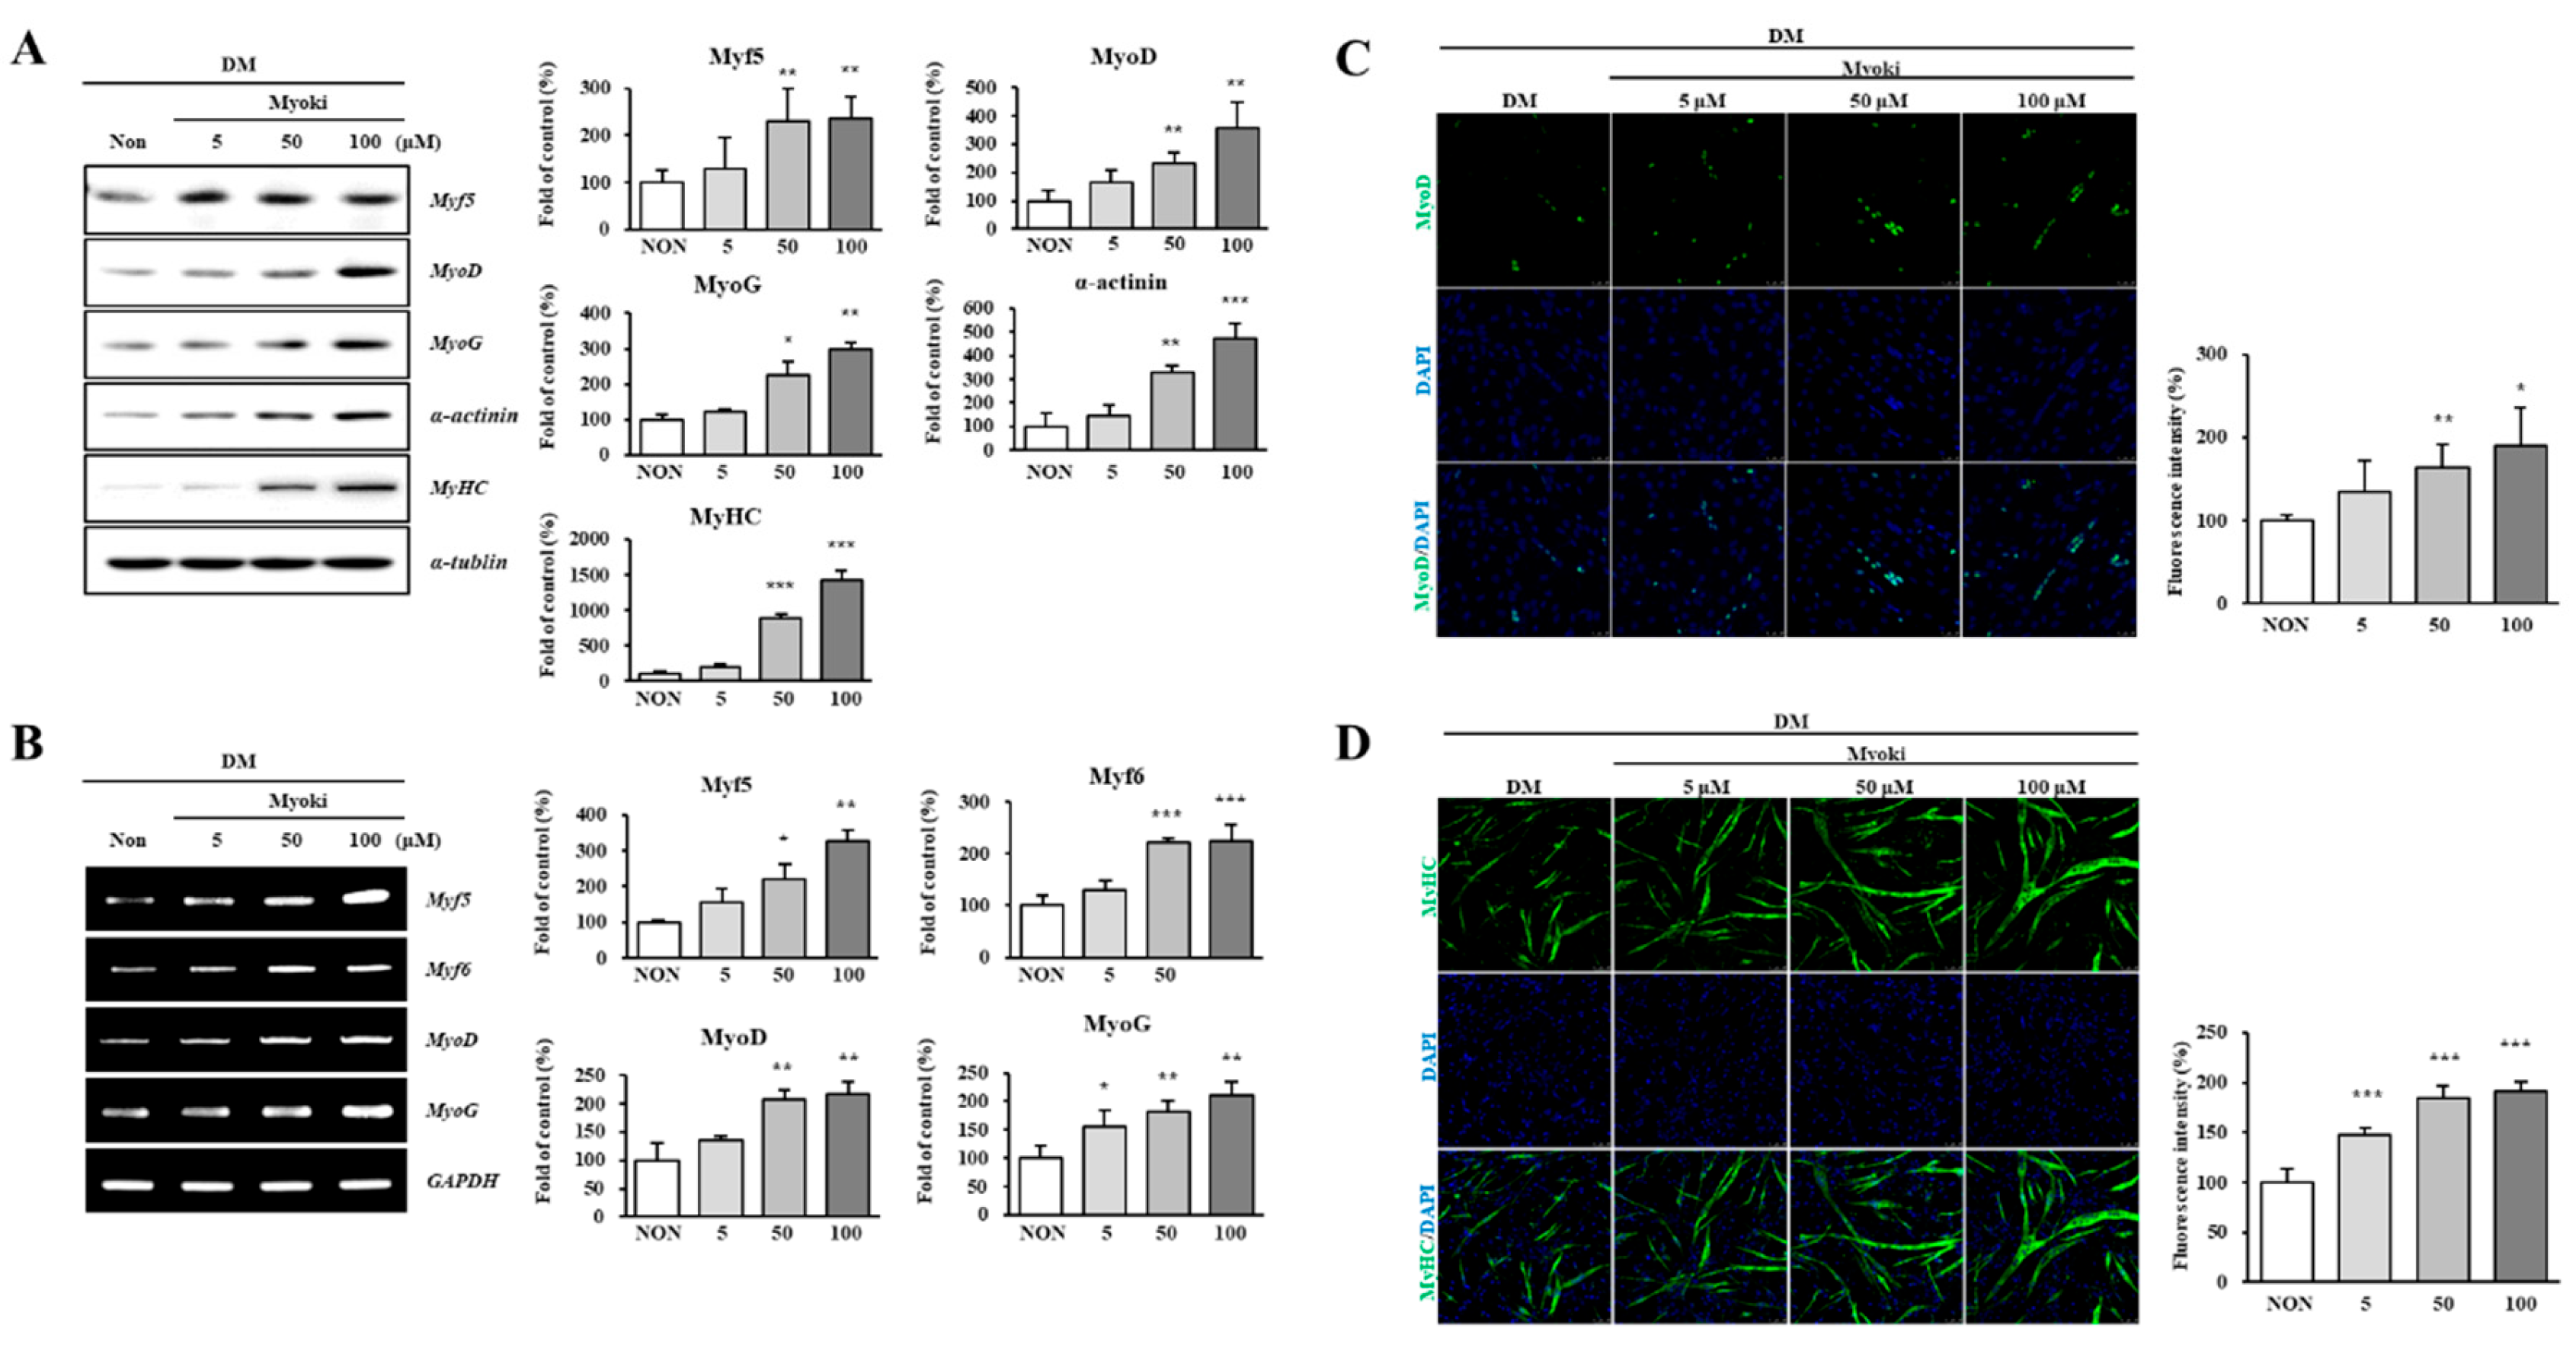
Figure 3.
Myoki enhances the expression of key proteins that constitute the myofiber. C2C12 cells were cultured in DM with or without Myoki (5, 50, and 100 μM) for 6 days. (A) The expression levels of α-actinin and myosin heavy chain (MyHC) were assessed by western blotting. (B) MyHC expression was further evaluated by immunofluorescence staining under the same conditions. Fluorescence intensity was quantified using ImageJ software. Scale bars: 50 μm. Data are expressed as means ± SD (n = 3). * p < 0.05, ** p < 0.01 vs. Non group.
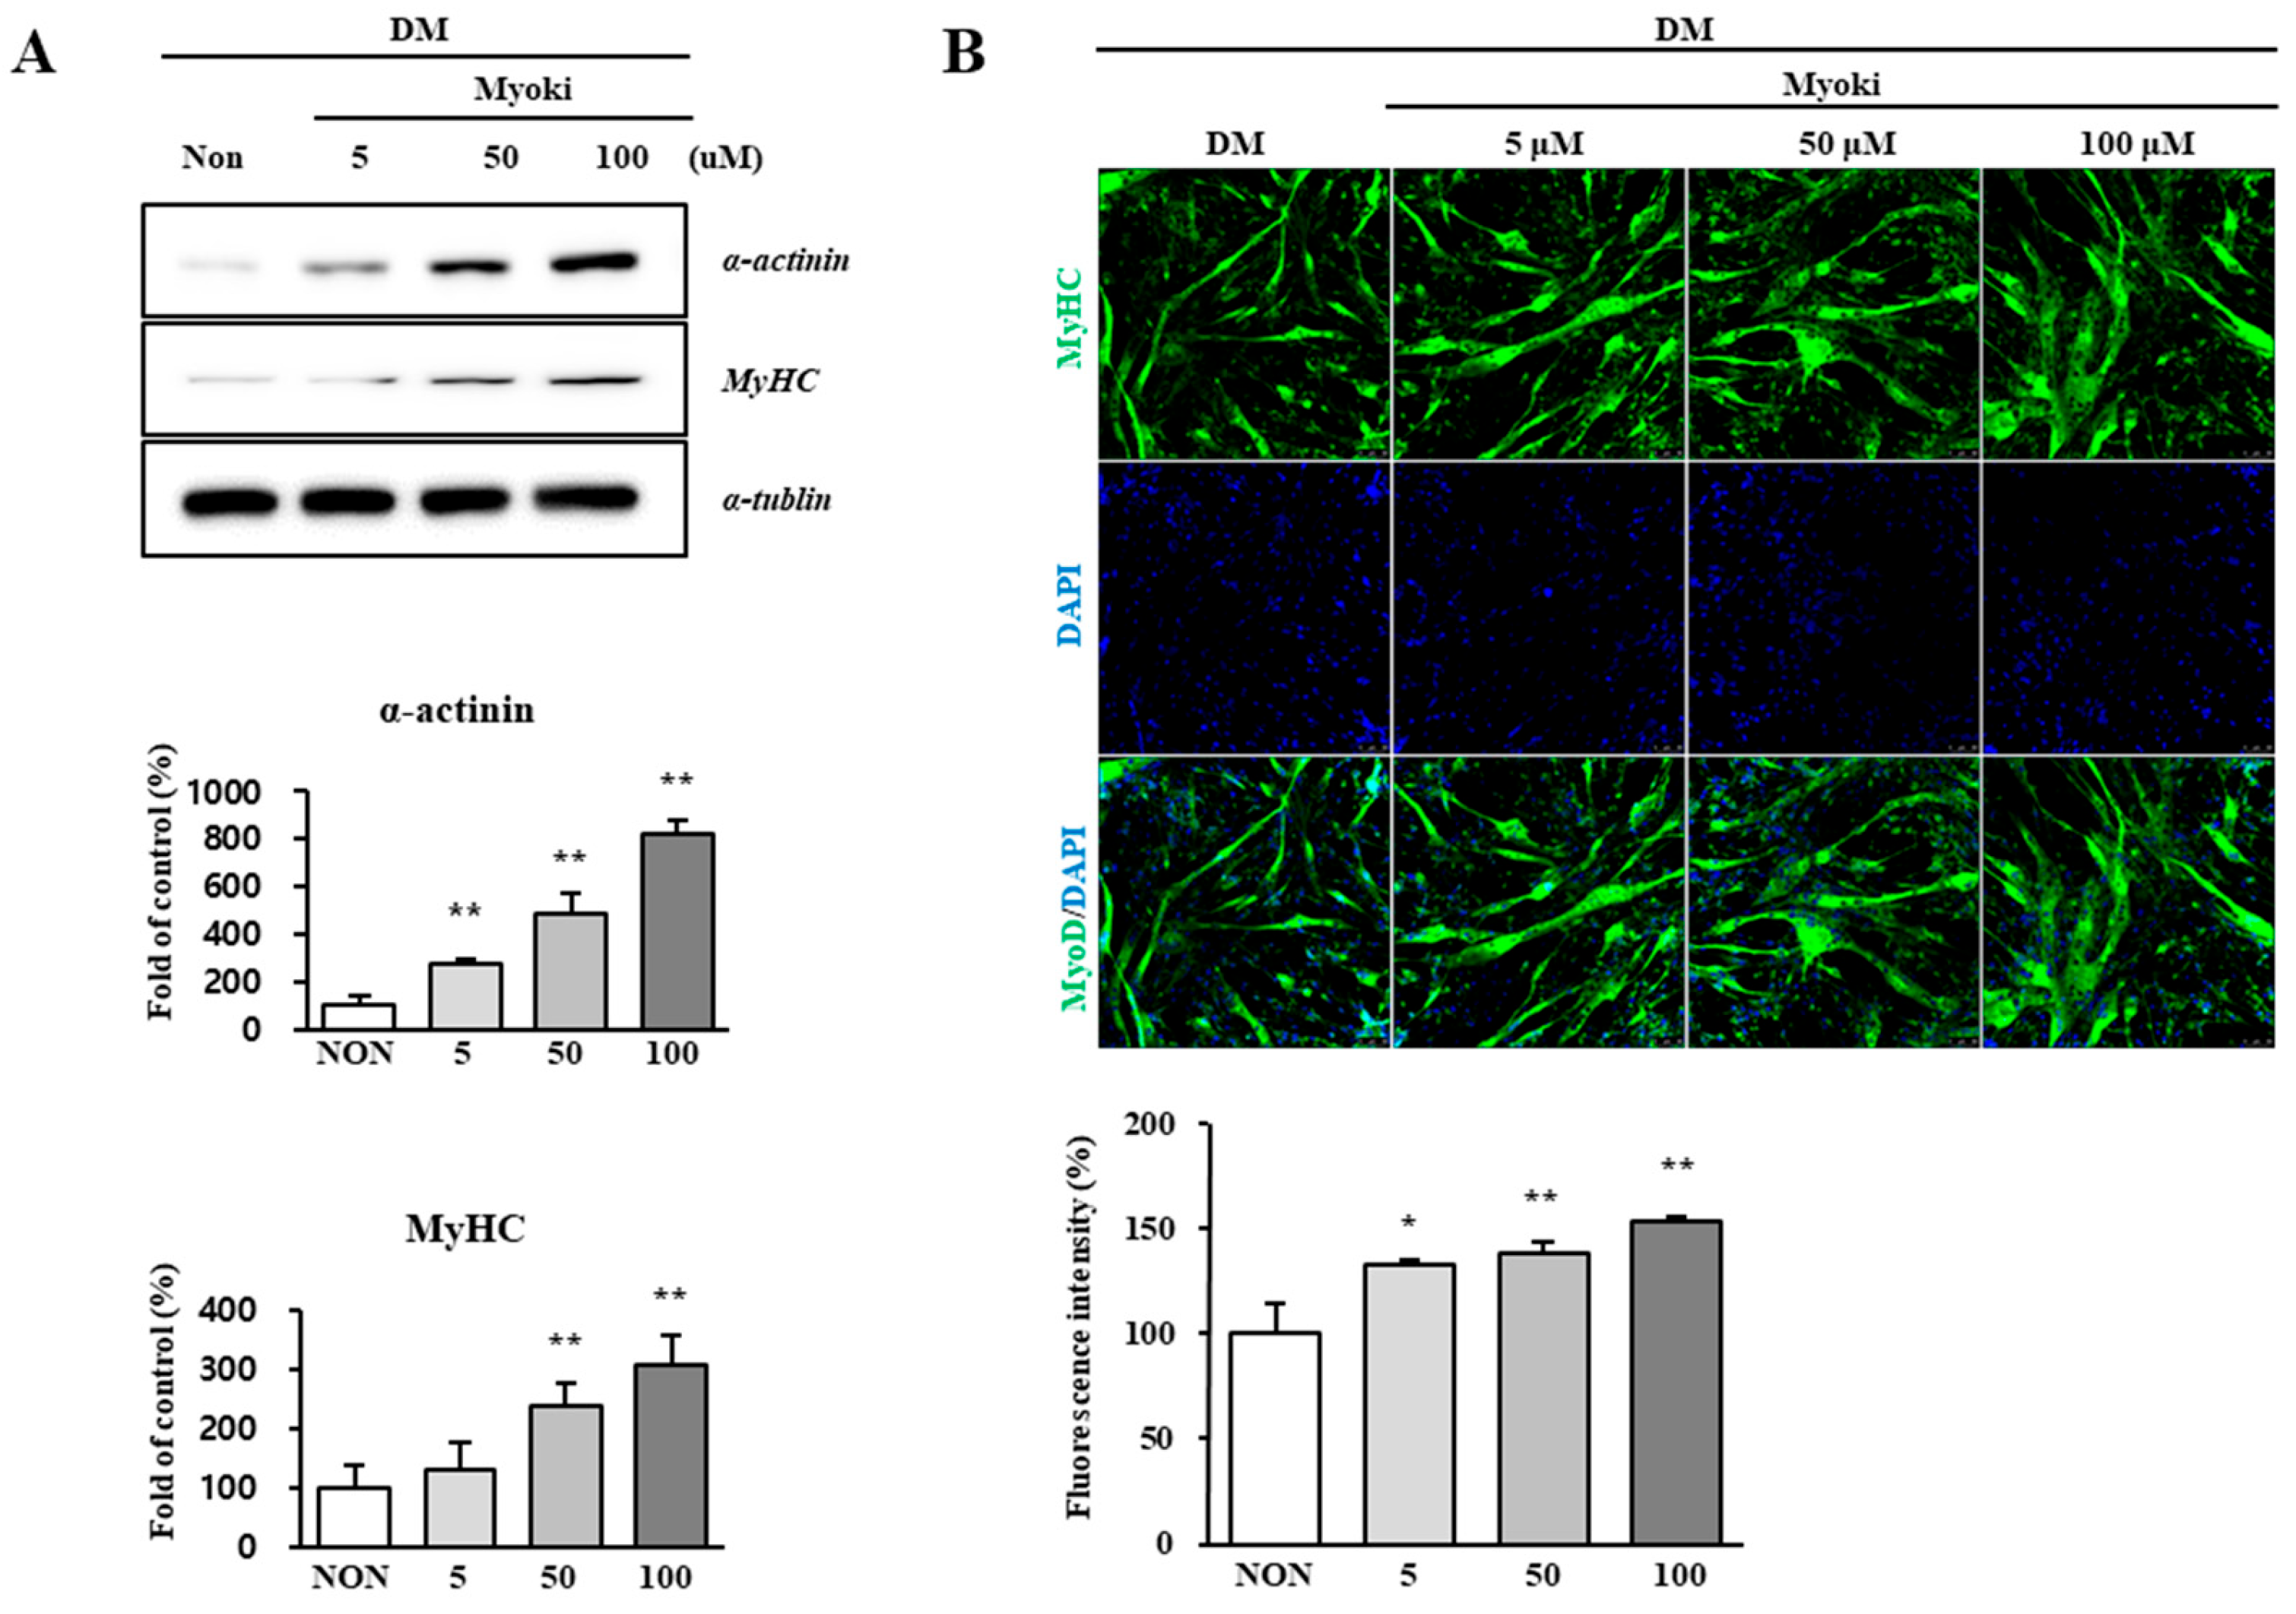
Figure 4.
Myoki enhances protein synthesis and inhibits degradation through the MSTN pathway in a DEX-induced C2C12 muscle atrophy model. C2C12 cells were treated with DEX to induce muscle atrophy and cultured with Myoki (10, 100 μM). (A) The expression levels of protein synthesis-related proteins and muscle fiber structural proteins, and (B) protein degradation-related proteins were analyzed by western blotting. (C) SPR analysis revealed concentration-dependent binding of the peptide to the MSTN-immobilized chip (3.125–200 μM; from bottom to top), and the equilibrium responses were fitted to a steady-state affinity model. (D) An ELISA-based binding assay was conducted to assess the interaction between Myoki and myostatin. Data are expressed as means ± SD (n = 3). * p < 0.05, ** p < 0.01, *** p < 0.001 vs. NC group.
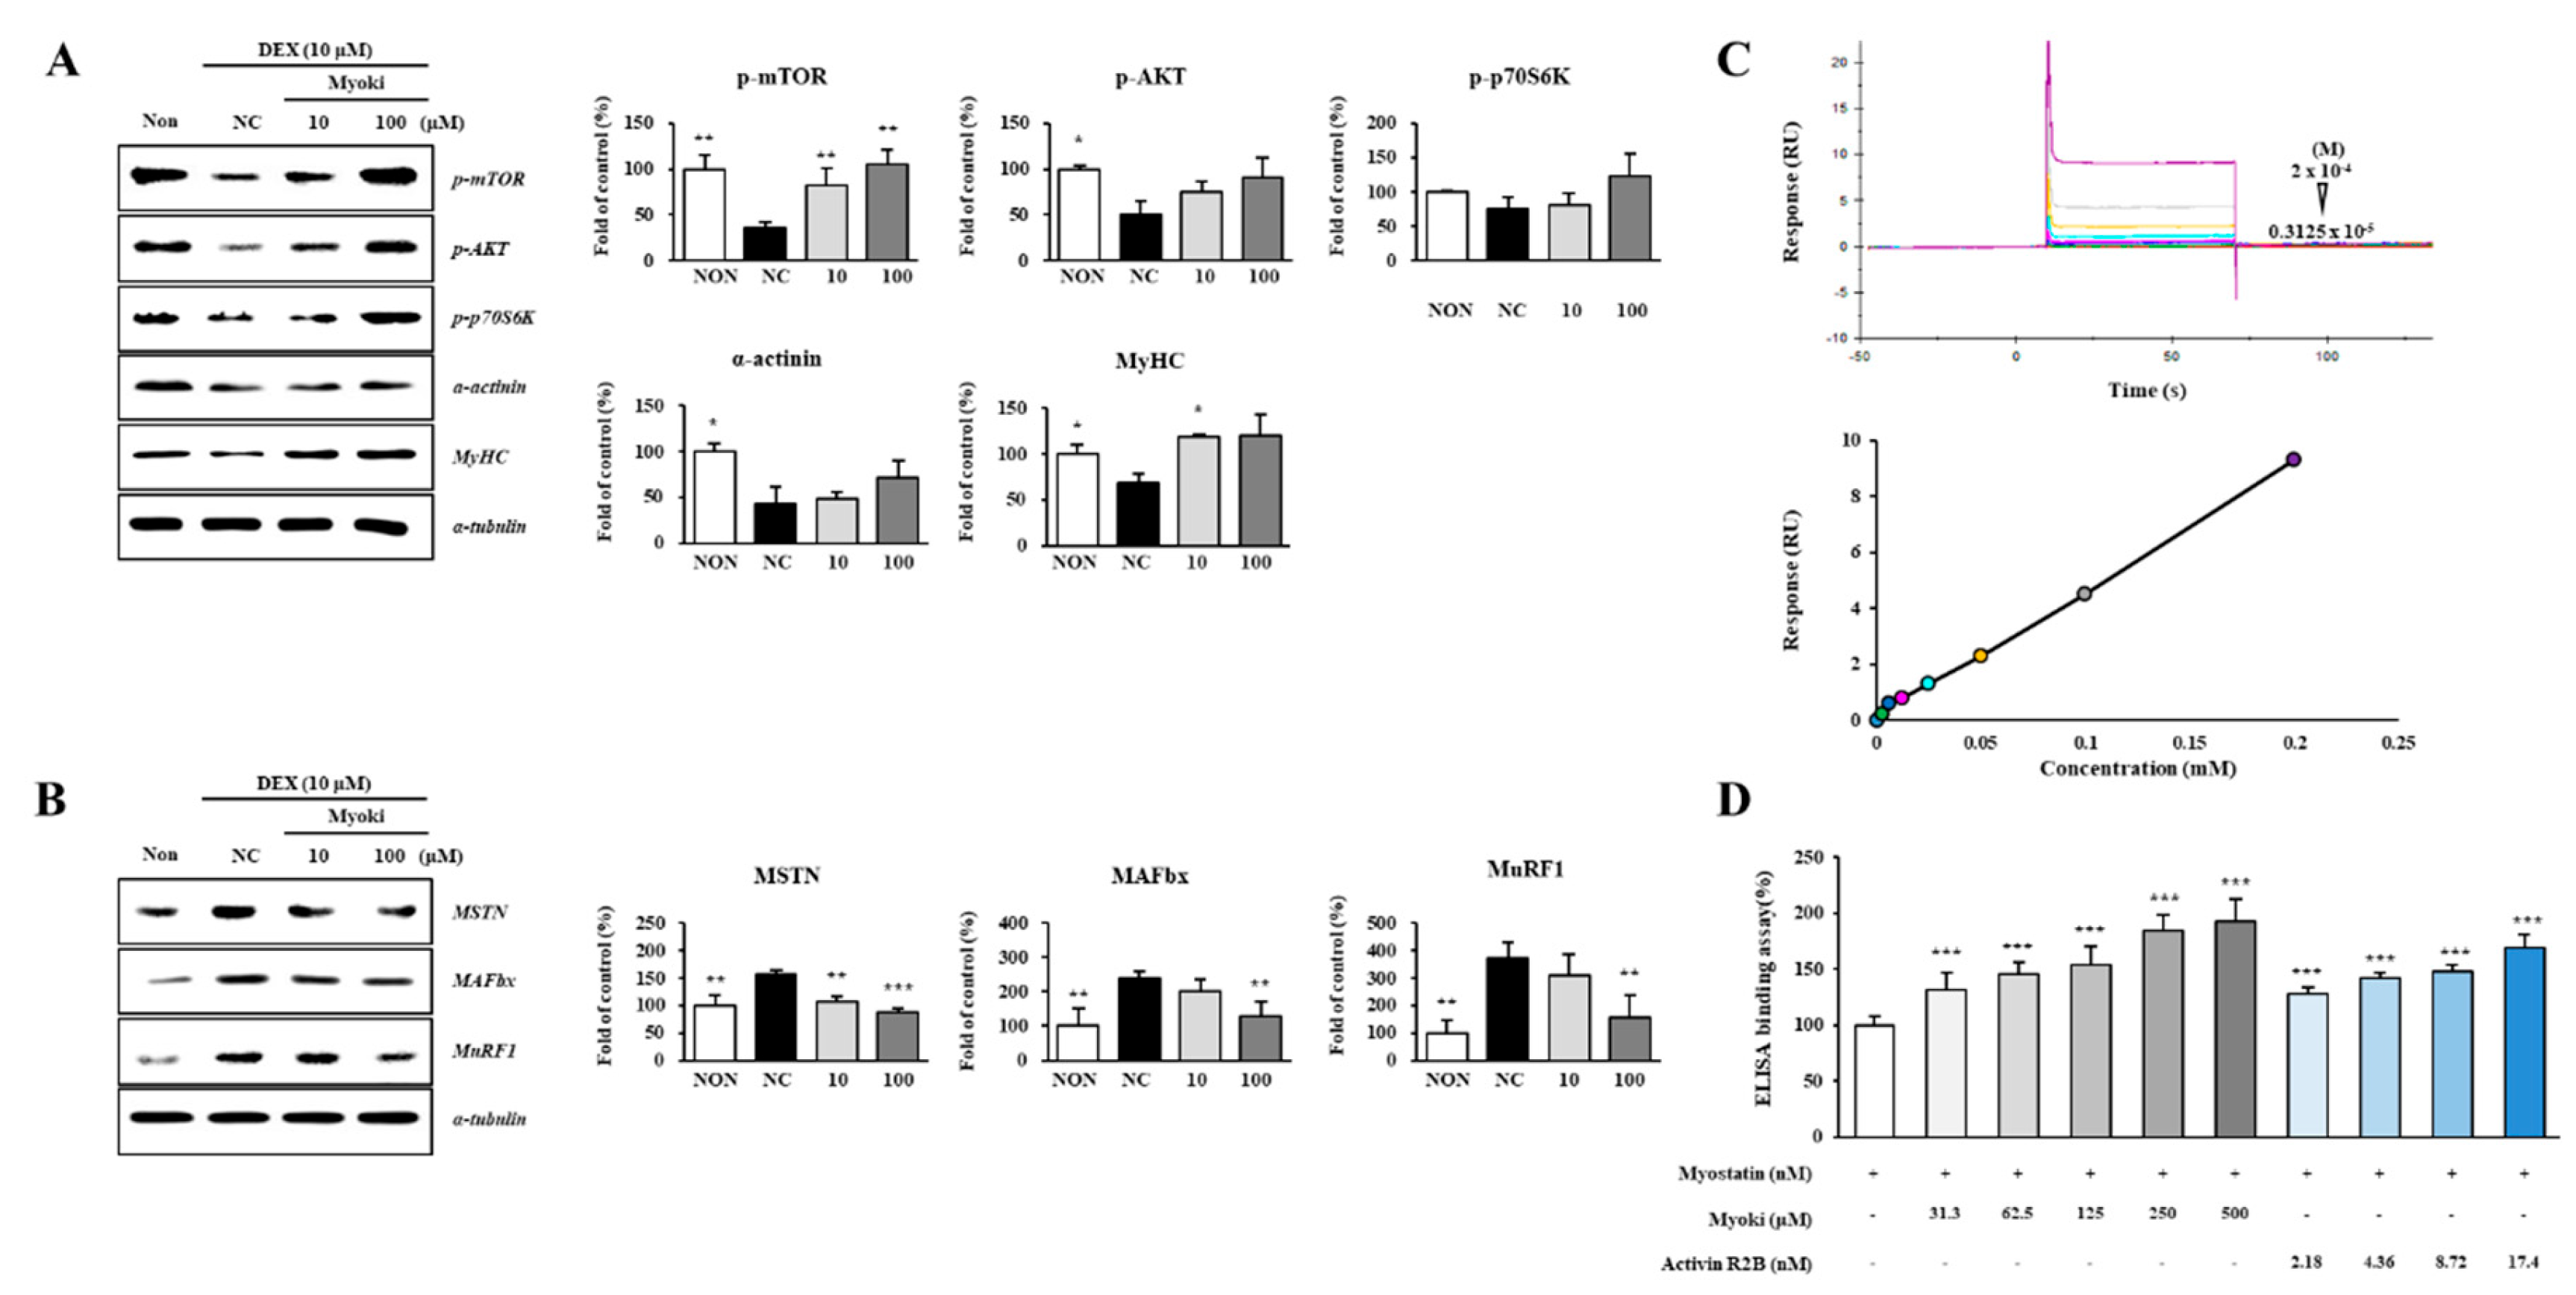
Figure 5.
Histological analysis shows that Myoki treatment alleviates muscle damage and fibrosis in senescence-accelerated mice (SAMP8). (A) SAMP8 mice were treated with Myoki peptide via intragastric (I.G.) administration for 45 weeks. Gastrocnemius and quadriceps muscles were collected, fixed in 10% neutral-buffered formalin, embedded in paraffin, sectioned, and stained with (B) hematoxylin and eosin (H&E) for general histological assessment and (C) Sirius Red for collagen fiber detection. Histological features were evaluated by light microscopy. Scale bars: 100 μm. Data are expressed as means ± SD (n = 5 per group). * p < 0.05, ** p < 0.01, *** p < 0.001 vs. SAMP8 group.
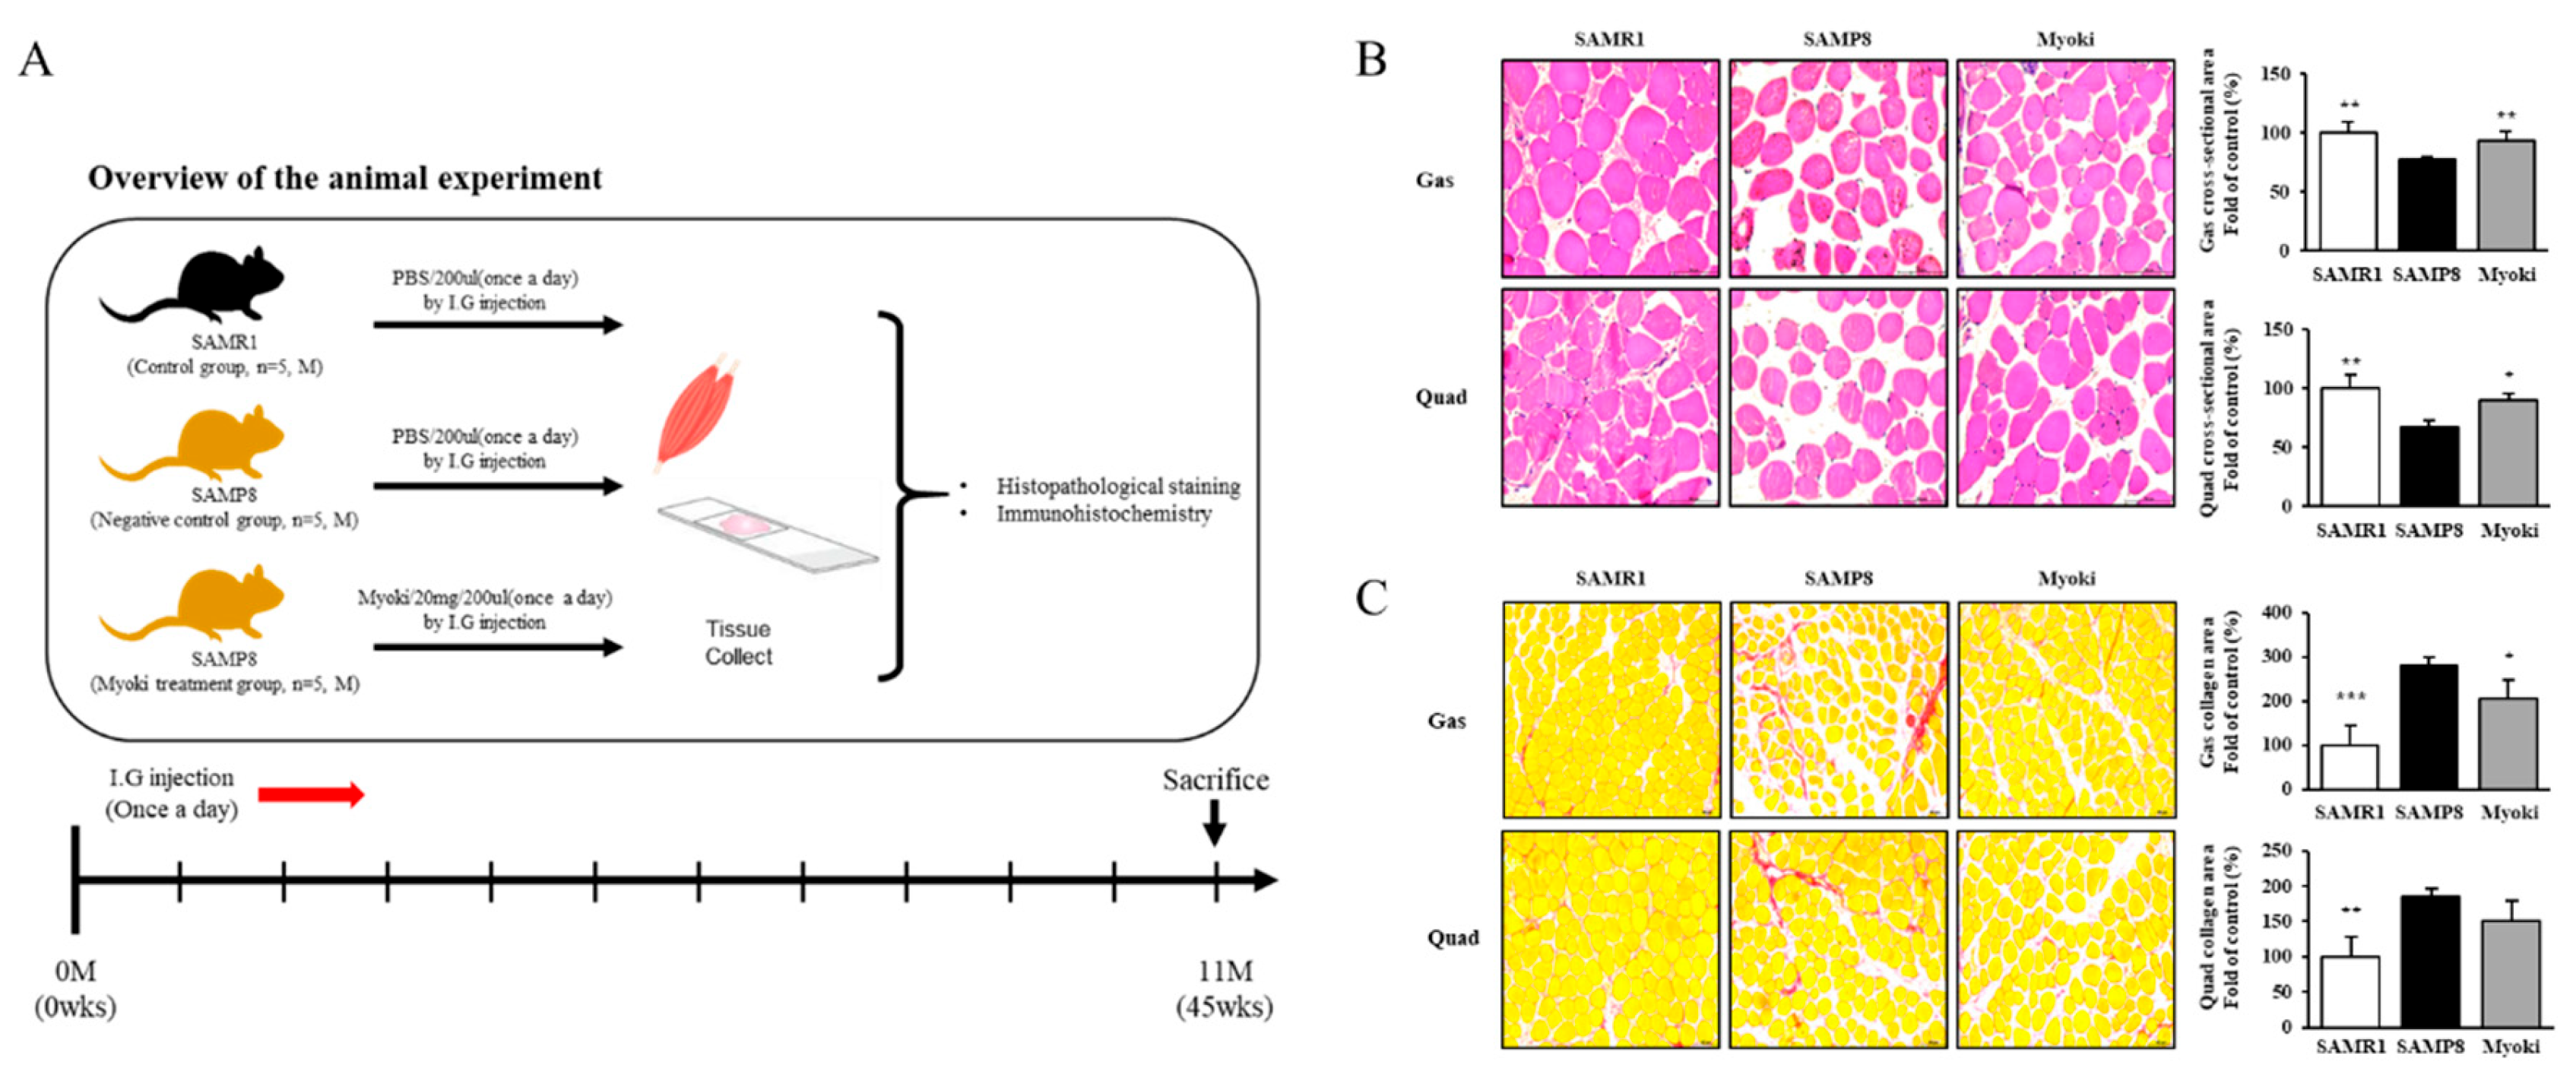
Figure 6.
Myoki peptide counteracts muscle atrophy-associated changes in the skeletal muscles of senescence-accelerated mice (SAMP8). Gastrocnemius and quadriceps muscles from SAMP8 mice treated with or without Myoki were collected, embedded in paraffin, and sectioned for immunofluorescence analysis. Sections were stained with antibodies against (A) myostatin, (B) MAFbx, and (C) fast myosin heavy chain (MyHC) (green) to evaluate the expression of key proteins involved in muscle atrophy and fiber composition. Nuclei were counterstained with DAPI (blue). Representative images were captured by fluorescence microscopy, and fluorescence intensity was quantified using ImageJ software. Scale bars: 100 μm. Data are expressed as means ± SD (n = 5 per group). * p < 0.05, ** p < 0.01, *** p < 0.001 vs. SAMP8 group.
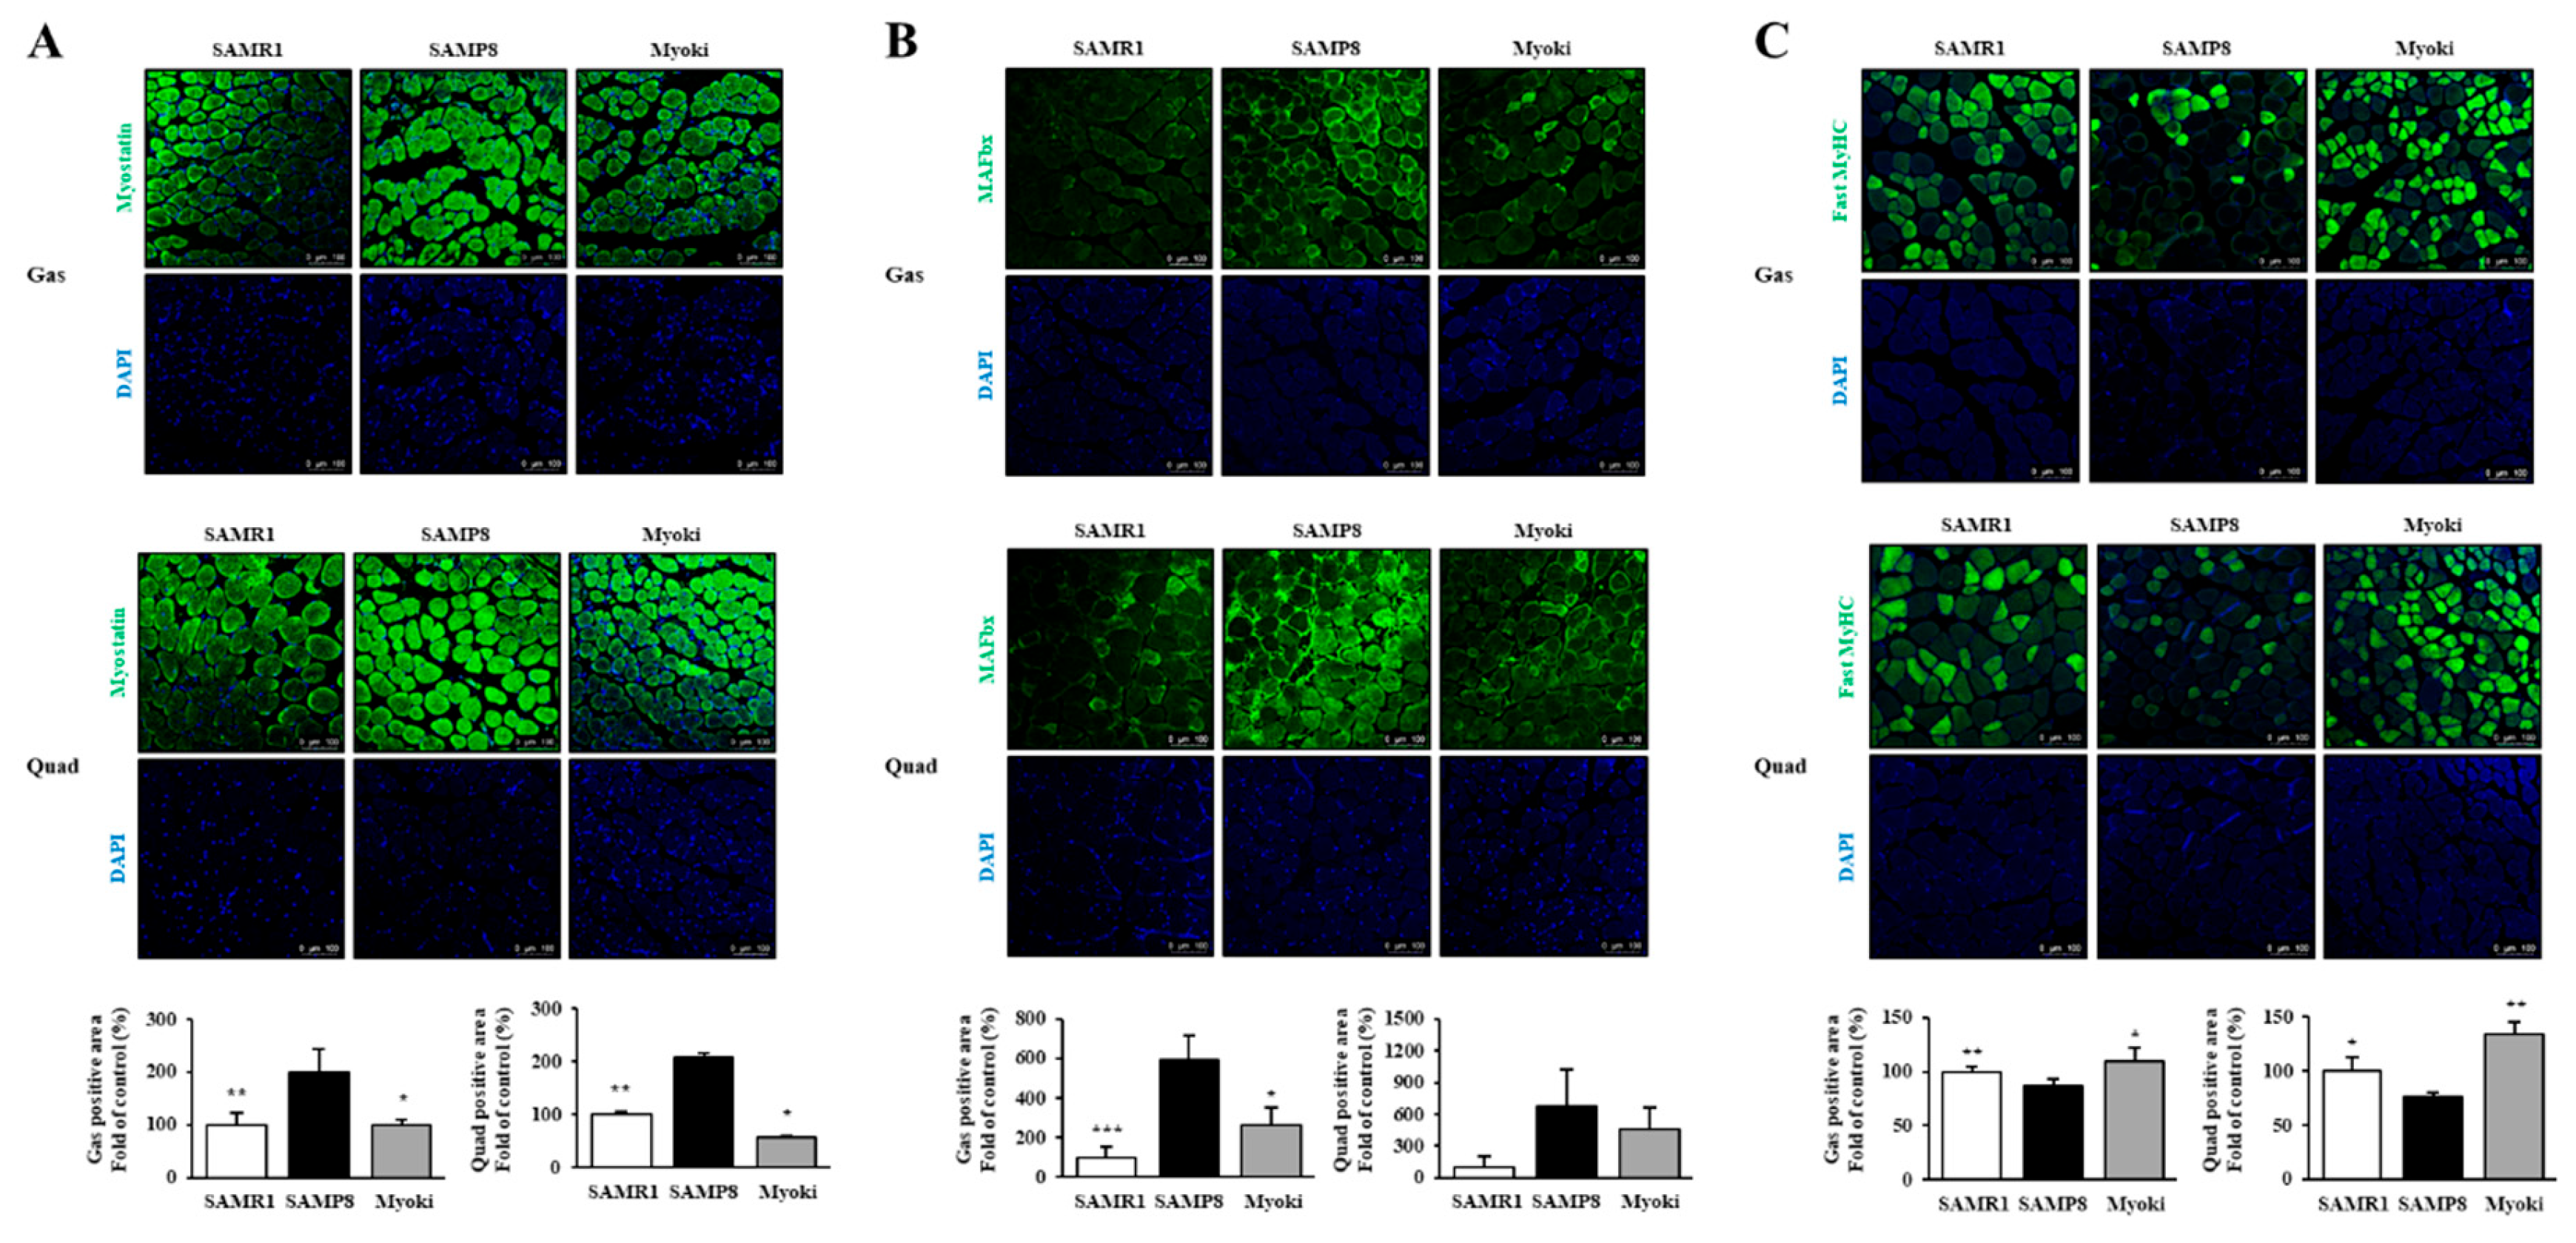
Figure 7.
Details of Disposition of Patients in the Study.
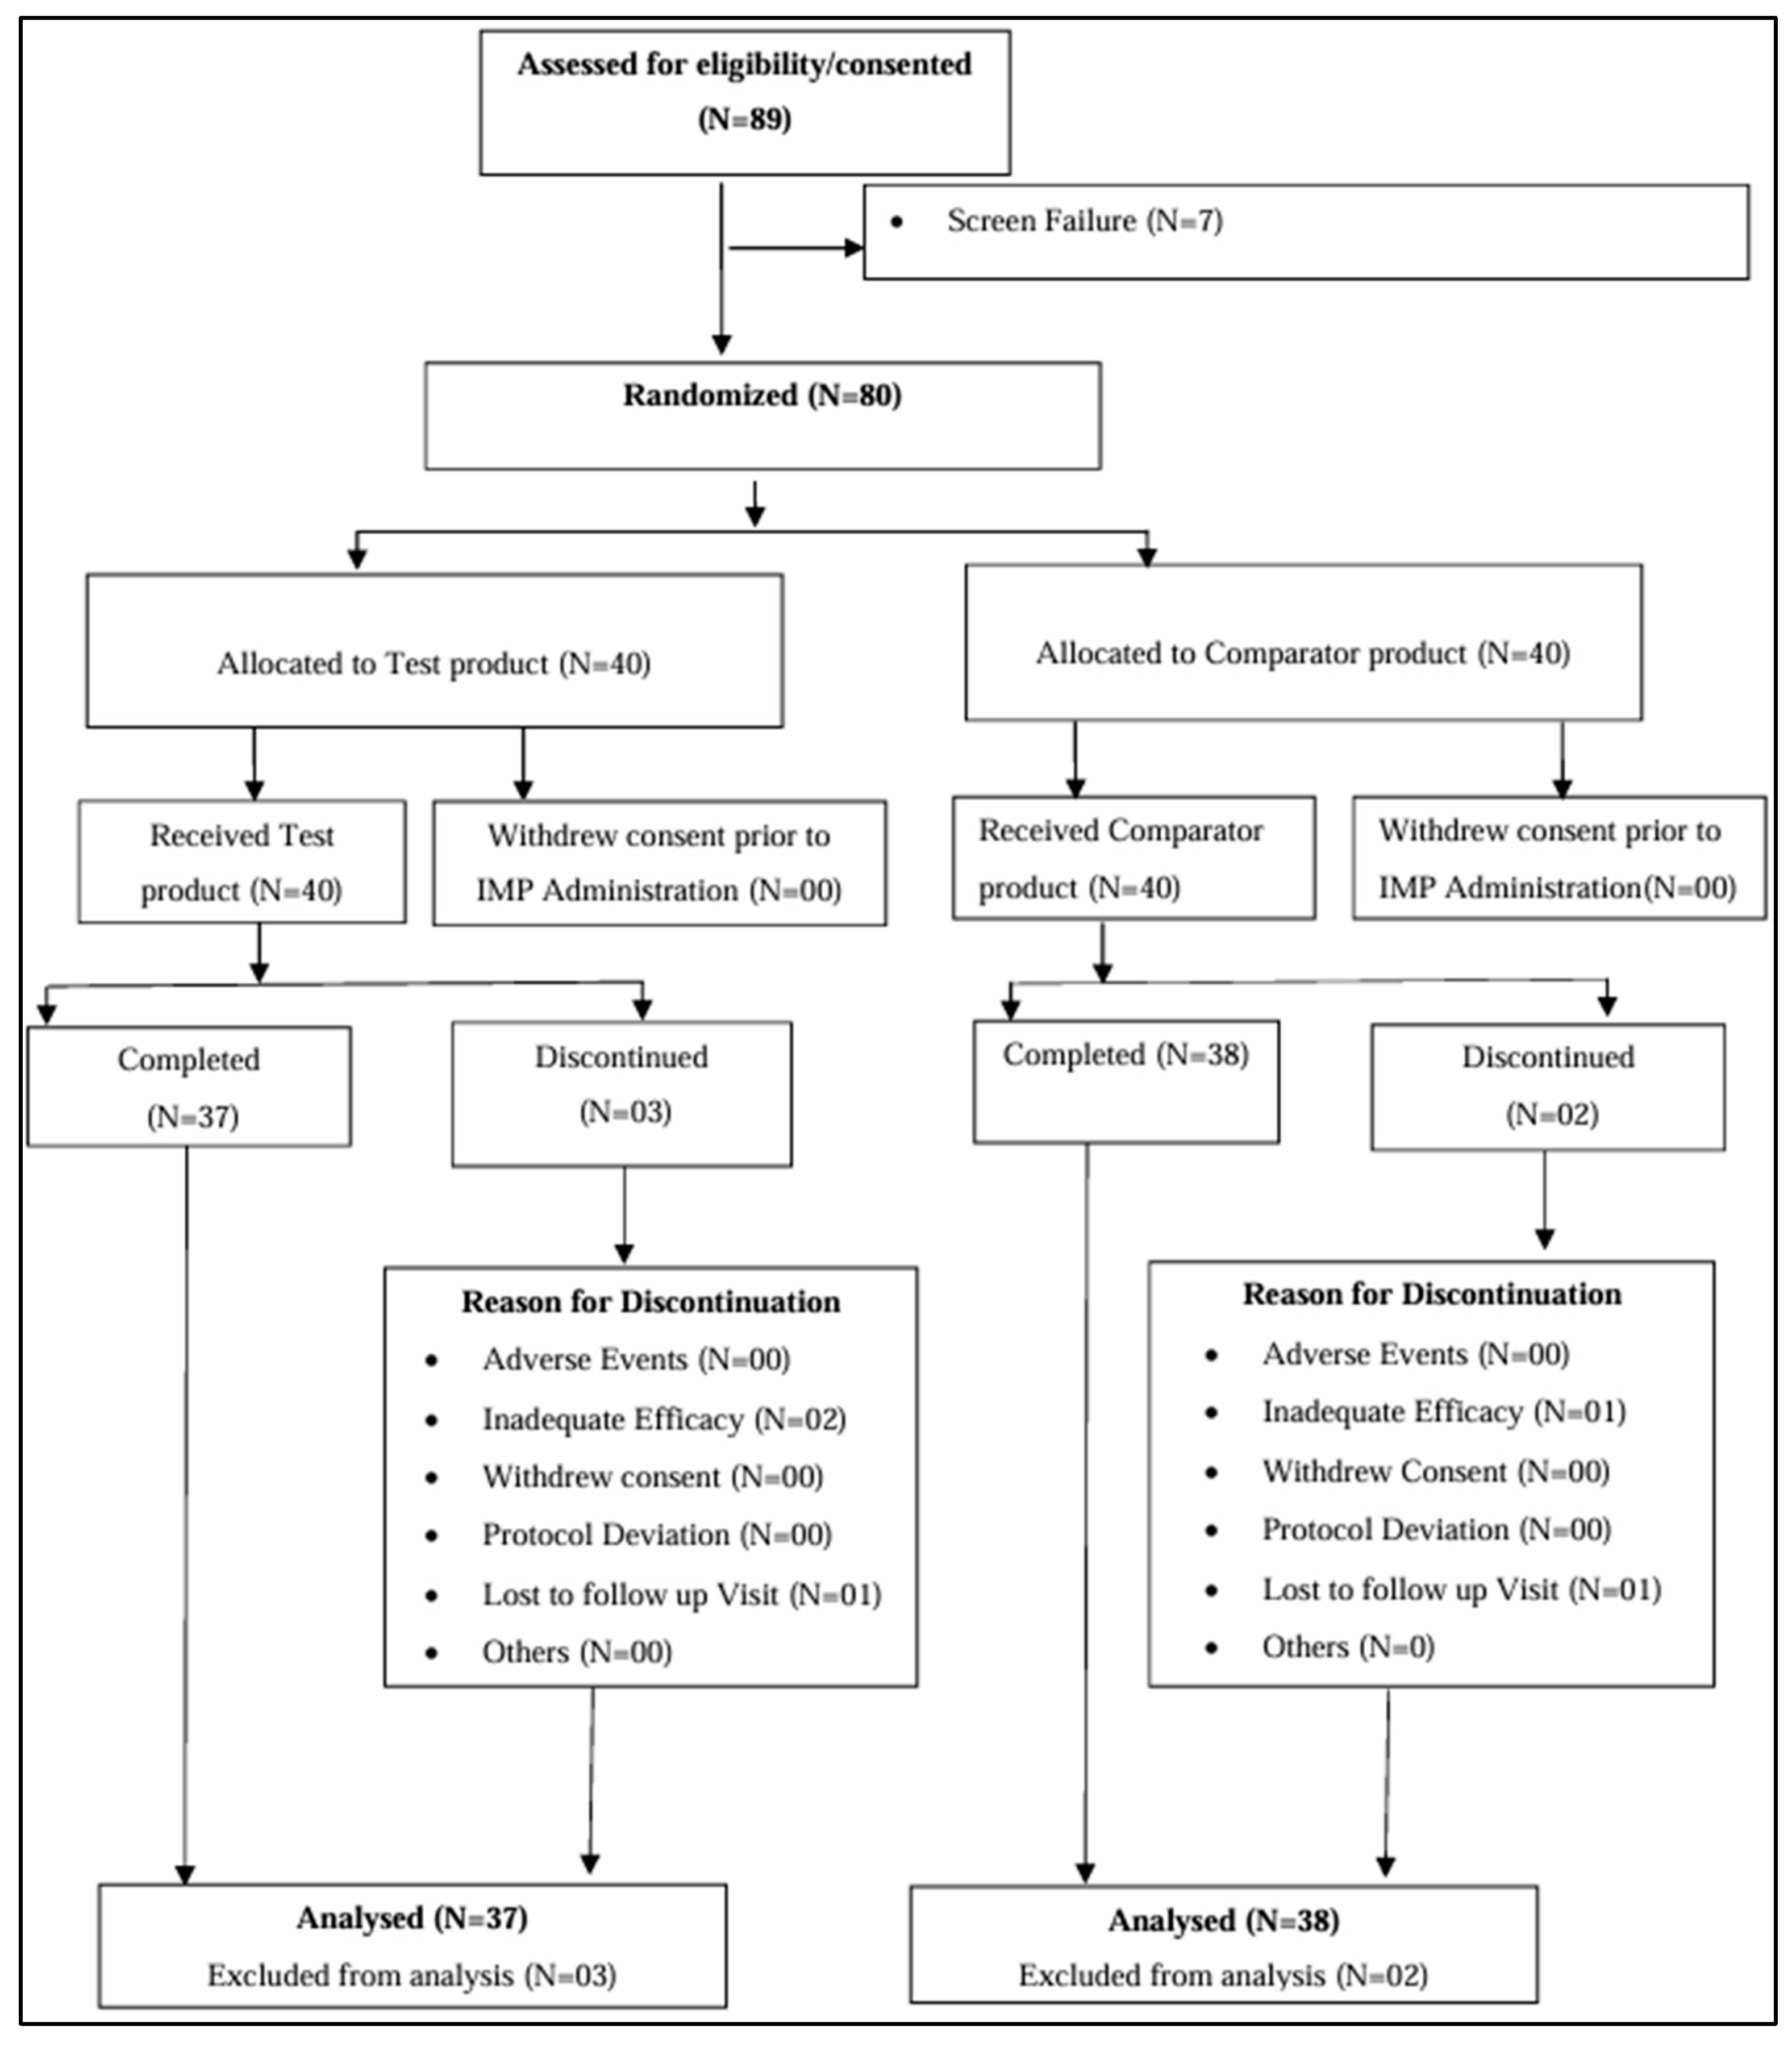

Table 1.
Schematic representation of the study.
| End point | Placebo (N=37) |
Treatment (N=38) |
Difference between Placebo and Treatment (95% CI) |
p-value |
|---|---|---|---|---|
| Lean muscle mass (g) | 225 | 930.8 | 705.8(433.40, 978.16) | < 0.01** |
| 95% CI for LS Mean | (33.69, 416.31) | (736.90, 1124.7) | ||
| Muscle mass (kg/m²) | 0.02 | 0.15 | 0.13(0.07 to 0.19) | < 0.01** |
| 95% CI for LS Mean | (-0.02, 0.06) | (0.11, 0.19) | ||
| Time to complete 6-meter walk test (TTC-6mWT) (sec) | -0.77 | -1.12 | -0.34(-0.68, 0.00) | < 0.01** |
| 95% CI for LS Mean | (-1.01, -0.53) | (-1.36, -0.87) | ||
| Hand grip strength test(Left Hand) (kg) | 0.81 | 1.07 | 0.27(-0.15, 0.69) | 0.02* |
| 95% CI for LS Mean | (0.51, 1.10) | (0.77, 1.37) | ||
| Hand grip strength test(Right Hand)(kg) | 0.85 | 1.27 | 0.43(-0.04, 0.89) | 0.04* |
| 95% CI for LS Mean | (0.52, 1.17) | (0.94, 1.60) | ||
| TNF-alpha (pg/ml) | 4.3 | 3.97 | -0.33(-8.07, 7.42) | 0.933 |
| 95% CI for LS Mean | (-1.14, 9.74) | (-1.54, 9.48) | ||
| IGF-1 (ng/ml) | 13.51 | 31.44 | 17.93(1.00, 34.87) | 0.038* |
| 95% CI for LS Mean | (1.71, 25.30) | (19.49, 43.40) | ||
| Sex hormones (Estrogen) (pg/ml) | -1.98 | -2.37 | -0.39(-8.45, 7.67) | 0.923 |
| 95% CI for LS Mean | (-7.64, 3.68) | (-8.11, 3.36) | ||
| Sex hormones (testosterone) (pg/ml) | -29.9 | 46.54 | 76.44(-18.68, 171.56) | 0.114 |
| 95% CI for LS Mean | (-96.63, 36.83) | (-21.09, 114.17) | ||
| IL-6 (pg/ml) | 1.31 | 0.04 | -1.27(-4.97, 2.43) | 0.496 |
| 95% CI for LS Mean | (-1.28, 3.90) | (-2.59, 2.67) | ||
| Myoglobin (ng/ml) | 8.15 | -6.45 | -14.6(-20.06, -9.14) | < 0.01** |
| 95% CI for LS Mean | (4.32, 11.98) | (-10.33, -2.56) | ||
| Creatine kinase (CK-MB) (ng/ml) | 3.41 | -0.54 | -3.95(-6.18, -1.72) | < 0.01** |
| 95% CI for LS Mean | (1.84, 4.97) | (-2.13, 1.04) | ||
| Aspartate aminotransferase | 2.57 | -2.83 | -5.39(-10.09, -0.70) | 0.025* |
| 95% CI for LS Mean (IU/L) | (-0.70, 5.84) | (-6.14, 0.49) |
* p < 0.05, ** p < 0.01.
Disclaimer/Publisher’s Note: The statements, opinions and data contained in all publications are solely those of the individual author(s) and contributor(s) and not of MDPI and/or the editor(s). MDPI and/or the editor(s) disclaim responsibility for any injury to people or property resulting from any ideas, methods, instructions or products referred to in the content. |
© 2025 by the authors. Licensee MDPI, Basel, Switzerland. This article is an open access article distributed under the terms and conditions of the Creative Commons Attribution (CC BY) license (http://creativecommons.org/licenses/by/4.0/).
Copyright: This open access article is published under a Creative Commons CC BY 4.0 license, which permit the free download, distribution, and reuse, provided that the author and preprint are cited in any reuse.


