
Submitted:
11 June 2025
Posted:
12 June 2025
You are already at the latest version
Abstract
Objectives: Pneumonia is associated with high morbidity, hospitalization, and mortality, with its etiology often unknown. Antimicrobial resistance (AMR) has grown in recent decades. This study aimed to investigate microbial isolates, antimicrobial susceptibility, and pneumonia outcomes. Methods: Adults aged ≥18 years hospitalized with pneumonia at a private hospital in Amman, Jordan, were prospectively included. Respiratory specimens were collected for culture and molecular testing, along with clinical data on antibiotic susceptibility and comorbidities. Results: The study included 111 participants with a mean age of 64·0 years (SD = 20·6), where 58·6% were male. Shortness of breath (54.1%) was the most common symptom, and hypertension (38.7%) was the most prevalent comorbidity. The majority of pneumonia cases were community-acquired (78.4%). Pathogen detection was higher with PCR (74.8%) than culture (57.7%), with PCR demonstrating greater sensitivity (96.9% vs. 86.3%, p=0.039). The mortality rate was 27%, with a significant association between non-guideline-concordant antibiotic use and poorer outcomes (p=0.023). Antimicrobial resistance (AMR) patterns showed significant variability. Conclusions: PCR offers superior sensitivity in pathogen detection, supporting better clinical decision-making and antimicrobial stewardship. The study highlights the need for national guidelines to address AMR variability in Jordan and advocates for a personalized approach to treatment.
Keywords:
pneumonia
; antimicrobial resistance
; molecular diagnostics
; pathogen detection
; antibiotic susceptibility
; clinical outcomes
; Jordan
1. Introduction
Inflammation of the lung parenchyma is the hallmark of pneumonia, which an infectious agent brings on. The majority of pneumonia cases can be categorised as community-acquired pneumonia (CAP) or hospital-acquired pneumonia (HAP) [1,2].
Lower respiratory tract infection (LRTI) (mainly pneumonia) leads to high rates of hospitalisation and causes substantial morbidity and mortality in adults worldwide [3,4]. The 2010 Global Burden of Disease Study reported that lower respiratory tract infections, including pneumonia, are the fourth-most common cause of death globally, exceeded only by ischemic heart disease, stroke, and chronic obstructive pulmonary disease (COPD), and represent the second-most frequent reason for years of life lost [5].
Risk factors for CAP include advanced age, the presence of other medical conditions (such as asthma, COPD, bronchiectasis, heart disease, diabetes mellitus, immunosuppressive disorders, and stroke), a previous history of pneumonia, use of immunosuppressive medications, viral respiratory infections, compromised airway protection, and lifestyle factors such as smoking, alcohol consumption, living in crowded conditions, poor dental hygiene, and regular contact with children [6,7].
The issue of antimicrobial resistance is most urgent in developing nations, where infectious diseases are highly prevalent. Factors contributing to this problem include excessive use of antibiotics, low quality of available antibiotics, and financial limitations that hinder the broad use of newer and more expensive treatments [8,9].
An etiologic agent is not identified in 30 % to 65% of patients with pneumonia [10]. The etiology of CAP often remains uncertain, and therapy is empirical. Hence, there is still room for improvement in the diagnosis of pneumonia.
Approximately 17 to 41 percent of CAP cases in the US are thought to be due to Streptococcus pneumoniae [11]. It was frequently reported that CAP from S. pneumoniae is associated with high mortality, risk of shock, and the need for mechanical ventilation [12].
Bacterial pneumonia is a frequently occurring condition, however, its causes differ depending on the geographical location [13,14]. Several studies have reported that the common causes of CAP are S. pneumoniae, K. pneumoniae, E. coli, H. influenzae, S. aureus, in addition to the atypical bacteria like L. pneumophila, C. pneumoniae, and M. pneumonia cases [15-17]. S. pneumoniae is the most common bacterial infection across all age groups, accounting for roughly 30% of pneumonia cases [15,16].
Despite recent breakthroughs in microbiological techniques, the etiology of pneumonia is not completely understood. The advancement of molecular techniques with enhanced sensitivity and specificity has facilitated the identification of new viruses, the detection of microorganisms that are challenging to cultivate, and the identification of pathogens at a later stage of the disease [17-25]. Historically, a limited number of researches in Arabic countries have employed advanced molecular techniques to examine the microorganisms responsible for pneumonia. This study aims to utilise traditional and molecular diagnostics to accurately identify and assess the presence of viruses and bacteria linked to pneumonia in Jordan.
2. Materials and Methods
Study Design and Patients
This study was conducted at the Islamic hospital in Amman, Jordan. The study followed a retro-prospective and cross-sectional design and was carried out from May 2021 to January 2022.
A total of 111 banked lower respiratory tract samples were collected from the hospital lab. The samples included hospitalised patients of adults aged ≥18 years who presented with pneumonia. Samples from patients who were under antibiotic treatment were excluded. Socio-demographic characteristics, clinical information, and other relevant variables were collected using the medical records.
The study was conducted as part of routine surveillance and ethical approval from the Institutional Review Board (IRB) committee (1053/2021/151). However, the consent from the patients was waived.
The definition of pneumonia was characterised by new pulmonary infiltrates on thoracic imaging and one or more of the following conditions: 1) novel or increased cough with or without sputum production and/or purulent respiratory secretions; 2) fever or hypothermia; 3) signs of systemic inflammation (leukocytosis >10,000 cells/cm3, bandemia >10%, leukopaenia <4000 cells/cm3), procalcitonin levels above the local upper limit of normal or increased C-reactive protein) [26].
The Infectious Diseases Society of America (IDSA) defines CAP as an acute infection of the pulmonary tissue accompanied by the presence of an acute infiltrate on a chest radiograph or auscultatory findings consistent with pneumonia in a patient who did not acquire it from a healthcare system or within the first 48 hours after hospitalisation [27]. In this study, we also included cases of HAP, which is defined as a type of pneumonia that occurs 48 hours or more after hospital admission and is not present at the time of admission.
Sample Collection and Preparation
Specimens were collected from adult patients with pneumonia using a disposable, leak-proof, sterile, wide-mouthed container with a tight-fitting lid. During the sputum collection, each study participant was routinely instructed to breathe deeply and then cough deeply and vigorously to provide at least 2 mL of sputum specimen into the container provided. Soon after collection, they were transported to the bacteriology laboratory using an ice box and processed within 30 minutes of collection.
Respiratory samples were archived and stored at -80 °C before analysis. Nucleic acids were extracted from each sample using the QIAamp Viral RNA Mini kit (Qiagen, Hilden, Germany), following the manufacturer’s instructions. To prevent degradation, extracts were stored at 4 °C until manipulation was complete (1-3 days).
Molecular Testing
In this study, we employed the FTD Respiratory Pathogens 33 kit, a multiplex real-time PCR assay designed for qualitatively detecting a broad range of respiratory pathogens. This kit allows for detecting 33 different pathogens, including viruses, bacteria, and fungi commonly associated with respiratory infections. The pathogens detected by this kit are available in Table 1.
The FTD Respiratory Pathogens 33 kit is suitable for using extracted RNA and DNA from respiratory samples, including throat, nasal, nasopharyngeal swabs, bronchoalveolar lavage (BAL), and sputum. The assay is performed on a variety of real-time PCR platforms.
The PCR setup was conducted using the Prime Pro 48 real-time PCR machine, which is equipped for high-throughput processing and precise thermal cycling control. The Prime Pro 48 facilitates the simultaneous amplification and detection of multiple targets, making it ideal for the comprehensive analysis provided by the FTD Respiratory Pathogens 33 kit.
The standard curves were used to calculate bacterial loads (DNA copies/mL). The amount of bacterial DNA present in each sample was obtained by directly extrapolating PCR cycle threshold (Ct) values to the amount of DNA, as read from the concentration versus the CT standard curve. Negative samples were defined as those with CT values > 30. Real-time quantitative PCR (qPCR) targeting the fumarate.
Statistical Analysis
Statistical analyses were performed to evaluate the study participants’ demographic characteristics, clinical outcomes, pathogen detection rates, and antibiotic susceptibility patterns. Continuous variables, such as age, and length of hospital stay, were summarised using means, standard deviations (SDs), and ranges. Or median (IQR) depending on the normality test. Categorical variables, including gender, initial symptoms, comorbidities, pneumonia classification, and antibiotic resistance categories, were summarised using frequencies and percentages.
The Chi-square test or Fisher’s exact test was used to compare categorical variables, as appropriate. The McNemar test was applied to assess the significance of the difference between the detection rates of pathogens using traditional culture methods and qPCR. Sensitivity for both culture and qPCR methods were calculated to compare their diagnostic performance, and the McNemar test was also employed to evaluate the statistical significance of the differences in sensitivity between the two methods.
To analyse the relationship between guideline adherence in antibiotic use and patient outcomes (improvement vs. death), a Chi-square test was used to determine the association. Additionally, logistic regression was conducted to explore the predictive value of guideline adherence on patient outcomes, with model accuracy and p-values reported.
Comparisons between the lengths of hospital stay in patients with different pneumonia classifications (CAP vs. HAP) were conducted using the independent samples t-test or the Mann-Whitney U test when the data did not meet the normality assumption. Antibiotic resistance patterns were visualised using bar charts and heatmaps, and monthly trends in antibiotic resistance were analysed using line plots.
All statistical analyses were performed using JASP (Jeffreys’s Amazing Statistics Program) 0·18·3·0 software, and a p-value of <0·05 was considered statistically significant.
3. Results
This section may be divided by subheadings. It should provide a concise and precise description of the experimental results, their interpretation, as well as the experimental conclusions that can be drawn.
Demographic and Baseline Characteristics
The study included 111 participants with a mean age of 64·0 years (SD = 20·6, range = 18-91). Of these, 46 (41·4%) were female, and 65 (58·6%) were male (Table 2). The most common initial finding was shortness of breath, reported by 60 (54·1%) patients, followed by fever (15·3%), cough (14·4%), and pleuritic chest pain (12·6%).
Comorbidities were prevalent among the participants, with hypertension being the most common (38·7%), followed by diabetes mellitus (30·6%), cardiovascular disease (27·9%), and Alzheimer’s disease (15·3%). The average number of previous hospitalisations was 2·2 (SD = 2·4, range = 0-14), and the average number of previous pneumonia episodes was 0·7 (SD = 1·1, range = 0-6).
Most samples were sputum, comprising 91·0% of the total 111 samples. Bronchoalveolar Lavage (BAL) accounted for 6·3% of the samples, while Endotracheal Aspirate comprised 2·7%.
Characteristics of Pneumonia
Of the participants, 87 (78·4%) had CAP, while 24 (21·6%) had HAP, including 3 (2·7%) cases of ventilator-associated pneumonia (VAP) (Table 3). According to the CURB-65 severity score, most patients were classified as having mild to moderate pneumonia, with a score of 1 being the most prevalent. The length of hospital stays (LOS) averaged 12·1 days (SD = 15·9, range = 1-83), and the length of ICU stay averaged 5·2 days (SD = 13·0, range = 0-83).
Pathogen Detection
PCR detected microorganisms in 83 (74·8%) patients, while traditional culture methods detected microorganisms in 64 (57·7%) patients. PCR identified a high diversity of pathogens, including Bordetella pertussis, Chlamydophila pneumoniae, and multiple viral agents not detected by culture. The presence of bacteria-virus co-infections was observed in 41 (36·9%) patients, highlighting the complexity of infections in this cohort (Figure 1).
Bacterial Culture Versus qPCR
Figure 2 illustrates the distribution of pathogens detected using the culture and molecular (qPCR) methods providing insights into the prevalence of various microbial species in the samples analysed. The bar chart reveals the dominant bacterial species, with Staphylococcus aureus and Escherichia coli appearing as the most frequently detected pathogens. The prominence of these bacteria indicates their significant role in infections within the population studied. Other pathogens, such as Klebsiella pneumoniae and Pseudomonas aeruginosa, are also represented, albeit at lower frequencies, suggesting a diverse microbial landscape. The culture method’s reliability in identifying viable bacteria makes this distribution an important baseline for clinical assessments and therapeutic interventions.
These descriptions provide a detailed analysis of the distribution of pathogens as detected by the two distinct methods, highlighting the strengths and applications of each approach in clinical diagnostics.
Table 4 compares the overall results for the culture and qPCR methods. PCR detected more positive cases (84) than culture (64). There is a statistically significant difference between the detection rates of culture and PCR methods (p<0·001). PCR can identify difficult or impossible pathogens to culture, such as certain viruses and fastidious bacteria, often missed by traditional culture methods.
Table 5 shows the association between PCR and culture results. The results indicate a significant association between PCR and culture results, with a very low p-value suggesting a strong correlation between the two detection methods.
A comparison between culture and PCR methods indicated a statistically significant difference in detection rates (p < 0·001), with PCR demonstrating higher sensitivity and broader pathogen detection capabilities. This is particularly important for rapid diagnosis and effective treatment planning.
We calculated the sensitivity for each method to compare the detection sensitivity between culture and qPCR. Sensitivity is the true positive rate, which measures the proportion of actual positives correctly identified by the test. For our data, it can be calculated as follows:
Our results indicate that the qPCR has a higher sensitivity (96·9%) than culture (86·3%), meaning it correctly identifies a larger proportion of true positives. We used McNemar’s test to determine whether the sensitivity difference is statistically significant. The p-value obtained from McNemar’s test is 0·039. This suggests a statistically significant difference in sensitivity between qPCR and culture detection methods.
We calculated the false positive and false negative rates for both qPCR and culture methods, as follows:
- False Positive Rate (qPCR): 21·7%
- False Negative Rate (qPCR): 3·1%
- False Positive Rate (Culture): 5·3%
- False Negative Rate (Culture): 13·7%
Therefore, PCR has a higher false positive rate but a lower false negative rate than culture. This means that qPCR is more likely to identify negatives as positives incorrectly but less likely to miss actual positives. In comparison, the culture has a lower false positive rate, meaning it is better at correctly identifying positives. However, it has a higher false negative rate, indicating it may miss a larger proportion of actual positives.
- Chi-Square Statistic: 64·33
- P-Value: 1·05×10−151·05×10−15
- Degrees of Freedom: 1
Clinical Outcome Analysis
The bar chart in Figure 3 illustrates the detection count of pathogens across different clinical outcomes. This visualisation helps identify which pathogens are more prevalent in patients with varying recovery statuses. The figure presents a comprehensive visualisation of clinical outcomes correlated with pathogen detection, highlighting the interplay between the specific pathogens identified and the resultant patient outcomes. This visualisation is structured to reveal patterns in how different bacterial infections impact patient recovery and mortality.
The visualisation reveals critical insights into the relationship between pathogen type and patient prognosis. For example, certain pathogens such as Bordetell pertussis, K. pneumonia, HCoV, and HPV3 are associated with higher mortality rates, as evidenced by the larger red segments in their respective bars.
We used a chi-square test to see if there is a significant association between guideline adherence and patient outcomes. A statistically significant association exists between adherence to treatment guidelines and patient outcomes (Chi-square statistic: 7·55, p-value= 0·023).
However, there is no statistically significant difference in the length of hospital stay between patients who adhered to treatment guidelines and those who did not (The Mann-Whitney U test, U statistic: 1245·0, p-value= 0·846).
Figure 4 illustrates the relationship between adherence to treatment guidelines and patient outcomes, specifically focusing on death and improvement. A higher proportion of deaths (64·3%) is associated with patients who did not adhere to the treatment guidelines. In contrast, a lower proportion of deaths (35·7%) is observed among patients who adhered to the guidelines. For patients who improved, a significant majority (73·1%) did not adhere to the guidelines. In contrast, only 26·9% of those who improved followed the guidelines (Chi-Square Statistic (χ2χ2): 3·841, Degrees of Freedom (dof): 1, p-value = 0·05). The p-value Indicates borderline significance. The result suggests that the difference observed might not be statistically significant, but it points to a potential relationship that may warrant further investigation.
A logistic regression analysis was conducted to investigate whether adherence to treatment guidelines predicts patient outcomes.
The logistic regression analysis yielded the following results:
- Coefficient for Adherence: 0·126
- Intercept: 0·270
- Model Accuracy: 60·9%
- p-value for Adherence: 0·764
The positive coefficient for adherence suggests a slight increase in the log odds of improvement with adherence to guidelines. However, the effect is minimal. The p-value of 0·764 indicates that adherence is not a statistically significant predictor of the outcome (death vs. improvement). The model’s accuracy is 60·9%, which is only marginally better than random chance (50%).
The t-test was used to compare the mean length of hospital stay (LOS) between patients with CAP and HAP (t-statistic: 0·534, p = 0·594). This indicates no significant difference in the LOS between CAP and HAP patients in this dataset.
The overall improvement rate was 70·3%, with 2·7% showing partial improvement and a mortality rate of 27·0%. The detection of specific pathogens appeared to correlate with clinical outcomes, as highlighted by the relationship between pathogen type and patient recovery status.
Antibiotics Susceptibility Patterns
displays the counts of each susceptibility category (resistance, intermediate, sensitive) for various antibiotics for every detected microorganism. The dataset reveals varying antibiotic resistance and sensitivity levels among the recorded cases. The antibiotic with the highest sensitivity rate is Levofloxacin. Conversely, the antibiotic with the highest resistance rate is Ampicillin. These findings indicate significant variations in antibiotic effectiveness, emphasising the importance of targeted antibiotic prescription based on sensitivity testing (Figure 5).
Figure 6 is a heatmap that shows the resistance patterns across different antibiotics. This will show the resistance levels for each antibiotic across the samples. The susceptibility data has been prepared with resistance levels represented as numerical values:
1: Resistance
0·5: Intermediate
0: Sensitive
The line plot in Figure 7 illustrates the monthly trends in antibiotic resistance for each antibiotic over the recorded period. This visualisation helps identify any seasonal patterns or trends in antibiotic resistance levels.
The analysis of antibiotic resistance patterns reveals significant trends over time, with certain antibiotics demonstrating stable resistance levels while others exhibit fluctuations. Notably, peaks in resistance levels occur during specific months, suggesting potential outbreaks or seasonal variations. For instance, resistance levels for Imipenem and Pipracillin_tazobactam show significant peaks around September and October, possibly due to higher infection rates or increased antibiotic use during these months.
Some antibiotics consistently display higher resistance levels compared to others, which could reflect overuse or widespread resistance mechanisms. Periods of increase or decrease in resistance levels may correlate with changes in prescribing practices or the introduction of new treatment guidelines. For example, Cefepime and Meropenem exhibit periodic increases in resistance, suggesting seasonal variations or specific challenges. Resistance for Cefepime tends to rise towards the end of the year, aligning with colder months, possibly reflecting higher hospital usage rates to combat pneumonia and other respiratory infections prevalent in fall and winter.
The Figure also displays the monthly resistance trends for the top five antibiotics with the highest resistance levels. Each line represents one of these antibiotics, showing how resistance has varied over time.
The analysis of antibiotic resistance patterns reveals key insights regarding the persistence and variability of resistance among different antibiotics. Ceftazidime and Ampicillin consistently show high resistance levels throughout the observed period, indicating ongoing resistance challenges that require attention. In contrast, antibiotics such as Pipracillin_tazobactam and Cefazolin exhibit noticeable peaks in resistance at specific times, suggesting the influence of seasonal trends or changes in prescribing practices. Aztreonam displays fluctuations with intermittent periods of increased resistance, highlighting variable resistance challenges across different timeframes.
- The x-axis represents time in year-month format, showing the timeline of the study period.
- The y-axis indicates the number of resistant isolates identified each month for each antibiotic.
- Each line represents one antibiotic, and its position on the y-axis reflects the number of resistant isolates detected in that month.
- Different colors distinguish the antibiotics, with a legend provided to the right for clarity.
Antibiotic Usage
Various antibiotics were used empirically and in targeted therapy (Table 7). The most frequently used antibiotics included azithromycin, amphotericin B, ampicillin, clindamycin, and imipenem-cilastatin, with a significant shift towards targeted therapy for drugs such as meropenem, tigecycline, and cefepime.
4. Discussion
The demographic characteristics of participants in research studies are critical for understanding the population being studied and drawing meaningful conclusions. Comorbidities often influence microbial profiles and antimicrobial susceptibility, The presence of pre-existing conditions can alter the gut microbiome, which plays a crucial role in immune function and response to infections [28]. Understanding the impact of comorbidities may lead to more tailored treatment strategies, enhancing recovery outcomes for affected individuals. Future research should focus on the interrelationships between specific comorbidities, microbial diversity, and treatment effectiveness in order to develop personalised rehabilitation protocols that optimise patient care and minimise the risk of antibiotic resistance.
This study highlights significant differences in pathogen detection between molecular methods (qPCR) and traditional culture techniques, underscoring the importance of integrating both approaches to enhance pneumonia management. Our findings reveal that the qPCR identified pathogens in 74·8% of patients, compared to 57·7% detected by culture methods. This disparity is consistent with previous research emphasising PCR’s superior sensitivity and ability to detect fastidious organisms that might not grow in culture, such as viruses and certain bacteria [29-31]. For instance, FilmArray PP detected respiratory pathogens with 90% positive agreement and altered antibiotic prescriptions in 40·7% of patients [32].
The qPCR has consistently demonstrated higher sensitivity in detecting pathogens than culture methods. For instance, in a study involving COPD patients, qPCR identified significantly more bacterial pathogens than culture (P<0·001), with common pathogens like S. pneumoniae and P. aeruginosa being more frequently detected by qPCR [29].
One of the major advantages of qPCR over culture is the rapid turnaround time. Traditional culture methods can yield results up to 72 hours, whereas qPCR can provide results within hours. For example, a multiplex qPCR assay for detecting CAP-associated microorganisms demonstrated a turnaround time of within one working day, significantly faster than culture methods [33]. This rapid detection is crucial for timely clinical decision-making and appropriate antibiotic administration.
While qPCR is more sensitive, it also shows high specificity. A study comparing qPCR and culture for detecting respiratory pathogens in pneumonia patients showed higher positivity rates for pathogens like H. influenzae and M. catarrhalis than culture [30]. However, there were discrepancies, such as the detection of additional pathogens by qPCR that were not identified by culture, indicating qPCR’s superior sensitivity [31].
The qPCR assays can simultaneously detect multiple pathogens and antibiotic resistance genes, which is a significant advantage over culture methods. Similar to what we used in this study (except for antibiotic resistance genes), the Biofire® Filmarray Pneumonia Panel can identify 33 targets, including bacteria, viruses, and resistance genes, providing comprehensive diagnostic information that culture methods cannot match [31]. This multiplex capability is instrumental in managing pneumonia patients, where co-infections and resistance patterns are common.
The enhanced sensitivity and rapid qPCR results can lead to better clinical outcomes by enabling more accurate and timely diagnosis. For instance, using qPCR to detect S. aureus in endotracheal aspirates showed higher sensitivity and specificity compared to culture, which can inform targeted preventive and therapeutic strategies in VAP [34]. Additionally, qPCR’s ability to detect pathogens in samples where culture fails, such as in patients pre-treated with antibiotics, underscores its clinical utility [35].
In summary, qPCR offers several advantages over traditional culture methods in detecting microorganisms in pneumonia patients, including higher sensitivity, faster turnaround times, and the ability to simultaneously detect multiple pathogens and resistance genes. These benefits can lead to more accurate diagnoses and better-informed clinical decisions, ultimately improving patient outcomes.
Unlike culture methods, qPCR offers a molecular approach to pathogen detection, identifying and quantifying DNA from bacteria present in samples [17-19,21,36-38]. This study showcases a broader spectrum of pathogens detected compared to culture methods, including both cultivable and non-cultivable species. This method’s sensitivity is evident in detecting lower-abundance bacteria, such as Chlamydia pneumoniae and Mycoplasma pneumoniae, which may not grow well in culture. The presence of these pathogens underscores the advantage of qPCR in comprehensive pathogen profiling, especially in complex infections. The broader detection range provides a more holistic view of the infectious landscape, aiding in developing targeted treatment strategies.
PCR can quantify the amount of microbial DNA or RNA present, which can help assess the severity of infection and monitor response to treatment.
The diverse range of pathogens identified by PCR in our study, including Bordetella pertussis, Chlamydophila pneumoniae, and multiple viral agents, demonstrates the complexity of pneumonia infections. The high rate of bacterial-virus co-infections (36·9%) is particularly noteworthy, as similar studies have shown that mixed infections can complicate clinical outcomes and necessitate tailored antimicrobial therapies [17,21,39]. This complexity underscores the limitations of relying solely on traditional cultural methods, which may overlook significant co-pathogens.
The prevalence of Staphylococcus aureus and Escherichia coli as dominant bacterial species aligns with other studies that report these pathogens as leading causes of pneumonia [40,41]. However, detecting a broader range of pathogens through qPCR suggests that a more comprehensive diagnostic approach could better inform empirical treatment strategies and improve patient outcomes.
Staphylococcus aureus, particularly methicillin-resistant Staphylococcus aureus (MRSA), has been increasingly recognised as a significant pathogen in various infections, including pneumonia. MRSA has emerged as a significant cause of community-acquired pneumonia (CAP), particularly necrotising pneumonia, which is severe and often follows viral infections like influenza. Furthermore, S. aureus, including MRSA, is a leading cause of bacterial infections in developed countries, contributing to a wide range of diseases, including fatal pneumonia [42].
S. aureus-associated pneumonia often presents with severe symptoms such as hemoptysis, multilobar infiltrates, and neutropenia, especially in community-acquired MRSA [40]. High mortality rates are associated with S. aureus-associated pneumonia, particularly in young, otherwise healthy individuals and those with concurrent viral infections [43].
Escherichia coli is traditionally known as a common cause of urinary tract infections and gastrointestinal diseases. However, its role in CAP has been increasingly recognised, prompting investigations into its epidemiology, clinical features, and outcomes. Some studies suggest E. coli is an essential and severe cause of community-acquired pneumonia with high mortality rates, while other studies indicate it is an infrequent cause but still associated with significant mortality and complications [44,45].
E. coli is an under-recognised but important cause of CAP, with studies showing it accounts for a small but significant percentage of pneumonia cases [45,46]. Patients with E. coli CAP tend to be older, more severely ill, and have higher in-hospital and 90-day mortality rates compared to those with pneumococcal pneumonia [45,46]. E. coli CAP is associated with higher rates of ICU admission, mechanical ventilation, and vasopressor use compared to pneumococcal pneumonia [46].
E. coli pneumonia is frequently associated with bacteremia, with many cases showing positive blood cultures [44,46]. High resistance rates to fluoroquinolones and ceftriaxone have been reported, necessitating cautious use of these antibiotics in empirical treatment [45,46].
E. coli CAP patients are often older, more likely to be female, and frequently come from nursing homes. They also present with severe illness and confusion [47]. The infection may originate from an occult gastrointestinal source, even without abdominal or urinary symptoms [44].
E. coli, while not the most common cause of CAP, is a significant and severe pathogen in this context. It is associated with high mortality, severe clinical presentations, and notable antibiotic resistance. The recognition of E. coli as a cause of CAP is crucial for appropriate diagnosis and treatment, especially in older and severely ill patients.
This study provides valuable insights into the clinical implications of different bacterial infections, emphasising the importance of accurate pathogen identification in guiding treatment decisions and improving patient outcomes. By linking pathogen presence to specific outcomes, healthcare providers can better tailor their therapeutic approaches to address the unique challenges of various infections, ultimately enhancing patient care.
The average length of hospital stay (12·1 days) observed in our study is slightly longer than findings from similar research (Median = 9 days) [48-50], which highlights the substantial healthcare burden of pneumonia and the need for improved management strategies. However, our reported ICU stay (5·2 days) is less than that of other previous studies (an average of 12 days) [51].
The study’s mortality rate of 27% is higher than some other reports, suggesting that more effective diagnostic and treatment protocols could improve survival rates. For example, integrating molecular diagnostics has facilitated early pathogen identification, allowing for more targeted antimicrobial therapy and potentially reducing mortality. The 30-day mortality rate for pneumonia patients varies but is around 11·1% to 13% [52,53]. Intra-hospital mortality rates for CAP can be as high as 20·4% [54].
The research revealed that qPCR exhibited higher sensitivity and broader detection capabilities than traditional culture methods (p < 0·001). This finding corroborates previous studies that emphasise the superior sensitivity of qPCR in detecting fastidious and non-culturable pathogens, which are often missed by culture techniques [55-59].
The qPCR remains effective in detecting pathogens even after antibiotic treatment, a significant advantage over culture methods that often fail in such scenarios [60].
The chi-square analysis further demonstrated a strong correlation between the two detection methods. However, qPCR’s ability to identify pathogens more accurately highlights its crucial role in rapid and precise diagnostic work. The higher sensitivity of qPCR (96·9%) was compared to culture (86·3%). However, it effectively identifies true positives, facilitating timely and appropriate therapeutic interventions. However, the higher false positive rate observed in qPCR (21·7% vs. 5·3% for culture) necessitates careful interpretation of results and may require confirmatory testing to avoid unnecessary treatments.
The analysis of clinical outcomes about pathogen detection sheds light on the critical role of early and accurate identification of microbial agents in influencing patient recovery and mortality rates. The study identified spec concerns such as Bordetella pertussis, Klebsiella pneumoniae, Human Coronavirus (HCoV), and Human Parainfluenza Virus 3 (HPV3) as being associated with higher mortality rates. In contrast, previous studies suggest that Bordetella pertussis is associated with higher pneumonia mortality rates, while other pathogens like Klebsiella pneumoniae, Human Coronavirus, and Human Parainfluenza Virus 3 are not specifically mentioned with pneumonia mortality rates [61-67]. Bordetella pertussis is strongly associated with pneumonia, particularly in children, and has been identified as a significant pathogen in both high TB prevalence areas and well-vaccinated populations [65]
The observed high rate of non-adherence among improved patients may have several explanations. One possibility is selection bias, where patients who are less severely ill are more likely to deviate from treatment guidelines but still recover. These individuals may not require the same level of strict adherence as those with more severe conditions. Additionally, there may be treatment variability, with some patients receiving effective treatments that are not necessarily guideline-adherent but tailored to their needs. Such personalised approaches may lead to successful outcomes despite not following standard protocols. Furthermore, data limitations could also play a role; the dataset used might not capture all relevant factors, such as comorbidities or the severity of illness, which could influence adherence and outcomes.
Some studies suggest that adherence to community-acquired and ventilator-associated pneumonia guidelines is associated with better outcomes. In contrast, other studies indicate no significant improvement in outcomes for hospital-acquired pneumonia or with specific feedback interventions. Implementing guidelines for community-acquired pneumonia (CAP) led to improvements in the care process, such as increased adherence to recommended antibiotic treatments and reduced CAP-related mortality, although not all results were statistically significant [68]. Real-time electronic clinical decision support tools in emergency departments improved adherence to guidelines and were associated with lower mortality in patients with CAP [69]. A quality improvement project for CAP showed that guideline adherence reduced the hospital LOS and improved other process indicators [68]. Feedback with blinded peer comparison significantly improved physician adherence to guidelines for pneumonia and sepsis, leading to better compliance with recommended treatments [70]. Guidelines for VAP emphasise the importance of timely and appropriate antibiotic therapy, which is associated with improved survival rates [71].
Understanding that treatment guidelines are general recommendations for average cases is essential. They may not always apply to the unique needs of individual patients. In clinical practice, decision-making can be complex, and clinicians might choose non-adherence when they believe alternative treatments are more suitable for a particular patient. This flexibility allows healthcare providers to consider the nuances of each case and adapt treatment plans accordingly.
When interpreting the data, it is crucial to distinguish between association and causation. While there is an observed association between non-adherence and improvement, this does not imply that non-adherence causes improvement. The high percentage of non-adherence among those who improved suggests the need for exploratory analysis to understand the underlying reasons and potential impacts. Further investigation is warranted to uncover the factors driving non-adherence and its effects on patient outcomes.
This analysis suggests that adherence to treatment guidelines is not a significant predictor of patient outcomes within this dataset. This implies that other factors may play a more critical role in determining outcomes or that the current sample size or data quality may not be adequate to detect a significant effect. Further research incorporating additional variables or a larger sample size might provide more significant insights into the predictors of patient outcomes.
More in-depth research is necessary to understand the relationship between guideline adherence and patient outcomes. Future studies should explore the factors influencing adherence, such as the severity of illness, comorbidities, and specific treatments received. This additional data could provide valuable insights into the observed patterns. Additionally, it is essential to recognise the role of clinical judgment in treatment decisions, acknowledging that personalised approaches may be needed beyond standard guidelines. These interpretations underscore the complexity of clinical outcomes and highlight the importance of nuanced analysis that goes beyond simple adherence metrics.
The study’s analysis of antibiotic resistance patterns revealed substantial resistance among certain antibiotics, notably Imipenem, piperacillin-tazobactam, and Cefepime. The heatmap visualisation demonstrated varying resistance levels, with Imipenem showing a balanced distribution between resistance and sensitivity, while piperacillin-tazobactam exhibited higher resistance rates. These findings are consistent with previous studies suggesting that resistance rates to Imipenem, piperacillin-tazobactam, and Cefepime are high, with specific rates being 33·9%, 38·6%, and 35·6%, respectively [72-74].
Studies indicate high resistance rates to non-carbapenem beta-lactams, including piperacillin-tazobactam and Cefepime, in countries like Turkey, India, China, and Spain [72,73]. For instance, resistance rates for piperacillin-tazobactam and Cefepime in P. aeruginosa were reported to be 33·9% and 35·6% in Turkey [72].
In a randomised trial, imipenem/cilastatin/relebactam was found to be noninferior to piperacillin/tazobactam in treating hospital-acquired or ventilator-associated bacterial pneumonia, with similar safety profiles [74].
The resistance to Imipenem, piperacillin-tazobactam, and Cefepime is notably high in certain regions and has been increasing over time, particularly in ICU settings. Imipenem/cilastatin generally shows higher treatment success and lower mortality rates compared to piperacillin-tazobactam and Cefepime, although it is associated with more adverse events. Piperacillin-tazobactam remains viable in settings with lower resistance profiles but is less effective in high-resistance regions [72-74]. Local resistance patterns and patient-specific factors should guide the choice of antibiotics to optimise treatment outcomes.
The line plot analysis of monthly trends in antibiotic resistance revealed seasonal peaks in resistance levels, particularly for Imipenem and piperacillin-tazobactam, around September and October. This may reflect increased infection rates and antibiotic use during these months.
Seasonal patterns are evident in the fluctuations of certain antibiotics, particularly around September and October. Imipenem shows noticeable resistance peaks during these months, suggesting seasonal variations linked to higher infection rates or increased antibiotic use. This trend might be associated with increased hospital admissions for respiratory illnesses in the fall, leading to higher use of broad-spectrum antibiotics like Imipenem. Similarly, Pipracillin/tazobactam exhibits resistance spikes in September and October, aligning with the fall season’s rise in infectious diseases. This increased use could result in resistant strains as the antibiotic is more frequently prescribed. For Cefepime, resistance trends rise towards the end of the year, coinciding with colder months, as healthcare providers might rely on Cefepime for severe infections, especially when facing resistance to other antibiotics.
The data indicates that antibiotic resistance for certain drugs increases during the fall months, possibly correlating with higher prescription rates due to seasonal illnesses. Understanding these trends can inform antibiotic stewardship efforts, ensuring judicious use during high-demand periods. Hospitals and clinics might implement targeted interventions during the fall to minimise unnecessary antibiotic use and curb resistance. Investigating conditions or infections driving these trends could provide additional insights for effective prevention and treatment strategies. This analysis highlights the role of seasonal trends in antibiotic resistance and underscores the importance of adjusting public health strategies accordingly.
No direct evidence from the previous studies indicates that resistance rates for Imipenem and piperacillin-tazobactam are higher around September and October [72,74-76]. The studies focus more on general trends and geographical variations rather than specific seasonal patterns [72,74].
Integrating qPCR with traditional methods enhances pathogen detection and supports personalised medicine by tailoring treatments based on specific microbial profiles and susceptibility patterns.
The rise of antibiotic-resistant S. aureus strains, including MRSA, complicates treatment, necessitating alternative antibiotics like linezolid and combination therapies [40,77].
In light of these findings, there is a compelling case for developing national guidelines in Jordan that incorporate both molecular and traditional diagnostic methods, thereby promoting personalised medicine approaches. Such guidelines would facilitate more accurate diagnoses, leading to tailored treatment plans that improve patient outcomes and reduce hospital stays. Additionally, the high prevalence of viral infection among our patients highlights the importance of viral screening in pneumonia management.
5. Conclusions
The persistently high resistance levels observed for antibiotics like Ceftazidime and Ampicillin underscore the need for alternative treatment strategies and enhanced antibiotic stewardship efforts. Seasonal patterns in resistance, as seen with Pipracillin/tazobactam and Cefazolin, suggest that targeted interventions during specific months could help mitigate the rise in resistance. Understanding these trends enables healthcare providers to make data-driven decisions, optimising antibiotic use and potentially reducing the emergence of resistant strains. This approach is critical in adapting to resistance patterns and ensuring effective treatment outcomes.
Antibiotics like Pipracillin/tazobactam display consistently high resistance levels, indicating potential overuse or prevalent resistance mechanisms. In contrast, antibiotics such as Cefepime and Meropenem exhibit periodic resistance increases, indicating seasonal variations or specific challenges. These findings highlight the need for ongoing surveillance and potential reevaluation of treatment protocols, especially for antibiotics with rising resistance trends. Tailoring antibiotic stewardship programs to address these patterns could help mitigate resistance. Identifying factors contributing to resistance trends, such as antibiotic usage patterns, could provide valuable insights for public health interventions.
The findings underscore the need for national guidelines in Jordan to incorporate molecular diagnostics alongside traditional methods, ensuring comprehensive and accurate microbial profiling. This integration is pivotal in advancing personalised medicine and improving patient outcomes in pneumonia management. Future research should focus on longitudinal studies to monitor resistance trends and the effectiveness of integrated diagnostic approaches in diverse clinical settings.
Author Contributions
A R.A.: Conceptualized and designed the study; performed data collection and analysis; supervised the study; contributed to the interpretation of results; wrote the initial draft of the manuscript; reviewed and edited the manuscript; provided overall guidance and expertise throughout the study. S. M.A.: Validation and reviewed and edited the manuscript. M.Z.: (Physician): Assisted with the study design; provided medical expertise in interpreting clinical data; reviewed and edited the manuscript. H.A.K.: reviewed and edited the manuscript. O.A.: (Physician): Assisted in patient recruitment and clinical data collection; contributed to medical insights; reviewed and edited the manuscript. A.D.P.: Assisted with data analysis; reviewed and edited the manuscript. L.Z.H.: reviewed and edited the manuscript. M.Z: Assisted with the study design; coordinated the study logistics; reviewed and edited the manuscript.
Funding
This research received no external funding.
Institutional Review Board Statement
The study was conducted as part of routine surveillance and ethical approval from the Institutional Review Board (IRB) committee (1053/2021/151).
Informed Consent Statement
The consent from the patients was waived.
Conflicts of Interest
The authors declare no competing interests.
References
- Zambare, K.K.; Thalkari, A.B.J.A.J.o.P.R. Overview on Pathophysiology of Pneumonia. 2019, 9. 9.
- Mandell, L.A.J.P.m. Community-acquired pneumonia: an overview. 2015, 127, 607-615.
- Assefa, M.; Tigabu, A.; Belachew, T.; Tessema, B.J.P.o. Bacterial profile, antimicrobial susceptibility patterns, and associated factors of community-acquired pneumonia among adult patients in Gondar, Northwest Ethiopia: a cross-sectional study. 2022, 17, e0262956.
- Ghia, C.J.; Dhar, R.; Koul, P.A.; Rambhad, G.; Fletcher, M.A.J.C.M.I.C., Respiratory; Medicine, P. Streptococcus pneumoniae as a cause of community-acquired pneumonia in Indian adolescents and adults: a systematic review and meta-analysis. 2019, 13, 1179548419862790.
- Lozano, R.; Naghavi, M.; Foreman, K.; Lim, S.; Shibuya, K.; Aboyans, V.; Abraham, J.; Adair, T.; Aggarwal, R.; Ahn, S.Y.; et al. Global and regional mortality from 235 causes of death for 20 age groups in 1990 and 2010: a systematic analysis for the Global Burden of Disease Study 2010. Lancet (London, England) 2012, 380, 2095–2128. [Google Scholar] [CrossRef]
- Torres, A.; Peetermans, W.E.; Viegi, G.; Blasi, F.J.T. Risk factors for community-acquired pneumonia in adults in Europe: a literature review. 2013, 68, 1057-1065.
- Almirall, J.; Serra-Prat, M.; Bolíbar, I.; Balasso, V.J.R. Risk factors for community-acquired pneumonia in adults: a systematic review of observational studies. 2017, 94, 299-311.
- Ayukekbong, J.A.; Ntemgwa, M.; Atabe, A.N.J.A.R.; Control, I. The threat of antimicrobial resistance in developing countries: causes and control strategies. 2017, 6, 1-8.
- Alsayed, A.R.; El Hajji, F.D.; Al-Najjar, M.A.; Abazid, H.; Al-Dulaimi, A. Patterns of antibiotic use, knowledge, and perceptions among different population categories: A comprehensive study based in Arabic countries. Saudi Pharmaceutical Journal 2022, 30, 317–328. [Google Scholar] [CrossRef] [PubMed]
- Sheu, C.C.; Gong, M.N.; Zhai, R.; Bajwa, E.K.; Chen, F.; Thompson, B.T.; Christiani, D.C. The influence of infection sites on development and mortality of ARDS. Intensive care medicine 2010, 36, 963–970. [Google Scholar] [CrossRef] [PubMed]
- Kollef, M.H.; Shorr, A.; Tabak, Y.P.; Gupta, V.; Liu, L.Z.; Johannes, R.S. Epidemiology and outcomes of health-care-associated pneumonia: results from a large US database of culture-positive pneumonia. Chest 2005, 128, 3854–3862. [Google Scholar] [CrossRef]
- Rello, J.; Lisboa, T.; Lujan, M.; Gallego, M.; Kee, C.; Kay, I.; Lopez, D.; Waterer, G.W. Severity of pneumococcal pneumonia associated with genomic bacterial load. Chest 2009, 136, 832–840. [Google Scholar] [CrossRef]
- Blejan, I.E.; Diaconu, C.C.; Arsene, A.L.; Udeanu, D.I.; Ghica, M.; Drăgănescu, D.; Burcea Dragomiroiu, G.; Rădulescu, M.; Maltezou, H.C.; Tsatsakis, A.M.J.F. Antibiotic resistance in community-acquired pneumonia. A Romanian perspective. 2020, 68, 512–520. [Google Scholar]
- Bathala, N.S.; Kumar, A.S.; Sasidhar, M.J.I.J.o.S. ; Research. Prevalence of Streptococcus Pneumoniae in Community Acquired Pneumonia and their Antibiotic Susceptibility Pattern in a Tertiary Care Hospital, South India. 2017, 6, 1940–1943. [Google Scholar]
- Adhanom, G.; Gebreegziabiher, D.; Weldu, Y.; Gebreyesus Wasihun, A.; Araya, T.; Legese, H.; Lopes, B.S.; Saravanan, M.J.B.r.i. Species, risk factors, and antimicrobial susceptibility profiles of bacterial isolates from HIV-infected patients suspected to have pneumonia in Mekelle zone, Tigray, northern Ethiopia. 2019, 2019.
- Zakharenkov, I.; Rachina, S.; Dekhnich, N.; Kozlov, R.; Sinopalnikov, A.; Ivanchik, N.; Yatsyshina, S.; Elkina, M.; Archipenko, M.; Gordeeva, S.J.T.a. Etiology of severe community-acquired pneumonia in adults: results of the first Russian multicenter study. 2020, 92, 36-42.
- Alsayed, A.R.; Hasoun, L.; Khader, H.A.; Abu-Samak, M.S.; Al-Shdifat, L.M.; Al-Shammari, B.; Maqbali, M.A. Co-infection of COVID-19 patients with atypical bacteria: A study based in Jordan. Pharmacy Practice 2023, 21, 1–5. [Google Scholar] [CrossRef]
- Al-Dulaimi, A.; Alsayed, A.R.; Al Maqbali, M.; Zihlif, M. Investigating the human rhinovirus co-infection in patients with asthma exacerbations and COVID-19. Pharmacy Practice 2022, 20, 1–10. [Google Scholar] [CrossRef]
- Alsayed, A.R.; Abed, A.; Abu-Samak, M.; Alshammari, F.; Alshammari, B. Etiologies of Acute Bronchiolitis in Children at Risk for Asthma, with Emphasis on the Human Rhinovirus Genotyping Protocol. Journal of Clinical Medicine 2023, 12, 3909. [Google Scholar] [CrossRef]
- Alsayed, A.R.; Abed, A.; Jarrar, Y.B.; Alshammari, F.; Alshammari, B.; Basheti, I.A.; Zihlif, M. Alteration of the Respiratory Microbiome in Hospitalized Patients with Asthma–COPD Overlap during and after an Exacerbation. Journal of Clinical Medicine 2023, 12, 2118. [Google Scholar] [CrossRef] [PubMed]
- Alsayed, A.R.; Abed, A.; Khader, H.A.; Al-Shdifat, L.M.; Hasoun, L.; Al-Rshaidat, M.M.; Alkhatib, M.; Zihlif, M. Molecular Accounting and Profiling of Human Respiratory Microbial Communities: Toward Precision Medicine by Targeting the Respiratory Microbiome for Disease Diagnosis and Treatment. International Journal of Molecular Sciences 2023, 24, 4086. [Google Scholar] [CrossRef] [PubMed]
- Alsayed, A.R.; Abed, A.; Khader, H.A.; Hasoun, L.; Al Maqbali, M.; Al Shawabkeh, M.J. The role of human rhinovirus in COPD exacerbations in Abu Dhabi: molecular epidemiology and clinical significance. Libyan Journal of Medicine 2024, 19, 2307679. [Google Scholar] [CrossRef]
- Alsayed, A.R.; Al-Dulaimi, A.; Alkhatib, M.; Al Maqbali, M.; Al-Najjar, M.A.A.; Al-Rshaidat, M.M. A comprehensive clinical guide for Pneumocystis jirovecii pneumonia: A missing therapeutic target in HIV-uninfected patients. Expert Review of Respiratory Medicine 2022, 16, 1167–1190. [Google Scholar] [CrossRef]
- Alsayed, A.R.; Talib, W.; Al-Dulaimi, A.; Daoud, S.; Al Maqbali, M. The first detection of Pneumocystis jirovecii in asthmatic patients post-COVID-19 in Jordan. Bosnian Journal of Basic Medical Sciences 2022, 22, 784. [Google Scholar] [CrossRef]
- Alsuof, E.A.; Alsayed, A.R.; Zraikat, M.S.; Khader, H.A.; Hasoun, L.Z.; Zihlif, M.; Ata, O.A.; Zihlif, M.A.; Abu-Samak, M.; Al Maqbali, M. Molecular Detection of Antibiotic Resistance Genes using Respiratory Sample from Pneumonia Patients. Antibiotics 2025, 14, 502. [Google Scholar] [CrossRef]
- Restrepo, M.I.; Babu, B.L.; Reyes, L.F.; Chalmers, J.D.; Soni, N.J.; Sibila, O.; Faverio, P.; Cilloniz, C.; Rodriguez-Cintron, W.; Aliberti, S. Burden and risk factors for Pseudomonas aeruginosa community-acquired pneumonia: a multinational point prevalence study of hospitalised patients. The European respiratory journal 2018, 52. [Google Scholar] [CrossRef]
- Ahmed, J.U.; Hossain, M.D.; Rahim, M.A.; Afroz, F.; Musa, A.J.B.M.J. Bacterial Etiology and Antibiotic Sensitivity Pattern of Community Acquired Pneumonia in Diabetic Patients: Experience in a Tertiary Care Hospital in Bangladesh. 2017, 7, 101-105.
- Bazzocchi, G.; Turroni, S.; Bulzamini, M.C.; D’Amico, F.; Bava, A.; Castiglioni, M.; Cagnetta, V.; Losavio, E.; Cazzaniga, M.; Terenghi, L. Changes in gut microbiota in the acute phase after spinal cord injury correlate with severity of the lesion. Scientific reports 2021, 11, 12743. [Google Scholar] [CrossRef]
- Farrell, H.O.; Shaw, J.; Felicia, G.; Bowman, R.; Fong, K.; Krause, L.; Yang, I. Potential clinical utility of multiple target quantitative polymerase chain reaction (qPCR) array to detect microbial pathogens in patients with chronic obstructive pulmonary disease (COPD). Journal of thoracic disease, 17. [CrossRef]
- Schoonbroodt, S.; Ichante, J.; Sophie, B.; Devos, N.; Devaster, J.; Laura, T.; Rondini, S.; Arora, A.; Thierry, G.P.; Ludovic, M. Real-time PCR has advantages over culture-based methods in identifying major airway bacterial pathogens in chronic obstructive pulmonary disease: Results from three clinical studies in Europe and North America. Frontiers in Microbiology 2023, 13. [Google Scholar] [CrossRef]
- Emad Abu, S.; Nicole, H.; Suleyman, G. Comparison of Multiplex Polymerase Chain Reaction (PCR) and Routine Culture for the Detection of Respiratory Pathogens in Pneumonia Patients. Open Forum Infectious Diseases 2019, 6. [Google Scholar] [CrossRef]
- Courtney, P.O.; Adrian, P.; Madhi, S. Performance of the Biomark HD real-time qPCR System (Fluidigm) for the detection of nasopharyngeal bacterial pathogens and Streptococcus pneumoniae typing. Scientific Reports 2019, 9. [Google Scholar] [CrossRef]
- Koo, S.; Jiang, B.; Lim, P.Q.; La, M.; Tan, T. Development of a rapid multiplex PCR assay for the detection of common pathogens associated with community-acquired pneumonia. Transactions of the Royal Society of Tropical Medicine and Hygiene, 1093. [Google Scholar] [CrossRef]
- Coppens, J.; Heirstraeten, L.V.; Ruzin, A.; Li, Y.; Timbermont, L.; Lammens, C.; Matheeussen, V.; Michael, M.; Philippe, J.; Ieven, M.; et al. Comparison of GeneXpert MRSA/SA ETA assay with semi-quantitative and quantitative cultures and nuc gene-based qPCR for detection of Staphylococcus aureus in endotracheal aspirate samples. Antimicrobial Resistance & Infection Control 2019, 8. [Google Scholar] [CrossRef]
- Elberse, K.; Mens, S.V.v.; Cremers, A.; Meijvis, S.; Vlaminckx, B.; Jonge, M.D.d.; Meis, J.; Cornelis, B.; Pol, I.v.d.; Schouls, L. Detection and serotyping of pneumococci in community acquired pneumonia patients without culture using blood and urine samples. BMC Infectious Diseases 2015, 15. [Google Scholar] [CrossRef]
- Alsayed, A.R.; Abed, A.; Al Shawabkeh, M.J.; Aldarawish, R.R.; Al-Shajlawi, M.; Alabbas, N. Human Rhinovirus: Molecular and Clinical Overview. Pharmacy Practice (Granada) 2024, 22, 1. [Google Scholar]
- Alsayed, A.R.; Abed, A.; Zihlif, M.; Abu-Samak, M.S.; Almuhur, R.A.; Alkhatib, M. The first study characterizing the respiratory microbiome in cystic fibrosis patients in Jordan. Pharmacy Practice 2023, 21, 1–6. [Google Scholar] [CrossRef]
- Alsayed, A.R.; Al-Dulaimi, A.; Alkhatib, M.; Al Maqbali, M.; Al-Najjar, M.A.A.; Al-Rshaidat, M.M.D. A comprehensive clinical guide for Pneumocystis jirovecii pneumonia: a missing therapeutic target in HIV-uninfected patients. Expert Rev Respir Med 2022, 16, 1167–1190. [Google Scholar] [CrossRef]
- Tarsia, P.; Aliberti, S.; Pappalettera, M.; Blasi, F. Mixed Community-Acquired Lower Respiratory Tract Infections. Current Infectious Disease Reports 2007, 9, 14–20. [Google Scholar] [CrossRef]
- Hangyong, H.; Wunderink, R. Staphylococcus aureus Pneumonia in the Community. Seminars in Respiratory and Critical Care Medicine 2020, 41, 470–479. [Google Scholar] [CrossRef]
- Hidrón, A.; Low, C.E.; Honig, E.; Blumberg, H. Emergence of community-acquired meticillin-resistant Staphylococcus aureus strain USA300 as a cause of necrotising community-onset pneumonia. The Lancet. Infectious diseases 2009, 9 6, 384–392. [Google Scholar] [CrossRef]
- Gordon, Y.C.C.; Justin, S.B.; Otto, M. Pathogenicity and virulence of Staphylococcus aureus. Virulence 2021, 12, 547–569. [Google Scholar] [CrossRef]
- Kallen, A.; Brunkard, J.; Zachary, M.; Philip, J.B.; Arnold, K.; Fosheim, G.; Finelli, L.; Beekmann, S.; Polgreen, P.; Gorwitz, R.; et al. Staphylococcus aureus community-acquired pneumonia during the 2006 to 2007 influenza season. Annals of emergency medicine 2009, 53 3, 358–365. [Google Scholar] [CrossRef]
- Ganipisetti, V.; Dudiki, N.; Anand, A. A Diagnostic Quandary of Escherichia Coli Pneumonia: A Case Report and Literature Review. Cureus 2023, 15. [Google Scholar] [CrossRef] [PubMed]
- Teny, M.J.; Deshpande, A.; Brizendine, K.; Pei-Chun, Y.; Rothberg, M. Epidemiology and Outcomes of Community-Acquired Escherichia coli Pneumonia. Open Forum Infectious Diseases 2021, 9. [Google Scholar] [CrossRef]
- Teny, M.J.; Deshpande, A.; Haessler, S.; Brizendine, K.; Pei-Chun, Y.; Imrey, P.; Rothberg, M. 1457. Escherichia coli Community Acquired Pneumonia. Open Forum Infectious Diseases 2018, 5. [Google Scholar] [CrossRef]
- Marrie, T.; Fine, M.; Obrosky, D.; Coley, C.; Singer, D.; Kapoor, W. Community-acquired pneumonia due to Escherichia coli. Clinical microbiology and infection : the official publication of the European Society of Clinical Microbiology and Infectious Diseases 1998, 4 12, 717-723. 12. [CrossRef]
- Bikmalla, S.; Khalil, M.; Ganaie, M. Predictors of length of stay in hospitalized patients with community acquired pneumonia. European Respiratory Journal 2013, 42, 2757. [Google Scholar]
- Hwei-Ling, C.; Huang, S. Pulmonary Rehabilitation Shortens Length of Hospital Stay for Patients With Pneumonia. Respiratory Care 2018, 63, 2960301. [Google Scholar]
- Rosario, M.; Cremades, M.J.; Martínez-Moragón, E.; Soler, J.J.; Reyes, S.; Perpin̄á, M. Duration of length of stay in pneumonia: influence of clinical factors and hospital type. European Respiratory Journal 2003, 22, 643–648. [Google Scholar] [CrossRef]
- Yaowen, Z.; Zhiyuan, Y.; Zhan, S.; Zhirong, Y.; Dong, W.; Jing, Z.; Jingyi, L.; Kyaw, M. Disease burden of intensive care unit-acquired pneumonia in China: a systematic review and meta-analysis. International journal of infectious diseases : IJID : official publication of the International Society for Infectious Diseases 2014, 29, 84–90. [Google Scholar] [CrossRef]
- Søgaard, M.; Nielsen, R.; Schønheyder, H.; Nørgaard, M.; Thomsen, R. Nationwide trends in pneumonia hospitalization rates and mortality, Denmark 1997-2011. Respiratory medicine 2014, 108 8, 1214–1222. [Google Scholar] [CrossRef]
- Bratzler, D.; Normand, S.; Yun, W.; Donnell, W.O.; Metersky, M.; Han, L.; Rapp, M.; Krumholz, H. An Administrative Claims Model for Profiling Hospital 30-Day Mortality Rates for Pneumonia Patients. PLoS ONE 2011, 6. [Google Scholar] [CrossRef]
- Teixeira-Lopes, F.; Cysneiros, A.; Dias, A.; Durão, V.; Christine, C.; Paula, F.; Margarida, S.; Baltazar, N.; Any Carolina Ióca, D.; Froes, F. Intra-hospital mortality for community-acquired pneumonia in mainland Portugal between 2000 and 2009. Pulmonology 2019, 25 2, 66–70. [Google Scholar] [CrossRef]
- Ariel, D.S.; Malek, A.; Ying, J.; Micah, M.B.; Wurster, S.; Kontoyiannis, D. Serum (1,3)-Beta-D-Glucan has suboptimal performance for the diagnosis of Pneumocystis jirovecii pneumonia in cancer patients and correlates poorly with respiratory burden as measured by quantitative PCR. The Journal of infection, 1016. [Google Scholar] [CrossRef]
- Huber, T.; Serr, A.; Geißdörfer, W.; Hess, C.; Christian, L.-A.; Loewenich, F.V.v.; Bogdan, C.; Held, J. Evaluation of the Amplex eazyplex Loop-Mediated Isothermal Amplification Assay for Rapid Diagnosis of Pneumocystis jirovecii Pneumonia. Journal of Clinical Microbiology 2020, 58. [Google Scholar] [CrossRef] [PubMed]
- Ishi, K.; Krista, L.; Jeanette, C.; Benjamin, C.D.; Erin, M.; Harwood, V.; Pruden, A. A framework for standardized qPCR-targets and protocols for quantifying antibiotic resistance in surface water, recycled water and wastewater. Critical Reviews in Environmental Science and Technology 2022, 52, 4395–4419. [Google Scholar] [CrossRef]
- Mercier, T.; Ellen, G.; Patteet, S.; Beuselinck, K.; Lagrou, K.; Maertens, J. Beta-d-Glucan for Diagnosing Pneumocystis Pneumonia: a Direct Comparison between the Wako β-Glucan Assay and the Fungitell Assay. Journal of Clinical Microbiology 2019, 57. [Google Scholar] [CrossRef] [PubMed]
- Yoon, S.; Min, I.; Jong Gyun, A. Immunochromatography for the diagnosis of Mycoplasma pneumoniae infection: A systematic review and meta-analysis. PLoS ONE 2020, 15. [Google Scholar] [CrossRef]
- Abdeldaim, G.; Strålin, K.; Korsgaard, J.; Blomberg, J.; Welinder-Olsson, C.; Herrmann, B. Multiplex quantitative PCR for detection of lower respiratory tract infection and meningitis caused by Streptococcus pneumoniae, Haemophilus influenzae and Neisseria meningitidis. BMC Microbiology 2010, 10, 310–310. [Google Scholar] [CrossRef]
- Breanna, B.-K.; Knoll, M.; Kagucia, E.; Christine, P.; Baggett, H.; Brooks, W.A.; Feikin, D.; Hammitt, L.; Howie, S.; Levine, O.; et al. Pertussis-Associated Pneumonia in Infants and Children From Low- and Middle-Income Countries Participating in the PERCH Study. Clinical Infectious Diseases: An Official Publication of the Infectious Diseases Society of America 2016, 63. [Google Scholar] [CrossRef]
- He, F.; Xia, X.; Danwen, N.; Hongmei, Y.; Yongzhong, J.; Xixiang, H.; Guo, F.; Bin, F.; Bing, H.; Honglin, J.; et al. Respiratory bacterial pathogen spectrum among COVID-19 infected and non–COVID-19 virus infected pneumonia patients. Diagnostic Microbiology and Infectious Disease 2020, 98, 115199–115199. [Google Scholar] [CrossRef]
- Macina, D.; Evans, K.E. Pertussis in Individuals with Co-morbidities: A Systematic Review. Infectious Diseases and Therapy 2021, 10, 1141–1170. [Google Scholar] [CrossRef]
- Manohar, P.; Loh, B.; Nachimuthu, R.; Hua, X.; Welburn, S.; Leptihn, S. Secondary Bacterial Infections in Patients With Viral Pneumonia. Frontiers in Medicine 2020, 7. [Google Scholar] [CrossRef]
- Marangu, D.; Zar, H. Childhood pneumonia in low-and-middle-income countries: An update. Paediatric Respiratory Reviews 2019, 32, 3–9. [Google Scholar] [CrossRef] [PubMed]
- Rhedin, S.; Lindstrand, A.; Annie, H.; Ryd-Rinder, M.; Öhrmalm, L.; Tolfvenstam, T.; Å, Ö.; Rotzén-Östlund, M.; Zweygberg-Wirgart, B.; Henriques-Normark, B.; et al. Respiratory viruses associated with community-acquired pneumonia in children: matched case–control study. Thorax 2015, 70, 847–853. [Google Scholar] [CrossRef] [PubMed]
- Xin, W.; You, L.; Maria, D.-K.; Madhi, S.; Cohen, C.; Arguelles, V.; Basnet, S.; Bassat, Q.; Brooks, W.A.; Echavarria, M.; et al. Global burden of acute lower respiratory infection associated with human parainfluenza virus in children younger than 5 years for 2018: a systematic review and meta-analysis. The Lancet. Global Health 2021, 9. [Google Scholar] [CrossRef]
- Fally, M.; Plessen, C.v.; Anhøj, J.; Benfield, T.; Tarp, B.; Lise Notander, C.; Kolte, L.; Emma, D.; Line, M.; Regitze, S.; et al. Improved treatment of community-acquired pneumonia through tailored interventions: Results from a controlled, multicentre quality improvement project. PLoS ONE 2020, 15. [Google Scholar] [CrossRef]
- Dean, N.; Jones, B.; Jones, J.; Jeffrey, P.F.; Herman, P.; Aronsky, D.; Vines, C.; Allen, T.; Haug, P. Impact of an Electronic Clinical Decision Support Tool for Emergency Department Patients With Pneumonia. Annals of emergency medicine 2015, 66 5, 511–520. [Google Scholar] [CrossRef]
- Trent, S.; Havranek, E.; Ginde, A.; Haukoos, J. Effect of Audit and Feedback on Physician Adherence to Clinical Practice Guidelines for Pneumonia and Sepsis. American Journal of Medical Quality 2018, 34, 217–225. [Google Scholar] [CrossRef]
- Bassi, G.; Ferrer, M.; Saucedo, L.; Torres, A. Do guidelines change outcomes in ventilator-associated pneumonia? Current Opinion in Infectious Diseases 2010, 23, 171. [Google Scholar] [CrossRef]
- Acar, A.; Karaahmetoglu, G.; Akalın, H.; Aybala, F.A. Pooled prevalence and trends of antimicrobial resistance in Pseudomonas aeruginosa clinical isolates over the past 10 years in Turkey: A meta-analysis. Journal of global antimicrobial resistance 2019, 18, 64–70. [Google Scholar] [CrossRef]
- Averbuch, D.; Orasch, C.; Mikulska, M.; Livermore, D.; Viscoli, C.; Gyssens, I.; Kern, W.; Klyasova, G.; Marchetti, O.; Engelhard, D.; et al. Re: "Comparison of antipseudomonal betalactams for febrile neutropenia empiric therapy: systematic review and network metaanalysis" by Horita et al. Clinical microbiology and infection : the official publication of the European Society of Clinical Microbiology and Infectious Diseases 2018, 24 6, 662-663. [CrossRef]
- Ivan, T.; Wunderink, R.; Roquilly, A.; Daniel Rodríguez, G.; David-Wang, A.; Boucher, H.; Kaye, K.; Losada, M.; Jiejun, D.; Tipping, R.; et al. A Randomized, Double-blind, Multicenter Trial Comparing Efficacy and Safety of Imipenem/Cilastatin/Relebactam Versus Piperacillin/Tazobactam in Adults With Hospital-acquired or Ventilator-associated Bacterial Pneumonia (RESTORE-IMI 2 Study). Clinical Infectious Diseases: An Official Publication of the Infectious Diseases Society of America 2020, 73. [Google Scholar] [CrossRef]
- Adam, G.S.; Paterson, D.; Young, B.; Lye, D.; Joshua, S.D.; Schneider, K.; Yılmaz, M.; Rümeysa, D.n.c.; Naomi, R.; Henderson, A.; et al. Meropenem Versus Piperacillin-Tazobactam for Definitive Treatment of Bloodstream Infections Caused by AmpC β-Lactamase–Producing Enterobacter spp, Citrobacter freundii, Morganella morganii, Providencia spp, or Serratia marcescens: A Pilot Multicenter Randomized Controlled Trial (MERINO-2). Open Forum Infectious Diseases 2021, 8. [Google Scholar] [CrossRef]
- Bitterman, R.; Fidi, K.; Mussini, C.; Geffen, Y.; Chowers, M.; Rahav, G.; Nesher, L.; Ben-Ami, R.; Turjeman, A.; Maayan Huberman, S.; et al. Piperacillin–tazobactam versus meropenem for treatment of bloodstream infections caused by third-generation cephalosporin-resistant Enterobacteriaceae: a study protocol for a non-inferiority open-label randomised controlled trial (PeterPen). BMJ Open 2021, 11. [Google Scholar] [CrossRef] [PubMed]
- DeLeo, F.; Chambers, H. Reemergence of antibiotic-resistant Staphylococcus aureus in the genomics era. The Journal of clinical investigation 2009, 119 9, 2464–2474. [Google Scholar] [CrossRef]
Figure 1.
Mono vs polymicrobial infections in the included pneumonia patients.
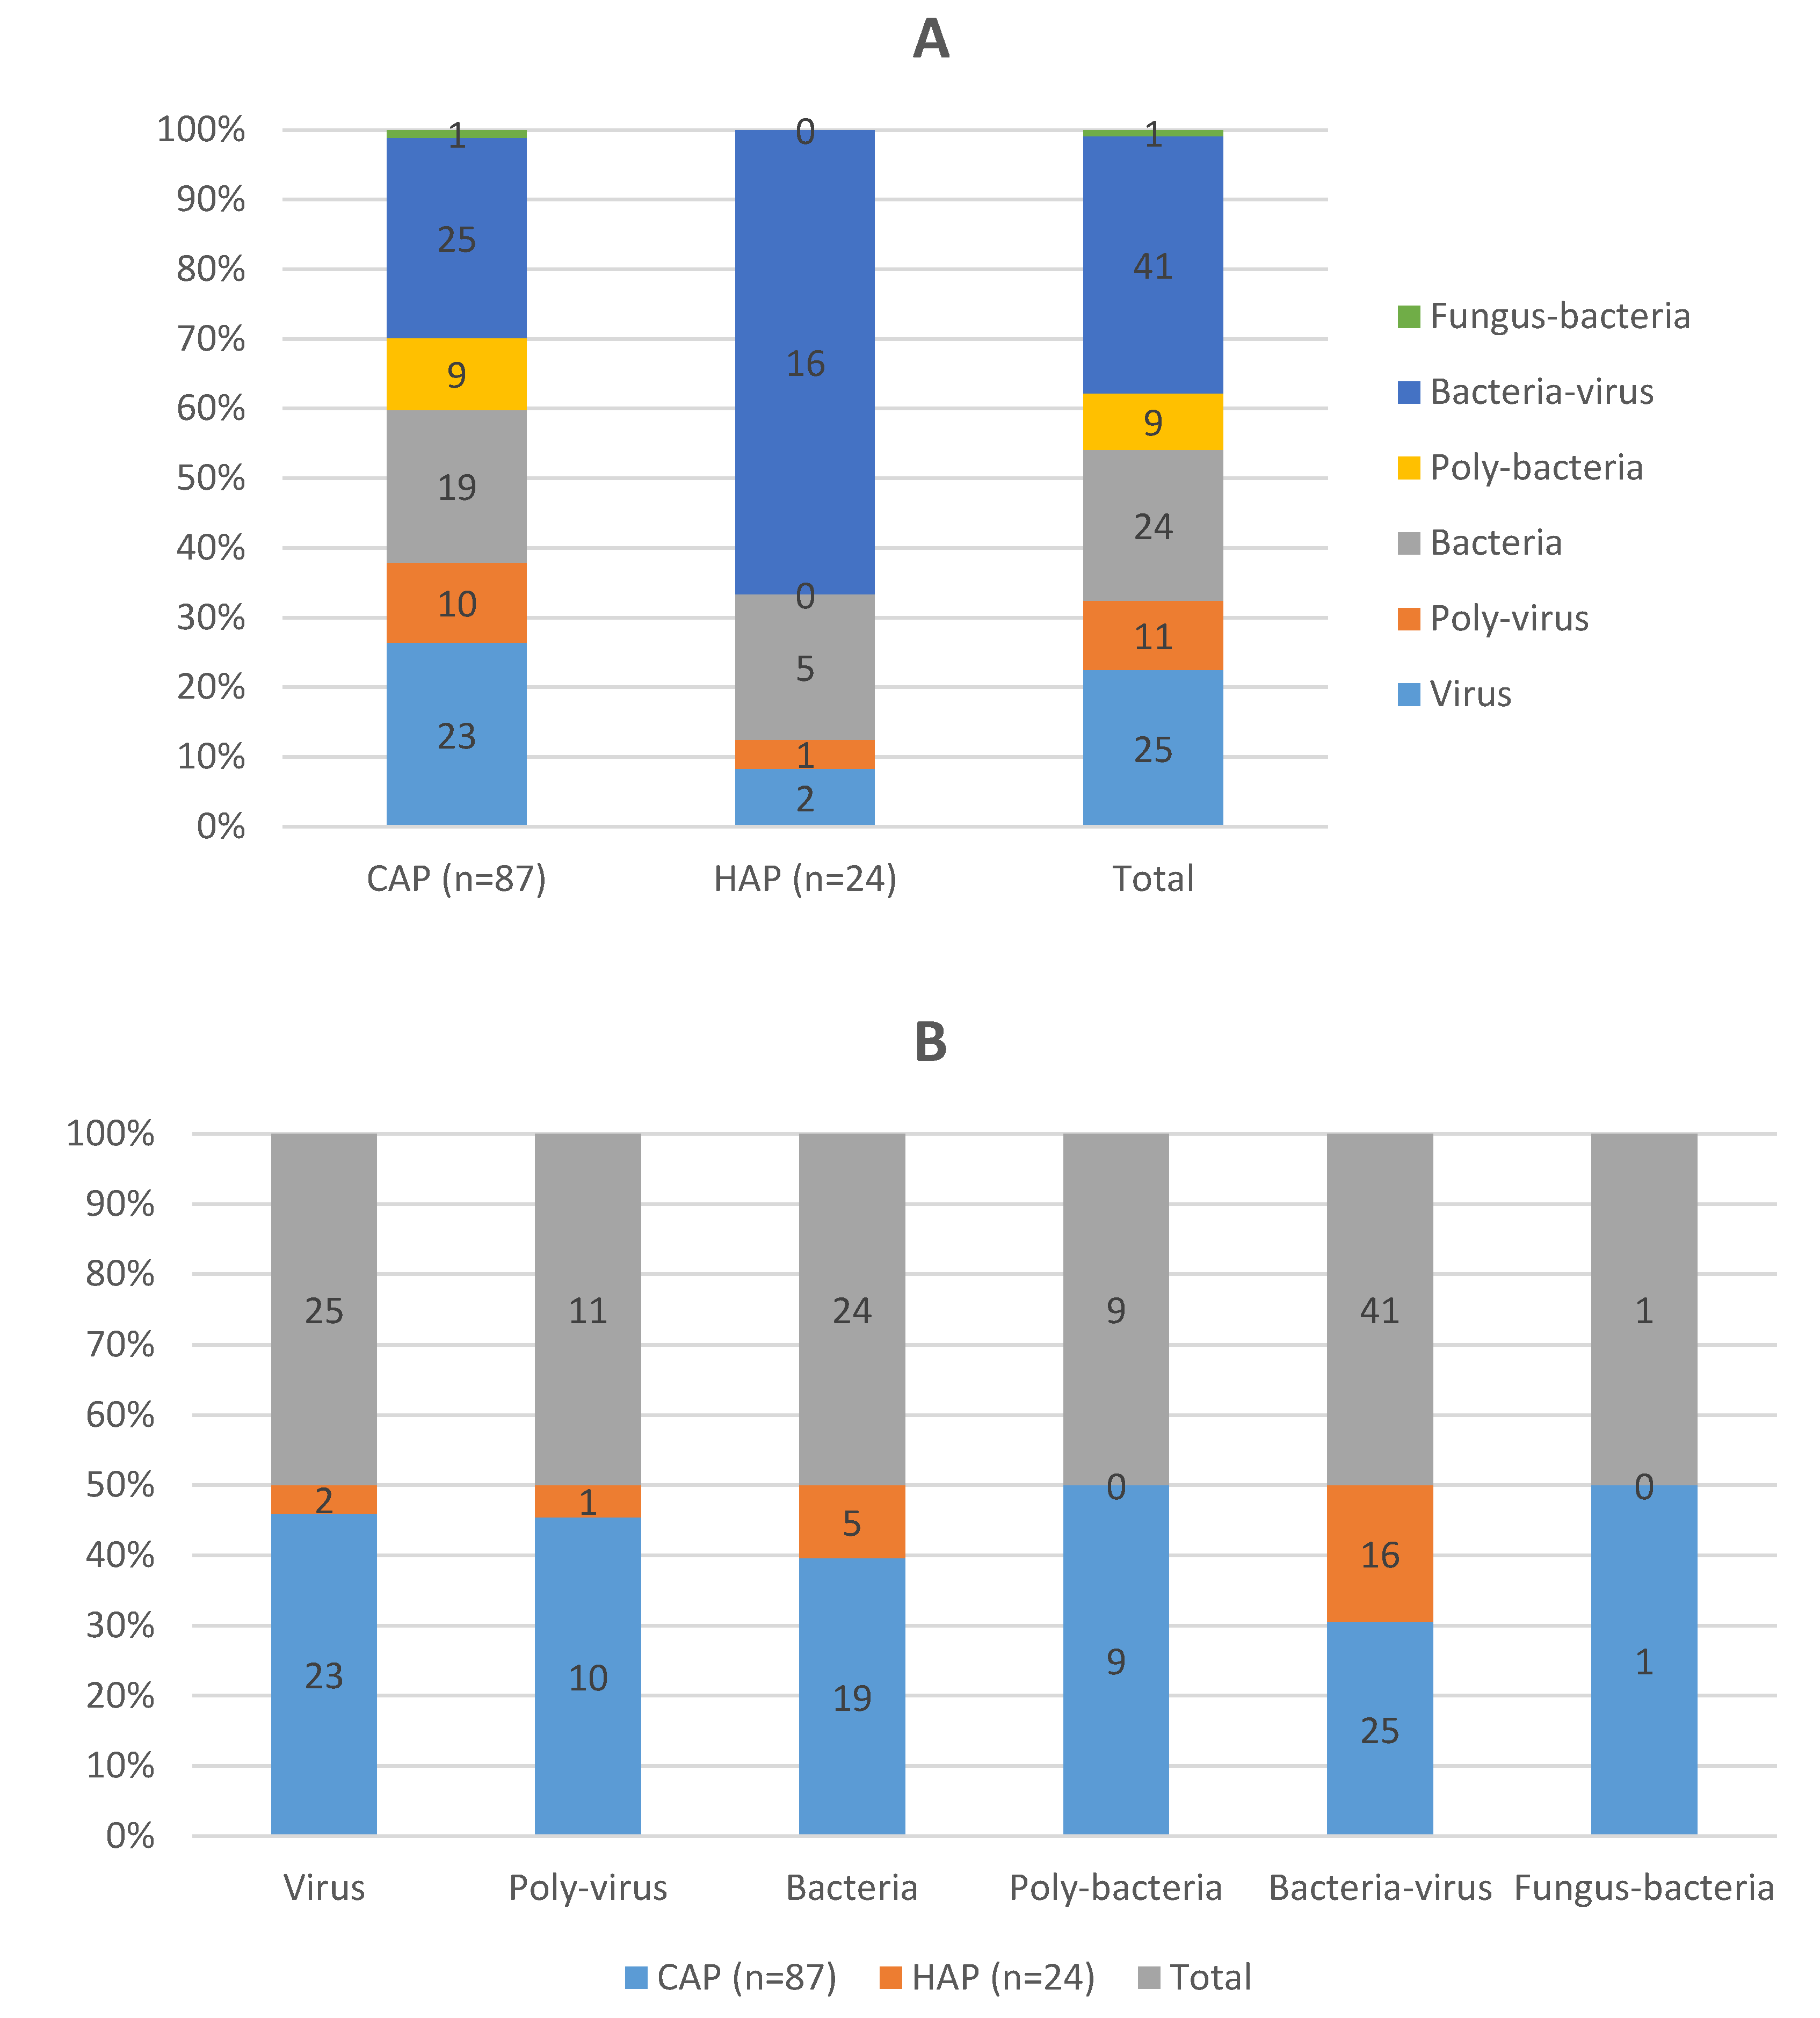
Figure 2.
Distribution of pathogens detected using culture and molecular methods.
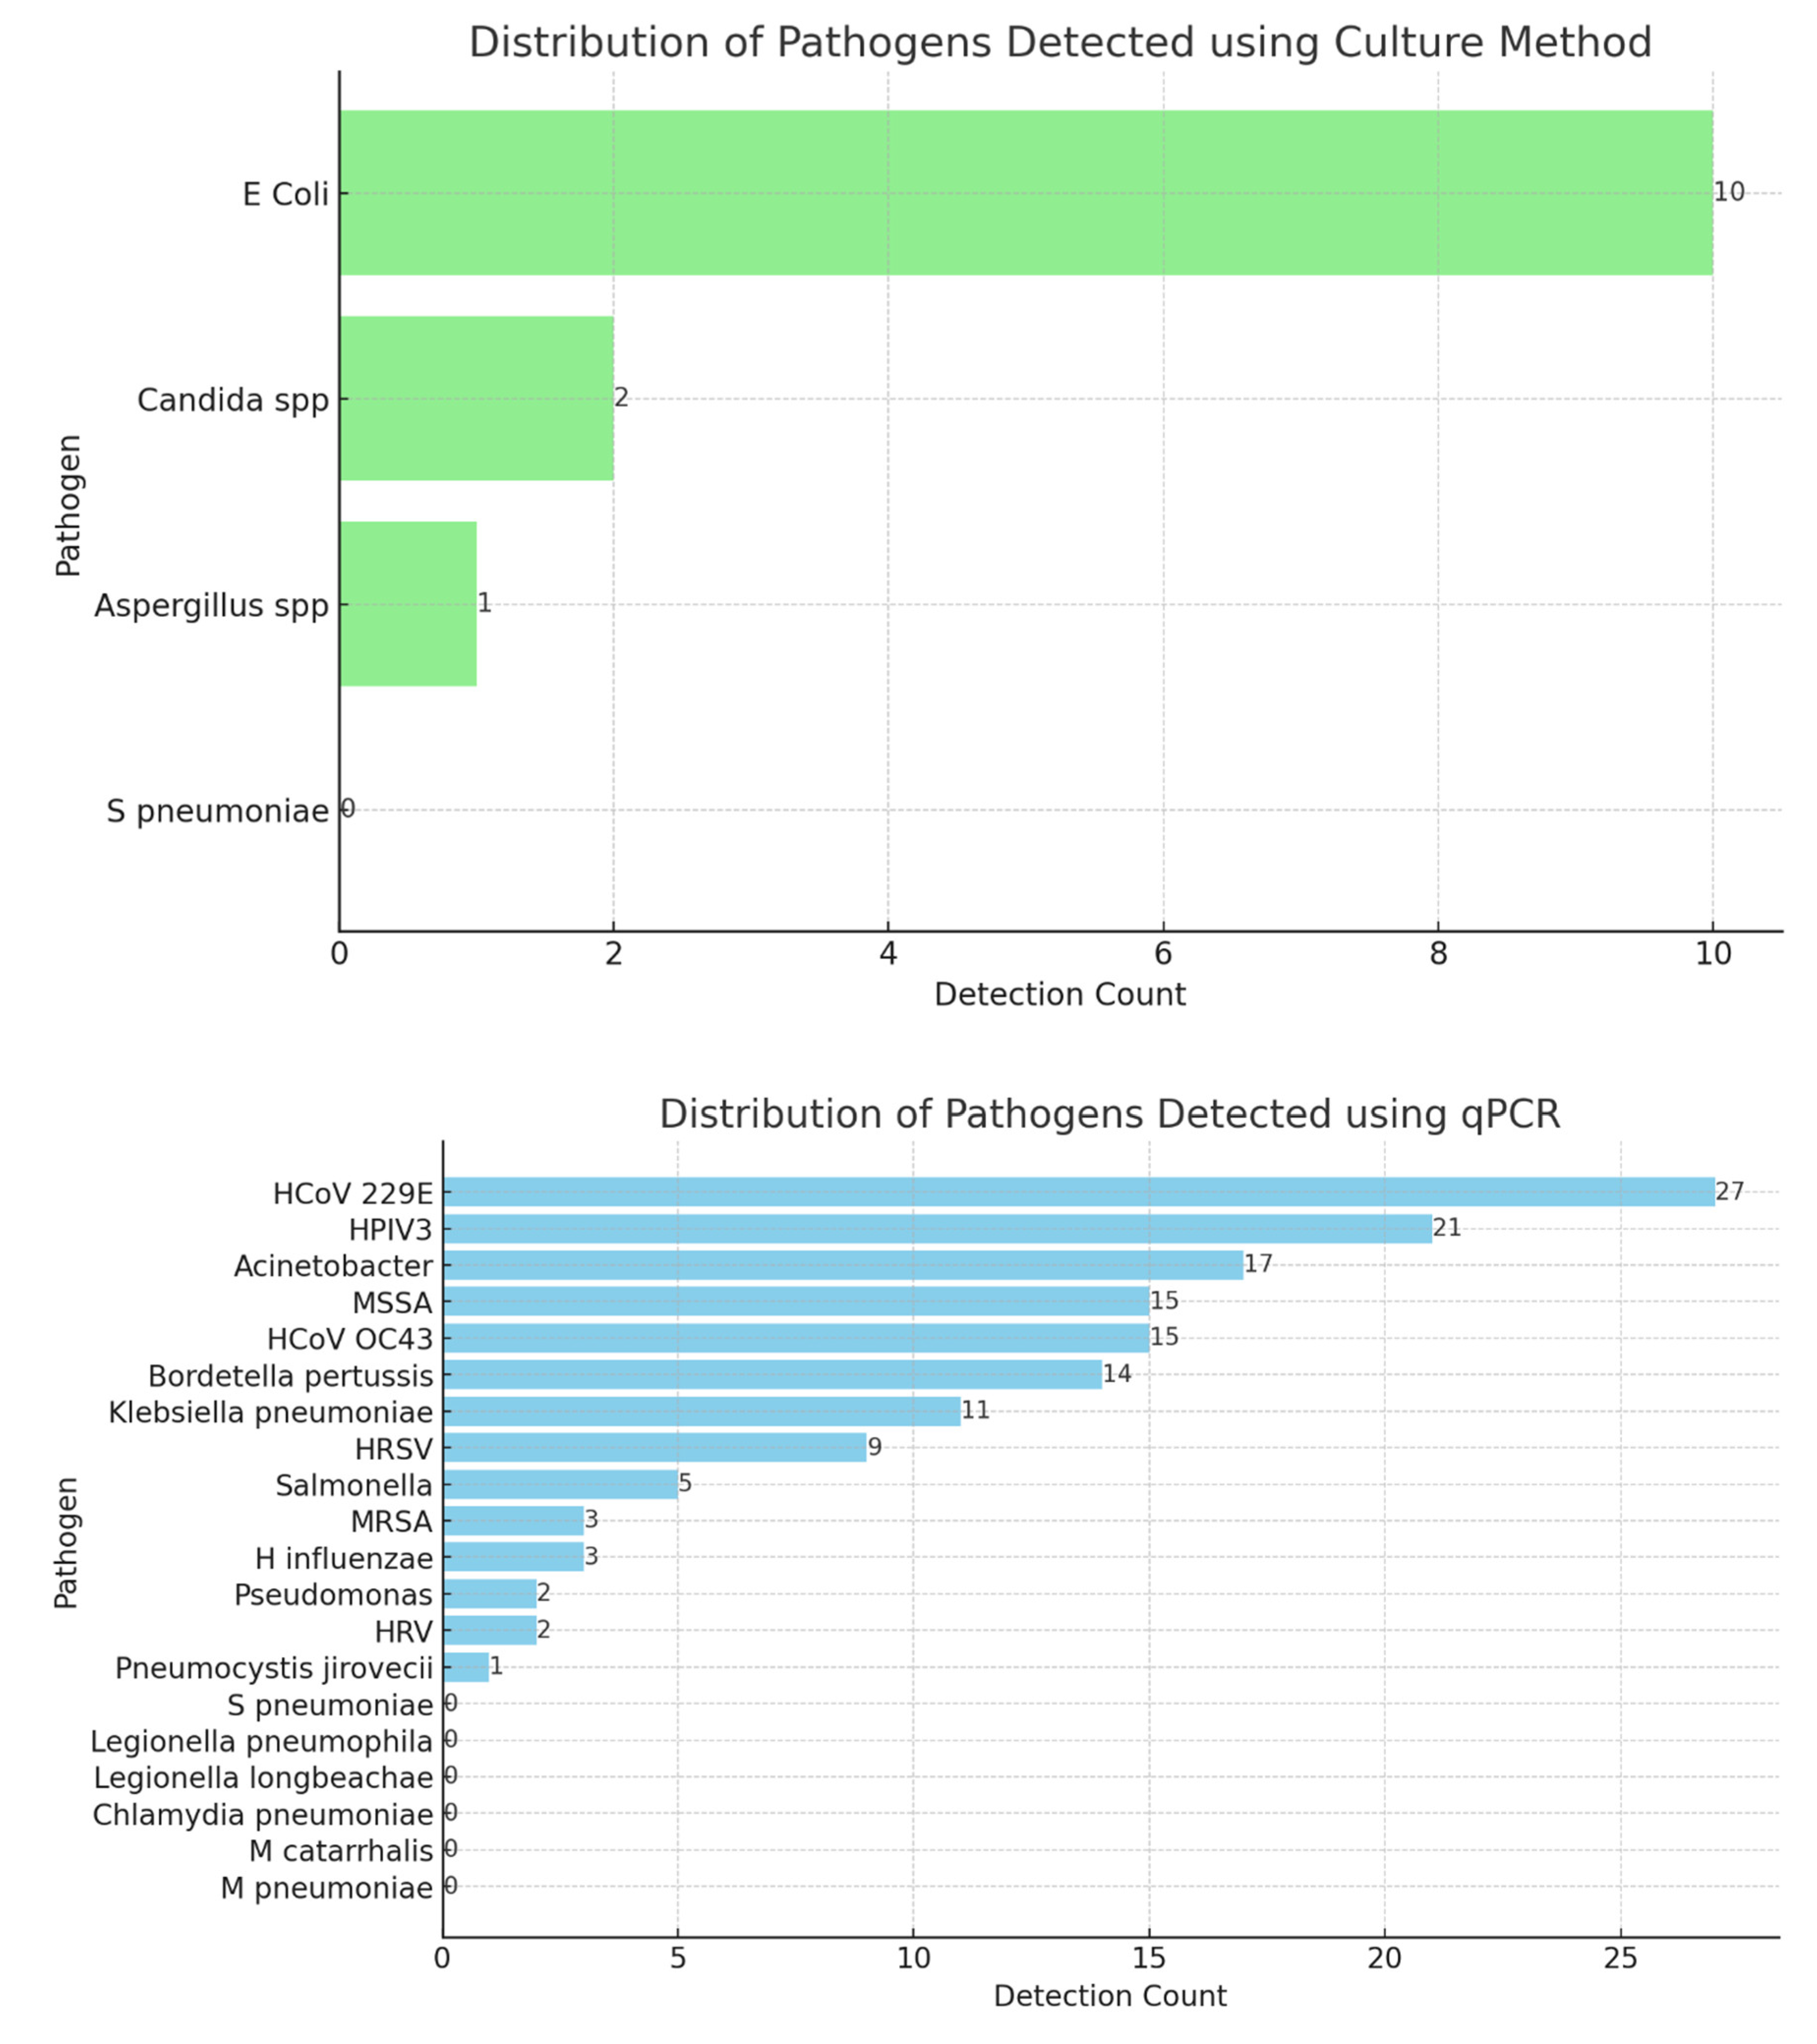
Figure 3.
Visualisation of clinical outcomes and pathogen detection.
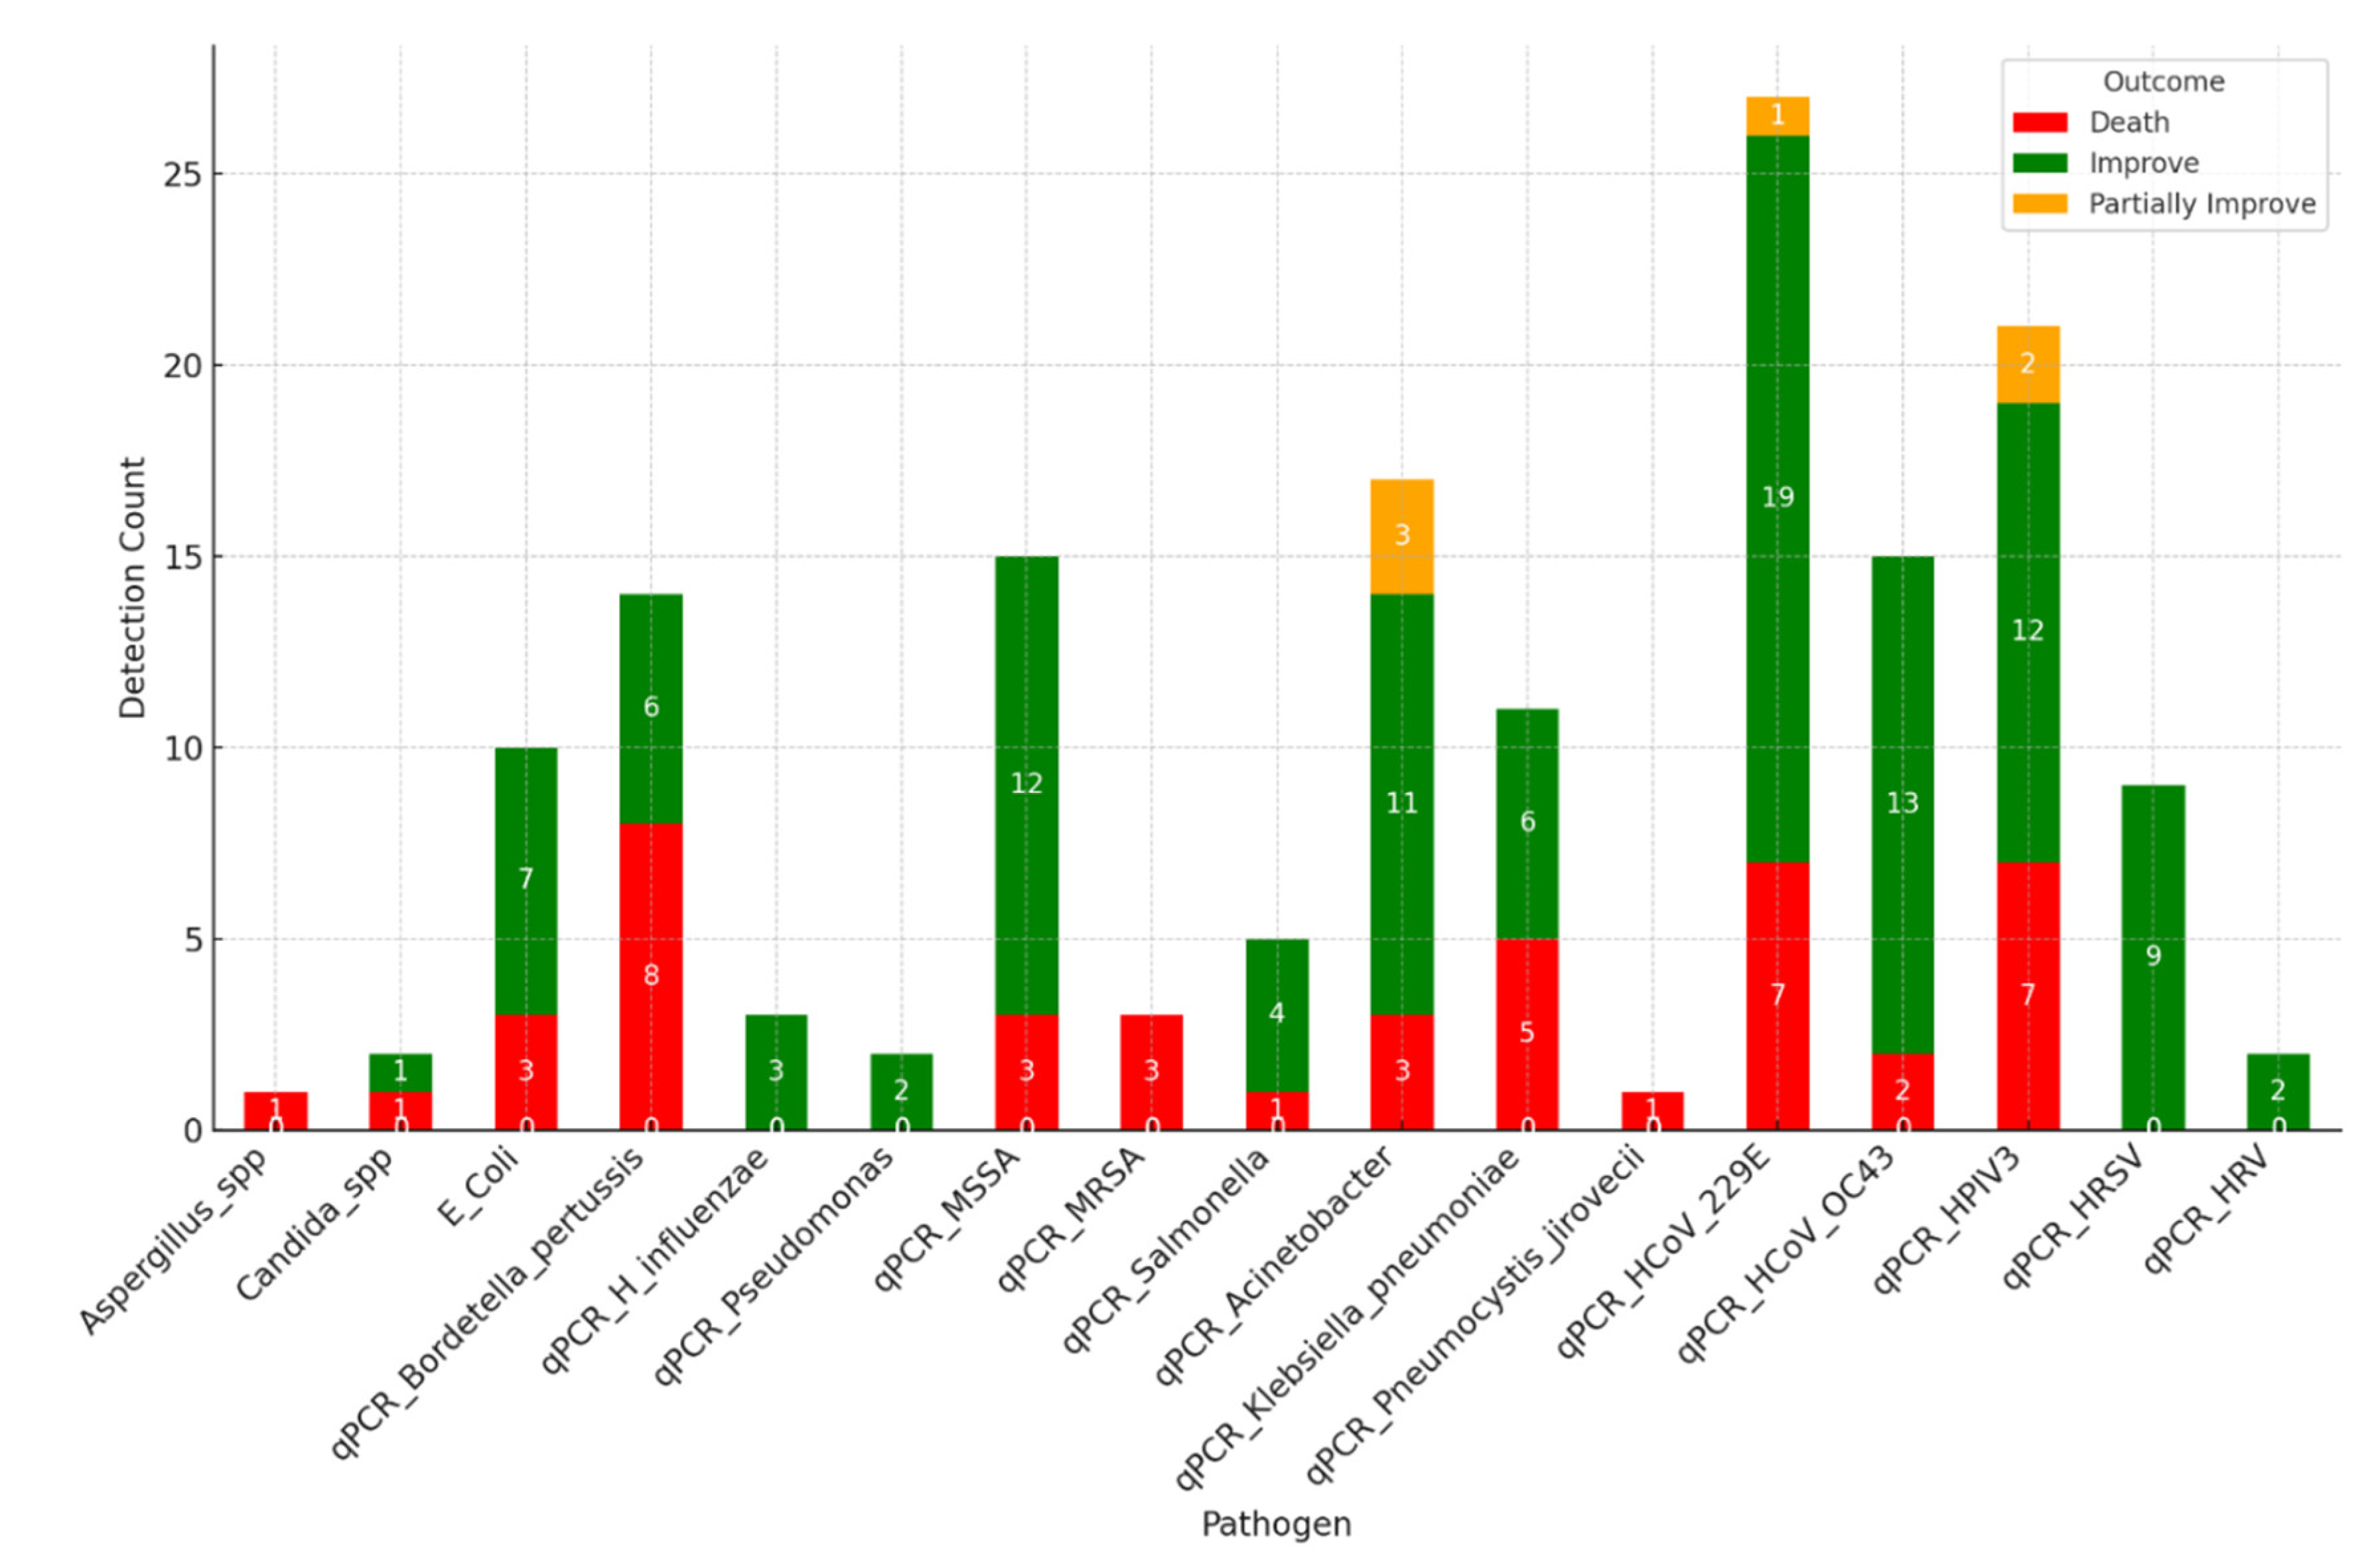
Figure 4.
Guideline adherence proportions by outcome.
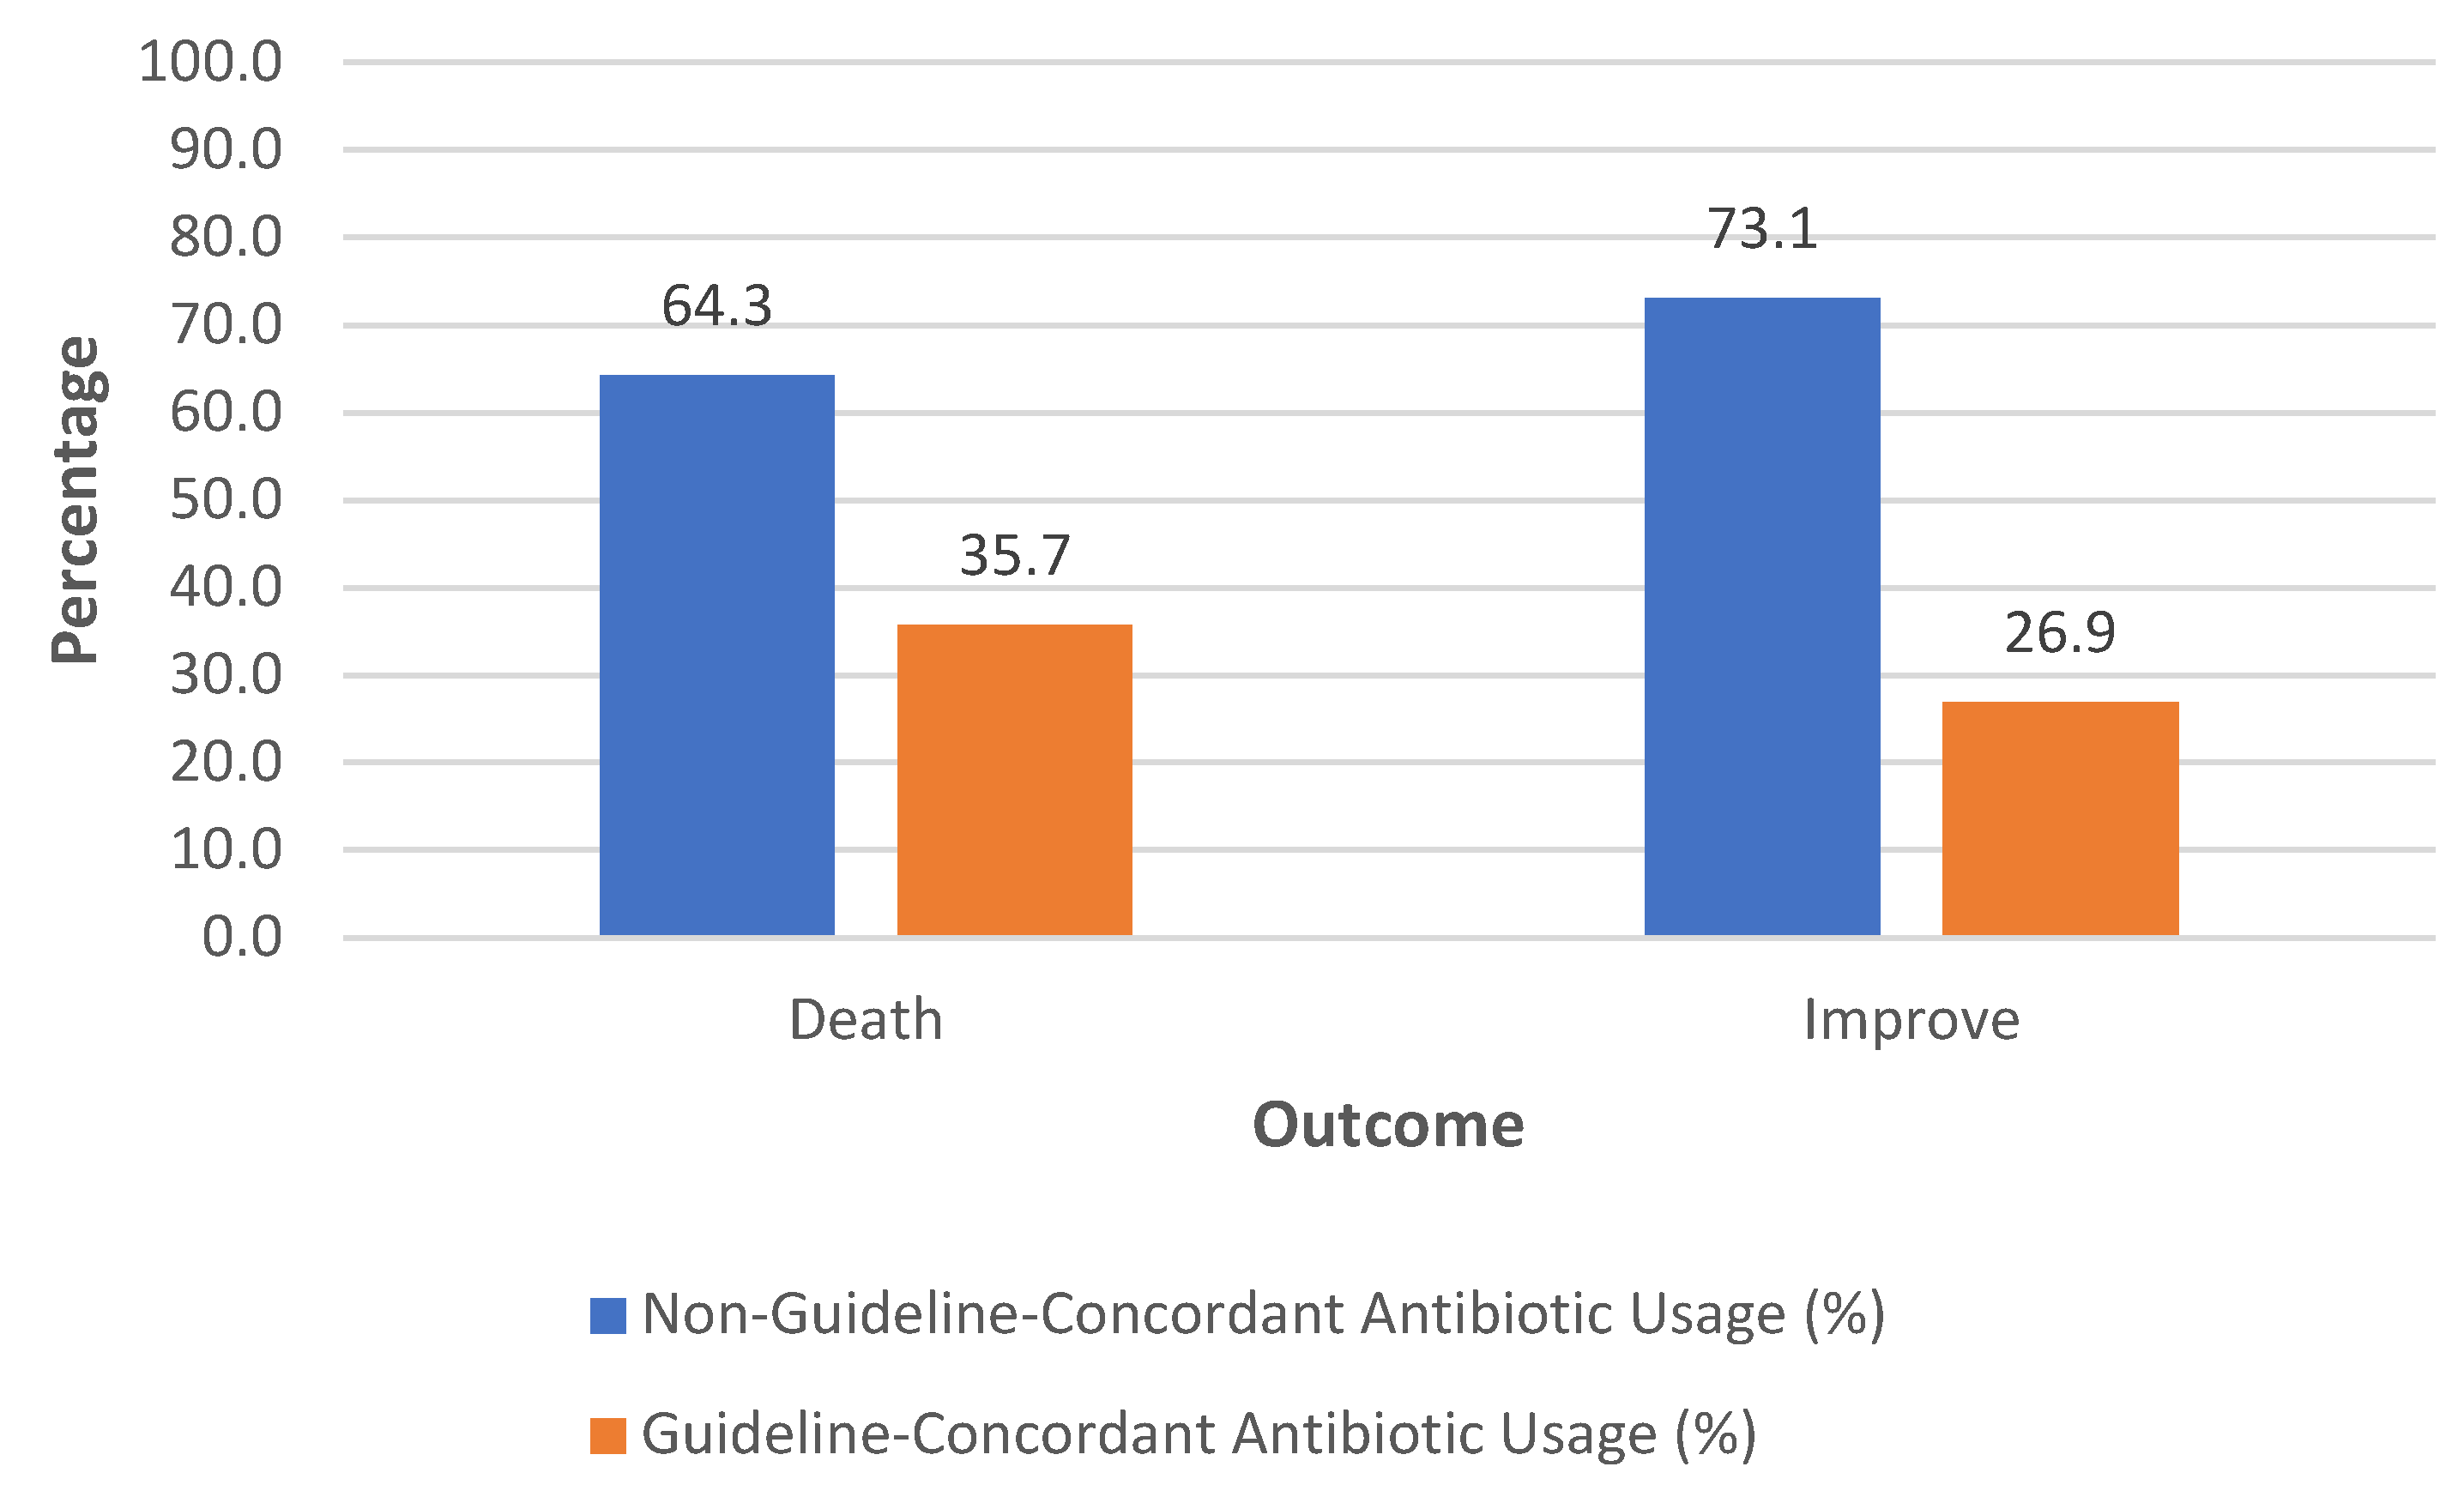
Figure 5.
Visualisation of antibiotics resistance patterns.
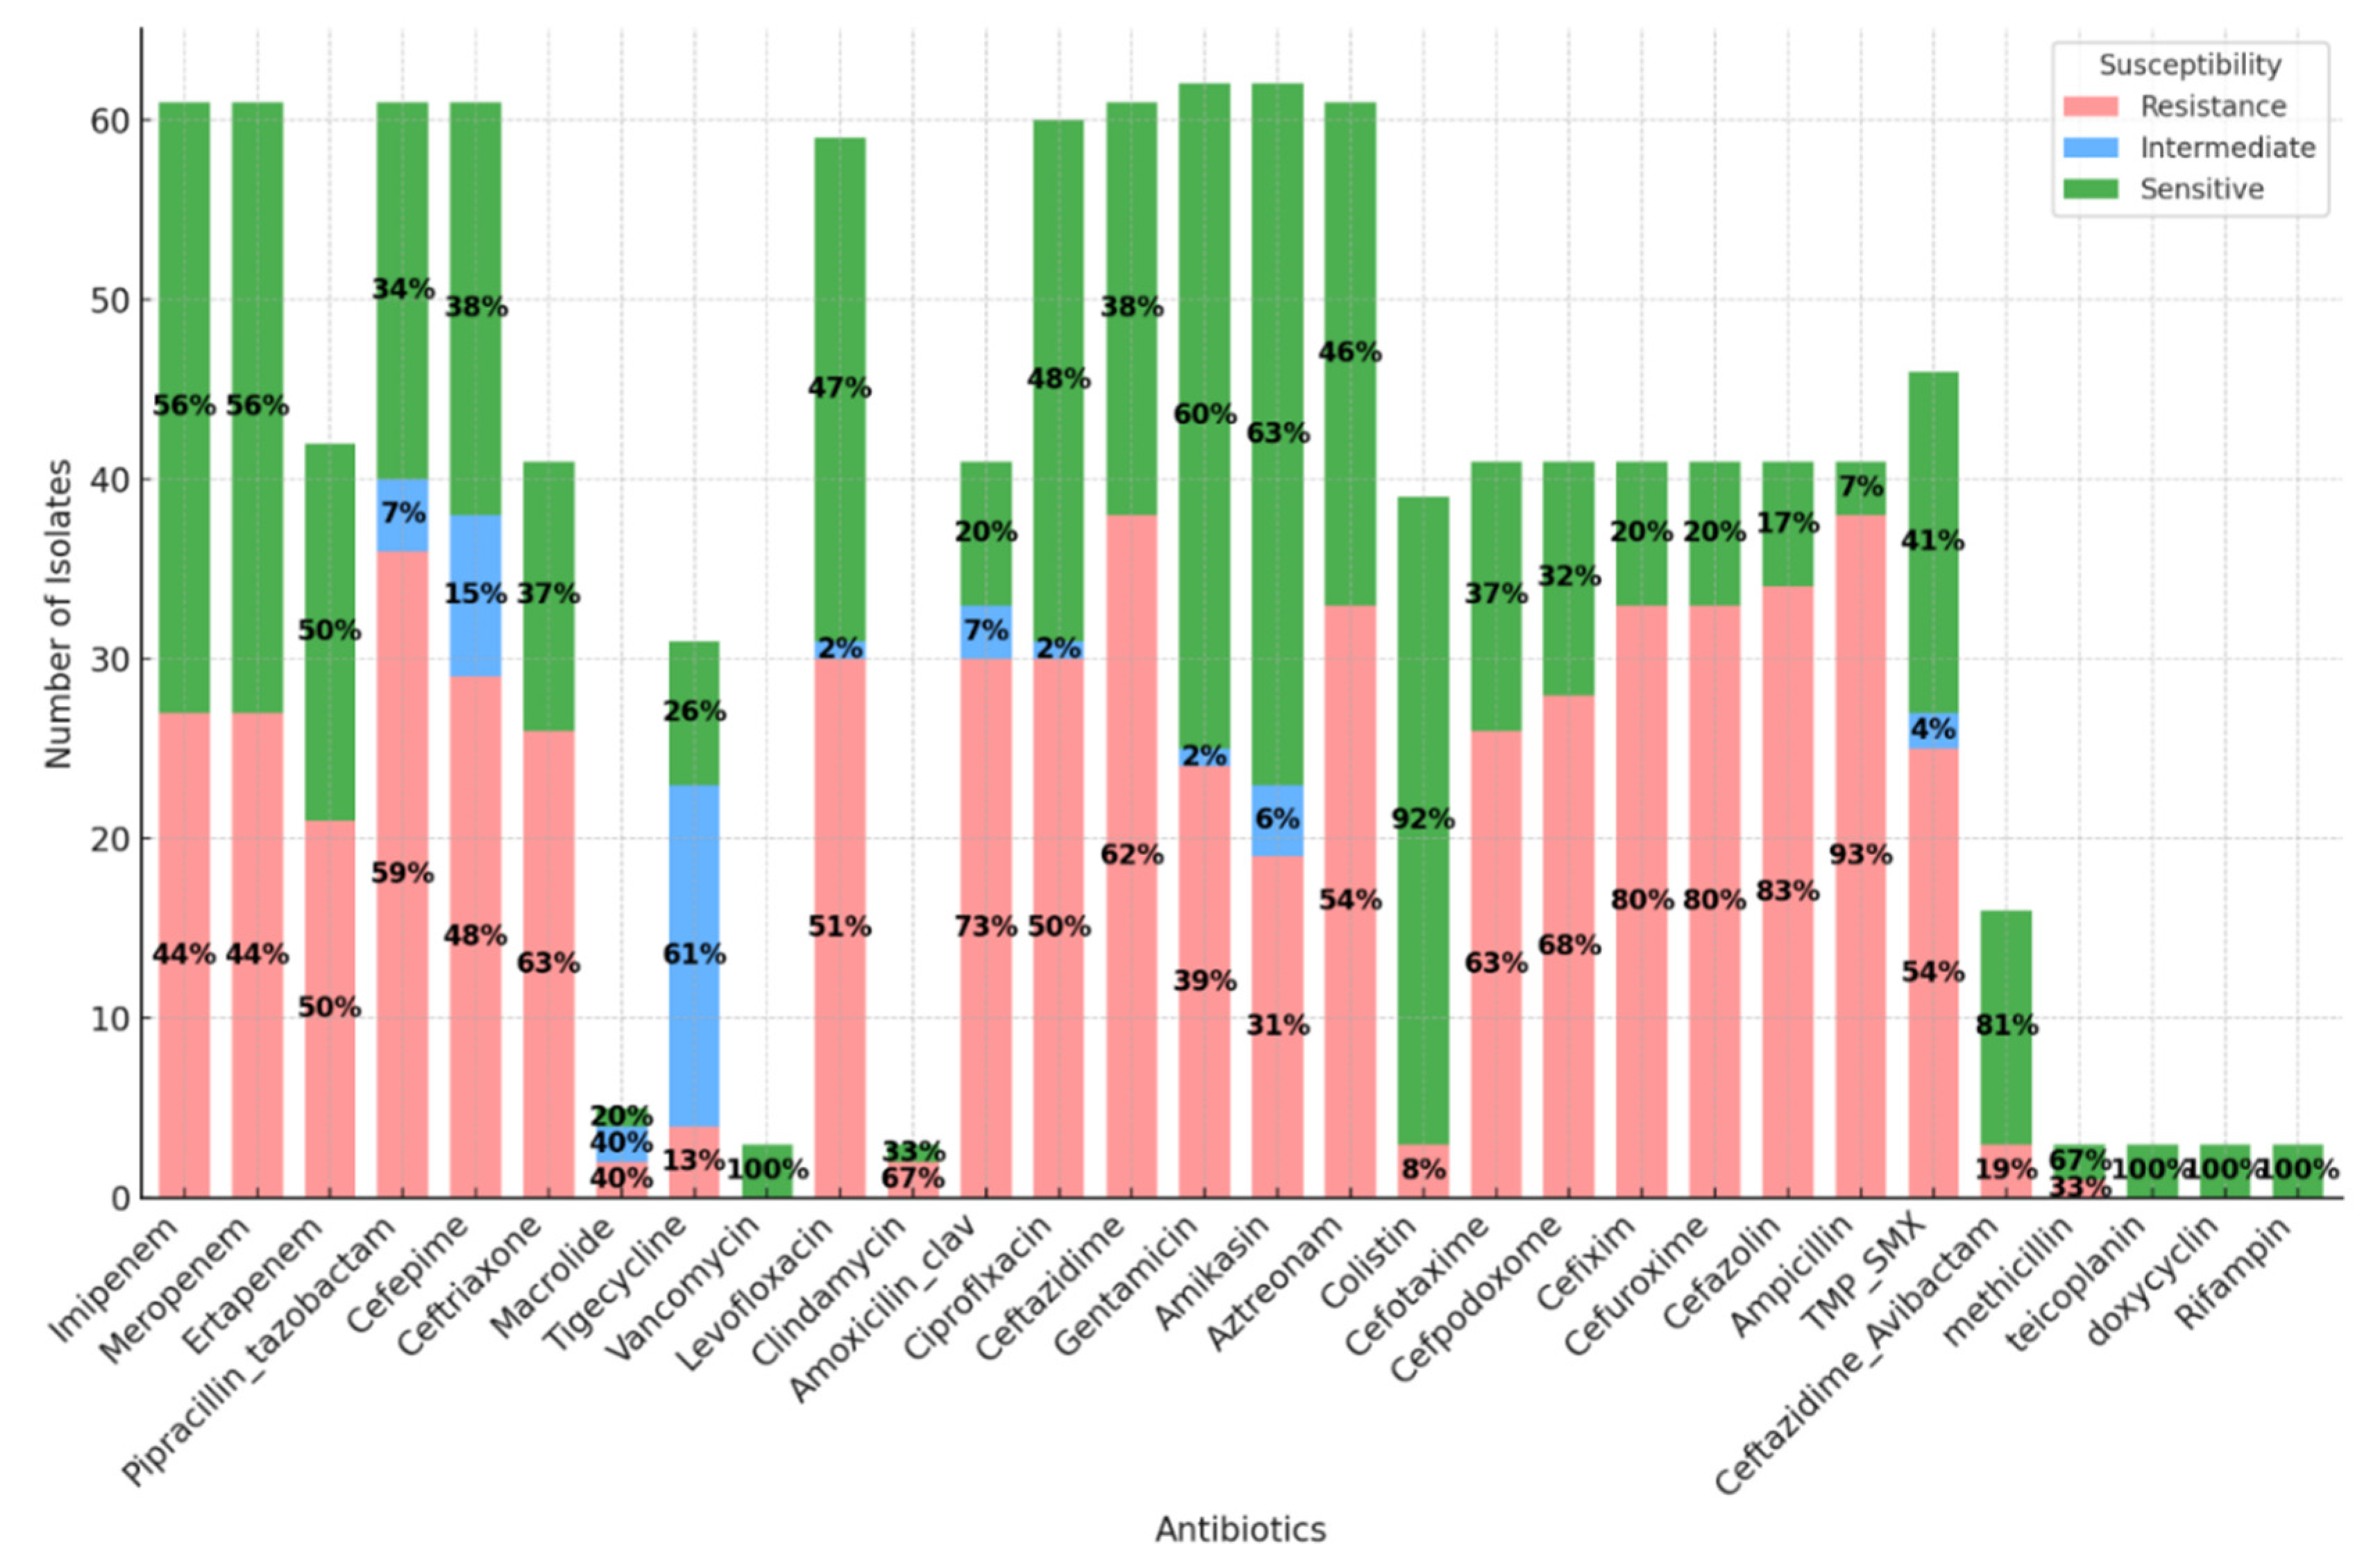
Figure 6.
Heatmap of Antibiotic Resistance Patterns. The heatmap visualises the number of resistant isolates for each antibiotic. The intensity of the color represents the resistance level, with darker shades indicating higher resistance.
Figure 6.
Heatmap of Antibiotic Resistance Patterns. The heatmap visualises the number of resistant isolates for each antibiotic. The intensity of the color represents the resistance level, with darker shades indicating higher resistance.
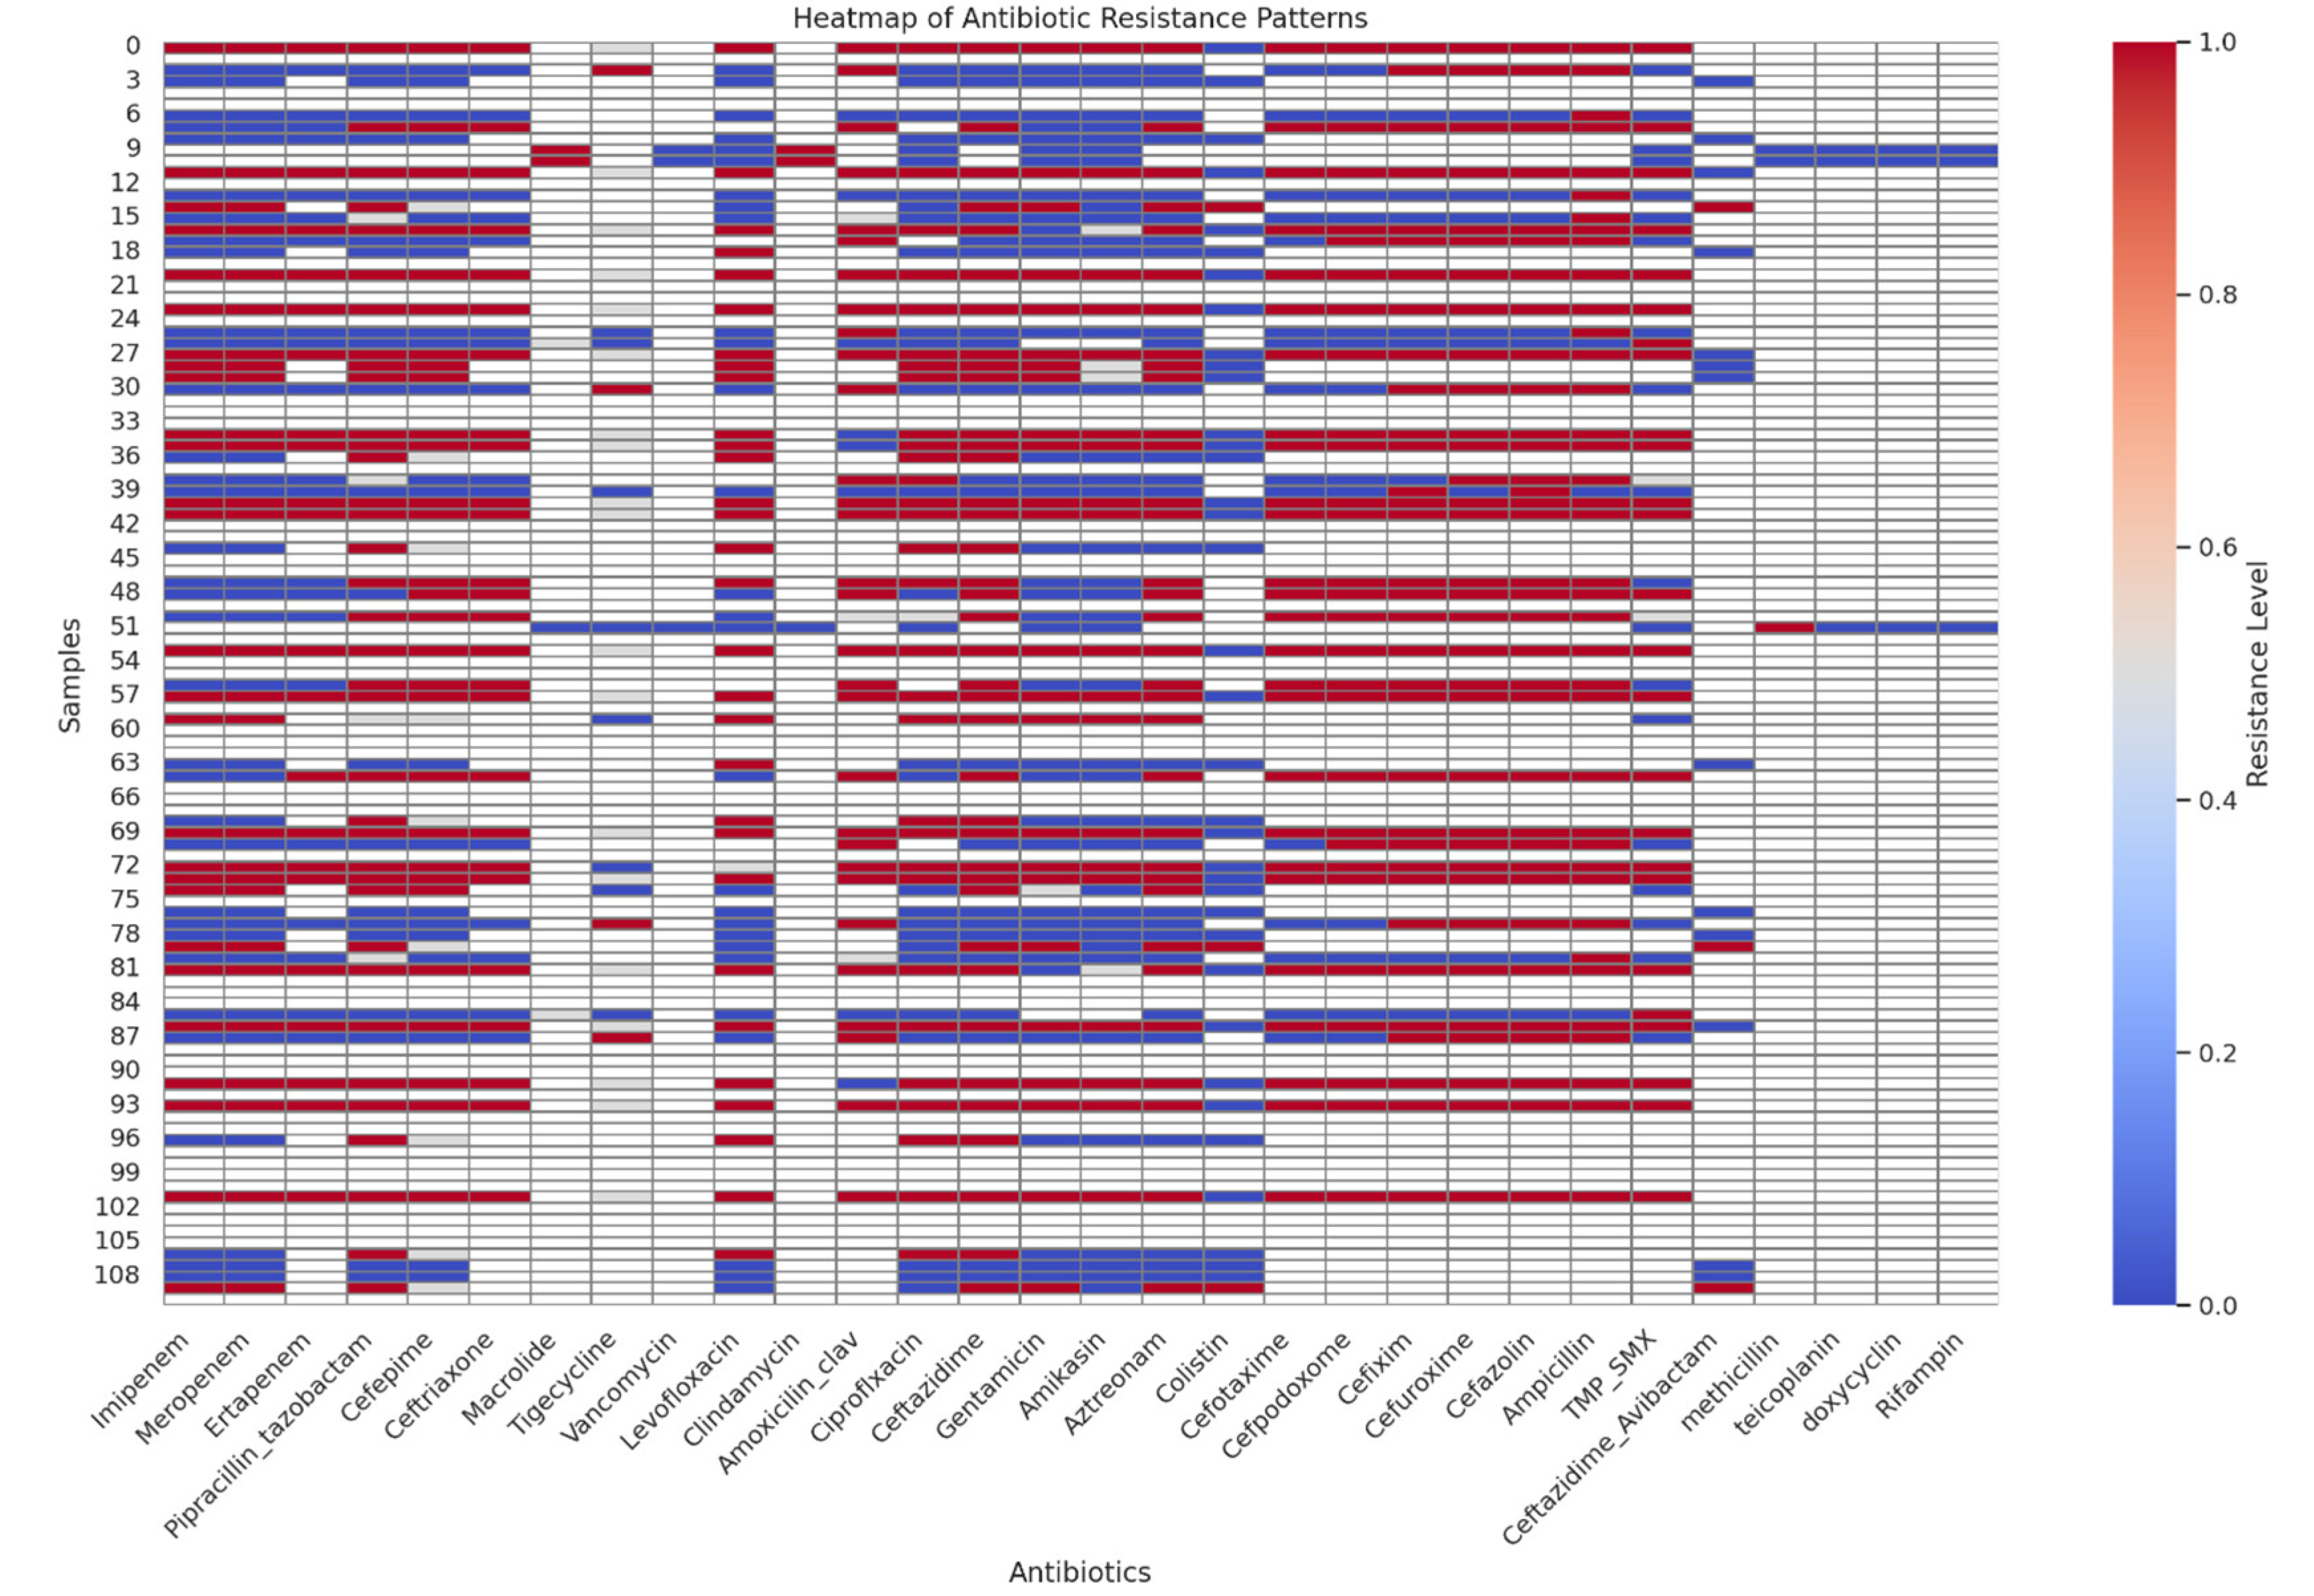
Figure 7.
Monthly antibiotic resistance rends of all antibiotics (A) and the top 7 antibiotics with the highest fluctuation trend (B).
Figure 7.
Monthly antibiotic resistance rends of all antibiotics (A) and the top 7 antibiotics with the highest fluctuation trend (B).
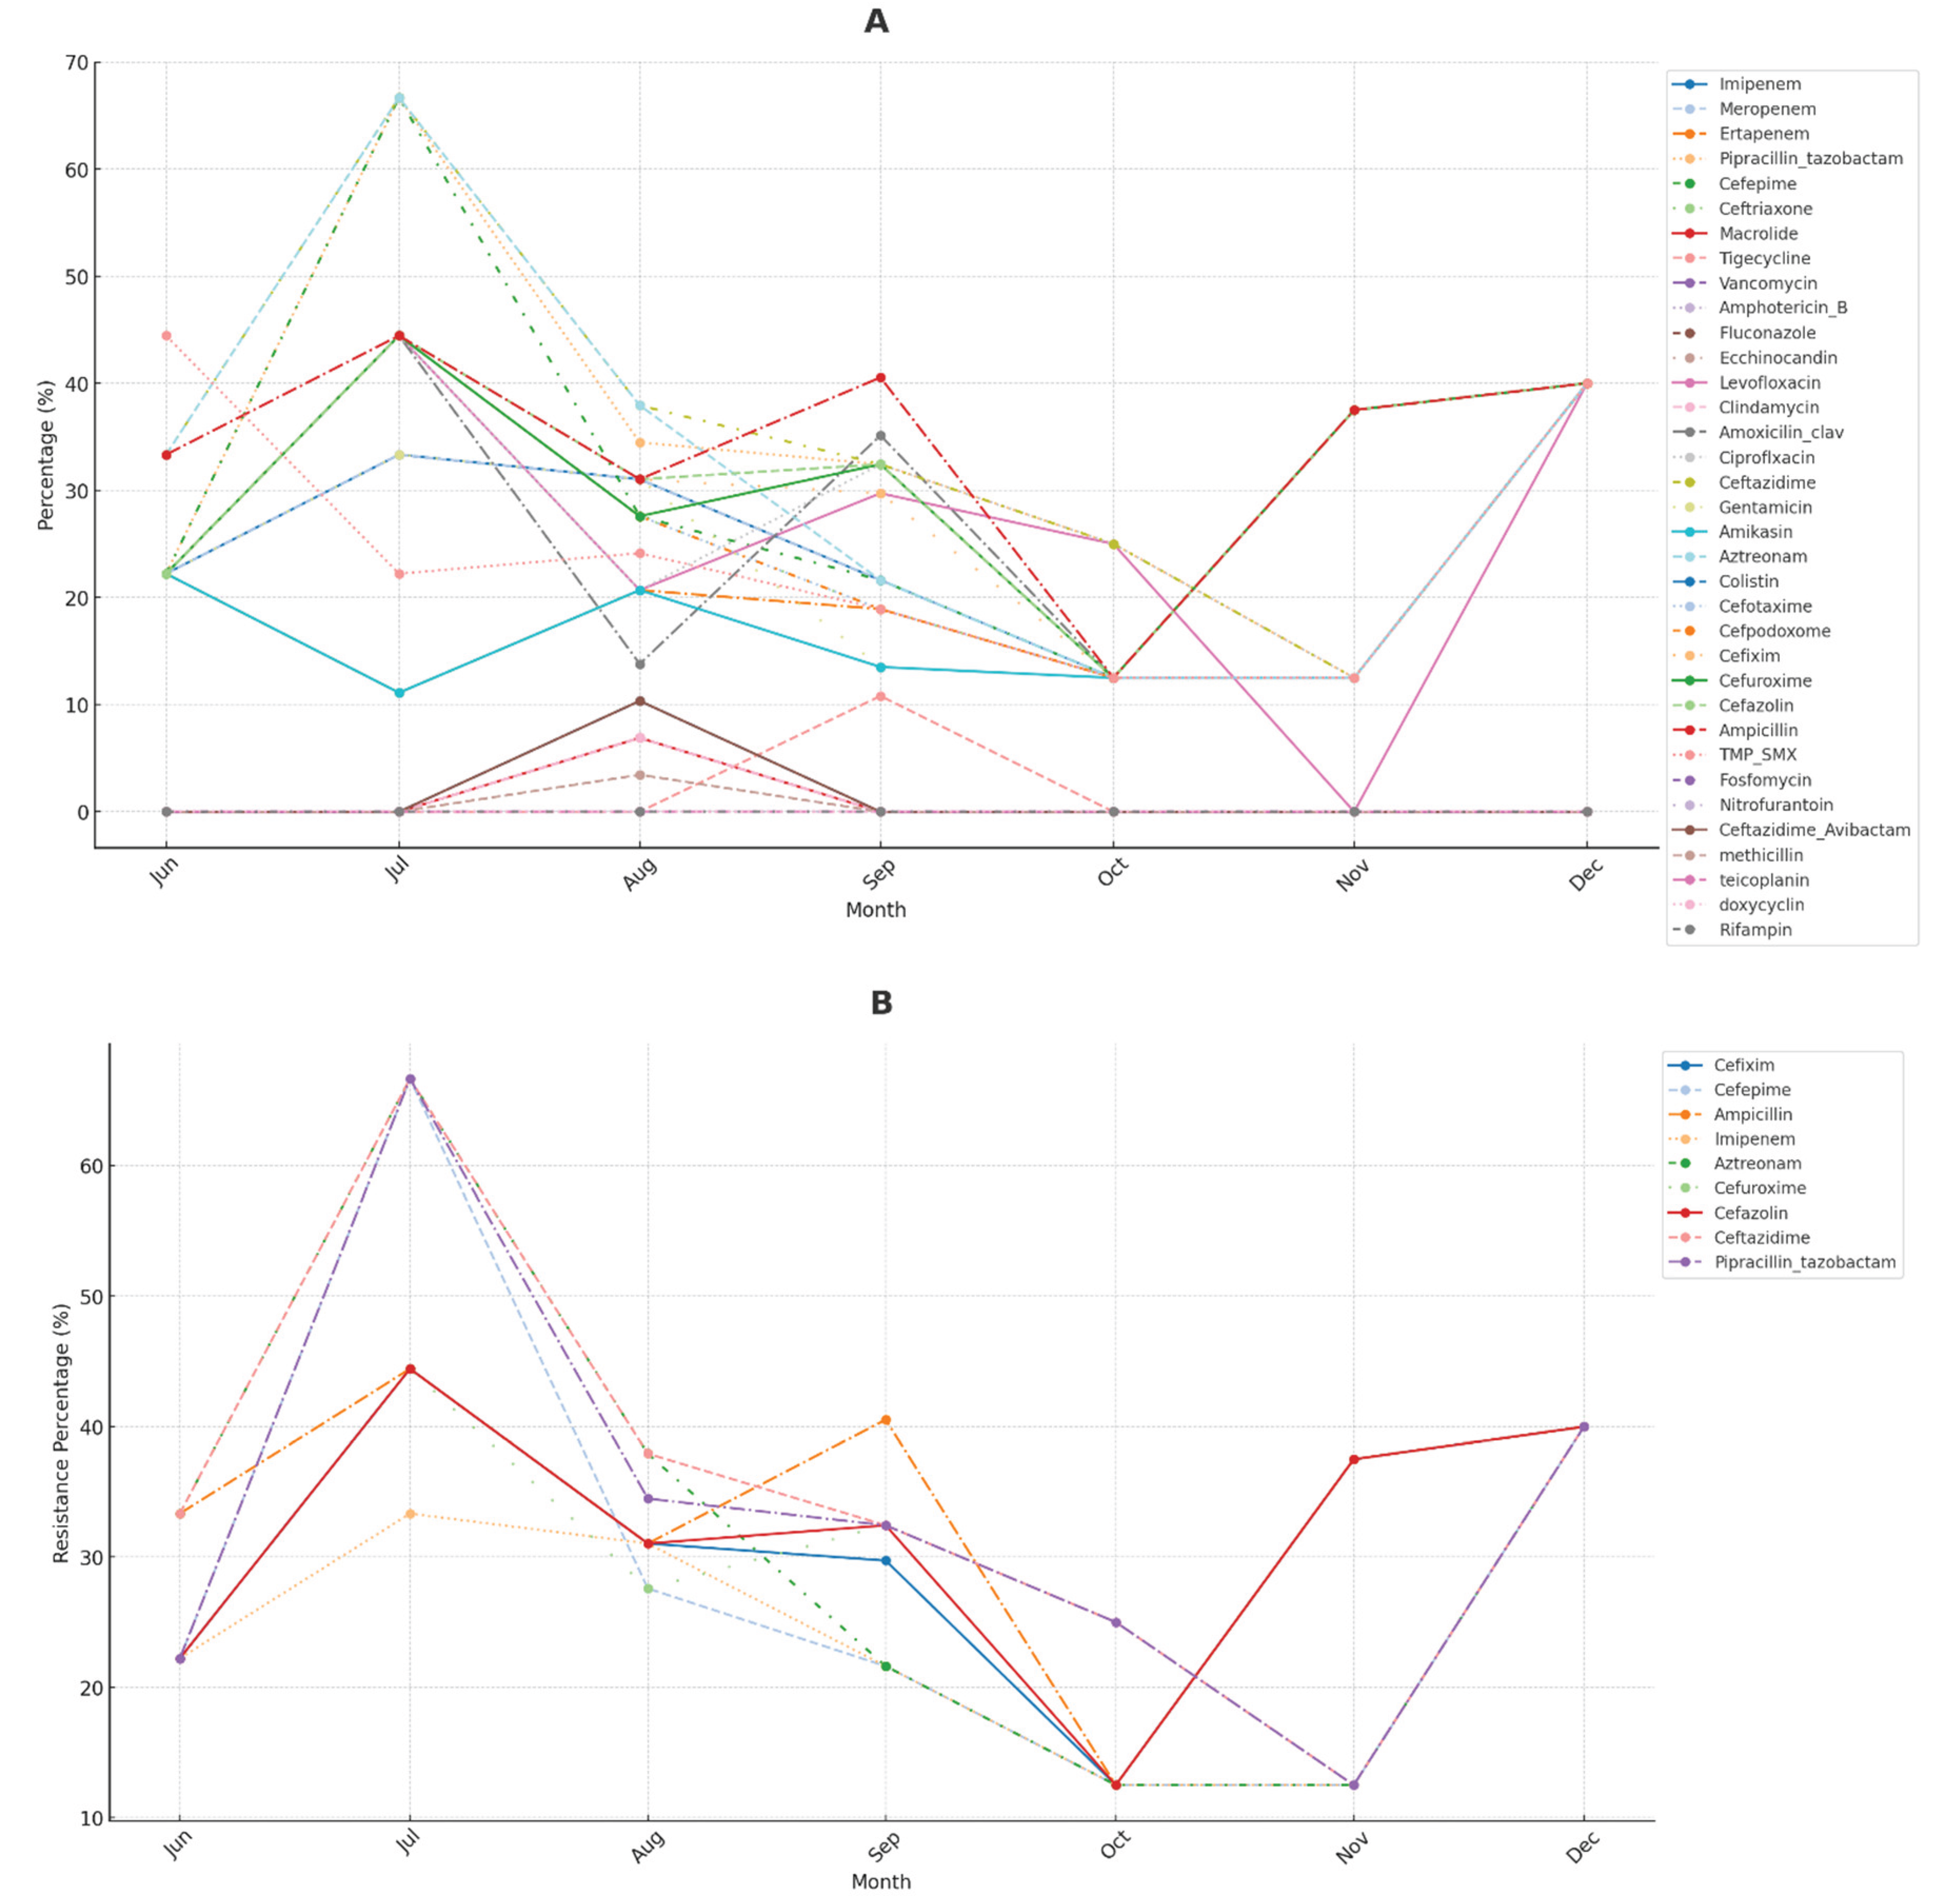

Table 1.
List of pathogens available in FTD® Respiratory Pathogens 33 Multiplex Assay.
| Type of pathogen | List of pathogens |
|---|---|
| Viruses |
|
| |
| |
| |
| |
| |
| |
| |
| |
| |
| |
| |
| |
| |
| |
| |
| |
| |
| |
| |
| Bacteria |
|
| |
| |
| |
| |
| |
| |
| |
| |
| |
| |
| |
| Fungi | Pneumocystis jirovecii |
Table 2.
Demographic and baseline characteristics of the study participants (N=111).
| Characteristics | n (%) | Mean±SD and Range |
|---|---|---|
| Age (years) | 64·0 ± 20·6, Range: (18-91) | |
| Gender | ||
| Female | 46 (41·4) | |
| Male | 65 (58·6) | |
| Initial finding | ||
| Shortness of breath | 60 (54·1) | |
| Fever | 17 (15·3) | |
| Pleuritic chest pain | 14 (12·6) | |
| Cough | 16 (14·4) | |
| Sputum production | 8 (7·2) | |
| Muscular or joint pain | 4 (3·6) | |
| Abdominal pain or nausea | 2 (1·8) | |
| Headache | 2 (1·8) | |
| Hyperglycemia | 1 (0·9) | |
| Comorbidities | ||
| Hypertension | 43 (38·7) | |
| Diabetes mellitus | 34 (30·6) | |
| Cardiovascular disease | 31 (27·9) | |
| Alzheimer’s disease | 17 (15·3) | |
| COPD | 15 (13·5) | |
| Asthma | 9 (8·1) | |
| Septic shock | 7 (6·3) | |
| Dyslipidemia | 5 (4·5) | |
| Hypotension | 5 (4·5) | |
| GERD | 5 (4·5) | |
| Hypoglycemia | 5 (4·5) | |
| Asthma COPD overlap | 4 (3·6) | |
| Skin disease | 2 (1·8) | |
| No. of previous hospitalizations | 2·2 ± 2·4, Range (0-14) | |
| No. of previous pneumonia | 0·7 ± 1·1, Range (0-6) |
COPD: Chronic obstructive pulmonary disease.
Table 3.
Characteristics of pneumonia in the study participants (N=111).
| Characteristics | n (%) | Mean±SD and Range | Median (IQR) |
|---|---|---|---|
| Location | 68·0 (27·5) | ||
| Outpatient | NA | ||
| Ward | 34 (30·6) | ||
| ICU | 77 (69·4) | ||
| Pneumonia Classification | |||
| CAP | 87 (78·4) | ||
| HAP (overall) | 24 (21·6) | ||
| VAP | 3/111 (2·7), 3/24 (12·5) | ||
| CURB-65 severity score | |||
| 0 | 4 (3·6) | ||
| 1 | 55 (49·5) | ||
| 2 | 32 (28·8) | ||
| 3 | 20 (18·0) | ||
| 4 | 0 (0·0) | ||
| 5 | 0 (0·0) | ||
| PSI | 68·0 (27·5) | ||
| Intubation and mechanical ventilation | 4 (3·6) | ||
| Aspiration | 15 (13·5) | ||
| Detection of microorganism by traditional culture | 64 (57·7) | ||
| Detection of microorganism by PCR | 83 (74·8) | ||
| Current C0VID-19 | 24 (21·6) | ||
| History of C0VID-19 | 14 (12·6) | ||
| Outcome | |||
| improve | 78 (70·3) | ||
| partialy improve | 3 (2·7) | ||
| death | 30 (27·0) | ||
| Length of hospital stay (LOS) | 12·1±15·9 Range: (1 - 83) | ||
| Length of ICU stay | 5·2±13·0 Range: (0 - 83) |
CAP: Community-acquired pneumonia, ICU: Intensive care unit.
Table 4.
Overall comparison of microorganism detection methods: Culture vs. qPCR.
| Method | Positive | McNemar p-value |
|---|---|---|
| Culture | 64 | < 0·001 |
| qPCR | 84 | < 0·001 |
Table 5.
Contingency table of the association between PCR and culture results.
| Culture | |||
|---|---|---|---|
| Positive | Negative | ||
| PCR | Positive | 63 | 10 |
| Negative | 2 | 36 | |
Table 6.
Antibiotic Susceptibility Profiles of Clinical Isolates by Microorganism.
| Microorganism | Antibiotic | Resistant (frequency) | Resistant (%) | Intermediate (frequency) | Intermediate (%) | Sensitive (frequency) | Sensitive (%) |
|---|---|---|---|---|---|---|---|
| Acinetobacter spp | Imipenem | 17 | 100 | 0 | 0 | 0 | 0 |
| Meropenem | 17 | 100 | 0 | 0 | 0 | 0 | |
| Ertapenem | 17 | 100 | 0 | 0 | 0 | 0 | |
| Pipracillin_tazobactam | 17 | 100 | 0 | 0 | 0 | 0 | |
| Cefepime | 17 | 100 | 0 | 0 | 0 | 0 | |
| Ceftriaxone | 17 | 100 | 0 | 0 | 0 | 0 | |
| Tigecycline | 0 | 0 | 16 | 94 | 1 | 6 | |
| Levofloxacin | 16 | 94 | 1 | 6 | 0 | 0 | |
| Amoxicilin_clav | 14 | 82 | 0 | 0 | 3 | 18 | |
| Ciproflxacin | 17 | 100 | 0 | 0 | 0 | 0 | |
| Ceftazidime | 17 | 100 | 0 | 0 | 0 | 0 | |
| Gentamicin | 15 | 88 | 0 | 0 | 2 | 12 | |
| Amikasin | 15 | 88 | 2 | 12 | 0 | 0 | |
| Aztreonam | 17 | 100 | 0 | 0 | 0 | 0 | |
| Colistin | 0 | 0 | 0 | 0 | 17 | 100 | |
| Cefotaxime | 17 | 100 | 0 | 0 | 0 | 0 | |
| Cefpodoxome | 17 | 100 | 0 | 0 | 0 | 0 | |
| Cefixim | 17 | 100 | 0 | 0 | 0 | 0 | |
| Cefuroxime | 17 | 100 | 0 | 0 | 0 | 0 | |
| Cefazolin | 17 | 100 | 0 | 0 | 0 | 0 | |
| Ampicillin | 17 | 100 | 0 | 0 | 0 | 0 | |
| TMP_SMX | 17 | 100 | 0 | 0 | 0 | 0 | |
| Bordetella pertussis | Imipenem | 5 | 36 | 0 | 0 | 9 | 64 |
| Meropenem | 5 | 36 | 0 | 0 | 9 | 64 | |
| Ertapenem | 10 | 75 | 0 | 0 | 4 | 25 | |
| Pipracillin_tazobactam | 9 | 64 | 1 | 9 | 4 | 27 | |
| Cefepime | 6 | 45 | 3 | 18 | 5 | 36 | |
| Ceftriaxone | 10 | 75 | 0 | 0 | 4 | 25 | |
| Tigecycline | 0 | 0 | 14 | 100 | 0 | 0 | |
| Levofloxacin | 8 | 60 | 0 | 0 | 6 | 40 | |
| Amoxicilin_clav | 14 | 100 | 0 | 0 | 0 | 0 | |
| Ciproflxacin | 9 | 64 | 0 | 0 | 5 | 36 | |
| Ceftazidime | 9 | 64 | 0 | 0 | 5 | 36 | |
| Gentamicin | 5 | 36 | 0 | 0 | 9 | 64 | |
| Amikasin | 3 | 18 | 3 | 18 | 9 | 64 | |
| Aztreonam | 6 | 45 | 0 | 0 | 8 | 55 | |
| Colistin | 0 | 0 | 0 | 0 | 14 | 100 | |
| Cefotaxime | 10 | 75 | 0 | 0 | 4 | 25 | |
| Cefpodoxome | 10 | 75 | 0 | 0 | 4 | 25 | |
| Cefixim | 10 | 75 | 0 | 0 | 4 | 25 | |
| Cefuroxime | 14 | 100 | 0 | 0 | 0 | 0 | |
| Cefazolin | 14 | 100 | 0 | 0 | 0 | 0 | |
| Ampicillin | 14 | 100 | 0 | 0 | 0 | 0 | |
| TMP_SMX | 10 | 75 | 4 | 25 | 0 | 0 | |
| Ceftazidime_Avibactam | 0 | 0 | 0 | 0 | 14 | 100 | |
| E Coli | Imipenem | 0 | 0 | 0 | 0 | 10 | 100 |
| Meropenem | 0 | 0 | 0 | 0 | 10 | 100 | |
| Ertapenem | 0 | 0 | 0 | 0 | 10 | 100 | |
| Pipracillin_tazobactam | 3 | 30 | 1 | 10 | 6 | 60 | |
| Cefepime | 3 | 30 | 0 | 0 | 7 | 70 | |
| Ceftriaxone | 3 | 30 | 0 | 0 | 7 | 70 | |
| Tigecycline | 7 | 67 | 0 | 0 | 3 | 33 | |
| Levofloxacin | 2 | 17 | 0 | 0 | 8 | 83 | |
| Amoxicilin_clav | 8 | 80 | 1 | 10 | 1 | 10 | |
| Ciproflxacin | 3 | 29 | 1 | 14 | 6 | 57 | |
| Ceftazidime | 3 | 30 | 0 | 0 | 7 | 70 | |
| Gentamicin | 0 | 0 | 0 | 0 | 10 | 100 | |
| Amikasin | 0 | 0 | 0 | 0 | 10 | 100 | |
| Aztreonam | 3 | 30 | 0 | 0 | 7 | 70 | |
| Cefotaxime | 3 | 30 | 0 | 0 | 7 | 70 | |
| Cefpodoxome | 5 | 50 | 0 | 0 | 5 | 50 | |
| Cefixim | 7 | 70 | 0 | 0 | 3 | 30 | |
| Cefuroxime | 8 | 80 | 0 | 0 | 2 | 20 | |
| Cefazolin | 8 | 80 | 0 | 0 | 2 | 20 | |
| Ampicillin | 10 | 100 | 0 | 0 | 0 | 0 | |
| TMP_SMX | 0 | 0 | 2 | 20 | 8 | 80 | |
| Klebsiella pneumoniae | Imipenem | 2 | 18 | 0 | 0 | 9 | 82 |
| Meropenem | 2 | 18 | 0 | 0 | 9 | 82 | |
| Ertapenem | 3 | 27 | 0 | 0 | 8 | 73 | |
| Pipracillin_tazobactam | 4 | 36 | 2 | 18 | 5 | 45 | |
| Cefepime | 5 | 45 | 0 | 0 | 6 | 55 | |
| Ceftriaxone | 5 | 45 | 0 | 0 | 6 | 55 | |
| Tigecycline | 4 | 40 | 4 | 40 | 2 | 20 | |
| Levofloxacin | 2 | 20 | 0 | 0 | 9 | 80 | |
| Amoxicilin_clav | 7 | 64 | 2 | 18 | 2 | 18 | |
| Ciproflxacin | 2 | 20 | 0 | 0 | 9 | 80 | |
| Ceftazidime | 5 | 45 | 0 | 0 | 6 | 55 | |
| Gentamicin | 2 | 18 | 0 | 0 | 9 | 82 | |
| Amikasin | 2 | 18 | 0 | 0 | 9 | 82 | |
| Aztreonam | 5 | 45 | 0 | 0 | 6 | 55 | |
| Colistin | 0 | 0 | 0 | 0 | 11 | 100 | |
| Cefotaxime | 5 | 45 | 0 | 0 | 6 | 55 | |
| Cefpodoxome | 5 | 45 | 0 | 0 | 6 | 55 | |
| Cefixim | 8 | 73 | 0 | 0 | 3 | 27 | |
| Cefuroxime | 7 | 64 | 0 | 0 | 4 | 36 | |
| Cefazolin | 8 | 73 | 0 | 0 | 3 | 27 | |
| Ampicillin | 10 | 91 | 0 | 0 | 1 | 9 | |
| TMP_SMX | 5 | 45 | 0 | 0 | 6 | 55 | |
| Ceftazidime_Avibactam | 0 | 0 | 0 | 0 | 11 | 100 | |
| MRSA | Macrolide | 2 | 67 | 0 | 0 | 1 | 33 |
| Tigecycline | 0 | 0 | 0 | 0 | 3 | 100 | |
| Vancomycin | 0 | 0 | 0 | 0 | 3 | 100 | |
| Levofloxacin | 0 | 0 | 0 | 0 | 3 | 100 | |
| Clindamycin | 2 | 67 | 0 | 0 | 1 | 33 | |
| Ciproflxacin | 0 | 0 | 0 | 0 | 3 | 100 | |
| Gentamicin | 0 | 0 | 0 | 0 | 3 | 100 | |
| Amikasin | 0 | 0 | 0 | 0 | 3 | 100 | |
| TMP_SMX | 0 | 0 | 0 | 0 | 3 | 100 | |
| methicillin | 1 | 33 | 0 | 0 | 2 | 67 | |
| teicoplanin | 0 | 0 | 0 | 0 | 3 | 100 | |
| doxycyclin | 0 | 0 | 0 | 0 | 3 | 100 | |
| Rifampin | 0 | 0 | 0 | 0 | 3 | 100 | |
| MSSA | Imipenem | 8 | 50 | 0 | 0 | 8 | 50 |
| Meropenem | 8 | 50 | 0 | 0 | 8 | 50 | |
| Ertapenem | 10 | 60 | 0 | 0 | 7 | 40 | |
| Pipracillin_tazobactam | 8 | 50 | 3 | 20 | 5 | 30 | |
| Cefepime | 8 | 50 | 0 | 0 | 8 | 50 | |
| Ceftriaxone | 10 | 60 | 0 | 0 | 7 | 40 | |
| Tigecycline | 0 | 0 | 17 | 100 | 0 | 0 | |
| Levofloxacin | 11 | 63 | 0 | 0 | 6 | 38 | |
| Amoxicilin_clav | 7 | 40 | 0 | 0 | 10 | 60 | |
| Ciproflxacin | 12 | 70 | 0 | 0 | 5 | 30 | |
| Ceftazidime | 8 | 50 | 0 | 0 | 8 | 50 | |
| Gentamicin | 8 | 50 | 0 | 0 | 8 | 50 | |
| Amikasin | 5 | 30 | 3 | 20 | 8 | 50 | |
| Aztreonam | 8 | 50 | 0 | 0 | 8 | 50 | |
| Colistin | 0 | 0 | 0 | 0 | 17 | 100 | |
| Cefotaxime | 10 | 60 | 0 | 0 | 7 | 40 | |
| Cefpodoxome | 10 | 60 | 0 | 0 | 7 | 40 | |
| Cefixim | 10 | 60 | 0 | 0 | 7 | 40 | |
| Cefuroxime | 17 | 100 | 0 | 0 | 0 | 0 | |
| Cefazolin | 17 | 100 | 0 | 0 | 0 | 0 | |
| Ampicillin | 17 | 100 | 0 | 0 | 0 | 0 | |
| TMP_SMX | 10 | 60 | 7 | 40 | 0 | 0 | |
| Ceftazidime_Avibactam | 0 | 0 | 0 | 0 | 17 | 100 | |
| Nontypeable H influenzae | Imipenem | 0 | 0 | 0 | 0 | 4 | 100 |
| Meropenem | 0 | 0 | 0 | 0 | 4 | 100 | |
| Ertapenem | 0 | 0 | 0 | 0 | 4 | 100 | |
| Pipracillin_tazobactam | 0 | 0 | 0 | 0 | 4 | 100 | |
| Cefepime | 0 | 0 | 0 | 0 | 4 | 100 | |
| Ceftriaxone | 0 | 0 | 0 | 0 | 4 | 100 | |
| Macrolide | 0 | 0 | 4 | 100 | 0 | 0 | |
| Tigecycline | 0 | 0 | 0 | 0 | 4 | 100 | |
| Levofloxacin | 0 | 0 | 0 | 0 | 4 | 100 | |
| Amoxicilin_clav | 0 | 0 | 0 | 0 | 4 | 100 | |
| Ciproflxacin | 0 | 0 | 0 | 0 | 4 | 100 | |
| Ceftazidime | 0 | 0 | 0 | 0 | 4 | 100 | |
| Aztreonam | 0 | 0 | 0 | 0 | 4 | 100 | |
| Cefotaxime | 0 | 0 | 0 | 0 | 4 | 100 | |
| Cefpodoxome | 0 | 0 | 0 | 0 | 4 | 100 | |
| Cefixim | 0 | 0 | 0 | 0 | 4 | 100 | |
| Cefuroxime | 0 | 0 | 0 | 0 | 4 | 100 | |
| Cefazolin | 0 | 0 | 0 | 0 | 4 | 100 | |
| Ampicillin | 0 | 0 | 0 | 0 | 4 | 100 | |
| TMP_SMX | 4 | 100 | 0 | 0 | 0 | 0 | |
| Pseudomonas aeruginosa | Imipenem | 5 | 29 | 0 | 0 | 12 | 71 |
| Meropenem | 5 | 29 | 0 | 0 | 12 | 71 | |
| Ertapenem | 0 | 0 | 0 | 0 | 17 | 100 | |
| Pipracillin_tazobactam | 10 | 59 | 0 | 0 | 7 | 41 | |
| Cefepime | 2 | 12 | 8 | 47 | 7 | 41 | |
| Levofloxacin | 9 | 53 | 0 | 0 | 8 | 47 | |
| Ciproflxacin | 7 | 41 | 0 | 0 | 10 | 59 | |
| Ceftazidime | 10 | 59 | 0 | 0 | 7 | 41 | |
| Gentamicin | 5 | 29 | 0 | 0 | 12 | 71 | |
| Amikasin | 0 | 0 | 2 | 12 | 15 | 88 | |
| Aztreonam | 5 | 29 | 0 | 0 | 12 | 71 | |
| Colistin | 3 | 18 | 0 | 0 | 14 | 82 | |
| Ceftazidime_Avibactam | 4 | 25 | 0 | 0 | 13 | 75 | |
| Salmonella | Imipenem | 0 | 0 | 0 | 0 | 5 | 100 |
| Meropenem | 0 | 0 | 0 | 0 | 5 | 100 | |
| Pipracillin_tazobactam | 0 | 0 | 0 | 0 | 5 | 100 | |
| Cefepime | 0 | 0 | 0 | 0 | 5 | 100 | |
| Levofloxacin | 0 | 0 | 0 | 0 | 5 | 100 | |
| Ciproflxacin | 0 | 0 | 0 | 0 | 5 | 100 | |
| Ceftazidime | 0 | 0 | 0 | 0 | 5 | 100 | |
| Gentamicin | 0 | 0 | 0 | 0 | 5 | 100 | |
| Amikasin | 0 | 0 | 0 | 0 | 5 | 100 | |
| Aztreonam | 0 | 0 | 0 | 0 | 5 | 100 | |
| Colistin | 0 | 0 | 0 | 0 | 5 | 100 | |
| Ceftazidime_Avibactam | 0 | 0 | 0 | 0 | 5 | 100 |
Table 7.
Antibiotic Usage among participants.
| Antibiotic | Category | Frequency | Percentage |
|---|---|---|---|
| Azithromycin | Empiric | 14 | 12·6% |
| Targeted | 3 | 2·7% | |
| Amphotericin_B | Empiric | 11 | 9·9% |
| Targeted | 3 | 2·7% | |
| Ampicilin | Empiric | 11 | 9·9% |
| Targeted | 4 | 3·6% | |
| Clindamycin | Empiric | 10 | 9·0% |
| Targeted | 5 | 4·5% | |
| Imipenem_cilastatin | Empiric | 10 | 9·0% |
| Targeted | 5 | 4·5% | |
| Ciprofloxacin | Empiric | 9 | 8·1% |
| Targeted | 7 | 6·3% | |
| Metronidazol | Empiric | 9 | 8·1% |
| Targeted | 3 | 2·7% | |
| Ecchinocandin | Empiric | 8 | 7·2% |
| Targeted | 2 | 1·8% | |
| Pipracillin_tazobactam | Empiric | 8 | 7·2% |
| Targeted | 10 | 9·0% | |
| Doxycycline | Empiric | 5 | 4·5% |
| Targeted | 6 | 5·4% | |
| Ertapenem | Empiric | 5 | 4·5% |
| Targeted | 5 | 4·5% | |
| Amoxicilin_clavulinic acid | Empiric | 7 | 6·3% |
| Targeted | 15 | 13·5% | |
| Vancomycin | Empiric | 6 | 5·4% |
| Targeted | 6 | 5·4% | |
| Fluconazole | Empiric | 0 | 0·0% |
| Targeted | 8 | 7·2% | |
| Meropenem | Empiric | 0 | 0·0% |
| Targeted | 23 | 20·7% | |
| Colistin | Empiric | 0 | 0·0% |
| Targeted | 9 | 8·1% | |
| Tigecycline | Empiric | 0 | 0·0% |
| Targeted | 18 | 16·2% | |
| Levofloxacin | Empiric | 0 | 0·0% |
| Targeted | 13 | 11·7% | |
| Cefepime | Empiric | 0 | 0·0% |
| Targeted | 17 | 15·3% | |
| Ceftriaxone | Empiric | 4 | 3·6% |
| Targeted | 7 | 6·3% | |
| Fluconazol | Empiric | 0 | 0·0% |
| Targeted | 8 | 7·2% | |
| Amikacin | Empiric | 0 | 0·0% |
| Targeted | 5 | 4·5% |
The table is sorted based on the percentage of the “Empiric” category, from highest to lowest.
Disclaimer/Publisher’s Note: The statements, opinions and data contained in all publications are solely those of the individual author(s) and contributor(s) and not of MDPI and/or the editor(s). MDPI and/or the editor(s) disclaim responsibility for any injury to people or property resulting from any ideas, methods, instructions or products referred to in the content. |
© 2025 by the authors. Licensee MDPI, Basel, Switzerland. This article is an open access article distributed under the terms and conditions of the Creative Commons Attribution (CC BY) license (http://creativecommons.org/licenses/by/4.0/).
Copyright: This open access article is published under a Creative Commons CC BY 4.0 license, which permit the free download, distribution, and reuse, provided that the author and preprint are cited in any reuse.


