
Submitted:
30 March 2025
Posted:
31 March 2025
You are already at the latest version
Abstract
Introduction/Objectives: Antibiotic resistance makes treatment for pneumonia challenging. Effective management depends on accurate diagnosis techniques to find resistance genes and customize drugs. This study primarily aimed to identify antibiotic resistance genes in respiratory samples from pneumonia patients using PCR to determine the prevalence of specific resistance genes and analyze clinical factors contributing to antibiotic resistance to provide actionable insights into resistance patterns in Jordan and support efforts to improve pneumonia management. Methods: This retrospective observational study was conducted involving 114 patients diagnosed with pneumonia. Clinical data, including prior antibiotic exposure and treatment history, were collected. PCR diagnostics were utilized to detect resistance genes in respiratory samples. This study evaluated 14 antibiotic resistance genes in pneumonia pathogens, highlighting diverse resistance mechanisms. Results: The Mec A gene was the most frequently detected, appearing in 87 samples (77.3%). Additionally, Tem in 80 samples (70.2%), Oxa-48-like in 15 samples (13.2%), and Ctx-M-1 38 samples (33.3%) were among the most common detected genes. In contrast, genes such as Oxa-40-like (7.0%), Vim (8.8%), and Imp (4.4%) exhibited lower prevalence. The Oxa-51-like gene showed the only significant association with Ertapenem resistance (p-value=0.046). Further analysis revealed statistically significant associations between the Mec A gene and methicillin resistance (p<0.001), underscoring its critical role. However, other genes, such as Oxa-40-like and Oxa-48-like, showed no significant correlation with resistance patterns for antibiotics like imipenem and meropenem (p>0.05). Conclusions: This research demonstrates the utility of PCR-based diagnostics in detecting resistance genes and highlights critical clinical factors associated with antibiotic resistance in pneumonia patients. The findings underscore the importance of integrating molecular diagnostics into routine care to improve treatment outcomes and combat the growing threat of antibiotic resistance in Jordan. This highlights PCR’s value in guiding effective treatment strategies and addressing multidrug-resistant pneumonia.
Keywords:
Antimicrobial
; Antibiotics-resistent Genes
; Hospital
; Epidemiology
; Pneumonia
1. Introduction
Antibiotic resistance is a significant global health crisis with far-reaching implications. The overuse and misuse of antibiotics have accelerated the emergence of resistant bacterial strains, making it increasingly difficult to treat infections that were once easily managed [1]. This challenge is particularly acute in the case of pneumonia, where the rapid and accurate detection of antibiotic resistance is crucial for effective treatment. The rise of multidrug-resistant pathogens has led to longer hospital stays, increased medical costs, and higher mortality rates, underscoring the urgent need for early and precise diagnostic methods to identify resistant strains and guide appropriate therapy [2].
Pneumonia remains one of the leading causes of morbidity and mortality worldwide, affecting millions of people each year. In Jordan, the burden of pneumonia is significant, particularly among vulnerable populations such as the elderly and those with underlying health conditions. Timely and effective treatment is essential to prevent complications and reduce mortality. However, the increasing prevalence of antibiotic-resistant bacteria complicates treatment efforts, making it more challenging to achieve positive patient outcomes [2].
Various diagnostic techniques are employed to identify the causative pathogens in pneumonia, ranging from traditional microbiological cultures to advanced molecular methods. While culture methods are considered the gold standard, they are time-consuming and can delay the initiation of appropriate therapy [3]. In contrast, molecular techniques like polymerase chain reaction (PCR) offer rapid and highly sensitive detection of pathogens and antibiotic resistance genes, enabling quicker clinical decision-making. PCR has emerged as a powerful tool in the diagnosis of pneumonia, especially in cases where rapid identification of resistant strains is crucial [4].
The growing threat of antibiotic resistance in pneumonia-causing pathogens presents a significant challenge to public health. With the rise of multidrug-resistant strains, there is a pressing need for diagnostic methods that can quickly and accurately identify these resistant pathogens [5].
The primary objective of this study is to detect antibiotic resistance genes in sputum and bronchoalveolar lavage (BAL) samples from pneumonia patients using PCR. Additionally, the study aims to evaluate the prevalence of specific resistance genes, and assess the clinical and demographic factors associated with antibiotic resistance in pneumonia patients. The findings are expected to provide valuable insights into the prevalence of antibiotic resistance in Jordan and help refine diagnostic practices to enhance patient outcomes in the treatment of pneumonia.
This research aims to address this need by developing and validating PCR-based diagnostic techniques that can be integrated into routine clinical practice. By focusing on the detection of antibiotic resistance genes in sputum and BAL samples from pneumonia patients, this study seeks to improve the management of pneumonia in Jordan and contribute to the global effort to combat antibiotic resistance.
2. Methods and Materials
2.1. Study Framework
This retrospective observational study aimed to identify antibiotic resistance genes in bacterial strains isolated from pneumonia patients. Samples were collected in 2022 from 114 patients at the Islamic Hospital. Table 1 summarizes the key aspects of the study design.
2.2. Sample Acquisition
Participants were selected based on inclusion and exclusion criteria. Cases without a pneumonia diagnosis, insufficient samples, or contaminated samples were excluded. Detailed criteria are provided in Table 2.
2.3. Sample Types
Sputum (SPU) was the most frequently collected sample type. Other sample types included:
- Fluid samples.
- Bronchoalveolar lavage (BAL).
- Endotracheal aspirates.
2.4. Sample Handling and Storage
Immediate Processing: Samples were promptly transported to the laboratory and stored at -80°C to preserve the integrity of the genetic material until processing.
2.5. Patient Demographics and Clinical Characteristics
The following table summarizes the key demographics and clinical characteristics of the patients involved in the study. It includes data on gender, age, prior antibiotic use, and clinical features such as respiratory distress and hemoptysis. The CURB-65 score was used to assess pneumonia severity, while microbiological data, including culture results, were utilized as clinical data for pathogen identification (Table 3).
2.6. Genetic Material Extraction
For the DNA extraction process, several key reagents and materials were used, each serving a specific function to ensure efficient extraction and purification of DNA. Table 4 provides a summary of the reagents and their specific purposes used in the DNA extraction process.
Table 5 summarizes the materials and methods used for bacterial DNA extraction from the lower respiratory tract samples. Bacterial DNA extraction was performed utilizing the ZymoBIOMICS™ DNA Miniprep Kit (Zymo Research, USA) according to the manufacturer’s instructions, with 200 µl of the sample processed per the kit protocol.
Key steps included cell lysis, DNA binding, washing, and elution. The process aimed to efficiently extract high-quality DNA suitable for downstream applications, including PCR.
2.7. Amplification via PCR
2.7.1. Diagnostic Tool: BacResista GLA REAL-TIME PCR Detection Kit
The BacResista GLA REAL-TIME PCR Detection Kit was utilized in this study for the molecular detection of antibiotic resistance genes. This kit is designed for the analysis of DNA obtained from biological samples or bacterial cultures, targeting resistance to glycopeptide (G) and beta-lactam (L) antibiotics (A).
The detection panel includes resistance genes for glycopeptides (VanA, VanB), beta-lactams (Mec A, Tem, Ctx-M-1, shv), and carbapenems (Oxa-40-like, Oxa-48-like, Oxa-23-like, Oxa-51-like, Imp, Kpc, ges, Ndm, Vim). By covering a broad spectrum of resistance determinants, the kit facilitates rapid and comprehensive. Table 6 summarizes the resistance genes detected by the kits and their associated antibacterial drugs.
The multiplex PCR technology integrated into this kit allows simultaneous detection of multiple DNA targets within a single reaction tube. This approach enhances the efficiency of resistance gene analysis, reducing both the time and cost associated with traditional diagnostic methods. The rapid identification of resistance genes enables clinicians to select appropriate antimicrobial therapy, thereby optimizing patient outcomes and minimizing treatment expenses.
The polymerase chain reaction (PCR) was performed to amplify target DNA sequences. The following Table 7 outlines the materials and steps involved in the PCR process.
2.7.2. Detection Channels of Amplification Products
Subsequent to bacterial DNA extraction, each sample underwent screening for antibiotic resistance genes employing the BACRESISTA GLA REAL-TIME PCR DETECTION KIT (DNA Technology, Russia). Ct value ≥ 45 is consider not detected, Ct value <45 consider detected. Refer to Table 8 for the specific target genes and their corresponding detection channels.
2.7.3. Procedure of PCR Amplification
The Taq-polymerase solution was vortexed for 3-5 seconds and then briefly spun for 1-3 seconds to collect any drops. Following this, 10 µL of the Taq-polymerase solution was added to each strip tube, taking care to avoid breaking the paraffin layer. A drop of approximately 20 µL of mineral oil was added to each strip tube, and the tubes were then closed. The tubes containing DNA samples, positive control samples, and negative control samples were vortexed for 3-5 seconds, followed by a brief spin for 1-3 seconds to ensure all drops were collected.
5.0 µL of DNA sample was added to the corresponding strips or tubes, making sure not to add DNA to the “C-” or “C+” strip tubes. Care was taken to avoid breaking the paraffin layer. Next, 5.0 µL of negative control (C-) that had passed the entire DNA extraction procedure was added to the “C-” tube, while 5.0 µL of positive control (C+) was added to the corresponding strip or tube. The strips or tubes were then spun for 1-3 seconds to collect any drops. Finally, the strips or tubes were placed into the Real-time Thermal Cycler for processing.
The operating software was launched. The corresponding test was added, and the number and IDs of the samples, along with the positive and negative control samples, were specified. The positions of the strips or tubes in the thermal unit were also assigned. The PCR was then initiated, and the process was allowed to run as programmed Table 9. The amplification program for target detection was executed using the Quant Gene 9600 instrument (BIOER).
3. Results
The findings of this study, encompassing demographic and clinical features, hospitalization characteristics, clinical outcomes, microbial pathogenesis, clinical features, risk factors, and pneumonia severity, are summarized below. A comprehensive overview of these results is provided in Table 11, which consolidates key data points for clarity and ease of reference.
3.1. Demographic and Clinical Features
A total of 114 patients with CAP were included in this study. The study had a median age of 73 years (IQR: 47–79), with a mean age of 64.114 years (±20.331), reflecting a predominantly elderly population. The youngest patient was 16 years old, while the oldest was 95 years old. Male patients constituted 55.263% (n=63), while females accounted for 44.737% (n=51). This gender distribution aligns with global data on pneumonia prevalence, where males are typically more affected due to higher risk factors such as smoking and chronic lung diseases.
3.1.1. Length of Stay and Hospitalization Characteristics
The median hospital length of stay (LOS) was 7 days (IQR: 3–10), with a mean of 11.272 days (±15.091). Hospital stays ranged from a minimum of 1 day to a maximum of 83 days, reflecting significant variability in disease severity. Among the patients requiring ICU admission, the median ICU length of stay was 1 day (IQR: 0–5), with a mean of 4.763 days (±11.882). The median number of hospitalizations was 2 (IQR: 1–3), with a mean of 2.772 (±3.005), and the median number of pneumonia episodes was 0.5 (IQR: 0–1), with a mean of 0.895 (±1.366).
3.1.2. Clinical Outcomes
Of the 114 patients, 23.684% (n=27) succumbed to their illness, indicating a high mortality rate consistent with severe pneumonia cases in older populations. Conversely, 76.316% (n=87) showed clinical improvement and were successfully discharged. This mortality rate highlights the burden of CAP in a vulnerable population, especially in the presence of comorbidities or antibiotic resistance.
3.1.3. Microbial Pathogenesis
The microbiological analysis revealed diverse etiologies of CAP, with bacterial pathogens being the most frequently identified. Bacterial infections accounted for 28.947% (n=33) of cases, followed by bacterial-viral co-infections at 24.561% (n=28). Viral infections alone constituted 20.175% (n=23), and polymicrobial infections were common, including polybacterial (10.526%, n=12) and polymicrobial viral infections (13.158%, n=15). Fungal-bacterial co-infections were the least frequent, comprising 1.754% (n=2). These findings emphasize the complexity of CAP pathogenesis, with a significant proportion of cases involving mixed infections, which may complicate treatment strategies. The data were taken from another study that performed PCR tests on these samples.
3.1.4. Clinical Features and Risk Factors
The most common clinical features in this study included shortness of breath (SOB), which was observed in 54.369% (n=56) of patients, and cough, which occurred in 13.158% (n=15). Fever was noted in 13.592% (n=14) of cases, while sputum production was recorded in 6.140% (n=7). Less frequent symptoms included pleuritic chest pain (8.738%, n=9). Hemoptysis or rust-colored sputum was absent in 103 patients (100%) due to 11 missing values, suggesting that no patients with available data exhibited these symptoms.
Regarding comorbidities, COPD was present in 3.509% (n=4) of patients, and asthma was documented in 5.263% (n=6). A significant majority, 91.228% (n=104), of patients had not received immunosuppressive treatment, indicating that most individuals in this study did not have this specific risk factor.
In terms of respiratory distress, 7.018% (n=8) of patients demonstrated signs of respiratory distress, while 84.211% (n=96) did not exhibit these signs. The prevalence of aspiration pneumonia was 15.358% (n=16), and 5.769% (n=6) of patients required intubation with mechanical ventilation, reflecting the severity of pneumonia in these cases.
Regarding prior antibiotic use, 91.228% (n=104) of patients did not have any antibiotic exposure within the 30 days preceding their current illness. This high proportion suggests that recent antibiotic use may not be a significant factor influencing the selection of antibiotic-resistant strains in this population.
3.1.5. Severity and Guideline Adherence
The CURB-65 score, used to assess pneumonia severity, showed that 24.561% (n=28) of patients had a score of 0, and 57.895% (n=66) had a score of 1, indicating low-risk CAP. A detailed summary of the pneumonia severity, is provided in Table 11 for a comprehensive overview.
The PSI, also known as the PORT score, was used to assess the severity of pneumonia and predict patient outcomes. Based on the PSI scores, patients were categorized into four risk classes, with each class corresponding to specific mortality rates and clinical management strategies.
- Class I (Low Risk, PSI 0–50):
59.649% (n=68) of patients had a PSI score ≤50, indicating low mortality risk (0.1%) and typically managed with outpatient care. This class represents the largest proportion of the study.
- Class II (Low to Moderate RiskPSI 51–70):
24.561% (n=28) of patients had PSI scores between 51 and 70, placing them at low to moderate risk, with a mortality rate of 0.6%. These patients may require either outpatient care or observation admission, depending on clinical judgment.
- Class III (Moderate Risk, PSI 71–90):
8.772% (n=10) of patients had PSI scores between 71 and 90, indicating moderate risk with a mortality rate of 0.9%. Inpatient admission is generally recommended for these patients due to the potential for complications and the need for closer monitoring.
- Class IV (High Risk, PSI >130):
7.018% (n=8) of patients had PSI scores >130, classifying them as high risk with a mortality rate of 9.3%. These patients typically require inpatient admission and more intensive management due to the significantly elevated risk of adverse outcomes.
Guideline-concordant antibiotic use was recorded in only 35.106% (n=33) of cases, underscoring suboptimal adherence to treatment protocols. Completion of prescribed antibiotic therapy was achieved in 63.158% (n=72) of patients, while 36.842% (n=42) either discontinued treatment prematurely or received incomplete regimens.
3.2. Antibiotic Sensitivity Test
Community-Acquired Pneumonia (CAP) management is increasingly challenged by the rising incidence of antibiotic resistance. The data provided in Figure 1 highlights the resistance and sensitivity patterns for various antibiotics used. Understanding these patterns is crucial for guiding effective treatment strategies.
Imipenem and Meropenem: Both carbapenems, Imipenem and Meropenem, exhibit resistance rates of 23.7% and 24.6%, respectively. Their corresponding sensitivity percentages are 31.6% and 30.7%.
Ertapenem: This carbapenem shows a slightly lower resistance rate of 20.2% with a sensitivity of 21.1%.
Piperacillin-Tazobactam: With a resistance rate of 30.7% and a sensitivity of 21.1%, this combination antibiotic is frequently used for its synergistic effect against a wide range of pathogens.
Cefepime, Ceftriaxone, and Ceftazidime: These cephalosporins illustrate varied resistance rates (28.1%, 24.6%, and 30.7%, respectively) and sensitivities (22.8%, 16.7%, and 23.7%, respectively). Ceftriaxone and Ceftazidime are often used as first-line agents for CAP due to their efficacy against Streptococcus pneumoniae and Haemophilus influenzae. Cefepime is typically reserved for more severe cases or suspected gram-negative infections because of its extended spectrum.
Tigecycline: This antibiotic has a notably low resistance rate of 4.4% and a sensitivity of 12.3%.
Amoxicillin-Clavulanate and Ciprofloxacin: Amoxicillin-Clavulanate shows a resistance rate of 29.8% and a sensitivity of 10.5%, whereas Ciprofloxacin has a resistance rate of 26.3% and a sensitivity of 22.8%. Both antibiotics are commonly used for outpatient CAP treatment.
Cefotaxime, Cefpodoxime, Cefixime, Cefuroxime, and Cefazolin: These cephalosporins exhibit significant resistance rates ranging from 24.6% to 32.5%, with sensitivities between 7.9% and 16.7%. Their use in CAP treatment is often guided by susceptibility results.
Ampicillin and Methicillin: Ampicillin shows a high resistance rate of 38.6% with a minimal sensitivity of 1.8%, reflecting limited efficacy against common CAP pathogens. Methicillin’s exceptionally low resistance (1.8%) and sensitivity (0.9%) confirm its limited role, being primarily of historical interest.
3.3. Antibiotic Utilization Patterns
The antibiotic utilization patterns in this study reflect the use of empiric and subsequent therapies. A summary of the findings is summarized in Table 13, which provides a detailed breakdown of empiric therapy, next-line therapy, and initial continuation therapy.
3.4. Empiric and Subsequent Antibiotic Use
3.4.1. Empiric Therapy
Empiric therapy was prescribed for most patients (n=114), with meropenem being the most frequently used antibiotic, accounting for 31.60% (n=36) of cases. Piperacillin-tazobactam was the second most common empiric antibiotic, utilized in 26.30% (n=30) of cases. Other antibiotics included amoxicillin-clavulanate (7.90%, n=9), which was favored for moderate infections, and ceftriaxone (6.10%, n=7), often prescribed for community-acquired infections. Less frequently used antibiotics included levofloxacin (3.50%, n=4) for respiratory pathogens, azithromycin (4.40%, n=5) for atypical coverage, and ampicillin (3.50%, n=4) for Gram-positive infections. Vancomycin was prescribed in 23.70% (n=27) of cases, reflecting its role in managing suspected MRSA infections. Targeted therapies like doxycycline (0.90%, n=1) and amikacin (1.80%, n=2) were used sparingly for atypical and Gram-negative pathogens, respectively.
3.4.2. Next-Line Therapy
Next-line therapies were initiated in patients who did not respond to empiric treatment or required escalation due to multidrug-resistant organisms. Amoxicillin-clavulanate was the most commonly used next-line antibiotic, prescribed in 14.04% (n=16) of cases to narrow therapy when pathogens were susceptible. Azithromycin and colistin were each used in 9.64% (n=11) of cases, with colistin targeting multidrug-resistant Gram-negative pathogens and azithromycin providing coverage for respiratory and atypical pathogens.
3.4.3. Initial Continuation Therapy
Empiric antibiotics were continued as initial therapy in some cases when clinical progress or culture results supported their use. Colistin was the most frequently continued antibiotic, used in 11.40% (n=13) of cases, primarily for resistant Gram-negative organisms. Doxycycline was continued in 7.02% (n=8) of cases for atypical pathogens, while azithromycin was continued in 6.14% (n=7) for respiratory or atypical infections. Other antibiotics continued included amikacin (4.39%, n=5), metronidazole (1.75%, n=2) for anaerobic infections, levofloxacin (2.63%, n=3), and amoxicillin-clavulanate (0.88%, n=1). Ceftriaxone was continued in 0.88% (n=1) of cases when susceptibility testing confirmed its efficacy.
The hospital opted for carbapenems as empiric therapy for CAP patients due to their broad-spectrum activity against a wide range of pathogens, including resistant strains. Carbapenems, particularly meropenem, are effective against Gram-negative bacteria that are commonly involved in severe CAP cases, such as those caused by multidrug-resistant organisms. Their strong effectiveness against organisms like Escherichia coli and Klebsiella pneumoniae, which frequently exhibit resistance to other antibiotic classes, makes them a reliable choice in critical settings.
Additionally, the rapid deterioration of CAP patients and the potential for severe complications necessitate the use of powerful antibiotics that can provide cover for a variety of possible pathogens during the initial treatment phase. The increasing prevalence of resistant bacteria calls for aggressive empirical therapy, and carbapenems serve this need, bridging the gap until susceptibility patterns can be confirmed through microbiological testing. This approach aims not only to ensure immediate treatment efficacy but also to reduce the risk of treatment failure and the associated morbidity and mortality in these patients.

Table 12.
Antibiotic prescription patterns.
| Category | Antibiotic | Number of Patients (n) | Percentage (%) | Details |
| Empiric Therapy | Meropenem | 36 | 31.60% | Most frequently used for severe infections. |
| Piperacillin-tazobactam | 30 | 26.30% | Broad-spectrum agent for Gram-negative and polymicrobial infections. | |
| Levofloxacin | 4 | 3.50% | Targets respiratory pathogens. | |
| Amoxicillin-clavulanate | 9 | 7.90% | Used for moderate infections, particularly when ESBL-producing organisms are less likely. | |
| Ceftriaxone | 7 | 6.10% | Commonly prescribed for community-acquired infections. | |
| Doxycycline | 1 | 0.90% | Targeted use for atypical pathogens. | |
| Amikacin | 2 | 1.80% | Used for Gram-negative organisms, typically in severe infections. | |
| Ampicillin | 4 | 3.50% | Commonly prescribed for less severe Gram-positive infections. | |
| Azithromycin | 5 | 4.40% | Often used for atypical respiratory pathogens. | |
| Vancomycin | 27 | 23.70% | Used for suspected MRSA infections. | |
| Next-Line Therapy | Amoxicillin-clavulanate | 16 | 14.04% | Continued when pathogens are susceptible, representing a shift to narrow-spectrum therapy. |
| Azithromycin | 11 | 9.64% | Often used for respiratory infections or atypical coverage. | |
| Colistin | 11 | 9.64% | Escalated for multidrug-resistant Gram-negative pathogens. | |
| Initial Continuation Therapy | Ceftriaxone | 1 | 0.88% | Continued when culture results support its efficacy. |
| Amoxicillin-clavulanate | 1 | 0.88% | Continued when pathogens are susceptible to narrow-spectrum therapy. | |
| Colistin | 13 | 11.40% | Used for multidrug-resistant Gram-negative organisms. | |
| Amikacin | 5 | 4.39% | Continued for Gram-negative coverage in severe cases. | |
| Metronidazole | 2 | 1.75% | Used for anaerobic infections, particularly in intra-abdominal or polymicrobial infections | |
| Levofloxacin | 3 | 2.63% | Targets respiratory pathogens. | |
| Doxycycline | 8 | 7.02% | Continued for atypical pathogen coverage. | |
| Azithromycin | 7 | 6.14% | Often used for respiratory infections or atypical coverage. |
3.5. Antibiotic Resistance Gene Detection
The study investigated the prevalence of antibiotic resistance genes in pneumonia patients, with a focus on several classes of antibiotics. The data revealed variable levels of resistance and sensitivity to different antibiotics, as well as significant variation in the detection of specific resistance genes. A detailed overview of all detected resistance genes and their associations is provided in Table 14.
3.5.1. Imipenem Resistance
Oxa-40-like gene was detected in 7% of samples from patients resistant to Imipenem, and 93% of samples did not exhibit this gene. The p-value for this association was 0.915, indicating no significant correlation between Oxa-40-like gene presence and Imipenem resistance.
Oxa-48-like gene was found in 13.2% of patients resistant to Imipenem, with 86.8% of samples undetected. The p-value of 0.200 suggests that there is no statistically significant relationship between the presence of this gene and Imipenem resistance.
Oxa-51-like gene detection was higher, with 74% of Imipenem-resistant samples showing the gene and 64.9% undetected. The p-value for this gene was 0.062, which approaches statistical significance, but the association was not strong enough to conclude a definitive relationship.
Imp gene had a detection rate of 4.4% in Imipenem-resistant samples, with a p-value of 0.209, showing no significant association.
Kpc gene was detected in only 1.8% of resistant samples, with a p-value of 0.535, indicating that Kpc does not significantly contribute to Imipenem resistance in the study population.
Ndm gene was present in 33.3% of Imipenem-resistant samples, and the p-value of 0.601 suggests no significant impact on resistance patterns.
Vim gene was detected in 8.8% of resistant samples, with a p-value of 0.074, indicating a potential, but non-significant, association.
3.5.2. Meropenem Resistance
Similar to Imipenem, resistance to Meropenem showed no significant association with the tested genes (p-values for Oxa-40-like, Oxa-48-like, Imp, and Kpc ranged from 0.200 to 0.930). The Oxa-51-like gene exhibited a trend towards significance, with a p-value of 0.093, but the association was not strong enough to conclude a definitive relationship. Vim gene was found in 8.8% of Meropenem-resistant samples, with 91.2% of samples undetected. The p-value of 0.08 shows a potential, but non-significant, association with Meropenem resistance.
3.5.3. Ertapenem Resistance
The Oxa-51-like gene showed the only significant association with Etrapenem resistance, with a p-value of 0.046, indicating that it may contribute to resistance in a portion of the population. The other genes tested, including Oxa40-like, Oxa-48-like, and Imp, showed no significant association with Ertapenem resistance, indicating that they may not play a major role in resistance in this population.
3.5.4. Methicillin Resistance
The Mec A gene was detected in 76.3% of samples resistant to methicillin, with a highly significant p-value of 0.000, indicating a strong association between the Mec A gene and methicillin resistance.
3.5.5. Resistance to Other Antibiotics
Pipracillin-Tazobactam resistance was linked to the Tem gene (70.2% of resistance samples), but no statistically significant association was found (p = 0.904).
Cefepime resistance also showed a strong association with the Tem gene (70.2% of resistance), but this was not statistically significant (p = 0.848). The Ctx-M-1 and shv genes were detected at varying frequencies in different antibiotic resistance profiles, though p-values were consistently higher than 0.05, indicating no significant correlation.
Table 12.
Association between antibiotic resistance genes and antibiotic susceptibility.
| Antibiotic | Gene name | Resistance gene (%) | Suciptability (frequency) | P-value(chi-square ) | |
|---|---|---|---|---|---|
| Resistance | Sensitive | ||||
| Imipenem | Oxa-40-like | 7 | 2 | 2 | 0.915 |
| Oxa-48-like | 13.2 | 6 | 5 | 0.200 | |
| Oxa-23-like | 53.5 | 17 | 19 | 0.499 | |
| Oxa-51-like | 64.9 | 22 | 24 | 0.062 | |
| Imp | 4.4 | 1 | 0 | 0.209 | |
| Kpc | 1.8 | 1 | 0 | 0.535 | |
| Ndm | 33.3 | 11 | 12 | 0.601 | |
| Vim | 8.8 | 3 | 0 | 0.074 | |
| Meropenem | Oxa-40-like | 6 | 2 | 2 | 0.930 |
| Oxa-48-like | 13.2 | 6 | 5 | 0.226 | |
| Oxa-23-like | 53.5 | 18 | 18 | 0.410 | |
| Oxa-51-like | 64.9 | 22 | 24 | 0.093 | |
| Imp | 4.4 | 1 | 0 | 0.212 | |
| Kpc | 1.8 | 1 | 0 | 0.556 | |
| Ndm | 33.3 | 11 | 12 | 0.666 | |
| Vim | 8.8 | 3 | 0 | 0.080 | |
| Etrapenem | Oxa-40-like | 7 | 2 | 1 | 0.811 |
| Oxa-48-like | 13.2 | 5 | 2 | 0.357 | |
| Oxa-23-like | 53.5 | 16 | 10 | 0.151 | |
| Oxa-51-like | 64.9 | 20 | 14 | 0.046 | |
| Imp | 4.4 | 1 | 0 | 0.472 | |
| Kpc | 1.8 | 1 | 0 | 0.508 | |
| Ndm | 33.3 | 9 | 6 | 0.569 | |
| Vim | 8.8 | 3 | 0 | 0.216 | |
| Pipracillin-Tazobactam | Tem | 70.2 | 23 | 17 | 0.904 |
| Ctx-M-1 | 33.3 | 14 | 6 | 0.692 | |
| Shv | 35.1 | 13 | 11 | 0.249 | |
| Cefepime | Tem | 70.2 | 12 | 11 | 0.848 |
| Ctx-M-1 | 33.3 | 13 | 6 | 0.553 | |
| shv | 35.1 | 12 | 12 | 0.417 | |
| Ceftriaxone | Tem | 70.2 | 14 | 15 | 0.656 |
| Ctx-M-1 | 33.3 | 12 | 5 | 0.431 | |
| Shv | 35.1 | 12 | 8 | 0.375 | |
| Amoxicillin-Clavulanic Acid | Tem | 70.2 | 24 | 9 | 0.888 |
| Ctx-M-1 | 33.3 | 13 | 3 | 0.413 | |
| shv | 35.1 | 14 | 5 | 0.329 | |
| Ceftazidime | Tem | 70.2 | 23 | 19 | 0.762 |
| Ctx-M-1 | 33.3 | 15 | 6 | 0.230 | |
| shv | 35.1 | 14 | 12 | 0.231 | |
| Cefotaxime | Tem | 70.2 | 19 | 15 | 0.656 |
| Ctx-M-1 | 33.3 | 12 | 5 | 0.431 | |
| shv | 35.1 | 12 | 8 | 0.375 | |
| Cefpodoxime | Tem | 70.2 | 21 | 13 | 0.577 |
| Ctx-M-1 | 33.3 | 12 | 5 | 0.758 | |
| shv | 35.1 | 12 | 8 | 0.280 | |
| Cefixime | Tem | 70.2 | 25 | 8 | 0.776 |
| Ctx-M-1 | 33.3 | 14 | 3 | 0.693 | |
| shv | 35.1 | 16 | 4 | 0.294 | |
| Cefuroxime | Tem | 70.2 | 26 | 7 | 0.867 |
| Ctx-M-1 | 33.3 | 14 | 3 | 0.770 | |
| shv | 35.1 | 17 | 3 | 0.236 | |
| Cefazolin | Tem | 70.2 | 26 | 8 | 0.765 |
| Ctx-M-1 | 33.3 | 14 | 3 | 0.770 | |
| shv | 35.1 | 17 | 3 | 0.242 | |
| Ampicillin | Tem | 70.2 | 31 | 2 | 0.641 |
| Ctx-M-1 | 33.3 | 17 | 0 | 0.419 | |
| shv | 35.1 | 20 | 0 | 0.128 | |
| Methicillin | Mec A | 76.3 | 1 | 0 | <0.001 |
| Teicoplanin | VanA/B | 25.4 | 0 | 0 | 0.405 |
3.6. Antibiotic Resistance Gene Prevalence
In this study, 14 antibiotic resistance genes were evaluated for their prevalence in the tested samples. Table 14 The gene Mec A was the most commonly detected, identified in 87 samples, corresponding to 77.2% of the total samples analyzed. This gene, known for conferring resistance to methicillin and other beta-lactam antibiotics, reflects a significant presence of methicillin-resistant Staphylococcus aureus (MRSA) or other resistant strains. Similarly, the Tem gene, which is associated with extended-spectrum beta-lactamases (ESBLs), was detected in 80 samples (70.2%), indicating beta-lactam resistance.
Other notable findings include the Oxa-51-like and Oxa-23-like genes, detected in 71 (64.9%) and 61 (53.5%) samples, respectively. These genes are typically linked to carbapenem resistance in Acinetobacter baumannii and other Gram-negative pathogens. Their high prevalence signals the significant threat posed by carbapenem-resistant organisms in the tested population. Furthermore, the Ctx-M-1 gene, another key marker for ESBL production, was identified in 38 samples (33.3%), underscoring the continued prevalence of beta-lactamase-producing organisms.
Genes associated with other forms of resistance, such as shv and Ndm, were also frequently detected. The shv gene, which codes for beta-lactamases, was identified in 40 samples (35.1%), while the Ndm gene, responsible for carbapenemase production, was present in 38 samples (33.3%). These findings highlight the growing challenge of multidrug-resistant pathogens, particularly those producing carbapenemases and ESBLs.
The detection of VanA/B (29 samples, 25.4%), ges (22 samples, 19.3%), and Oxa-48-like (15 samples, 13.2%) further emphasizes the presence of resistance mechanisms in the population.. The ges gene, associated with resistance to aminoglycosides, and Oxa-48-like, a carbapenemase gene, further highlight the diverse range of resistance mechanisms present in the tested samples.
Lower frequencies of detection were observed for the Oxa-40-like (7%), Vim (8.8%), and Imp (4.4%) genes. The Oxa-40-like and Vim genes, both related to carbapenem resistance, were detected in a smaller proportion of samples, but their presence still indicates potential concerns in the resistance landscape. The imp gene, found in only 5 samples (4.4%), also contributes to carbapenem resistance, though it appears to be less prevalent in this study. The Kpc gene, associated with carbapenemase production, was the least commonly detected, appearing in just 2 samples (1.8%).
The distribution of these resistance genes demonstrates a complex and multifaceted resistance profile within the population. The high prevalence of Mec A, Tem, and shv suggests a substantial burden of beta-lactam and methicillin resistance. Meanwhile, the presence of carbapenemase genes such as Oxa-51-like, Oxa-23-like, Ndm, and Kpc emphasizes the growing threat of multidrug-resistant Gram-negative bacteria. Additionally, the detection of VanA/B and ges highlights the ongoing issue of resistance to glycopeptides and aminoglycosides.
Figure 2.
Antibiotic resistance genes percentage.
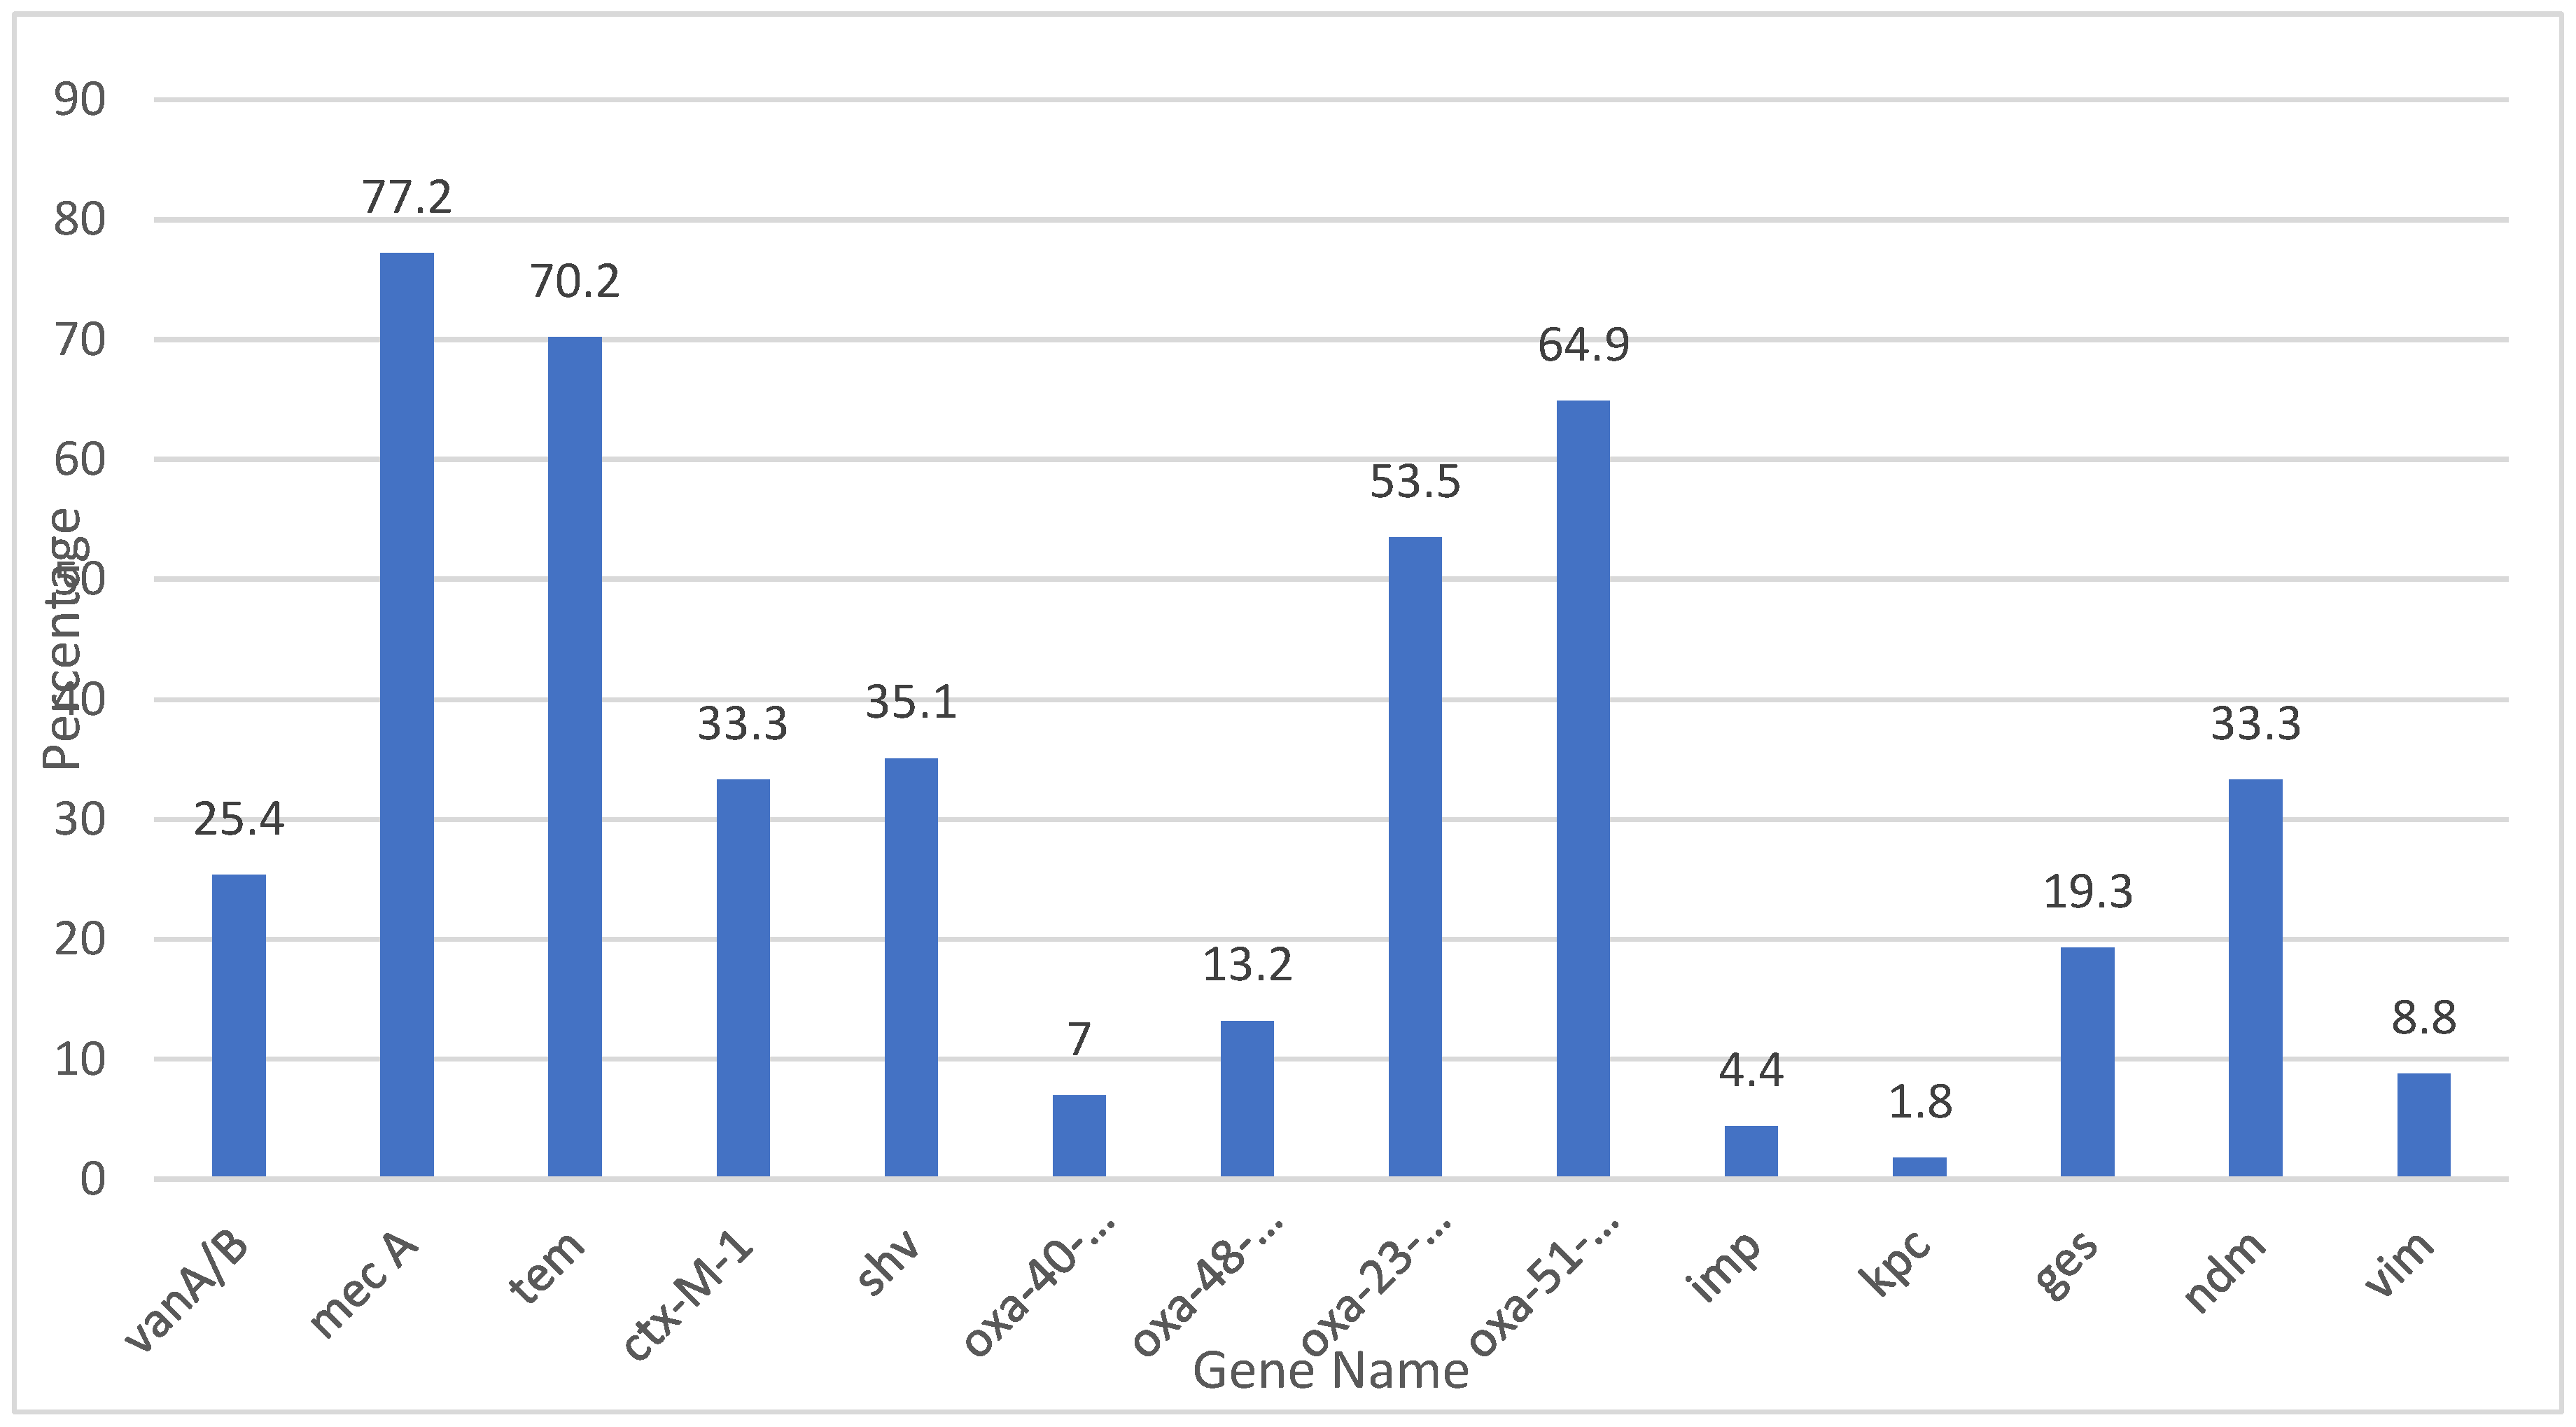
Table 13.
Antibiotic resistance genes frequency.
| Gene | Frequency |
| VanA/B | 29 |
| Mec A | 87 |
| Tem | 80 |
| Ctx-M-1 | 38 |
| shv | 40 |
| Oxa-40-like | 8 |
| Oxa-48-like | 15 |
| Oxa-23-like | 61 |
| Oxa-51-like | 71 |
| Imp | 5 |
| Kpc | 2 |
| ges | 22 |
| Ndm | 38 |
| Vim | 10 |
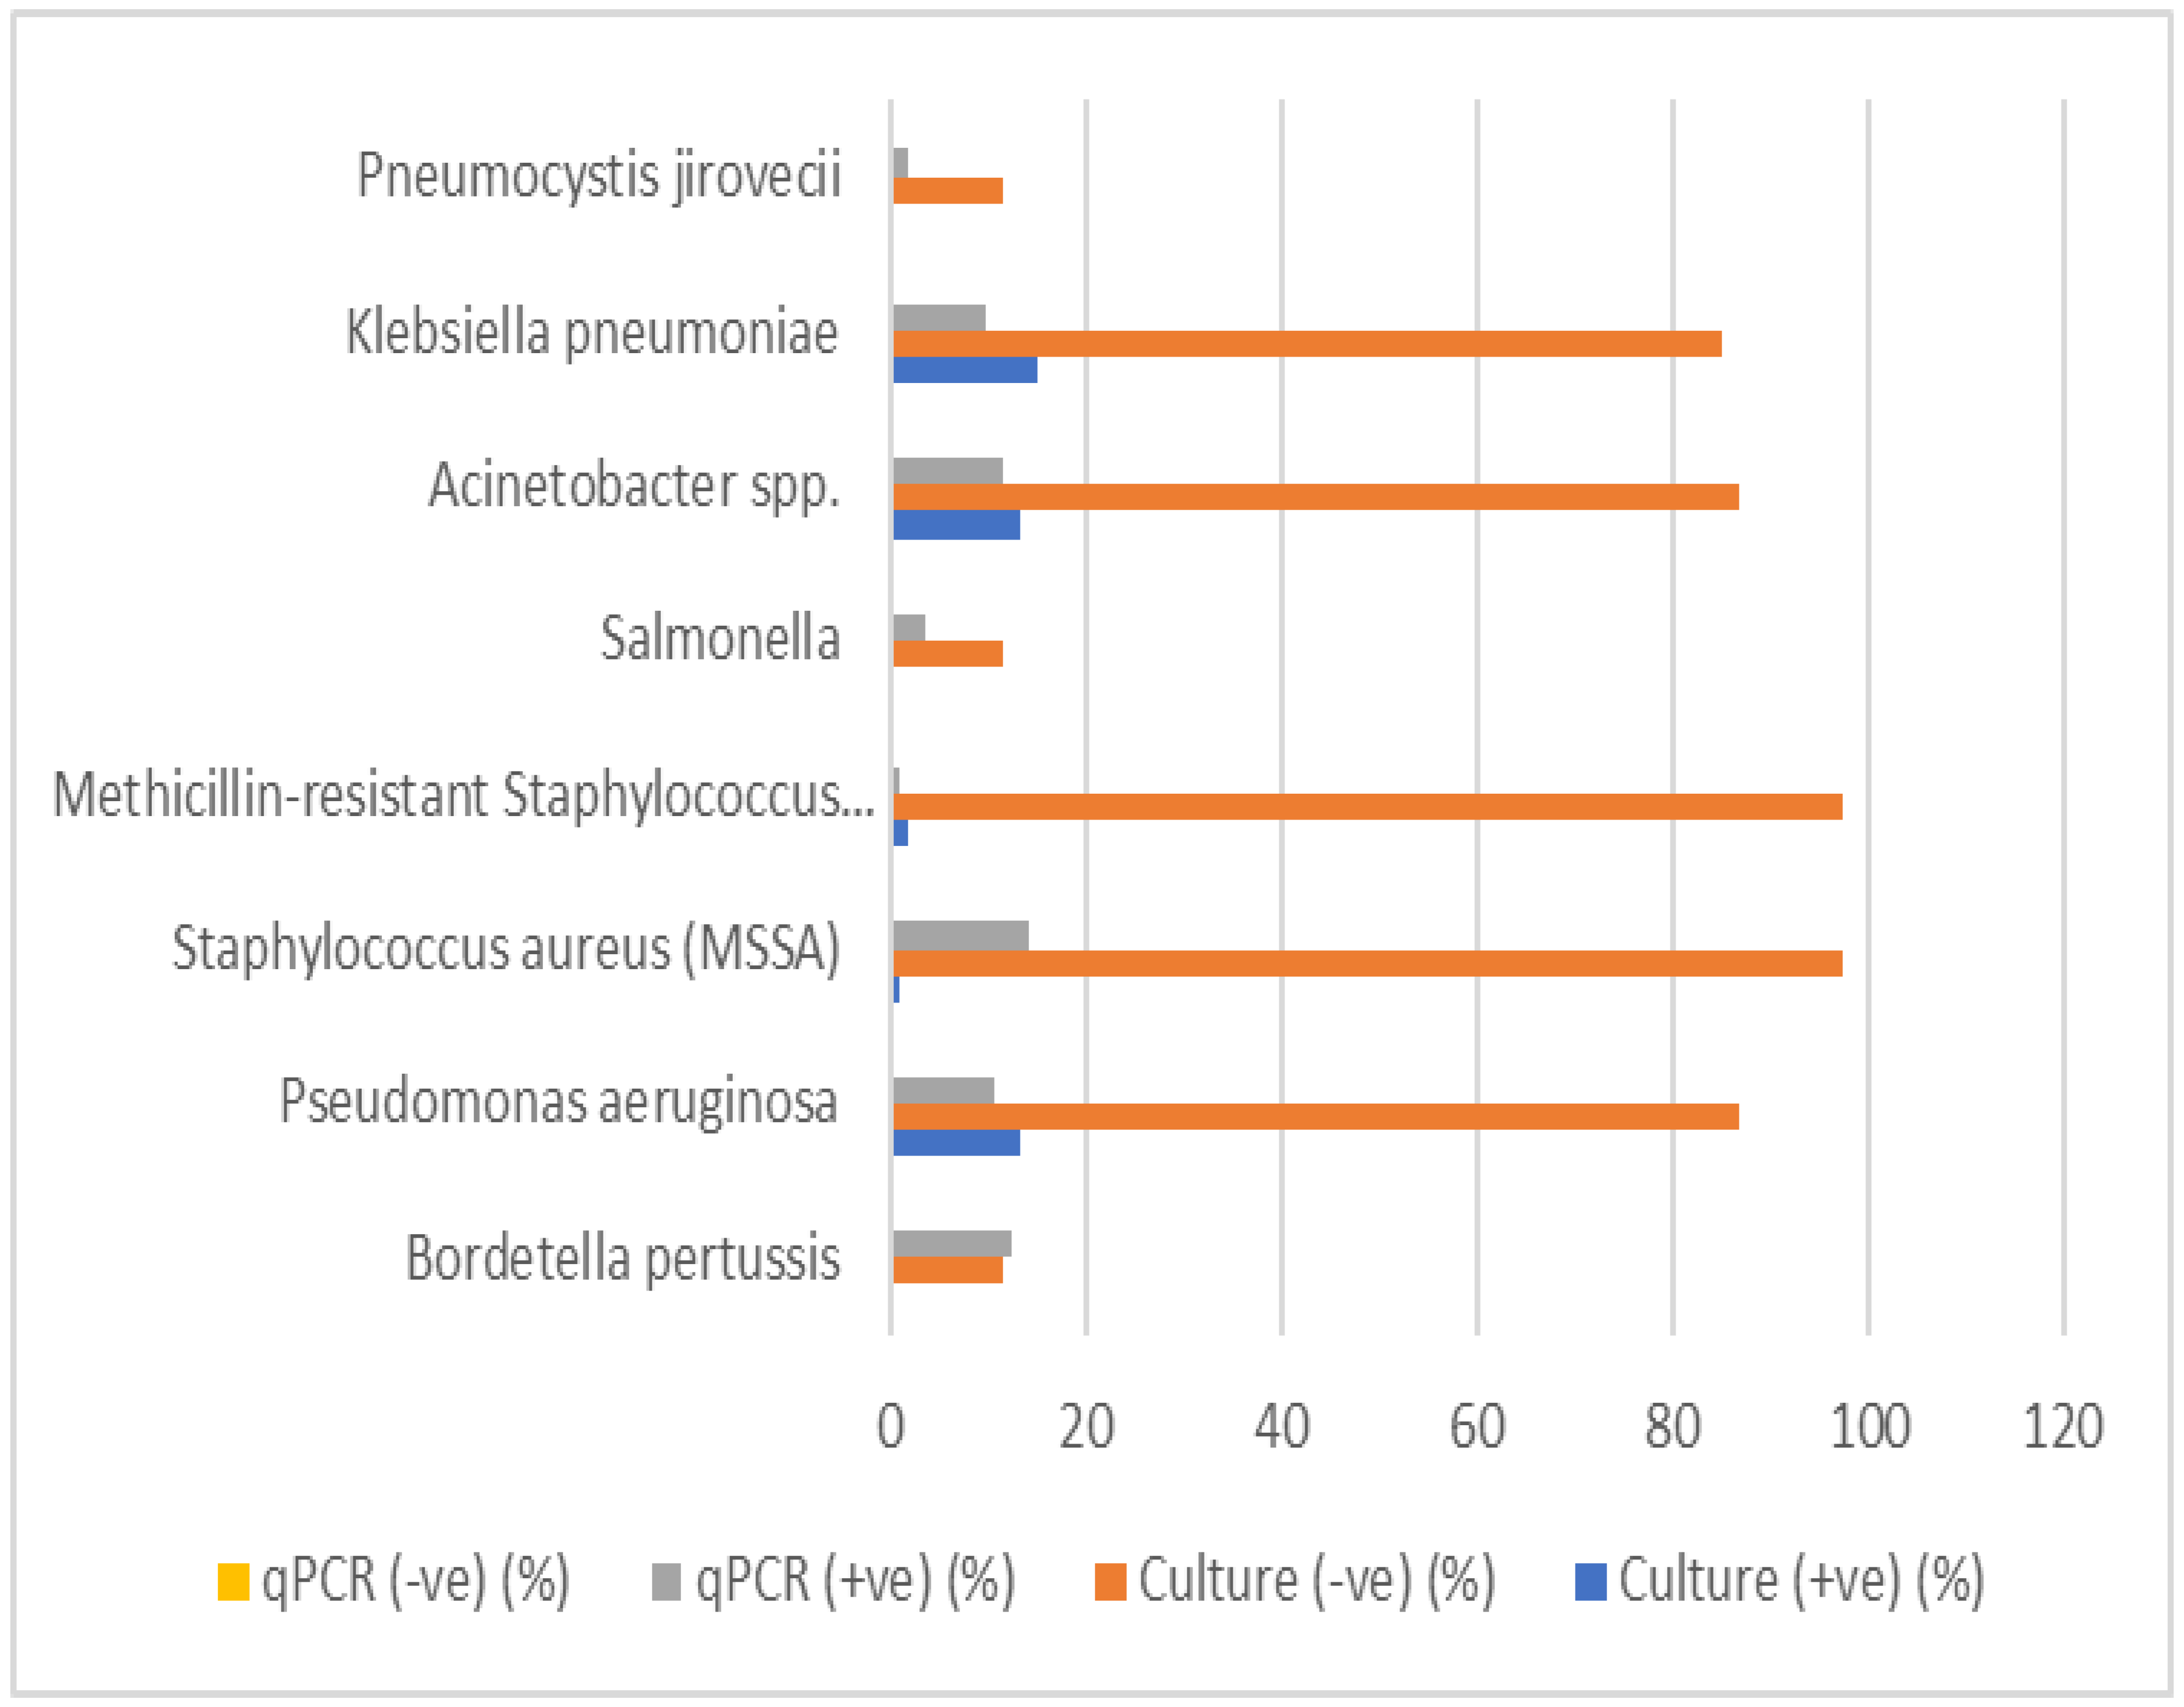
5.6. Comparison between Culture and qPCR
The comparison of culture and qPCR detection for various respiratory pathogens was conducted to assess the diagnostic performance of both methods. The results for each pathogen are summarized in Table 16. The table includes the valid percentages for positive and negative culture results, qPCR results, as well as the p-values for statistical significance.
Bordetella pertussis: A low percentage (12.3%) of positive results were detected by qPCR, with no culture positive samples. The p-value (0.152) indicates no statistically significant difference between culture and qPCR results.
Streptococcus pneumoniae, Mycoplasma pneumoniae, Non-typeable Haemophilus influenzae, Moraxella catarrhalis, Chlamydia pneumoniae, and Legionella pneumophila: These pathogens showed a 100% negative culture rate, but no positive qPCR results were found for most of them. The p-values were marked as "a," indicating no available statistical test was performed or these pathogens did not meet criteria for testing.
Pseudomonas aeruginosa: This pathogen showed 13.2% positive culture results and 10.5% positive qPCR results, with a p-value of 0, suggesting a highly significant difference between culture and qPCR detection methods.
Meticillin-sensitive Staphylococcus aureus (MSSA) and MRSA: While MSSA and MRSA showed a low percentage of positive culture results (0.9% and 1.8%, respectively), both had significantly higher qPCR positivity (14% for MSSA, 0.9% for MRSA). The p-values were 0.778 for MSSA and 0 for MRSA, indicating no significant difference for MSSA but a significant difference for MRSA.
Salmonella, Acinetobacter spp., Klebsiella pneumoniae: Salmonella had a culture positivity of 0%, but the qPCR detected 3.5% positive samples, with a p-value of 0.465, suggesting no significant difference between the two methods. Acinetobacter spp. and Klebsiella pneumoniae had similar findings, with culture positivity percentages of 13.2% and 14.9%, respectively, and qPCR positivity of 11.4% and 9.6%. Both had p-values of 0, indicating no significant difference.
Legionella longbeachae: This pathogen showed no percentage of positive culture (0%) and no qPCR positivity (0%), with all results marked as "not available" for qPCR. The p-value is marked as "a," indicating no comparison.
Pneumocystis jirovecii: This pathogen showed a culture positivity of 0% and qPCR positivity of 1.8%, with a p-value of 0.609, suggesting no significant difference.
Table 14.
Comparison of culture and qPCR results for respiratory pathogens.
| Bacteria Name | Culture (+ve) (%) | Culture (-ve) (%) | Culture Not Available (%) | qPCR (+ve) (%) | qPCR (-ve) (%) | Not Available qPCR (%) | P-value |
| Bordetella pertussis | 0 | 11.4 | 88.6 | 12.3 | 0 | 87.7 | 0.152 |
| Streptococcus pneumoniae | 0 | 100 | 0 | 0 | 0 | 100 | a |
| Mycoplasma pneumoniae | 0 | 100 | 0 | 0.9 | 0 | 99.1 | a |
| Non-typeable Haemophilus influenzae | 0 | 100 | 0 | 2.6 | 0 | 97.4 | a |
| Moraxella catarrhalis | 0 | 100 | 0 | 0 | 0 | 100 | a |
| Chlamydia pneumoniae | 0 | 100 | 0 | 0 | 0 | 100 | a |
| Legionella pneumophila | 0 | 100 | 0 | 0 | 0 | 100 | a |
| Pseudomonas aeruginosa | 13.2 | 86.8 | 0 | 10.5 | 0 | 89.5 | <0.001 |
| Staphylococcus aureus (MSSA) | 0.9 | 97.4 | 1.8 | 14 | 0 | 86 | 0.778 |
| Methicillin-resistant Staphylococcus aureus (MRSA) | 1.8 | 97.4 | 0.9 | 0.9 | 0 | 99.1 | <0.001 |
| Salmonella | 0 | 11.4 | 88.6 | 3.5 | 0 | 96.5 | 0.465 |
| Acinetobacter spp. | 13.2 | 86.8 | 0 | 11.4 | 0 | 88.6 | <0.001 |
| Klebsiella pneumoniae | 14.9 | 85.1 | 0 | 9.6 | 0 | 90.4 | <0.001 |
| Legionella longbeachae | 0 | 7.9 | 92.1 | 0 | 0 | 100 | a |
| Pneumocystis jirovecii | 0 | 11.4 | 88.6 | 1.8 | 0 | 98.2 | 0.609 |
"a," indicating no available statistical test was performed or these pathogens did not meet criteria for testing.
Figure 3.
Comparison between culture and qPCR detection of respiratory pathogens.
4. Discussion
This study utilized polymerase chain reaction (PCR) to detect antibiotic resistance genes in pneumonia pathogens, providing rapid and precise identification of genetic resistance mechanisms. The findings shed light on the genetic basis of antibiotic resistance in pneumonia patients, highlighting current management challenges. Empirical antibiotic treatment poses significant challenges, particularly in low- and middle-income countries with widespread multidrug-resistant bacteria [6]. Rapid molecular PCR-based diagnostics are urgently needed to guide targeted antibiotic therapy, mitigating delayed treatment, mortality, and antimicrobial resistance [7].
This study used a multiplex PCR assay for rapid detection of 14 antibiotic resistance genes directly from respiratory samples, facilitating timely diagnosis and targeted therapy. Our study identified the Mec A gene in 77.2% of samples, making it the most prevalent resistance gene detected. This finding corroborates global evidence underscoring Mec A’s critical role in methicillin resistance, particularly among Staphylococcus aureus isolates [8]. The strong association between Mec A and methicillin resistance (p < 0.001) emphasizes its clinical significance in managing S. aureus-related infections, including pneumonia [9].
Carbapenem resistance genes (Oxa-48-like, Ndm, Kpc) exhibited varying prevalence rates, with Oxa-48-like detected in 13.1% of samples. Although statistical significance was not achieved (p > 0.05), these genes highlight the emerging threat of carbapenemase-producing pathogens in multidrug-resistant pneumonia [10]
Extended-spectrum beta-lactamase (ESBL) genes, specifically Ctx-M-1 and Shv, confirmed the prevalence of beta-lactam resistance. Notably, Ctx-M-1 (33.3%) contributes significantly to global cephalosporin resistance, emphasizing the importance of considering ESBL-producing bacteria in empirical pneumonia treatment [11,12]
The Oxa-51-like gene demonstrated a borderline significant association with ertapenem resistance (p = 0.046), suggesting its potential role in conferring resistance. Typically intrinsic to Acinetobacter baumannii [10], this finding underscores the need for targeted surveillance of A. baumannii infections, particularly in mechanically ventilated patients.
The hospital selected antibiotics such as meropenem and piperacillin-tazobactam primarily for their broad-spectrum efficacy against various pathogens, particularly those causing severe infections. Meropenem emerged as the most frequently used empiric antibiotic due to its effectiveness against resistant Gram-negative bacteria. In contrast, piperacillin-tazobactam was chosen for its synergistic effects and capability to cover both Gram-positive and Gram-negative organisms.
However, the widespread use of these antibiotics poses a risk of developing resistance. Notably, the prevalence of resistance genes, like Oxa-51-like and Oxa-23-like, signifies a considerable threat from carbapenem-resistant organisms. Resistance rates for carbapenems are concerning, with 23.7% for imipenem and 24.6% for meropenem, and similar resistance is observed with piperacillin-tazobactam at 30.7%. (Sharma et al. [13])
When comparing sensitivity tests to antibiotic utilization, discrepancies arise. For example, despite meropenem’s sensitivity being at 30.7%, it is used in 31.6% of cases, indicating prescriptions often occur despite a significant portion of pathogens exhibiting resistance. Similarly, although piperacillin-tazobactam has a low sensitivity of 21.1%, it is frequently utilized. This gap stresses the importance of aligning empirical treatment decisions with actual resistance patterns and highlights the necessity for ongoing surveillance and antibiotic stewardship programs to combat resistance development effectively.
The results of this study underscore the significant diagnostic advantages of qPCR over traditional culture-based methods for detecting various respiratory pathogens, for example, was identified by qPCR in 12.3% of cases, while no positive results were obtained through culture, although the p-value (0.152) did not indicate statistical significance [14]. Pseudomonas aeruginosa displayed a significant detection difference between culture (13.2%) and qPCR (10.5%), with a highly significant p-value (<0.001). This emphasizes qPCR’s capability to complement or even surpass culture methods in detecting certain pathogens [15]. Similarly, both MSSA and MRSA showed low culture positivity (0.9% and 1.8%, respectively) but much higher qPCR detection rates (14% for MSSA and 0.9% for MRSA). The p-value for MSSA (0.778) indicated no significant difference, while MRSA (p < 0.001) highlighted qPCR’s superiority in detecting resistant strains. Other pathogens such as Salmonella, Acinetobacter spp., and Klebsiella pneumoniae presented with low culture positivity but comparable qPCR detection, with p-values suggesting no significant difference for Salmonella (0.465) but highly significant differences for Acinetobacter spp. and Klebsiella pneumoniae (both <0.001). Pneumocystis jirovecii, which had 0% culture positivity but 1.8% qPCR positivity, indicates that qPCR can detect pathogens missed by culture, though the difference was not statistically significant (p-value: 0.609). Overall, this study’s findings strongly advocate for the integration of qPCR into routine clinical diagnostics. [16]
The comparison of culture and PCR methods for detecting bacteria reveals that, in some cases, culture proved more effective than PCR, which is typically expected to be more sensitive. However, errors in performing PCR—such as sample handling, DNA extraction, personnel errors, and contamination—can lead to false-negative results. For example, Pseudomonas aeruginosa showed 13.2% culture positivity compared to 10.5% with qPCR. Similarly, for Staphylococcus aureus (MRSA), culture positivity was 0.9%, while qPCR positivity was notably higher at 14%. In the case of Acinetobacter spp., there was 13.2% culture positivity and 11.4% qPCR positivity, while Klebsiella pneumoniae showed 14.9% culture positivity and 9.6% qPCR positivity.
PCR offers several advantages over traditional culture-based methods, making it a superior diagnostic tool in many clinical settings. One of the key benefits of PCR is its high sensitivity, which allows for the detection of low levels of pathogens that may go undetected with culture methods [15]. Additionally, PCR boasts high specificity, enabling the precise identification of particular DNA sequences from complex mixtures [17]. This method is also extremely fast compared to traditional techniques, providing rapid results that can significantly expedite clinical decision-making and patient management [18]. Another advantage is that PCR can be performed easily and can use various fluid samples, including blood, without being influenced by prior antimicrobial therapy. This minimizes the risk of multidrug-resistant pathogen emergence and reduces the need for unnecessarily administered drugs [19]. Furthermore, PCR minimizes the risk of cross-contamination and allows for the simultaneous identification of multiple microorganisms and resistance genes, enhancing diagnostic throughput and accuracy .However, it is important to note that PCR also has some limitations, such as higher costs compared to traditional methods, the inability to assess susceptibility to all antibiotics, and challenges in diagnosing infections due to non-viable organism detection. Despite these drawbacks, the significant advantages of PCR make it an invaluable tool in modern diagnostics, especially in the fight against antibiotic resistance [20].
5. Conclusions
This study comprehensively investigated the prevalence of antibiotic resistance genes in pneumonia pathogens using PCR, with a focus on several key antibiotic classes, including beta-lactams, carbapenems, and others. The findings highlighted the complex and dynamic nature of antibiotic resistance in Pneumonia pathogens and underscore the critical need for robust molecular surveillance to guide treatment decisions and combat the growing threat of resistant infections.
The study also highlighted the advantages of using PCR as a diagnostic tool to detect antibiotic resistance genes. PCR provided a rapid, sensitive, and specific method for detecting resistance genes directly from clinical samples, including those from patients with negative or slow-growing cultures. The increased sensitivity of PCR over traditional culture techniques was particularly evident in the detection of pathogens such as Staphylococcus aureus (MSSA and MRSA) and Pseudomonas aeruginosa, where PCR detected resistance in cases that culture failed to identify. This underscores the potential role of PCR in improving the diagnostic accuracy of respiratory infections, enabling more targeted and timely therapeutic interventions.
5.1. Clinical Implications and Recommendations
5.1.1. Patient Sample Collection
Collect respiratory samples (e.g., sputum, nasopharyngeal swabs, or bronchoalveolar lavage) and blood cultures from CAP patients. Ensure sterile collection, labeling, and rapid transport to the lab.
5.1.2. qPCR Analysis
Perform qPCR to detect specific pathogens (e.g., Streptococcus pneumoniae, Haemophilus influenzae, atypical bacteria) and resistance genes (e.g., Mec A, Tem, Ctx-M-1, or carbapenemase genes like Oxa-48-like).
5.1.3. Initial Empiric Therapy for CAP
Begin treatment immediately, tailoring the choice of antibiotics to the severity of the illness and local resistance patterns.
Low-Severity CAP (CURB-65 Score 0–1):
- First-line: Amoxicillin-Clavulanate or Ceftriaxone for typical pathogens.
Atypical coverage: Add Azithromycin or Doxycycline.
- Moderate-Severity CAP (CURB-65 Score 2):
Combination therapy with Ceftriaxone (or Cefotaxime) and Azithromycin.
- High-Severity CAP (CURB-65 Score ≥3 or ICU Admission):
Broad-spectrum: Piperacillin-Tazobactam or Meropenem, plus Azithromycin for atypical coverage. Suspected MRSA: Add Vancomycin or Linezolid.
5.2. Tailored Therapy Based on qPCR Results
Adjust therapy once qPCR results identify the pathogen and resistance genes:
- Methicillin-Resistant Staphylococcus aureus (MRSA): Use Vancomycin or Linezolid.
- Beta-Lactamase Producers (e.g., Tem, shv, or Ctx-M-1): Use Meropenem or Ertapenem.
- Carbapenemase-Producing Pathogens (e.g., Oxa-51-like, Ndm genes): Use Colistin plus Tigecycline.
- Multidrug-Resistant Pseudomonas or Acinetobacter spp.: Add Amikacin or Polymyxins.
- Atypical Pathogens (e.g., Mycoplasma pneumoniae, Legionella spp.): Use Azithromycin or Levofloxacin.
- Typical Pathogens Without Resistance Genes: Narrow therapy to Ceftriaxone, Amoxicillin-Clavulanate, or Doxycycline, depending on pathogen susceptibility.
5.3. Limitations of the Study
Despite the valuable insights provided by this study, several limitations must be considered when interpreting the results. First, the sample size, while adequate for a preliminary analysis, may not fully represent the broader population of pneumonia patients. A larger cohort across multiple centers would be needed to confirm the generalizability of these findings, particularly given the variation in resistance patterns that may exist across different geographical regions.
Second, the study focused primarily on a targeted set of resistance genes, which may not capture the full spectrum of resistance mechanisms present in pneumonia pathogens. It is possible that other uncharacterized genes or mechanisms, such as efflux pump systems or alterations in antibiotic targets, contribute to resistance but were not included in the analysis. Additionally, the study did not assess the phenotypic resistance of the pathogens, which would have provided complementary data on the clinical significance of the detected genes.
Furthermore, while PCR is a powerful tool for identifying resistance genes, it does not provide information about the functional expression of these genes in bacterial populations. In some cases, resistance genes may be present but not actively contributing to the resistance phenotype. Future studies using whole-genome sequencing or transcriptomic approaches could provide a more comprehensive understanding of the genetic and phenotypic relationships between resistance genes and resistance phenotypes.
Another limitation was the use of a single diagnostic kit (Bacresista GLA kit), which may not have detected all possible resistance genes, particularly those that are rare or specific to certain pathogens. Future work could involve using broader or more customized panels for PCR detection to ensure the inclusion of a wider variety of resistance determinants.
5.4. Future Work
Future studies should aim to expand on the findings of this research by addressing the limitations outlined above. Key directions for future work include:
- Larger, Multicenter Studies: A larger and more geographically diverse sample would allow for more robust data on the prevalence and distribution of antibiotic resistance genes across different populations. Multicenter studies could provide a clearer picture of regional differences in resistance patterns, which is crucial for tailoring local and national antibiotic stewardship policies.
- Broadening the Range of Resistance Genes Studied: Future work should include a broader range of resistance genes, particularly those related to newer antibiotics and emerging resistance mechanisms. Whole-genome sequencing or next-generation sequencing (NGS) could provide a more comprehensive assessment of both known and novel resistance determinants, including those associated with plasmids, integrons, or other mobile genetic elements. This would offer a more complete understanding of the genetic basis of resistance in pneumonia pathogens.
- Phenotypic Resistance Testing: Complementing molecular techniques like PCR with phenotypic resistance testing could help establish a clearer link between gene presence and antibiotic resistance. This would be especially useful for genes that are not fully expressed or may have reduced functional significance in clinical isolates.
- Functional Studies: Investigating the functional role of resistance genes, such as Ndm, Oxa-48-like, and Ctx-M-1, in clinical isolates would provide valuable insights into how these genes contribute to resistance in a dynamic clinical setting. Transcriptomic analyses or protein assays could help determine the expression levels and activity of these genes under different conditions, thus further clarifying their role in infection outcomes.
- Development of PCR-based Diagnostic Tools for Routine Clinical Use: As the study demonstrates the value of PCR in detecting resistance genes, future research could focus on optimizing and validating PCR-based diagnostic kits for routine clinical use in pneumonia diagnostics. Such kits could be used to rapidly identify both the pathogens and their resistance profiles, allowing for faster, more targeted treatment strategies.
Author Contributions
Conceptualization, E.A.A., M.A.Z., and A.R.A.; methodology, A.R.A.; software, A.R.A.; validation, A.R.A., M.S.Z., and L.Z.H.; formal analysis, A.R.A. and E.A.A.; investigation, A.R.A. and E.A.A; resources, A.R.A.; data curation, A.R.A. and M.A.Z.; writing—original draft preparation, A.R.A. and E.A.A.; writing—review and editing, M.A.M., H.A.K., M.A.S., and A.R.A.; visualization, E.A.A.; supervision, A.R.A. and M.S.Z.,; project administration, A.R.A.; funding acquisition, A.R.A. and M.S.Z., All authors have read and agreed to the published version of the manuscript.
Funding
This research received no external funding
Institutional Review Board Statement
The Institutional Review Board (IRB) of the clinical site approved the study, whereby all data were de-identified and kept in secure databases to protect patient confidentiality. This study complies with the Declaration of Helsinki. The approval of the study was gained from the Islamic Hospital ethical committee in Amman, Jordan, and University of Jordan, Amman, Jordan (IRB: 101/2021/1053, and 6-11-2021-921 respectively).
Informed Consent Statement
Informed consent was waived due to the observational nature of the study and the absence of any intervention or interaction with human participants.
Data Availability Statement
Available upon reasonable request.
Acknowledgments
The authors would like to thank the IRB committee and participants.
Conflicts of Interest
The authors declare no conflicts of interest.
References
- Dadgostar, P. Antimicrobial resistance: Implications and costs. Infect Drug Resist 2019, 12, 3903–3910. [Google Scholar] [CrossRef] [PubMed]
- Watkins, R.R.; Van Duin, D. Current trends in the treatment of pneumonia due to multidrug-resistant Gram-negative bacteria. F1000Res 2019, 8, F1000 Faculty Rev-121. [Google Scholar] [CrossRef] [PubMed]
- Torres, A.; Cilloniz, C.; Niederman, M.S.; Menéndez, R.; Chalmers, J.D.; Wunderink, R.G.; van der Poll, T. Pneumonia. Nat Rev Dis Primers 2021, 7, 25. [Google Scholar] [CrossRef] [PubMed]
- Murdoch, D.R.; Anderson, T.P.; Beynon, K.A.; Chua, A.; Fleming, A.M.; Laing, R.T.R.; Town, G.I.; Mills, G.D.; Chambers, S.T.; Jennings, L.C. Evaluation of a PCR assay for detection of Streptococcus pneumoniae in respiratory and nonrespiratory samples from adults with community-acquired pneumonia. J Clin Microbiol 2003, 41, 63–66. [Google Scholar] [CrossRef] [PubMed]
- Salam, M.A.; Al-Amin, M.Y.; Salam, M.T.; Pawar, J.S.; Akhter, N.; Rabaan, A.A.; Alqumber, M.A.A. Antimicrobial resistance: A growing serious threat for global public health. Healthcare (Basel) 2023, 11, Article 13. [Google Scholar] [CrossRef] [PubMed]
- Ali, T.; Habib, A.; Nazir, Z.; Ali, M.; Haque, M.A. Healthcare challenges in LMICs: Addressing antibiotic resistance threats, a call for comprehensive global solutions: An editorial. Int J Surg 2024, 110, 3085–3087. [Google Scholar] [CrossRef] [PubMed]
- Kaprou, G.D.; Bergšpica, I.; Alexa, E.A.; Alvarez-Ordóñez, A.; Prieto, M. Rapid methods for antimicrobial resistance diagnostics. Antibiotics (Basel) 2021, 10, 209. [Google Scholar] [CrossRef] [PubMed]
- Idrees, M.M.; Saeed, K.; Shahid, M.A.; Akhtar, M.; Qammar, K.; Hassan, J.; Khaliq, T.; Saeed, A. Prevalence of mecA− and mecC-associated methicillin-resistant Staphylococcus aureus in clinical specimens, Punjab, Pakistan. Biomedicines 2023, 11, Article 3. [Google Scholar] [CrossRef] [PubMed]
- Liu, C.; Bayer, A.; Cosgrove, S.E.; Daum, R.S.; Fridkin, S.K.; Gorwitz, R.J.; Kaplan, S.L.; Karchmer, A.W.; Levine, D.P.; Murray, B.E.; et al. Clinical practice guidelines by the infectious diseases society of America for the treatment of methicillin-resistant Staphylococcus aureus infections in adults and children: Executive summary. Clin Infect Dis 2011, 52, 285–292. [Google Scholar] [CrossRef] [PubMed]
- Ramirez, M.S.; Bonomo, R.A.; Tolmasky, M.E. Carbapenemases: Transforming Acinetobacter baumannii into a yet more dangerous menace. Biomolecules 2020, 10, 720. [Google Scholar] [CrossRef] [PubMed]
- Hijazi, S.M.; Fawzi, M.A.; Ali, F.M.; Abd El Galil, K.H. Prevalence and characterization of extended-spectrum beta-lactamases producing Enterobacteriaceae in healthy children and associated risk factors. Ann Clin Microbiol Antimicrob 2016, 15, 3. [Google Scholar] [CrossRef] [PubMed]
- Paterson, D.L.; Bonomo, R.A. Extended-spectrum beta-lactamases: A clinical update. Clin Microbiol Rev 2005, 18, 657–686. [Google Scholar] [CrossRef] [PubMed]
- Sharma, S.; Banerjee, T.; Yadav, G.; Kumar, A. Susceptibility profile of bla OXA-23 and metallo-β-lactamases co-harbouring isolates of carbapenem resistant Acinetobacter baumannii (CRAB) against standard drugs and combinations. Front Cell Infect Microbiol 2022, 12, 1068840. [Google Scholar] [CrossRef]
- Aydemir, O.; Aydemir, Y.; Ozdemir, M. The role of multiplex PCR test in identification of bacterial pathogens in lower respiratory tract infections. Pak J Med Sci 2014, 30, 1011–1016. [Google Scholar] [CrossRef] [PubMed]
- Sundell, N.; Andersson, L.-M.; Brittain-Long, R.; Sundvall, P.-D.; Alsiö, Å.; Lindh, M.; Gustavsson, L.; Westin, J. PCR detection of respiratory pathogens in asymptomatic and symptomatic adults. J Clin Microbiol 2019, 57, e00716-18. [Google Scholar] [CrossRef] [PubMed]
- Engstrom-Melnyk, J.; Rodriguez, P.L.; Peraud, O.; Hein, R.C. Clinical applications of quantitative real-time PCR in virology. Methods Microbiol 2015, 42, 161–197. [Google Scholar] [CrossRef] [PubMed]
- Yamin, D.; Uskoković, V.; Wakil, A.M.; Goni, M.D.; Shamsuddin, S.H.; Mustafa, F.H.; Alfouzan, W.A.; Alissa, M.; Alshengeti, A.; Almaghrabi, R.H.; et al. Current and future technologies for the detection of antibiotic-resistant bacteria. Diagnostics (Basel, Switzerland) 2023, 13, 3246. [Google Scholar] [CrossRef] [PubMed]
- Markoulatos, P.; Siafakas, N.; Moncany, M. Multiplex polymerase chain reaction: A practical approach. J Clin Lab Anal 2002, 16, 47–51. [Google Scholar] [CrossRef] [PubMed]
- Nazir, I.; Zaid Mahmood, H.; E Mustafa, S. Polymerase chain reaction: A creative review. J Appl Biotechnol Bioeng 2020, 7, 157–159. [Google Scholar] [CrossRef]
- Yang, S.; Rothman, R.E. PCR-based diagnostics for infectious diseases: Uses, limitations, and future applications in acute-care settings. Lancet Infect Dis 2004, 4, 337–348. [Google Scholar] [CrossRef] [PubMed]
Figure 1.
Antibiotic sensitivity test.
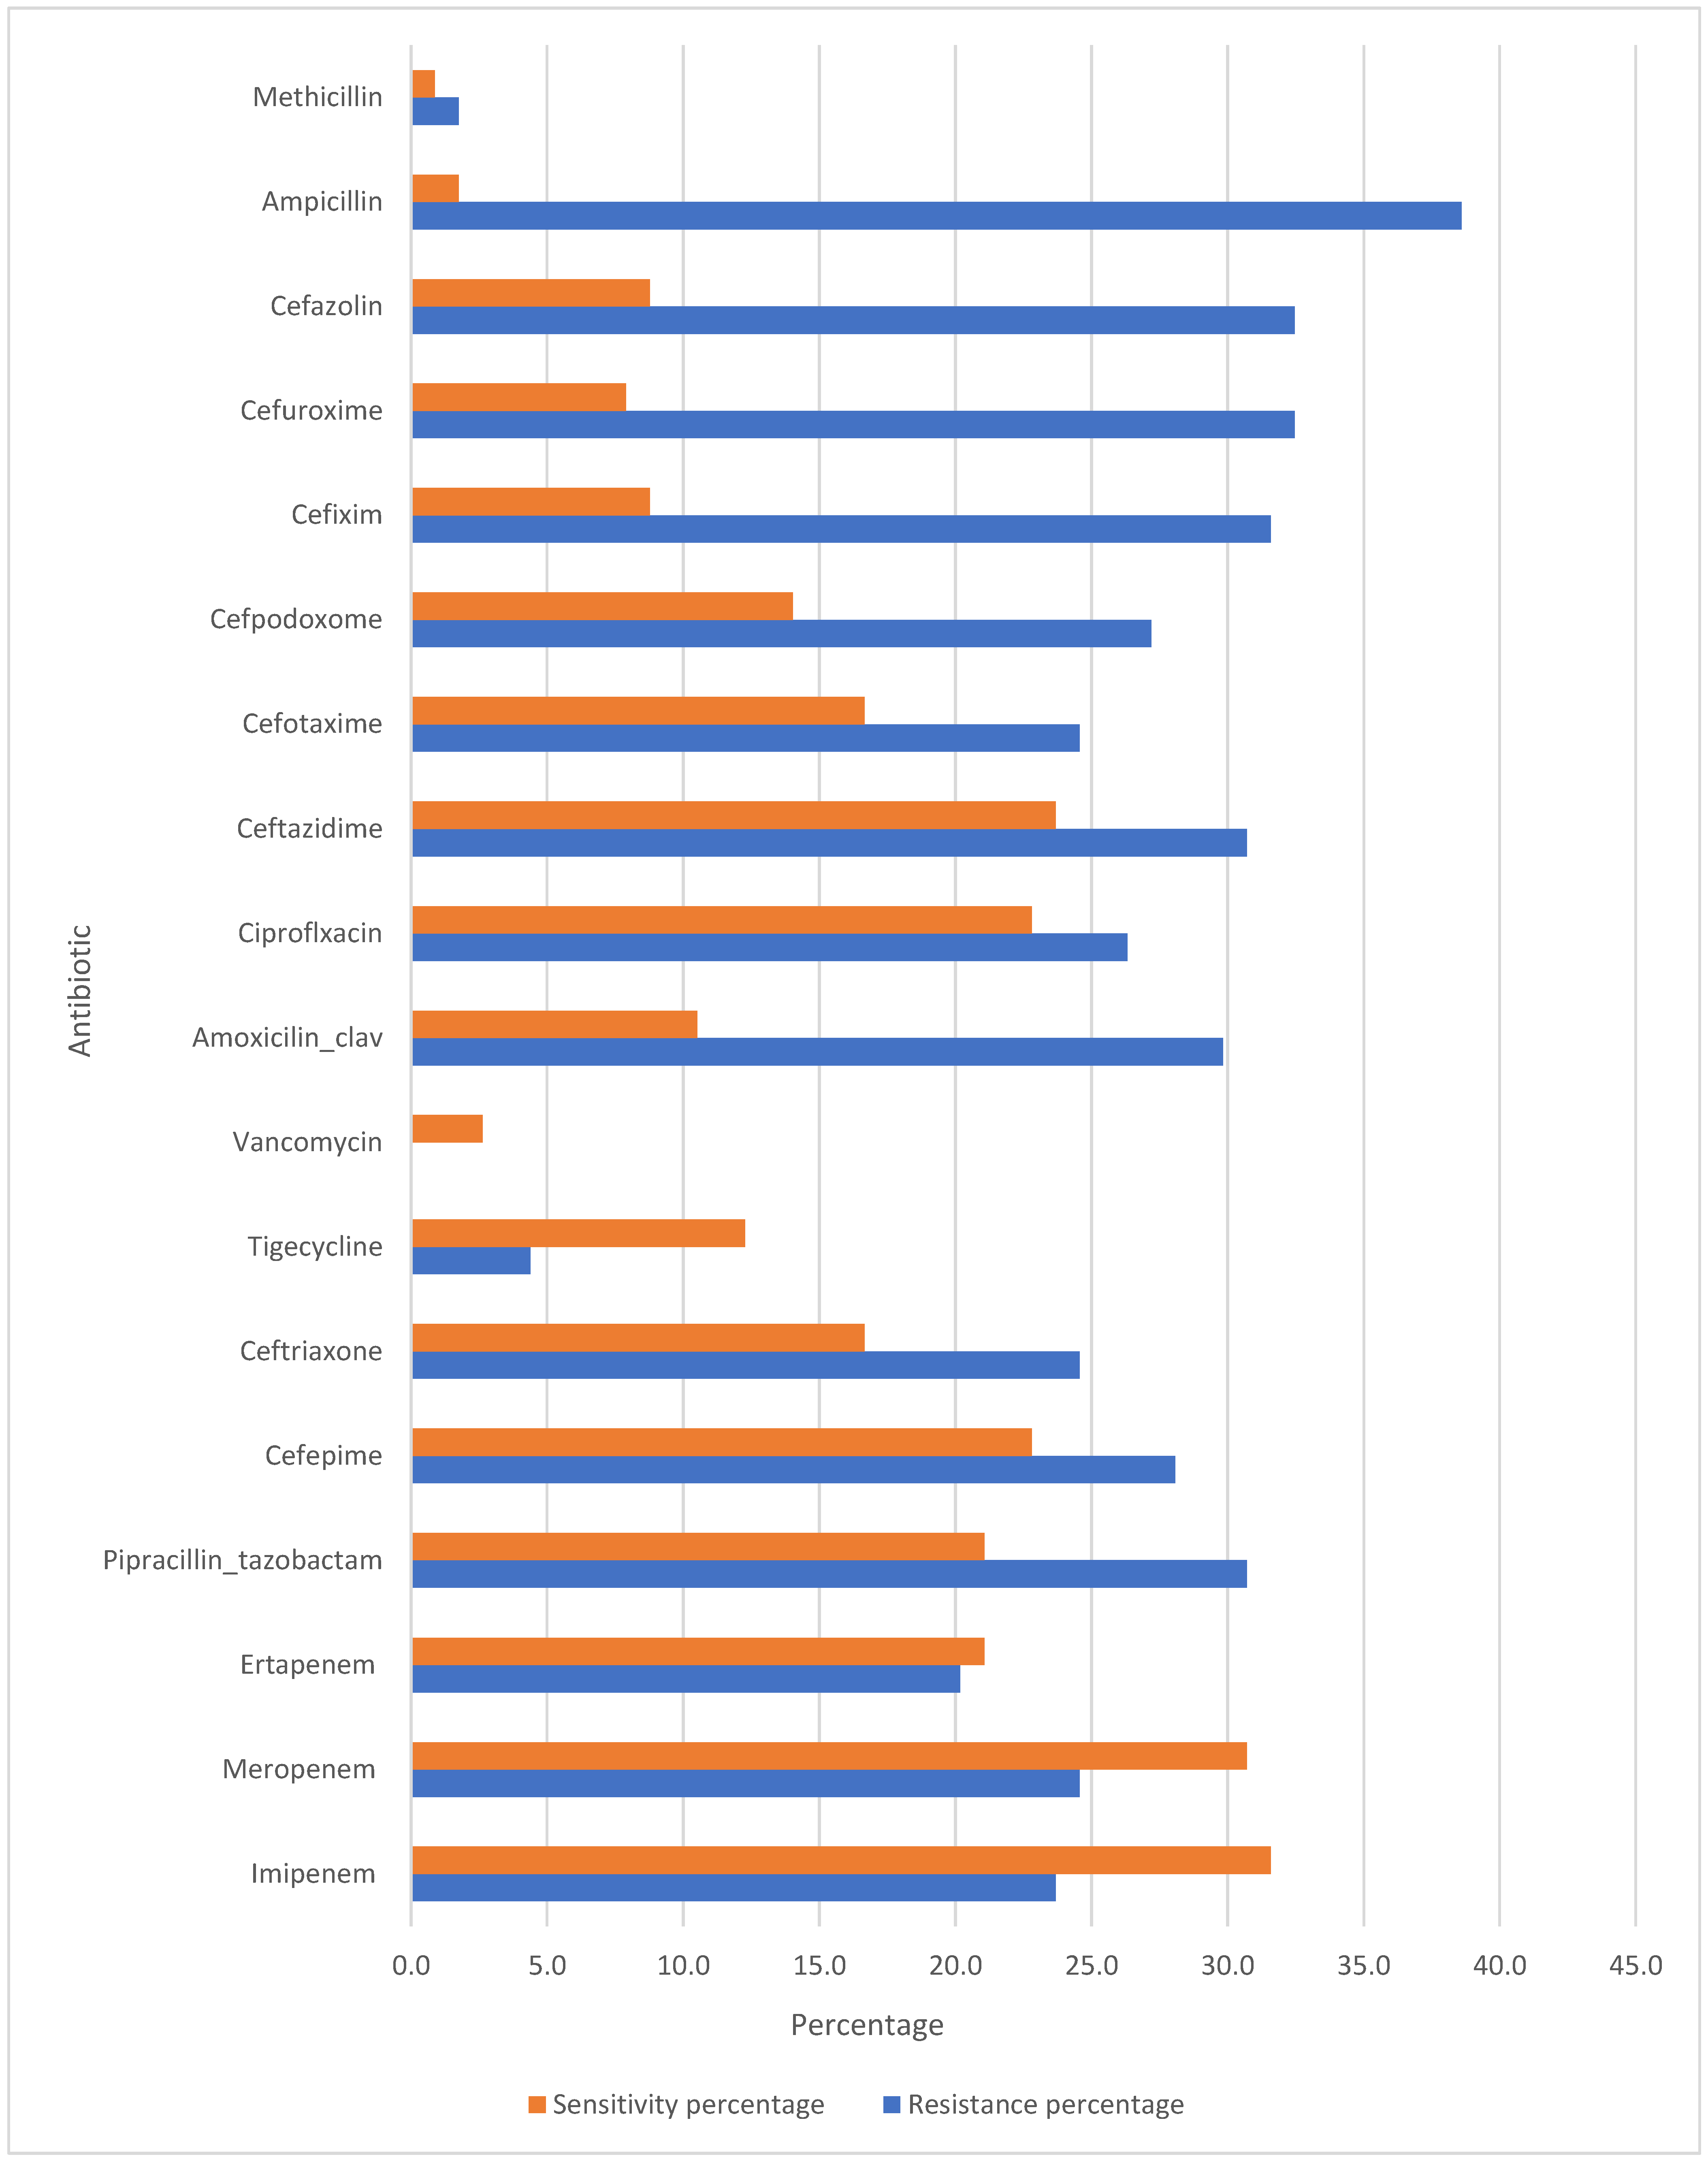
Table 1.
Study framework.
| Aspect | Description |
| Study Type | Observational study |
| Objective | Identification of antibiotic resistance genes |
| Year of Study | 2022 |
| Study Clinical Site | Islamic Hospital |
| Sample Size | 114 patients and lower respiratory tract samples |
Table 2.
Participant selection criteria.
| Category | Inclusion Criteria | Exclusion Criteria |
| Diagnosis | Clinically confirmed pneumonia | Non-pneumonia cases |
| Sample Quality | - | Contaminated or insufficient samples |
| IRB | Patients or their guardians provided informed consent for the use of their samples in this study. |
Table 3.
Patient demographics and clinical characteristics.
| Category | Parameter |
| Demographics | Age |
| Gender | |
| Length of Stay (LOS) | |
| ICU Length of Stay (ICU-LOS) | |
| Clinical Outcome | |
| Microbial Pathogenesis | |
| Antibiotic Utilization (Empirical Initial & Next Therapy) | |
| Clinical Features | Cough |
| Shortness of Breath (SOB) | |
| Fever | |
| Sputum Production | |
| Pleuritic Chest Pain | |
| Hemoptysis or Rust-Colored Sputum | |
| Respiratory Distress | |
| Chronic Obstructive Pulmonary Disease (COPD) | |
| Asthma | |
| Immunosuppressive Treatment History | |
| Aspiration Pneumonia | |
| Patients Requiring Intubation with Mechanical Ventilation | |
| Prior Antibiotic Use | |
| Pneumonia Severity Index (PSI) | |
| CURB-65 Score | |
| Microbiological Findings | Pathogen Identification via PCR and Culture Results |
Table 4.
Reagents/materials and their purposes.
| Reagent/Material | Purpose |
| Lysis Buffer | Breaks cell walls to release DNA |
| Binding Buffer | Facilitates the binding of DNA to the spin column by providing a suitable environment for DNA adsorption. |
| Wash Buffers | Washes away contaminants and impurities from the bound DNA. Typically includes ethanol to help in the washing process. |
| Elution Buffer | Contains a low salt solution that helps elute the DNA from the column into a clean collection tube. |
| Proteinase K | Breaks down proteins |
| Spin Columns | Contains a silica membrane that binds DNA during the binding step and allows for the separation of DNA from contaminants during washing. |
| Collection Tubes | Collects the flow-through during the binding and washing steps, and holds the eluted DNA after the final elution step. |
Table 5.
Materials and methods for DNA extraction.
| Step | Material/Method | Description |
| 1. Cell Lysis | ZR BashingBead™ Lysis Tubes, Lysis Solution, Proteinase K | 200 µL of biofluid added to the lysis tubes. 750 µL of Lysis Solution and 20 µL of Proteinase K added, followed by incubation at 55°C for 30 minutes to lyse bacterial cells. |
| 2. Bead Beating | Omni Bead Ruptor Elite®, Bashing Bead™ Tubes | Bead-beating conducted for 1 minute at 6 m/s, with 5-minute rest intervals for 3 cycles to break open bacterial cells. |
| 3. DNA Binding | ZymoBIOMICS™ DNA Binding Buffer, Zymo-Spin™ IICR Column | 1,200 µL of Binding Buffer mixed with the lysate, and aliquoted into the spin column. Centrifuged at 10,000 × g for 1 minute to bind DNA. |
| 4. Washing | Wash Buffers 1 and 2 | Sequential washing with 400 µL of Wash Buffer 1 and 700 µL of Wash Buffer 2, followed by centrifugation at 10,000 × g for 1 minute to remove contaminants. |
| 5. DNA Elution | DNase/RNase-Free Water, Zymo-Spin™ III-HRC Filter, HRC Prep Solution | Elution of DNA by adding 100 µL of water to the column and centrifuging. DNA was further purified using HRC Prep Solution and the final elution was conducted at 16,000 × g for 3 minutes. |
Table 6.
Resistance genes detected by BacResista GLA Kits and their associated antibacterial drugs.
| Resistance Gene | Associated Antibacterial Drugs |
| VanA/B | Vancomycin, Teicoplanin |
| MecA | Methicillin, Oxacillin |
| Tem | Penicillins and Cephalosporins |
| Ctx-M-1 | |
| shv | |
| Oxa-40-like | Carbapenems |
| Oxa-48-like | |
| Oxa-23-like | |
| Oxa-51-like | |
| imp | |
| Kpc | |
| ges | |
| Ndm | |
| Vim |
Table 7.
PCR method and reagents.
| Step | Reagent/Material | Purpose |
| 1. PCR Reaction Setup | Taq Polymerase | Enzyme responsible for synthesizing DNA strands |
| Primers | Short DNA sequences that bind to target DNA regions | |
| Nucleotide Mix | Provides the building blocks (dNTPs) for DNA synthesis | |
| PCR Buffer | Maintains the optimal pH and salt conditions for the reaction | |
| Thermal Cycling | Thermal Cycler | Machine that cycles through different temperatures (denaturation, annealing, extension) |
| 3. Amplification | Mineral Oil | Prevents evaporation during the thermal cycling process |
| 4. Controls | Positive Control | Contains known target DNA to ensure the reaction works correctly |
| Negative Control | Contains no DNA to check for contamination or false positives |
Table 8.
Detection channels of amplification products.
|
Tube no. |
DYE LABLE/DETECTION CHANNEL | COLOR OF THE BUFFER | ||||
| FAM | HEX | ROX | CY5 | CY5.5 | ||
| Bacresista GLA | ||||||
| 1 | Imp | IC** | - | - | - | Blue |
| 2 | TBL* | IC | - | Oxa-51-like | - | Colorless |
| 3 | Ctx-M-1 | - | Tem | - | ||
| 4 | Van A/B | IC | - | Mec A | - | |
| 5 | Oxa-48-like | IC | - | Oxa-40-like | - | |
| 6 | Vim | IC | - | Kpc | - | |
| 7 | Oxa-23-like | IC | - | Ndm | - | |
| 8 | shv | IC | Marker | ges | - | |
| *TBL: Total bacterial load **IC: Internal control | ||||||
Table 9.
PCR amplification program.
| Stage | Step № | Temperature, °C | Time min:sec | Number of cycles (repeats) |
| Hold Sеage | 1 | 80 | 01:00 | 1 |
| 2 | 94 | 01:30 | 1 | |
| PCR Stage | 1 | 94 | 0:20 | 50 |
| 2 | 64 | 0:25 |
Table 10.
Summary of demographic, clinical, microbial, and treatment characteristics of pneumonia patients.
Table 10.
Summary of demographic, clinical, microbial, and treatment characteristics of pneumonia patients.
| Category | Variable | Value | Details |
| Demographics | Total Patients | 114 | - |
| Median Age |
73 years | Mean: 64.114 years (±20.331) | |
| Gender Distribution | Male: 63 (55.263%) | Female: 51 (44.737%) | |
| Length of Stay (LOS) | Median LOS | 7 days | Mean: 11.272 days (±15.091) |
| ICU LOS | Median: 1 day | Mean: 4.763 days (±11.882) | |
| Hospitalization History | Median No. of Hospitalizations | 2 day | Mean: 2.772 (±3.005) |
| Median No. of Pneumonia Episodes | 0.5 day | Mean: 0.895 (±1.366) | |
| Outcomes | Mortality Rate | 27 pateint (23.684%) | Improved: 87 (76.316%) |
| CAP Prevalence | 100% | All cases were community-acquired pneumonia. | |
| Microbial Pathogenesis | Bacterial Infections | 33 (28.947%) | - |
| Bacterial-Viral Co-infections | 28 (24.561%) | - | |
| Viral Infections | 23 (20.175%) | - | |
| Polybacterial Infections | 12 (10.526%) | - | |
| Polymicrobial Viral Infections | 15 (13.158%) | - | |
| Fungal-Bacterial Co-infections | 2 (1.754%) | - | |
| Sample Types | Sputum (SPU) | 102 (89.474%) | Predominant diagnostic sample type. |
| Fluid Samples | 5 (4.386%) | - | |
| BAL | 3 (2.632%) | Bronchoalveolar lavage | |
| Endotracheal Aspirates | 3 (2.632%) | - | |
| Nasopharyngeal Swabs (NAS) | 1 (0.877%) | - | |
| Clinical Features | Shortness of Breath (SOB) | 56 (49.123%) | Most common presenting symptom |
| Cough | 15 (13.158%) | - | |
| Fever | 14 (12.281%) | - | |
| Sputum Production | 7 (6.140%) | - | |
| Pleuritic Chest Pain | 9 (8.738%) | - | |
| Hemoptysis/Rust-colored Sputum | 11 (9.649%) | - | |
| Severity Scores | CURB-65 Scores | 1: 66 (57.895%), 2: 20 (17.544%) | Score 1 reflects low risk; score 2 reflects moderate risk |
| PSI (Pneumonia Severity Index) | - | Range: 8–150 | |
| Treatment Adherence | Guideline-Concordant Antibiotics | 33 (35.106%) | - |
| Completion of Antibiotic Therapy | 72 (63.158%) | Incomplete in 42 cases (36.842%) |
Table 11.
Pneumonia Severity Index (PSI) classification, mortality rates, and guideline-concordant antibiotic therapy.
Table 11.
Pneumonia Severity Index (PSI) classification, mortality rates, and guideline-concordant antibiotic therapy.
| Category | Class I (Low Risk, PSI ≤70) | Class II (Low to Moderate Risk, PSI 71-90) | Class III (Moderate Risk, PSI 91-130) | Class IV (High Risk, PSI >130) |
| PSI Score Range | ≤70 | 71–90 | 91–130 | >130 |
| Mortality Rate | 0.1% | 0.6% | 0.9% | 9.3% |
| Number of Patients | 59.649% (n=68) | 24.561% (n=28) | 8.772% (n=10) | 7.018% (n=8) |
| Description | Low risk, typically managed with outpatient care. | Low to moderate risk, outpatient care or observation. | Moderate risk, typically requiring inpatient admission. | High risk, requires inpatient admission due to elevated mortality. |
| Guideline-Concordant Antibiotic Therapy | Use antibiotics recommended for typical pathogens and empirical therapy, adjusted once pathogen is identified. | Empiric therapy based on likely pathogens, considering local resistance. | Inpatient treatment based on the patient’s risk and local resistance patterns. | High-risk patients treated aggressively with appropriate antibiotics based on severity and resistance patterns. |
Disclaimer/Publisher’s Note: The statements, opinions and data contained in all publications are solely those of the individual author(s) and contributor(s) and not of MDPI and/or the editor(s). MDPI and/or the editor(s) disclaim responsibility for any injury to people or property resulting from any ideas, methods, instructions or products referred to in the content. |
© 2025 by the authors. Licensee MDPI, Basel, Switzerland. This article is an open access article distributed under the terms and conditions of the Creative Commons Attribution (CC BY) license (http://creativecommons.org/licenses/by/4.0/).
Copyright: This open access article is published under a Creative Commons CC BY 4.0 license, which permit the free download, distribution, and reuse, provided that the author and preprint are cited in any reuse.


