
Submitted:
11 June 2025
Posted:
12 June 2025
You are already at the latest version
Abstract
The Philippines currently has seven dam-type man-made reservoirs in Luzon which are being utilized for hydroelectricity generation. The surface area of these artificial reservoirs can be used for floating photovoltaic (FPV) deployment, which is currently providing opportunities for solar PV capacity expansion in other countries. This study assessed the resource potential of FPV system on artificial reservoirs in Luzon by using a reservoir-specific methodology depending on data availability and provided estimates of potential and LCOE of FPV systems on these reservoirs. The resource potential is bounded by site constraint such as the underwater terrain and water level variation of the water body and technical limitations such as minimum distance from shore and anchor placement. FPV potential ranging from 50 MW to 230 MW are estimated for reservoirs with bathymetry data while 600 MW to 2500 MW are estimated for reservoirs with lacking bathymetry. These figures represent a reservoir area coverage of approximately 7% to 65%. An economic analysis based on the estimated resource potential of the FPV systems on each reservoir shows that the systems sited in Luzon have a range of LCOEs from USD 0.079/kWh to USD 0.094/kWh which is at least 20% higher compared to ground-mounted PVs due to additional cost of floating structure and higher mismatch and soiling losses. The result of this study can be utilized by policymakers to develop guidelines and policies specific to FPV deployment in the country and can also serve as a reference for the resource potential of FPV for energy developers and investors.
Keywords:
floating solar
; FPV resource assessment
; artificial reservoir
; QGIS
; georeferencing
; bathymetry
1. Introduction
Solar photovoltaic (PV) energy is predicted to contribute around 33 GW of the Philippines' total 53 GW renewable energy capacity by 2040 [1]. However, one of the drawbacks of using a traditional solar PV system, especially on a big scale, is that it requires land or open space for solar module mounting. A ground-mounted PV system with a capacity of 1 MW requires 11,500 square meters of land [2].
One of the solutions to the problem of the significant land use of ground-mounted solar PVs is to use floating photovoltaics. Floating photovoltaics is considered as one of the viable options for expanding the solar energy sector and is currently labeled as the third pillar of solar energy sector [3]. The FPV system is a type of solar farm built on the water's surface, such as hydropower reservoirs, lakes, and ponds [4]. The FPV installations provide new possibilities for increasing solar energy capacity.
Artificial hydropower reservoirs in the Philippines are already managed, and existing infrastructure and roads are present. FPV resource assessment in these waterbodies will support further deployment of this renewable energy system in the country. Several FPV resource assessment studies have been published evaluating the potential of floating solar globally, countrywide and regional level [5,6,7].
A data-gap analysis for FPV resource assessment identified the need to use the bathymetry and water level data for accurate assessment of global FPV potential [7]. However, due to unavailability of high-resolution bathymetry data of the waterbodies to be investigated, the geographical extent of Global Reservoir and Dam (GRanD) database shapefiles are used in resource assessment. Additionally, National Hydrography Dataset (NHD) can be used to identify artificial waterbodies in USA that is suitable for FPV deployment [5,6].
The objectives of the study are to (a) gather available data of hydropower reservoirs in Luzon that can be used for FPV resource assessment, (b) process the data in QGIS to build an illustration and an estimate of the resource potential of FPV in Luzon, (c) evaluate the effects in the FPV potential of the non-availability of bathymetry and water level data, and (d) determine the indicative annual energy yield and levelized cost of electricity (LCOE) of proposed FPV system capacities in each reservoir.
2. Materials and Methods
2.1. Bathymetry, Water Level Data and Boundary Data
The artificial reservoirs' bathymetry data and water level variation data are gathered from the hydropower plant operator/owner or the reservoir management authority as listed in Table 1. These organizations regularly perform bathymetric surveys and release the daily elevation status in meters above sea level (masl) of the water on these reservoirs. Bathymetry data that are provided by Independent Power Producers (IPP) and National Power Corporation (NPC) can be of different types. Raw survey point can be given with corresponding contour lines and processed bathymetry data such as color map and contour map can also be provided. In this study, bathymetry survey point data is referred to as Type 1 bathymetry data, and bathymetry contour map is referred to as Type 2 bathymetry data. Depending on the given data, different methods are introduced in this study to digitize the available bathymetry data.
Global Reservoir and Dam Database (GRanD) maps 7,320 dams [8]. The database includes reservoir data such as location, area covered, capacity and information on the associated hydropower plants. We extracted only the area and extent of these datasets in shapefile format for the seven reservoir of study. We use the boundary data from GRanD in resource assessment if bathymetry and water elevation data are not available.
2.2. Data Processing and GIS Modelling
QGIS is a geographic information system application that supports viewing, editing, printing, and analyzing geospatial data. It has a georeferencing tool (Georeferencer GDAL) used to plot the bathymetry map in OpenStreetMap (OSM) in QGIS. Georeferencing is performed for both types of bathymetry data gathered in this study to translate the location of each reservoir into the QGIS map.
Figure 1.
Processing of Reservoir Data in QGIS.
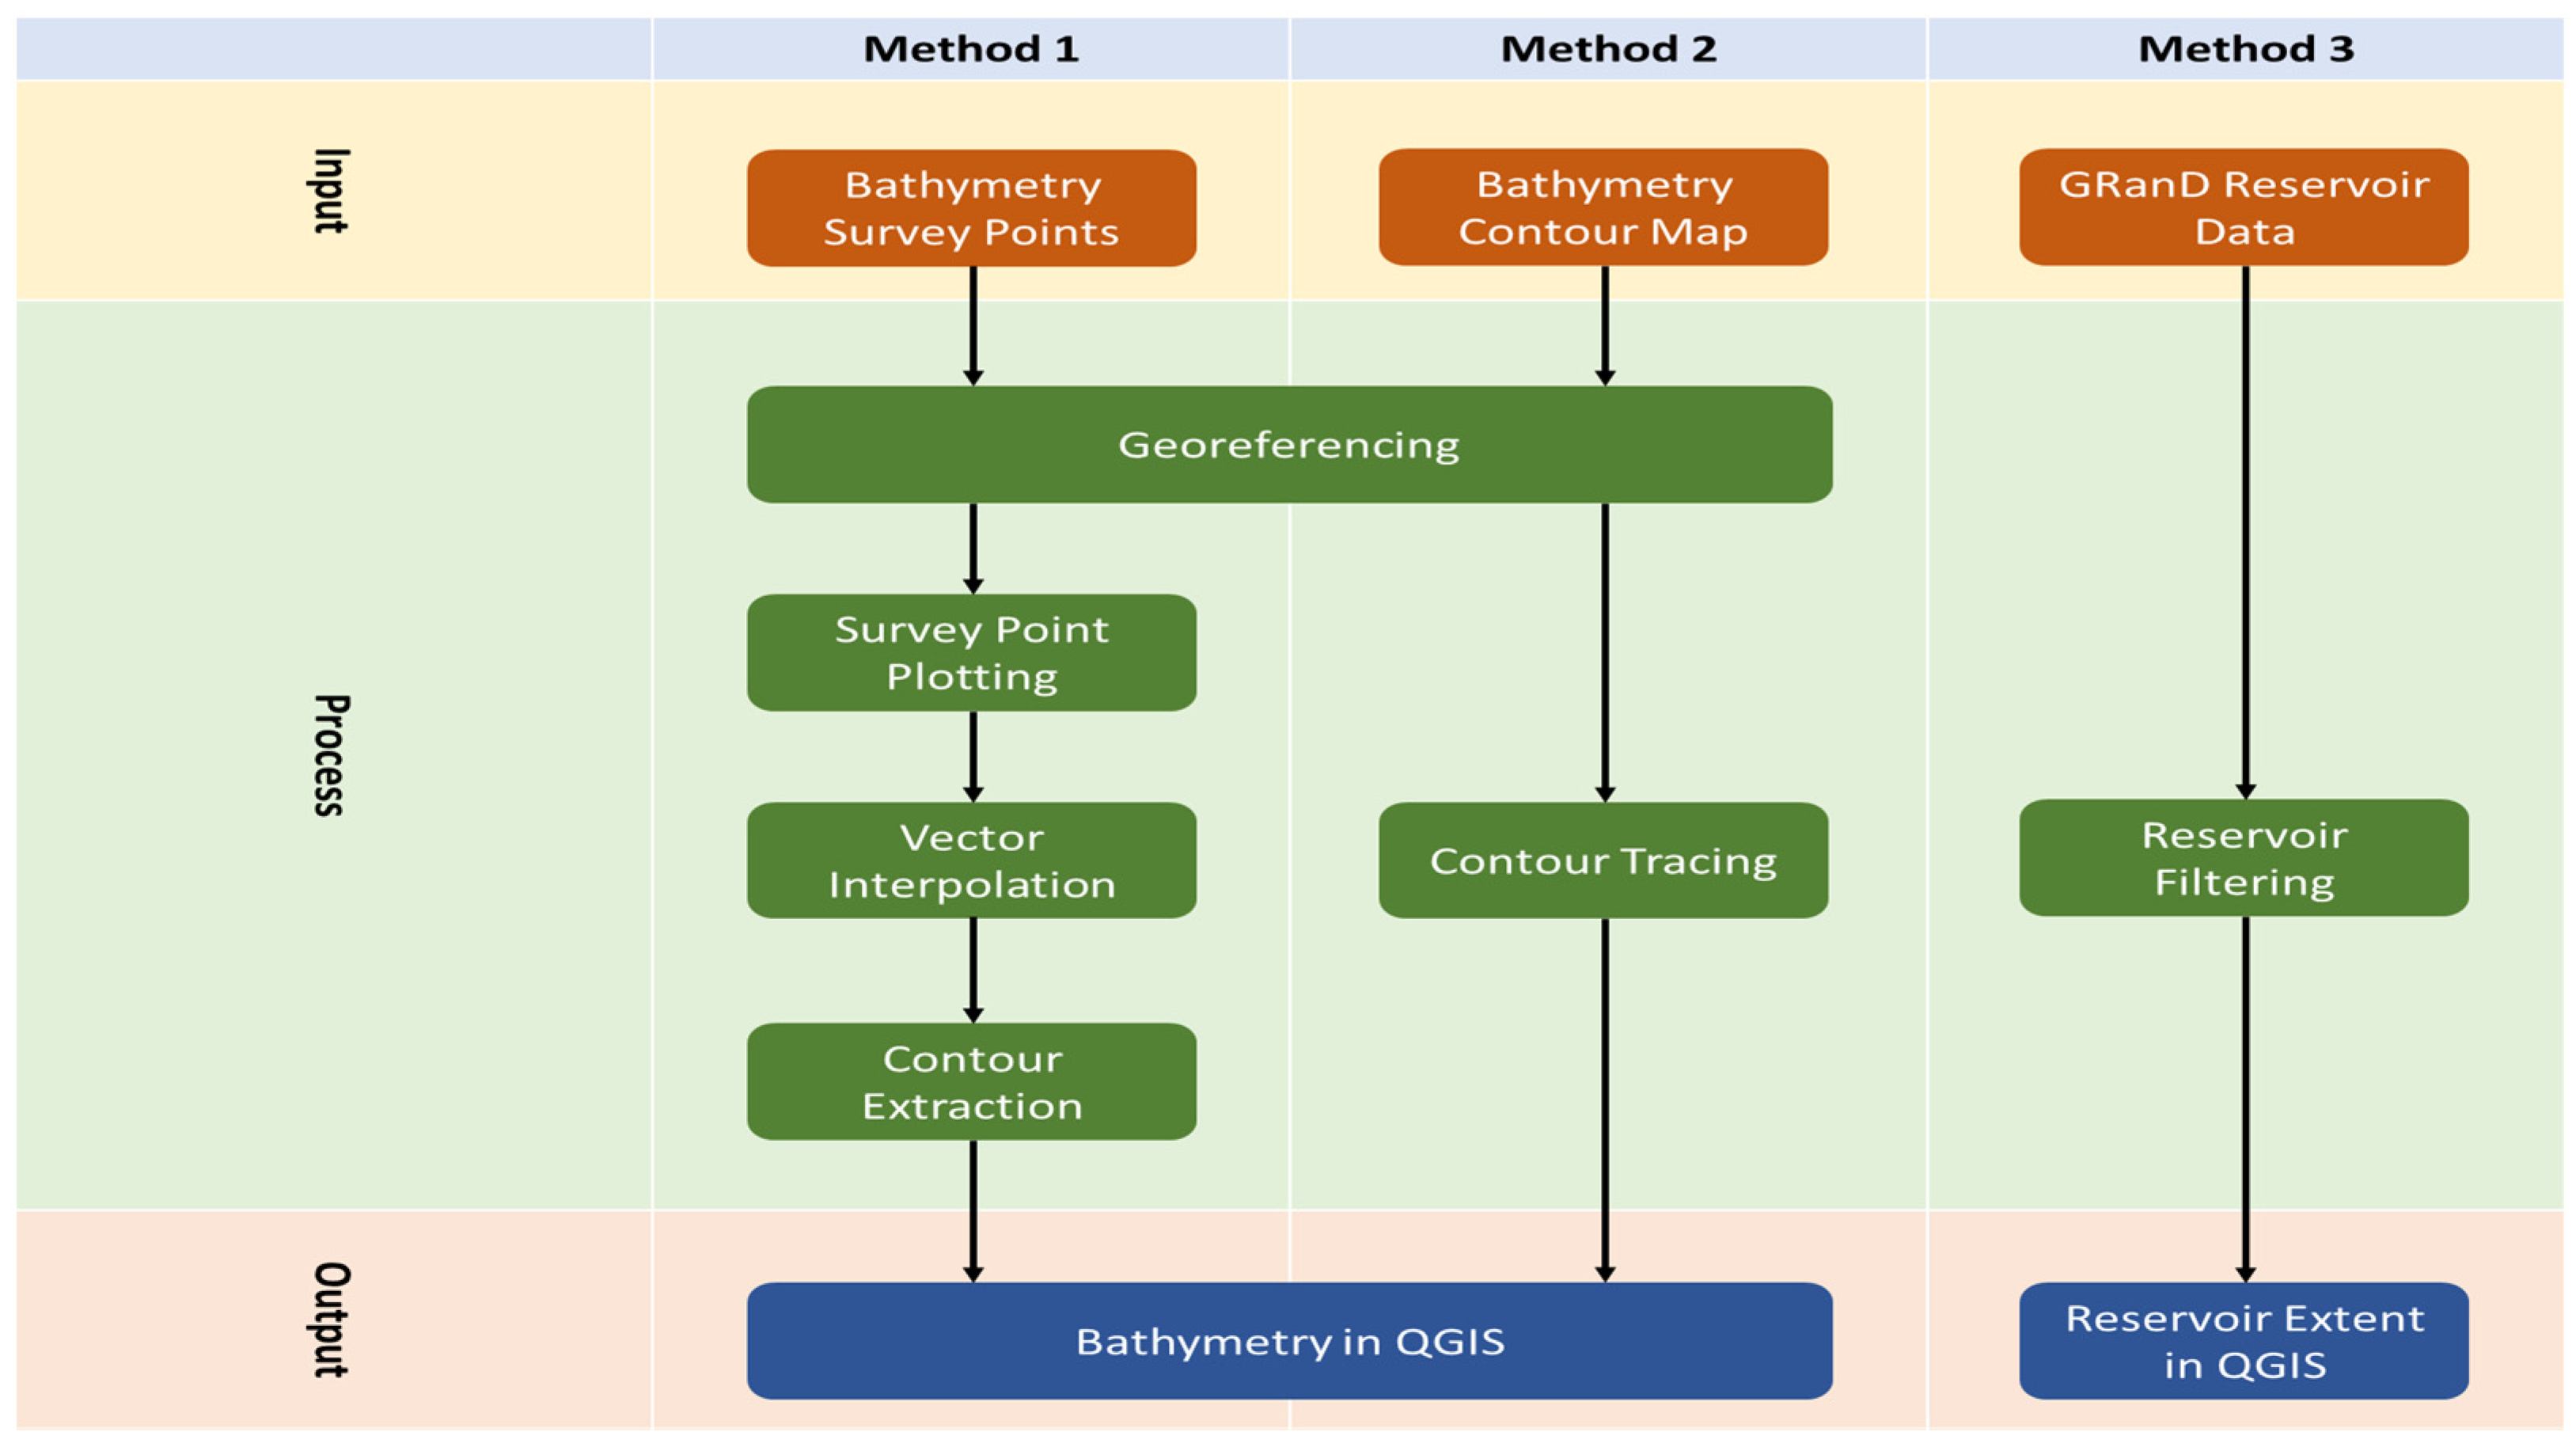
We digitized the Type 1 bathymetry data to QGIS data by tracing the boundary of reservoir and plotting the points in the QGIS map using the georeferenced bathymetry map as a canvas. We translated the survey points to QGIS by introducing a new shapefile layer having a point geometry type. The new survey point shapefile has an attribute that describes the elevation in masl. We used a geospatial interpolation method called Inverse Distance Weighing (IDW) to estimate the unknown elevation in the map with the given known survey points. The method estimates the unknown point values by calculating the weights of the available survey data points based on their distance and multiplying it by their known elevation values. In QGIS, the output of IDW Interpolation is a color band raster which describes the masl values of an area in the reservoir. We extracted the contour lines from the interpolation raster resulting from the IDW interpolation. We set the contour line interval to 1 m. Contours are used for FPV area tracing rather than color band raster due to discrete contours line values for better plotting boundary lines of feasible FPV areas.
Bathymetry data are sometimes given as processed color map or contour map without survey points (Type 2). We digitized these data in QGIS by tracing the reservoir boundary and the needed water level masl. Tracing is performed by creating another shapefile layer with line geometry type.
We use the boundary data of reservoirs in the GRanD database when bathymetry data is unavailable. We filtered the reservoir list to extract the data of artificial reservoirs in Luzon using the attribute table tool of QGIS. The shapefile has corresponding polygon geometry data of the reservoirs which is used for FPV resource assessment in this study when bathymetry and water level data are unavailable.
2.3. FPV Resource Assessment
Site constraints for FPV emerged from the natural limitations due to changing water elevation and underwater terrain of the reservoirs. The minimum water level of the reservoir limits the area that is allowable for FPV installation. We traced the minimum water level by determining and emphasizing the contour line having the same masl value from the QGIS-generated bathymetry contour map of the reservoir. In case of Type 2 bathymetry data, minimum water level is already traced when digitizing the data. The area enclosed by this line represents the surface area of water when the reservoir has a minimum water capacity, indicating the maximum area where FPV systems can be installed.
We also consider in this study the assumed recreational areas that may be present in the reservoir. We limit the FPV installation to at least 200 m from the shore using QGIS offset tool to exclude areas used for recreational and commercial purposes. The 200-m distance is in line with the minimum distance of FPV modules set by Laguna Lake Development Authority in allocating FPV areas in Laguna Lake for RE developers [9].
We also introduced a visual inspection matrix that excluded FPV areas that are too small, located on the inflow or outflow, or have large islets within that can disrupt the engineering design and installation of the technology. The visual inspection criteria are listed in Table 2, and we determined that all of the criteria must be met for the initial FPV area to be included and considered as more suitable for FPV installation.
The anchor location and its mooring line also limit the areas for installation of FPV. In this study, we set a lower bound of 6 m water depth from the adjusted minimum water level for anchor placement based on the current industry practice of InventOceant Technologies and LS Electric [10,11]. The process flowchart of integrating site and technical constraints in FPV resource assessment is shown in Figure 2.
The field calculator tool in QGIS is used to calculate the area of the area blocks in a square kilometer. The tool utilized the geometrical extent of the areas and yield a value based on the set coordinate system of the project. The estimated reservoir area is used to calculate Luzon's FPV technical potential in MW. Technical potential capacity is the product of power density in MW per square km and suitable reservoir area for FPV given by Equation 1 [7]. The power density for FPV is set to 100 MW/km and calculated based on the characterization of area-to-capacity ratios of 51 FPV projects globally [5].
2.4. LCOE Analysis
The economic parameter called Levelized Cost of Electricity (LCOE) is determined for both FPV and ground-mounted PV system near the reservoir site. LCOE is used to compare the cost of energy output of energy conversion systems. The FPV system used in the analysis consists of floating structures, anchor and mooring systems, PV modules and other electrical and structural balance systems. On the other hand, the reference ground-mounted PV system consists of a racking structure, PV modules and other electrical and structural balance of system.
Capital cost per MW varies with increasing installed capacity. A 50-MW and 5-MW ground-mounted solar PV system require USD 0.67 and USD 0.73 per watt of investment. For FPV system, a 50-MW and 5-MW system cost USD 0.77 and USD 0.97 per watt. The estimates exclude developer and EPC overhead costs. Linear trend of capital cost for utility scale ground-mounted PV and FPV versus installed capacity can be deduced [12,13,14]. We used interpolation method to determine the corresponding capital cost per MW of this technology for the calculated potential of FPV in each reservoir.
Other cost assumptions such as O&M cost and replacement cost for inverter are listed in Table 3. With assumed 20-year operating lifetime of a PV or FPV system based on the conservative assumption that structural BOS has a lifespan of at most 20 years, we considered the replacement cost of inverters at least once during the plant’s operation.
We used Global Solar Atlas (GSA) to determine the corresponding energy output of ground-mounted PV and FPV systems with the given capacity. It is an online tool that provides an overview of solar energy potential for a site or region. It is the only PV potential simulation tool with the option for floating solar technology's energy yield. In this study, we used Equation 2 to simplify energy calculation through PV simulation software. Initial energy yield is calculated with the given formula [7,17,18]:
where PV output in GWh/MW per year is determined using GSA providing information on photovoltaic potential.
A lot of factors influence the Levelized Cost of Electricity (LCOE) of a photovoltaic system. In this study, we use a simplified LCOE analysis using the following formula [12,19]
where TLCC is the total life cycle cost of the system and TE is the total energy produced by the energy system in its operating lifetime. TLCC is composed of the investment cost I, replacement cost of inverter R and operation and maintenance cost OM. En is the energy produced in year n accumulated to the present year to calculate TE. DR is the system degradation rate which accounts for the annual loss of energy output throughout the operation of PV system. Discount rate d used in this analysis is based on the Weighted Average Cost of Capital (WACC) for a typical energy and utility project in the Philippines. Inflation rate i is the calculated average inflation from 2010 to 2020 to cover the pre-pandemic period. Table 4 summarizes the assumptions used in the calculation of LCOE. The LCOE formula is a before tax estimation and assumes that the developer fully funds capital costs.
3. Results and Discussion
3.1. FPV Resource Potential Using Method 1 (Caliraya)
The provided bathymetry data for Caliraya Reservoir is digitized using QGIS. The adjusted minimum water level, approximately 284 masl, is determined by subtracting the standard deviation from the minimum water level to anticipate the changing behavior of the water in the future. In this study, the anchors are set to be placed 6 m deeper from the adjusted minimum water level as mentioned in the methodology. The visual inspection criteria reduced the number of 6-m enclosed areas to more suitable FPV areas. Lastly, applying the same 200-m from shore limitation set by the LLDA for Laguna de Bay, the resulting final FPV area is shown in Figure 3.
Shown in Figure 5 is the allowable area for FPV highlighted in green which represents 7.96% of the entire water surface area or 0.589 km2 as calculated by Field Calculator Tool. The power density or area factor, y of FPV farm is 100 MW/km2. Therefore, the estimated resource potential of FPV in Caliraya reservoir using Equation 1 is 58.9 MW.
3.2. FPV Resource Potential Using Method 2 (Ambuklao, Binga and Angat)
Similar to the procedure performed in assessing the resource potential of Caliraya reservoir, from the given daily water level data of Ambuklao reservoir, the adjusted minimum water level is approximately 736 masl. Using the 6-m minimum water depth, the corresponding masl in the bathymetry map is 730 masl (referenced to adjusted minimum water level). The 730 masl for anchor placement is traced in the provided bathymetry map using QGIS. Visual inspection criteria and the 200-m distance is integrated. Figure 4 illustrates the allowable FPV areas coinciding with the anchor locations. The allowable area for FPV installation highlighted in green represents 18.96% of the entire water surface area or 0.95 km2 as calculated by Field Calculator Tool. The estimated resource potential of FPV in Ambuklao reservoir is then 95 MW.
3.3. FPV Resource Potential Using Method 3 (Magat, Pantabangan and San Roque)
The site constraint of 200-m distance from shore and the visual inspection matrix are exclusively applied to Magat reservoir due to unavailability of bathymetry and daily water level data. The 200-m limitation is deducted from the reservoir extent data from GRanD as shown in Figure 7. The final FPV-feasible area accounts for 42.55% of the entire reservoir or 12.864 km2 as calculated by Field Calculator tool. Without considering the varying water elevation, the estimated resource potential of FPV in Magat reservoir is 1286.4 MW.
Figure 8 and Figure 9 illustrate the allowable FPV areas of Pantabangan and San Roque reservoirs using Method 3 as detailed in this section. From the result of the assessment, the estimated FPV coverage area for Pantabangan is 65.38% or 2478.6 MW of FPV capacity while for San Roque is 44.15% or 609.3 MW of FPV capacity.
3.4. Summary of FPV Resource Assessment
The summary of FPV resource potential assessment of the seven artificial reservoirs in Luzon is given in Table 5. The table shows that with the given bathymetry data, the area covered by reservoirs for FPV installation is limited to less than 20%. Contrarily, FPV resource potential of Magat, Pantabangan and San Roque are significant due to lacking bathymetry and water level data. Figure 10 shows the distribution of area coverage of 51 FPV projects of C&T relative to seven FPV projects in this study. The graph includes the indicative area coverage of Luzon FPVs. The 51 international FPV projects deployed by C&T have less than 74% reservoir area coverage. All of the seven FPV projects in this study has area coverage that are within the area coverage of 51 operational FPV projects of Cile et Terre (0.01% - 74%).
To give an estimate of how much the FPV potential of Caliraya, Ambuklao, Binga and Angat will change when bathymetry and water level data of these reservoirs are unavailable, we applied the method 3 for the mentioned reservoir. Resource potential using method 3 for Caliraya, Ambuklao, Binga and Angat are summarized in Table 6. FPV resource potential using only the 200-m shore limitation and visual inspection would increase estimates to at least 40% of the potential when bathymetry and water level data were used in FPV resource estimation.
3.5. Energy Yield and Levelized Cost of Electricity
The indicative initial energy yield of FPV systems on the seven reservoirs of study are summarized in Table 7 resulted using Global Solar Atlas parameters. The corresponding initial energy yield of ground-mounted PV using irradiance data of the seven reservoir sites are indicated also in the table.
According to Global Solar Atlas settings and parameters, FPV systems generate lower energy yield relative to ground-mounted PV due to increased bird droppings and higher mismatch losses between modules in a string experiencing different operating conditions and generating different electrical output.
the text following an equation need not be a new paragraph. Please punctuate equations as regular text.
The LCOE of both energy technologies for the reservoir sites and coincident with estimated FPV capacities in Table 5 are summarized in Table 8. The LCOE of floating PV system is generally higher compared to the LCOE of ground-mounted PV system for the seven reservoir sites of study. The difference which is around 20% is due to higher mismatch and soiling losses and lower plant availability of FPV systems due to harsher environment that reduces its additional energy yield from the water-cooling effect as indicated in GSA parameters. Additional investments on floating structures, mooring and anchoring also caused higher FPV LCOE.
3.6. Sensitivity Analysis
Sensitivity analysis is performed in this study to assess the effects of varying the technical and site assumptions of FPV system in the FPV technical potential of reservoirs. Figure 11 and Figure 12 show sensitivity analysis of each of the seven FPV systems with capacities that vary depending on minimum anchor depth and minimum distance of FPV from shore.
The anchor depths ranging from 4 to 8 m affect the FPV capacities of Angat, Binga, and Ambuklao minimally with a maximum of +15.75% as shown in Figure 11. Contrarily, the effect of changing the distance from shore is significant to the FPV potential of the three mentioned reservoirs with a minimum of +277% change for the three reservoirs. Changing site constraints such as limitations on distance of FPV from shore due to assumed recreational areas greatly impacts the FPV potential of Magat, Pantabangan and San Roque. Huge increase in FPV potential can be noticed for the three reservoirs when shore distance is changed from 300 to 100 m. FPV potentials changed drastically by about 42%, 43% and 70% for Magat, Pantabangan and San Roque, respectively.
4. Conclusions
Seven large hydropower reservoirs in the Philippines particularly in Luzon are chosen for FPV potential assessment. Reservoir data needed for resource assessment such as bathymetry data, boundary data and water level data are gathered. FPV potential of these reservoirs are calculated and illustrated.
The use of available bathymetry and water level data provides a better estimate of FPV area and capacity potential on the reservoirs. Method 1 (for Caliraya) used raw bathymetry points to digitize the contour map of reservoir while Method 2 (for Ambuklao, Binga and Angat) utilized the available bathymetry contour map to digitize and trace the minimum water level in the reservoir. Both of the methods can determine the minimum water level of reservoir from the digitized contour map. Estimated FPV area coverage using Method 1 for Caliraya is 7.96% or 58.9 MW of FPV potential. Estimated FPV area coverage using Method 2 for Ambuklao, Binga and Angat ranges from 8% to 19% or approximately 14 MW to 222 MW. Method 3 (for Magat, Pantabangan and San Roque) is used when bathymetry and water level data is not available. Method 3 is useful when determining a rough estimate of FPV potential in a reservoir. Rough estimates of FPV area coverage using Method 3 for Magat, Pantabangan and San Roque ranges from 42% to 65% or approximately 609 MW to 2480 MW.
One-variable sensitivity analysis of FPV capacity shows that FPV distance from shore has greater impact with a minimum of +277% change on the capacity estimates compared to water depth for anchor placement with a maximum change of +207%. Additionally, initial energy yields of FPV system on the reservoirs are less compared to those of ground-mounted PV by 7 to 11% due to higher soiling and mismatch losses. Lastly, using the cost benchmark of NREL and energy yield simulated from Global Solar Atlas, the computed LCOE of FPV systems with bathymetry data ranges from 0.081 to 0.094 USD/kWh while those with lacking bathymetry ranges from 0.079 to 0.084 USD/kWh which are at least 20% higher compared to the computed LCOE of ground-mounted PV system in the same location.
A resource potential assessment for FPV in the future should also consider limitations on electrical and structural balance of systems such as cable routing and float loading. The space between anchor and FPV modules and between FPV blocks should also be considered in future resource assessment study. Future assessment should include simulation of varying offset distance of FPV from the anchors using a more sophisticated geographical assessment tool. Additionally, future economic assessment of FPV may include other non-renewable and renewable energy technologies to provide a broader comparison of its economic benefit.
Author Contributions
Alvin C. Adorna: Conceptualization, Methodology, Data gathering, Analysis, Writing - original draft, Writing - editing, Visualization. Adonis Emmanuel D.C. Tio: Conceptualization, Validation, Methodology, Supervision, Writing - review. Maria Rosario Concepcion O. Ang: Validation, Conceptualization, Methodology, Supervision. Luigi S. Teola: Conceptualization, Methodology, Writing – review, Supervision.
Data Availability Statement
The original contributions presented in this study are included in the article. Further inquiries can be directed to the corresponding author.
Acknowledgments
The authors would like to express their appreciation to the Engineering Research and Development for Technology (ERDT) of the Department of Science and Technology, Philippines for providing funds for this study.
Conflicts of Interest
The authors declare that they have no known competing financial interests or personal relationships that could have appeared to influence the work reported in this paper.
References
- Department of Energy. Philippine Energy Plan (PEP) 2020-2040. 2020. Accessed at https://www.doe.gov.ph/pep/philippine-energy-plan-2020-2040-1.
- Lawrence Berkely Natural Laboratory. Land Requirements for Utility-Scale PV: An Empirical Update on Power and Energy Density. 2022. Retrieved from https://eta-publications.lbl.gov/sites/default/files/land_requirements_for_utility scale_pv.pdf.
- The Energy and Research Institute. Floating Solar Photovoltaic (FSPV): A Third Pillar to Solar PV Sector? 2019. Accessed at https://www.teriin.org/sites/default/files/2020-01/floating-solar-PV-report.pdf.
- Solomin, E., Sirotkin, E., Cuce, E., Selvanathan, S., & Kumarasamy, S. Hybrid Floating Solar Plant Designs: A Review. 2021. [CrossRef]
- Spencer, R., Macknick, J., Aznar, A., Warren, A., & Reese, M. Floating PV: Assessing the Technical Potential of Photovoltaic Systems on Man-Made Water Bodies in the Continental US. 2018. Accessed at http://pubs.acs.org.
- Lewis, T., Liber, W., Bartle, C., Spencer, R., Macknick, J., & Cagle, A. Statewide Potential Study for the Implementation of Floating Solar Photovoltaic Arrays. Colorado Energy Office. 2018.
- Lee, N., Grunwald, U., Rosenlieb, E., Mirletz, H., Aznar, A., Spencer, R., & Cox, S. Hybrid floating solar photovoltaics-hydropower systems: Benefits and global assessment of technical potential. 2020. [CrossRef]
- Global Dam Watch. "Global Reservoir and Dam Database". 2022. Accessed at http://globaldamwatch.org/data/.
- Power Philippines. “2K hectares of Laguna de Bay allotted for floating solar projects”. 2022. Accessed at https://powerphilippines.com/2k-hectares-of-laguna-de-bay- allotted-for-floating-solar-projects/.
- Kanotra, R. and Shankar, R. Floating Solar Photovoltaic Mooring System Design and Analysis. OCEANS 2022 - Chennai | 978-1-6654-1821-8/22/$31.00 ©2022 IEEE. [CrossRef]
- LS Electric. Floating Photovoltaic System: System Design. 2016. Retrieved from www.lsis.com.
- Feldman, D., Ramasamy, V., Jal Desai, and Robert Margolis. U.S. Solar Photovoltaic System and Energy Storage Cost Benchmarks: Q1 2021. Golden, CO: National Renewable Energy Laboratory. NREL/TP-7A40-80694.
- World Bank Group. Where Sun Meets Water: Floating Solar Handbook for Practitioners. 2019. www.worldbankgroup.com.
- Ramasamy, Vignesh and Robert Margolis. Floating Photovoltaic System Cost Benchmark: Q1 2021 Installations on Artificial Water Bodies. Golden, CO: National Renewable Energy Laboratory. 2021. NREL/TP-7A40-80695. https://www.nrel.gov/docs/fy22osti/80695.pdf.
- Walker, A., Eric Lockhart, Jal Desai, Kristen Ardani, Geoff Klise, Olga Lavrova, Tom Tansy, Jessie Deot, Bob Fox, and Anil Pochiraju. Model of Operation and Maintenance Costs for Photovoltaic Systems. Golden, CO: National Renewable Energy Laboratory. 2020. NREL/TP-5C00-74840. https://www.nrel.gov/docs/fy20osti/74840.pdf.
- US DOE. End-of-Life Management for Solar PV. 2023. Available at energy.gov/eere.
- Sanchez, R., Kougias, I., and Girona, M. Assessment of floating solar photovoltaics potential in existing hydropower reservoirs in Africa. 2021. [CrossRef]
- Kim, S., Oh, M. and Park, H. Analysis and Prioritization of the Floating Photovoltaic System Potential for Reservoirs in Korea. 2019. [CrossRef]
- National Renewable Energy Laboratory. Floating Photovoltaic System Cost Benchmark: Q1 2021 Installations on Artificial Water Bodies. Golden, CO: NREL/TP-7A40-80695. https://www.nrel.gov/docs/fy22osti/80695.pdf.
- Ye, J. Y., T. Reindl, A. G. Aberle, and T. M. Walsh. Performance Degradation of Various PV Module Technologies in Tropical Singapore. IEEE Journal of Photovoltaics 2014 (5): 1288–94.
- Ocon, J. Energy Transition from Diesel-based to Solar Photovoltaics-Battery-Diesel Hybrid System-based Island Grids in the Philippines – Techno-Economic Potential and Policy Implication on Missionary Electrification. Journal of Sustainable Development of Energy, Water and Environment Systems. 2019.
- Ciel et Terre. Hydrelio Floating PV Project Reference List 2020. Accessed at img1.wsimg.com/blobby/go/.
- Lazard. Solar PV LCOE. 2021. Accessed at https://www.pv-magazine.com/2021/11/05/utility-scale-solar-reaches-lcoe-of-0-028-0-041-kwh-in-the-us-lazard-finds/.
Figure 2.
Integration of Site and Technical Constraints in FPV Resource Assessment.
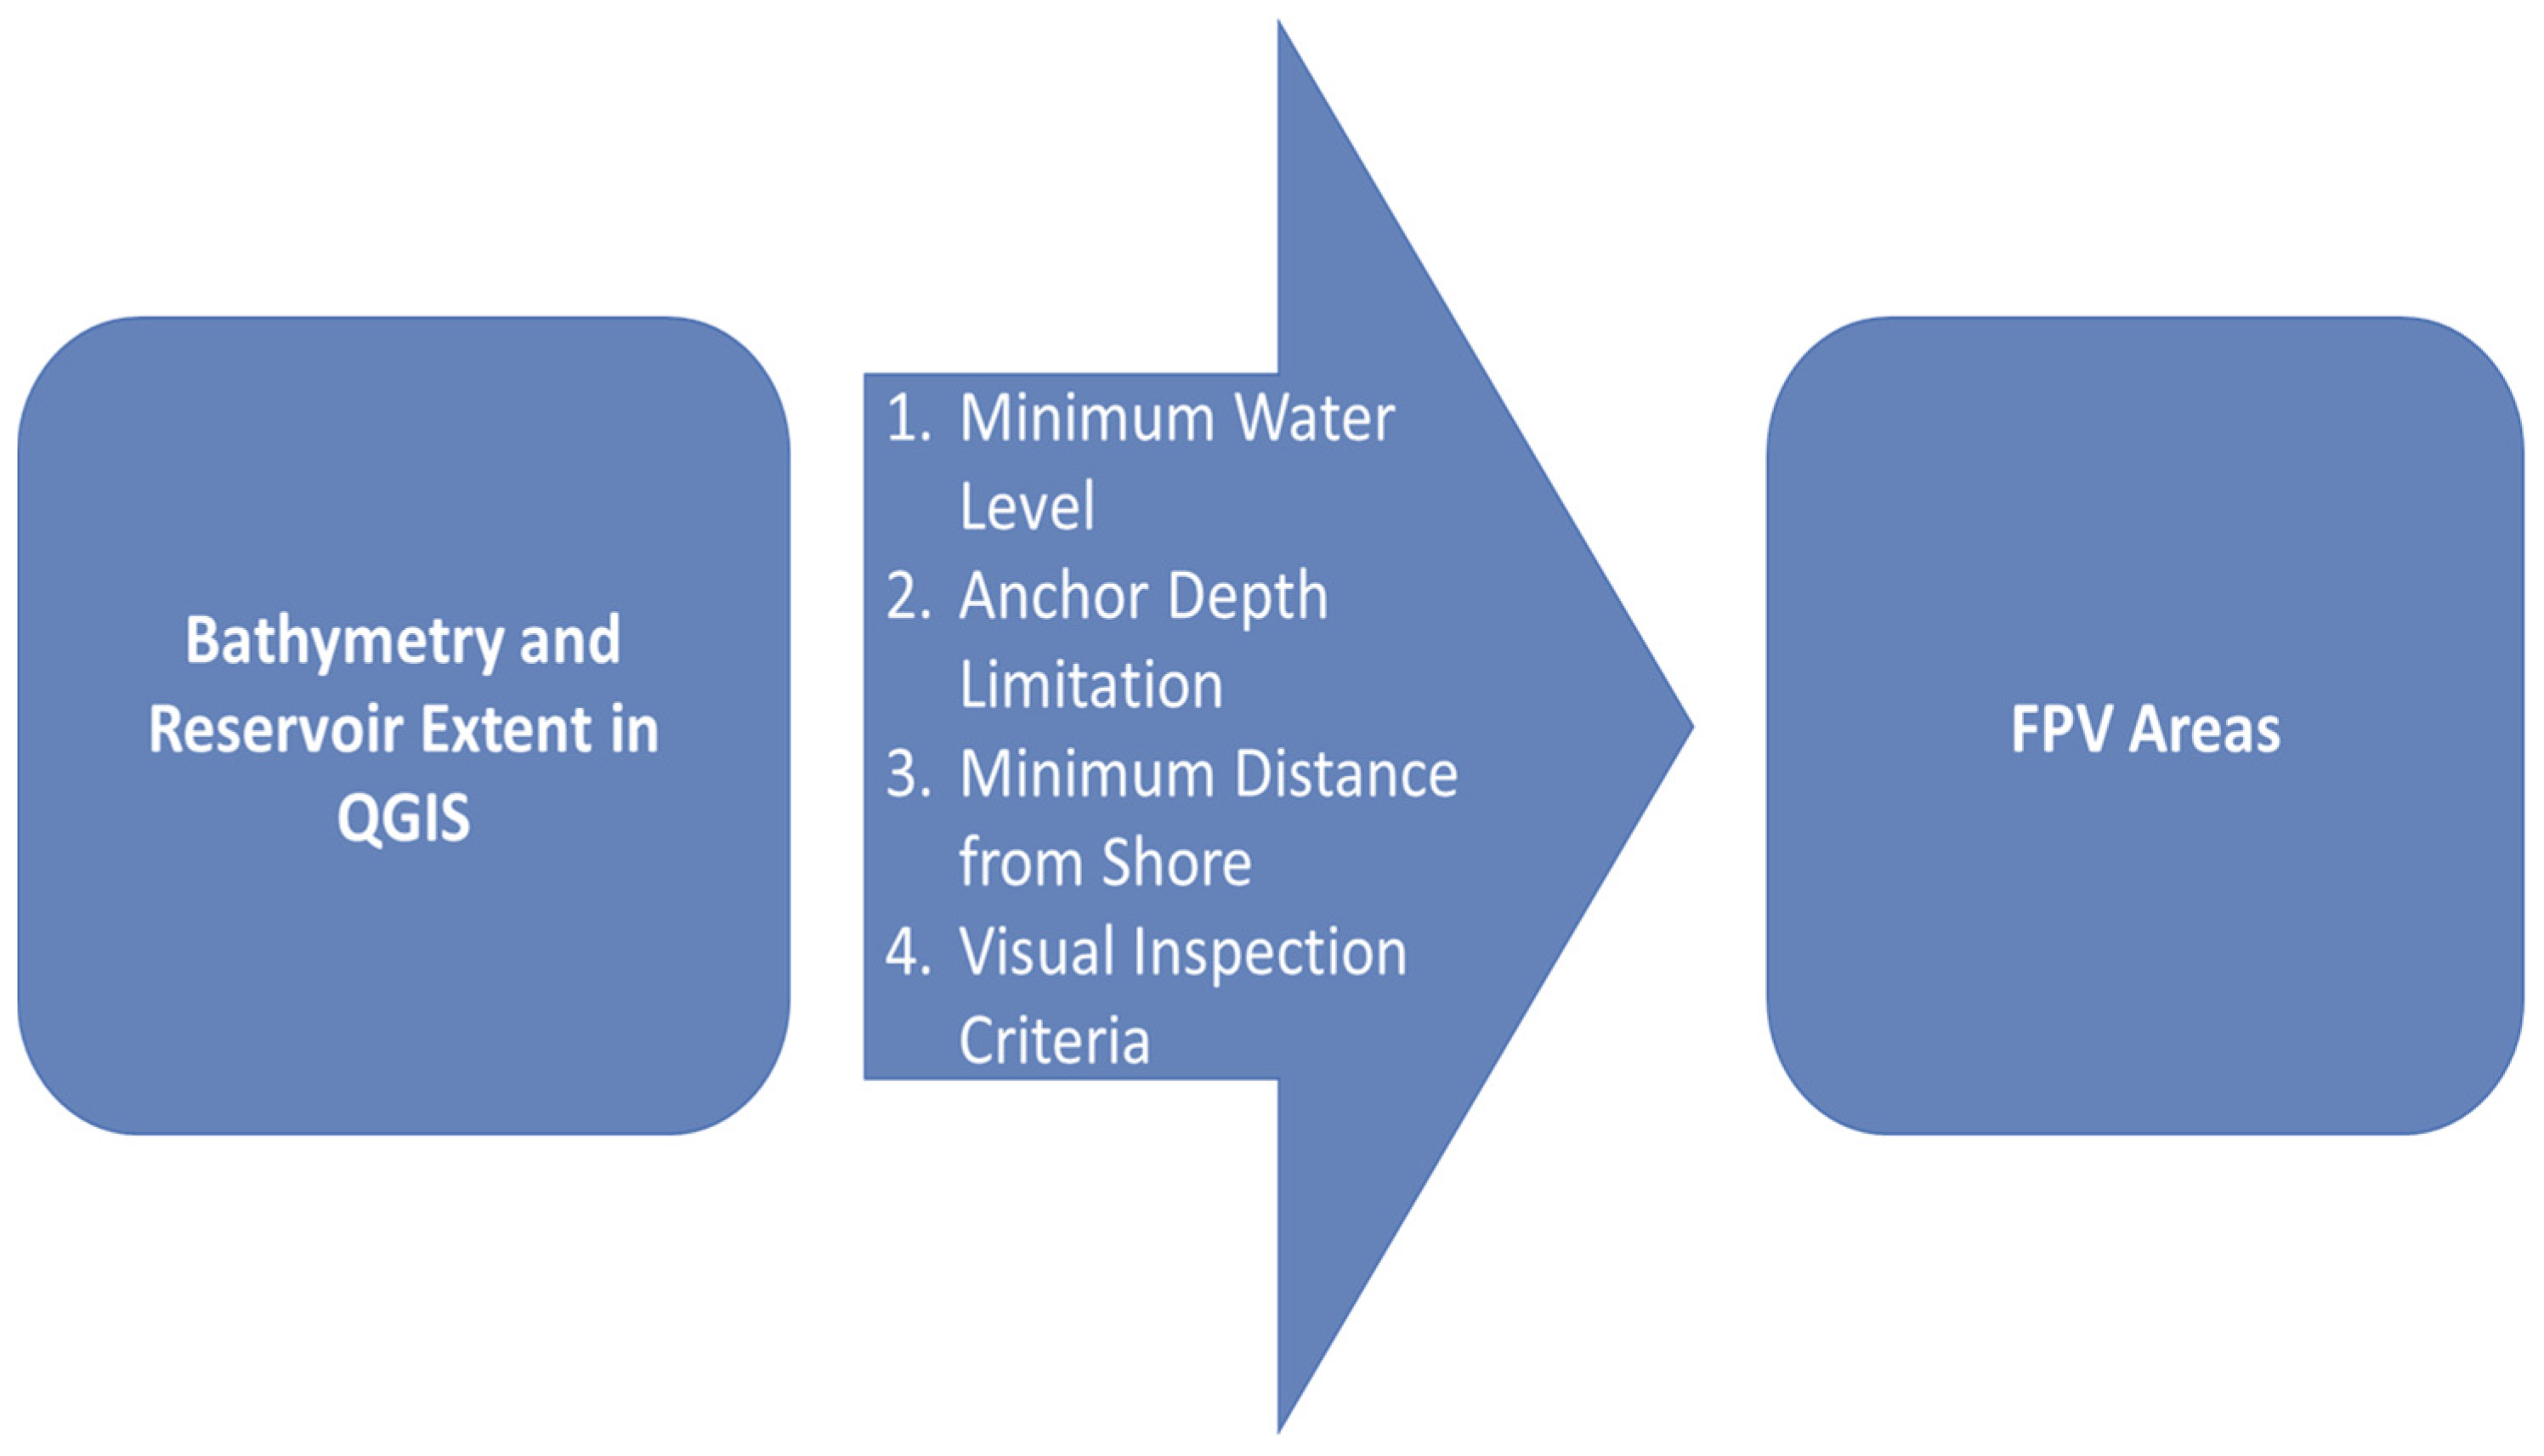
Figure 3.
The allowable FPV area for Caliraya reservoir.
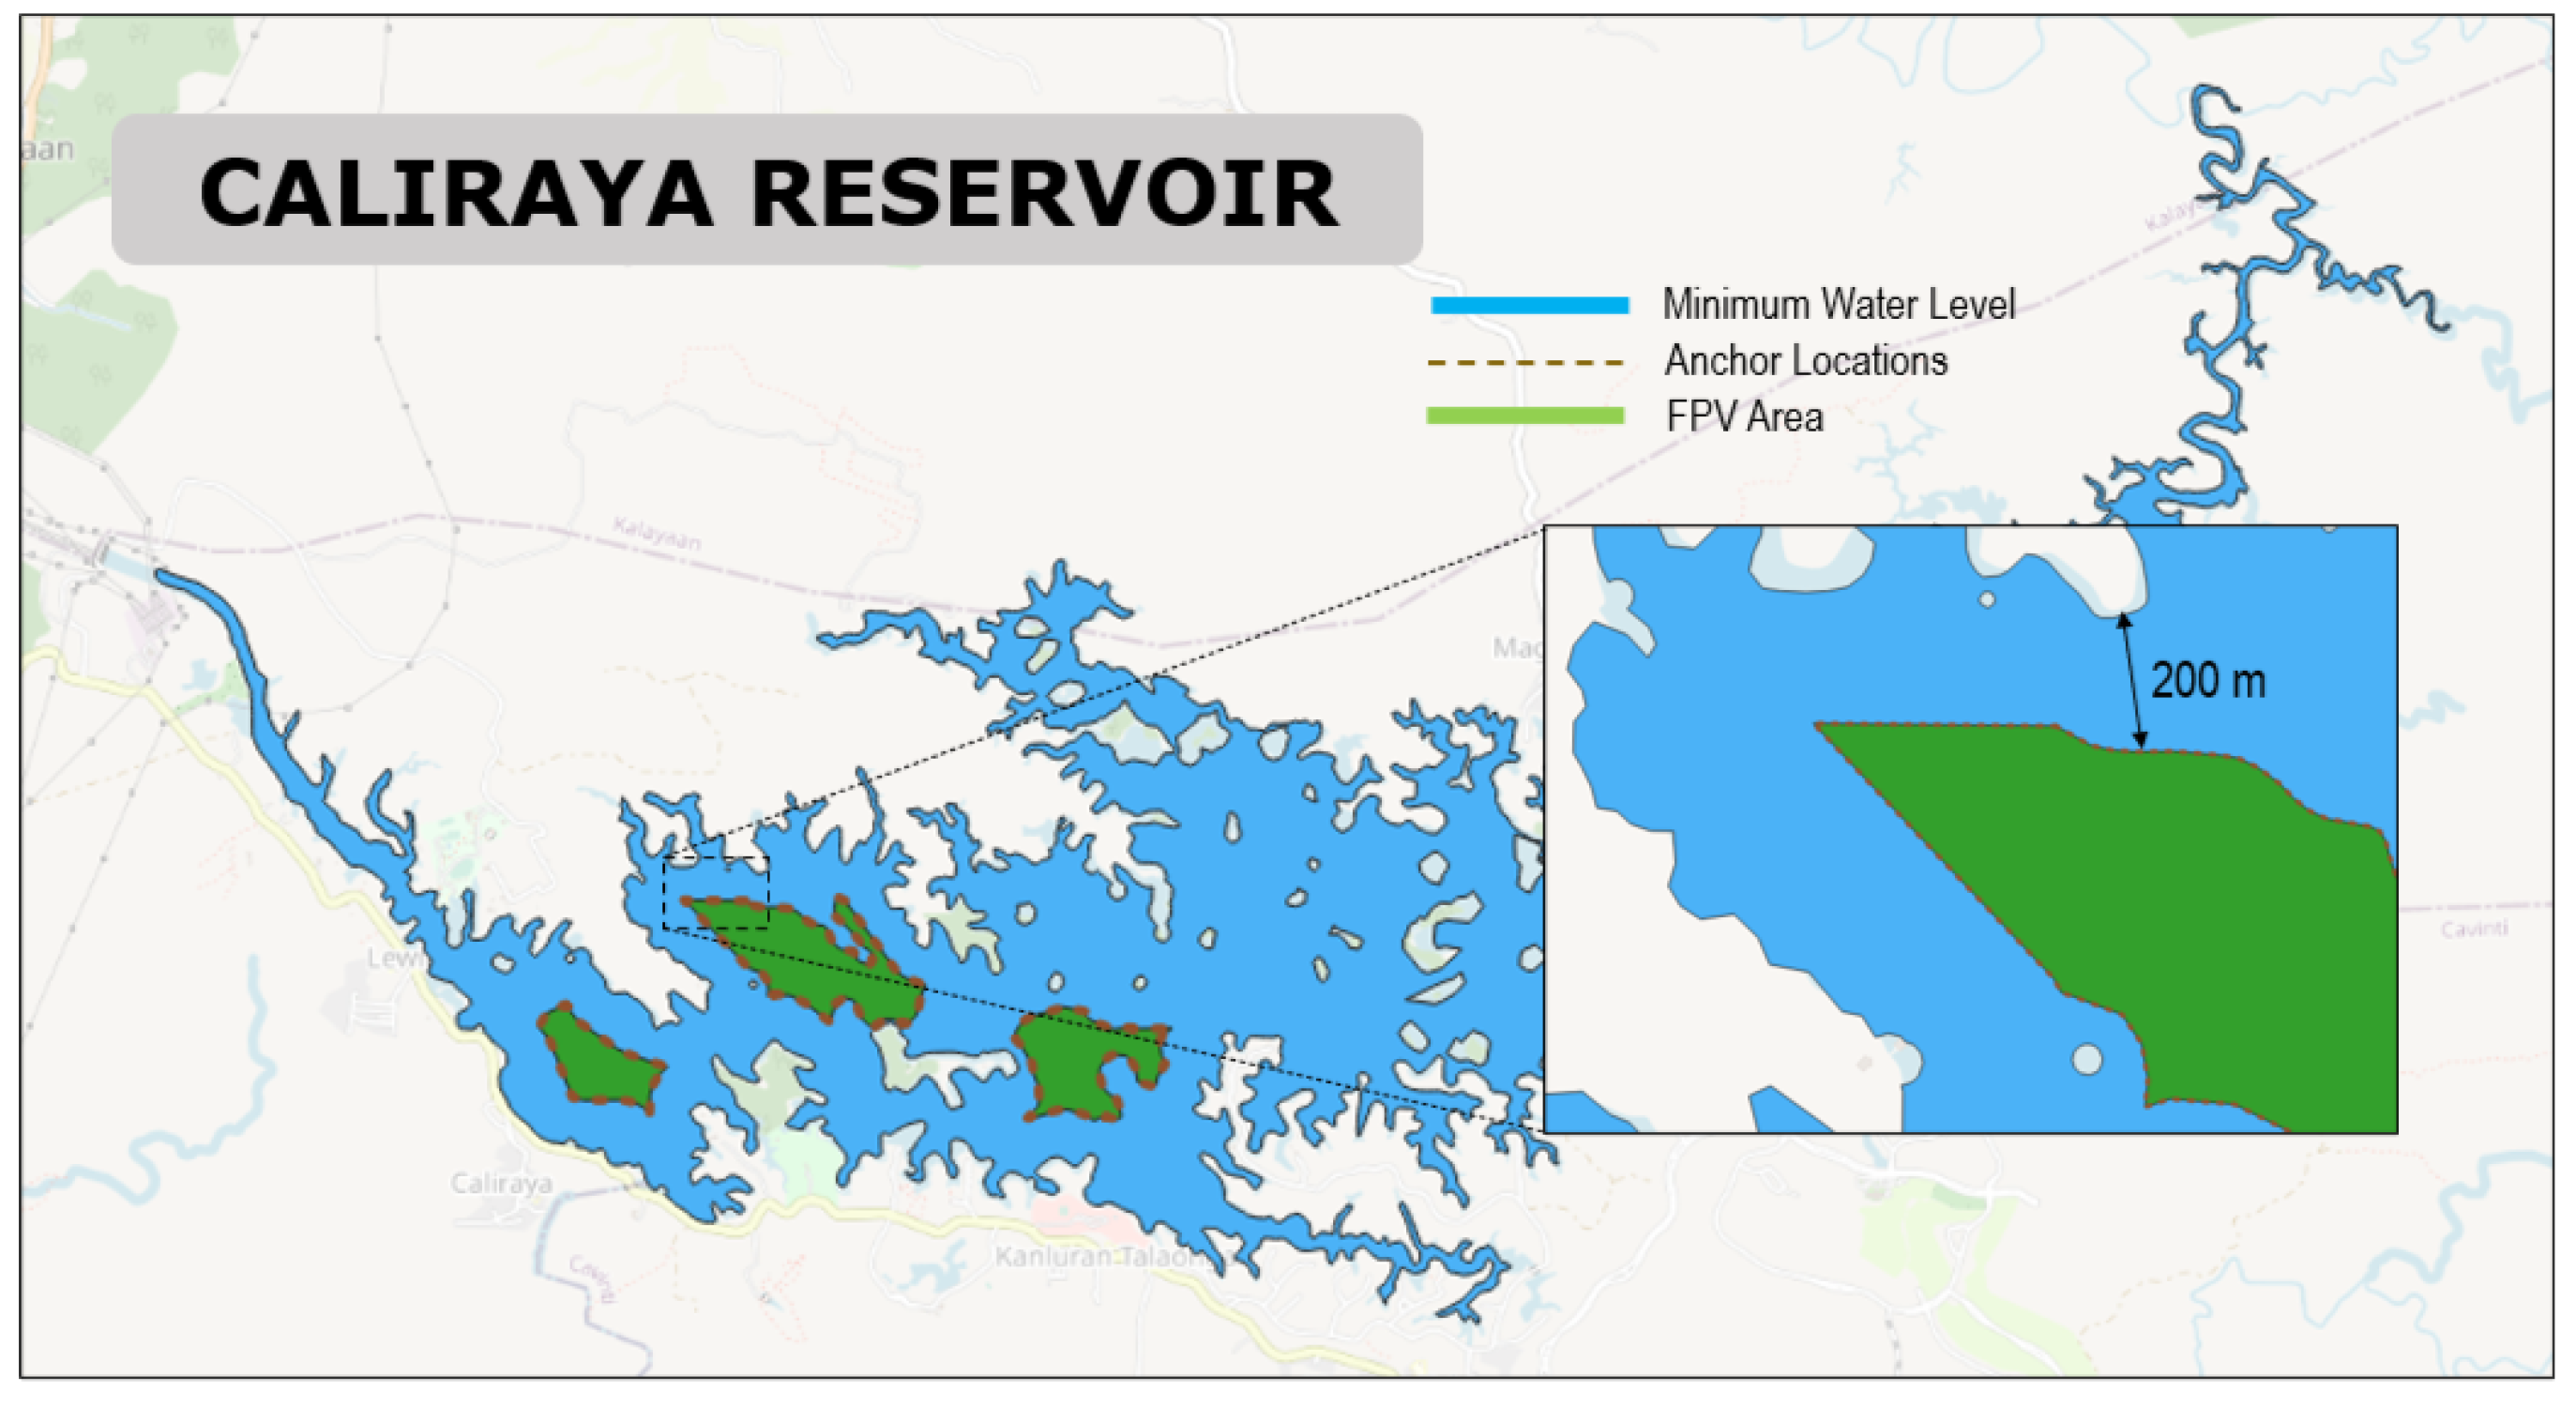
Figure 4.
The allowable FPV area in Ambuklao reservoir.
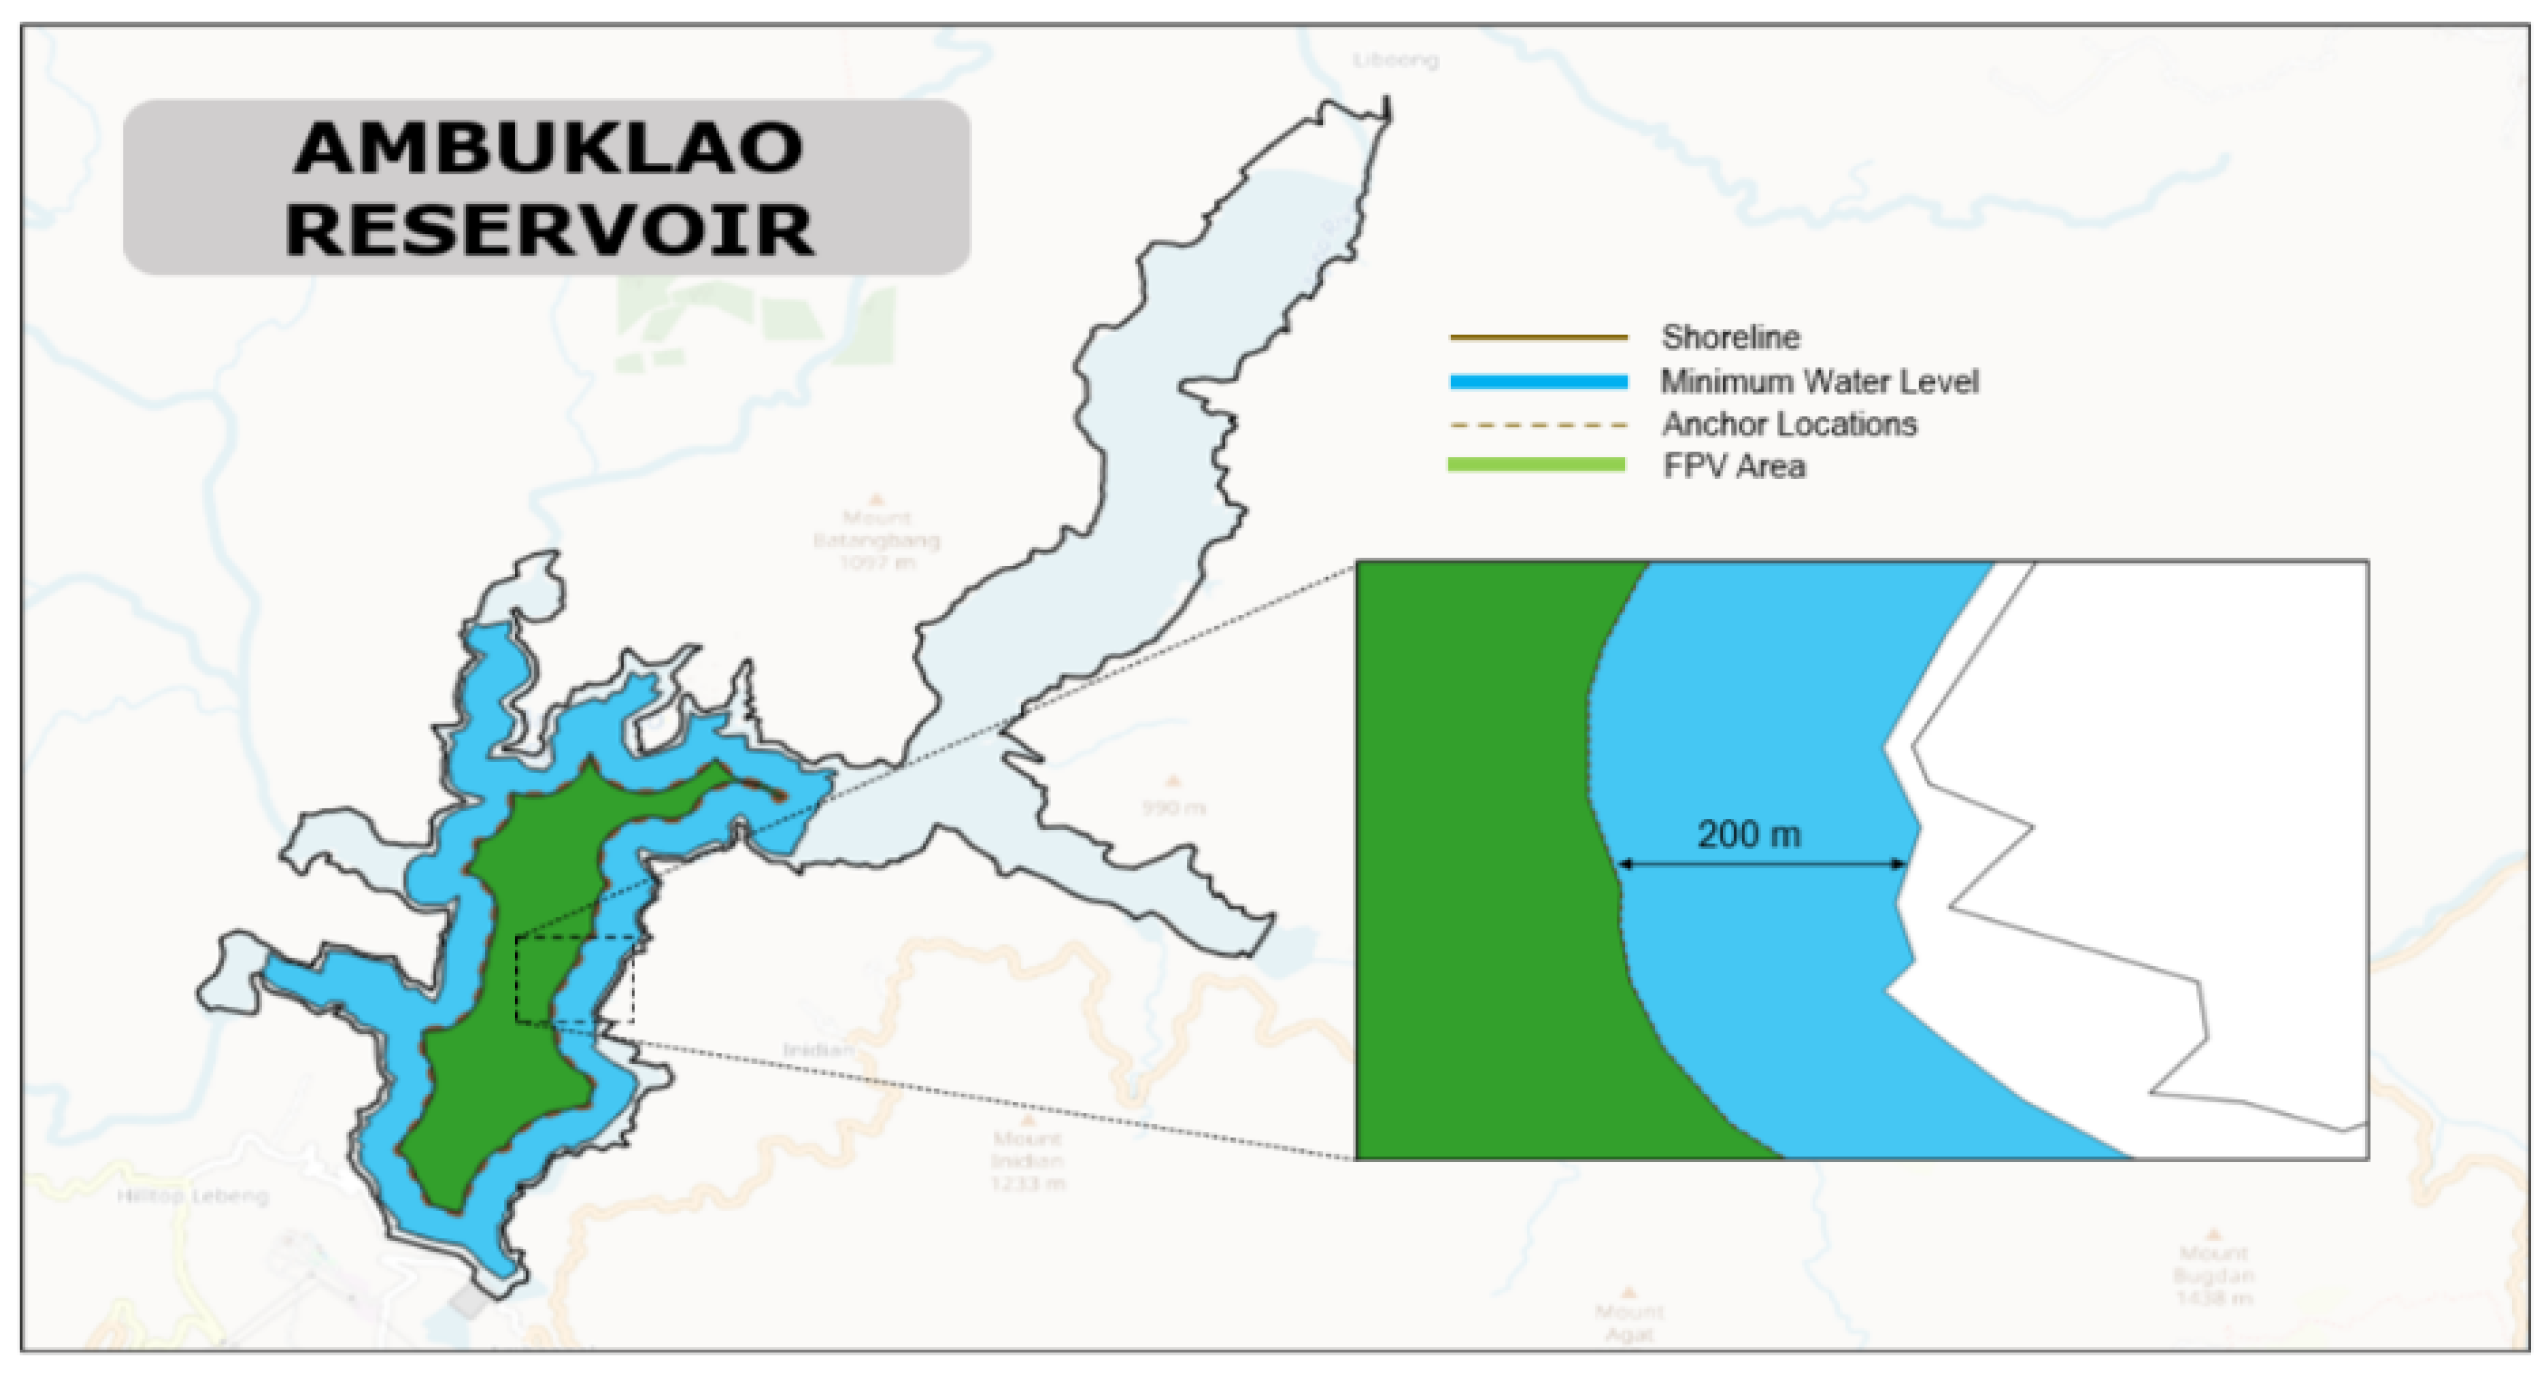
Figure 5.
The allowable FPV area in Binga reservoir
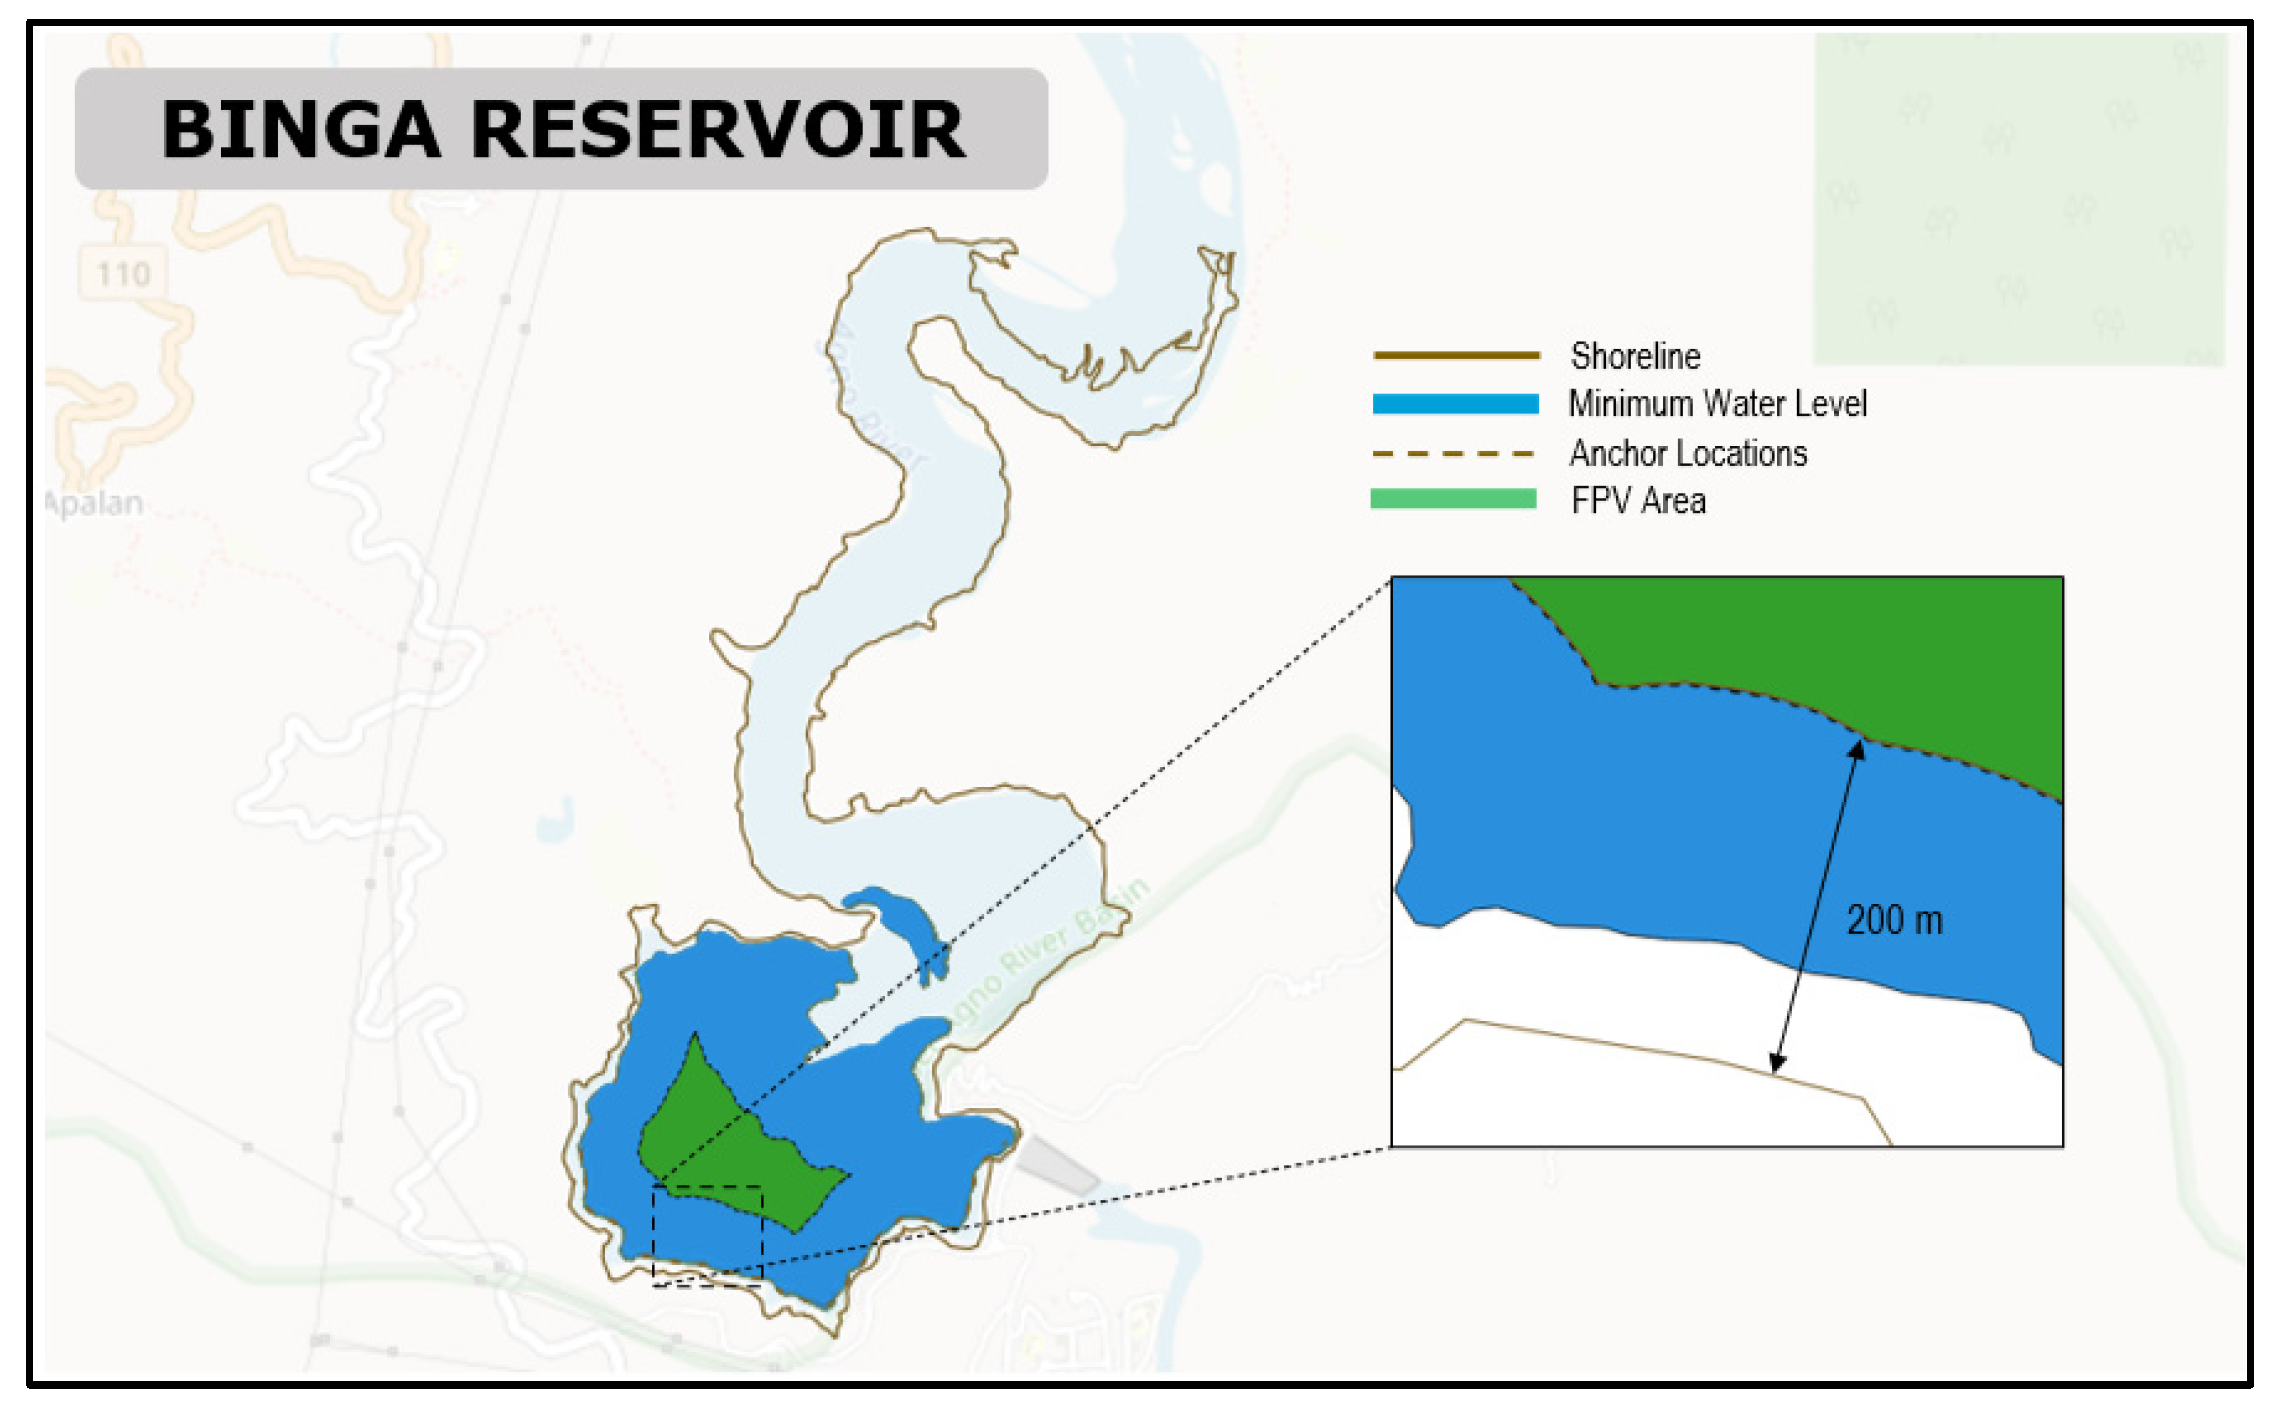
Figure 6.
The allowable FPV area in Angat reservoir.
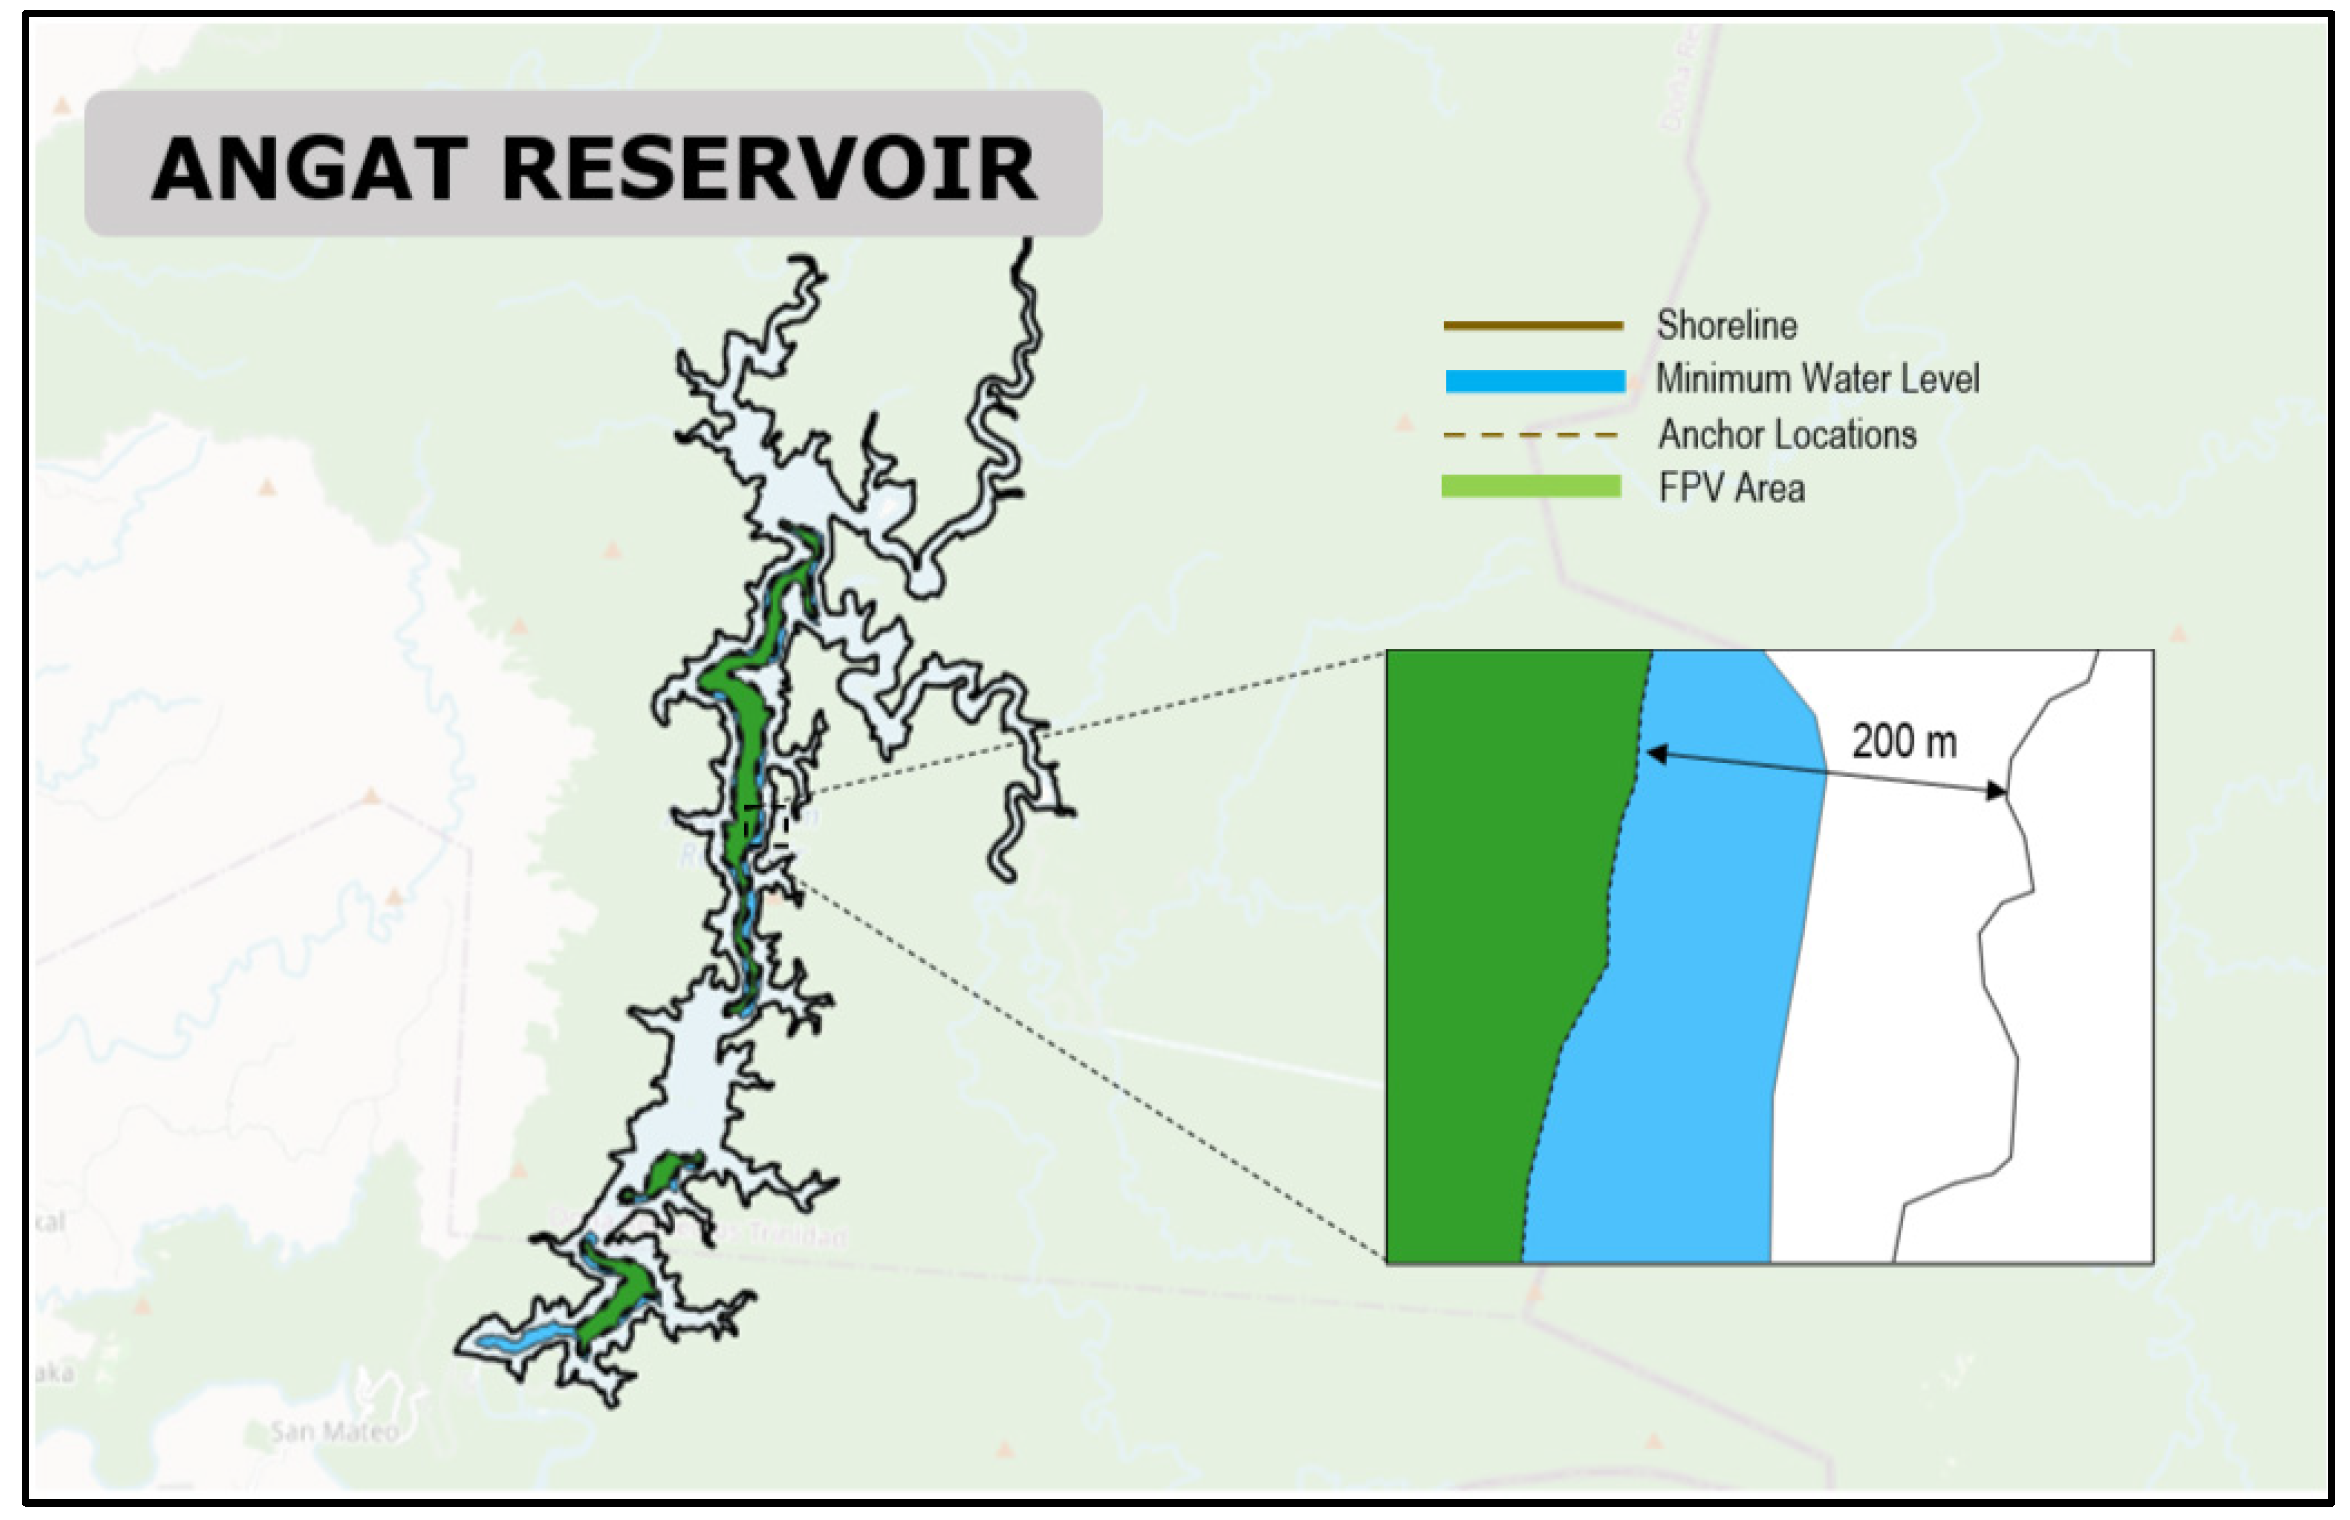
Figure 7.
The allowable FPV area in Magat reservoir.
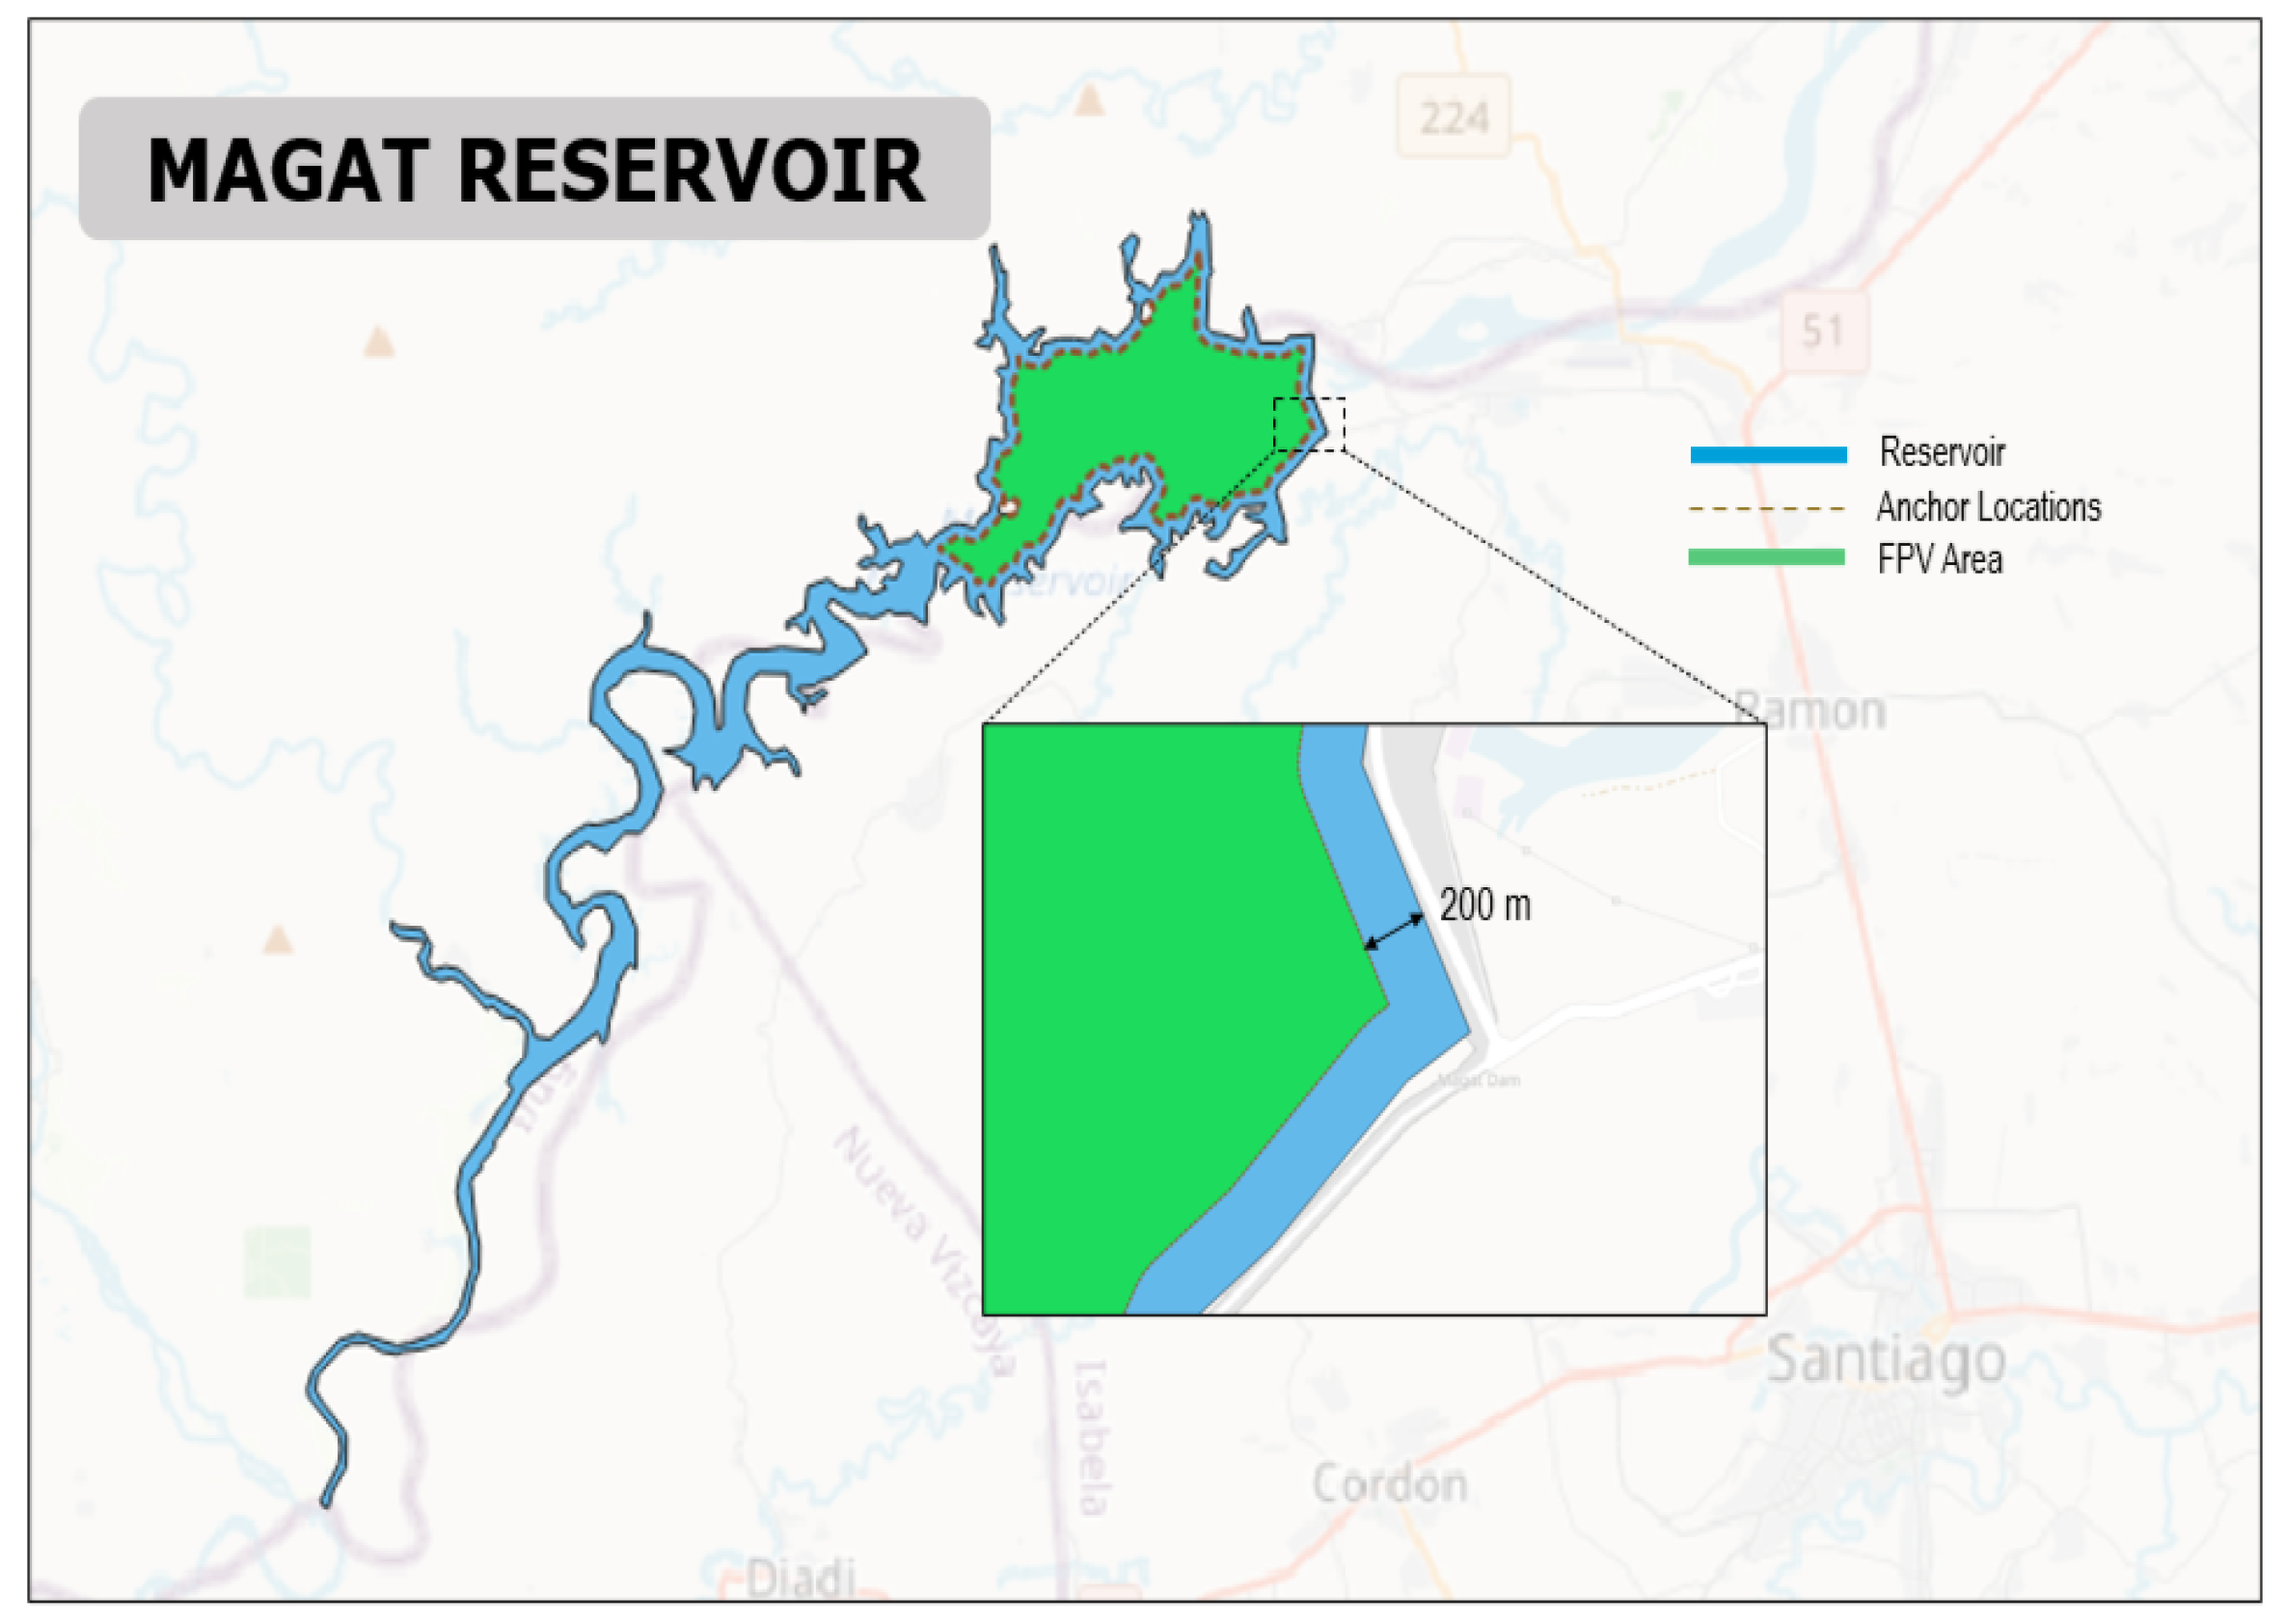
Figure 8.
FPV Area for Pantabangan reservoir.
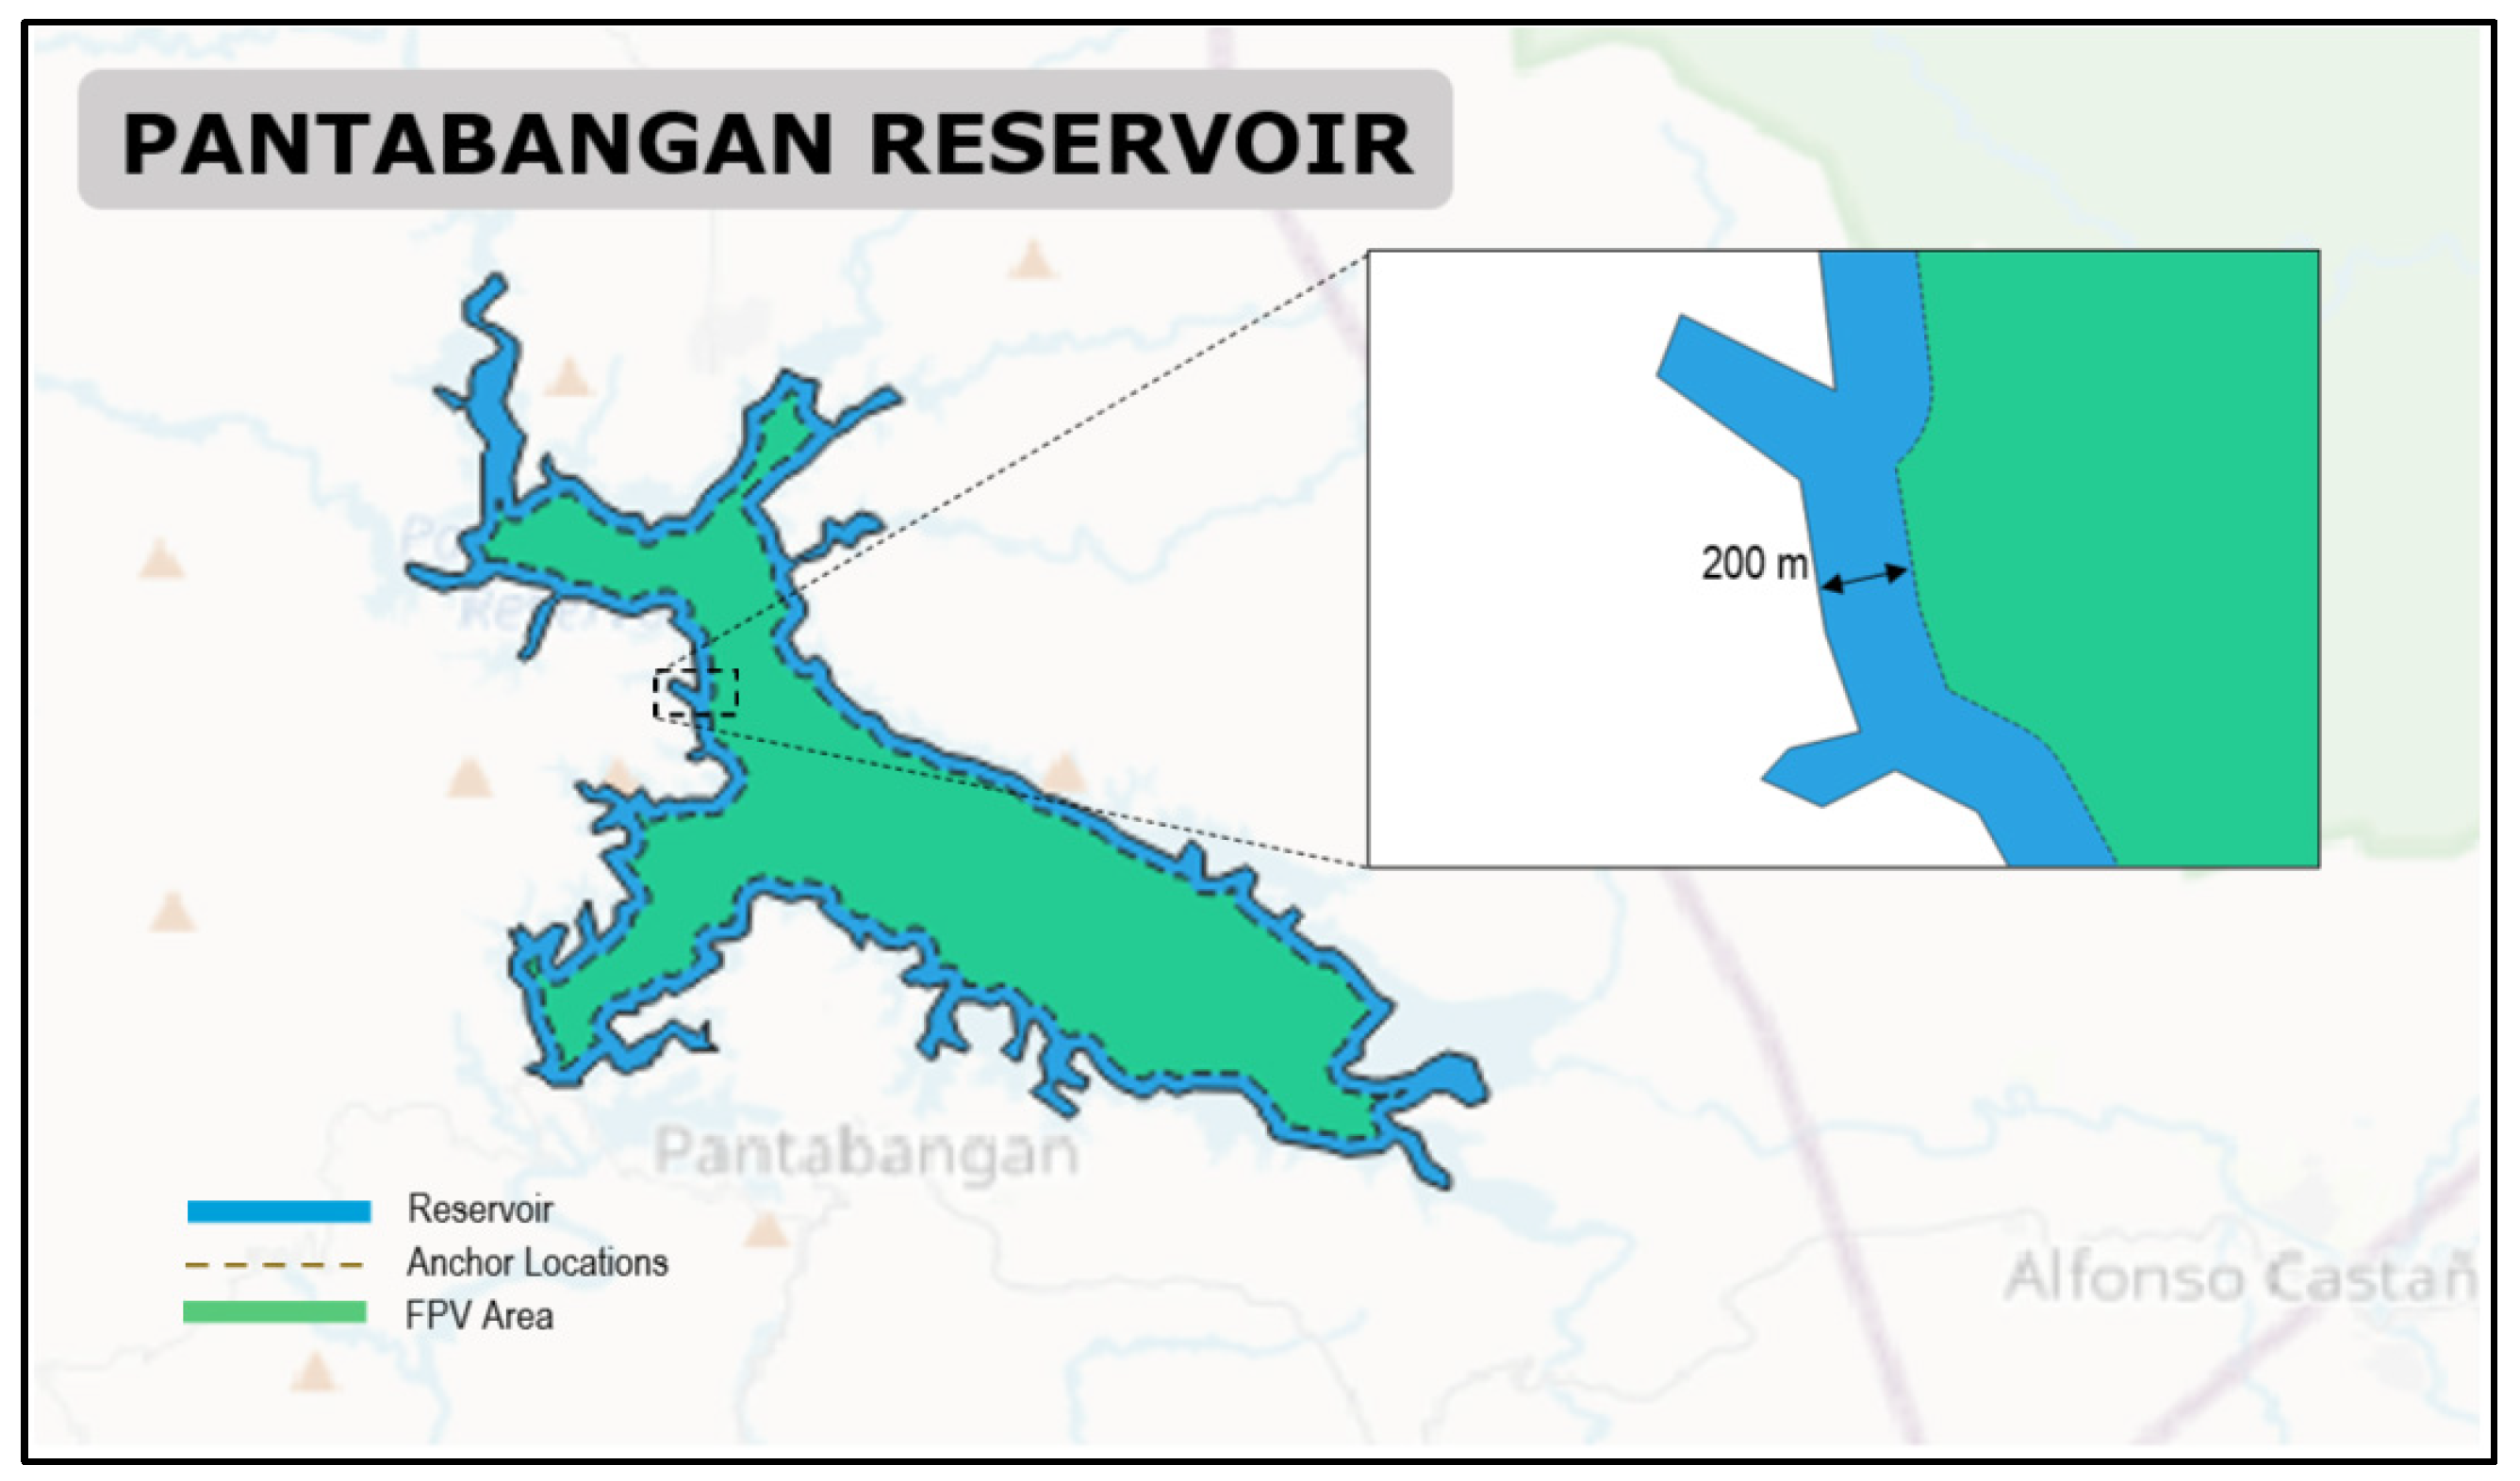
Figure 9.
FPV Area for San Roque reservoir.
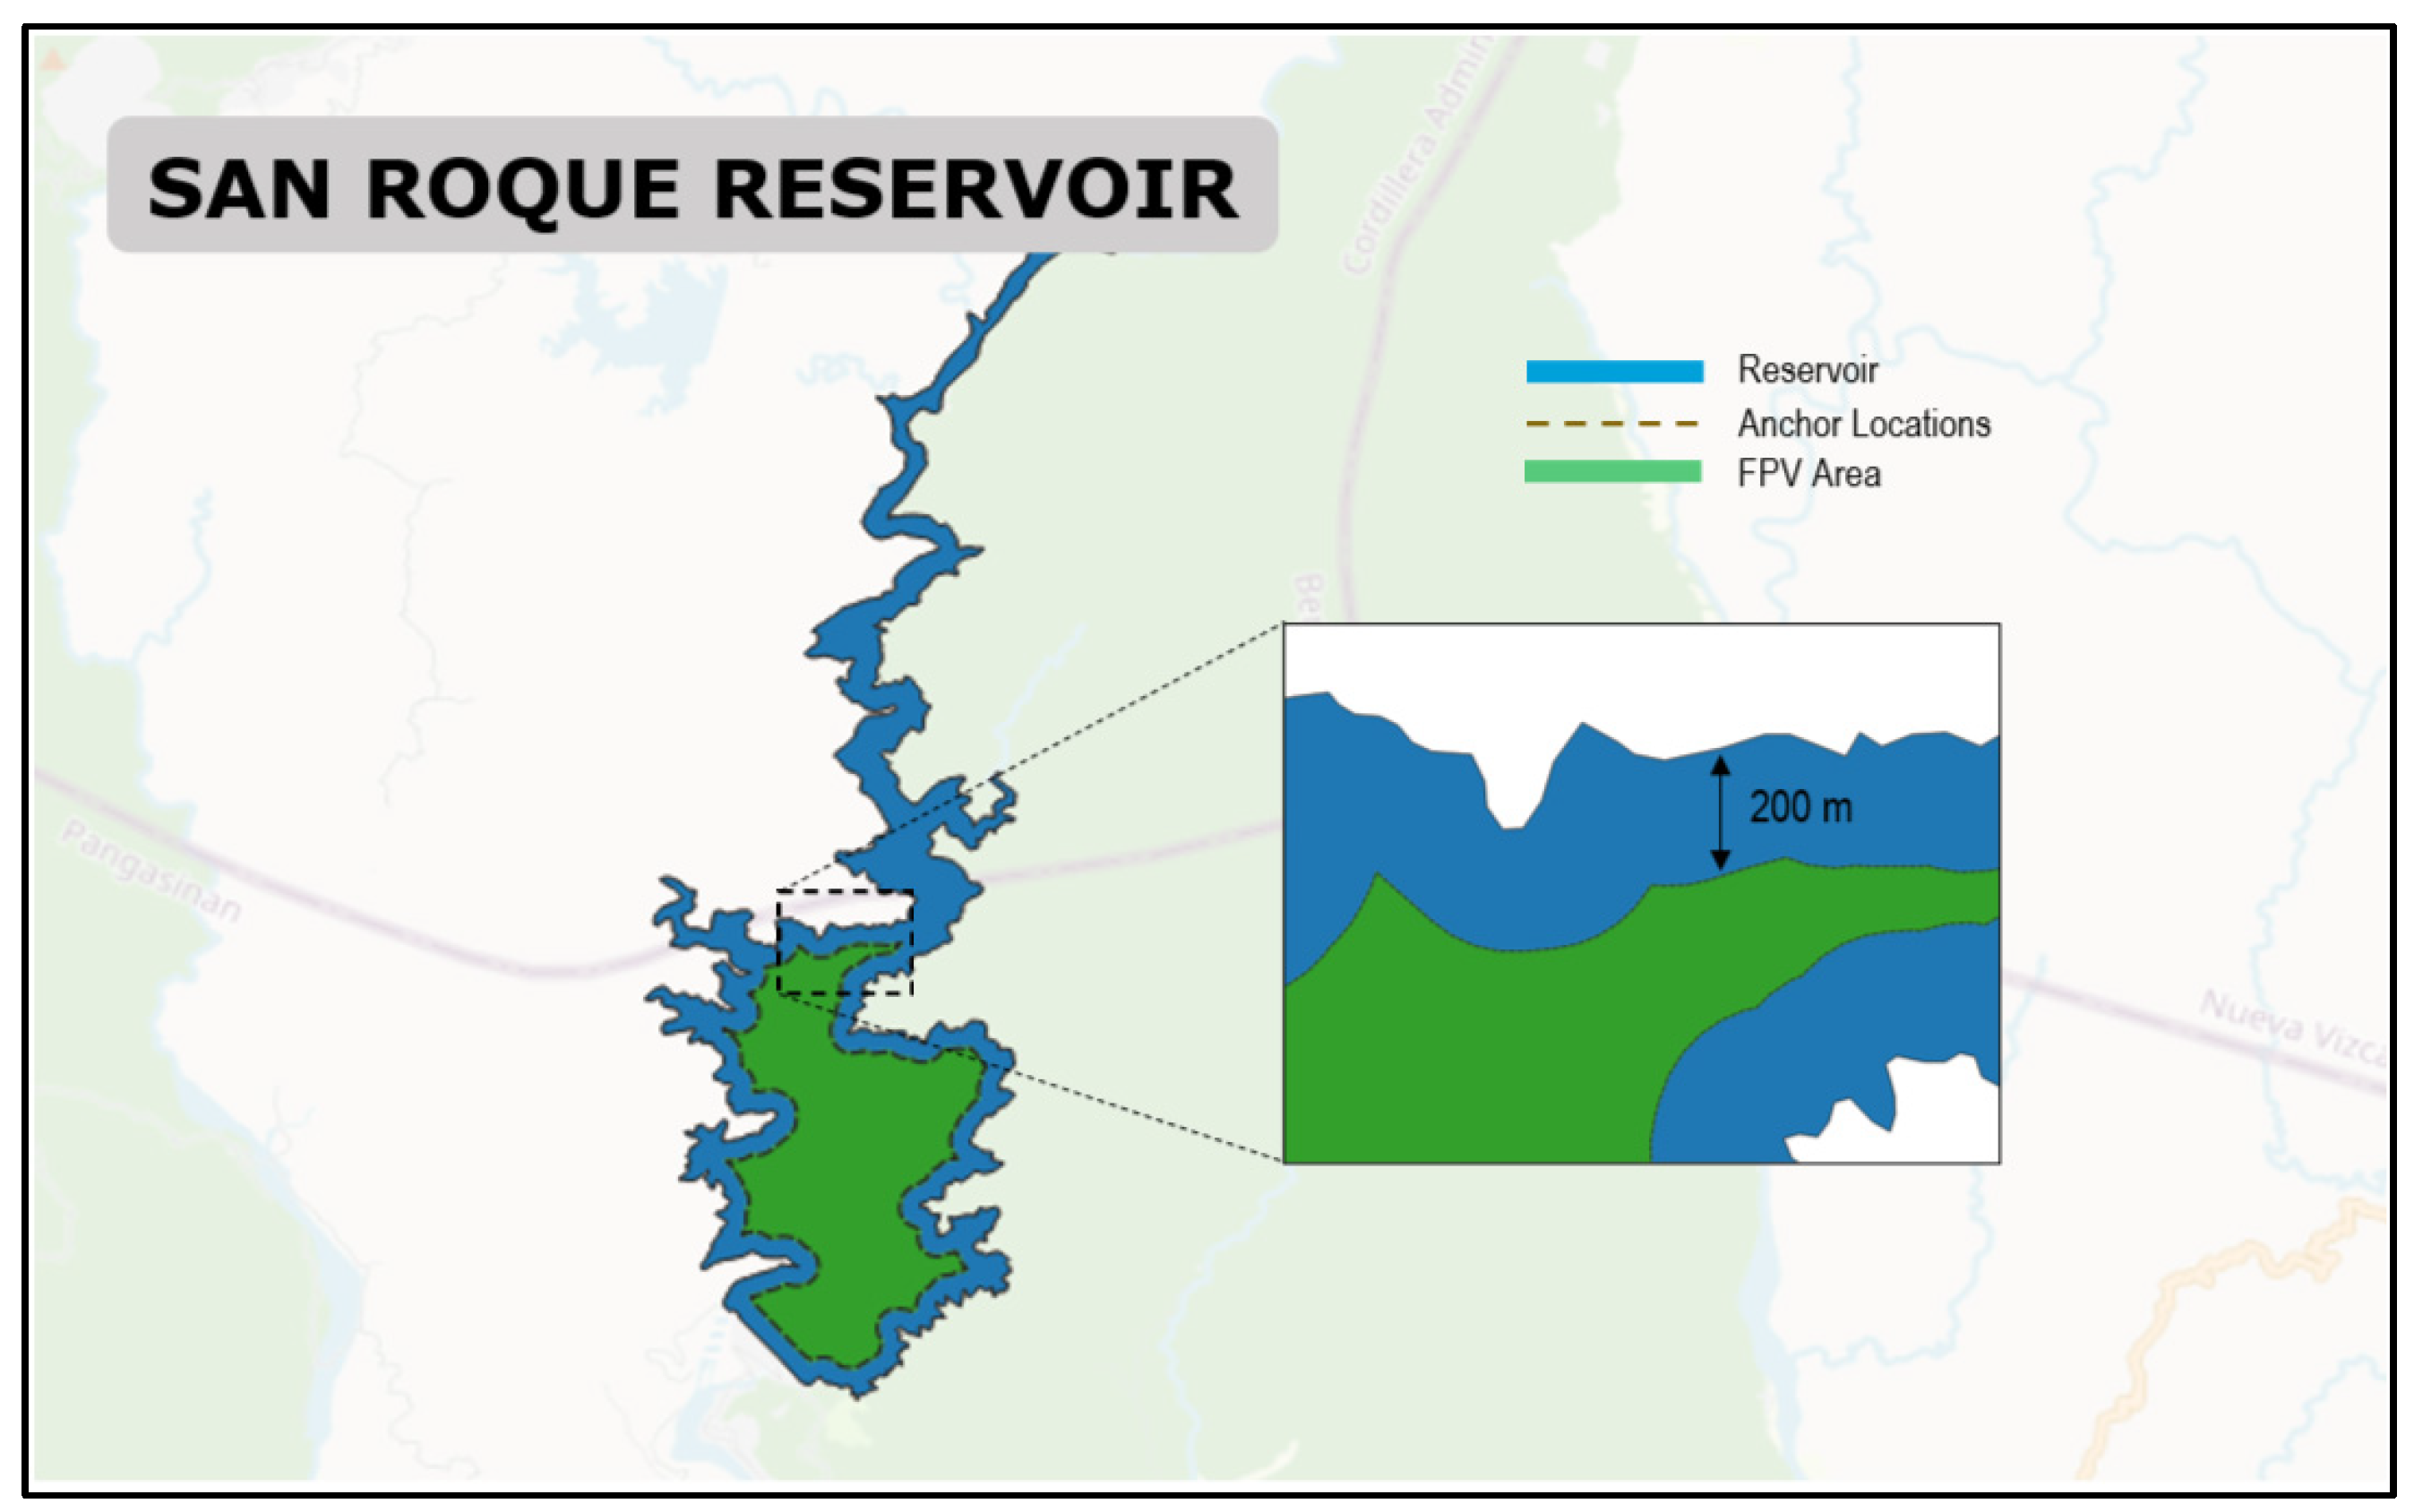
Figure 10.
Distribution of area coverage of 51 FPV projects of C&T relative to seven FPV projects in this study [22].
Figure 10.
Distribution of area coverage of 51 FPV projects of C&T relative to seven FPV projects in this study [22].
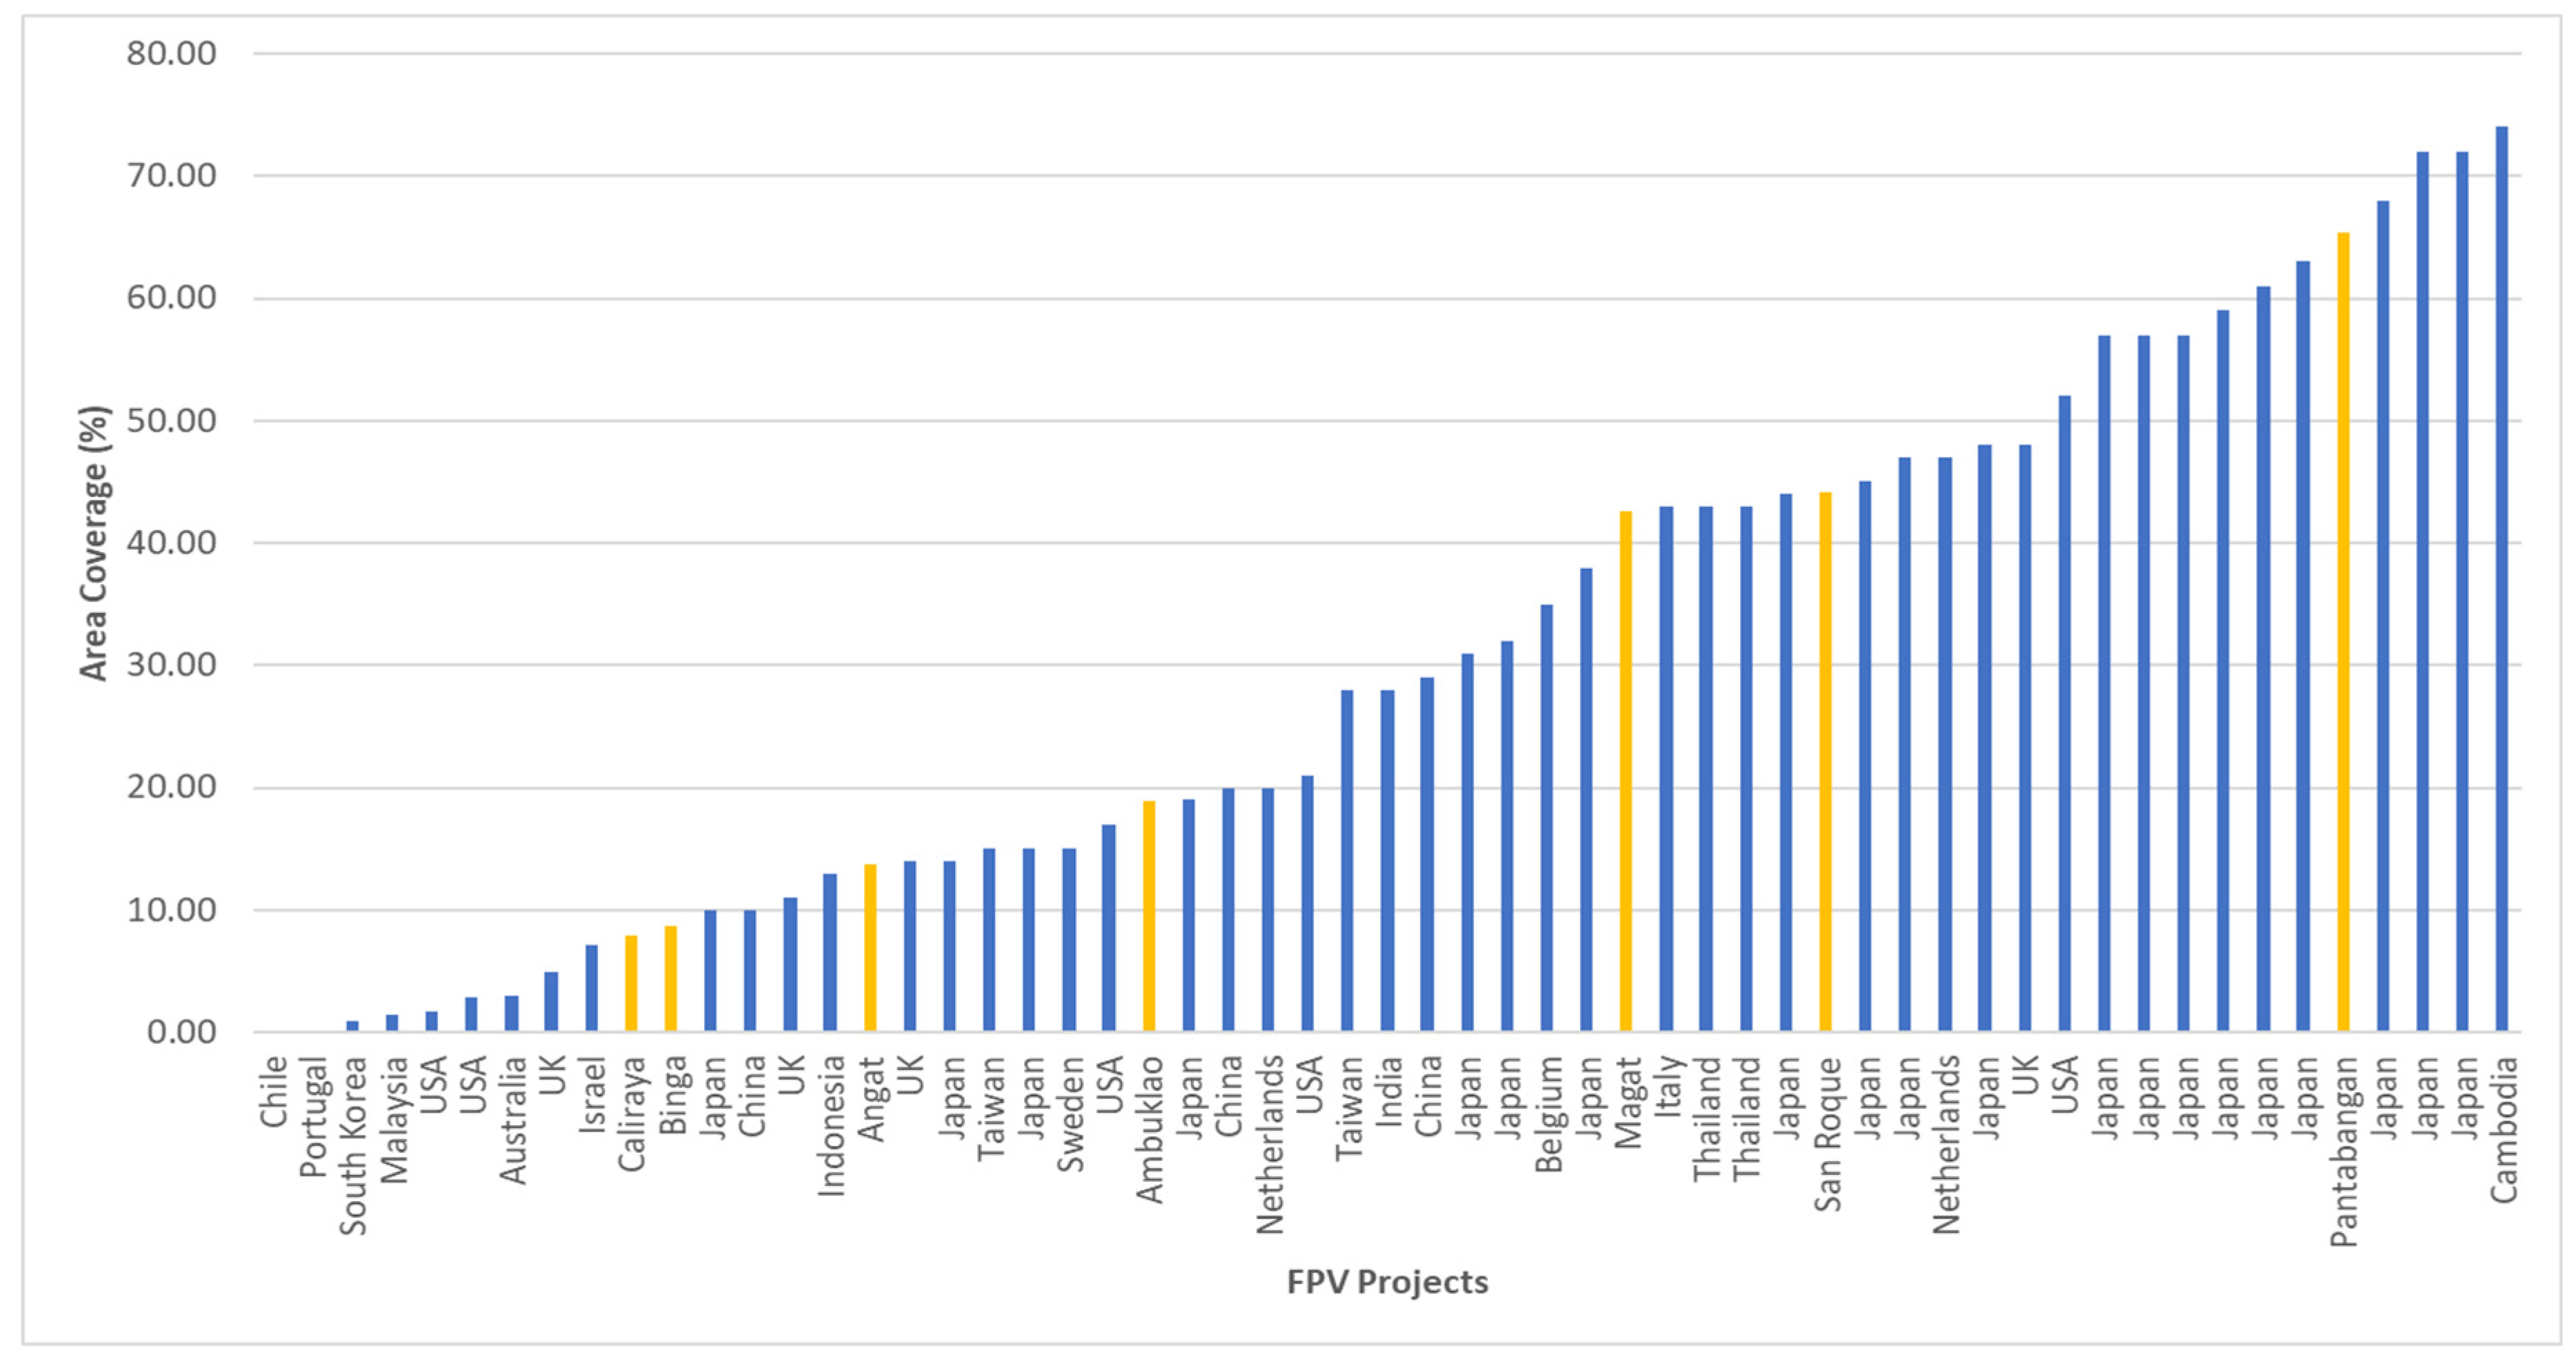
Figure 11.
Sensitivity of FPV installed capacity with varying technical and site constraints (Angat, Binga, Ambuklao and Caliraya).
Figure 11.
Sensitivity of FPV installed capacity with varying technical and site constraints (Angat, Binga, Ambuklao and Caliraya).
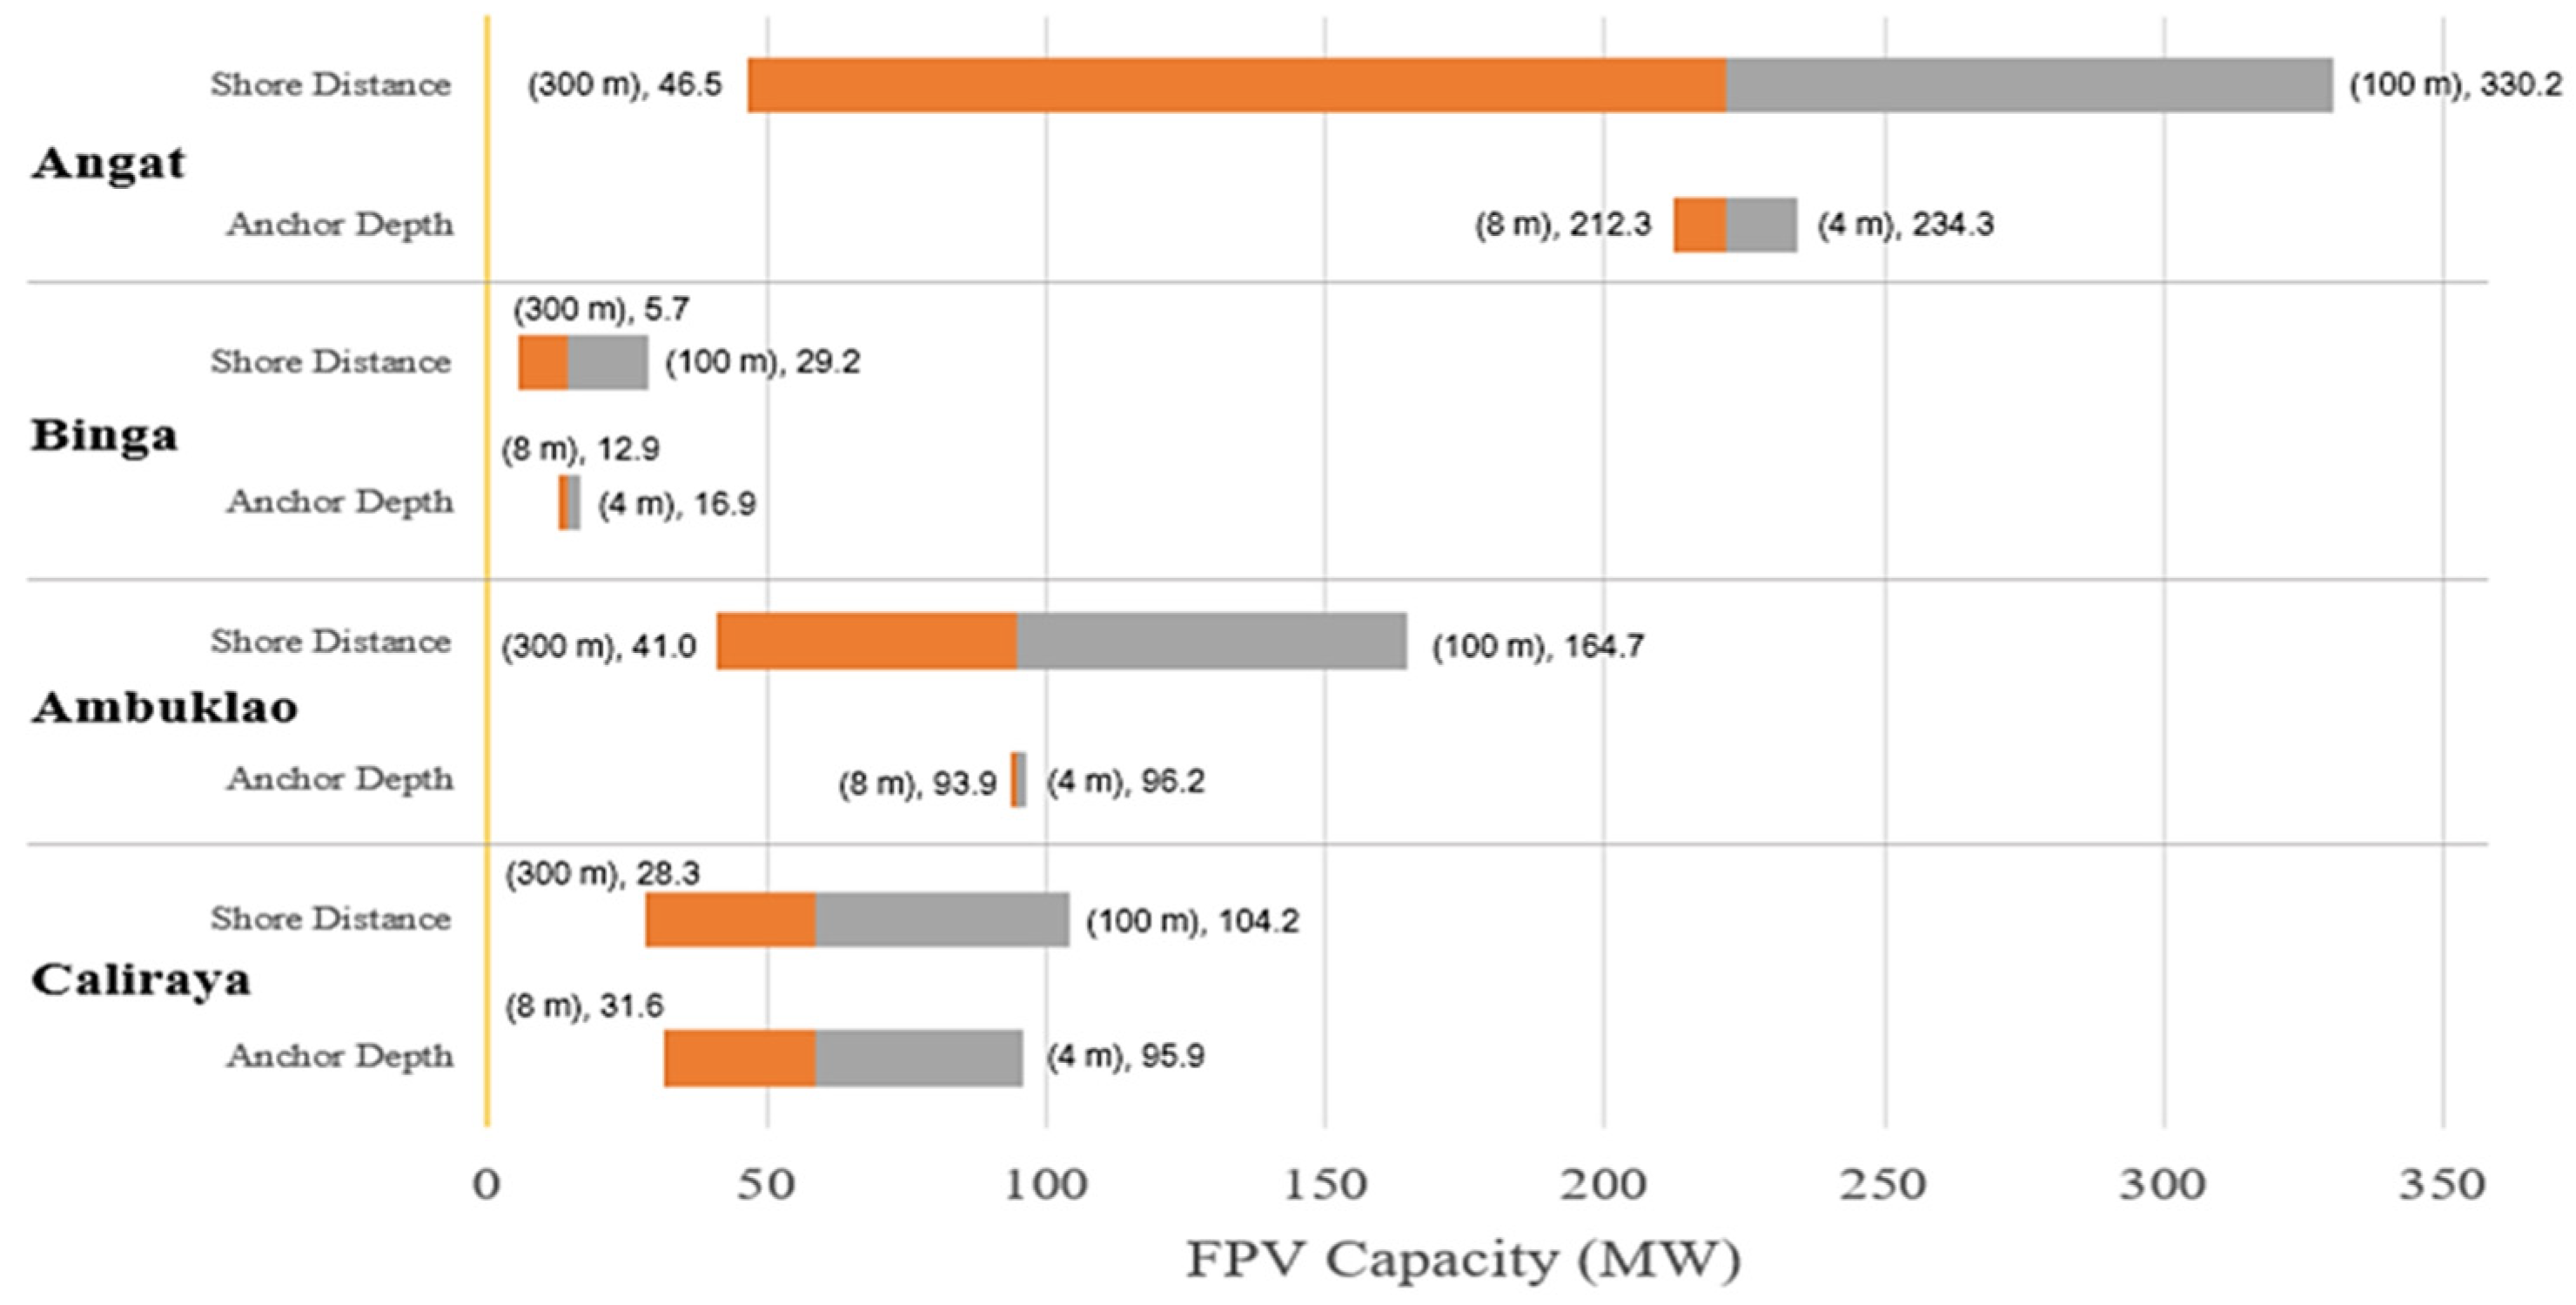
Figure 12.
Sensitivity of FPV installed capacity with varying site constraints (San Roque, Pantabangan and Magat).
Figure 12.
Sensitivity of FPV installed capacity with varying site constraints (San Roque, Pantabangan and Magat).
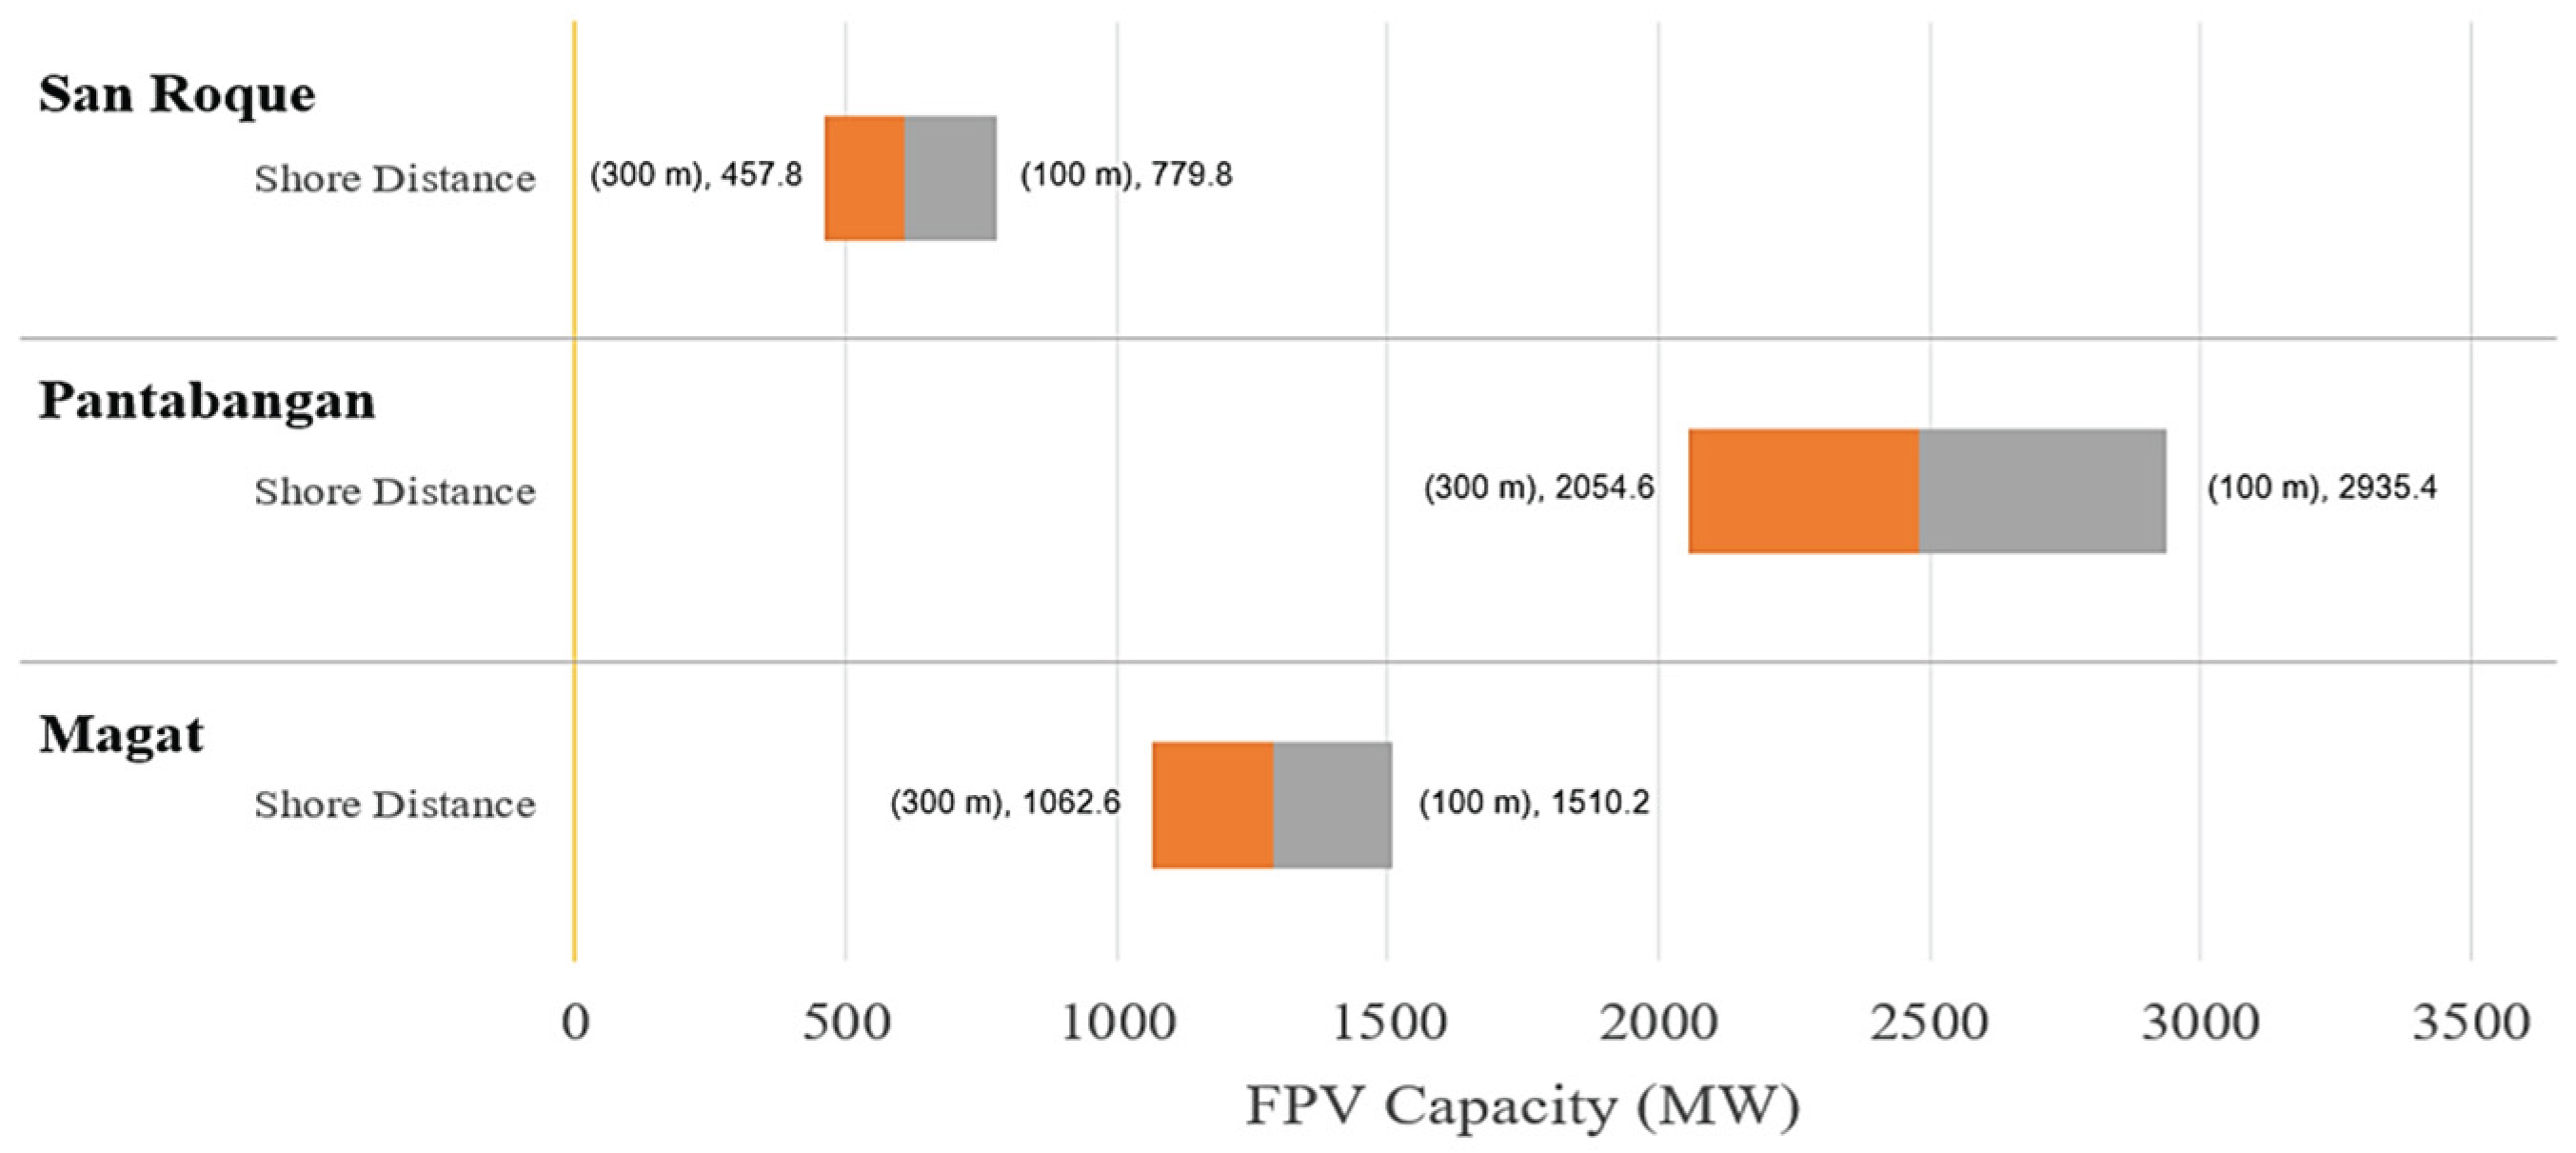

Table 1.
Power Plant Owner and Gathered Bathymetry and Water Level Data.
| Reservoir | Power Plant Owner | Bathymetry Type | Water Level Data |
| Ambuklao | SN Aboitiz Power (SNAP) | Contour Map (Type 2) | Available |
| Angat | Angat Hydro Power Corporation (AHPC) | Contour Map (Type 2) | Available |
| Binga | SN Aboitiz Power (SNAP) | Contour Map (Type 2) | Available |
| Caliraya | Power Sector Assets and Liabilities Management Authority (PSALM) | Survey Points (Type 1) | Available |
| Magat | SN Aboitiz Power (SNAP) | Not Available | Not Available |
| Pantabangan | First Gen Hydro Power Corporation (FG Hydro) | Not Available | Not Available |
| San Roque | Strategic Power Development Corporation (SPDC) | Not Available | Not Available |
Table 2.
Visual Inspection Criteria for FPV Area [5]
Table 2.
Visual Inspection Criteria for FPV Area [5]
| Visual Inspection Criteria |
| Minimum area of 4000 m2 |
| Not containing islets larger than half of its total area |
| Not located on the inflow/outflow portion, narrow part and irregular part of the reservoir |
Table 3.
Cost Assumptions.
| Ground-Mounted PV | FPV | References | |
| Capital Cost | Extrapolated based on figure 21 | Extrapolated based on figure 22 | [12,13,14] |
| Inverter Replacement Cost | USD 80,000 | USD 80,000 | [15] |
| Levelized O&M | USD 18/kw-yr | USD 15.5/kw-yr | [14] |
| Economic System Life | 20 years | 20 years | Based on the conservative lifespan of structural BOS; [16] |
Table 4.
Financial Assumptions and other LCOE Parameters.
| Ground-Mounted PV | FPV | References | |
| System Size | Same with the calculated FPV capacity | Depends on the FPV potential of reservoir | Resource Assessment |
| Initial Energy Output | Calculated using the corresponding FPV site and capacity | Depends on the FPV potential of the reservoir | Global Solar Atlas simulation |
| Degradation Rate | 1% | 1% | [20] |
| Discount Rate | 9.94% | 9.94% | [21] |
| Inflation | 2.98% | 2.98% | Averaged using Inflation rates from 2010 to 2020 |
Table 5.
Summary of FPV resource potential of artificial reservoirs in Luzon.
| Reservoir | Method | Bathymetry Data | Daily Water Level Data | Reservoir Surface Area (km2) | Area feasible for FPV (km2) | Area Covered (%) | FPV Potential (MW) |
| Caliraya | Method 1 | Bathymetry Contour Map with Survey Points | Available | 7.4 | 0.589 | 7.96 | 58.9 |
| Ambuklao | Method 2 | Bathymetry Contour/Color Map | Available | 5.01 | 0.950 | 18.96 | 95.0 |
| Binga | 1.69 | 0.146 | 8.64 | 14.6 | |||
| Angat | 16.12 | 2.219 | 13.77 | 221.9 | |||
| Magat | Method 3 | Not Available | Not Available | 20.23 | 12.864 | 42.55 | 1286.4 |
| Pantabangan | 37.91 | 24.786 | 65.38 | 2478.6 | |||
| San Roque | 13.8 | 6.093 | 44.15 | 609.3 | |||
Note:
| |||||||
Table 6.
Resource potential of Caliraya, Ambuklao, Binga and Angat using Method 3.
| Reservoir | Reservoir Surface Area (km2) | Area feasible for FPV (km2) | Area Covered (%) | FPV Potential (MW) |
| Caliraya | 7.4 | 1.951 | 26.36 | 195.1 |
| Ambuklao | 5.01 | 1.353 | 27.01 | 135.3 |
| Binga | 1.69 | 0.225 | 13.31 | 22.5 |
| Angat | 16.12 | 3.231 | 20.04 | 323.1 |
Table 7.
Indicative Initial Energy Yield in GWh of FPV and Ground-mounted PV in the reservoir sites (Simulated using Global Solar Atlas software).
Table 7.
Indicative Initial Energy Yield in GWh of FPV and Ground-mounted PV in the reservoir sites (Simulated using Global Solar Atlas software).
| Reservoir | FPV (GWh) | Ground-mounted PV (GWh) |
| Caliraya | 74.86 | 83.23 |
| Ambuklao | 137.66 | 150.29 |
| Binga | 20.85 | 22.76 |
| Angat | 277.15 | 306 |
| Magat | 1781.66 | 1951.47 |
| Pantabangan | 3494.83 | 3829.44 |
| San Roque | 899.94 | 961.48 |
Disclaimer/Publisher’s Note: The statements, opinions and data contained in all publications are solely those of the individual author(s) and contributor(s) and not of MDPI and/or the editor(s). MDPI and/or the editor(s) disclaim responsibility for any injury to people or property resulting from any ideas, methods, instructions or products referred to in the content. |
© 2025 by the authors. Licensee MDPI, Basel, Switzerland. This article is an open access article distributed under the terms and conditions of the Creative Commons Attribution (CC BY) license (http://creativecommons.org/licenses/by/4.0/).
Copyright: This open access article is published under a Creative Commons CC BY 4.0 license, which permit the free download, distribution, and reuse, provided that the author and preprint are cited in any reuse.


