
Submitted:
10 June 2025
Posted:
11 June 2025
You are already at the latest version
Abstract
The use of LUZs in urban environments is a critical factor for the proper functioning of vehicle mobility in cities. A poor use of these zones causes negative externalities such as double parking or illegal occupation of pedestrian crossings or garage doors. The purpose of the study is to provide city governance with a methodology based on the OEE model to evaluate the efficiency of a zone or a set of zones and to be able to make decisions that improve the use of these zones without harming the coexistence with the rest of the city users. To validate the methodology, all deliveries made in selected areas of the city of Zaragoza over a full month were studied. The result of the study shows that there is a very considerable loss of use and some recommendations are proposed in order to obtain a better use. The low level of efficiency is due to the incorrect use by the delivery drivers themselves, who often use the LUZs as parking lots, and the illegal occupation of the zones by unauthorized private vehicles.
Keywords:
loading and unloading zone
; weighted time
; OEE
; availability
; efficiency
; quality
; illegal occupation
; exceeded time
; weighted occupation time
1. Introduction
The vast majority of cities were not designed for the distribution of goods by trucks or delivery vans. Vehicle mobility on the streets and coexistence between pedestrians, personal mobility vehicles (PMVs), buses, private cars, and transporters is a critical factor that municipal authorities must manage. Parking in dense urban areas is a major challenge for last-mile logistics. The scarcity of parking and policies that do not address the needs of commercial vehicles often lead these vehicles to park illegally, according to Ghizzawi et al. [1] The solution currently in place in cities for loading and unloading goods to retail stores is to reserve LUZ on the streets, but in most cases, these LUZ are neither located in the right place nor are they of adequate size for the use required by transporters, nor do they have adequate reservation times. Alho et al.[2] argue that optimizing the number, location, and use of LUZs can lead to substantial improvements in mobility indicators, particularly in reducing double parking, an externality that disproportionately affects traffic and the efficiency of the urban transport system. Incorrect location, incorrect sizing, and poor choice of reserved times, as well as the time allowed for each unloading, standardized for all areas, cause very harmful externalities for urban mobility, such as double parking and illegal occupation of sidewalks, garage doors, crosswalks, or street intersection islands, as suggested by Amaya et al. [3] when they argue that commercial vehicle drivers, when they cannot find legal parking nearby, choose to double park or park in illegal spaces to ensure on-time delivery. Alho et al. [4] indicate that there are no clear criteria for choosing the location, size, and duration of the hours reserved for this task.
This study proposes the application of the OEE model, typically used in industrial and production environments, as a KPI, considering a LUZ as if it were a production element in order to evaluate operational efficiency and identify the factors that reduce productivity in that area. This information can be very useful for city governance, which can draw valuable conclusions about the performance of established areas. Comi et al. [5] propose a methodology for verifying and designing the number of delivery bays needed based on demand, but do not indicate how to measure their efficiency. Although Muñuzuri et al. [6] assert that, in the context of their research, they believe that decisions about the number, size, and location of loading zones should be made for individual streets rather than for sectors or areas, the application of the OEE model proposed in this article is very versatile and flexible, as it can be applied to a zone or a set of zones and over any time horizon that can be defined, whether hours, days, weeks, or months.
There is abundant literature on urban distribution of goods (UDG), but specifically on LUZ there are hardly any studies. References found tend to focus research on access routes to zones [7–9] and walking distance, which is the distance from the LUZ to the supply point [10,11]. Castrellon et al.[12] suggest that a maximum distance of 75 m provides a good level of accessibility service for cargo. Other authors, such as Dezi et al. [13] and Muñuzuri et al.[6] suggest a distance of 50 m, while McLeod et al. [14], suggest 100 m and Ochoa-Olán [15]. Other studies focus on booking spaces in LUZ [16–18] to avoid externalities and save on energy consumption when searching for parking. Several articles have also been found relating the OEE model to the UDG, which has led to the writing of this article.
Table 1 below shows the KPIs identified in the literature for evaluating processes in LUZs, divided into four categories, according to the authors' criteria:
After analyzing all the KPIs in the table, none were found that allows the efficiency of a LUZ to be measured in terms of city governance. Therefore, the objective of this study will be to define a new indicator based on the OEE model that allows the use of a LUZ or a set of LUZs to be evaluated over a specific time horizon. Its implementation will provide a methodology for making decisions about whether the location, size, and reservation hours for loading and unloading operations are appropriate or not. Wilson et al. [42] assert that the same space will be less valuable during periods of lower activity. With the application of the proposed model, these periods can be identified. The analysis can also lead to actions that improve the use of the area, which will help city governance to make coexistence between the different agents in the city more compatible. Alho et al., [4] discuss the variable size of the LUZ but highlight the difficulty of assessing whether it is the correct one. As will be demonstrated at the conclusion of this work, illegal occupation by vehicles not authorized to use the LUZ and the excessive time spent by transporters unloading are the two factors that most hinder the efficiency of the LUZ. The contribution of this study is to quantify the impact of these bad practices.
The article is organized as follows: Section 2 describes the OEE model and its application to the DUM. It then addresses the characterization of loading and unloading zones in the city of Zaragoza and details the five zones that have been chosen for the study and why they have been chosen, as well as the fieldwork from which the data for the study has been obtained. Section 3 analyzes the results of applying the model in all its aspects and possibilities for analysis, and section 4 interprets the results and makes recommendations for city governance. Finally, section 5 presents the conclusions and possible future lines of research.
2. Materials and Methods
2.1. The OEE Model
Getting into the objective of this article, we will now define the OEE model for evaluating the selected LUZs. OEE (Overall Equipment Effectiveness) is a concept commonly used in the industrial sector, introduced by Nakajima (1988) [43] as part of total productive maintenance (TPM) to measure the productivity and efficiency of equipment [44]. It is a productivity ratio between real production and what could ideally be produced [45], which in our case could be likened to the unloading carried out in the time reserved for loading and unloading tasks, compared to what could have been done. The objective of this model is to increase productivity and reduce losses in time, speed, and quality. Castrellon et al. [46] suggest that future research could be developed using analytical methods to examine the statistics collected and propose techniques for standardizing performance measures given the multiple scales and metrics encountered. For their part, Alho et al. [2] recommend investigating how different levels of compliance with standards affect the efficiency of the system and what policies can encourage better compliance. Castrellon et al.[12] also suggest in another study that there is a lack of analysis based on objective data and highlight the inefficiency of public policies.
In the logistics sector, there is no defined methodology for calculating this. Studies that address the OEE model for transport [47], compare the vehicle not to industrial equipment according to the classic OEE concept, but rather to the analysis of the efficiency of each individual route [47] and the analysis of the efficiency of the truck loading and unloading process [48], where it is observed that efficiency depends not only on the efficiency of the vehicle but also on that of the driver or on other external factors. Les et al. [32] calculate the OEEM, specific for OEE analysis of a delivery route. In no case has the model been found to apply to LUZ. Teodorovic et al.[49] indicate that it would be necessary to study in more detail segmentation, occupancy rates, average parking duration, indirect parking problems, and the enforcement of parking violations. Marcucci et al. [50] suggest that future research could also investigate the spatial optimization of loading bay locations in relation to demand and supply in a given sector. Hence, research such as that presented in this article constitutes an important pillar in the field of mechanisms for evaluating urban loading and unloading areas.
2.1.1. Factors That Make Up OEE and Their Application to LUZ
2.1.1.1. Availability
Drawing an analogy with the manufacturing sector, this factor reflects the time that a machine, in our case a LUZ, is in production compared to the total time it could be producing. Based on the 24 hours in a day, only a fraction of them are reserved for loading and unloading. From those reserved hours, scheduled downtime must be deducted, such as reserving the LUZ for removals, diesel supplies to communities, or for external events in the city. Therefore, this factor reflects the measurement of the time that the LUZ is in use, i.e., occupied, within the reserved time and excluding scheduled downtime.
In addition to the KPIs or variables currently used to evaluate loading and unloading areas, and in order to characterize this availability factor, it has been necessary to define a new KPI that will be called weighted occupancy time (tp). It is calculated as follows for a vehicle i:
Lt = total length of the LUZ
Li = length of the vehicle occupying the area
Tt = Total time reserved for loading and unloading in the area
tj = time that is occupying the zone
Li / Lj = % zone occupation
Li / Lj x tj = weighted occupation time (tp)
N
∑ tp = total occupation of the area
j=1
The interpretation of this new weighted time indicator is that its sum reflects the spatial-temporal contribution of each vehicle to the LUZ, i.e., how much time the vehicle's length is occupying the area, and its sum is compared with the Total Time available to see the availability of the area. To calculate the indicator, standard lengths have been taken for each type of vehicle: private car (4 m), small van (4 m), delivery van (4.5 m), large volume van (5.8 m), light truck with a maximum authorized mass (MAM) of 3.5 tons (6.2 m), and light truck with a MAM of 7.5 tons (7.7 m).
An availability indicator close to 1 means that it has been permanently occupied during that time, either legally or illegally. On the other hand, a low result would indicate a long period of non-occupation.
N
∑ tp
j=1
Availability = -----------
Tt
2.1.1.2. Efficiency
This factor measures the time that the area has actually been occupied by commercial DUM vehicles, i.e., the weighted occupancy time of non-commercial and unauthorized vehicles is discounted, leaving only goods delivery vehicles to be considered. The calculation of this indicator takes into account the reduction in the weighted time of use of unauthorized vehicles tx over the total time Tt.
tx
Efficiency = 1- ------
Tt
A value close to 1 would indicate that there has been no illegal occupation in the area, while a low value would indicate abuse by unauthorized vehicles. The indicator shows the length of time the area has been occupied by commercial vehicles.
2.1.1.3. Quality
In cities, there are rules and regulations regarding the time allowed for loading and unloading operations. To correctly quantify the time exceeded, the first 30 minutes are considered correct use, as indicated in the Zaragoza City Council's Urban Mobility Ordinance, and the excess time is considered illegal occupation of the LUZ. This factor quantifies the excess time that the area has been occupied by commercial vehicles that have exceeded the time allowed by the city authorities, i.e. the weighted occupancy time of commercial vehicles is subtracted, which, once the legal time has been exceeded, becomes illegal occupation (toi). The calculation of this indicator takes into account the reduction in the weighted time of illegal occupation due to exceeding the time allowed.
toi
Quality = 1- -----
Tt
A value close to 1 would reveal that commercial vehicles comply with the time allowed for loading or unloading, while a low value would indicate abuse by commercial vehicles, which use the LUZ as free parking. The indicator measures the quality of deliveries made correctly, in their corresponding zone and within the time allowed.
2.1.1.4. Calculation of the OEE for the LUZ
With the three factors defined, the generic formula of the OEE model is applied.:
OEE = Availability (A) x Efficiency (E) x Quality (Q)
The OEE can be measured for a single area or a group of areas. It can also be measured over any time period you wish to define. It should be noted that in this study, the OEE KPI proposed could be used when there is a need to evaluate an area from different points of view, for example, an OEE can be calculated by hours of occupancy to see if there are any times that suggest the need for improvement actions, or measured by day of the week to see how it behaves with weekly seasonality, or measured over a long period such as the entire month evaluated to obtain consolidated data. It will also be interesting to see the different behaviour of each area in the morning or afternoon.
Figure 1 shows the OEE model applied to a LUZ in graphical form for better understanding:
2.2. Characterisation of Selected LUZs
The analysis of the loading and unloading zones in the city of Zaragoza is shown below. This city was chosen because it is a pioneer in mobility initiatives, such as the implementation of an Urban Consolidation Centre (CCU) in combination with PMVs for UDG [51], distribution pilots with autonomous robots [52], autonomous buses [53], collaborations with the General Directorate of Traffic (GDT) [54,55], which has selected it as a test laboratory, and its participation in national and European projects such as URBANDUM[56] and DISCO Based on the 2018 Sustainable Urban Mobility Plan (PMUS) [57], in the section on UDG, together with open data from Zaragoza City Council, 779 LUZs have been identified. [58,59].
The average length of LUZs in the 14 areas defined in the PMUS in the urban area of the city is 19.4 metres and the average time reserved is 7.7 hours. Considering that this includes recently urbanised areas with very large spaces and generous times for loading and unloading, the central area, with 19.6 metres and 6.5 hours, seems to be a representative area for the study. In this area, 108 LUZ were identified, representing 13.86% of the 779 areas.
Article 93 of Zaragoza's 2024 Urban Mobility Ordinance [60] establishes the maximum time allowed for loading and unloading goods as 30 minutes in general terms.
This article is based on field research with direct observation in five LUZ in the central area. These areas were chosen for their representativeness:
Zone 1:
One-way street with free parking, 9.2 m wide in total and 5.3 m between vehicles, allowing for comfortable double parking. In addition, opposite LUZ there is a ‘dark store’ (an urban warehouse supplying stock to Glovo delivery drivers with PMV), so there is high demand for supplies. The hours for this area are from 9 a.m. to 12 p.m. and from 2 p.m. to 5 p.m. It is a 13-metre area, which corresponds to three theoretical vans or trucks. The entire street, excluding garage entrances and pedestrian crossings, including both pavements, is 168 metres long.
Zona 2:
Six-lane avenue, three lanes in each direction, with regulated parking, which also allows frequent double parking. The reservation time for loading and unloading is from 8 a.m. to 11 a.m., only in the morning. The avenue only has vehicles parked on one side, as the other side is dedicated to a bike lane, and has a total length of 173 metres reserved for parking. The length of the loading area is 10 metres, for two theoretical unloading spaces.
Zones 3, 4 y 5:
One-way street with free parking and no double parking, with cars on both sides of the street, with a total length of 165 metres dedicated to parking. The three areas are: a first area of 18 metres, with 4 theoretical spaces assigned and reservation times from 7 a.m. to 12 p.m. and from 2 p.m. to 5 p.m., a second 10-metre zone for two theoretical spaces, from 9 a.m. to 12 p.m. and from 2 p.m. to 5 p.m., and a third 8-metre zone (reduced due to the allocation of a few metres to a bar terrace) for a single theoretical space, with the same hours as the previous zone. On this street, illegal parking occurs in front of garage doors, pedestrian crossings and at the intersection with the adjacent street. Figure 2 below shows a map of the area with the LUZ marked in red:
At this confluence of areas, 43 retail establishments have been identified as recipients and/or senders of goods, 27 on the avenue, 4 on the wide street, 7 on the narrow street, and 5 on the street that completes the set of zones. Of these, 8 are food retailers, 18 are general stores, 1 is a supermarket, 10 are Horeca channel, 2 are pharmacies, 1 is a ‘dark store’ and 3 are car repair shops, which offers a standard representation of a typical service area.
Ochoa-Olan et al. [15] proposed that the use of numerical methods to estimate the location, number, and size of truck parking spaces should be complemented by empirical studies in order to balance mathematical calculations. Therefore, this paper presents the field study carried out during the entire month of May 2025 through direct observation, recording all entries and exits from the indicated areas. The month of May was chosen as it is a representative month, with full activity during the school year due to its impact on the city's mobility and the absence of holidays, and is therefore considered to be a time of coexistence between goods transporters and citizens in a normal situation. A total of 1,582 downloads of all types and with all types of vehicles were collected in the five LUZ.
3. Results
3.1. Global Indicators
Before addressing the results to apply them to the OEE model, we will explain the overall indicators to give a general idea of the use of LUZ in the period analysed. Table 2 provides a summary of the loading and unloading operations observed in the areas.
A total of 1,582 loading and unloading operations were recorded in the area as a whole, of which 1,092 were in the LUZ areas under analysis. Of the other 490, 329 were carried out in double rows and 161 were illegal (garage doors, pedestrian crossings or intersection islands). This can be seen in Table 3.
As the article focuses on calculating OEE for LUZ, we will disregard double parking and illegal occupation operations, and only analyse data observed in LUZ operations during their authorised hours. Data referring to the number of operations can be found in Table 4:
From this table, we can draw an initial conclusion: only 51.44% of operations were carried out correctly within the time allowed. This information is in line with the findings of Dezi et al, whose research carried out at delivery points in the study area of the city of Bologna showed that more than 50% of delivery points were occupied illegally. In this case, the correct use of the LUZ only considers operations that have been carried out within the time allowed, although subsequently, when calculating availability, the first 30 minutes are counted as correct, with any time after the 31st minute being considered illegal.
Another interesting fact, whose impact on the OEE calculation is referenced in the weighted time calculation formula, is the type of vehicle used for unloading. It has been observed that only in very few cases are LUZs used by vehicles exceeding 3.5 tonnes of maximum authorised mass MMA, with double parking normally being used to unload such large vehicles. In the case of unloading at the supermarket or ‘dark store’ in the area, the unloading operation includes lowering the pallets from the truck with a tail lift and then walking to the delivery point by dragging the pallet with an electric pallet truck along the road and pavement, with the consequent risk to the delivery driver, other road users and pedestrians. Table 5 shows the total operations recorded by type of vehicle, including those carried out in the LUZ, double parking and illegal parking.
3.2. Availability
The results obtained from applying the defined formula can be seen in the following tables, which analyse the factor according to zone, time slot and day of the week. Table 6 shows the availability factor by zone:
It can be observed that there is a considerable difference between zones and also between the morning and afternoon periods.Table 7 shows availability by time slot:
By analysing behaviour by hour, it can be deduced that the first hours are those with the highest activity, while the last hours are those with the fewest operations. It should be noted that the arrival time is taken as a reference. Table 8 shows availability by day of the week:
In terms of weekly seasonality, Fridays are the days when the areas are used the least. There are external factors that affect activity, such as the fact that Friday 2nd was a bank holiday and activity was noticeably lower. The data obtained for Wednesdays is also noteworthy, but there was one day (7/05) when the area was not used for LUZ as it was reserved for a removal, during what had been defined as scheduled time when LUZ was not to be used.
In short, we can take the value of 0.58 as an indicator of the availability of the set of LUZ under study. The reading is that 58% of the time the LUZ are occupied.
3.3. Efficiency
At this point, it proceeds to evaluate and discounting the factor that penalises efficiency, which is the illegal occupation of the LUZ by private non-commercial vehicles that make use of free parking, preventing the proper use of the LUZ. Let us also see how this indicator behaves with the level of analysis in the previous section. The efficiency by zone can be seen in Table 9:
In this case, more regular behaviour was observed, both by area and in the morning and afternoon. Only two viable solutions were proposed to try to resolve this reduction in performance. On the one hand, awareness campaigns for the public and, on the other, increased police control. It should be noted that during the 21 days of analysis in which data was collected in the field, only once the police issued a fine in a LUZ, to a private vehicle that had been parked for 10 minutes, while right next to it there was a large van that had been parked in the area for two days and was not fined, as it is supposed to be an authorised vehicle and the time it spends in the area is not monitored. Table 10 shows the performance by time slot:
No significant variation in this alteration was detected depending on the time of day or the area. The day of non-use in zone 3 was taken into account. Table 11 shows the performance per day of the week:
The table shows that there are no significant differences between days of the week. The day on which zone 3 was not used has also been taken into account.
To calculate the OEE, we will use the value 1- (no efficiency) This value quantifies the proportion of time that the LUZ is occupied by private vehicles and provides the city government with tools to improve loading and unloading operations without increasing reserved times. In this case, the value for all areas is 0.88, which means that 12% of the time, the LUZ is occupied by illegally parked private vehicles.
3.4. Quality
This indicator identifies the time that LUZ spaces are illegally occupied by commercial vehicles that abuse the areas, in some cases using them directly as free parking spaces. During the analysis period, several vans from nearby businesses were detected repeatedly making this improper use of the spaces. On several occasions, vehicles have even been detected parked for several days in a LUZ. As in the previous sections, these will be analysed separately. It should be specified that times exceeding the 30 minutes allowed are considered toi, with the first 30 minutes of the operation being reported as normal. Table 12 shows the quality factor by zone:
The table shows that there is greater abuse of excess time in the afternoon sections, as well as greater abuse in zone 4. Table 13 shows the quality factor by time section:
It has been observed that there is greater abuse by delivery drivers at the end of the reserved time slot, probably because they take advantage of the reserved time to find a space and park their vehicles. The quality factor per day of the week is shown in Table 14:
Wednesdays get the best response, while Tuesdays and Thursdays get the worst results.
To calculate the OEE, the value of Non-Quality = 1-(weighted time of illegal use due to excess time) will be used. A very low indicator would denote little solidarity among transporters, who do not make an effort to comply with the established times. In this case, the result is 0.74, indicating that 26% of the time, the LUZ are illegally occupied by vans or trucks that exceed the permitted time.
If we exclude operations that exceeded 30 minutes and focus solely on successful deliveries, there were only 305 (27.9% of those made in the LUZ), and the average delivery time was 17.9 minutes, which suggests to the city authorities that the 30 minutes currently established by the ordinance could perhaps be reduced. This figure is similar to that of the city of Bologna, which has set the time for completing the operation at 14 minutes. Obviously, if the time allowed is reduced, this non-quality indicator would increase considerably.
One possible solution to try to alleviate this excess, apart from public awareness and police control, would be to equip each parking space with a light and a presence sensor that, after 30 minutes, begins to flash to indicate that the vehicle is illegally parked due to exceeding the time limit.
3.5. OEE Calculation
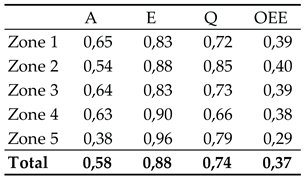
Finally, with all factors analysed separately, the OEE will be evaluated, also broken down by the types analysed above. The OEE formula is applied as shown in Table 15:
OEE = A x E x Q
It can be seen that zone 5 has a significantly lower OEE than the others, and in reference to the overall OEE. In general, a value of 0.37 is very low. The result suggests that there is significant margin for improvement in the area. One interpretation could be that the areas analysed as a whole are only achieving 37% of the targets set by the city's governance and that improvement measures should be established to address the 63% of non-compliance.
The OEE by time slot, in Table 16:

Table 16.
OEE by time slot.
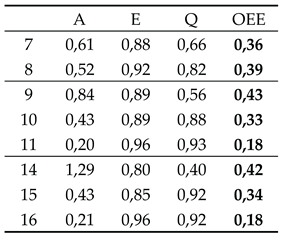 |
The analysis of the OEE per hour of use shows that afternoon hours have the lowest ratio, which may suggest that these time slots are not the most suitable for loading and unloading. It can also be seen that the OEE is much lower in the final slots of the reserved time, which is probably influenced by the fact that the start time is taken as a reference. The OEE per day of the week, in Table 17:
Table 17.
OEE by day of the week.
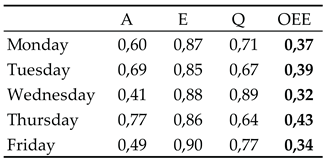 |
Finally, the OEE per day of the week shows that Wednesdays and Fridays are when the indicator is lowest, which could lead to a reconsideration of the schedules assigned based on the day of the week.
4. Discussion
It is no surprise that the illegal occupation of LUZs by private non-commercial vehicles and excessive use by transport operators are the main causes of poor LUZ performance. One of the contributions of this work is the proposal of a methodology to quantitatively evaluate and enable the comparison of the behaviour of an area or set of areas using the OEE indicator. To do this, the key is the introduction of the new weighted occupancy time KPI, in which each vehicle contributes its length in the period of time it is using the area.
Evaluating separately and then jointly the availability of each zone, its occupation efficiency, and the quality of deliveries in terms of completion within the time allowed is very valuable information for decision-making. Similarly, being able to evaluate each zone separately, as well as the performance of the zones based on booking times and days of the week, also provides relevant information for checking the performance of the zone. Finally, temporal versatility is also an important factor. Each zone can be evaluated in a morning or afternoon slot, a full day, a week, a month or any other time frame.
Focusing on the illegal ocupation, it should be noted that in Zone 1, only 7.7% of the area is dedicated to LUZ (13 m of the 168 m dedicated to free street parking), in Zone 2, 5.7% (10 m of the 173 m of regulated parking on the avenue) and in Zones 3, 4 and 5, 21.8% (18 + 10 + 8 of the 165 m of street space). It is a significant finding that of the 472 instances of illegal parking observed in zone 1 (a one-way street with the possibility of double parking), 38.77% (183) were double parking and only 3.81% (18) were illegal parking in front of garage doors, on pavements or pedestrian crossings, while in streets in zones 3, 4 and 5, where double parking is not possible, illegal parking accounted for 17.22% (140 out of 813). The street with the three zones and three times the space reserved for LUZ compared to the street in zone 1 has three times the illegal parking, indicating that the impossibility of double parking leads to a significant increase in illegal parking in unauthorised areas, regardless of the size of the space reserved for LUZ on the street.
The field study carried out shows that the use of free parking by private vehicles and inconsiderate transport operators leads to poor management of the LUZ, as well as generating externalities such as double parking and the illegal occupation of pedestrian crossings, garage doors and intersection islands. However, this study has detected deliveries by delivery drivers, especially from the HORECA sector, who double park even when there are spaces available in the LUZ, in order to avoid walking distances and due to the heavy weight of the goods they have to deliver.
The proposed KPIs are applicable in urban environments in any area of the city and allow for the evaluation of the suitability of the location and size of the area. They can be used for a single area or to compare a set of areas. These parameters and the proposed methodology respond to the limitations that other authors have expressed in the literature discussed throughout the article. This method of calculating the OEE indicator is valid for any city, for an area or for a set of areas, and is therefore considered a very useful tool for city governance. As a general rule, both the location and size of the space reserved for LUZ, as well as the time allocated for loading and unloading, in cities are generally applied in a generalised manner and without objective and quantifiable criteria for measuring them. With this proposed methodology, city governance could make decisions on the suitability of urban mobility regulations, and it could be applied especially to low-emission zones for better use.
The main limitation of this study is the problem of data collection, which in this study was manual, tedious and thorough, and could be standardised and automated with artificial vision cameras that could identify the type of vehicle by its dimensions or by reading number plates in connection with the Directorate General of Traffic (DGT). In this case, the OEE could be calculated automatically and evaluated in real time by the city's governance system.
5. Conclusions
One of the main contributions of this article is the proposal and characterisation of a new weighted occupancy time KPI, which serves as the basis for calculating the values of the availability, performance and quality factors that are used to evaluate OEE. This is a very important contribution, as it indicates the time that the length of the transport element occupies the area compared to the total occupation time and serves as the basis for calculating OEE.
The literature review identified the need for measurements of these occupancy levels, but no study indicated how to take these measurements. The studies analysed also pointed to the need to standardise these measurements, as well as segmentation, occupancy rates, average parking duration and indirect parking problems. All these needs can be addressed through OEE analysis based on weighted occupation time.
Proper standardisation of data collection and analysis of the data obtained using the proposed methodology would provide city authorities with a decision-making tool to try to improve each of the OEE factors and thus achieve better use of street lighting, with the consequent reduction of negative externalities such as double parking and illegal occupation of spaces. Decisions could also be made, such as changing the location of an area or modifying the size allocated or the reservation times for the area.
In the future, research could be conducted on the impact of illegal parking, such as double parking or the illegal occupation of spaces reserved for public use, not only during the time reserved for loading and unloading but throughout the entire day, in order to assess the effect of expanding or reducing both the space reserved for loading and unloading and the time reserved for this purpose. Supporting what other authors have said, this study shows that flexibility is needed to make better use of the space and time allocated.
Another possible future study could be how to better optimise a LUZ without extending the weighted time in an area, i.e. without causing greater inconvenience to citizens, by reassessing the length of the areas and the times reserved. It could also be considered to reserve an area with different sections and different operating times. For example, an area with a certain length could be extended but with less time reserved, and a certain part of the length of the area could be dedicated to shorter operations, for example ten minutes. However, this would not be truly beneficial if there were no enforcement of the legal compliance of the spaces and times reserved.
Author Contributions
Conceptualisation, methodology, model generation and research, AGG and MPL; drafting and preparation of the original manuscript, AGG; writing, review and editing, MPL and PM; supervision, MPL and JR; project administration and management, JR and JCS. All authors have read and accepted the published revision of the manuscript.
Funding
This research received no external funding.
Institutional Review Board Statement
Not applicable.
Informed Consent Statement
Not applicable.
Data Availability Statement
The data presented in this study are available on request from the corresponding author.
Conflicts of Interest
Authors Paula Morella and Juan Carlos Sánchez were employed by the company TECNALIA. The other authors declare that the research was conducted in the absence of any commercial or financial relationship that could be interpreted as a potential conflict of interest.
Abbreviations
The following abbreviations are used in this manuscript:
| UDG | Urban Distribution of Goods |
| LUZ | Loading and Unloading Zones |
| OEE | Overall Equipment Effectiveness |
| PMV | Personal Mobility Vehicles |
References
- Ghizzawi, F.; Galal, A.; Roorda, M.J. Modelling Parking Behaviour of Commercial Vehicles: A Scoping Review. Transp Rev 2024, 44, 743–765. [Google Scholar] [CrossRef]
- Alho, A.R.; de Abreu e Silva, J.; de Sousa, J.P.; Blanco, E. Improving Mobility by Optimizing the Number, Location and Usage of Loading/Unloading Bays for Urban Freight Vehicles. Transp Res D Transp Environ 2018, 61, 3–18. [Google Scholar] [CrossRef]
- Amaya, J.; Encarnación, T.; Delgado-Lindeman, M. Understanding Delivery Drivers’ Parking Preferences in Urban Freight Operations. Transp Res Part A Policy Pract 2023, 176. [Google Scholar] [CrossRef]
- Alho, A.; Silva, J. de A. e; Sousa, J.P. de A State-of-the-Art Modeling Framework to Improve Congestion by Changing the Configuration/Enforcement of Urban Logistics Loading/Unloading Bays. Procedia Soc Behav Sci 2014, 111, 360–369. [Google Scholar] [CrossRef]
- Comi, A.; Moura, J.L.; Ezquerro, S. A Methodology for Assessing the Urban Supply of On-Street Delivery Bays. Green Energy and Intelligent Transportation 2022, 1. [Google Scholar] [CrossRef]
- Muñuzuri, J.; Cuberos, M.; Abaurrea, F.; Escudero, A. Improving the Design of Urban Loading Zone Systems. J Transp Geogr 2017, 59, 1–13. [Google Scholar] [CrossRef]
- Sun, S.Y.; Bi, R.H.; Wang, Z.Y.; Ji, Y. Loading and Unloading Points Identification Based on Freight Trajectory Big Data and Clustering Method. Promet - Traffic and Transportation 2023, 35, 148–160. [Google Scholar] [CrossRef]
- Martins-Turner, K.; Nagel, K. How Driving Multiple Tours Affects the Results of Last Mile Delivery Vehicle Routing Problems. In Proceedings of the Procedia Computer Science; Elsevier B.V., 2019; Vol. 151; pp. 840–845. [Google Scholar]
- Cao, J.; Menendez, M. Quantification of Potential Cruising Time Savings through Intelligent Parking Services. Transp Res Part A Policy Pract 2018, 116, 151–165. [Google Scholar] [CrossRef]
- Amaya, J.; Encarnación, T.; Delgado-Lindeman, M. Understanding Delivery Drivers’ Parking Preferences in Urban Freight Operations. Transp Res Part A Policy Pract 2023, 176. [Google Scholar] [CrossRef]
- Dalla Chiara, G.; Krutein, K.F.; Ranjbari, A.; Goodchild, A. Providing Curb Availability Information to Delivery Drivers Reduces Cruising for Parking. Sci Rep 2022, 12. [Google Scholar] [CrossRef]
- Castrellon, J.P.; Sanchez-Diaz, I.; Gil, J. Smart Loading Zones. A Data Analytics Approach for Loading Zones Network Design. Transp Res Interdiscip Perspect 2024, 24. [Google Scholar] [CrossRef]
- Dezi, G.; Dondi, G.; Sangiorgi, C. Urban Freight Transport in Bologna: Planning Commercial Vehicle Loading/Unloading Zones. In Proceedings of the Procedia - Social and Behavioral Sciences; Elsevier Ltd, 2010; Vol. 2; pp. 5990–6001. [Google Scholar]
- McLeod, F.; Cherrett, T. Loading Bay Booking and Control for Urban Freight. International Journal of Logistics Research and Applications 2011, 14, 385–397. [Google Scholar] [CrossRef]
- Ochoa-Olán, J. de J.; Betanzo-Quezada, E.; Romero-Navarrete, J.A. A Modeling and Micro-Simulation Approach to Estimate the Location, Number and Size of Loading/Unloading Bays: A Case Study in the City of Querétaro, Mexico. Transp Res Interdiscip Perspect 2021, 10. [Google Scholar] [CrossRef]
- Patier, D.; David, B.; Chalon, R.; Deslandres, V. A New Concept for Urban Logistics Delivery Area Booking. Procedia Soc Behav Sci 2014, 125, 99–110. [Google Scholar] [CrossRef]
- Mor, A.; Speranza, M.G.; Viegas, J.M. Efficient Loading and Unloading Operations via a Booking System. Transp Res E Logist Transp Rev 2020, 141. [Google Scholar] [CrossRef]
- Ni, X.Y.; Sun, D. Agent-Based Modelling and Simulation to Assess the Impact of Parking Reservation System. J Adv Transp 2017, 2017. [Google Scholar] [CrossRef]
- Kalahasthi, L.K.; Sánchez-Díaz, I.; Pablo Castrellon, J.; Gil, J.; Browne, M.; Hayes, S.; Sentís Ros, C. Joint Modeling of Arrivals and Parking Durations for Freight Loading Zones: Potential Applications to Improving Urban Logistics. Transp Res Part A Policy Pract 2022, 166, 307–329. [Google Scholar] [CrossRef]
- Ghizzawi, F.; Galal, A.; Roorda, M.J. Modelling Parking Behaviour of Commercial Vehicles: A Scoping Review. Transp Rev 2024, 44, 743–765. [Google Scholar] [CrossRef]
- Comi, A.; Buttarazzi, B.; Schiraldi, M.M.; Innarella, R.; Varisco, M.; Rosati, L. DynaLOAD: A Simulation Framework for Planning, Managing and Controlling Urban Delivery Bays. In Proceedings of the Transportation Research Procedia; Elsevier B.V., 2017; Vol. 22; pp. 335–344. [Google Scholar]
- Castrellon, J.P.; Sanchez-Diaz, I.; Gil, J. Smart Loading Zones. A Data Analytics Approach for Loading Zones Network Design. Transp Res Interdiscip Perspect 2024, 24. [Google Scholar] [CrossRef]
- Alho, A.R.; de Abreu e Silva, J.; de Sousa, J.P.; Blanco, E. Improving Mobility by Optimizing the Number, Location and Usage of Loading/Unloading Bays for Urban Freight Vehicles. Transp Res D Transp Environ 2018, 61, 3–18. [Google Scholar] [CrossRef]
- Comi, A.; Moura, J.L.; Ezquerro, S. A Methodology for Assessing the Urban Supply of On-Street Delivery Bays. Green Energy and Intelligent Transportation 2022, 1. [Google Scholar] [CrossRef]
- Ochoa-Olán, J. de J.; Betanzo-Quezada, E.; Romero-Navarrete, J.A. A Modeling and Micro-Simulation Approach to Estimate the Location, Number and Size of Loading/Unloading Bays: A Case Study in the City of Querétaro, Mexico. Transp Res Interdiscip Perspect 2021, 10. [Google Scholar] [CrossRef]
- Wilson, M.; Janjevic, M.; Winkenbach, M. Modeling a Time-Differentiated Policy for Management of Loading Bays in Urban Areas. Research in Transportation Business and Management 2022, 45. [Google Scholar] [CrossRef]
- Alho, A.; Silva, J. de A. e; Sousa, J.P. de A State-of-the-Art Modeling Framework to Improve Congestion by Changing the Configuration/Enforcement of Urban Logistics Loading/Unloading Bays. Procedia Soc Behav Sci 2014, 111, 360–369. [Google Scholar] [CrossRef]
- Castrellon, J.P.; Sanchez-Diaz, I. Effects of Freight Curbside Management on Sustainable Cities: Evidence and Paths Forward. Transp Res D Transp Environ 2024, 130. [Google Scholar] [CrossRef]
- McLeod, F.; Cherrett, T. Loading Bay Booking and Control for Urban Freight. International Journal of Logistics Research and Applications 2011, 14, 385–397. [Google Scholar] [CrossRef]
- Dezi, G.; Dondi, G.; Sangiorgi, C. Urban Freight Transport in Bologna: Planning Commercial Vehicle Loading/Unloading Zones. In Proceedings of the Procedia - Social and Behavioral Sciences; Elsevier Ltd, 2010; Vol. 2; pp. 5990–6001. [Google Scholar]
- Sanchez-Diaz, I.; Palacios-Argüello, L.; Levandi, A.; Mardberg, J.; Basso, R. A Time-Efficiency Study of Medium-Duty Trucks Delivering in Urban Environments. Sustainability (Switzerland) 2020, 12. [Google Scholar] [CrossRef]
- Les, A.; Morella, P.; Lambán, M.P.; Royo, J.; Sánchez, J.C. A New Indicator for Measuring Efficiency in Urban Freight Transportation: Defining and Implementing the OEEM (Overall Equipment Effectiveness for Mobility). Applied Sciences (Switzerland) 2024, 14. [Google Scholar] [CrossRef]
- Muriel, J.E.; Zhang, L.; Fransoo, J.C.; Perez-Franco, R. Assessing the Impacts of Last Mile Delivery Strategies on Delivery Vehicles and Traffic Network Performance. Transp Res Part C Emerg Technol 2022, 144. [Google Scholar] [CrossRef]
- De Marco, A.; Cagliano, A.C.; Mangano, G.; Perfetti, F. Factor Influencing Logistics Service Providers Efficiency’ in Urban Distribution Systems. In Proceedings of the Transportation Research Procedia; Elsevier, 2014; Vol. 3; pp. 499–507. [Google Scholar]
- Castrellon, J.P.; Sanchez-Diaz, I.; Kalahasthi, L.K. Enabling Factors and Durations Data Analytics for Dynamic Freight Parking Limits. Transp Res Rec 2023, 2677, 219–234. [Google Scholar] [CrossRef]
- Ezquerro, S.; Moura, J.L.; Alonso, B. Illegal Use of Loading Bays and Its Impact on the Use of Public Space. Sustainability (Switzerland) 2020, 12. [Google Scholar] [CrossRef]
- Ludowieg, A.R.; Sanchez-Diaz, I.; Kalahasthi, L.K. Using Machine Learning to Predict Freight Vehicles’ Demand for Loading Zones in Urban Environments. Transp Res Rec 2023, 2677, 829–842. [Google Scholar] [CrossRef]
- dos Santos Junior, J.L.; de Oliveira, L.K. Analysis of the Level of Service of Unloading Zones Using Diversity Measures in a Multiplex Network. Sustainability (Switzerland) 2020, 12. [Google Scholar] [CrossRef]
- Nourinejad, M.; Wenneman, A.; Habib, K.N.; Roorda, M.J. Truck Parking in Urban Areas: Application of Choice Modelling within Traffic Microsimulation. Transp Res Part A Policy Pract 2014, 64, 54–64. [Google Scholar] [CrossRef]
- T; Organization: Rensselaer Polytechnic Institute Impacts of Freight Parking Policies in Urban Areas: The Case of New York City . 2016.
- Roca-Riu, M.; Cao, J.; Dakic, I.; Menendez, M. Designing Dynamic Delivery Parking Spots in Urban Areas to Reduce Traffic Disruptions. J Adv Transp 2017, 2017. [Google Scholar] [CrossRef]
- Wilson, M.; Janjevic, M.; Winkenbach, M. Modeling a Time-Differentiated Policy for Management of Loading Bays in Urban Areas. Research in Transportation Business and Management 2022, 45. [Google Scholar] [CrossRef]
- Muñoz-Villamizar, A.; Santos, J.; Montoya-Torres, J.R.; Jaca, C. Using OEE to Evaluate the Effectiveness of Urban Freight Transportation Systems: A Case Study. Int J Prod Econ 2018, 197, 232–242. [Google Scholar] [CrossRef]
- Muchiri, P.; Pintelon, L. Performance Measurement Using Overall Equipment Effectiveness (OEE): Literature Review and Practical Application Discussion. Int J Prod Res 2008, 46, 3517–3535. [Google Scholar] [CrossRef]
- SANZ, G.; PASTOR, R.; BENEDITO, E. DISTRIBUCIÓN URBANA DE MERCANCÍAS: DESCRIPCIÓN Y CLASIFICACIÓN DE SOLUCIONES EXISTENTES E IMPLEMENTACIÓN DE DOS SOLUCIONES NOVEDOSAS. Dyna (Medellin) 2013, 80, 6–13. [Google Scholar]
- Castrellon, J.P.; Sanchez-Diaz, I. Effects of Freight Curbside Management on Sustainable Cities: Evidence and Paths Forward. Transp Res D Transp Environ 2024, 130. [Google Scholar] [CrossRef]
- Ortolani, C. PARAMETRIC MODELLING OF FREIGHT NETWORKS: OPERATIONAL AND ENVIRONMENTAL COSTS. 2023.
- Corrales, L. del C.N.; Lambán, M.P.; Hernandez Korner, M.E.; Royo, J. Overall Equipment Effectiveness: Systematic Literature Review and Overview of Different Approaches. Applied Sciences 2020, Vol. 10, Page 6469 2020, 10, 6469. [Google Scholar] [CrossRef]
- Teodorović, D.; Lučić, P. Intelligent Parking Systems. Eur J Oper Res 2006, 175, 1666–1681. [Google Scholar] [CrossRef]
- Marcucci, E.; Gatta, V.; Scaccia, L. Urban Freight, Parking and Pricing Policies: An Evaluation from a Transport Providers’ Perspective. Transp Res Part A Policy Pract 2015, 74, 239–249. [Google Scholar] [CrossRef]
- CITYlogin Inaugura En Zaragoza Un Microhub Para El Reparto Urbano Sostenible.
- BDM, R. Prueba Piloto de Los Primeros Robots Autónomos de Reparto En Zaragoza - Big Data Magazine.
- Caravia, S. Zaragoza, Epicentro de La Nueva Movilidad Con El Proyecto Digizity.
- DGT, M. interior VI Encuentro de Ciudades En Zaragoza, Ciudades 2030.
- DGT, M. interior Zaragoza Acoge La VI Edición Del Encuentro de Ciudades Organizado Por La Dirección General de Tráfico.
- Turrubia, M. UrbanDUM 4.0 Fase 2: Distribución Urbana, Inteligente y Sostenible de Mercancías | ALIA - Clúster Logístico Aragón.
- Abierto, O. de T. y G. Revisión Del Plan de Movilidad Urbana Sostenible de Zaragoza. Ayuntamiento de Zaragoza.
- Abierto, O. de T. y G. Datos Abiertos. Gobierno Abierto. Ayuntamiento de Zaragoza.
- Abierto, O. de T. y G. Reserva de Espacios Para Carga y Descarga. Datos Abiertos. Ayuntamiento de Zaragoza.
- ORDENANZA_MOVILIDAD_URBANA_def.
Figure 1.
Chart of the OEE model applied to a loading and unloading area.
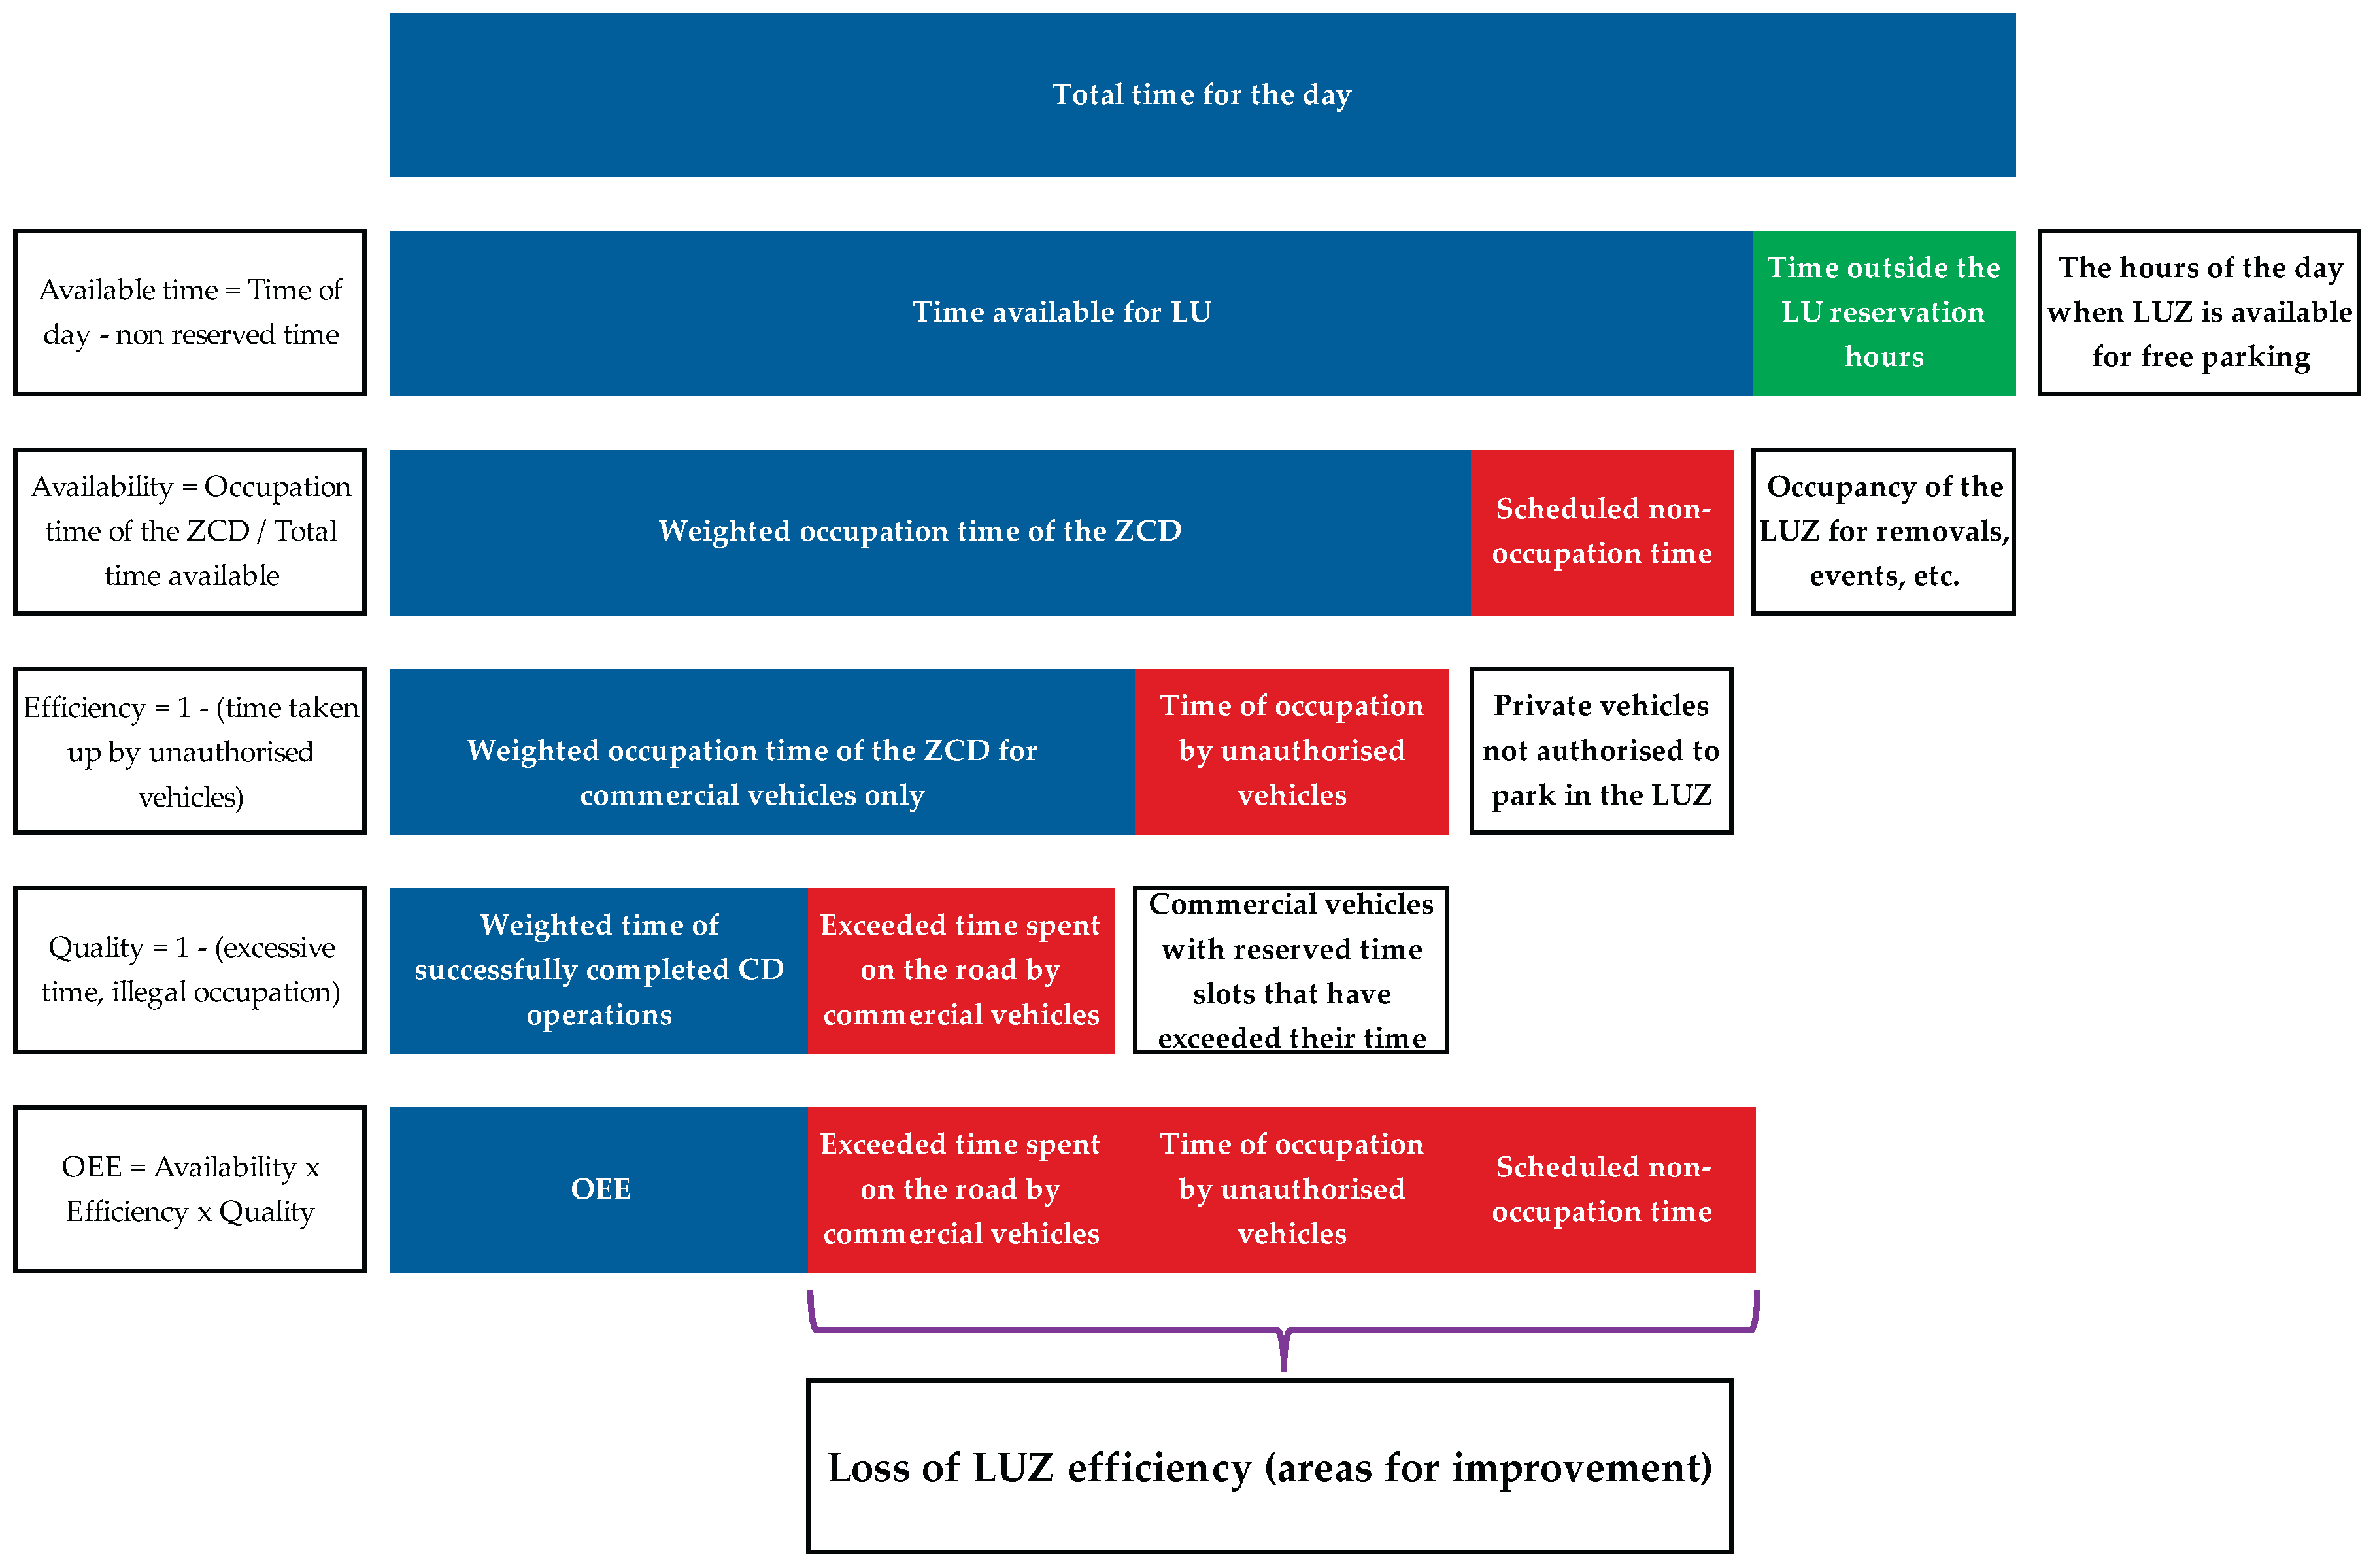
Figure 2.
Chart of the OEE model applied to a loading and unloading area.
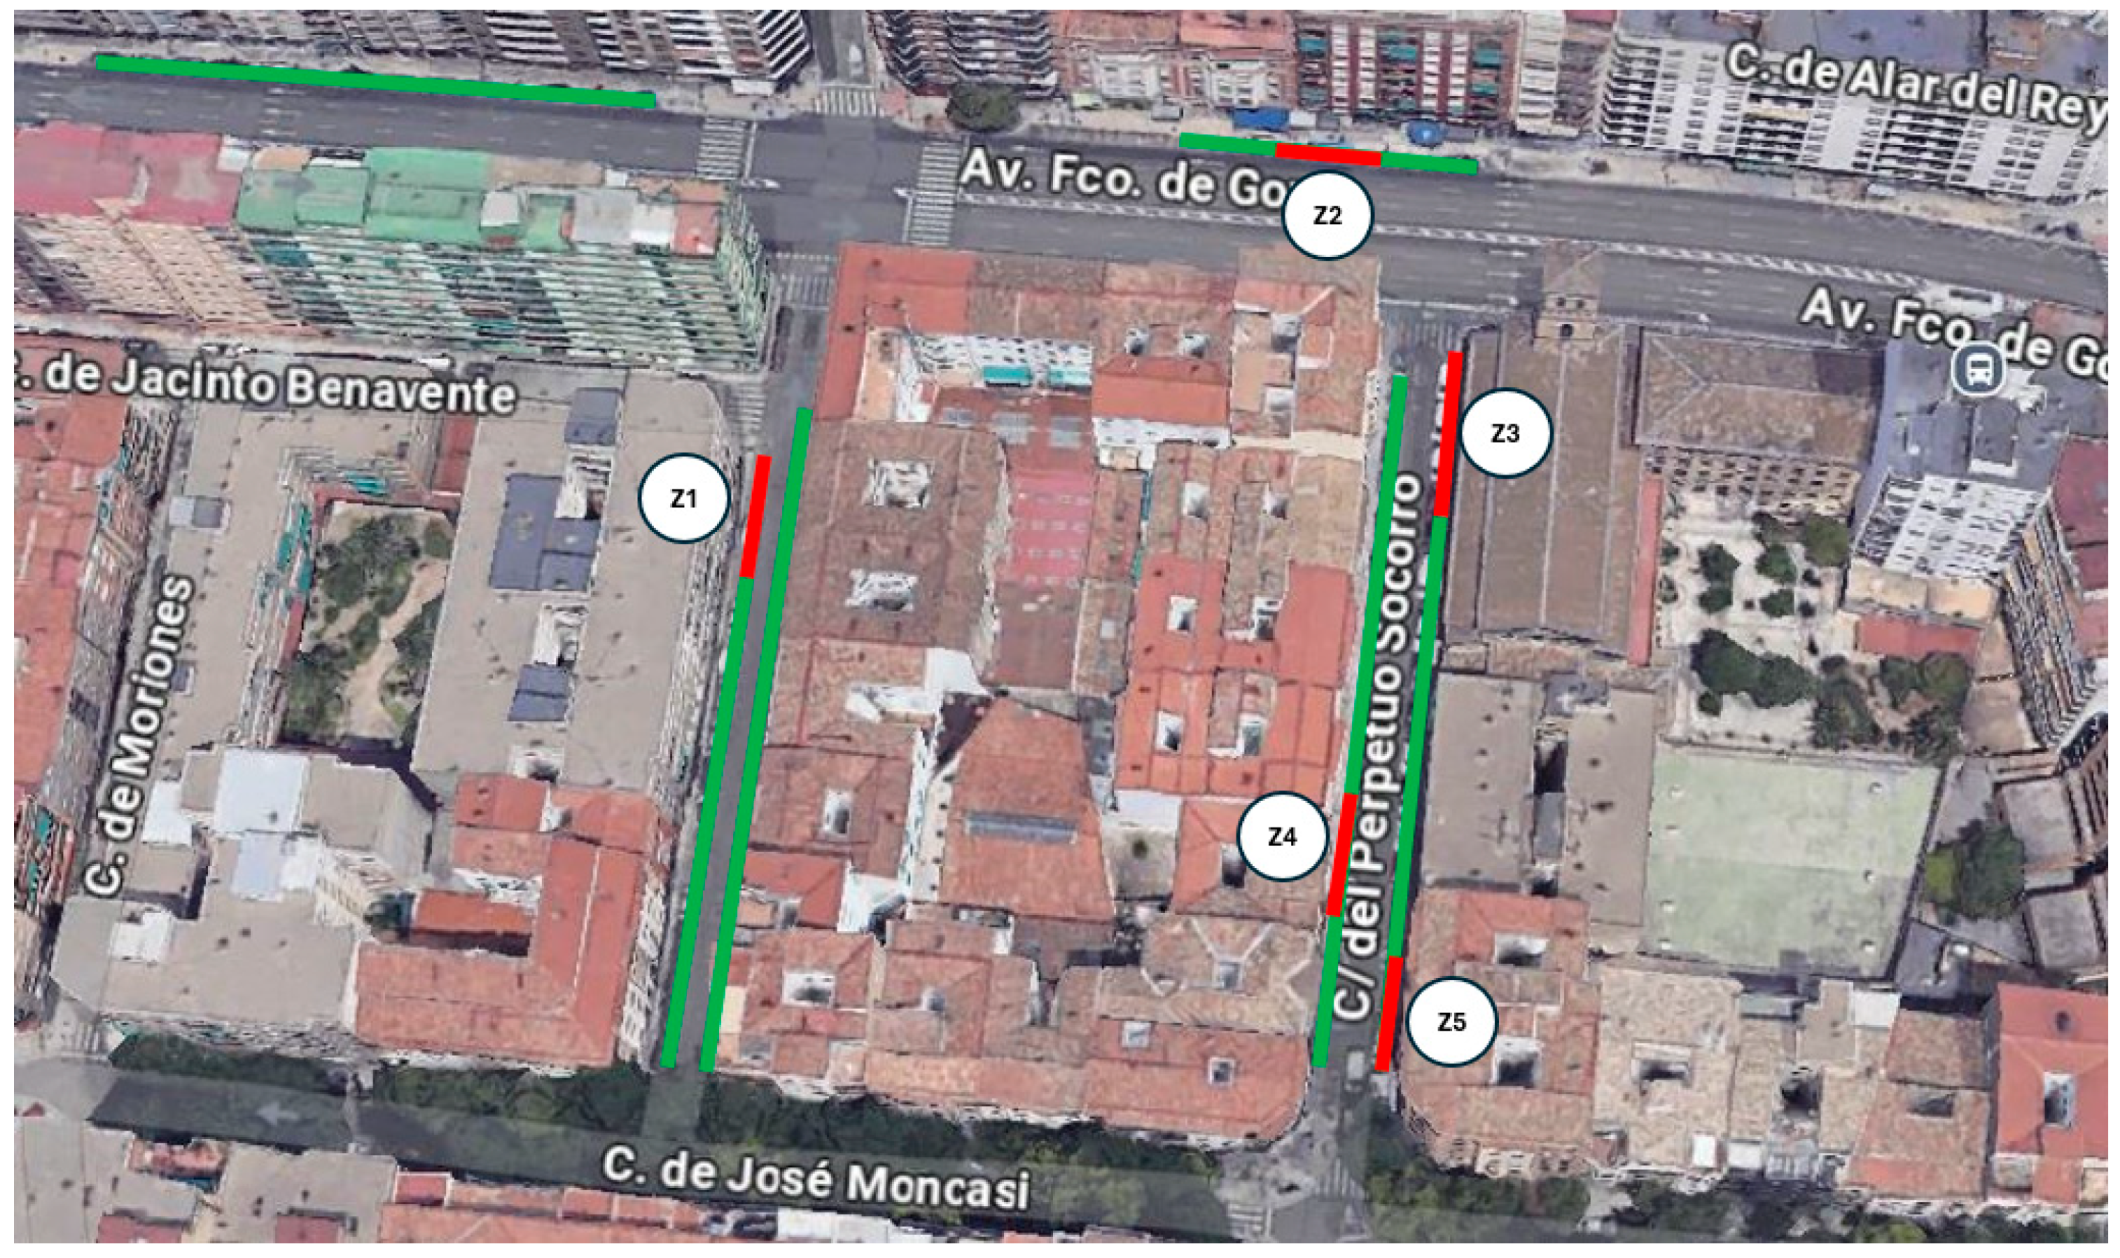
Table 1.
KPIs detected in the literature.
| KPIs related to the delivery process | Fuente |
| Average parking duration | [11,16,19–23] |
| Vehicle arrival rate | [17,19,24,25] |
| Average delivery time | [20,25–30] |
| Average waiting time (cruising) | [10,11,17,18,20,21,24] |
| Number of deliveries made | [10,16,22,25,26,30–32] |
| % of deliveries during peak vs. off-peak hours | [26,30] |
| Deliveries not made on time | [33,34] |
| Occupancy rate of places s / total available | [16–19,21–24,26,28,33,35] |
| Type and capacity of vehicles | [10,11,18–20,23,29,30,35,36] |
| Number of vehicles entering the area | [10,11,18–20,23,29,30,35][36] |
| Day of the week | [19] |
| Time of arrival/departure | [17,19,20,34,35,37] |
| Professional activity (sector) | [19,20,27,35] |
| Type of cargo, weight, and volume | [19,24,34] |
| KPIs related to LUZ | Fuente |
| Number of delivery bays required | [16,17,23–27,36,38] |
| Size of loading bays | [16–18,22,23,25–27,36,37] |
| Location and availability of LUZ | [11,16,17,22,23,25,27,29,30,33,36,38] |
| Walking distance | [10,11,18,22,26,30,38,39] |
| Frequency of use of loading areas (rotation) | [19,24,26,35] |
| KPIs auxiliaries | Fuente |
| kg per person consumed in an area | [40] |
| Average emissions per vehicle | [19,22,27] |
| Impact of external events | [33] |
| Parking costs | [10,18,27,33] |
| LUZ demand | [17,21,22,29,31] |
| LUZ parking space reservation | [17,18,29] |
| KPIs about externalities | Fuente |
| Number of double-parked vehicles | [10,17,23,26,28,29,33] |
| Location of double-parked vehicles | [11,21,23,30][23][17,36,41] |
| Illegality rate by vehicle type and duration | [19,23,27,36] |
| Percentage of unauthorized vehicles in LUZ | [36] |
Table 2.
Loading and unloading operations observed in the areas.
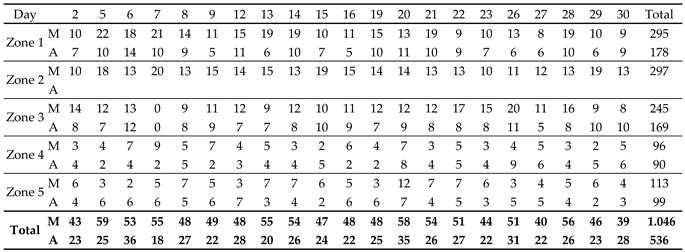 |
Table 3.
Data observed in total operations.
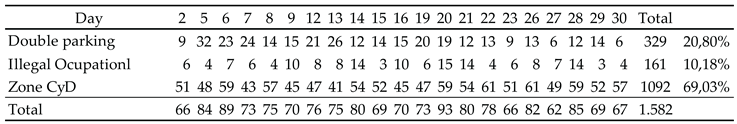 |
Table 4.
Data observed in operations only in the loading and unloading areas.
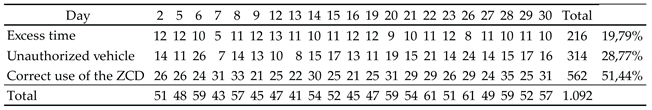 |
Table 5.
Total operations recorded by vehicle type.
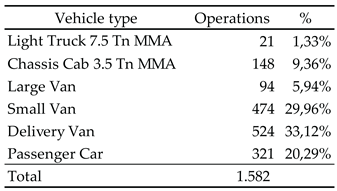 |
Table 6.
Availability factor by zone.
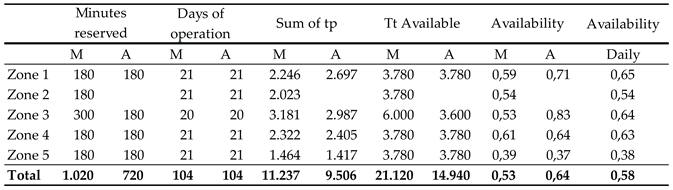 |
Table 7.
Availability by time slot.
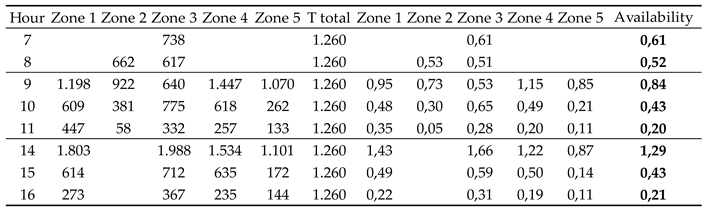 |
Table 8.
Availability by day of the week.
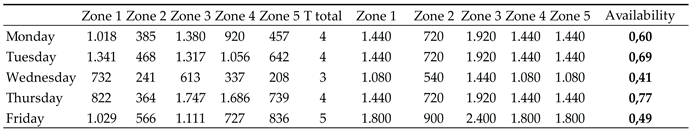 |
Table 9.
Efficiency by zone.
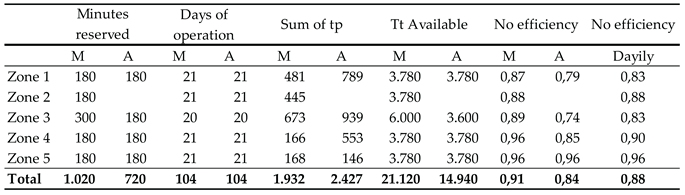 |
Table 10.
Efficiency by time slot.
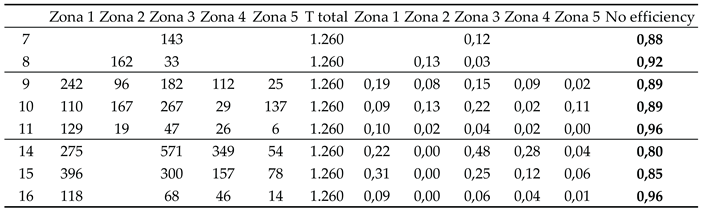 |
Table 11.
Efficiency by day of the week.
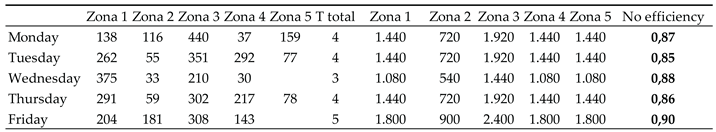 |
Table 12.
Quality by zone.
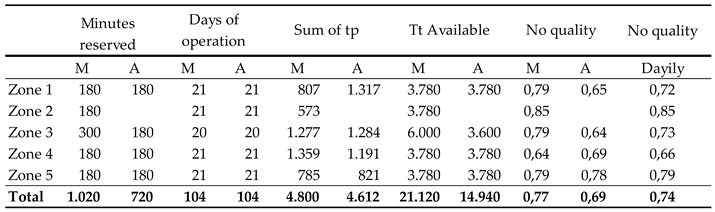 |
Table 13.
Quality by time slot.
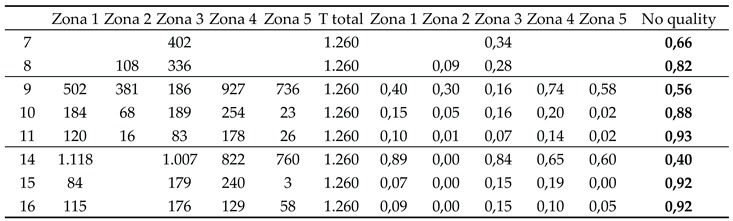 |
Table 14.
Quality by day of the week.
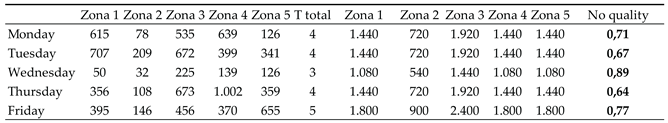 |
Table 15.
OEE by zone calculation.
 |
Disclaimer/Publisher’s Note: The statements, opinions and data contained in all publications are solely those of the individual author(s) and contributor(s) and not of MDPI and/or the editor(s). MDPI and/or the editor(s) disclaim responsibility for any injury to people or property resulting from any ideas, methods, instructions or products referred to in the content. |
© 2025 by the authors. Licensee MDPI, Basel, Switzerland. This article is an open access article distributed under the terms and conditions of the Creative Commons Attribution (CC BY) license (http://creativecommons.org/licenses/by/4.0/).
Copyright: This open access article is published under a Creative Commons CC BY 4.0 license, which permit the free download, distribution, and reuse, provided that the author and preprint are cited in any reuse.


