
Submitted:
26 April 2023
Posted:
28 April 2023
You are already at the latest version
Abstract
The study aims to investigate Gen Z's intentions to utilize the Waze mobile application as a solution for sustainable traffic management in Meto Manila. The extended Technology Acceptance Model (TAM) was used to define user behavior and technology usage to determine the factors influencing Filipino drivers' application acceptance of Waze. The study’s data results have revealed that the System Quality, Perceived Location Accuracy, Perceived Usefulness, and Perceived Ease of Use affect Filipinos' intentions to use traffic navigation applications, particularly Waze. The study utilized a survey and was given to 300 Filipino drivers traveling within the National Capital Region to accurately measure the factors and their connections to usage intention and actual use. The analytical approach used for this investigation was partial least squares structural equation modeling (PLS-SEM). The study's results can be applied as a theoretical framework for future researchers of Waze mobile applications, Waze route accuracy, and Waze overall application performance, as well as the features of the Waze application, to evaluate how the use of the Waze mobile application could help in the effective management of traffic situations in Metro Manila. The study was able to assess the effectiveness of the Waze navigation app as a platform for efficiently managing traffic situations in Metro Manila. Moreover, this study also highlighted the application performance of Waze and its acceptance by Filipino drivers in Metro Manila. Furthermore, the study implores a critical review of Waze's application performance. The study recommends that similar future studies must consider samples from a more diverse geographic background to obtain a more accurate representation of Filipinos traveling. Future researchers are also advised to adopt a qualitative research design to gain more detailed insights of Filipinos regarding their experience with the Waze application.
Keywords:
Waze Mobile Application
; Technology Acceptance Model
; Structural Equation Modeling
1. Introduction
Sustainable traffic management is the practice of effectively managing traffic flow and reducing the negative environmental impacts of transportation systems. This involves implementing strategies and initiatives that prioritize sustainability and promote more eco-friendly modes of transportation [1]. According to Diliman [2], in promoting sustainable traffic management, traffic navigation apps can reduce travel time, fuel consumption, and greenhouse gas emissions, while improving safety and mobility. A study by Noerkaisar et al. [3] finds that traffic navigation app like Waze app helps drivers navigate through the city's complex road network and improves their overall travel experience. Waze data, according to Silva et al., [4] can provide valuable insights into traffic patterns and help traffic managers make more informed decisions. A study by Laor and Galily [5] examines user behavior and motivations in the use of Waze, and finds that Waze users are motivated by convenience, time savings, and the sense of community that comes with crowdsourcing traffic data.
Traffic congestion has been a perennial issue throughout the cities, and Metro Manila is the best example. This circumstance resulted in several negative feedback about transportation safety and mobility in the Philippines. According to annual traffic index, Metro Manila ranked 18th as the most congested city in the world, with an average congestion level of 43% in 2021 [6]. The poor mass public transportation and exasperated traffic volume consumes 30% of their time daily, which they can use more productively. Palmiano et al. [7] pointed out that since the locations of new commercial developments in Metro Manila significantly follow the expansions of an urban transportation system, it is necessary to plan and control the developments more carefully.
Considering the traffic situation in Metro Manila, most Filipino drivers have equipped themselves with mobile navigation applications to help them reach their destination and avoid traffic jams along the way. Three mobile traffic applications demonstrated their value to Metro Manila drivers based on their satisfaction levels: Waze, Google Maps, and Apple Maps [8]. Based on a study by Yamsaengsung [9], these apps have similar completeness, concise representation, and consistent representation levels. Despite the similarities between the applications, Waze's user interface provided more accessible access to relevant information in the scenarios discussed and the overall relevancy of the provided information by the application. In accordance with everything that has been stated so far, this research aims to assess whether the Waze navigation app is an effective platform for the efficient management of traffic situations in Metro Manila. This study also highlighted the application performance of Waze and its acceptance to Gen Z drivers in Metro Manila. Furthermore, the study implores to critically review the application performance of Waze.
2. Conceptual Framework
Technology Acceptance Model (TAM) is a reliable model for examining the acceptability of new technologies [10,11] and defining user behavior and technology usage [12]. Because TAM was frequently investigated in the context of other technologies unrelated to traffic navigation applications, the present study intends to explore other constructs related to driver acceptability by extending the fundamental TAM model. First, the independent variables from the original TAM model were chosen to indicate consumers' intention to use the traffic navigation application: perceived usefulness (PU) and perceived ease of use (PE). In this study, it is assumed that if traffic navigation apps are valuable in the eyes of the user, the user will also believe that the applications are simple to use and will eventually plan to utilize the applications. The two parameters that have the most significant impact on user approval are attitude (AT) and perceived usability (PU) [13]. Additionally, if the users believe that the traffic navigation applications are simple to use, meaning that they can be quickly launched while they are in the driver's seat, and if the interaction process with the human-machine interface is straightforward and beneficial for a driving experience, the users will demonstrate a positive attitude (AT) and a high likelihood of accepting the applications. However, this study is limited to the actual use variable because it was outside the purview of this study, and the traffic navigation applications are currently not fundamental parts of all vehicle types. As the model's target variable, the intention to utilize traffic navigation apps (BI) is chosen to represent users' or drivers' actual system usage.
By using the extended Technology Acceptance Model (TAM), this study explores the variables that affect the Filipinos' behavior intentions to use traffic navigation applications, particularly Waze. As shown in Figure 1, the suggested model identifies seven variables: System Quality (SQ), Perceived Location Accuracy (PLA), Perceived Usefulness (PU), Perceived Ease of Use (PEU), Attitude (AT), Usage Intention (UI), and Actual Use (AU).
2.1. Determinants of Traffic Navigation App Usage
System quality is often based on an information system's accuracy, comprehensiveness, timeliness, and presentation format. According to prior research on drivers' responses to traffic information, these attributes are the key factors for the determinants of traffic information quality. As Ben-Elia et al. [14] demonstrated, the compliance rate can be enhanced by giving travelers accurate information. A user's view of the usefulness increases when reliable information is made available to aid decision-making and better travel planning. Earlier investigations also corroborated these connections. Thus, it was hypothesized that:
Hypothesis 1 (H1).
System quality has significant and positive effect on perceived usefulness.
Hypothesis 2 (H2).
System quality has significant and positive effect on perceived ease of use.
According to Peeta and Ramos [15], providing travelers with the location of the accident, projected delay, and best detour option is more beneficial than providing information on location alone. Thus, perceived location accuracy is another prerequisite for the effectiveness of traffic information systems. Park et al. [16] defined perceived location accuracy as the extent to which mobile map service users become aware of their exact locations on displayed maps. Users of mobile map services can view the maps to see where they are right now and their surroundings. The systems and services should also provide precise users' positions by calculating and supplying locational information immediately because the bulk of mobile map systems in mobile devices give their services in real-time. Therefore, users are likely to consider mobile map systems and services more valuable if they have superior locational accuracy and efficiency. As a result, this study proposes that:
Hypothesis 3 (H3).
Perceived location accuracy has significant and positive effect on perceived usefulness.
Hypothesis 4 (H4).
Perceived location accuracy has significant and positive effect on perceived ease of use.
Perceived usefulness is the degree to which drivers believe traffic navigation will help them plan their travels. Relevance was one of the most prevalent measures of the use of traffic information in earlier studies on its effects [17]. They demonstrated that traffic data is significant if it directly affects how other road users behave. Perceived ease of use, on the other hand, refers to ideas like legibility, understandability, and ease of learning when describing how drivers respond to traffic information. Attitude is positively impacted by perceived ease of use. An app that is simple to use will take less time and effort to process. The driver's ability to use the knowledge quickly and shift their attention to other driving activities will help them perform better. Previous research on drivers' acceptance of road guidance systems [18,19,20] supports this finding.
Hypothesis 5 (H5).
Perceived usability has significant and positive effect on attitude.
Hypothesis 6 (H6).
Perceived ease of use has significant and positive effect on attitude.
Hypothesis 7 (H7).
Attitude has significant and positive effect on usage behavior.
Hypothesis 8 (H8).
Usage behavior has significant and positive effect on actual use.
3. Methodology
3.1. Setting
Due to the continuous growth of Waze users in the Philippines, this study employed a convenience sampling technique. This technique is suitable for this study because it uses convenience as the primary basis for selecting the sample for a large population [21]. The target respondents of this research are the Waze application users traveling within the National Capital Region.
3.2. Participants and Sampling Technique
In this study, a non-probability sampling technique, specifically convenience sampling through an online survey, was used. The aim was to gather responses from Waze users located in the National Capital Region. As per Yamane's research [22], which recommends a minimum sample size of 300 to achieve a 10% margin of error, the expected minimum number of respondents was set at 300. The summary of demogaphic profile I shown in Table 1.
3.3. Instrumentation
To conduct the online survey, a self-administered approach was utilized, which involved distributing the questionnaire via Google Form. This method enabled the respondents to answer the questions on their own, without any assistance from the researchers. The questionnaire was designed using multiple cross-sectional designs, which allowed for a broader range of data to be collected.
The survey link was sent to the intended participants for a duration of two months. This provided ample time for the respondents to complete the questionnaire at their convenience, thereby ensuring a higher response rate. The online survey was presented in the English language, which was the preferred language for the target respondents.
The survey consists of 30-item questions. The respondent's demographics were determined in the first section of the questionnaire using 6-item questions, including age, gender, civil status, area of residence, and how long they have been using the Waze app.
The second part of the questionnaire consists of the indicators based on the extended TAM model: system quality, perceived location accuracy, perceived usefulness, and perceived ease of use. This will measure users' perceived intention to use the Waze app. The survey consists of item questions where all answers were on a 5-point Likert scale ranging from "strongly disagree" to "strongly agree". Six (6) latent will be used in the survey. The summary of measures and constructs is shown in Table 2. The items for the constructs were adopted from existing studies.
The questionnaire was briefly discussed with each respondent, and written consent was obtained. Following the Data Privacy Act or Republic Act No. 10173 in the Philippines, the respondents were asked to sign a consent form that says the responses and information they give will only be used for academic and research purposes. Before collecting data, the researchers also asked the Mapua University Research Ethics Committee for permission (application number FM-RC-21-89).
3.5. Data Analysis
The data that were collected from the survey were analyzed using multivariate analysis. In this study, the structural equation model (SEM) that was used is a variance-based partial least squares SEM (PLS-SEM) with maximum likelihood estimation. PLS-SEM is a tool for studying the relationships between abstract ideas [35]. It deals with complex constructs with higher levels of abstraction and produces higher construct reliability and validity, which makes it great for prediction [36] and useful in this study. Its main goal is to explain the variation in the dependent constructs as much as possible. The data quality is also judged based on the properties of the measurement model. According to Ouellette and Wood [37], PLS-SEM differs from previous modeling approaches since it considers both direct and indirect effects on presumptive causal links and is increasingly found in scientific investigations and studies. Also, PLS-SEM is the best method for coming up with new theories and making predictions, while CB-SEM is better for testing and proving theories that already exist [38]. Several fit indices was utilized to justify the model fit in this study using PLS-SEM, such as standardized root mean square residual (SRMR), normal fit index (NFI), and Chi-square. For SRMS, a value of less than 0.08 is considered a good fit [39]. For NFI, according to Baumgartner and Homburg [40], a value of 0.80 and above represents an acceptable fit, while for Chis-square, a value below 5.0 indicates a well-fitting model.
4. Results and Findings
Presented in Figure 2 is a representation of the model used to explore the variables that affect Filipinos' behavioral intention to use the Waze mobile application. The model is composed of 6 latent variables and 35 indicators which factor loading, reliability, and validity results are presented in Table 5. Before structural equation modeling was carried out, a validity and reliability test were done to ensure that the gathered data were sound and replicable and that the results were accurate [41]. The study utilized Cronbach's alpha, composite reliability, and average variance extracted tests to assess data sets' reliability and internal consistency in behavioral intention models [42]. According to Hamid et al. [43], the desired value for composite reliability and Cronbach's alpha is between 0.60 to 0.70. In contrast, for the average variance extracted test, at least a value of 0.50 is recommended [44]. As indicated in Table 3, all values satisfy the conditions of each test; therefore, each construct from this model can be considered valid and reliable.
In testing the proposed hypotheses of this study, partial least squares-structural equation modeling (PLS-SEM) was performed using SmartPLS v3.3.3. According to Hair [45], PLS-SEM is a standard approach for analyzing complex inter-relationships between observed and latent variables. Researchers prefer this modeling as the possibility to estimate very complex models and the method’s flexibility in terms of data requirements and measurement specification [35]. The results of the hypothesis test are presented in Table 4. Out of seven proposed hypotheses, six were proven to significantly affect the usage behavior and behavioral intentions of the Waze application. Furthermore, all six accepted hypotheses have a positive influence on perceived usefulness, perceived ease of use, usage intention, and actual use.
As recommended by Henseler et al. [46], the Fornell-Lacker criterion and the Heterotrait-Monotrait ratio of correlation were performed to prove the significant correlation between each factor discussed in the study. Discriminant validity measures the degree of differences between the overlapping constructs [35]. Henseler et al. [46] added that the Heterotrait-Monotrait ratio (HTMT) could achieve higher specificity and sensitivity rates in determining discriminant validity, followed by the Fornell-Lacker criterion. As presented in Table 5 and Table 6, the values are within the desired range, indicating satisfactory and convergent reliability. Hence, the overall results among the constructs are valid.

Table 5.
Discriminant Validity: Fornell-Larcker Criterion.
| AU | PLA | PEU | PU | SQ | UI | |
|---|---|---|---|---|---|---|
| AU | 0.908 | |||||
| PLA | 0.650 | 0.770 | ||||
| PEU | 0.626 | 0.560 | 0.798 | |||
| PU | 0.622 | 0.648 | 0.638 | 0.766 | ||
| SQ | 0.592 | 0.674 | 0.594 | 0.675 | 0.810 | |
| UI | 0.663 | 0.713 | 0.560 | 0.623 | 0.591 | 0.827 |
Presented in Figure 2 is the final SEM model; no indicator was removed from the model as it exceeded the 0.50 minimum value explained by Joseph Hair. In assessing the validity of the suggested model, a model fit analysis was performed consisting of SRMR, Chi-square, and NFI, using the parameters from a study by Hu and Bentler [39]. As shown in Table 7, all parameter estimates exceeded the minimum threshold value, confirming the proposed model's validity.
5. Discussion
It can be seen in the result of Table 4 that six hypotheses were accepted to have a positive influence including system quality (SQ) to perceived usefulness (PU) and perceived ease of use (PEU), perceived location accuracy (PLA) to perceived usefulness (PU) and perceived ease of use (PEU), perceived ease of use (PEU) to usage intention (UI) and usage intention to actual use (AU).
System quality (SQ) was proved to have a significant and positive effect on perceived usefulness (PU) and perceived ease of use (PEU) of the Waze app, thereby supporting H1 and H2. This finding is supported by prior studies that proved that the quality of the app's system significantly impacts the app's perceived usefulness and ease of use [47,48]. Waze is a GPS-based navigation application that delivers real-time traffic information, suggested routes, and other features aimed to enhance the driving experience. According to Nelson et al. [49], the accuracy, clarity, timeliness, and presentation style of an information system are frequently the determinants of system quality. In the case of Waze, the quality of the system may be determined based on variables such as the precision of its mapping data, the dependability of its traffic updates, the quickness of its interface, and the consistency of its operation across various devices and operating systems. These criteria are the primary determinants of the quality of traffic information. According to a previous study on drivers' reactions to traffic information, giving travelers accurate information can increase compliance rate; when credible information is made available to assist in decision-making and better trip planning, a user's perception of the usefulness increases [50]. In addition, Hussain et al. [51] examined the effectiveness of perceived ease of use, and analyzed how users engage with the Waze app on mobile devices in sophisticated ways, and how usefulness, usability, and enjoyment are perceived as motivating factors. It explains why user acceptability of interactive mobile map technology varies. User engagement of interactive mobile maps is significantly positively influenced by perceived usefulness. Hence, if the Waze app has a high level of system quality, users are more likely to find the application useful and easy to use, as they can rely on its features to offer accurate and trustworthy information that facilitates more efficient navigation to their destination.
Perceived location accuracy (PLA) was also proved to have a significant and positive effect on perceived usefulness (PU) and perceived ease of use (PEU), thereby supporting H3 and H4. Waze is a popular navigation program that employs real-time user data to give drivers with information on traffic, road closures, accidents, and other pertinent information. According to Marzuki et al. [52], the perceived location accuracy and perceived usefulness of the offered information are two major variables that contribute to the success of the app. Mukul et al. [53] states that insights are more reliable if there is accuracy in location data. This is also confirmed by the study of Yamsaengsung & Papasratorn [44], which states that the usefulness of location accuracy impacts usefulness and the ease of use of the Waze app. During their test on tolls, the Waze app prominently offered the ETA on their initial screen. Since the Waze app has a color-coded representation of congestion on the app, this allowed drivers to visualize on which section of the route they should expect congestion. This also allows the drivers to choose a route with the shortest trip time, regardless of traffic. Also, since the Waze App shows both text and graph, it strengthens the app’s concise representation of the road. The traffic graph in Waze is considered helpful for selecting lighter traffic and resulting in shorter trip time. This level of accuracy in Waze helps with easy navigation for its users [44]. Overall, the perceived location accuracy, perceived usefulness and ease of use of the Waze app are significant contributors to its success and appeal. By providing users with accurate and pertinent information, the app enables them to navigate more effectively and with greater ease, resulting in an enhanced driving experience [52].
Perceived ease of use (PEU) was also proved to have a significant and positive effect on usage intention (UI), thereby supporting H6. This implies that drivers found the Waze app easy to utilize, and less time and effort are needed, gaining positive feedback from the drivers. The usage intention of interactive mobile apps is significantly positively influenced by perceived ease of use. David et al. [54] defined perceived ease of use as “the degree to which a person believes that using a particular system would be free of effort.” It has been shown to positively influence the usage of intention to utilize the Waze navigation system considering the criteria of legibility, understandability, and ease of learning from the obtained results describing a positive attitude from the drivers. In a study conducted by Hussain et al. [51], it was discovered that perceived ease of use predicts the intention to use the Waze application. The intuitive features of the Waze app allow users to rapidly enter their destination and obtain turn-by-turn directions. Waze is mainly used for navigation, and its goal is to help people get where they want to go as quickly and efficiently as possible. Users may quickly and simply input their destination, examine the scheduled arrival time, and receive voice-guided turn-by-turn directions, contributing to Waze's popularity. Thus, the usability of Waze is directly related to its intention, which is to give users a dependable and effective navigation tool that assists them in reaching their destination efficiently and reliably.
Usage intention (UI) was also found to have a significant and positive effect on actual use (AU), thereby supporting H7. This means that the significant positive attitude determined the driver’s acceptance of the Waze app technology, which provided the key to understanding their behavioral intention to use the navigation system. This evaluates that the user’s behavior is accepted under the scale of having a positive attitude and acceptance from the participants from the obtained results. According to Wang et al. [55], the usage intention refers to a user's intention to utilize the Waze app for navigation. Various variables may influence this intention, such as the user's prior experience with the app, recommendations from relatives or friends, or the desire to avoid traffic congestion [56]. On the other hand, actual use relates to whether a user utilizes the Waze app to navigate their trip [5]. This depends on a range of factors, such as whether the user finds technical difficulties with the app, whether they find the app's suggestions helpful, and whether they prefer an alternative navigation app or method [1].
On the contrary, perceived usefulness was found to have no direct and significant effect on usage intention, thereby rejecting H5. According to Vankatesh et al. [57], it is improbable that usage intention for Waze remains unimpacted by perceived usefulness, as it is a crucial element in the Technology Acceptance Model (TAM). This model is a widely used theoretical framework for comprehending user acceptance and adoption of technology [58]. Perceived usefulness is the primary determinant of a user's intention to use technology in TAM. Waze is a mobile navigation app that provides drivers with real-time traffic information and route guidance. Its perceived usefulness relies on its potential to aid navigation, provide alternative routes, and identify potential traffic hazards [34]. Therefore, it is reasonable to assume that perceived usefulness holds considerable weight in a user's intention to use Waze. Nevertheless, other factors may also influence its usage intention, for instance, ease of use, perceived credibility, social influence, or differing attitudes towards technology [57]. Hence, an all-inclusive gauge of Waze's usage intention must consider these factors in addition to its perceived usefulness.
6. Conclusions
This is the first study to investigate the acceptance and use of the Waze navigation app as a solution to manage traffic situations utilizing the Technology Acceptance Model (TAM) among Filipino drivers in Metro Manila. The traffic flow disruption has been rapidly increasing in the Philippines, and several navigation mobile apps have been utilized to solve the traffic congestion that Filipino drivers experience daily. The user’s perception of navigation apps is beneficial as they relay reliable information the system provides. Thus, this study has focused on determining the user’s behavioral and technology usage intention regarding using the Waze navigation application. A questionnaire was developed and distributed using an online survey convenience sampling technique to 300 Filipino drivers to determine factors affecting their intention to use and behavior on the Waze application.
The results of the proposed hypotheses, partial least squares-structural equation modeling (PLS-SEM), were verified using SmartPLS v3.3.3. Out of seven proposed hypotheses, six were proven to significantly affect the usage behavior and behavioral intentions of the Waze application. Furthermore, all six accepted hypotheses positively influence perceived usefulness, perceived ease of use, usage intention, and actual use. The rejected hypothesis has shown that perceived usability does not significantly influence usage intention, as one study has shown that traffic congestion affects drivers' driving behaviors.
6.1. Recommendations
In line with the completion of this study, the researchers came up with various suggestions that future researchers may adopt if they decide to pursue a topic like this research. Primarily, it is ideal to consider samples from a more diverse geographic background as it provides a more accurate representation of Filipinos traveling within the National Capital Region. Future researchers may also adopt a qualitative research design to gain more detailed insights of Filipinos regarding their experience with the Waze application. Although several statistical treatments were done with the gathered data, it is still recommended for future researchers to obtain narrative responses from their target respondents. Furthermore, future researchers may consider increasing the sample size and related studies to establish stronger inferences. Although this study complied with the conditions needed for its chosen statistical treatment, it would be better for future studies to obtain more responses to validate the accuracy of the findings of this study.
6.2. Practical and Manegerial Implication
As there is limited information on the behavioral intentions of Filipinos in using traffic navigation applications, it is essential to explore the constructs related to the acceptability of the Waze application to assess its efficiency and acceptability in managing traffic situations in Metro Manila. The findings of this study shed light on the perception of Filipino drivers regarding the system quality of the application. As a result, the perceptions of drivers may aid in the improvement of navigation technologies, as the study provided validated hypotheses that comprehend the determinants of user acceptance and adaptation of the application. Furthermore, this could encourage the transportation industry to invest in traffic navigation systems and include the study's significant indicators in their application. This study would enable the government to understand better how the expansion and enhancement of applications such as Waze could reduce traffic congestion in the Philippines. Moreover, the framework used in the study may also be utilized and adopted for technological advancements locally and even internationally.
6.3. Theoretical Implication
Research on the determinants of the usage of traffic navigation applications is crucial due to the continuous increase of the traffic congestion level in Metro Manila. The extended Technology Acceptance Model (TAM) showcased a much more holistic framework for evaluating the behavioral intentions for the use of navigation systems. As this is a comprehensive study related to the usability of the Waze application for managing traffic situations, the findings of the study could serve as a model for technologies to align its systems according to the proposed hypotheses that are found to be significant in the user acceptance of Filipino drivers. Furthermore, this study adds new insights by demonstrating that most of the factors indicated in the extended technology acceptance model have a significant effect on gaining positive feedback from Filipino drivers. For authorities and developers in the technology industry, it is important to utilize a developed model to enhance navigation systems' efficiency and usability, as it plays a key role in managing traffic situations and improving public transportation in Metro Manila.
6.4. Limitations
Despite the findings presented, several limitations were still evident in this study which can be further explored in the future. The first limitation is related to the distribution of respondents; the study could not include samples from a diverse geographic background providing a more accurate behavior of Filipino drivers using navigation systems. Future researchers may also consider enlarging the sample size and conducting related studies to draw more firm conclusions to better understand the usage intention of Filipinos in the Waze application. Second, the study employed a non-probability sampling technique. Further research and analyses can be conducted to confirm the validity of the study's conclusions. Future researchers could recreate this study and consider these aspects as moderators to verify the hypotheses proposed in this study. Lastly, the study only focused on the Waze application. Future research can circumvent this constraint by looking at different traffic navigation systems available in the country and applying this type of research to study its acceptability to Filipino drivers.
Funding
This research received no external funding.
Institutional Review Board Statement
This study was approved by Mapua University Research Ethics Committees.
Informed Consent Statement
Informed consent was obtained from all subjects involved in the study.
Data Availability Statement
The data presented in this study are available on request from the corresponding author.
Acknowledgments
In this section, you can acknowledge any support given which is not covered by the author contribution or funding sections. This may include administrative and technical support, or donations in kind (e.g., materials used for experiments).
Conflicts of Interest
The authors declare no conflict of interest.
References
- Chen, C.-F.; Chen, P.-C. Applying the TAM to travelers’ usage intentions of GPS devices. Expert Syst. Appl. 2011, 38, 6217–6221. [Google Scholar] [CrossRef]
- Diliman, Q. C. (2005). Traffic impact assessment for sustainable traffic management and transportation planning in urban areas. In Proceedings of the Eastern Asia Society for Transportation Studies (Vol. 5, pp. 2342-2351).
- Noerkaisar, N.; Suharjo, B.; Yuliati, L.N. The Adoption Stages of Mobile Navigation Technology Waze App as Jakarta Traffic Jam Solution. Indep. J. Manag. Prod. 2016, 7, 914–925. [Google Scholar] [CrossRef]
- Silva, T. H., De Melo, P. O. V., Viana, A. C., Almeida, J. M., Salles, J., & Loureiro, A. A. (2013). Traffic condition is more than colored lines on a map: characterization of waze alerts. In Social Informatics: 5th International Conference, SocInfo 2013, Kyoto, Japan, November 25-27, 2013, Proceedings 5 (pp. 309-318). Springer International Publishing.
- Laor, T.; Galily, Y. In WAZE we trust? GPS-based navigation application users’ behavior and patterns of dependency. PLOS ONE 2022, 17, e0276449. [Google Scholar] [CrossRef]
- Huang, Z.; Loo, B.P.Y. Urban traffic congestion in twelve large metropolitan cities: A thematic analysis of local news contents, 2009–2018. Int. J. Sustain. Transp. 2022, 17, 592–614. [Google Scholar] [CrossRef]
- Palmiano, H.S.O., Kurokawa, T. and Sigua R.G.. (2015) Shopping centers in Metro Manila and necessity for traffic impact study, Journal of the Eastern Asia Society for Transportation Studies, Vol. 3, No. 4, 107-121.
- Chua. J. A., Blancaflor, E., Wilwayco, J. S., Dela Pena, S., Ibaan, J. I. (2021). Determining satisfaction levels among the factors influencing three mobile traffic navigation applications used by motorists in Metro Manila. Association for Computing Machinery, 92-99. 10.1145/3507524.3507540. [CrossRef]
- Yamsaengsung, S.; Papasratorn, B. Towards Improving User Interaction with Navigation Apps: an Information Quality Perspective. KnE Soc. Sci. 2018, 3, 119–131. [Google Scholar] [CrossRef]
- Braun, H., Gärtner, M., Trösterer, S., Akkermans, L. E. M., Seinen, M., Meschtscherjakov, A., & Tscheligi, M. (2019, September 21). Advanced driver assistance systems for aging drivers. Proceedings of the 11th International Conference on Automotive User Interfaces and Interactive Vehicular Applications. [CrossRef]
- Braun, H., Gärtner, M., Trösterer, S., Akkermans, L. E. M., Seinen, M., Meschtscherjakov, A., & Tscheligi, M. (2019, September 21). Advanced driver assistance systems for aging drivers. Proceedings of the 11th International Conference on Automotive User Interfaces and Interactive Vehicular Applications. [CrossRef]
- Rahman, M.; Strawderman, L.; Lesch, M.F.; Horrey, W.J.; Babski-Reeves, K.; Garrison, T. Modelling driver acceptance of driver support systems. Accid. Anal. Prev. 2018, 121, 134–147. [Google Scholar] [CrossRef]
- Voinea, G.-D.; Postelnicu, C.C.; Duguleana, M.; Mogan, G.-L.; Socianu, R. Driving Performance and Technology Acceptance Evaluation in Real Traffic of a Smartphone-Based Driver Assistance System. Int. J. Environ. Res. Public Heal. 2020, 17, 7098. [Google Scholar] [CrossRef] [PubMed]
- Voinea, G.-D.; Postelnicu, C.C.; Duguleana, M.; Mogan, G.-L.; Socianu, R. Driving Performance and Technology Acceptance Evaluation in Real Traffic of a Smartphone-Based Driver Assistance System. Int. J. Environ. Res. Public Heal. 2020, 17, 7098. [Google Scholar] [CrossRef] [PubMed]
- Peeta, S.; Ramos, J.L.; Pasupathy, R. Content of Variable Message Signs and On-Line Driver Behavior. Transp. Res. Rec. J. Transp. Res. Board 2000, 1725, 102–108. [Google Scholar] [CrossRef]
- Park, E.; Kim, K.J.; Del Pobil, A.P. An examination of psychological factors affecting drivers’ perceptions and attitudes toward car navigation systems. In IT Convergence and Security 2012; Springer: Dordrecht, The Netherlands, 2013; pp. 555–562. [Google Scholar]
- Chatterjee, K.; Mcdonald, M. Effectiveness of using variable message signs to disseminate dynamic traffic information: Evidence from field trails in European cities. Transp. Rev. 2004, 24, 559–585. [Google Scholar] [CrossRef]
- Ghazizadeh, M.; Peng, Y.; Lee, J.D.; Boyle, L.N. Augmenting the Technology Acceptance Model with Trust: Commercial Drivers’ Attitudes towards Monitoring and Feedback. Proc. Hum. Factors Ergon. Soc. Annu. Meet. 2012, 56, 2286–2290. [Google Scholar] [CrossRef]
- Larue, G.S.; Rakotonirainy, A.; Haworth, N.L.; Darvell, M. Assessing driver acceptance of Intelligent Transport Systems in the context of railway level crossings. Transp. Res. Part F: Traffic Psychol. Behav. 2015, 30, 1–13. [Google Scholar] [CrossRef]
- Roberts, S.C.; Ghazizadeh, M.; Lee, J.D. Warn me now or inform me later: Drivers' acceptance of real-time and post-drive distraction mitigation systems. Int. J. Human-Computer Stud. 2012, 70, 967–979. [Google Scholar] [CrossRef]
- Etikan, I.; Musa, S.A.; Alkassim, R.S. Comparison of Convenience Sampling and Purposive Sampling. Am. J. Theor. Appl. Stat. 2016, 5, 1–4. [Google Scholar] [CrossRef]
- Yamane, T. (1967). Statistics, an Introductory Analysis. Journal of the American Statistical Association, 60 (310), 678. [CrossRef]
- Zhou, T. Examining the critical success factors of mobile website adoption. Online Inf. Rev. 2011, 35, 636–652. [Google Scholar] [CrossRef]
- Jeong, H. (2011). An investigation of user perceptions and behavioral intentions towards the e-library. Library Collections, Acquisitions, and Technical Services, 35(2-3), 45-60.
- Prasetyo, Y.T.; Ong, A.K.S.; Concepcion, G.K.F.; Navata, F.M.B.; Robles, R.A.V.; Tomagos, I.J.T.; Young, M.N.; Diaz, J.F.T.; Nadlifatin, R.; Redi, A.A.N.P. Determining Factors Affecting Acceptance of E-Learning Platforms during the COVID-19 Pandemic: Integrating Extended Technology Acceptance Model and DeLone & McLean IS Success Model. Sustainability 2021, 13, 8365. [Google Scholar] [CrossRef]
- Diop, E.B.; Zhao, S.; Van Duy, T. An extension of the technology acceptance model for understanding travelers’ adoption of variable message signs. PLOS ONE 2019, 14, e0216007. [Google Scholar] [CrossRef] [PubMed]
- Park, E.; Kim, H.; Ohm, J.Y. Understanding driver adoption of car navigation systems using the extended technology acceptance model. Behav. Inf. Technol. 2014, 34, 741–751. [Google Scholar] [CrossRef]
- Zeng, K. C., Liu, S., Shu, Y., Wang, D., Li, H., Dou, Y., ... & Yang, Y. (2018). All your {GPS} are belong to us: Towards stealthy manipulation of road navigation systems. In 27th {USENIX} security symposium ({USENIX} security 18) (pp. 1527-1544).
- Voinea, G.-D.; Postelnicu, C.C.; Duguleana, M.; Mogan, G.-L.; Socianu, R. Driving Performance and Technology Acceptance Evaluation in Real Traffic of a Smartphone-Based Driver Assistance System. Int. J. Environ. Res. Public Heal. 2020, 17, 7098. [Google Scholar] [CrossRef]
- Cooharojananone, N., Napapruekchat, S., Puttirutwong, T., & Pongnumkul, S. (2014, November). A study of factors influencing intention to use traffic information applications on smartphones in Bangkok, Thailand. International Conference on Information Society (i-Society 2014). [CrossRef]
- Lowrie, C., Kruczkiewicz, A., McClain, S. N., Nielsen, M., & Mason, S. J. (2022). Evaluating the usefulness of VGI from Waze for the reporting of flash floods. Scientific reports, 12(1), 5268. [CrossRef]
- Khairunnisa, R., & Muthaiyah, S. (2021). Understanding Factors Influencing Continuance Intention Of Users Toward Community-Based Traffic And Navigation Application In Indonesia. Turkish Journal of Computer and Mathematics Education, 12(12), 3464-3476.
- Noerkaisar, N.; Suharjo, B.; Yuliati, L.N. The adoption stages of mobile navigation technology waze app as Jakarta traffic jam solution. Indep. J. Manag. Prod. 2016, 7, 914–925. [Google Scholar] [CrossRef]
- Yang, L.; Bian, Y.; Zhao, X.; Liu, X.; Yao, X. Drivers’ acceptance of mobile navigation applications: An extended technology acceptance model considering drivers’ sense of direction, navigation application affinity and distraction perception. Int. J. Human-Computer Stud. 2020, 145, 102507. [Google Scholar] [CrossRef]
- Hair, J.F.; Sarstedt, M.; Ringle, C.M.; Mena, J.A. An assessment of the use of partial least squares structural equation modeling in marketing research. J. Acad. Mark. Sci. 2012, 40, 414–433. [Google Scholar] [CrossRef]
- Dash, G.; Paul, J. CB-SEM vs PLS-SEM methods for research in social sciences and technology forecasting. Technol. Forecast. Soc. Chang. 2021, 173, 121092. [Google Scholar] [CrossRef]
- Dash, G.; Paul, J. CB-SEM vs PLS-SEM methods for research in social sciences and technology forecasting. Technol. Forecast. Soc. Chang. 2021, 173, 121092. [Google Scholar] [CrossRef]
- Dash, G.; Paul, J. CB-SEM vs PLS-SEM methods for research in social sciences and technology forecasting. Technol. Forecast. Soc. Chang. 2021, 173, 121092. [Google Scholar] [CrossRef]
- Hu, L.-T.; Bentler, P.M. Fit indices in covariance structure modeling: Sensitivity to underparameterized model misspecification. Psychol. Methods 1998, 3, 424–453. [Google Scholar] [CrossRef]
- Baumgartner, H.; Homburg, C. Applications of structural equation modeling in marketing and consumer research: A review. Int. J. Res. Mark. 1996, 13, 139–161. [Google Scholar] [CrossRef]
- Kimberlin, C.L.; Winterstein, A.G. Validity and reliability of measurement instruments used in research. Am. J. Health-Syst. Pharm. 2008, 65, 2276–2284. [Google Scholar] [CrossRef]
- Peters, G. (2014). The alpha and the omega of scale reliability and validity: Why and how to abandon Cronbach’s alpha and the route towards more comprehensive assessment of scale quality. The European Health Psychologist, 16(2), 56–69. [CrossRef]
- Ab Hamid, M.; Sami, W.; Sidek, M.M. Discriminant validity assessment: Use of Fornell & Larcker criterion versus HTMT criterion. In Proceedings of the Journal of Physics: Conference Series, Kuantan, Malaysia, 8–10 August 2017; p. 012163.
- Analysis INN. (2020, April 19). Average Variance Extracted (AVE). Analysis INN. https://www.analysisinn.com/post/average-variance-extracted-ave/.
- Hair, J. F., Hult, G. T. M., Ringle, C. M., & Sarstedt, M. (2014). A primer on partial least squares structural equation modeling (PLS-SEM).
- Henseler, J.; Ringle, C.M.; Sarstedt, M. A new criterion for assessing discriminant validity in variance-based structural equation modeling. J. Acad. Mark. Sci. 2015, 43, 115–135. [Google Scholar] [CrossRef]
- Park, E.; Kim, K.J.; Del Pobil, A.P. An examination of psychological factors affecting drivers’ perceptions and attitudes toward car navigation systems. In IT Convergence and Security 2012; Springer: Dordrecht, The Netherlands, 2013; pp. 555–562. [Google Scholar]
- Peeta, S.; Ramos, J.L.; Pasupathy, R. Content of Variable Message Signs and On-Line Driver Behavior. Transp. Res. Rec. J. Transp. Res. Board 2000, 1725, 102–108. [Google Scholar] [CrossRef]
- Nelson, R.R.; Todd, P.A.; Wixom, B.H. Antecedents of Information and System Quality: An Empirical Examination Within the Context of Data Warehousing. J. Manag. Inf. Syst. 2005, 21, 199–235. [Google Scholar] [CrossRef]
- Ben-Elia, E.; Di Pace, R.; Bifulco, G.N.; Shiftan, Y. The impact of travel information’s accuracy on route-choice. Transp. Res. Part C: Emerg. Technol. 2012, 26, 146–159. [Google Scholar] [CrossRef]
- Hussain, A.; Mkpojiogu, E.O.C.; Yusof, M.M. Perceived usefulness, perceived ease of use, and perceived enjoyment as drivers for the user acceptance of interactive mobile maps. In AIP Conference Proceedings (Vol. 1761, No. 1, p. 020051). AIP Publishing LLC.
- Marzuki, M. I. I., Rosly, A. N., Roslan, N. S., Abdullah, D., Kamal, S. B. M., & Azmi, A. (2016). The role of perceived interactivity, perceived ease of use, perceived usefulness, and perceived enjoyment toward intention to use online mapping service applications. International Academic Research Journal of Business and Technology, 2(2), 135-139.
- Mukul, M., Srivastava, V., Jade, S., & Mukul, M. (2017). Uncertainties in the shuttle radar topography mission (SRTM) Heights: Insights from the indian Himalaya and Peninsula. Scientific reports, 7(1), 1-10.
- Davis, F.D.; Bagozzi, R.P.; Warshaw, P.R. User Acceptance of Computer Technology: A Comparison of Two Theoretical Models. Manag. Sci. 1989, 35, 982–1003. [Google Scholar] [CrossRef]
- Wang, H.; Ouyang, M.; Meng, Q.; Kong, Q. A traffic data collection and analysis method based on wireless sensor network. EURASIP J. Wirel. Commun. Netw. 2020, 2020, 1–8. [Google Scholar] [CrossRef]
- Khairunnisa, R., & Muthaiyah, S. (2021). Understanding Factors Influencing Continuance Intention Of Users Toward Community-Based Traffic And Navigation Application In Indonesia. Turkish Journal of Computer and Mathematics Education, 12(12), 3464-3476.
- Vankatesh, V., Morris, M. G., Davis, G. B., & Davis, F. D. (2003). User acceptance of information technology: Toward a unified view. Mis Quarterly, 27(3), 425-478.
- Bhattacherjee, A. Understanding Information Systems Continuance: An Expectation-Confirmation Model. MIS Q. 2001, 25, 351–370. [Google Scholar] [CrossRef]
Figure 1.
Conceptual Framework based on Extended Technology Acceptance Model.
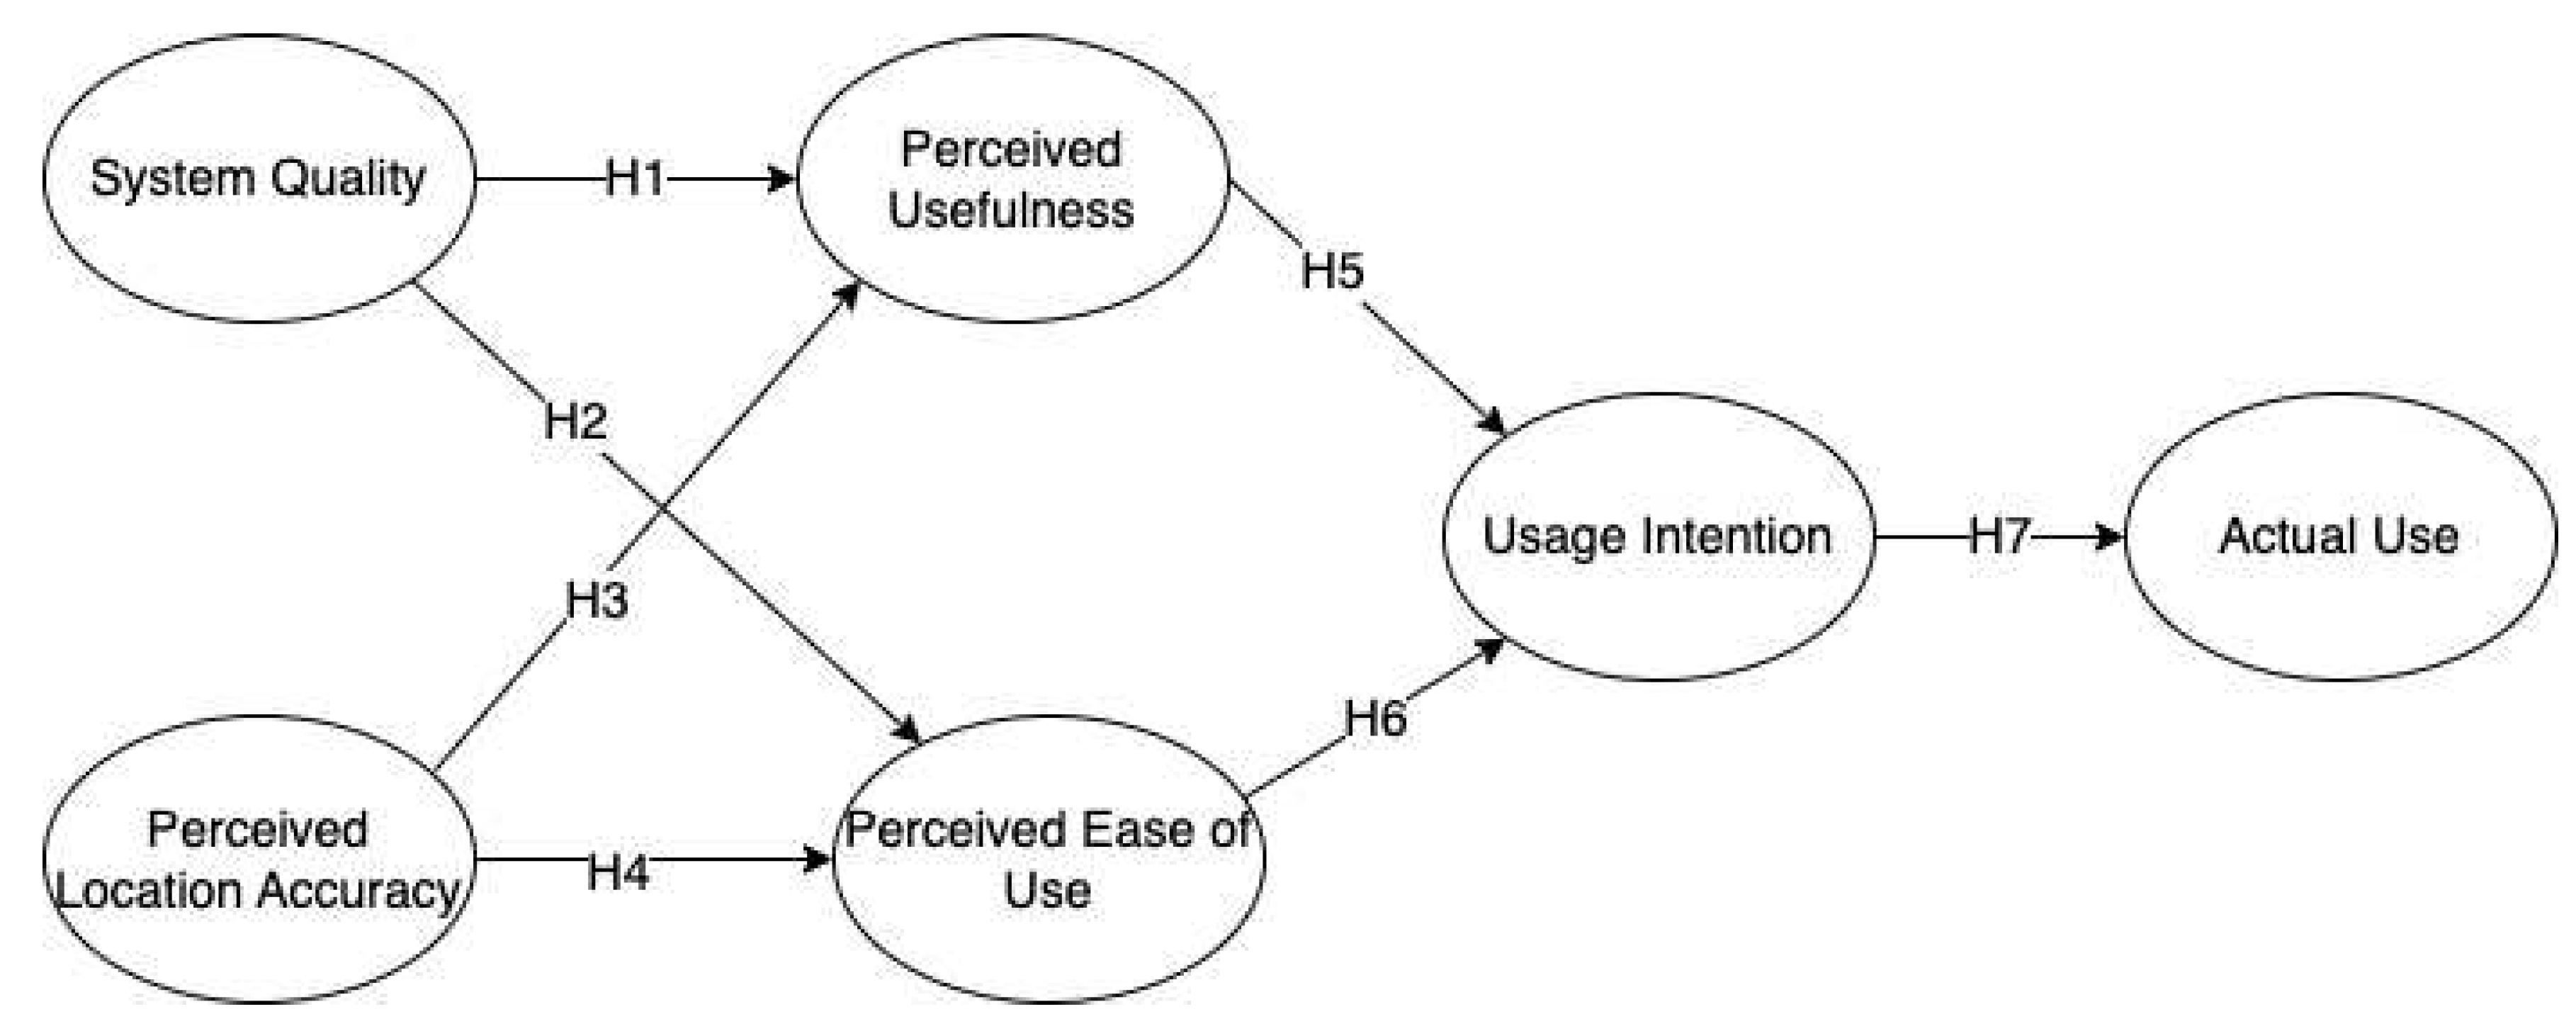
Figure 2.
Final SEM Model.
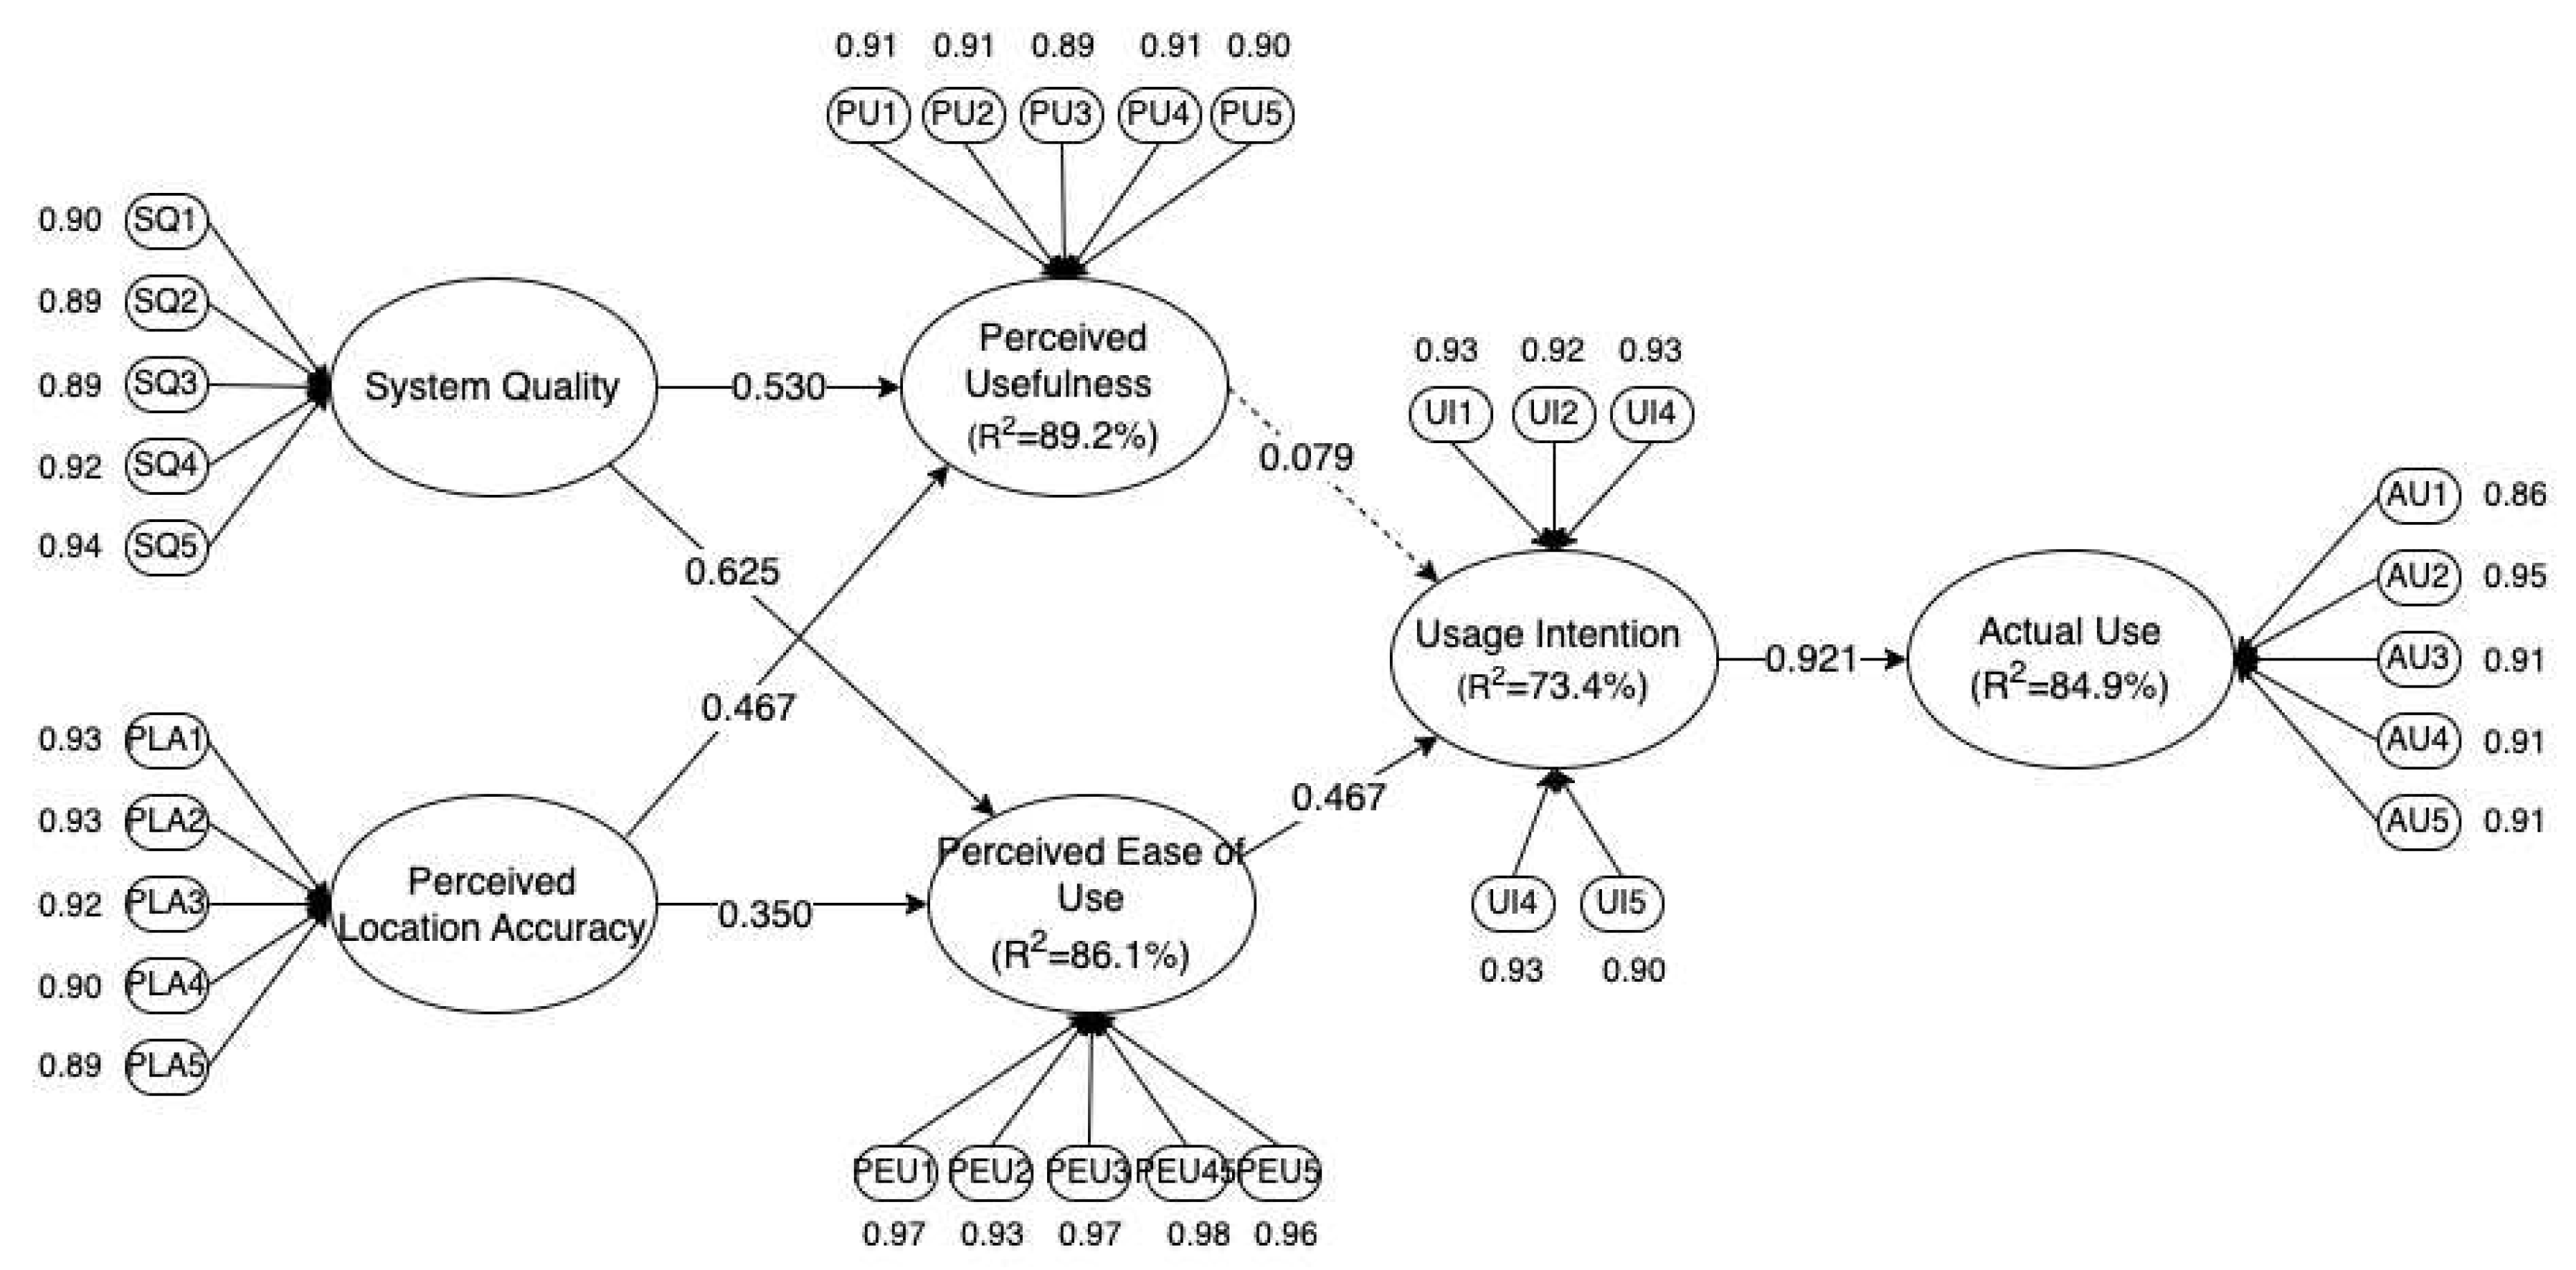
Table 1.
Demographic Profile.
| Respondent’s Profile (n=300) | Category | N | % |
|---|---|---|---|
|
Age |
18 | 139 | 46.3% |
| 19 | 99 | 33% | |
| 20 | 57 | 19% | |
| 21 | 5 | 1.7% | |
|
Gender |
Female | 143 | 47.7% |
| Male | 157 | 52.3% | |
|
Area of Residence |
Within NCR | 115 | 38.3% |
| Outside NCR | 185 | 61.7% | |
|
Educational Attainment |
Finished college or with graduate degree | 139 | 46.3% |
| Attended college | 36 | 12% | |
| Attended high school | 121 | 40.3% | |
| Attended grade school level | 4 | 1.3% | |
| Did not attend school | - | - | |
|
Duration of Application Use |
Less than a year | 133 | 44.3% |
| 1 year | 35 | 11.7% | |
| 2 years | 34 | 11.3% | |
| More than 3 years | 98 | 32.7% |
Table 2.
Construct and Measurement Items.
| Items | Measure | Supporting References |
|---|---|---|
| System Quality | ||
| SQ1 | I find the Waze app interface easy to use. | [23,24,25] |
| SQ2 | I have a clear and understandable interaction with the Waze app interface | |
| SQ3 | I feel comfortable using the Waze app services and functionalities. | |
| SQ4 | The Waze app’s interface and system design is friendly. | |
| SQ5 | The Waze app provides user-friendly features. | |
| Perceived Location Accuracy | ||
| PLA1 | The Waze app provides accurate travel information | [26,27,28] |
| PLA2 | The Waze app provides accurate duration of travel | |
| PLA3 | The Waze app provides accurate travel route | |
| PLA4 | The Waze app provides timely travel information | |
| PLA5 | The Waze app provides complete travel information | |
| Perceived Usefulness | ||
| PU1 | I find it easy to remember the steps on how to use Waze app | [1,29,30,34] |
| PU2 | I find it useful to use Waze app to avoid traffic congestion | |
| PU3 | I find it useful to use the Waze app to reach my destination faster | |
| PU4 | I find it useful to use the Waze app to accurately reach my destination | |
| PU5 | I find the Waze app useful in my daily travel | |
| Perceived Ease of Use | ||
| PEOU1 | I find it easy to learn how to use the Waze app. | [1,28,29,30] |
| PEOU2 | I find it easy to be good at navigating using the Waze app. | |
| PEOU3 | I find it easy to do what I want to do in the Waze app. | |
| PEOU4 | I find it easy to use the Waze app. | |
| PEOU5 | Interactions in the Waze app are clear and easy to understand. | |
| Usage intention | ||
| UI1 | I will use the Waze app often. | [25,31,32] |
| UI2 | I am planning to use the Waze app frequently. | |
| UI3 | I wish that my habit of using the Waze app continues in the future. | |
| UI4 | I am motivated to use the Waze app. | |
| UI5 | I am willing to use the Waze app in the future | |
| Actual Use | ||
| AU1 | I use Waze app to avoid traffic congestion | [33,34] |
| AU2 | Among all the traffic navigation apps, I prefer to use the Waze app | |
| AU3 | I use the Waze app frequently. | |
| AU4 | I use the Waze app consistently. | |
| AU5 | I recommend using the Waze app. | |
Table 3.
Reliability and Convergent Validity Result.
| Construct | Items | Mean | S.D. | FL (≥0.7) | α (≥0.7) | CR (≥0.7) | AVE (≥0.5) |
|---|---|---|---|---|---|---|---|
| System Quality | SQ1 | 3.85 | 1.15 | 0.897 | 0.946 | 0.947 | 0.959 |
| SQ2 | 3.80 | 1.11 | 0.893 | ||||
| SQ3 | 3.81 | 1.07 | 0.891 | ||||
| SQ4 | 3.92 | 1.10 | 0.921 | ||||
| SQ5 | 3.98 | 1.06 | 0.935 | ||||
| Perceived Location Accuracy | PLA1 | 3.51 | 1.09 | 0.925 | 0.949 | 0.949 | 0.961 |
| PLA2 | 3.68 | 1.09 | 0.927 | ||||
| PLA3 | 3.54 | 1.09 | 0.919 | ||||
| PLA4 | 3.70 | 1.05 | 0.897 | ||||
| PLA5 | 3.71 | 1.09 | 0.891 | ||||
| Perceived Usefulness | PU1 | 3.89 | 1.09 | 0.901 | 0.937 | 0.938 | 0.952 |
| PU2 | 3.75 | 1.13 | 0.911 | ||||
| PU3 | 3.81 | 1.06 | 0.890 | ||||
| PU4 | 3.81 | 1.11 | 0.906 | ||||
| PU5 | 3.69 | 0.14 | 0.895 | ||||
| Perceived Ease of Use | PEU1 | 3.86 | 1.11 | 0.970 | 0.980 | 0.980 | 0.984 |
| PEU2 | 3.71 | 1.09 | 0.934 | ||||
| PEU3 | 3.80 | 1.11 | 0.970 | ||||
| PEU4 | 3.84 | 1.10 | 0.981 | ||||
| PEU5 | 3.83 | 1.13 | 0.958 | ||||
| Usage Intention | UI1 | 3.54 | 1.05 | 0.932 | 0.952 | 0.952 | 0.963 |
| UI2 | 3.57 | 1.07 | 0.924 | ||||
| UI3 | 3.55 | 1.09 | 0.933 | ||||
| UI4 | 3.59 | 1.10 | 0.934 | ||||
| UI5 | 3.89 | 1.04 | 0.859 | ||||
| Actual Use | AU1 | 3.82 | 0.97 | 0.858 | 0.947 | 0.948 | 0.959 |
| AU2 | 3.72 | 1.12 | 0.953 | ||||
| AU3 | 3.56 | 1.09 | 0.909 | ||||
| AU4 | 3.53 | 1.14 | 0.910 | ||||
| AU5 | 3.92 | 1.13 | 0.908 |
Table 4.
Hypothesis Test Results.
| No | Relationship | Beta coefficient | p-value | Result | Significance | Hypothesis |
|---|---|---|---|---|---|---|
| 1 | SQ→PU | 0.530 | <0.001 | Positive | Significant | Accept |
| 2 | SQ→PEU | 0.625 | <0.001 | Positive | Significant | Accept |
| 3 | PLA→PU | 0.467 | <0.001 | Positive | Significant | Accept |
| 4 | PLA→PEU | 0.350 | <0.001 | Positive | Significant | Accept |
| 5 | PU→UI | 0.079 | 0.633 | Positive | Not Significant | Reject |
| 6 | PEU→UI | 0.467 | <0.001 | Positive | Significant | Accept |
| 7 | UI→AU | 0.921 | <0.001 | Positive | Significant | Accept |
Table 6.
Discriminant Validity: Heterotrait-Monotrait Ratio.
| AU | PLA | PEU | PU | SQ | UI | |
|---|---|---|---|---|---|---|
| AU | ||||||
| PLA | 0.781 | |||||
| PEU | 0.790 | 0.780 | ||||
| PU | 0.827 | 0.709 | 0.798 | |||
| SQ | 0.790 | 0.659 | 0.728 | 0.671 | ||
| UI | 0.648 | 0.747 | 0.834 | 0.802 | 0.683 |
Table 7.
Model Fit.
| Model Fit for SEM | Parameter Estimates | Minimum cut-off |
Recommended by |
|---|---|---|---|
| SRMR | 0.055 | < 0.08 | Hu & Bentler (1999) |
| (Adjusted) Chi-square/dF | 3.48 | <5.0 | Hooper (2008) |
| Normal Fit Index (NFI) | 0.973 | > 0.90 | Baumgartner (1996) |
Disclaimer/Publisher’s Note: The statements, opinions and data contained in all publications are solely those of the individual author(s) and contributor(s) and not of MDPI and/or the editor(s). MDPI and/or the editor(s) disclaim responsibility for any injury to people or property resulting from any ideas, methods, instructions or products referred to in the content. |
© 2023 by the authors. Licensee MDPI, Basel, Switzerland. This article is an open access article distributed under the terms and conditions of the Creative Commons Attribution (CC BY) license (http://creativecommons.org/licenses/by/4.0/).
Copyright: This open access article is published under a Creative Commons CC BY 4.0 license, which permit the free download, distribution, and reuse, provided that the author and preprint are cited in any reuse.


