Submitted:
10 June 2025
Posted:
10 June 2025
You are already at the latest version
Abstract
Dehydration is a serious medical problem for elder patients and young children. The most widely used diagnostics are measurements of sodium-ion (Na+) and potassium-ion (K+) in blood serum. Dehydration is difficult to diagnose even by trained health care professionals because the body compensates to maintain the appearance of skin. These measurements required a blood draw because specific tests are generally not available for only Na+ and K+. The blood samples are analyzed by an electrolyte panel (EP) or a basic metabolic panel (BMP). Most hospitals limit EP and BMP to one per day to control costs. More frequent measurements of Na+ and K+ are needed, especially during rehydration. We designed on a fluorescent contact lens (NaK-CL) that can provide the Na+ and K+ concentrations as needed or for continuous monitoring. The measurements are obtained from the fluorescent lifetime or wavelength-ratiometric intensities of the Na+ and K+ sensitive fluorophores. The NaK-CL does not contain electronic components and are inexpensive to prepare.
Keywords:
Dehydration
; Sodium/Potassium Ions
; Silicone Hydrogel Contact Lens
; Tear
; Fluorescence
; Point-of-care diagnosis
1. Introduction
Dehydration is a world-wide health problem, resulting in over 1.35 million deaths per year [1]. Approximately half of these deaths are due to dehydration with diarrhea and many of which are due to poor water quality. Younger children <5 years of age and adults >65 years of age are the most affected populations. In the senior population, 5–10% of deaths are due to dehydration [2,3]. The percentage is possibly higher because death of the elderly are often attributed to broken bones, which can be the result of falling due to dehydration. In the general population, 1 out of 5 illnesses can be prevented by adequate hydration [4,5,6,7]. In developed countries dehydration occurs among the elderly, often those with other medical conditions. Elderly patients admitted to the hospital due to dehydration, without other medical conditions, have a 50% chance of dying [3], and those that recover can have cognitive deficiencies [8]. There are multiple reasons for dehydration of elderly individuals. With increasing age there is a decrease in the total body water for both men and women. Because of the smaller water volume the sodium concentration increases more rapidly with loss of water. The elderly have a decreased sense of thirst [9,10] and often do not drink enough fluids to replace a water deficiency. Additionally, the concentrating ability of the kidneys is decreased with aging. Elderly patients in nursing care homes are frequently dehydrated [7], and those admitted to hospitals have a significantly greater risk of in-hospital mortalities [10].
Dehydration is often not reported as a primary diagnosis because it occurs concurrently with many other medical conditions. Numerous reports have demonstrated that a physical examination of the patient is not a reliable way to identify dehydration [11,12,13,14]. Diagnosis of dehydration requires measurements of the sodium-ion (Na+) and potassium-ion (K+) concentrations in blood, serum or plasma [15]. These concentrations are typically determined from a standardized electrolyte panel (EP) or a basic metabolic profile (BMP) panels. A blood draw is necessary to conduct the EP and BMP panels, which are used to measure the concentrations of Na+, K+, and other analytes [15]. However, most hospitals only allow one blood draw per day, which may not be adequate for many patients with dehydration. The time delay to receive EP or BMP panels does not allow Na+ and K+ measurements at the bedside or during IV rehydration treatment. If too rapid IV rehydration can result in neurological damage [16,17,18]. Individual Na+ and K+ measurements are rarely requested or performed because the EP and BMP are fully automated. The limited number of panels creates a danger for patients with dysnatremia, or rapid changes in sodium concentrations which can result in death or neurological problems [16,17,18]. Additionally, repeated venipunctures may lead to hospital-acquired anemia (HAA), particularly in frail or post-operative individuals, and result in higher hospitalization expenses.
Unfortunately, other methods to diagnose dehydration have not been effective. For children, diarrhea, vomiting, and weight loss have only a modest value for assessing dehydration but were not useful for older individuals [19,20]. Using specific gravity or plasma osmolarity had almost no diagnostic value for older individuals [21]. As a result, other technologies have been tested to diagnose dehydration. The more recent literature describes new technologies, which included testing of sweat, saliva, bioimpedance over a wide range of frequencies, infrared absorption, and Raman spectroscopy [22,23,24]. None of these methods were able to diagnosis dehydration and did not provide useful clinical information. There is no gold standard method to diagnosis dehydration [16]. Therefore, a straightforward method for diagnosing dehydration is necessary for individuals of all age groups. Tear samples offer a non-invasive method, but their use is restricted by the total volume (7-10 µL) of tears available [25,26]. Larger tear volumes are not available because physical contact with the eye results in a rapid change in tear composition [25,26].
The first contact lenses were made of glass or a hard plastic methacrylate (PMMA) [27]. These hard lenses did not permit oxygen transport to the cornea which limited the wear time. Contact lens technology was improved by the introduction of soft contact lenses made from hydrogels (HG), which improved oxygen permeability [27]. However, for adequate permeability the HG polymer content had to be very low, and the HG lenses were too fragile for handling [27,28,29]. Silicone (not oxidized, SiO2) is known to be highly permeable to oxygen due to high oxygen diffusion and solubility [30,31,32,33]. Silicone itself is too hydrophobic to be used on the sensitive corneal cells and does not allow transport of tear electrolytes [27,28,29,30,31,32,33]. This resulted in extensive commercial research to develop silicone-containing precursors to create silicone hydrogel (SiHG) lenses with unique morphology (Figure S1). There are numerous reports describing smart contact lenses (SCL) which contain electronic components for receiving and sending signals, sensing of the analyte, and an antenna for charging by electrical induction [34,35]. Even if some SCL are successful they are likely to be too expensive for medical applications, such as discarding after one test or one week. The SiHG lenses are distinct from HG lenses. SiHG lenses have continuous silicone channels for oxygen transport and open aqueous channels for transport of water and ions. This morphology contains both hydrophobic and hydrophilic regions, and interface regions, which can be used to bind sensing fluorophores. Over the past several years we have developed methods to bind fluorophores to SiHG lenses [36,37,38,39,40]. One of the methods takes advantage of the hydrophobic region of SiHG lenses. Long chain hydrocarbons are attached to ion-sensitive fluorophores which bind by hydrophobilic effects [36]. The second method, used in this report, takes advantage of the high affinity of poly-L-lysine (PL) for SiHG lenses. PL was selected because of the well-known binding of lysozyme to SiHG lenses, and lysozyme is probably the only positively charged protein in tears. Fluorophores linked to PL were found to bind quickly and strongly to several different SiHG lenses [36,37,38,39,40].
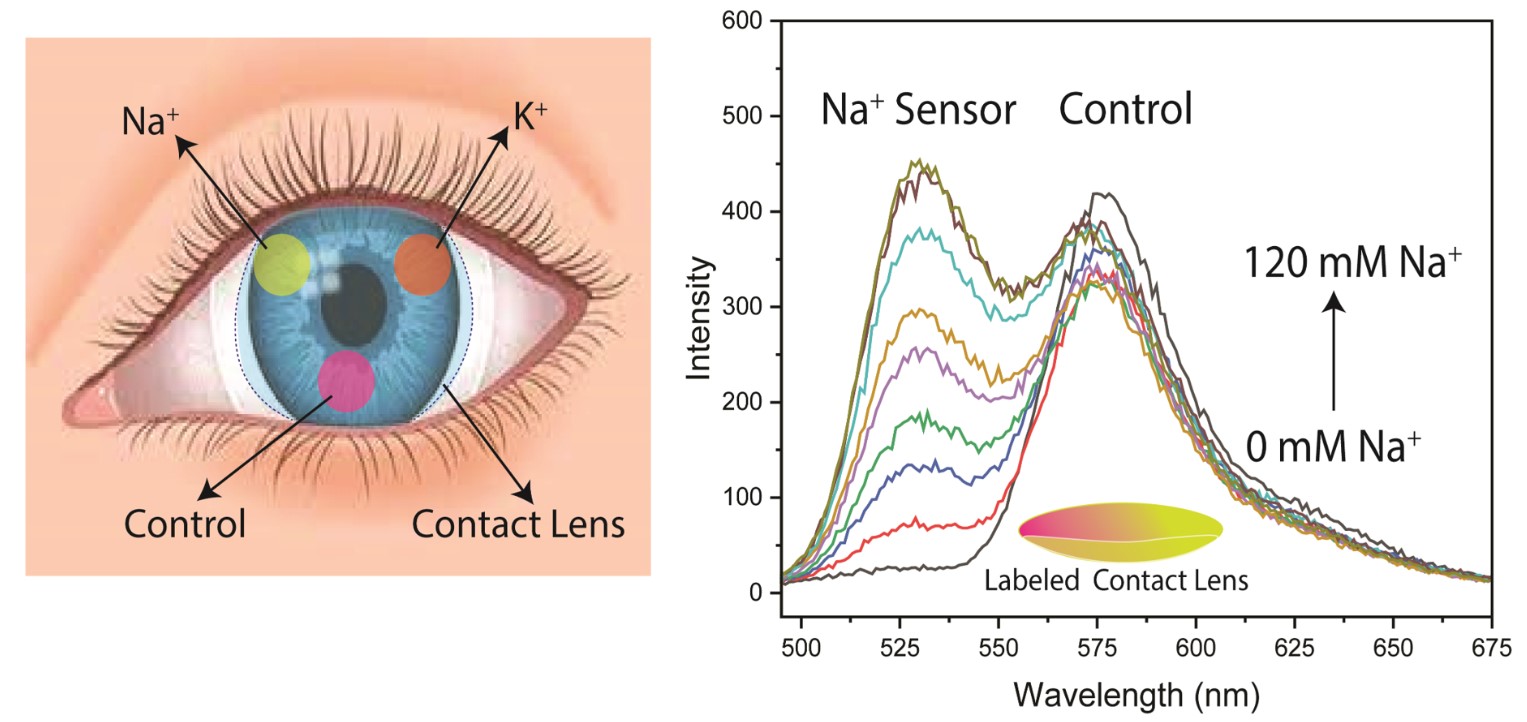
In the present report we describe the synthesis of different Na+ or K+-sensitive fluorophores bound to PL. The lenses also contained rhodamine B (RhB) which was not sensitive to either ion was used for reference intensity. The ion-concentrations were determined using intensities, intensity-ratios or lifetimes of the PL-linked probes. Both Na and K measurements could be made in the physiology range of these ions (Table S1). The wavelength ratio and lifetime measurements can be made even if the fluorescence signals are unstable (Figure 1). These lenses can provide on-demand measurements of Na+ and K+ without the need for additional blood draws.
2. Materials and Methods
2.1. Selection of SiHG Contact Lens
In this work, for the purpose of developing sodium and potassium contact lenses, we selected two SiHG contact lenses that are easily obtainable in the market. The Biofinity (Comfilcon A) from Cooper Vision and Air Optix (Lotrafilcon A) from Alcon contact lenses from were selected for testing due to the fact that around 65% of new prescriptions are for these SiHG lenses which are well accepted by the public [41,42]. The second generation SiHG lenses have high oxygen permeability, allowing them to be worn continuously for up to 30 days without causing pain. The Air Optix lenses probably contain more silicone than the Biofinity lenses (Figure S1), so the aqueous regions are shown to be narrower than for the Biofinity lenses, but precise 3D structures are not known. From the structures of starting monomers the SiHG lenses appear to have a net negative charge and are known to become coated by the positively charged lysozyme in tears [36,37,38,39,40]. Sodium-sensitive and potassium-sensitive fluorophores were synthesized with poly-L-lysine (PL) were found to bind to the contact lens in this study. PL is frequently used to coat polystyrene and hydrophobic surfaces, and it is not expected to be toxic.
2.2. Synthesis of the Sodium-Sensitive and Potassium-Sensitive Fluorophores
We synthesized sodium- and potassium-sensitive fluorophores by using Sodium Green (SG, tetramethylamonium salt, cell impermeant) and Potassium Green (PG, Potassium Green-2 Salt, cell impairment), as described in our initial materials in our previous work [38,39]. Both potassium- and sodium-sensitive probes were conjugated the PL (Advanced Biomatrix, USA) to allow the probes (SG or PG) to bind to contact lenses. The free carboxyl groups on the sodium and potassium probes were initially activated using the NHS/EDC method, and amide bonds were then formed using PL. Figure 2 shows the chemical structures of the probes and the synthesis procedures. More specifically, 1 mg of SG and PG were added to 2 ml of dimethylformamide (DMF, Sigma-Aldrich) in a solution that included 0.20 ml of 0.01% PL (MW 70–150 kDa). The SG and PG probe solutions were activated using N-hydroxysuccinimide (NHS, 0.27 mg in 2 ml (Sigma-Aldrich) and N-(3-dimethylaminopropyl)-N carbodiimide hydrochloride (EDC, 0.33 mg in 2 ml) overnight at room temperature and inert atmosphere. After the addition of PL into the SG or PG probe the solution was stirred continuously for an additional hour. Finally, the final SG-PL or PG-PL probe solutions were bound to the contact lens by diluting 0.020 ml aliquots of the prepared reaction mixture in 2 ml of water. In this study, the rhodamine B (RhB, Sigma-Aldrich) probe was used as a reference probe due to its ability to provide a signal which was independent of the sodium and potassium concentrations. RhB was used without chemical modification because it spontaneously binds to the lenses. This result was expected because RhB was known to bind to cell membranes [43,44].
2.3. Probe Labeling of SiHG Lenses
A simple approach was used to attach an SG-PL or PG-PL probe onto Lot A or Con A lenses, a 20 µL solution of SG-PL probe was diluted with 2 mL of an aqueous-methanol (50-50 v/v) solution in order to attain a probe concentration of 1 µM. Next, the mixture was thoroughly stirred and thereafter transferred to a cuvette size 1 cm x 1 cm, which was used to hold the lenses in a diagonal orientation for probe uptake. The Lot A or Con A lenses were incubated with a probe solution for about 90 minutes. Additionally, the lenses were subjected to a washing procedure with deionized water to eliminate any unattached probes. A similar method was used to analyze the uptake of PG-PL probes into lenses. In order to perform ion-sensitive measurements, lenses with SG-PL or PG-PL probes were used for fluorescence measurement (Figure 3). The labeled lenses could be seen visually under a UV hand lamp (Figure 4).
2.4. SiHG Lenses Fluorescence Measurements
Using fluorescence measurements, the SG-PL and PG-PL probes attached to contact lenses were tested for ion-sensitivity. The lenses were positioned diagonally inside a 1 cm × 1 cm cuvette and covered with MOPS buffer at room temperature and pH 7.2. The SG-PL and PG-CL lenses were examined with varying concentrations of NaCl and KCL in 20 mM. Emission spectra and lifetime data were obtained for each concentration of sodium and potassium. The intensity and intensity decays of ion-sensitive SiHG lenses fluorescence spectra were obtained using a FluoTime 300 instrument from PicoQuant. The subsequent analysis was conducted using the EasyTau software. A 480 nm laser diode was used as the excitation source, operating at a repetition rate of 40 MHz with a pulse width of less than 100 ps. The measurement of intensity decays was conducted at the emission maximum, and the analysis was conducted using the multi-exponential model and described previously [45,46]. The SG-PL or PG-PL were also examined using fluorescent lifetime imaging microscopy (FLIM) from ISS (Champaign, IL). The FLIM technique [47,48] used a dual scanning capability, with a 473 nm laser diode as the excitation source. The excitation rate was set at 40 MHz, and the pulse width was around 250 ps. The contact lenses were imaged at a distance of 13 mm over the entire lens area, with a resolution of 256 x 256 pixels.
3. Results
Three fluorophores were selected for the dehydration contact lens (DH-CL). In each case the starting fluorophores were SG and PG contained free carboxyl groups which were linked to amino groups on PL. The third probe rhodamine B (RhB) was not reacted with PL lenses because RhB was known to spontaneously bind to cell membranes [49]. Absorption and emission spectra of these probes showed considerably spectral overlap (Figure 3). We reasoned that selection of excitation and emission wavelengths, and wavelength-dependent lifetime measurements would allow these three species to be independent quantified. SG-PL and PG-PL were rapidly bound to both the Con A and Lot A contact lenses as could be observed visually (Figure 4) and by fluorescence intensity measurements (Figure S2). These data show that probe uptake occurs but cannot be used to calculate accurate uptake rate constants because the incubation probe solution was being deleted of free probe during the measurements (Figure S3).
The Na+ and K+ probes were tested for sensitivity to their target ions when bound to Lot A lenses (Figure 5 and Figure 6). The tests were performed in two ways. The first test was performed using SG-PL alone in the lens, with the RhB reference is a separate lens (Figure 5A). These tests showed the SG-PL intensity increased about 9-fold with increasing considerations of Na+ and no significant effect on the RhB fluorescence. The second test was performed with both SG-PL and RhB bound to the same lens (Figure 5B). Essentially the same results were found for the Lot A lens with both SG-PL and RhB bound to the same lens. This demonstrates the RhB reference fluorophore had no effect on the SG-PL. A similar result was obtained for the K+ probe PG-PL when bound to the Lot A lenses (Figure 6A and B). The results in Figure 5 and Figure 6 showed no effect of Na+ or K+ on the RhB emission.
To quantify the extent of ion binding the ion-dependent intensities of SG-PL and PG-PL bound to lenses are shown in Figure 7A and Figure 7B. These results show the probes are sensitive to their target ions in the physiological range (Table S1). Figure 7C shows the ion-dependent intensities relative to RhB. In the present case, with stable positioning of the lenses, the ratio measurements do not provide additional information. However, if the lens was being worn by a patient, there would be changes in the total intensities, and they could be accounted for by the wavelength-ratiometric measurements.
The fluorescence lifetimes of SG-PL, PG-PL and RhB bound to Lot A lenses over a range of ion concentrations are shown in Figure 8. Both SG-PL and PG-PL displayed a 9-fold increase in intensity with increased ion concentrations. However, SG-PL and PG-PL displayed only a 60% increase in lifetime from 0.0 to high concentrations of Na+ and K+. The lifetime of RhB was independent of the ion concentrations. The lifetimes changes of SG-PL and PG-PL are smaller than expected when compared to the intensity changes (Figure 5 and Figure 6). At present we do not know the reason for this difference, but the probes demonstrate the possibility of lifetime-based sensing of Na+ and K+ in contact lenses. This fact is demonstrated in Figure 9 where the lifetimes of SG-PL and PG-PL were measured with different excitation intensities caused by placing neutral density filters into the excitation pathways. The lifetimes of these probes remained constant for 2-fold changes in excitation intensity.
The reversibility of the ion response was tested by reported immersion of each lens in a 0.0 mM or high concentration (130 mM Na+ or 110 mM K+). Both the intensities and lifetimes were found to be completely reversible over multiple cycles (Figure 10). Both probes were tested for washout of the contact lenses. These tests were performed on both the parent probes without PL and with the PL-bound probes. These results showed that washout did not occur for SG-PL or PG-PL, but some washout occurred for SP-PL for the probes SG and PG without PL (Figure S4 and S5). The lack of probe washout, and the low amounts of probe bound to the lenses, suggests there will be no toxic effects on the cornea if worn by patients.
Another important consideration is interference of K+ measurements with the Na+ measurement. Interference by sodium is expected to be the dominant effect because the smaller Na+ ion can fit into the larger azacrown for K+ (Figure 2). There was no interference effect on the Na+ measurement due to high K+ concentration (Figure 11). A minor interference effect was observed for measurement of K+ in the presence of high Na+ concentration (Figure 11D). This minor effect is not likely to affect the K+ measurements because the high Na+ concentration varies over a narrow range compared to its total concentration in tears.
We questioned the probe distribution in the lenses and the lifetimes across the lenses. As expected, the intensity was highly variable depending on location (Figure 12). The intensity of each probe in the lens decreased to zero when the focal spot was off the edge of the lens. The intensity changes because the confocal spot of this was not adjusted to remain directly on the curved surface of the lens. In contrast to the intensities, the lifetimes of SG-PL via PG-PL were constant across the entire lens (Figure 12). The result suggests that lifetime-based lensing is possible with a labeled contact lens.
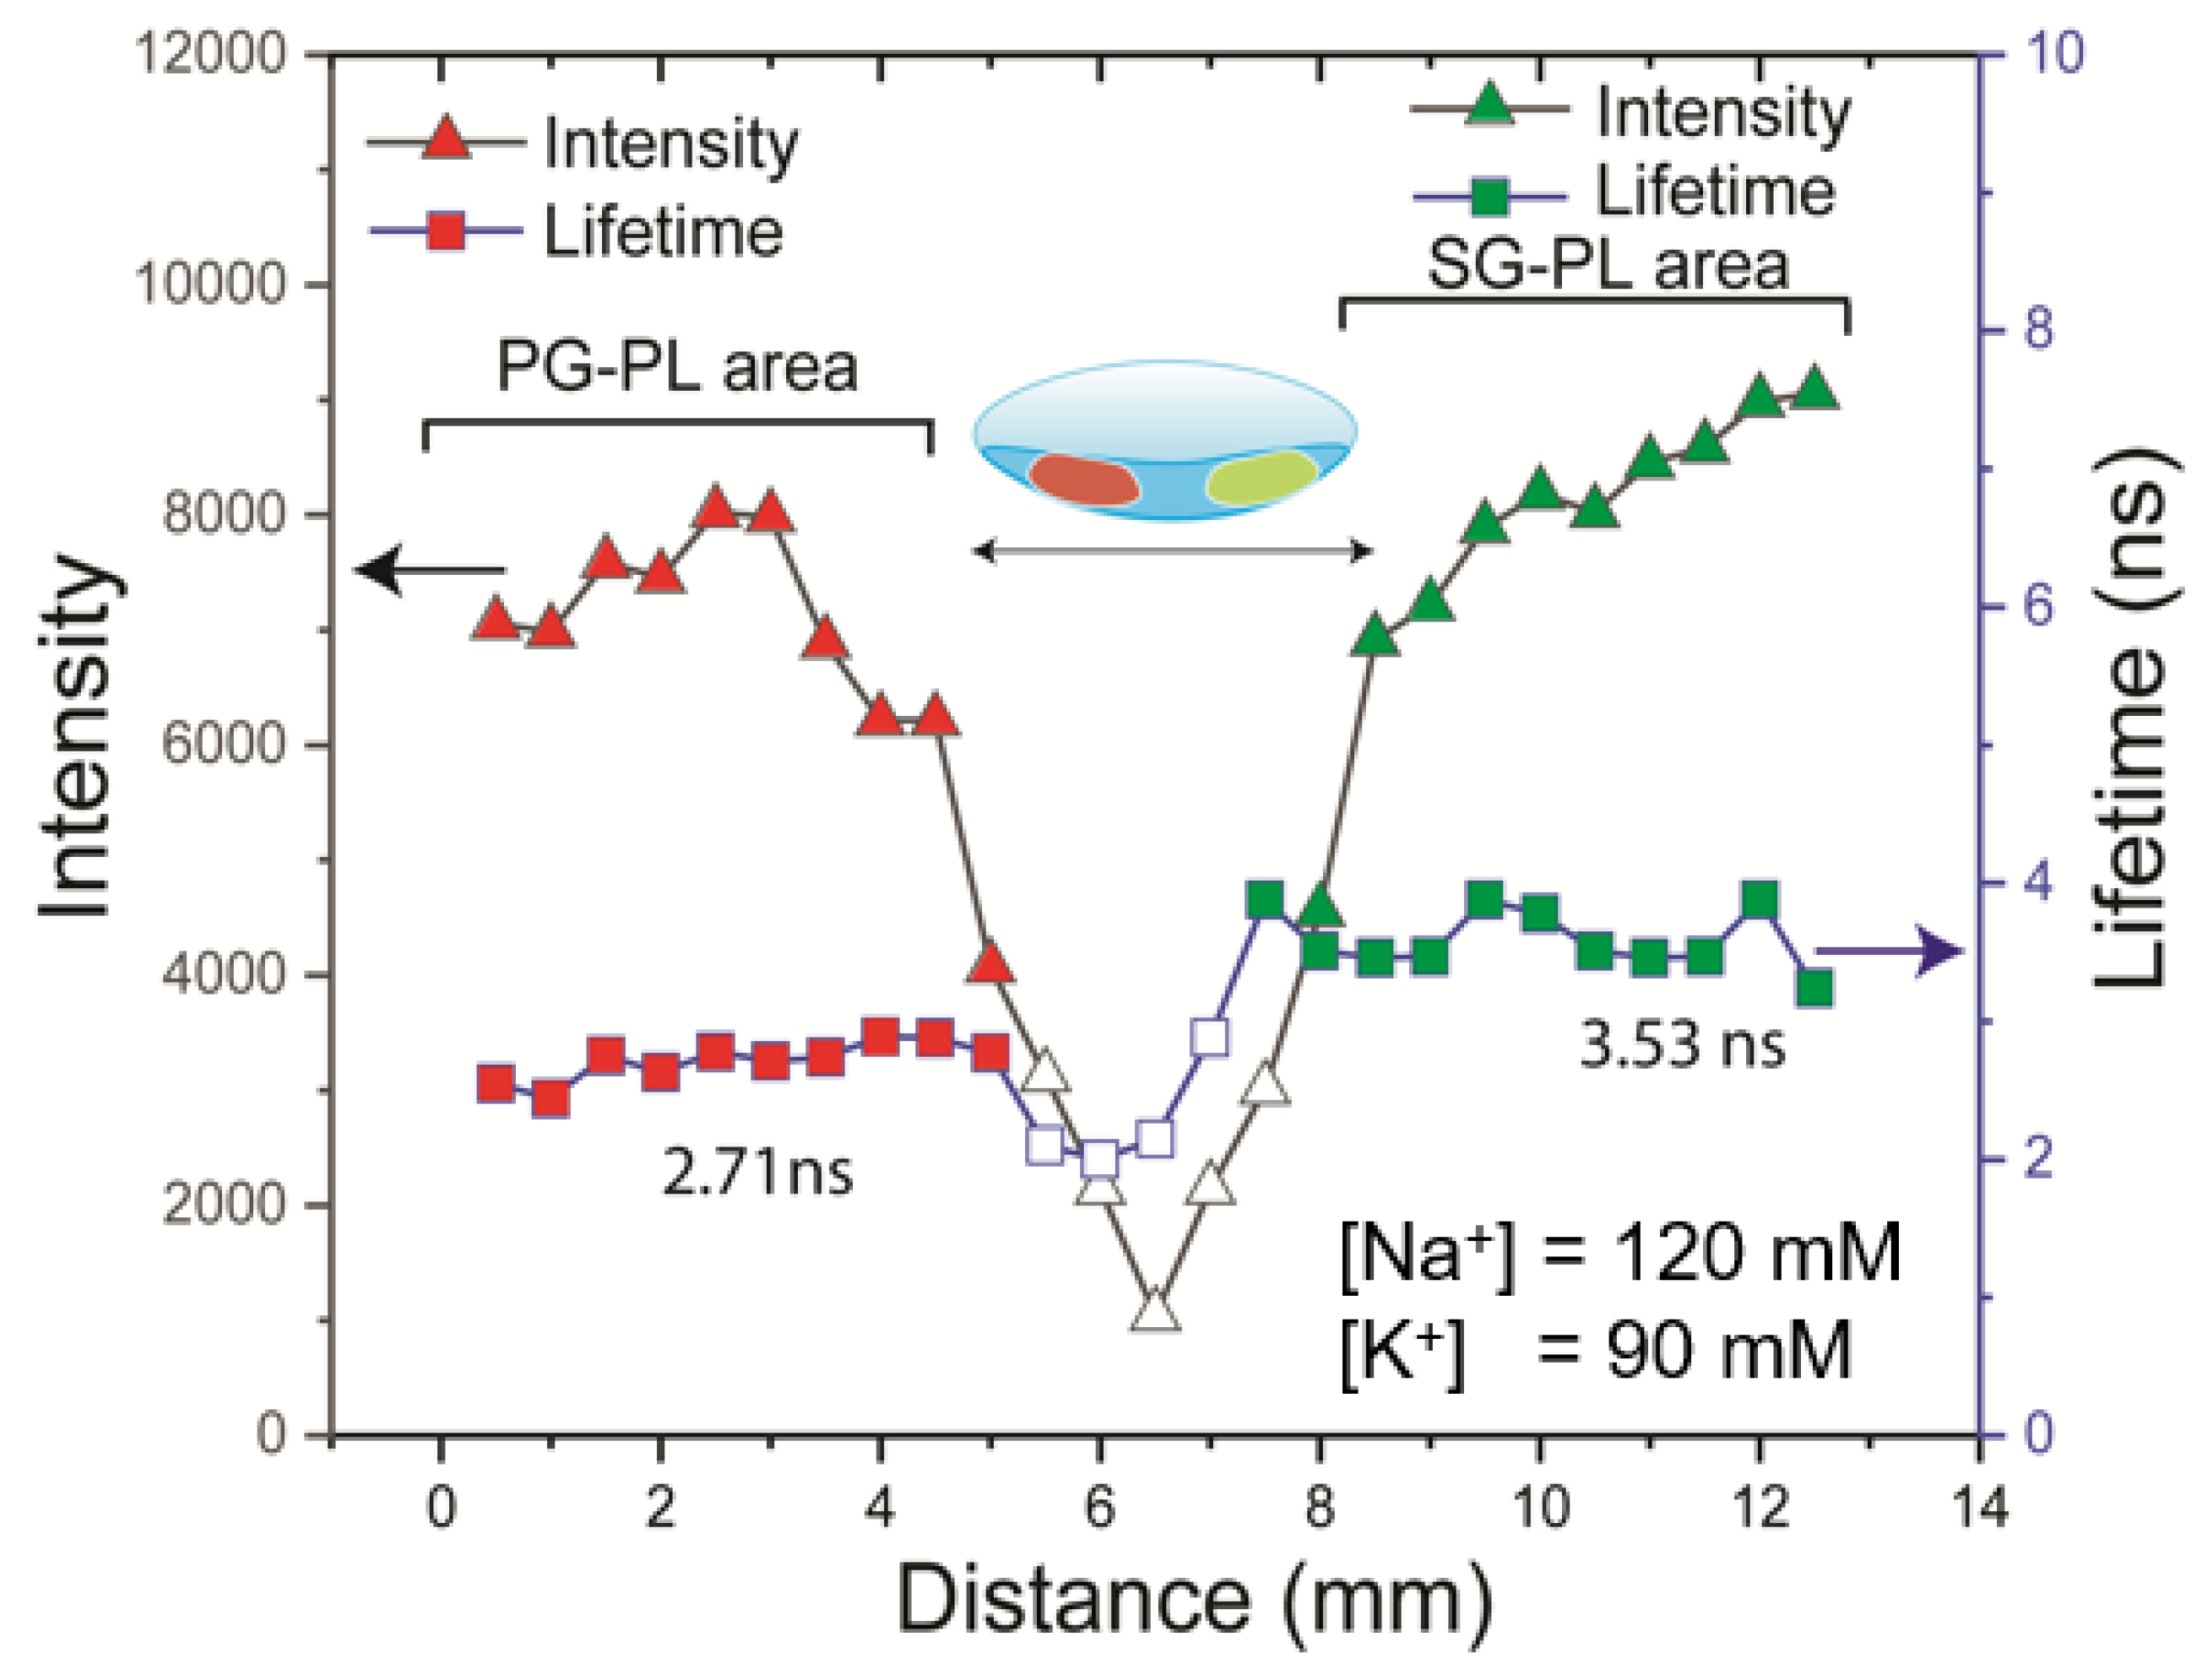
As a final test we placed all three probes in a single lens and recorded the emission spectra and wavelength-dependent lifetimes at various concentrations of Na+ and K+. However, the spectral overlap of the probes prevented the separate detection of the Na+ and K+ concentrations. We then proceeded with the option of separate locations of the probes on the lens. Because both the lens and probe solution were hydrophilic the spots from a micropipette spread rapidly. Hence, we then carefully dipped the edge of the lens into either a solution of SG-PL or PG-PL. The procedure provided a lens with one-half containing each probe and a blank region in the center (Figure 13). The intensity and lifetime measurements clearly showed the different spectral properties on each half of the lens. This result demonstrated that a successful NaK-CL contact lens can be made with the three probes used in this report.
4. Discussion and Conclusion
There are many advantages to the use of contact lenses for use in medical diagnostics and research. The present report on the DH-CL, the NaK-CL lens, represents only the first step in a longer-term development of NaK-CL lenses and fluorescent contact lenses for other sensing applications. We acknowledge its design is not ideal. The NaK-CL can be improved in several ways. For example, there is excessive overlap of the probes emission spectra, which partially diminishes the value of the RhB reference fluorophore. The difficulty can be easily overcome by a longer wavelength rhodamine derivative [50,51,52]. The emission spectra of SG-PL and PG-PL display too much overlap for simple independent measurements. It is highly likely that similar Na+ and K+ dependent probes can be developed, and useful structures are already known [53,54,55,56]. Additionally, the lifetimes of the three probes used in this report are too similar, and a larger difference between the values would more easily allow lifetime-based sensing to minimize the effects of patient motion.
There is an alternative approach to avoid the problems described above, which is to have the probes spatially separated in the lens. We have already demonstrated that the PL-linked probes do not migrate across the lens and that the PL-linked probes do not diffuse through the lens from the front to back surface [57]. The lenses by design are wet and have a hydrophobic surface. As a result, our early attempts to label spots were not successful and resulted in poorly localized probes. A large amount of research has been devoted to localize spotting of similar solutions on hydrophilic surfaces [58,59,60] and we are presently working on this topic.
There are other considerations for the clinical use of labeled contact lenses. Of course the lenses must be tested for toxicity, in particular effects on the sensitive corneal layer. The probe used in the presence NaK-CL are similar to those already in use in ophthalmology, such as fluorescein and Indocyanine green and the amount of probe in the lenses is much less than used for corneal staining. Additionally, we found that the PL-linked probes do not leach out of the lenses.
The NaK-CL will be simple to use in clinical practice. We have spoken with many individuals about their first use of contact lenses, some with HG lenses and the majority with SiHG lenses. For a large majority of the individuals the initial insertion of a lens was rapid and painless and none were reported to use an ocular anesthetic. The same ease-of-use results were found for most new CL users. We questioned the former chairman of Ophthalmology at the University of Maryland Baltimore, USA. He stated that he has never encountered a patient who did not readily adapt to the insertion of a SiHG lens, even patients who have never worn CLs.
New CL users adapted very quickly to their new lenses. The patients expressed a few minutes of blurred vision until the lens became centrally located on the eye. A small number of patients had some eye irritation for the first several days which quickly resolved sometimes with eye drops. The conclusions from this report are that patients above 4 years of age can wear sensing contact lenses in a hospital setting. Many of the elderly patients have previously worn contact lenses but later found regular glasses more convenient. The NaK-CL lenses will be fabricated without optical correction so the patient can continue with their present glasses for distance, reading or bifocals. Patients who require frequent blood draws will be happy to have a reduced number by using the NaCl lens.
Continuous vs on-demand ion concentration measurements. The type of measurements will depend on the design of the optical reader and the clinical requirements, and different devices can be designed for each type of measurement. The incident light does not need to be directed into the eye but can pass across the lens like the currently used slit lamps. For a NaK-CL the incident interaction will be much lower than a slit lamp. Given the current advanced state of electronics technology, and the variety of optical detectors reported for vision, there is no doubt that suitable devices could be developed. The CL readers could be a hand-held device such as a cell phone, or a pair of glasses with built in light sources and detectors as shown in Figure 1. The vast knowledge from medical and defense applications (such as LIDAR) for remote sensing insures the needed devices can be designed and constructed. At present the limited resources for research funding, and absence of the infrastructure needed for electronic design, we focused on the ion-sensing probes and measurement methods.
Response time of measurements. There are several different factors to consider the response time of the NaK-CL lens. The time response reported by the NaK-CL lens is likely to be closely related to the turnover time from the lachrymal duct secretions. The rate of tear turnover rate is near 17% per minute [61], so the time to replace the tear volume is near 5 minutes. The tear flow rate will typically increase when a lens is placed on the eye, which changes the tear composition. These effects typically return to the basal rate in 10 mins or less. The NaK-CL can be worn as long as needed for the tears to return to the hard level composition.
The response time of the NaK-CL can also be affected by the pathway of tear flow. Tears can flow around, over and under the CL. Flow around the lens may not affect the optical reading. Tear flow over the CL occurs with the pre-lens tear film (PLTF) and tear flow under the lens, between the lens and cornea, occurs in the post-lens tear film (PoLTF). The PoLTF is about 10-fold thinner than the PLTF and is expected to occur more slowly. Wash-out measurements of fluorescence dyes do not distinguish between these two film layers, but the multiple time constants indicate a slower component likely to be due to the PoLTF. These different flow paths and time constants could affect the time response of the NaK-CL. If diffusion of ions through the lens is rapid then both values will remain the same. Presently there is little information of ion transport rates through the pores of the lens. It is not practical to calculate time constants for these complex channels. Fortunately, there is a way to eliminate this transport effect, or if needed to measure exchange rates in the PLTF and PoLTF. We recently reported that Na+ and K+ dyes could be bound in the inner or outer layer of a CL, and the probes do not diffuse across the lenses from a period or days to weeks. If necessary, a NaK-CL can be placed on just the outer surface of the lens, in the PLTF, for detection in the faster flow region.
Errors in [K+] measurements. It is known from panel testing that the [K+] measurements often have great uncertainty than the [Na+] measurements. This is thought to result from the higher intracellular [K+] in cells near 150 mM as compared to the [K+] in blood near 4 mM and in tears near 24 mM (Table S1). Therefore, any cell damage during a blood draw will cause the K+ measurements to be elevated in the blood panel. This effect is not expected to be a problem with the NaK-CL because there are few cells in tears, and the measurements can always be delayed till tear exchange is complete.
Cost of the NaK-CL lenses. At present there are many research programs to develop sensing contact lenses [61,62,63,64]. Almost all these efforts are focused on known electrical and sensing measurements such as ion-selected electrodes with the size reduced to a fit with the contact lenses. A sample of these publications reveals a dependence on known sensing chemistry with reduced size to fit with a CL. If such opto-electronics contact lenses (OE-CL) will almost certainly be more expensive than our proposed lenses. Additionally, the surface chemistry of SiHG lenses has been evolving rapidly, and this could increase the costs of new DE-CL. The emphasis of OE-CL is likely the result of research projects located in engineering departments rather than biophysical chemistry and/or fluorescence laboratories. The research costs for fluorescent Na and K sensors for use in lenses are likely to be much less than the cost to develop a new OE-Cl.
Ethical considerations. The clinical testing of the NaK-CL lenses appears to be more straightforward than a new drug. The NaK-CL lenses can be tested for accuracy and safety without any significant risk to the patients. Almost all elderly patients admitted to the hospital will be subjected to an EB or BMP test, which is the current standard of medical care. The additional use of a NaK-CL will provide additional information about the patients Na+ and K+ concentration.
The measurements for the NaK-CL results can be used or not used to decide on further treatment or can be used to follow ion concentrations levels during rehydration treatment. Neurological damage can occur if rehydration is too rapid. Many of the SiHG lenses and FDA approved for 30 days of continuous wear, even while sleeping, because of high oxygen transport. The longer-term wear of the SiHG lens reduces the possibility of contaminants during insertion or deletion of the lenses. The present results on the possibility of a NaK-CL are likely to stimulate further development of this opportunity.
Supplementary Materials
The following supporting information can be downloaded at the website of this paper posted on Preprints.org. Figure S1: Schematic of the nanoporous contact lenses, Table S1: Electrolyte Concentrations in Serum, Tears, and Cells, Figure S2: Lens uptake SG-PL and PG-PL probe, Figure S3: The absorbance spectra, and Figure S4 and S5: Measurement of probe washout of SG and PG.
Author Contributions
Conceptualization, K.S. and J.L.; methodology, K.S.; software, K.S.; validation, K.S., J.L. and E.A.R.; formal analysis, K.S.; investigation, K.S. and J.L.; resources, J.L.; data curation, K.S. and J.L.; writing—original draft preparation, K.S. and J.L.; writing—review and editing, K.S., E.A.R., and J.L.; visualization, K.S., and J.L.; supervision, E.A.R., and J.L.; project administration, K.S., E.A.R., and J.L.; funding acquisition, J.L..
Funding
The authors thank the National Institute of General Medical Science for support by R35 GM 144147.
Acknowledgments
The authors thank the National Institutes of Health, NIGMS, R35-1244147 for their generous support.
References
- Costillo, L. (2023). The most surprising dehydration statistics in 2023, Gitnux Marketing Report 2023., 13 pp.
- Manz, F. , and Wentz, A. (2005). The importance of good hydration for the prevention of chronic diseases, Nutrition Rev., 63:S2-S5.
- El-Sharkawy, A. M. , Virdee, A., Wahab, A., Humes, D. J., Sahota, O., Devonald, M. A. J., and Lobo, D. N. (2017). Dehydration and clinical outcome in hospitalised older adults: cohort study, Eur. Ger. Med., 8:22-29.
- Michelis, M. F. (2009) Disorders of serum sodium concentration in the elderly patient, Chapter 16. American Society of Nephrology.
- Edmonds, C. J. , Foglia, E., Booth, P., Fu, C. H. Y., and Gardner, M. (2021). Dehydration in older people: A systematic review of the effects of dehydration on health outcomes, healthcare costs and cognitive performance, Arch. Geron. Geriatrics, 95:104380-1/12.
- Woff, A. , Stuckler, D., and McKee, M. (2015). Are patients admitted to hospitals from care homes dehydrated? J. Roc. Soc. Med., 108:259-265.
- Paulis, S. J. C. , Everink, I. H. J., Halfens, R. J. G., Lohrmann, C., and Schols, J. M. G. A. (2018). Prevalence and risk factors of dehydration among nursing home residents: A systematic review, J. Am. Med. Assoc., 19:646-657.
- Beck, A. M. , Seemer, J., Knudsen, A. W., and Munk, T. (2021). Narrative review of low-intake dehydration in older adults, Nutrients., 13:3142.
- Pross, N. (2017). Effects of dehydration on brain functioning: A life span perspective, Nutr. Metab., 70:30-36.
- Benelam, B. , and Wyness, L. (2010) Hydration and health: a review, Nutrition Bulletin, 35:3-25.
- Begum, M. N. , and Johnson, C. S. (2010). A review of the literature on dehydration in the institutionized elderly, Eur. J. Clin. Nutr. Metab., 5:e47-e53.
- Lavzzo-Mourey, R. (1987). Dehydration in the elderly: a short review, J.. Natl. Med. Assoc., 79:1033-1038.
- Hooper, L., et al. (2015). Clinical symptoms, signs and tests for identification of impending and current water-loss dehydration in older people, Cochrane Database Sys. Rev., 30:CD009647.
- Ladey, J. , et al. (2019). A multidisciplinary consensus on dehydration: definition, diagnostic methods and clinical implications, Ann. Med., 51:232-251.
- Thomas, D. R. , et al. (2008). Understanding clinical dehydration and its treatment, J. Am. Med. Dir. Assoc., 9:292-301.
- Braun, M. H. , Barstow, C. H., and Pyzocha, N. J. (2015). Diagnosis and management of sodium disorders: Hyponatremia and hypernatremia, Am. Fam. Phy., 91:299-307.
- Lombardi, G. , Ferraro, P. M., Calvaruso, L., Naticchia, A., D’Alonzo, S., and Gambaro, G. (2019). Sodium fluctuations and mortality in a general hospital population, Kidney Blood Pres Res., 44:604-614.
- Nicolini, E. A. , et al. (2017). Could dysnatremias play a role as independent factors to predict mortality in surgical critically ill patients? Medicine, 96:e6182.
- Pringle, K. , Shah, S. P., Umulisa, I., Munyaneza, R. B. M., et al. (2011). Comparing the accuracy of the three popular clinical dehydration scales in children with diarrhea, Int. J. Emer. Med., 4:1-6.
- Bunn, D. K. , and Hooper, L. (2019). Signs and symptooms of low-intake dehydration do not work in older care home residents, DRIE diagnostic study, J. Am. Med. Dir. Assoc., 20:963-970.
- Hooper, I., Abdelhamid, A., Attreed, N. J., Campbell, W. W., et al. (2015). Clinical symptoms, signs and tests for identification of impeding and current water-loss dehydration in older people. Cochrane Database Systemic Rev., 4:CD009647.
- Li, M. S. , Wong, H. L., Ip, Y. L., Peng, Z., Yiu, R., Yuan, H., Wong, JKW., and Chan, Y. K. (2022). Current and future perspectives on microfluidic tear analytic devices, ACS Sensors, 7:1300-1314.
- Shi, Y. , Jiang, N., Bikkannavar, P., Cordeiro, M. F., and Yetisen, A. K. (2021). Ophthalmic sensing technologies for ocular disease diagnostics, Analyst., 146:6416.
- Gray, M., Birkenfeld, J. S., and Butterworth, I. (2023). Noninvasive monitoring to detect dehydration: Are we there yet? Annu.Res. Biomed. Eng., 25:23-49.
- Scherz, W. , Doane, M.G., Dohlman, C.H. (1974) Tear volume in normal eyes and keratoconjunctivitis sicca, Albrecht von Graefes Arch. Klin. Ophthalmol., 192:141-150.
- Van Haeringen, N.J. (1981) Clinical biochemistry of tears. Surv Ophthalmol., 26(2):84-96.
- Kazuhiko, I. , Xinfeng, S., Kyoko, F., Tetsuji, Y., George, Y., James, Y. W. (2023) Biomimetic-Engineered Silicone Hydrogel Contact Lens Materials, ACS Applied Bio Materials, 6 (9): 3600-3616.
- Tranoudis, L. , and Efron, N. (2004). Tensile properties of soft contact lens materials, Con. Lens Ant. Eye., 27:177-191.
- Vhamra, T. S. , and Tighe, B. J. (2016). Mechanical properties of contact lenses: The contribution of measurement techniques and clinical feedback to 50 years of materials development. Con. Lens Ant. Eye.,40:70-81.
- Klimant, I. , and Wolfbeis, O. S. (1995). Oxygen-sensitive luminescent materials based on silicone-soluble ruthenium diimine complexes, Anal. Chem.., 67:3160-3166.
- Trettnak, W. , Gruber, W., Reininger, F., and Klimant, I. (1995). Recent progress in optical oxygen sensor instrumentation, Sen. Act. B. Chem., 29:219-225.
- Bambrick, I. L. , Kostov, Y., and Rao, G. (2011). In vitro cell culture pO2 is significantly different from incubator pO2, Am. J. Chem. Eng., 27:1185-1189.
- Castellano, F. N. , and Lakowicz, J. R. (1998). A water-soluble luminescence oxygen sensor, Photochem. Photobiol., 67:179-183.
- Shi, Y. , Jiang, N., Bikkannavar, P., Cordero, M. F., and Yetisen, A. K. (2021). Ophthalmic sensing technologies for ocular disease diagnostics, Analyst., 146:6416-6444.
- Savariraj, A. D. , Salih, A., Alam, F., Elsherif, M, Al Qattan, B., Khan, A. K., Yetisen, A. K., and Butt, H. (2021). Ophthalmic sensors and drug delivery, ACS Sensors., 6:2046-2076.
- Badugu, R. , Reece, E. A., and Lakowicz, J. R. (2018). Glucose-sensitive silicone hydrogel contact lens toward tear glucose monitoring, J. Biomed. Optics., 23:057006/1-9.
- Badugu, R. , Jeng, B. H., Reece, E. A., and Lakowicz, J. R. (2018). Anal. Biochem., 542:84-94.
- Badugu, R. , Szmacinski, Reece, E. A., Jeng, B. H., and Lakowicz, J. R. (2020). Fluorescent contact lens for continuous non-invasive measurements of sodium and chloride ion concentrations in tears, Anal. Biochem., 608:113902.
- Badugu, R. , Szmacinski, H., Reece, E. A., Jeng, B. H., and Lakowicz, J. R. (2021). Sodium-sensitive contact lens for diagnostics of ocular pathologies, Sen. Actuat. B., Chem., 331:129434.1-12.
- Sivashanmugan, K. , Reece, E.A., Lakowicz, J.R. (2025) On the Possibility of Fluorescent Capture Immunoassays on a Contact Lens, Biosensors, 15:326.
- Gromacki, S. J. (2013). Compliance with daily disposable contact lenses, Contact Lens Spectrum/Special Edition, p. 13. www.cispectrum.com.
- Dart, J. K. G. , Radford, C. F., Minassian, D., Verma, S., and Stapleton, F. (2008). Risk factors for microbial keratitis with contemporary contact lenses, Ophthal., 115:1647-1654.
- Scaduto, R. C. , and Grotyohann, L. W. (1999). Measurement of mitochondrial potential using fluorescent rhodamine derivatives, Biophys. J., 76:469-477.
- Reungpatthanaphong, P. , Dechsupa, S., Meesungnoen, J., Loetchutiant, C., and Mankhetkorn, S. (2003). Rhodamine B as a mitochondrial probe for measurement and monitoring of mitochondrial membrane potential in drug sensitive and resistant cells, J. Biochem. Biophys. Methods., 57:1-16.
- Szmacinski, H. , and Lakowicz, J. R. (1996). Frequency-domain lifetime measurements and sensing In highly scattering media, Sen. Actua. B., 30:207-15.
- Szmacinski, H. , and Lakowicz, J. R. (1993). Optical measurements of pH using fluorescence lifetimes and phase-modulation fluorometry, Anal. Chem., 85:1668-1674.
- Lakowicz, J. R. , Szmacinski, H., Nowaczyk, K., Berndt, K. W., and Johnson, M. L. (1992). Fluorescence lifetime imaging, Anal. Biochem., 202:316-330.
- Suhling, K. , et al. (2014). Fluorescence lifetime imaging (FLIM): Basic concepts and some recent developments, Med. Photonics, 27:3-40.
- Magalhaes, N. , Simoes, G. M., Ramos, C., Samelo, J., Oliveira, A. C., Filipe, H. A. L., Moreno, M. J., and Loura, L. M. S. (2022). Interactions between Rhodamine dyes and model membrane systems – Insights from Molecular Dynamics simulations, Molecules., 27:1-19.
- Wang, L. , Du, W., Hu, Z., Uvdal, K., Li, L., and Huang, W. (2019). Hybrid rhodamine fluorophores in the visible NIR region for biological imaging, Angew. Chemie Intl., 58:14026-14043.
- Fu, M. , Xiao, Y., Qian, X., Zhao, D., and Xu. Y. (2008). A design concept of long wavelength fluorescent analogs of rhodamine dyes: replacement of oxygen with silicon atom., Chem. Commun., 1780-1782,.
- Zhou, W. , Fang, X., Qiao, Q., Jiang, W., Zhang, Y., and Xu, Z. (2021). Quantitative assessment of rhodamine spectra., Chin. Chem. Letts., 32:943-946.
- Ueyama, H. , Takagi, M., and Takenaka, S. (2002). A novel potassium sensing in aqueous media with a synthetic oligonucleotide derivative, fluorescence resonance energy transfer associated with guanine quartet potassium ion complex formation, J. Amer. Chem. Soc., 124:14286-14287.
- CoroNa Red as a potential probe for intracellular sodium imaging. (2013)., FDSS Appl. Note No. 2. Hamamatsu Photonics.
- Boens, N. , Leen, V., and Dehaen, W. (2012). Fluorescent indicators based on BODIPY, Chem. Soc. Rev., 41:1130-1172.
- Hirata, T. , Terai, T., Komatsu, T., Hanaoka, K., and Nagano, T. (2011). Development of a potassium ion-selective fluorescent sensor based on 3-styrylated BODIPY, Bior Med. Chem. Letts., 21:6090-6093.
- Lakowicz, J. R. , Badugu, R., Sivashanmugan, K., and Reece, E. A. (2023). Remote measurements of tear electrolyte concentrations on both sides of an inserted contact lens, Chemosen., 11:11080463-1/14.
- Ho, T. A. , Papayassiliou, D. V., Lee, L. L., and Striolo, A. (2011). Liquid water can slip on a hydrophilic surface, Proc. Natl. Acad. Sci., 108:16170-16175.
- Guo, Z. , Zhang, L., Monga, D., Stone, H. A. and Dai, X. (2021). Hydrophilic slippery surface enabled coarsening effect for rapid water harvesting, Cell Rep. Phy. Sci. 4:100387.
- Kanduc, M. , Schlaich, A., Schneck, E., and Netz, R. R. (2016). Water mediated interactions between hydrophilic and hydrophobic surfaces, Langmuir ., 32:8767-8782.
- Webber, W. R. S. , Jones, D. P., and Wright, P. (1987). Fluorophotometric measurements of tear turnover rate in normal healthy persons: Evidence for a circadian rhythm, Eye., 1:615-620.
- Kim, J. , Kim, M., Lee, M-S., Kim, K., Ji, S, Kim, Y-T., Park, J., Na, K., Bae, K-H., Kim, H. K., Bien, R., Lee, C. Y., and Park, J-U. (2017). Wearable smart sensor systems integrated on soft contact lenses for wireless ocular diagnostics, Nature Comm., 8:14997-1/7.
- Elsherif, M. , Moreddu, R., Alam, F., Salih, A. E., Ahmed, I., and Butt, H. (2022). Wearable smart contact lenses for continual glucose monitoring: A review. Front. Med, 9:1-15.
- Shetty, K. H. , Desai, D. T., Patel, H. P., Shah, D. O., Willcox, M. D. P., and Maulvi, F. A. (2024). Contact lens as an emerging platform for non-invasive bio-sensing: A Rev.,Sens. Actua. B., Phys., 376:115617-1/16.
Figure 1.
Schematic illustrating commercially available glasses with built with electrical and optical components and an image of the proposed dehydration contact lens. Bottom row shows the fluorescence methods available for measuring emission for labeled contact lenses.
Figure 1.
Schematic illustrating commercially available glasses with built with electrical and optical components and an image of the proposed dehydration contact lens. Bottom row shows the fluorescence methods available for measuring emission for labeled contact lenses.
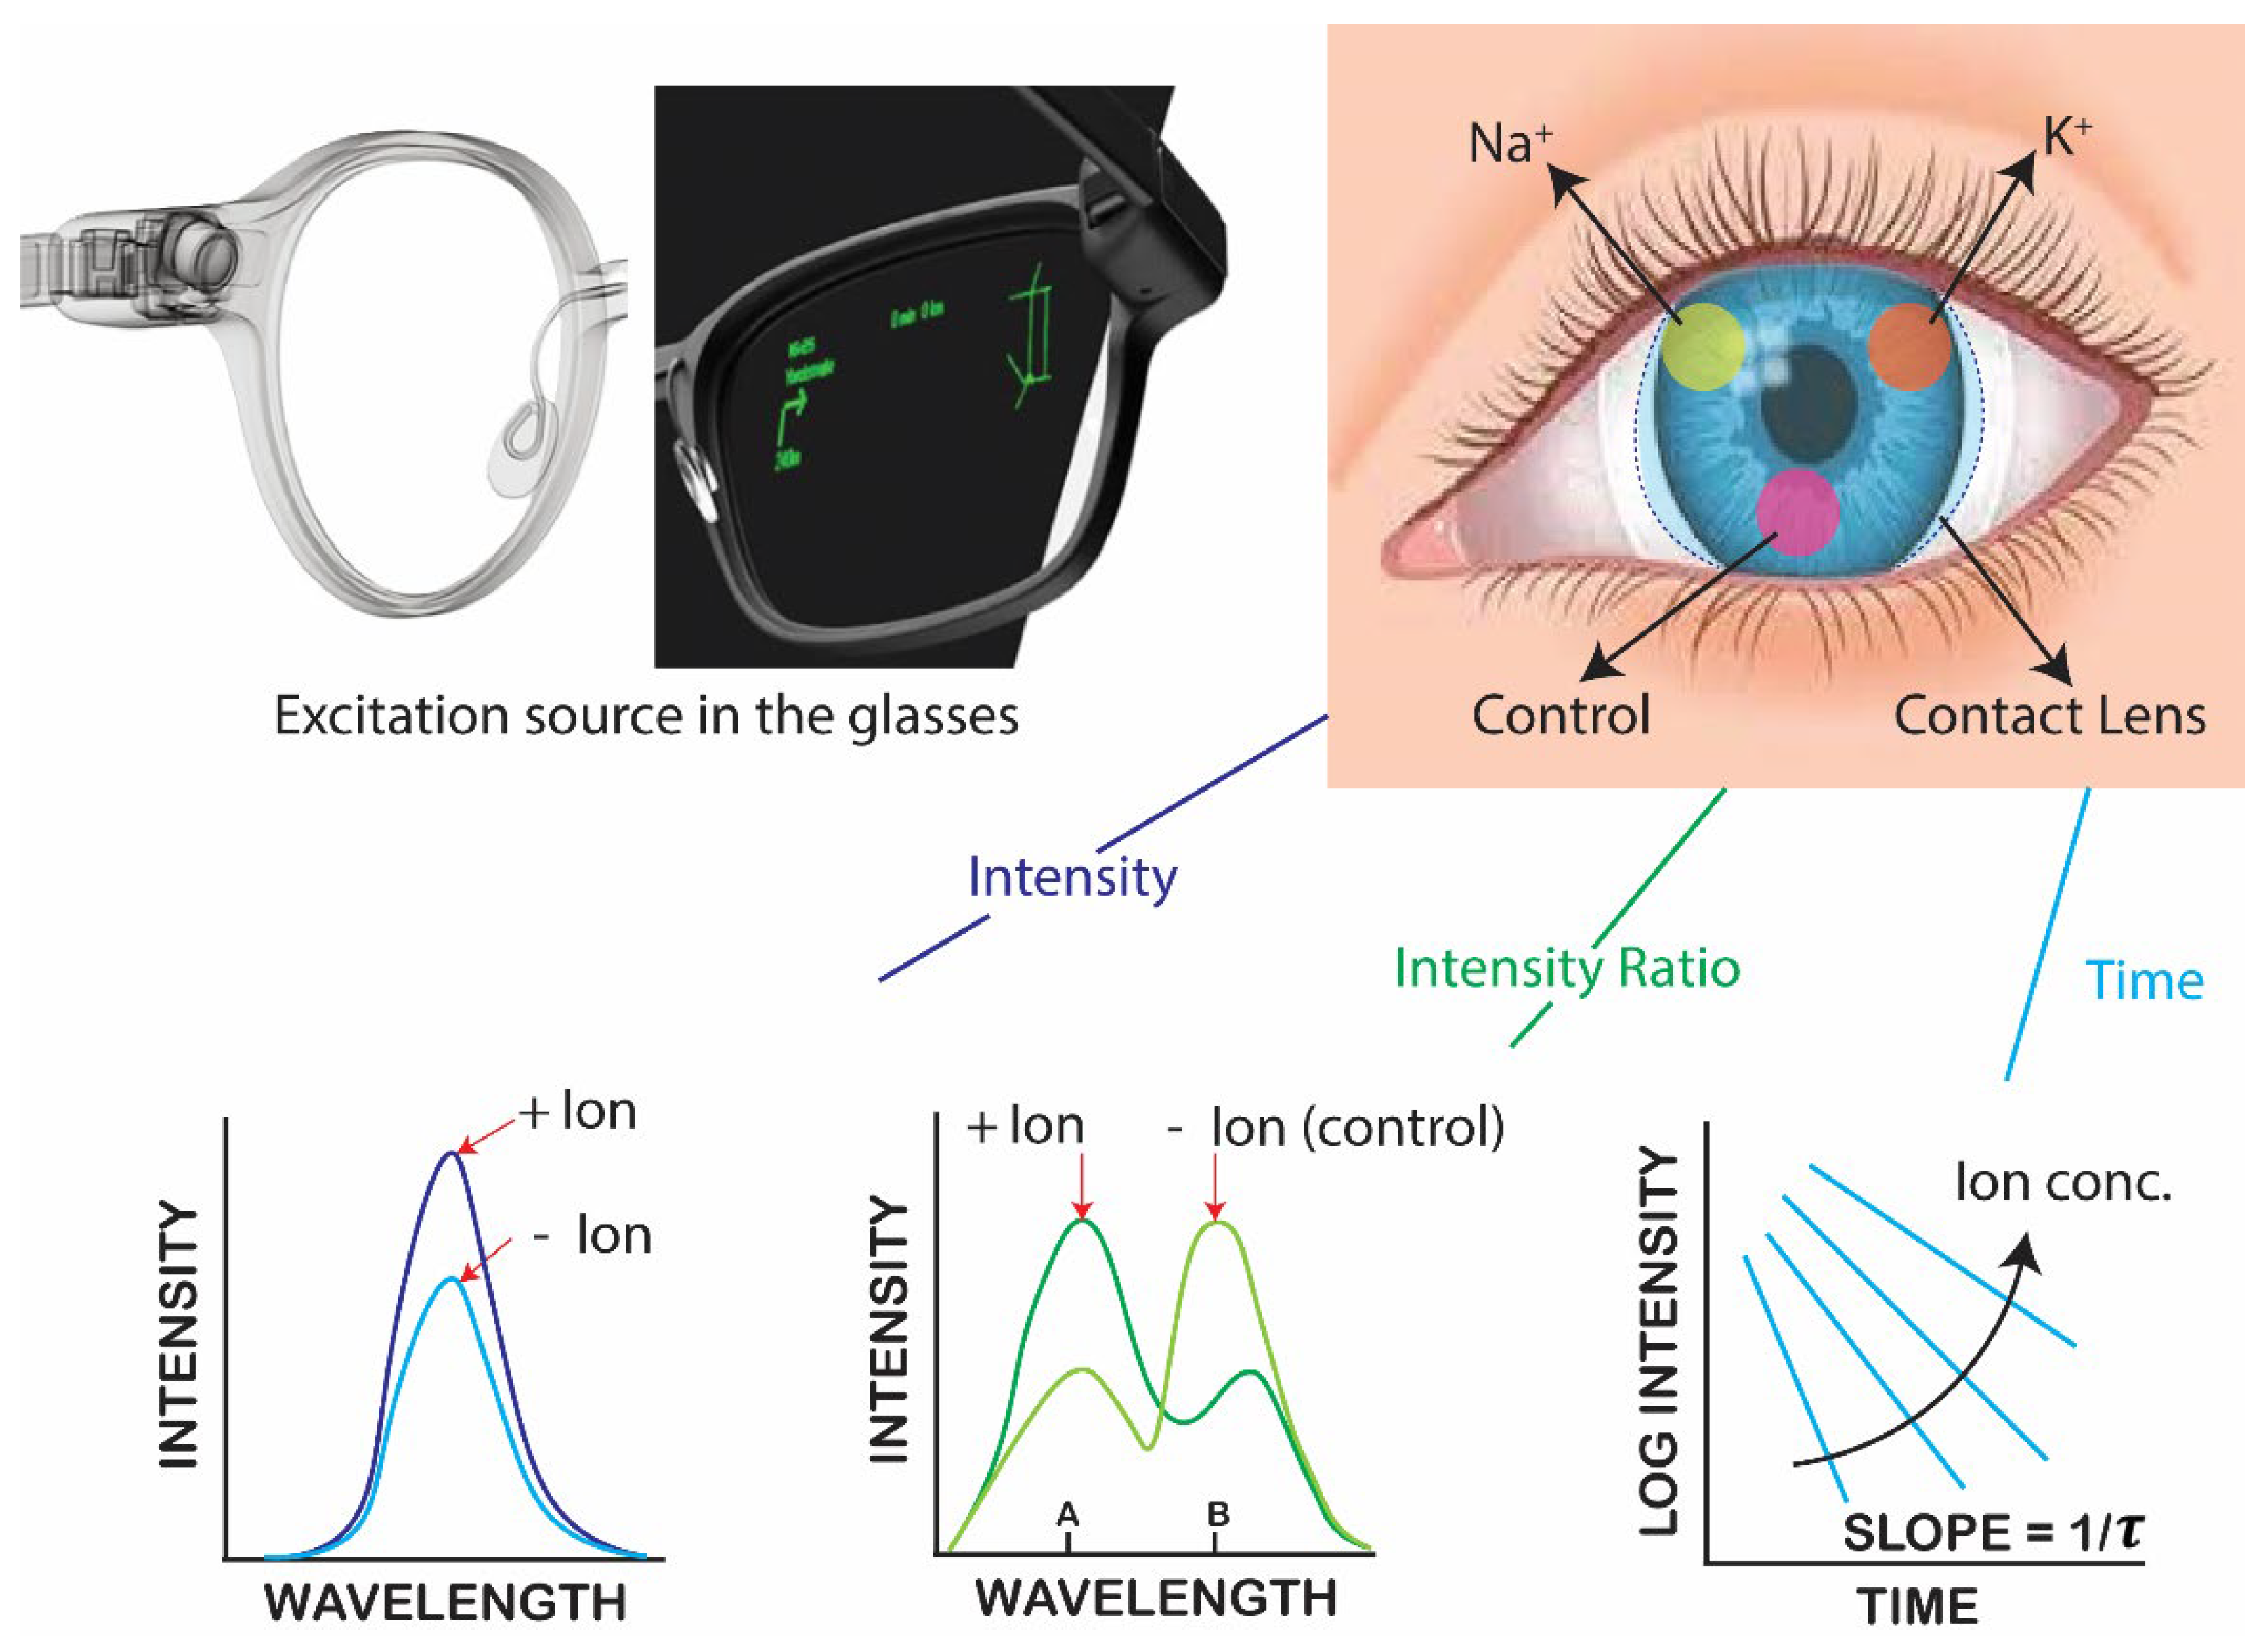
Figure 2.
(A) Chemical synthesis and structure of sodium green poly-lysine (SG-PL), (B) potassium green (PG-PL) poly-lysine, and (C) structure of the reference probe rhodamine B.
Figure 2.
(A) Chemical synthesis and structure of sodium green poly-lysine (SG-PL), (B) potassium green (PG-PL) poly-lysine, and (C) structure of the reference probe rhodamine B.
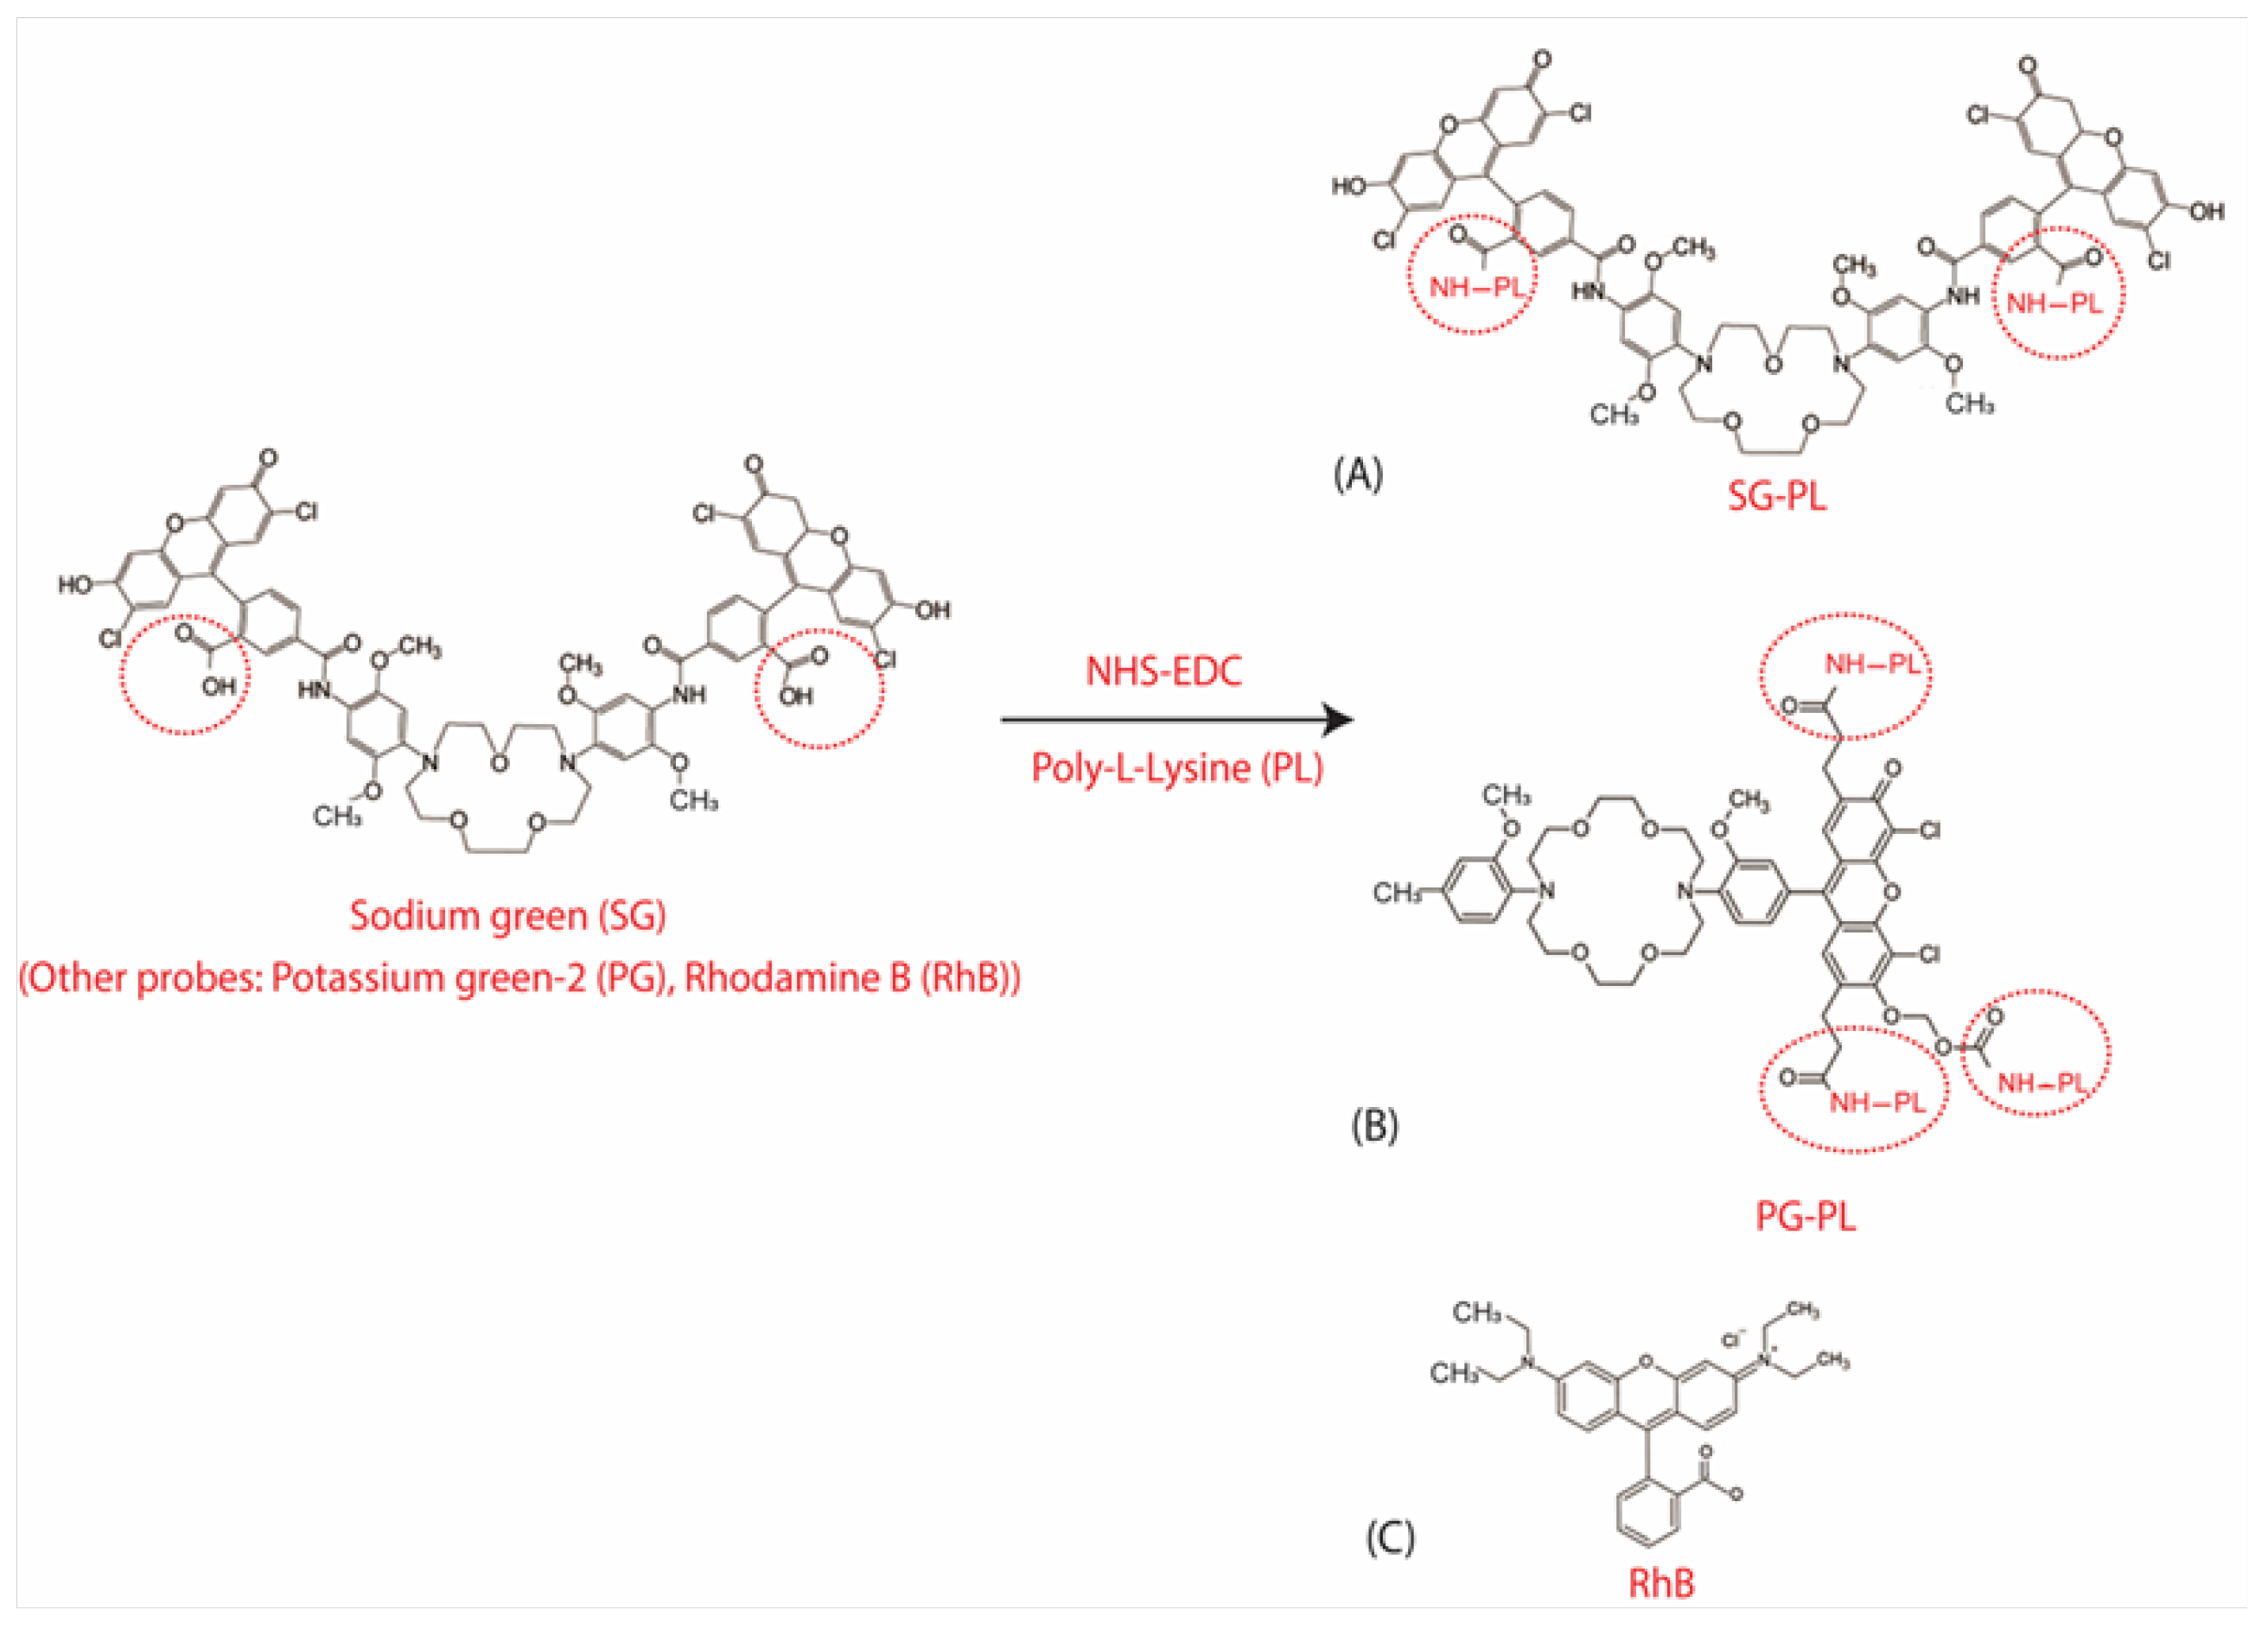
Figure 3.
Absorption and emission spectra of SG-PL, PG-PL, and RhB probe solutions. The absorption and emission spectra were measured using 20 µL aliquots of the as-prepared reaction mixture diluted in 2 mL of water.
Figure 3.
Absorption and emission spectra of SG-PL, PG-PL, and RhB probe solutions. The absorption and emission spectra were measured using 20 µL aliquots of the as-prepared reaction mixture diluted in 2 mL of water.
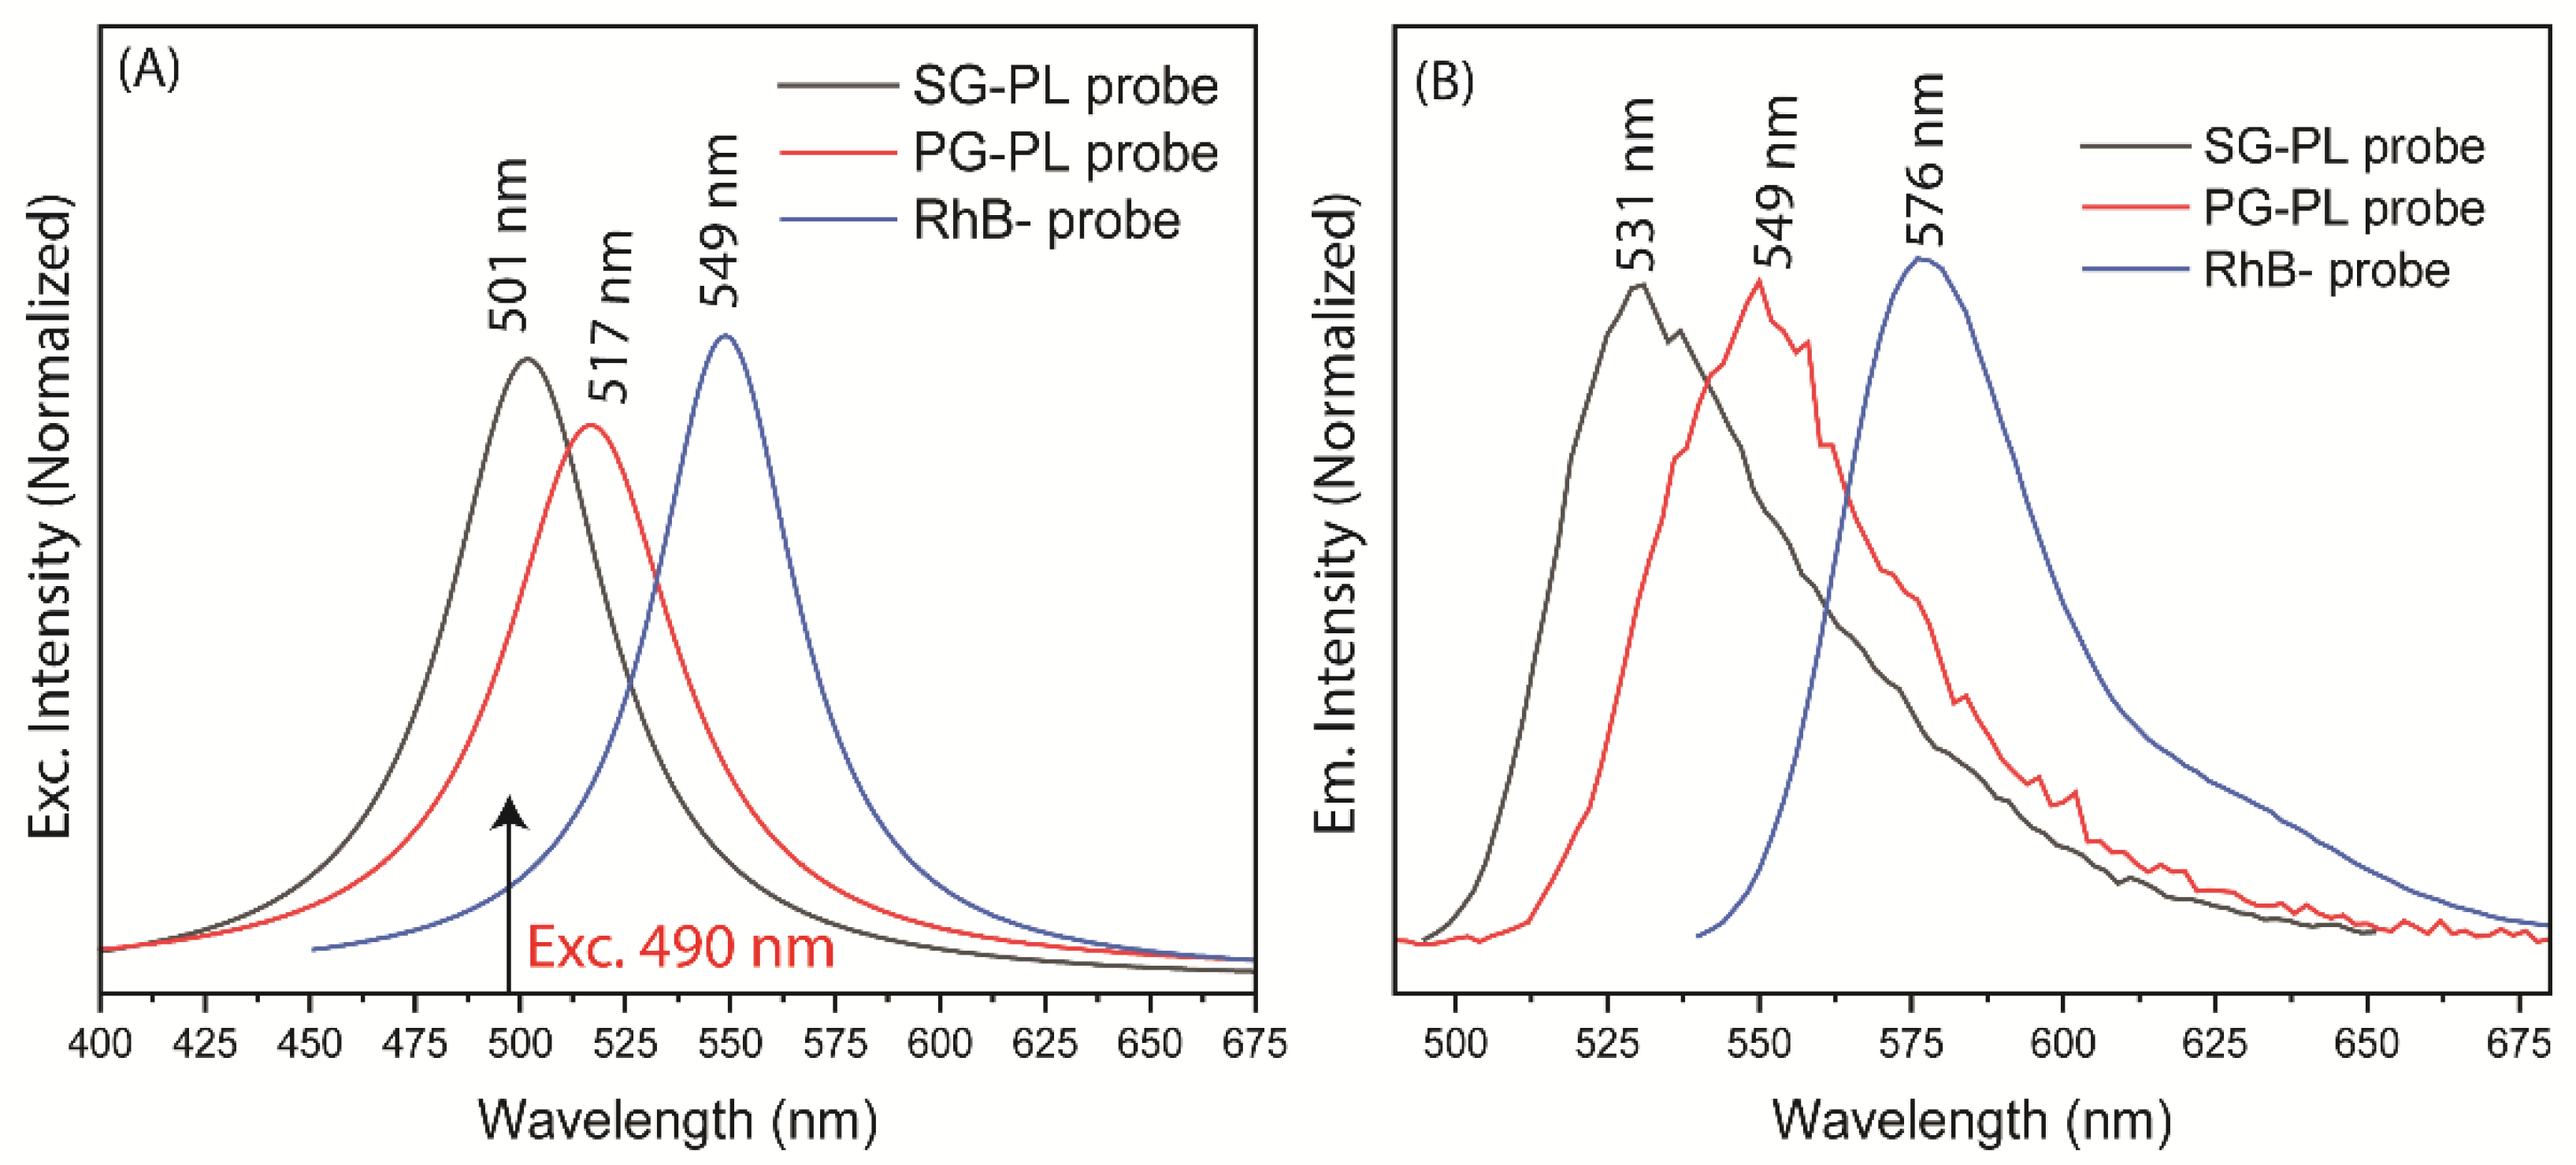
Figure 4.
Photographs of the lenses labeled with SG-PL, PG-PL and RhB in Lot A lenses. Left, white images and right, under a UV-handlamp.
Figure 4.
Photographs of the lenses labeled with SG-PL, PG-PL and RhB in Lot A lenses. Left, white images and right, under a UV-handlamp.
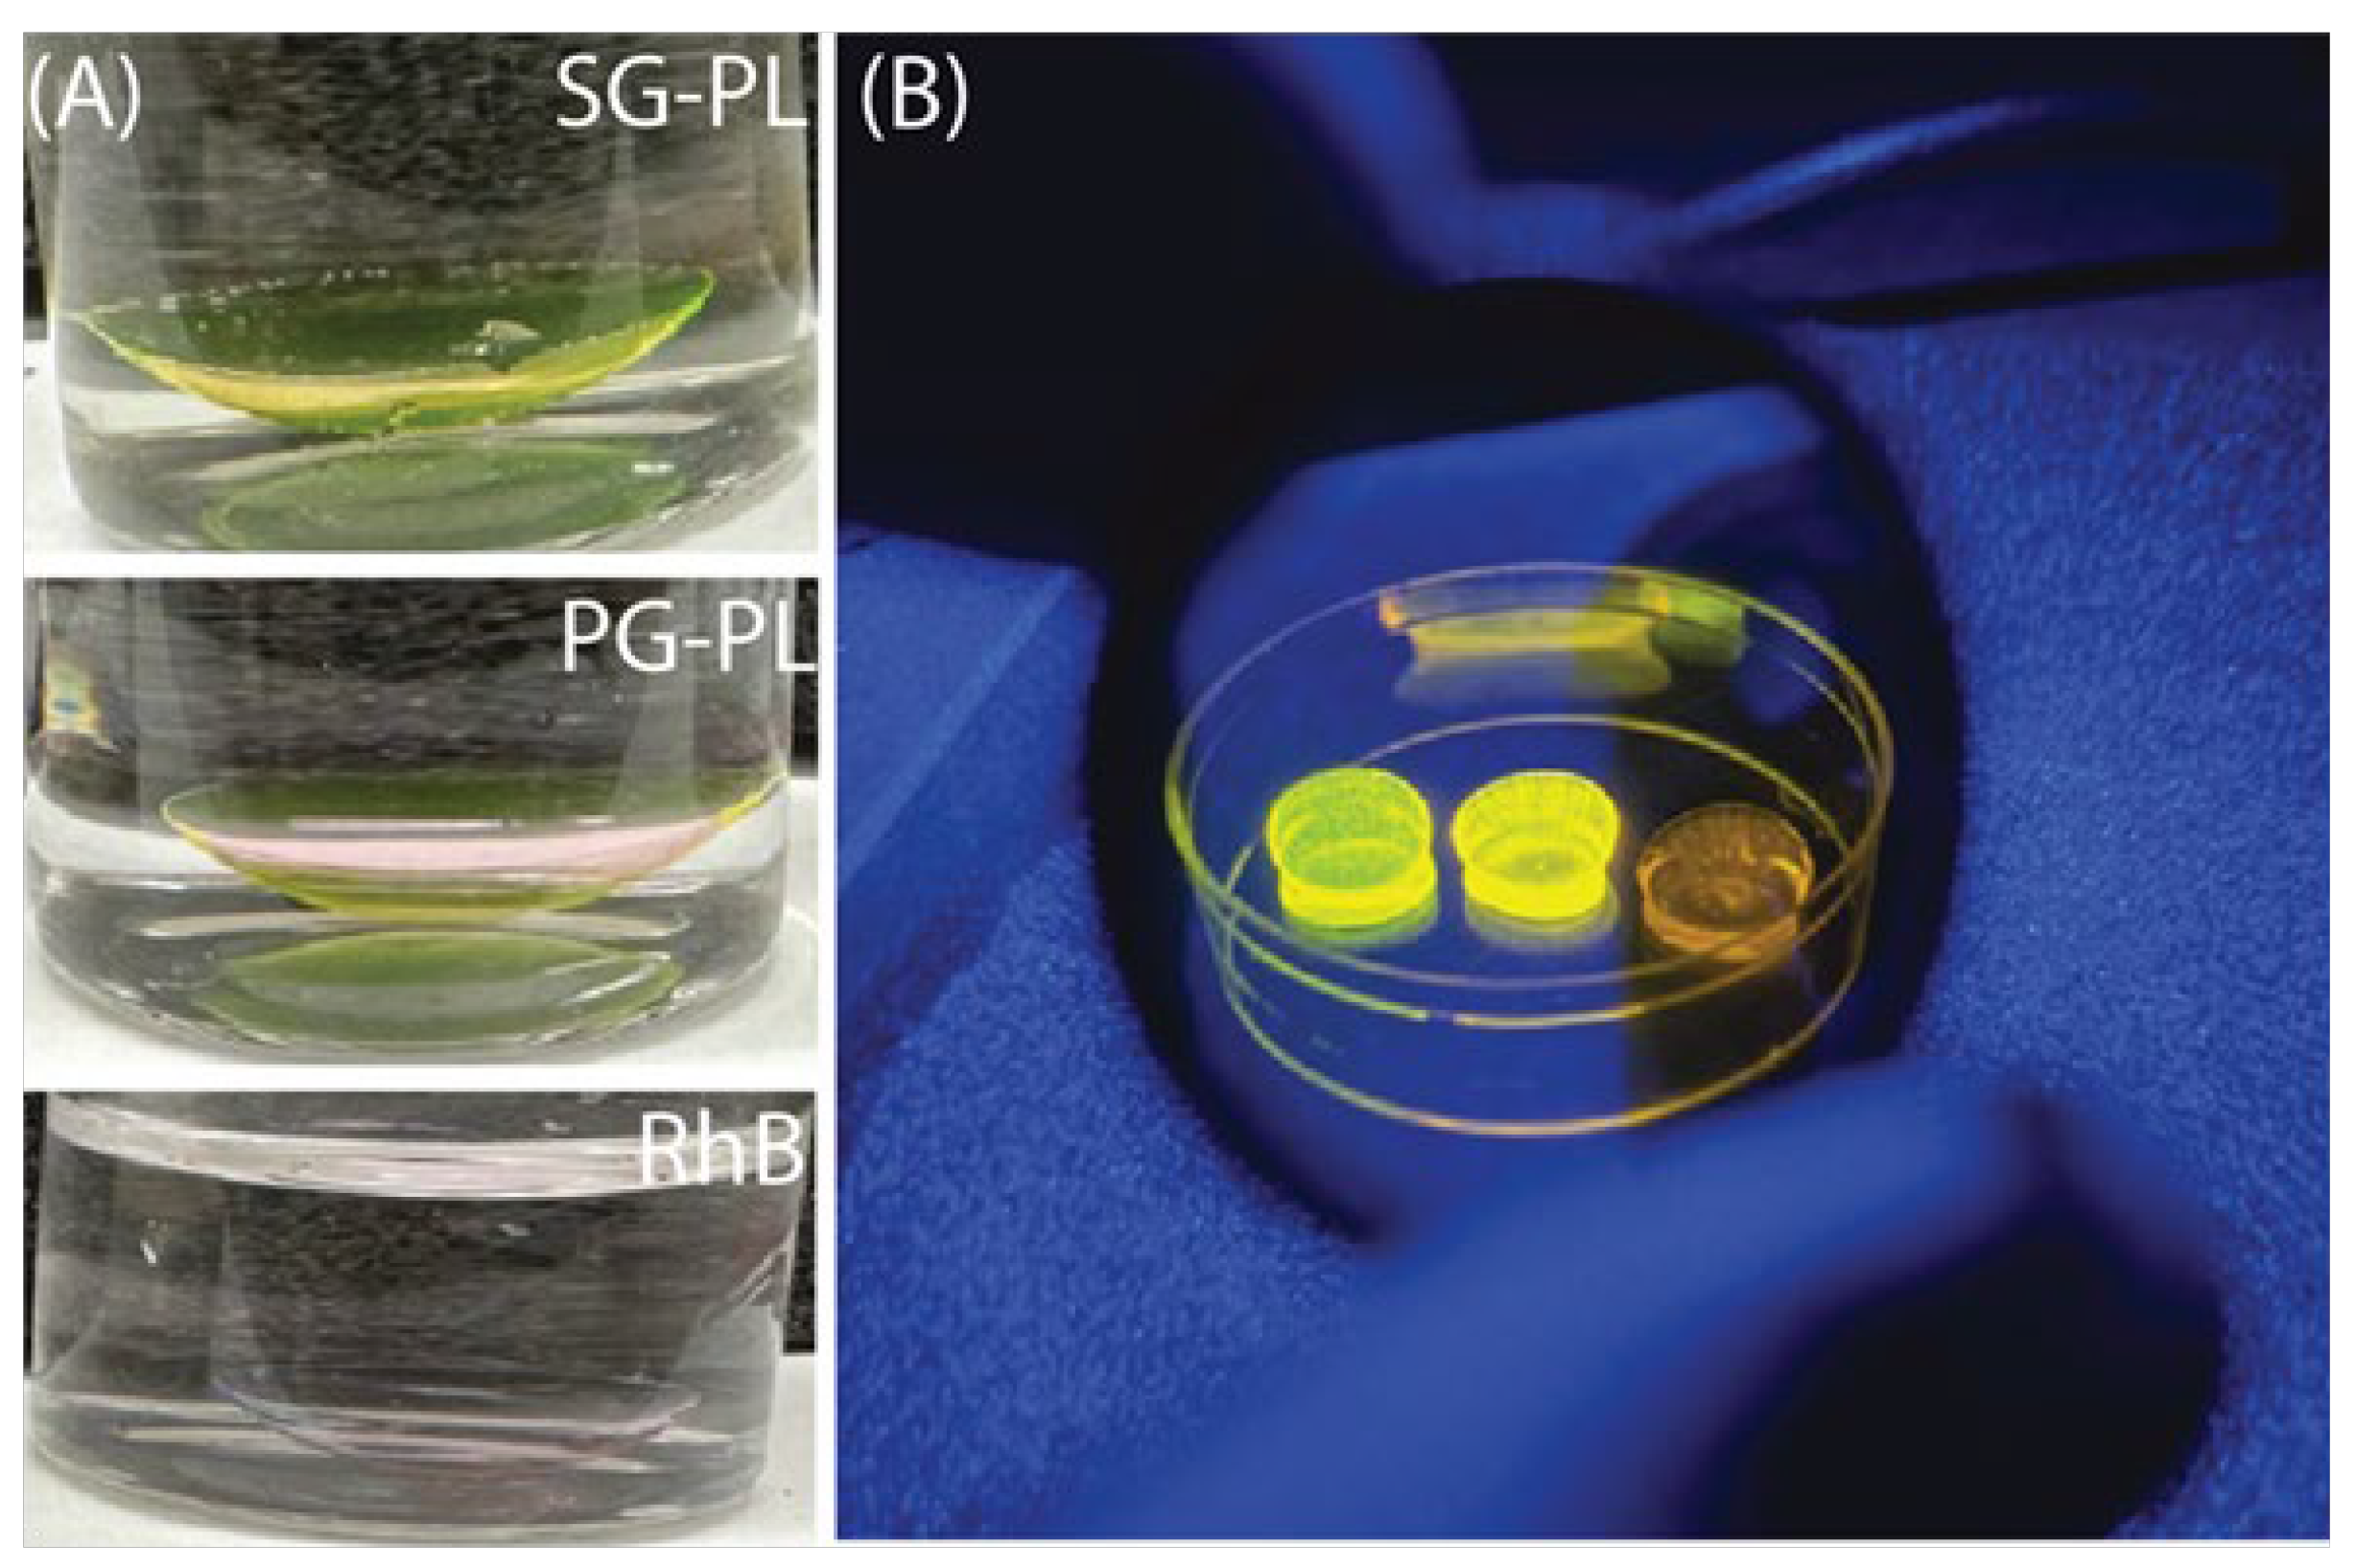
Figure 5.
(A) Sodium response of SG-PLand RhB bound to two separate Lot A lenses. (B) SG-PL and RhB both bound to the same Lot A lenses. Arrows indicate peak intensity wavelength of 531 nm.
Figure 5.
(A) Sodium response of SG-PLand RhB bound to two separate Lot A lenses. (B) SG-PL and RhB both bound to the same Lot A lenses. Arrows indicate peak intensity wavelength of 531 nm.
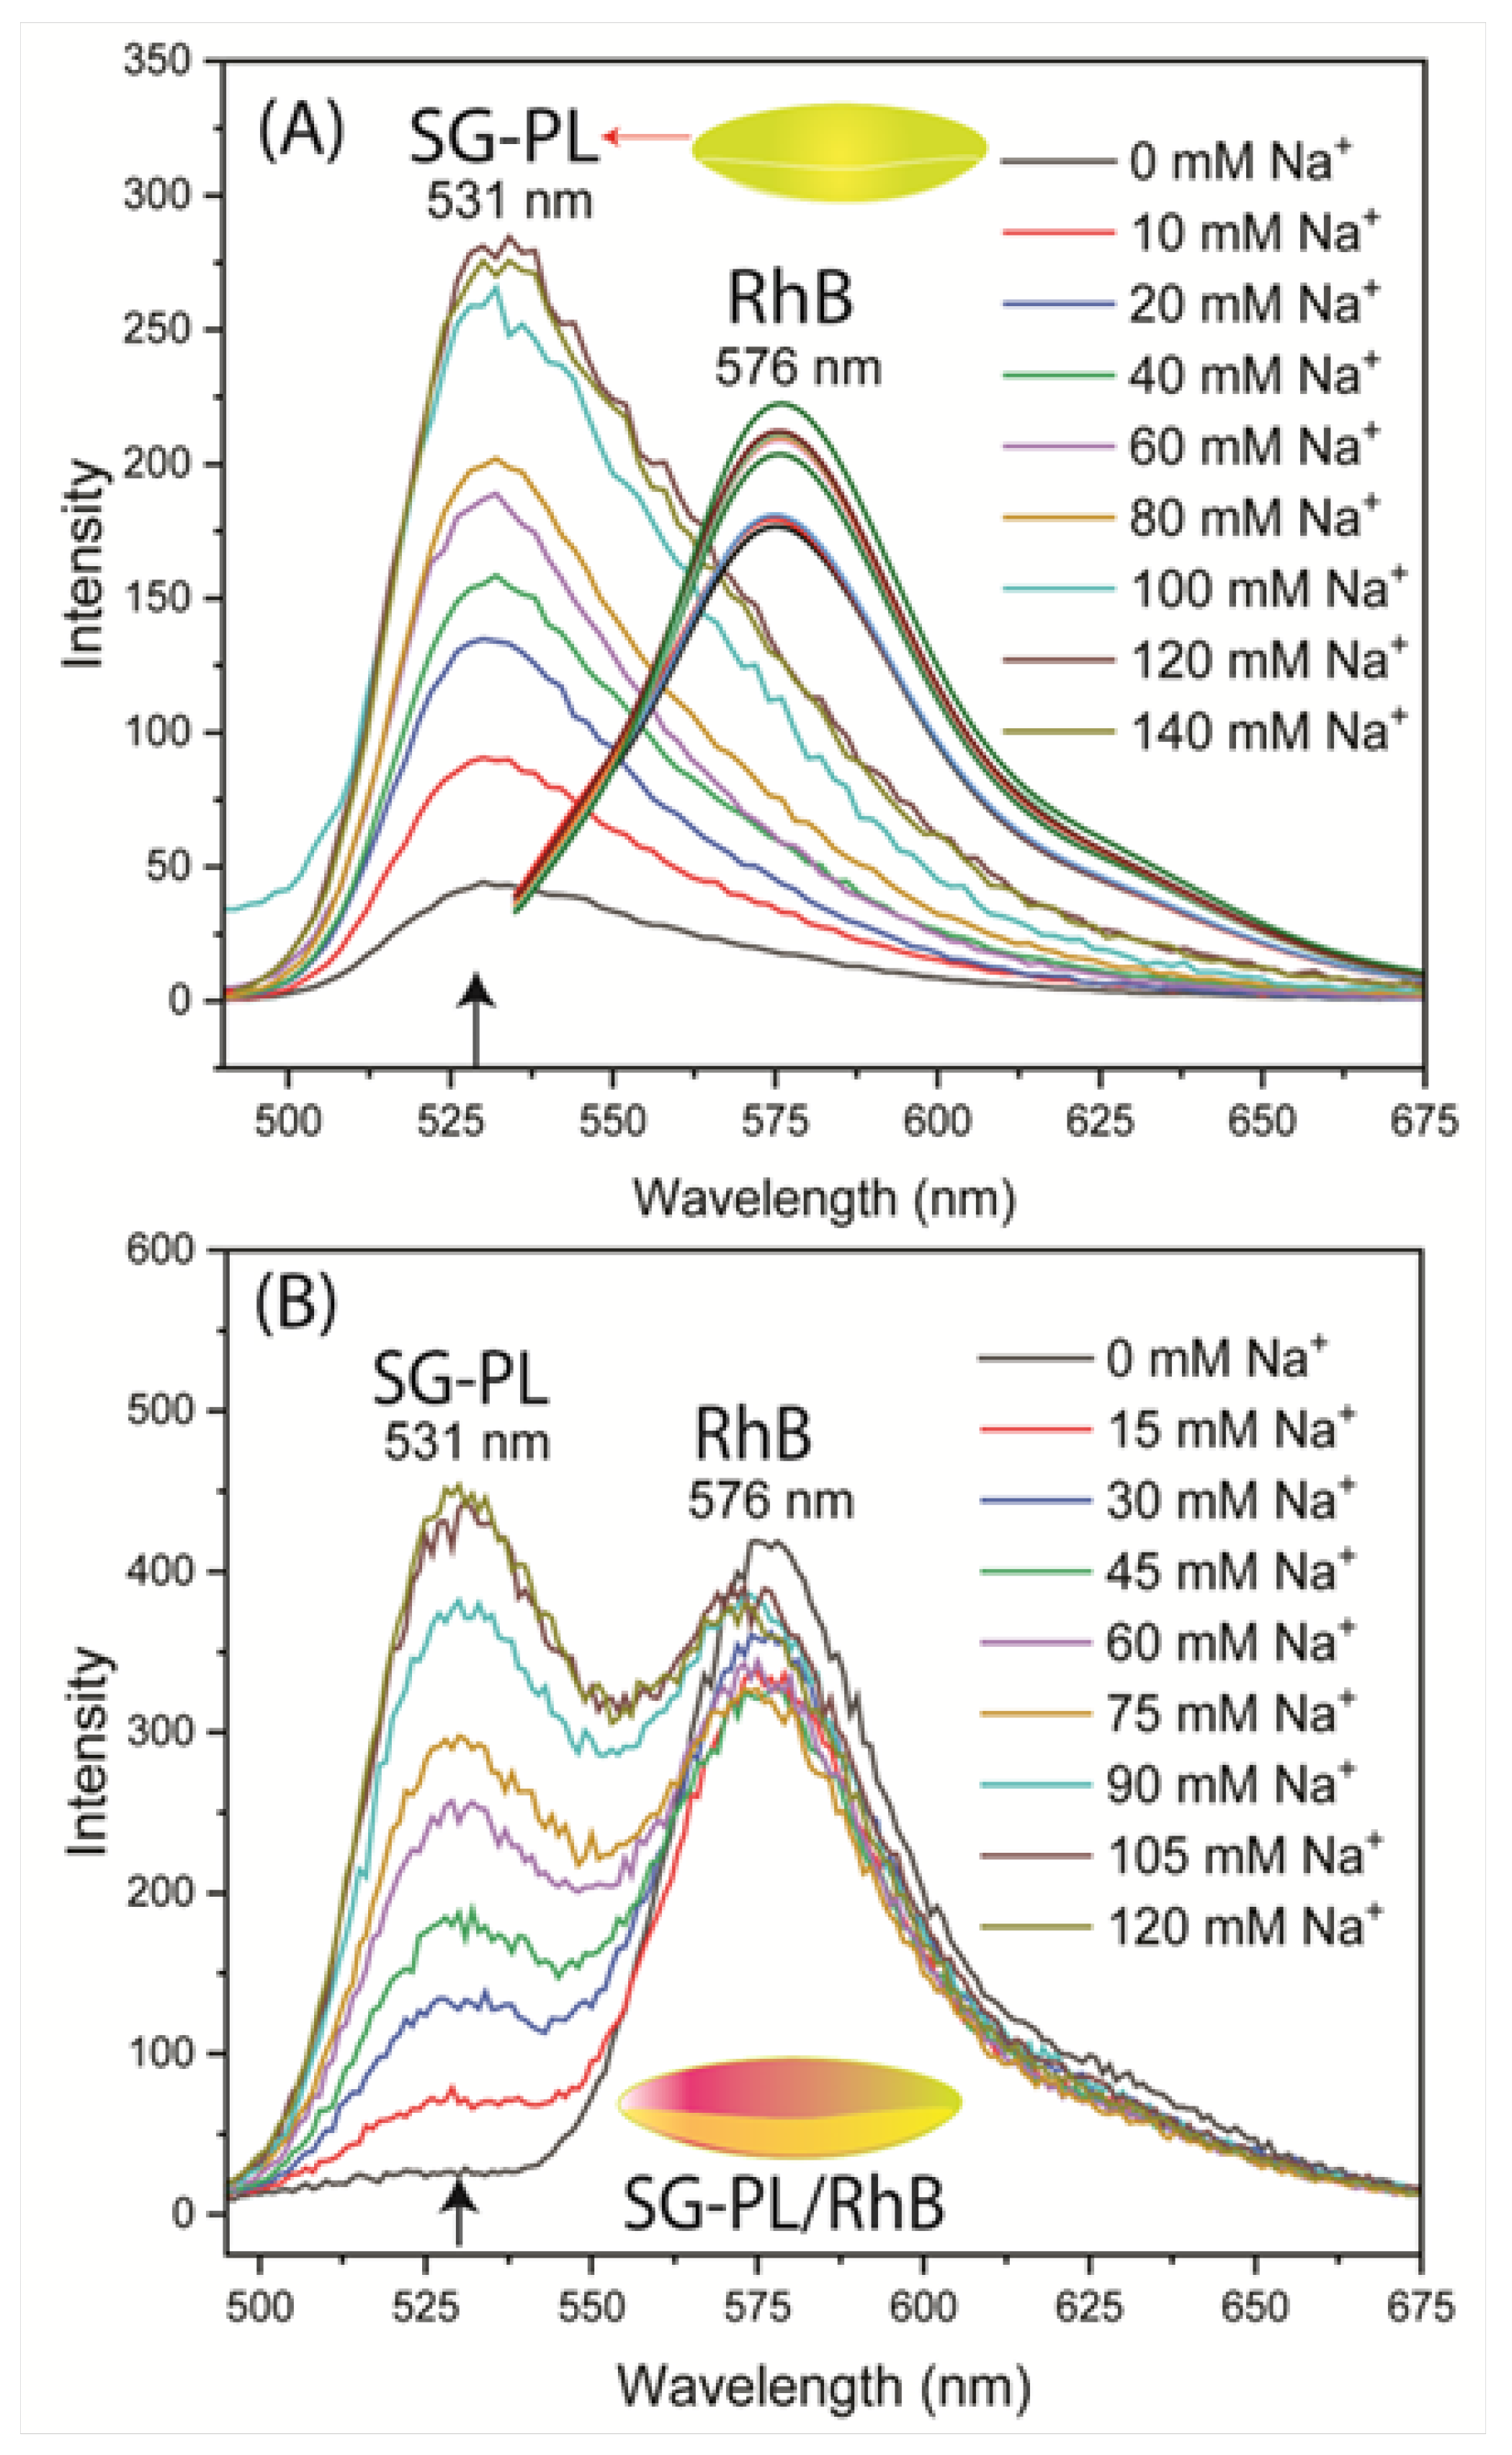
Figure 6.
(A) Potassium response of PG-PL and control RhB bound to two separate Lot A lenses. (B) PG-PL and RhB both bound to the same Lot A lenses. Arrows indicate peak intensity wavelength of 549 nm.
Figure 6.
(A) Potassium response of PG-PL and control RhB bound to two separate Lot A lenses. (B) PG-PL and RhB both bound to the same Lot A lenses. Arrows indicate peak intensity wavelength of 549 nm.
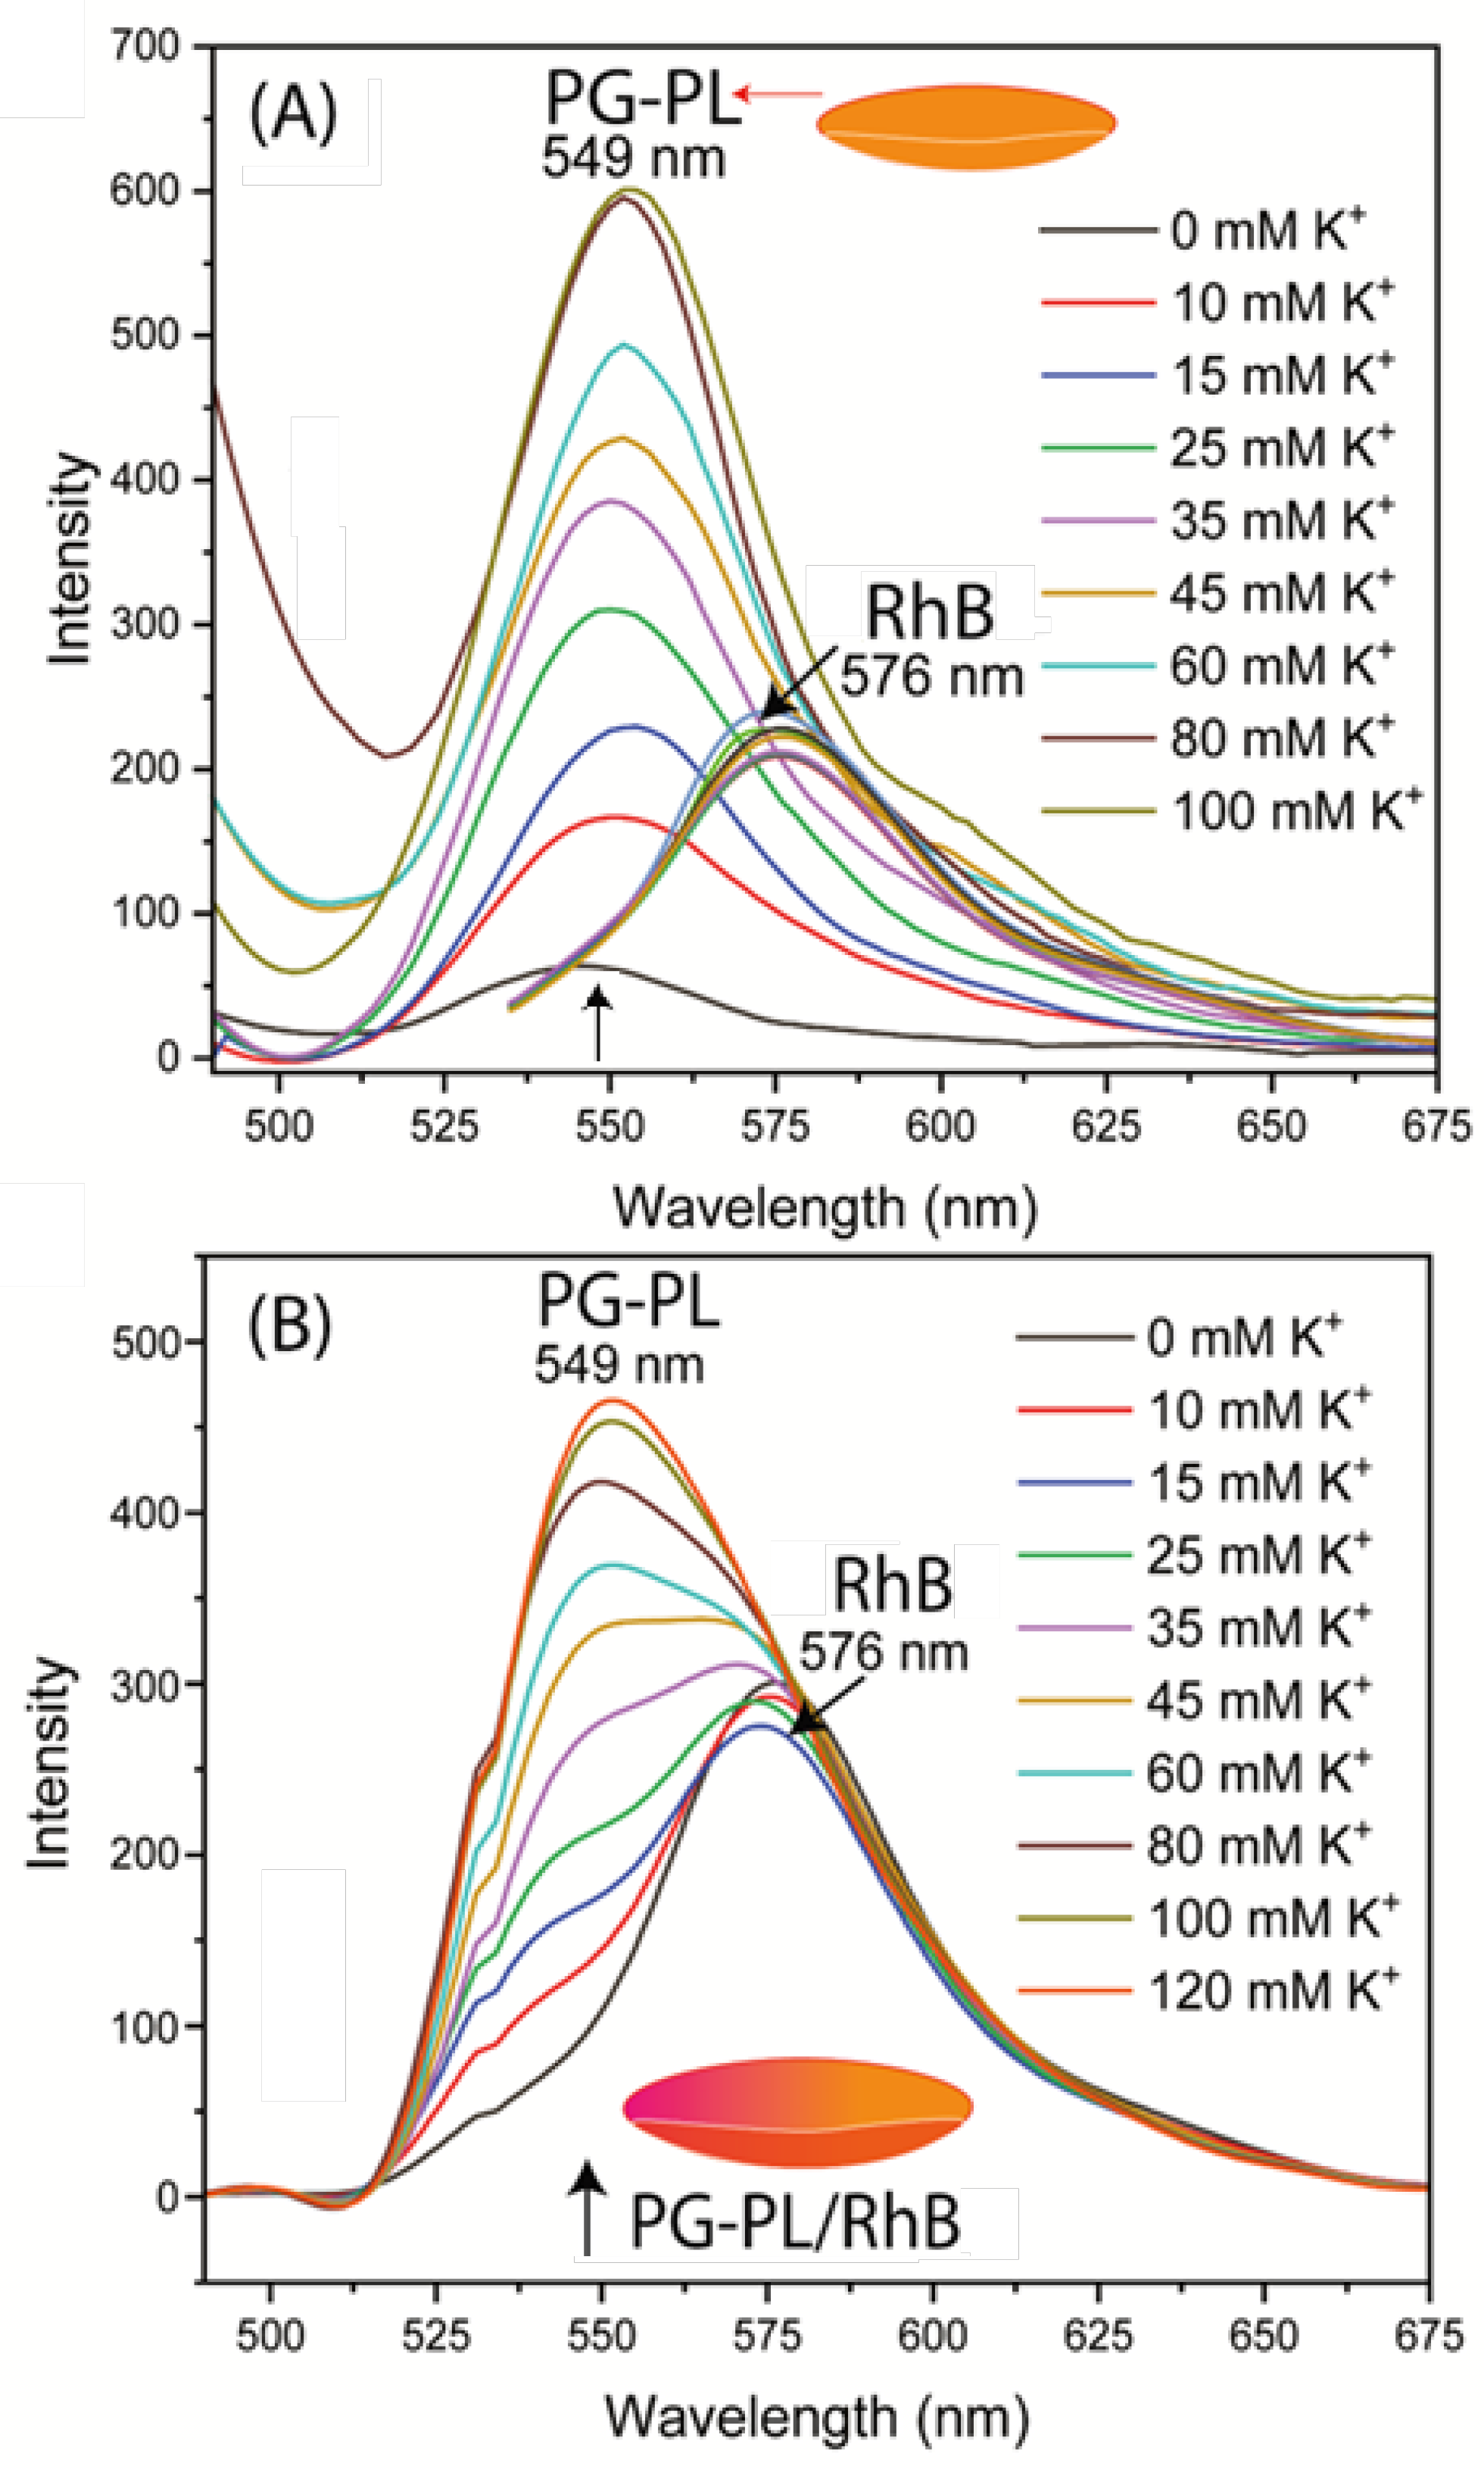
Figure 7.
Effects of sodium on the intensities of SG-PL at 531nm (A), and effects of potassium on PG-PL ay 549 nm (B), both with RhB in the Lot lens. Wavelength-ratiometric measurements of SG-PL/RhB and PG-PL/RhB measurements with RhB as the reference fluorophore(C).
Figure 7.
Effects of sodium on the intensities of SG-PL at 531nm (A), and effects of potassium on PG-PL ay 549 nm (B), both with RhB in the Lot lens. Wavelength-ratiometric measurements of SG-PL/RhB and PG-PL/RhB measurements with RhB as the reference fluorophore(C).
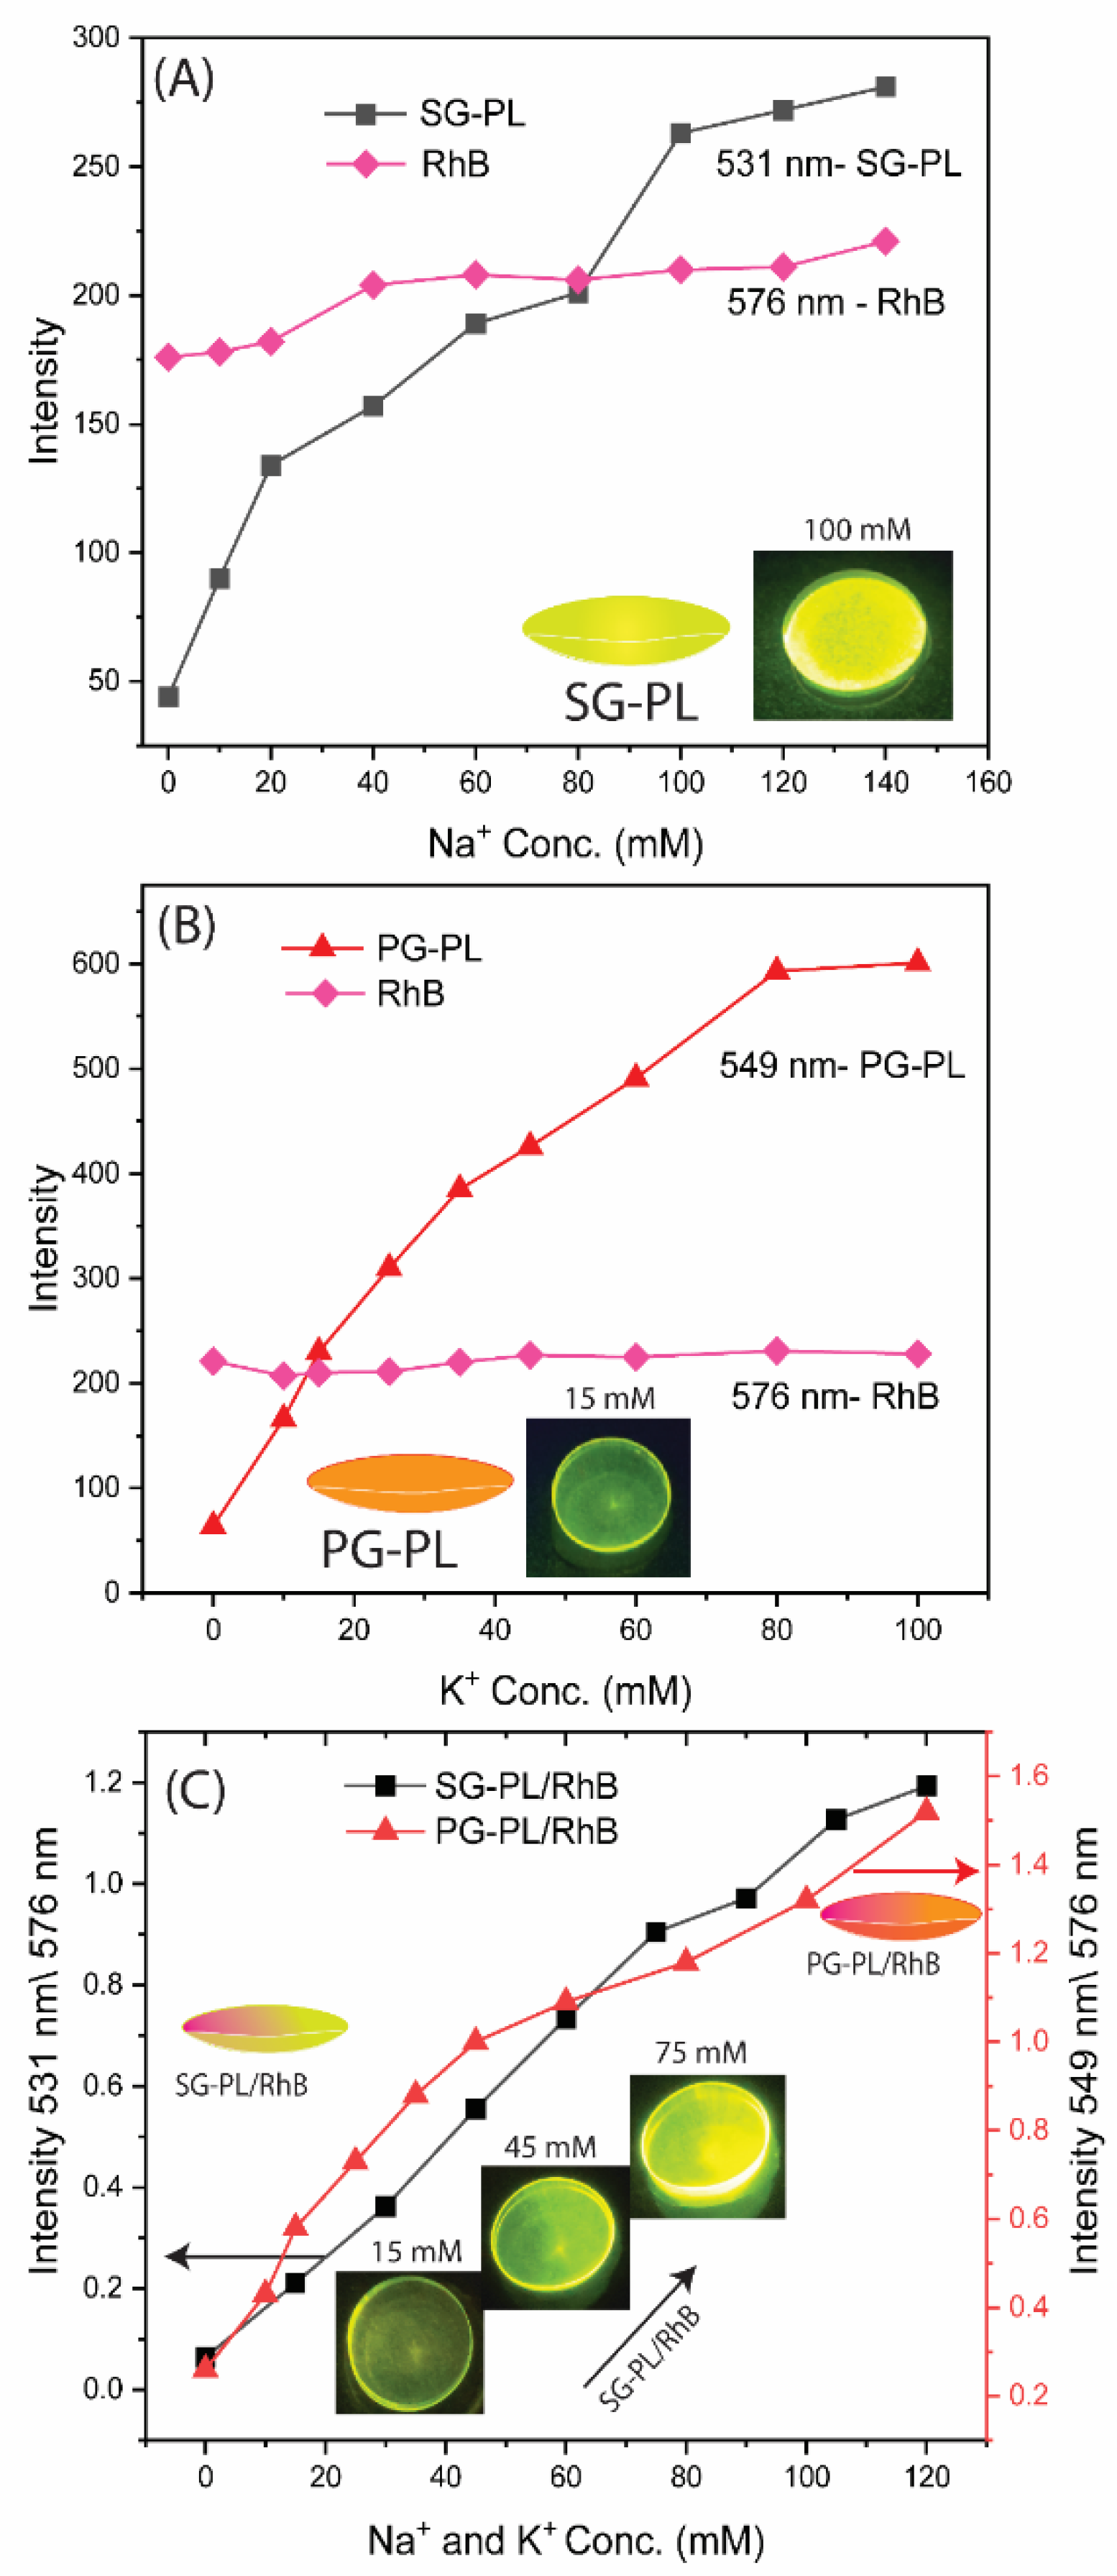
Figure 8.
Fluorescence lifetime of a SG-PL/ RhB lens measured at the SG-PL emission maximum (A) and at the RhB emission maximum (B). Fluorescence lifetime of a PG-PL/RhB lens measured at the PG-PL emission maximum (C) and at RhB the emission maximum (D).
Figure 8.
Fluorescence lifetime of a SG-PL/ RhB lens measured at the SG-PL emission maximum (A) and at the RhB emission maximum (B). Fluorescence lifetime of a PG-PL/RhB lens measured at the PG-PL emission maximum (C) and at RhB the emission maximum (D).
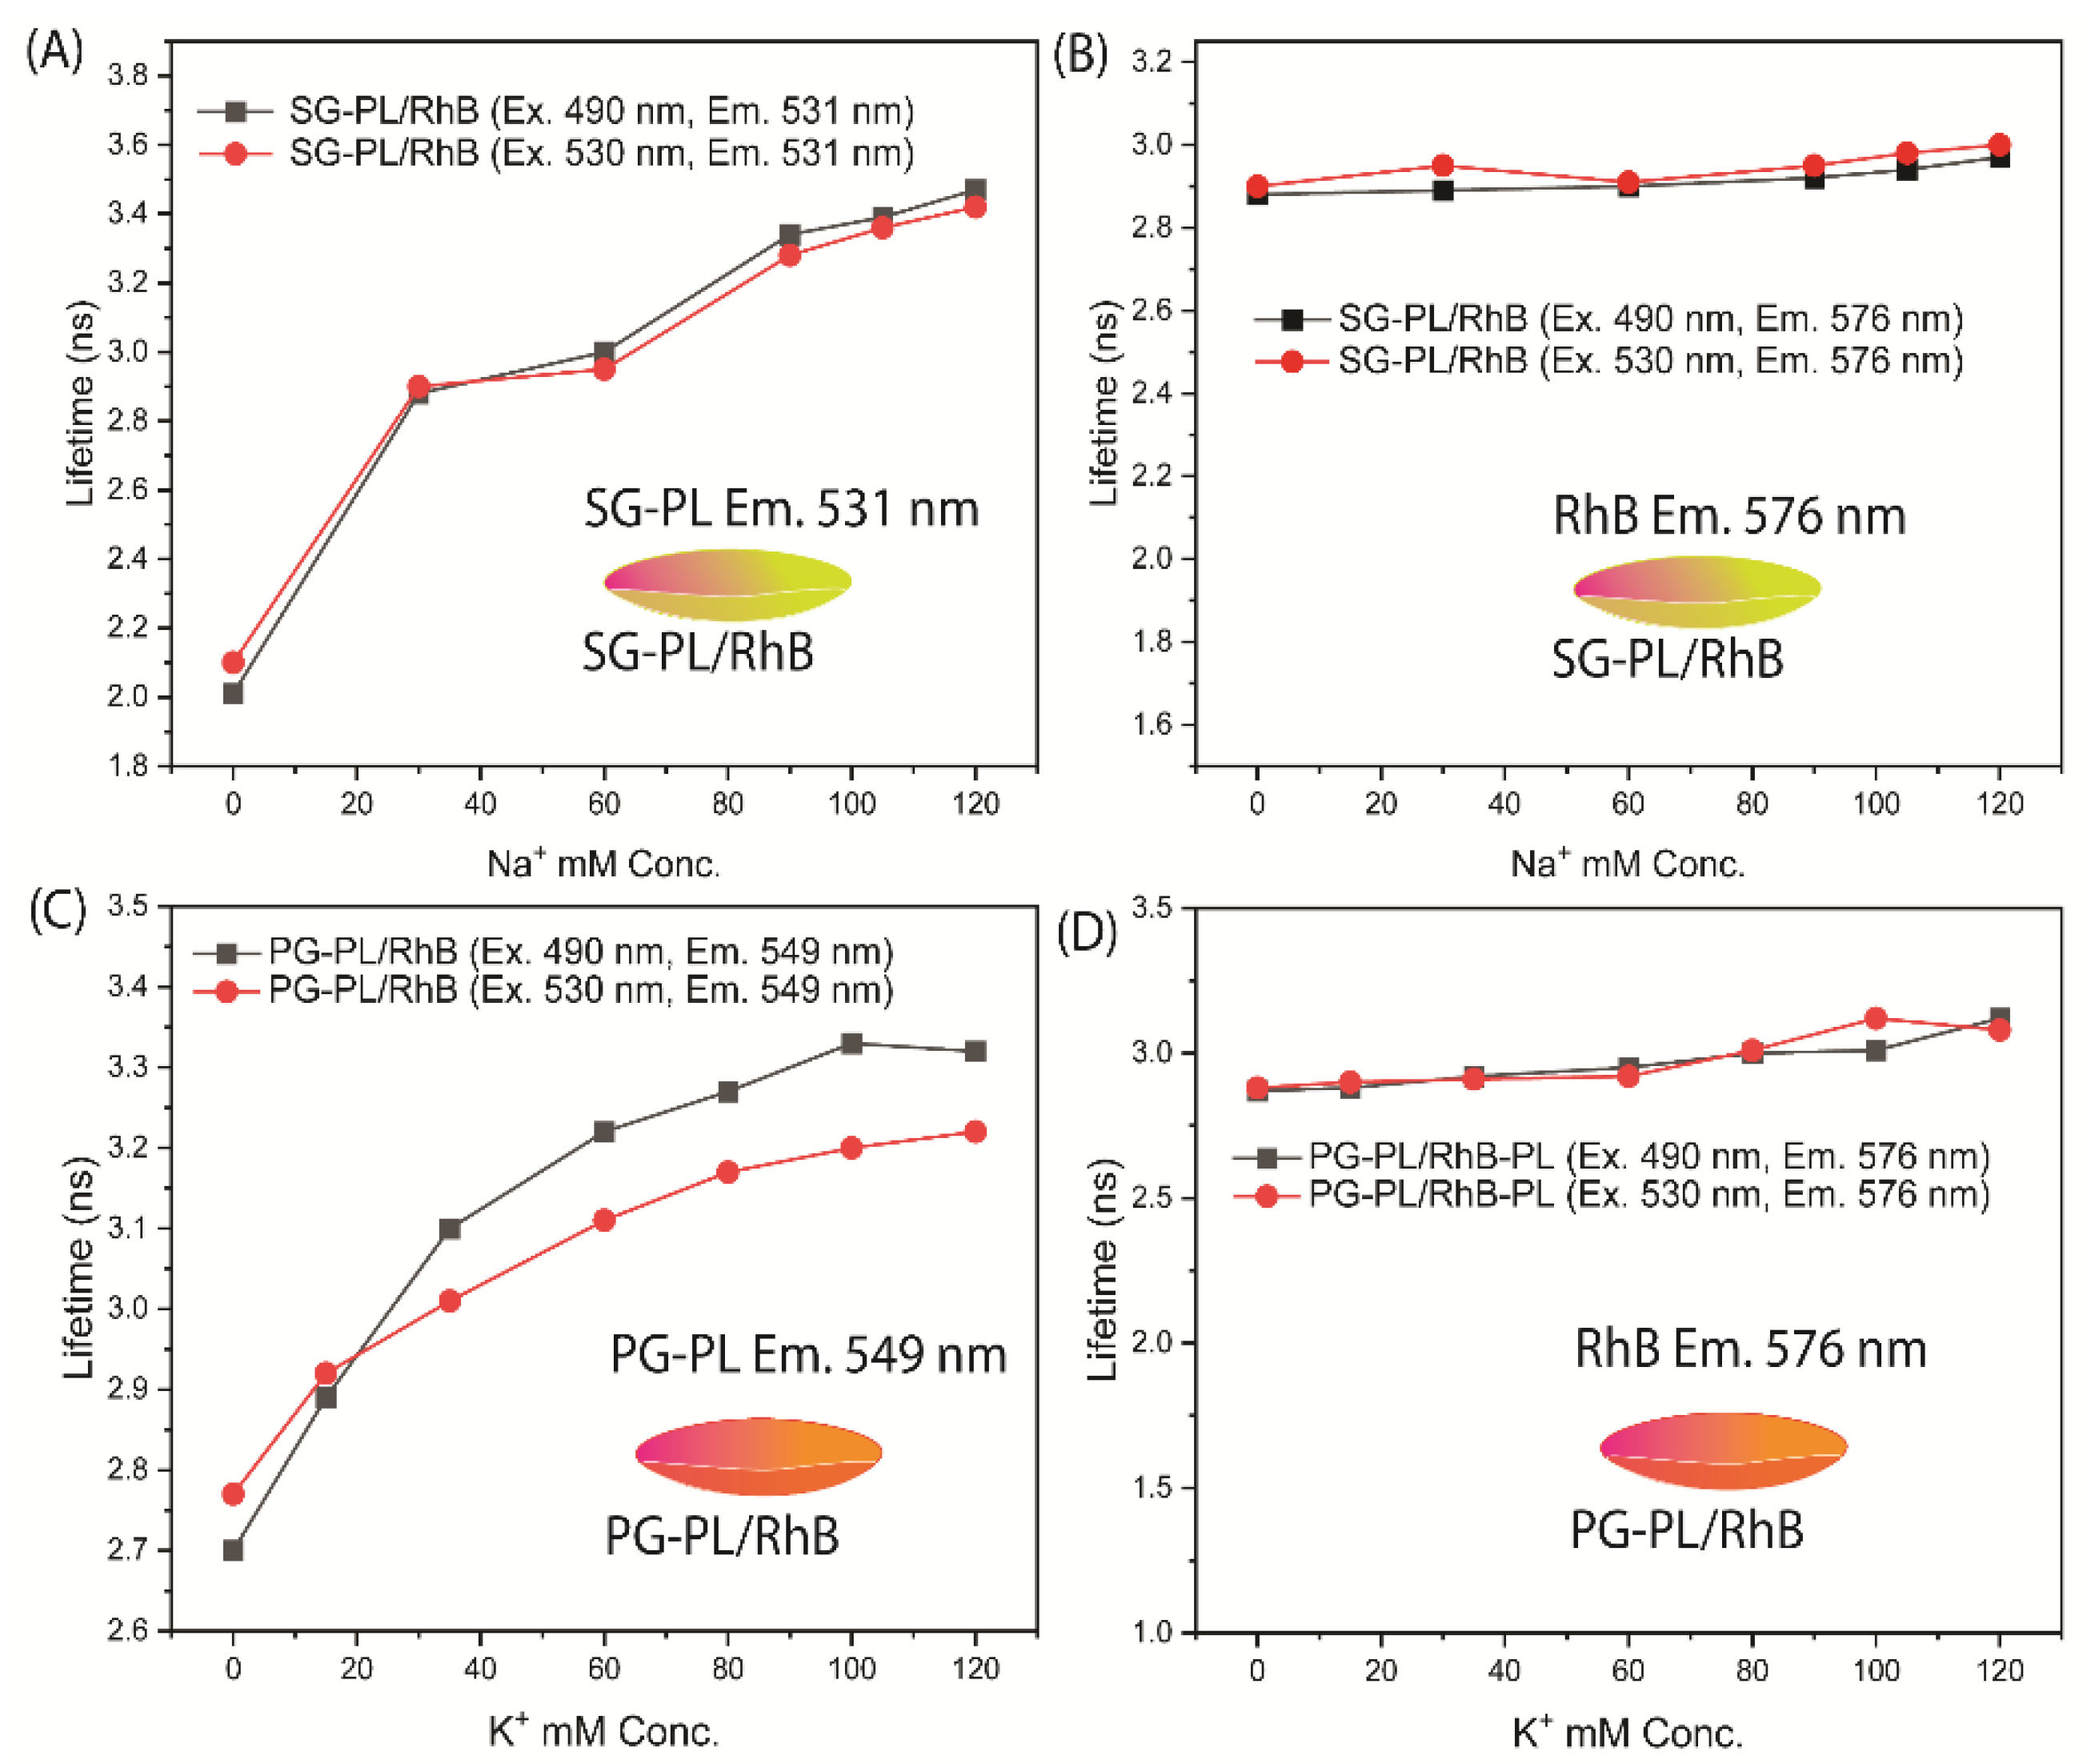
Figure 9.
Fluorescence intensities and lifetime SG-PL lenses with 0.0 to 130 mM Na+ and PG-PL lenses with 0.0 to 110 mM K+ for excitation intensity changed by thin gray glass filters between the source and samples. The emission intensities are changed by the filters, but the lifetimes remain constant.
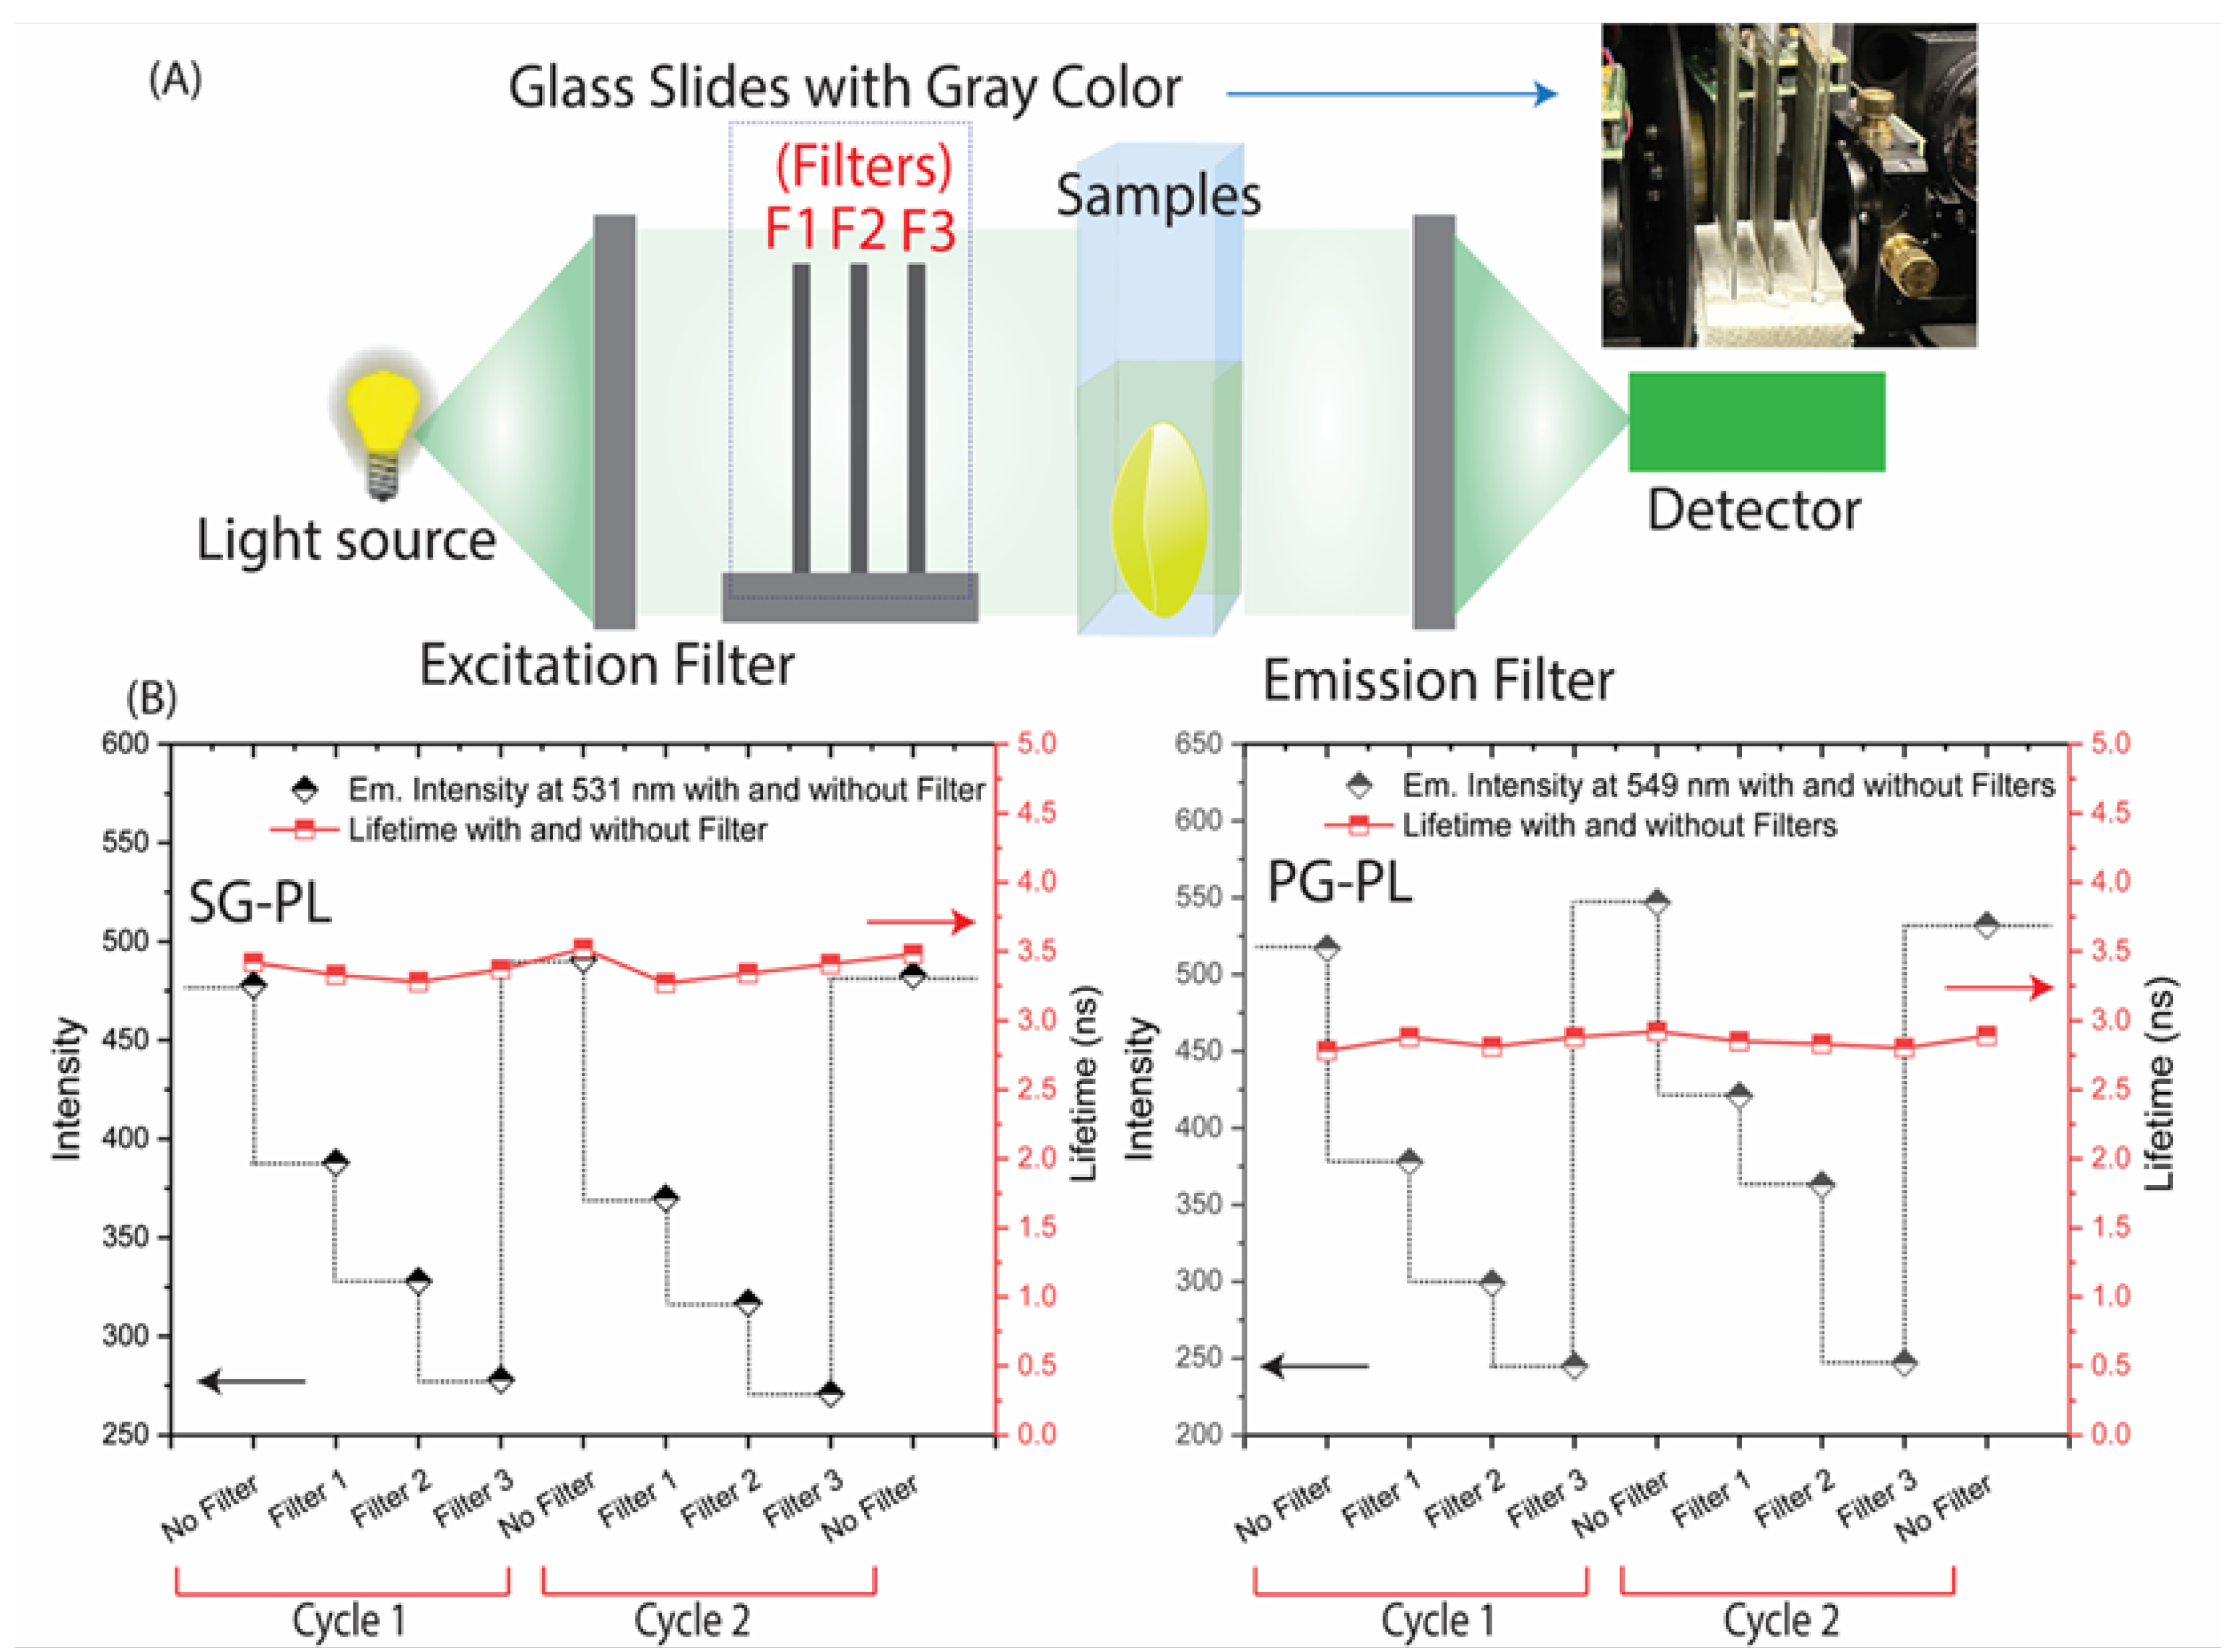
Figure 10.
Reversibility of the response to different ion concentration for SG-PL and Na+ (A), and PG-PL and K+ (B). Emission spectra, intensity and lifetime were measured for 12 cycles, lasting about 3 minutes each.
Figure 10.
Reversibility of the response to different ion concentration for SG-PL and Na+ (A), and PG-PL and K+ (B). Emission spectra, intensity and lifetime were measured for 12 cycles, lasting about 3 minutes each.
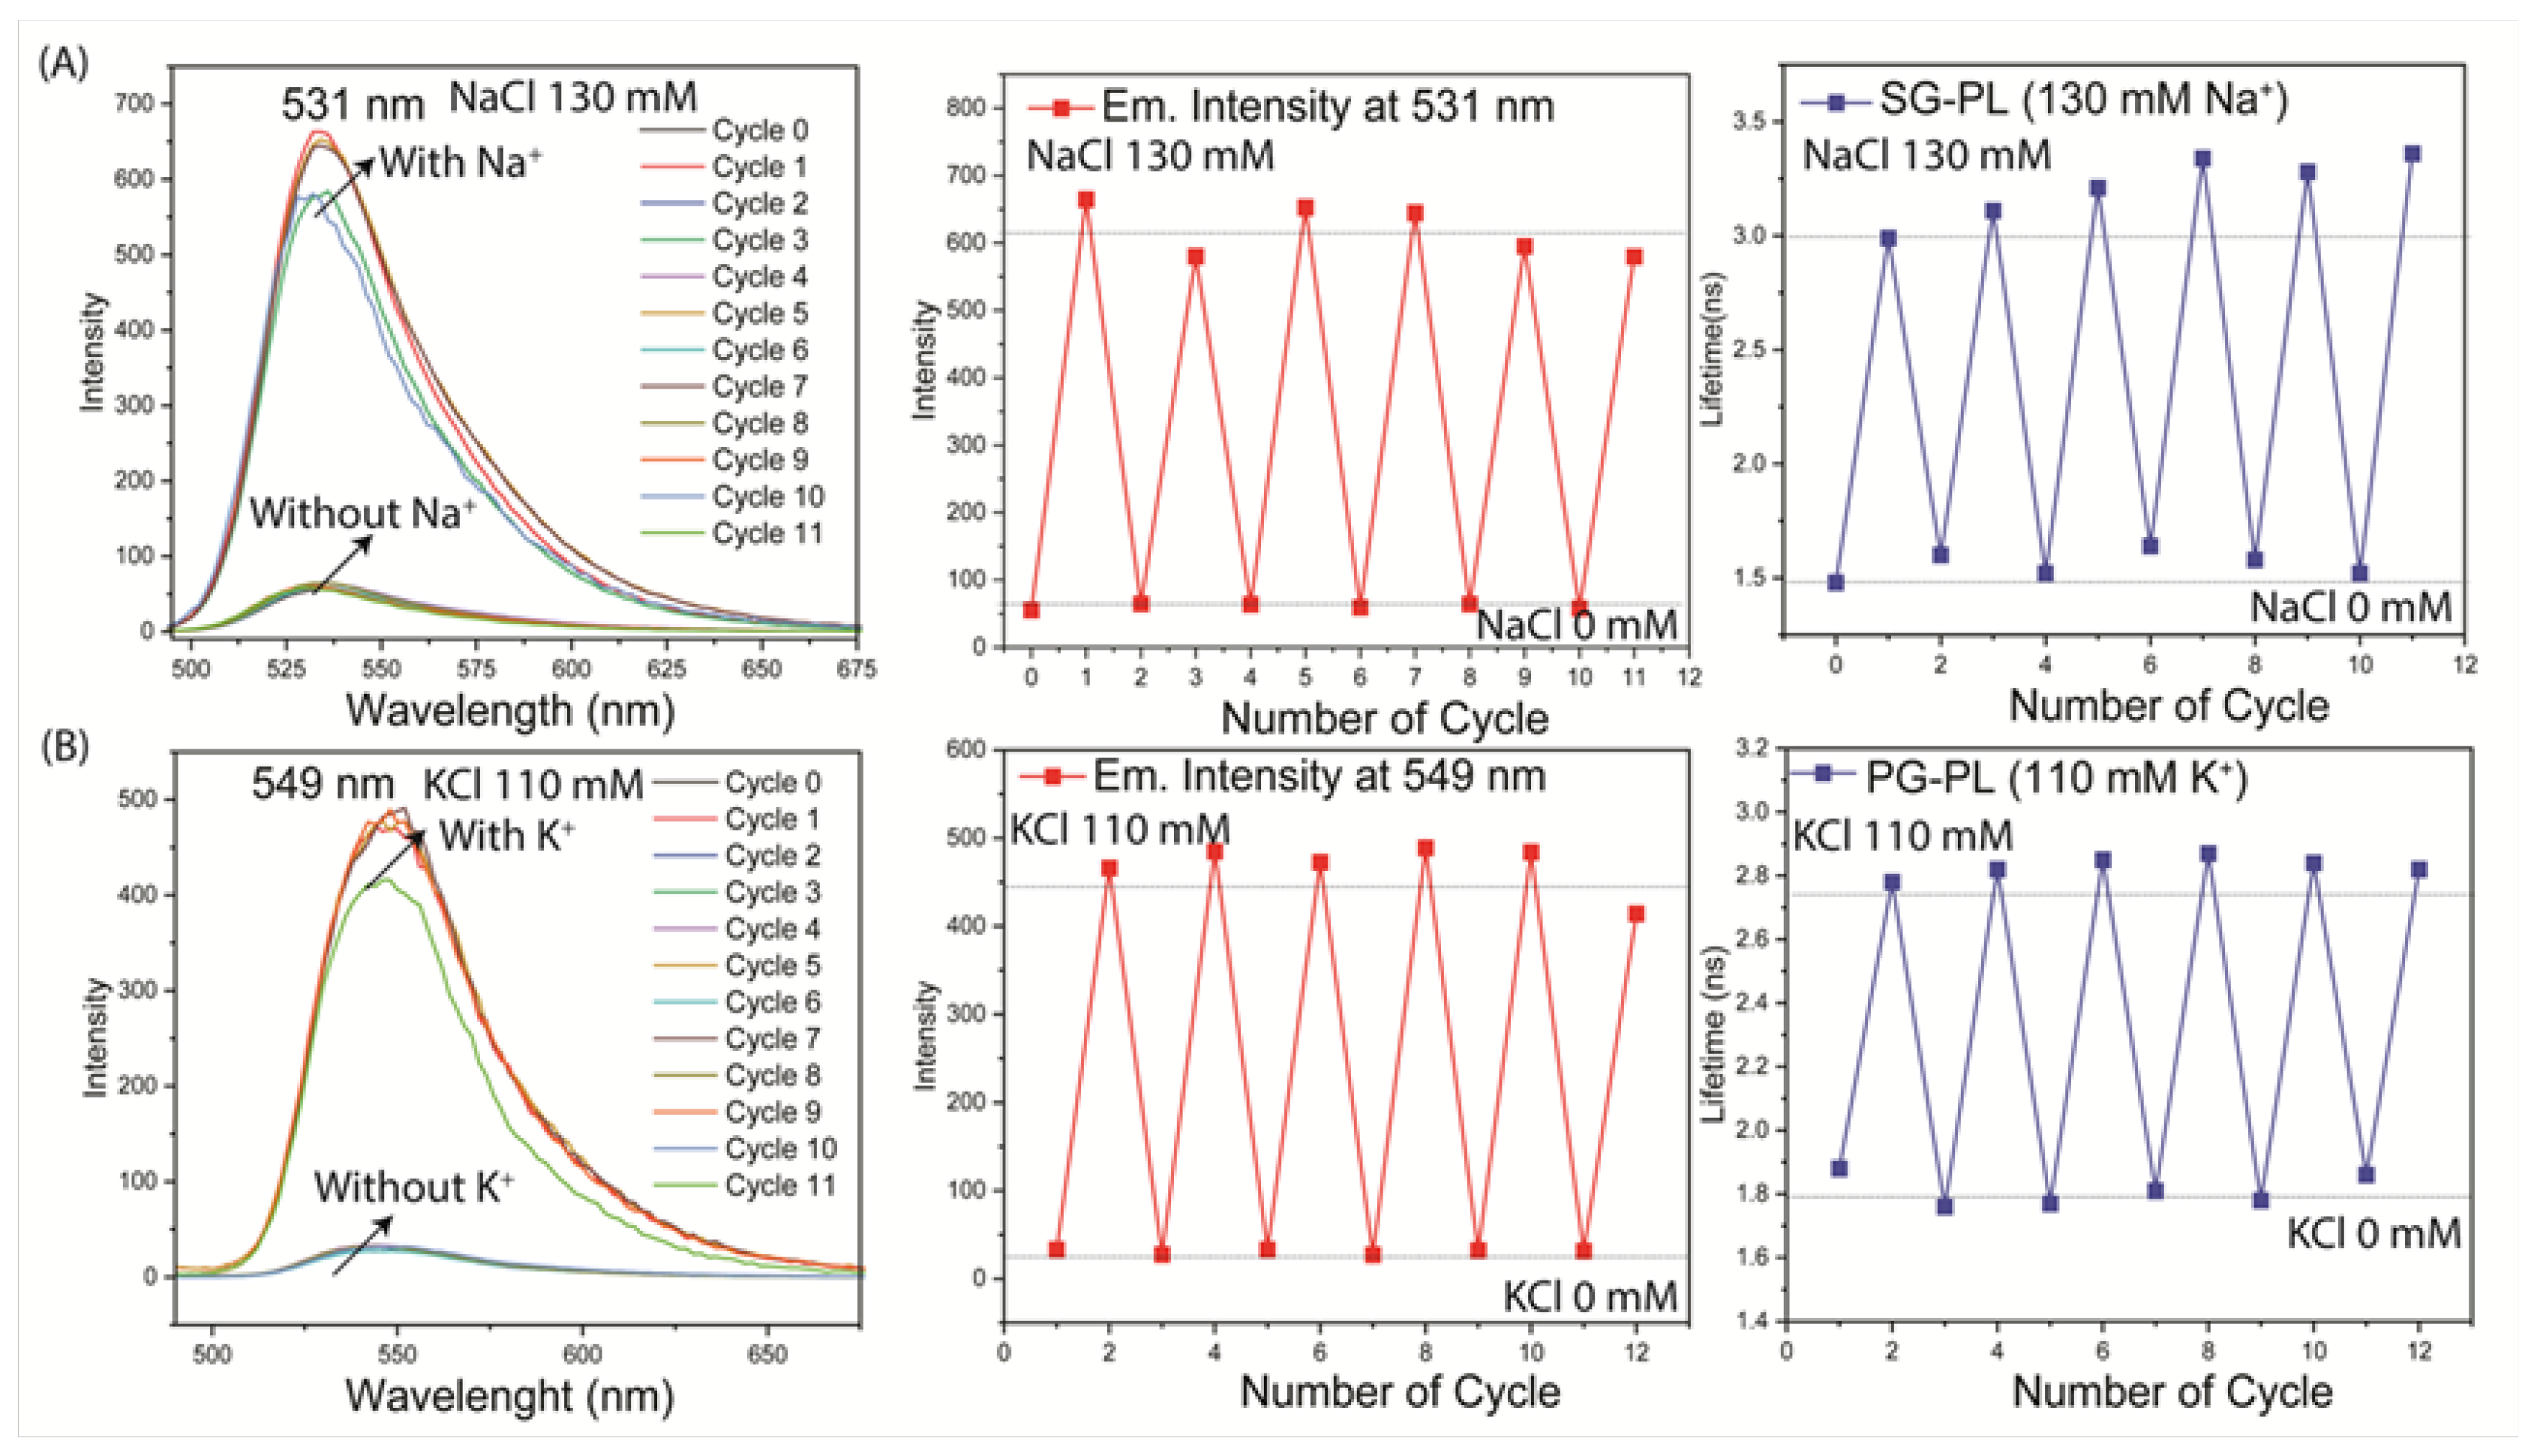
Figure 11.
SG-PL Lens with different concentrations of Na+ ions with or without 25 mM K+ ions. PG-PL Lens with different concentrations of K+ ions with or without 130 mM Na+ ions.
Figure 11.
SG-PL Lens with different concentrations of Na+ ions with or without 25 mM K+ ions. PG-PL Lens with different concentrations of K+ ions with or without 130 mM Na+ ions.
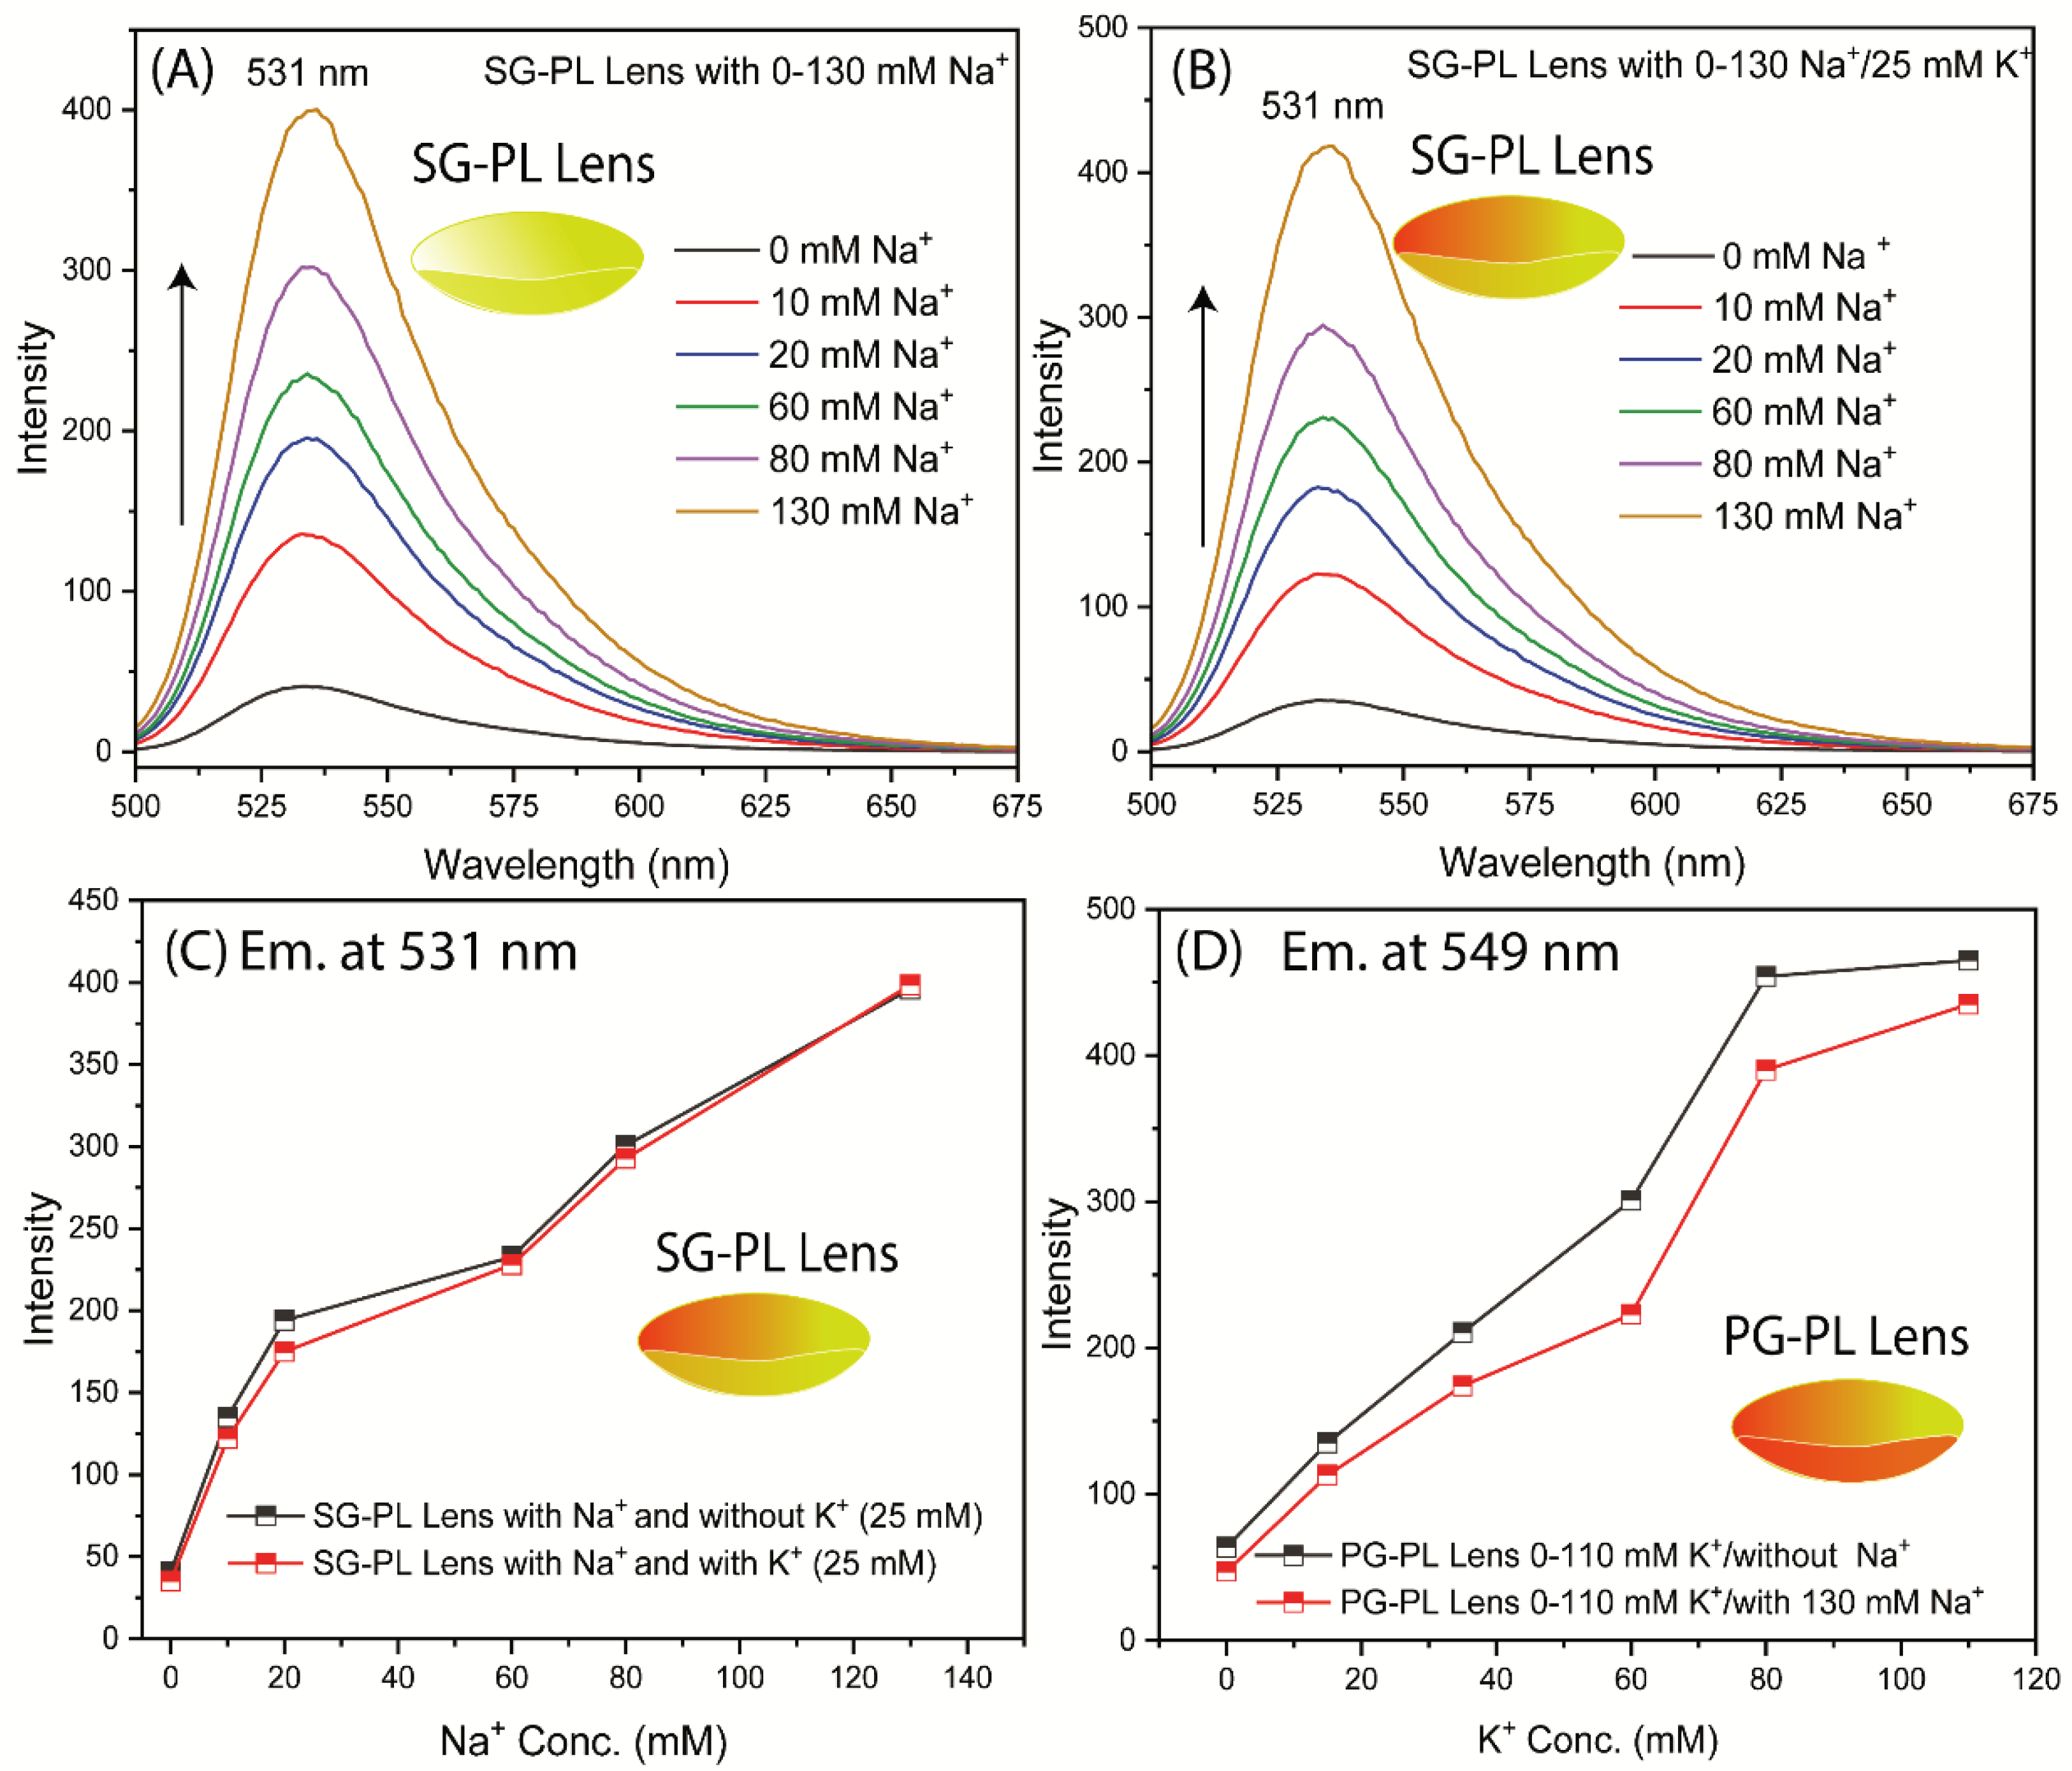
Figure 12.
Fluorescence intensities and lifetimes measured across the SG-PL (A) and PG-PL (B) Lot A lenses lens (13 mm length).
Figure 12.
Fluorescence intensities and lifetimes measured across the SG-PL (A) and PG-PL (B) Lot A lenses lens (13 mm length).
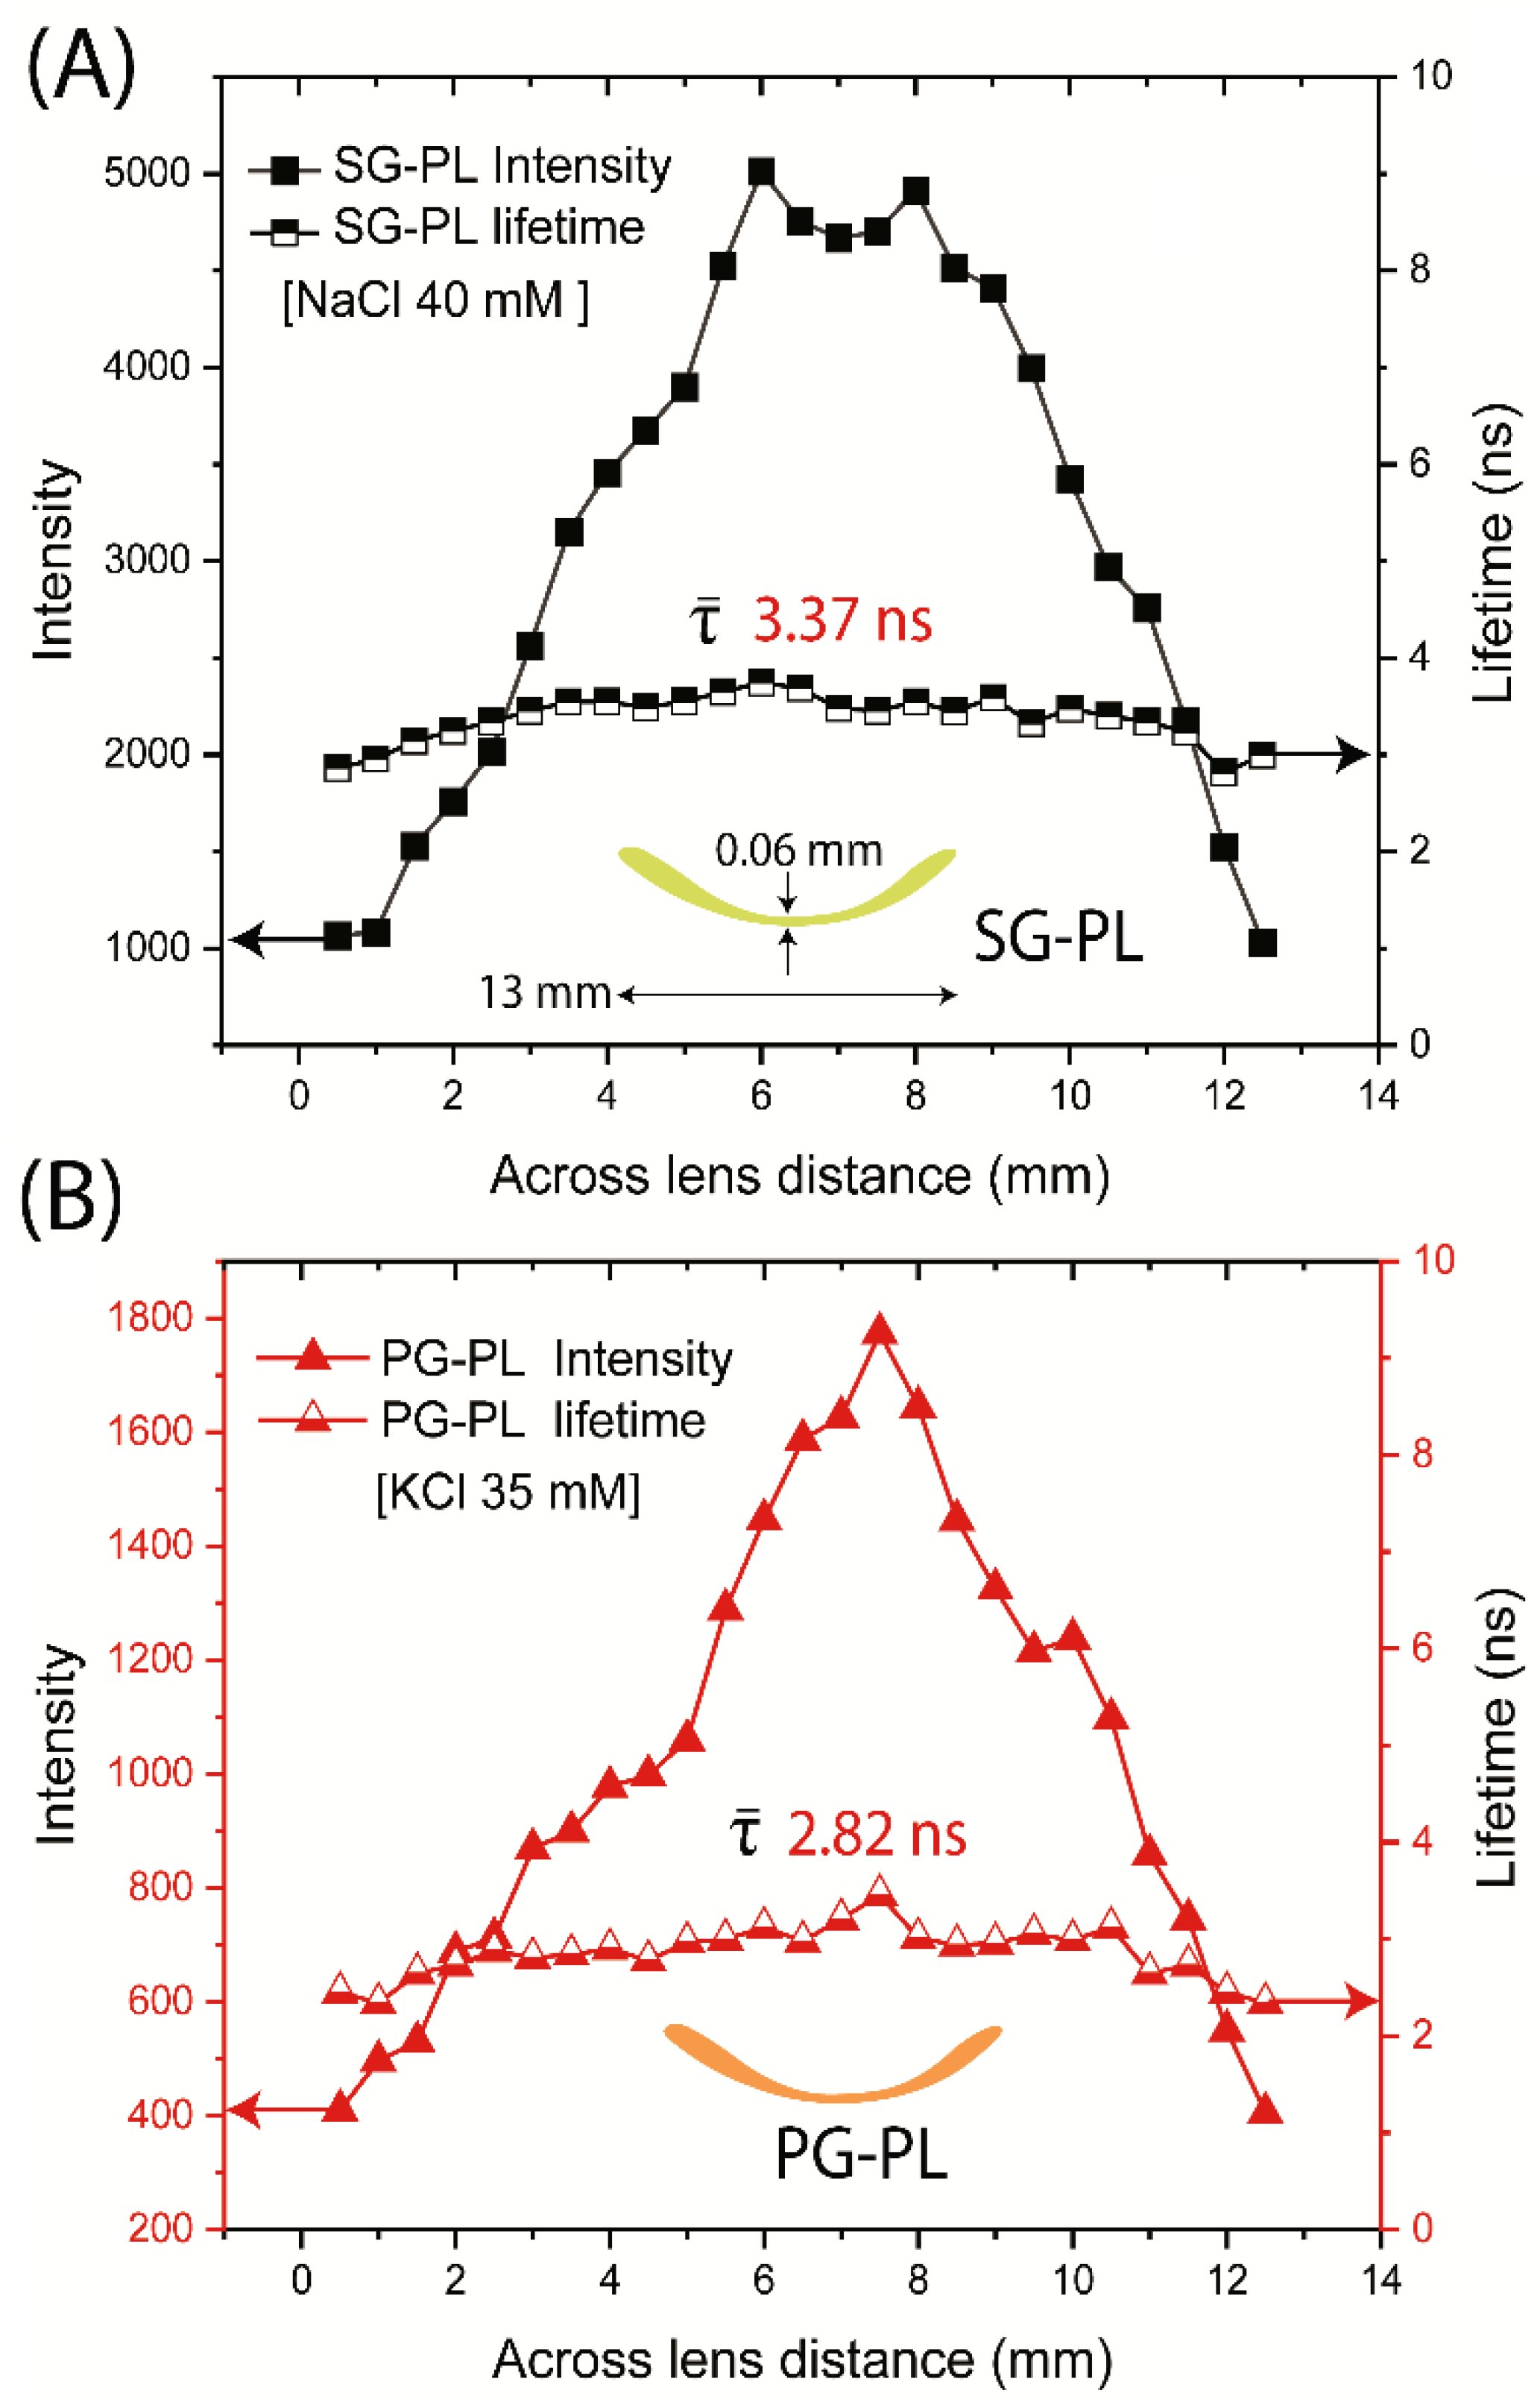
Figure 13.
Detection of Na+ and K+ using a single Lot A lens using intensity or FLIM measurements. The lens was scanned across a 10 mm length (Step size 0.36 mm), measuring the intensity and lifetime of probes. The lens was labeled on the left side with PG-PL and on the right side with SG-PL.
Figure 13.
Detection of Na+ and K+ using a single Lot A lens using intensity or FLIM measurements. The lens was scanned across a 10 mm length (Step size 0.36 mm), measuring the intensity and lifetime of probes. The lens was labeled on the left side with PG-PL and on the right side with SG-PL.
Disclaimer/Publisher’s Note: The statements, opinions and data contained in all publications are solely those of the individual author(s) and contributor(s) and not of MDPI and/or the editor(s). MDPI and/or the editor(s) disclaim responsibility for any injury to people or property resulting from any ideas, methods, instructions or products referred to in the content. |
© 2025 by the authors. Licensee MDPI, Basel, Switzerland. This article is an open access article distributed under the terms and conditions of the Creative Commons Attribution (CC BY) license (https://creativecommons.org/licenses/by/4.0/).
Copyright: This open access article is published under a Creative Commons CC BY 4.0 license, which permit the free download, distribution, and reuse, provided that the author and preprint are cited in any reuse.


